Embed Size (px)
Citation preview

PARCA/OIB Workshops Logistics Venue: NASA Goddard Space Flight Center, 8800 Greenbelt Rd., Greenbelt, MD 20771 TUESDAY, JANUARY 19
• GEOSummit Bi-annual meeting: B33/H114 WEDNESDAY, JANUARY 20
• PARCA Workshop: B34/W150 • Snow Thickness on Sea Ice Working Group (STOSIWG) meeting: B34/W120AB
THURSDAY, JANUARY 21
• OIB Land Ice Team meeting: B34/W150 (team members and invited attendees only)
• Snow Thickness on Sea Ice Working Group (STOSIWG) meeting: B34/W120AB (concludes at noon)
• OIB Sea Ice Team Meeting: B34/W120AB (following the STOSIWIG meeting, team members and invited attendees only)
FRIDAY, JANUARY 22
• OIB Sea Ice Team Meeting: B34/W120AB (team members and invited attendees only)
Internet within GSFC: Use “GUEST-‐CNE” Badging: Allow approximately 30 minutes to obtain your badge. You will need to have appropriate identification with you (Driver’s license or passport for US citizens, original greencard documentation for LPRs, and Passport/Visa for non-‐US citizens). Also, please note that if you hold a driver’s license from the following states: Alaska, America Samoa, Arizona, Kentucky, Louisiana, Maine, Massachusetts, Minnesota, Montana, New York, Oklahoma, or Washington State; you will be required to present an alternate form of I.D. (i.e. passport) for unescorted access at GSFC. The security office has created a badge for each of you that is valid for the duration of the meetings. You will need to pick up your badge at the Main Gate (Building 9) the morning you arrive for the meeting. Hold on to your badge at the end of each day until you conclude your visit. At that time, you should return your badge to the box on the guard booth in the left lane at any of the 4 gates. If you encounter problems with badging (or something else), please contact Charles (cell 512-‐689-‐9624) or Stacy (cell 240-‐695-‐4975).

Getting from the Airport to Greenbelt: Baltimore-‐Washington International (BWI): Bus B30 Metro Express to Greenbelt Station ($6), pick up by Super Shuttle (1 hr. @ $33) or a taxi (30 min. @ $45). Reagan National (DCA): Metro to Greenbelt station, pick up by Super Shuttle (1 hr. @ $33), or a taxi (90 min. @ $25) Washington DC Dulles International (IAD): Washington Flyer Bus to West Falls Church Metro station, then Metro to Greenbelt Metro station, then taxi. (2 hrs. $35), or Super Shuttle (1 hr @ $39) Area Hotels:
Holiday Inn 7200 Hanover Drive, Greenbelt, MD 20770; 301-‐982-‐7000 Website:http://www.ihg.com/holidayinn/hotels/us/en/greenbelt/wasgb/hoteldetail?qAdlt=1&qBrs=6c.hi.ex.rs.ic.cp.in.sb.cw.cv&qChld=0&qFRA=1&qGRM=0&qPSt=0&qRRSrt=rt&qRef=df&qRms=1&qRpn=1&qRpp=10&qSHp=1&qSmP=3&qSrt=sBR&qWch=0&srb_u=1&icdv=99618083&cm_mmc=mdpr-‐_-‐TripAdvisorUS-‐_-‐BLwebsite-‐_-‐HI_WASGB&icdv=99618083
Greenbelt Marriott 6400 Ivy Lane, Greenbelt, MD 20770; 301-‐441-‐3700 Website: http://www.marriott.com/hotels/travel/wasgb-‐greenbelt-‐marriott/?pid=corptbta&stop_mobi=yes&scid=b661a3c4-‐9c47-‐48c8-‐9e13-‐75b66089dd79
Courtyard by Marriott 6301 Golden Triangle Drive, Greenbelt, MD 20770; 301-‐441-‐3311 Website: http://www.marriott.com/hotels/travel/wasgr-‐courtyard-‐greenbelt/?pid=corptbta&stop_mobi=yes&scid=b661a3c4-‐9c47-‐48c8-‐9e13-‐75b66089dd79
Residence Inn 6320 Golden Triangle Drive, Greenbelt, MD 20770; 301-‐982-‐1600 Website: http://www.marriott.com/hotels/travel/wasgl-‐residence-‐inn-‐greenbelt/?pid=corptbta&stop_mobi=yes&scid=b661a3c4-‐9c47-‐48c8-‐9e13-‐75b66089dd79
Hilton Garden Inn 7810 Walker Dr, Greenbelt, MD 20770; 301-‐474-‐7400 Website: http://hiltongardeninn3.hilton.com/en/hotels/maryland/hilton-‐garden-‐inn-‐washington-‐dc-‐greenbelt-‐DCAGBGI/index.html
Taxi and shuttle information: Super shuttle: http://www.supershuttle.com/ Taxi: 301-‐577-‐2000 Goddard taxi: Can be used to/from all Center buildings
(Operates 7 am – 5:30 pm; Ph. 301-‐346-‐8276; from Goddard phone: 4-‐TAXI)


Agenda GEOSummit
19 January, 2016 at GSFC
9:00-9:05 SCO Welcome/Objectives 9:05-10:25 Brief (10 minute maximum) science presentations. Focus should be on plans for the near and mid-term future. If recent results help motivate these plans, feel free to show them, but more than 70% of talk should be forward looking. Order of presenters is alphabetical, if you feel your talk should precede or follow a certain talk we can try to accommodate (let SCO know in advance if possible). Kimberly Casey/Zoe Courville/Shane Grigsby/Thomas Hearty/Detlev Helmig/Ben Kopec/John Kovac/Jae Lee 10:25-10:40 Break 10:40-12:10 Brief (10 minute maximum) science presentations. See notes above. Phil Lubin/Mike Macferrin/Joe McConnell/Tim Norton/Frank Rack/Christoper Shuman/Brian Vasel/Von Walden/Stephanie Wissel 12:10-13:15 Lunch 13:15-13:30 Comments from PLR ARC RSL (Renee Crain/Pat Haggerty) 13:30-13:45 Observations and comments on drifting at Summit (Bob Hawley) 13:45-14:15 Update on GrIT and potential for science support by GrIT (Jay Burnside) 10 minute presentation, balance for discussion 14:15-14:45 Update on Summit Redevelopment Plan (Jay Burnside)
10 minute presentation, balance for discussion
14:45-15:30 Development of Isi (moderated by Jack Dibb) We hope to have open discussion about the requirements of currently planned or proposed astrophysics projects. In particular, we hope to identify potential adverse impacts of these projects on each other, and on traditional science and operations at Summit. Ideally, we will also brainstorm ways to mitigate these impacts (by thoughtful layout, shared resources, etc.).
Note, afternoon schedule is flexible. If active discussion warrants, we will extend time
spent on any/all of the above topics. Please be prepared to stay until at least 16:30.
PARCA 2016 Wednesday, January 20 8:30 AM – 5:15 PM GSFC Building 34, Room W150 8:30 Welcome: Logistics Thorsten Markus, NASA Goddard Space Flight Center 8:45 The View from Headquarters Tom Wagner, NASA Headquarters 9:00 The Ice Sheet Mass Balance Inter-‐comparison Exercise Kate Briggs, University of Leeds
In 2012, the Ice Sheet Mass Balance Inter-‐comparison Exercise (IMBIE) successfully led to the first community assessment of Greenland and Antarctic Ice Sheet Mass Balance. In the time since, additional data has become available from new satellite missions (e.g. CryoSat-‐2, Sentinnel-‐1), new geophysical corrections, new techniques and new teams, and as such there is demand for an updated assessment. A framework for a continuing IMBIE assessment has now been established, and a second assessment will take place in 2016, with funding secured for two further years. Similar to the first assessment, the next assessments will combine estimates of ice sheet mass balance from the three techniques of gravimetry, altimetry and the mass budget method within a common framework (e.g. common spatial domains), and with the aim of arriving at a community consensus on ice sheet mass change. However, this next phase will be open to all participants who meet necessary data requirements, and will aim to conduct additional experiments to better understand the differences between estimates and the processes driving observed mass change. This presentation will review the recent and historical contributions of the ice sheets to global sea level rise and outline the approach for the second phase of IMBIE, the main science goals and the current status.
9:15 Ocean Melting Greenland: Season 2015 Michael Wood, University of California Irvine
Ocean Melting Greenland (OMG) is a NASA Earth Venture Mission to observe changing water temperature around Greenland and how marine-‐terminating glaciers react to the presence of warm, salty Atlantic water (AW). To determine whether AW reaches the glacier termini, OMG will collect CTD data from vessels and planes, and measure bathymetry using multibeam echo sounding and airborne gravity. To determine the impact of AW on the glaciers, OMG will fly GLISTIN radar topographic mapper repeatedly along all marine terminating glaciers once a year. The mission started in 2015 with bathymetry mapping in northwest Greenland, and will be followed in 2016 by AXCTD data collection, airborne gravity and the first GLISTIN flights. The 2015 multibeam and CTD data revealed complex pathways for AW to reach the glaciers, and the pervasive presence of AW in all fjords that are deep enough to host it. We compare the results with the pattern of glacier retreat to conclude that there is no simple relationship between ocean thermal forcing and glacier retreat. The glacier evolution involves instead a complex interplay between geometry, climate forcing, ice-‐ocean interaction, ice motion, surface melt and calving.
9:30 Surface Mass Balance Workshop Marco Tedesco, Columbia University
At the past PARCA meeting the need for a workshop was advocated as a crucial tool to answer questions such as: how do we separate the uncertainties deriving from the physics of the models and their forcing on SMB estimates? How do we scale estimates of runoff to a larger scale? How do we interpret elevation-‐change data and improve mass balance-‐change estimates by accounting for densification and compaction processes? What is the spatial and temporal variability of uncertainties of the quantities driving SMB?
What targeted/organized field measurements are needed to reach our goals? After PARCA 2015, the need for a workshop was further discussed during follow-‐up telecons open to the PARCA participants. A proposal to NASA was submitted to fund such a workshop. In this brief presentation, I will discuss how to start coordinating for the workshop that is planned to be held at Lamont-‐Doherty of the Columbia University at the beginning of April 2016. The ultimate goal is to identify a strategy and suggest a series of programmatic and scientific actions that will ultimately lead to improved SMB estimates in a timely manner. The outcome of the workshop will benefit not only the members of the scientific community focusing on SMB over the GrIS but also the participants of the PARCA 2017 meeting as well as program officers at funding agencies.
9:40 Greenland change in global perspective: coupled climate modeling with CESM Jan T.M. Lenaerts, Utrecht University
Greenland SMB modeling has been mostly restricted to regional climate models (RCMs) with sophisticated snow models necessary to represent snow processes (melt, refreezing, vertical & horizontal transport). These regional models are usually bounded by atmospheric reanalyses for the present climate, and by CMIP5-‐style General Circulation Models (GCMs) for the future. Since these GCMs are often biased, the future changes in the RCM based on these are often difficult to interpret. Moreover, feedbacks from the ice sheet SMB to the atmosphere, ocean and sea ice are not considered. In the past few years, we started to use the Community Earth System Model (CESM) to study ice sheet SMB in a global context. We apply our knowledge from the RACMO2 and use ground and remote sensing observations, to further improve CESM snow and atmospheric processes, with the overall aim to study present and future Greenland SMB and its impact on Arctic and global climate.
9:55 Evaluation of Greenland surface climate in MERRA-‐2 Richard Cullather, University of Maryland & NASA Goddard Space Flight Center
Global atmospheric reanalyses represent a valuable tool for assessing recent climate by synthesizing the available meteorological observations with a state-‐of-‐the-‐art background model. In the Arctic, reanalyses are hindered in part by conventional data scarcity, difficulties in satellite retrievals in the presence of snow and ice, and model deficiencies in the representation of complex surface and atmospheric moisture processes. In this study, the representation of near-‐surface conditions in the recently released MERRA-‐2 reanalysis is assessed over the Greenland Ice Sheet for the available period 1980-‐2014. MERRA-‐2 utilizes a glaciated land representation that allows for surface hydrological processes including fractional snow cover, a prognostic albedo, meltwater percolation and refreezing, and runoff. For global reanalyses, surface mass balance (SMB) has previously been assessed with available ice core climatologies and comparisons to regional climate models. In addition to these comparisons three further sources of information are added: comparisons with GRACE mass change observations, OIB CReSIS radar derived accumulation, and gauged runoff data at selected locations. These new-‐ish methods for validation emphasize temporal variability, from daily to interannual time scales. This is a direct reflection of current needs for understanding the recent evolution of surface processes.
10:10 Atmospheric summer teleconnections and Greenland Ice Sheet surface mass variations: insights from MERRA-‐2 Young-‐Kwon Lim, Goddard Earth Sciences Technology and Research/IMSG & NASA Goddard Space Flight Center
The relationship between leading atmospheric teleconnection patterns and Greenland Ice Sheet (GrIS) temperature, precipitation, and surface mass balance (SMB) are investigated for the last 36 summers (1979-‐2014) based on Modern-‐Era Retrospective analysis for Research and Applications version 2 (MERRA-‐2) reanalyses. The results indicate that the negative phase of both the North Atlantic Oscillation (NAO) and Arctic Oscillation (AO), associated with warm and dry conditions for the GrIS, lead to SMB decreases within 0-‐1 months. Furthermore, the positive phase of the East Atlantic (EA) pattern often lags the negative NAO, reflecting a dynamical linkage between these modes that acts to further enhance the warm and dry conditions over the GrIS, leading to a favorable environment for enhanced surface mass loss. The
development of a strong negative NAO in combination with a strong positive EA in recent years leads to significantly larger GrIS warming compared to when the negative NAO occurs in combination with a negative or weak positive EA. The previous studies suggested that the CMIP5 models do not show a significant relationship between Arctic amplification over the 21st century and changes in the frequency of the NAO and EA under RCP4.5 or RCP 8.5 scenario. Though the relationship with climate change is not clear yet, our results imply that, to the extent that a strong negative NAO and positive EA frequently occur together in the future summers, we can expect continued severe GrIS surface mass loss.
10:25 BREAK ☕ 10:45 Arctic Amplification and the Northward shift of a new Greenland melting record Marco Tedesco, Columbia University
Large-‐scale atmospheric circulation controls the mass and energy balance of the Greenland ice sheet through its impact on radiative budget, runoff and accumulation. Using reanalysis data and the outputs of a regional climate model, here we show that the persistence of an exceptional atmospheric ridge, centered over the Arctic Ocean was responsible for a northward shift of surface melting records over Greenland, and for increased accumulation in the south during the summer of 2015. Concurrently, new records of mean monthly zonal winds at 500 hPa and of the maximum latitude of ridge peaks of the 5700±50 m isohypse over the Arctic were also set. An unprecedented (1948 – 2015) and sustained jet stream easterly flow promoted enhanced runoff, increased surface temperatures and decreased albedo in northern Greenland, while inhibiting melting in the south. The exceptional 2015 summer Arctic atmospheric conditions are consistent with the anticipated effects of Arctic Amplification, including slower zonal winds and increased jet stream wave amplitude. Properly addressing the impact of Arctic Amplification on surface runoff of the Greenland ice sheet is crucial for rigorously quantifying its contribution to current and future sea level rise, and the relative impact of freshwater discharge on the surrounding ocean.
11:00 Climatology at Swiss Camp, western slope of Greenland ice sheet, 1991-‐2015 Konrad Steffen, Swiss Federal Research Institute WSL & Swiss Federal Institute of Technology (ETH)
Climate observations (1991-‐2015) will be discussed from the Swiss Camp (69°33′53″N, 49°19′51″W, 1176 m), located at the western slope of the Greenland ice sheet, 60 km inland from Ilulissat. The mean annual temperature of -‐12°C increased 3.0°C between 1991 and 2015 (1.3°C per decade) with large interannual variability in all seasons. The mean spring temperature increased from -‐16.2°C to -‐13.8°C, and the fall temperature increased from -‐12.2°C to -‐11.5°C in the same time. The winter temperature showed the largest increase of 4°C, whereas summer temperatures increased 2°C during the 21 years (1991–2015). Radiation has been monitored continuously at Swiss Camp since 1993. Net radiation of 50 Wm-‐2 was recorded in 2012, the warmest summer month on record. The entire annual snow cover melted at Swiss Camp, reducing the monthly albedo value to 0.4 with bare ice exposed. Interannual variability of snow accumulation ranged between 0.07 and 0.70 m water equivalent, whereas annual snow and ice ablation varied between +0.35 (net gain) and -‐1.8 m (net loss) for the time period 1991-‐2015. The equilibrium line altitude (ELA) is no longer located at Swiss Camp (1176 m elevation) with a net surface lowering of 12 m since 1991. Increasing summer air temperatures have resulted in an upward migration of both the percolation facies and ablation area of the Greenland ice sheet. The 0°C isothermal migrated upward at a rate of 35 m/a over the 1995–2015 period in West Greenland. There is a 50% probability of the mean annual dry snow line migrating above Summit by 2025, at which time Summit will experience routine melt on an annual basis. The surface mass balance observations similarly indicate that the ELA has migrated upwards at a rate of 44 m/a over the 1997–2011 period in West Greenland, resulting in a more than doubling of the ablation zone width during this period. New results from the snow radar will be shown installed at Swiss Camp and at the Summit of the ice sheet. This radar continuously monitors the snow accumulation in water equivalent and shows the layering of the snow pack throughout the year.
11:15 In situ monitoring of the Greenland ice sheet Dirk van As, Geological Survey of Denmark and Greenland (GEUS)
The Programme for Monitoring of the Greenland Ice Sheet (PROMICE) was initiated in 2007 to monitor total ice sheet mass loss. The primary component in PROMICE is an automatic weather station network, which targets the ablation area, a region which is difficult to reach and hard on instrumentation. The stations record meteorology, radiation budget, ablation, accumulation and ice movement. Station transects provide the means to calculate the regional surface mass balance components. Combining PROMICE and GC-‐Net weather station data with MODIS surface albedo allows for a Greenland-‐wide observation-‐based estimate of surface melt. Weather station observations are also used to validate/calibrate remote sensing data and regional climate model output. To obtain the total mass balance from the ice sheet, the dynamic mass loss is determined from airborne ice thickness measurements and satellite-‐based surface velocities. Various related activities target mass balance processes in more detail. Firn coring campaigns revealed the existence of thick ice layers in firn in southwest Greenland, limiting local refreezing – as confirmed by thermistor string data. Proglacial discharge measurements provide regional runoff values for use in studies of ice sheet melting, refreezing, discharge delay, etc.
11:30 Recent volume fluctuations observed by CryoSat-‐2 in the accumulation zone of Greenland dominated by abrupt firn densification Santiago de la Peña, Ohio State University
Fluctuations in the firn volume of the Greenland Ice Sheet between 2010 and 2014 are observed from repeated CryoSat-‐2 elevation measurements. The variability observed is large in part due to relatively high (and highly variable) accumulation rates, and in recent years due to the changing melting and refreezing patterns. For the 2011-‐2012 period, negative elevation change is observed seasonally to an elevation of almost 2500 m west of the divide, and only slight thickening in the east. More pronounced is the observed negative surface elevation change in most of the accumulation zone over the period of 2012-‐2013, in part the result of the extreme melt the GrIS experienced during summer 2012 that caused abrupt densification in the near-‐surface firn, and as consequence of the production of large amounts of surface meltwater in the summer, which infiltrates within the snowpack and subsequently refreezes at depth. In contrast, the period of 2013-‐2014 presents positive elevation change on average, likely the result of a an increase in precipitation combined with a milder summer 2013 that resulted in a lower densification rate near the surface compared to summer 2012.
11:45 Evaluation of Greenland surface mass balance models using GRACE and OIB time series Isabella Velicogna, University of California Irvine
We study the processes driving ice mass change of the Greenland ice sheet integrating information from multiple datasets and approaches. Here, we use GRACE-‐derived time series of ice mass change, surface mass balance (SMB) from RACMO and MAR, and altimetry results from OIB and ICESat-‐1. We determine which portion of the GRACE signal is explained by SMB variability, and within these regions we compare RACMO and MAR SMB. In regions where ice discharge is changing significantly, we compensate the GRACE data for ice discharge. We focus on 3 time periods: 1) the warm summer of 2012; 2) the cold summer of 2013 and 3) the 2015 summer for which OIB seasonal data have been collected. In general, we find more runoff production in MAR (lower melt production and lower refreeze) than RACMO (more cloud cover, higher albedo), but GRACE and RACMO in better agreement in the southwest and the southeast. Only in the north, RACMO runoff production appears to be too high, for reasons that are not yet clear. Time series of ice elevation will help further compare the models, particularly in the north and southwest, at low elevation. Results involving the 2015 summer will also be discussed at the meeting since they provide the first seasonal data in the north.
12:00 LUNCH !
1:00 In situ measurements of SMB runoff on the southwestern Greenland ice sheet Laurence C. Smith, University of California Los Angeles
Meltwater runoff through supraglacial streams and rivers flowing on the Greenland Ice Sheet has received little physical study. We present remotely sensed (UAV, WorldView) and in situ (Acoustic Doppler Current Profiler, Lagrangian drifters) measurements of supraglacial river drainage pattern, hydraulic properties, and discharge in the Kangerlussuaq region. This area of the ice sheet is characterized by large, well-‐organized supraglacial stream/river networks that efficiently drain the ice surface with minimal retention of surface water, with river moulins being the dominant physical mechanism by which surface meltwater enters the ice sheet. An intensive 2015 field campaign acquired novel datasets of watershed extent, drainage pattern, ablation rate, albedo and discharge for a ~70 km2 mid-‐elevation ice catchment ("Rio Behar"), including a continuous 72-‐hour record of discharge and water temperature in a supraglacial river upstream of its terminal moulin. Such situ measurements of supraglacial river discharge, when combined with simultaneous satellite and/or UAV remote sensing of catchment area, offer a unique opportunity to directly test runoff estimates of surface mass balance models.
1:15 Mapping and modeling hydrologic drainage of the Greenland Ice Sheet Lincoln H. Pitcher, University of California Los Angeles
Warming Arctic temperatures have accelerated mass loss of the Greenland Ice Sheet (GrIS) and increased its contribution to global sea level rise. Up to two-‐thirds of GrIS mass loss occurs via meltwater runoff yet the physical processes and pathways of hydrologic drainage remain poorly understood. To gain improved understanding, we map all GrIS meltwater exit points along the ice edge using high resolution satellite imagery. These meltwater exit points are further downscaled into ocean-‐connected land terminating hydrologic features downstream of any tributary. Next, to enhance understanding of meltwater routing and runoff these meltwater exit points are used to calibrate ice catchments for all GrIS land terminating outlet glaciers using gridded topography datasets. Our preliminary estimates suggest that (1) land terminating ice sheet watersheds cover ~10% of the surface of the GrIS yet surface mass balance runoff model outputs predict that > 30% of total runoff flows through this selection of large proglacial rivers and (2) that the ~10 largest land terminating watersheds in Greenland produce ~16% of the total GrIS meltwater runoff. We conclude that meltwater runoff is an important yet understudied component of GrIS mass loss.
1:30 Analysis of ATM waveform laser altimetry: a potential new tool for ice sheet surface hydrology and sea ice melt pond research Michael Studinger, NASA Goddard Space Flight Center
Studies of seasonal formation of melt water in the Arctic and its pooling in melt ponds on sea ice and in supraglacial lakes and streams on the surface of the Greenland Ice Sheet are often lacking critical information on the depth of these aquatic features. In-‐situ depth measurements of melt ponds on sea ice are limited in spatial coverage while supraglacial lake depth retrievals from multispectral reflectance of satellite remote sensing data desire higher spatial resolution and better accuracy in order to allow more precise estimates of the volume of melt water.
Airborne laser altimeters emitting short green pulses of coherent laser light have a long history of mapping bathymetry in near-‐coastal areas. The Airborne Topographic Mapper (ATM) systems with their 6-‐ns-‐short pulse at 532 nm wavelength are therefore ideally suited for penetrating several meters of clear melt water and detecting returns from the bottom of supraglacial lakes on the Greenland Ice Sheet as well as estimating the height of the water surface of these lakes. Preliminary analysis of July 2008 ATM data indicates the capability to estimate depths of supraglacial lakes on the Greenland Ice Sheet. In addition to lake-‐bottom returns the spatial variability in return signal strength and pulse width could potentially be used to discriminate between open water, thin bare ice, and snow-‐covered ice on the surface of supraglacial lakes.
Furthermore, the July 2008 ATM data indicates that the 1-‐meter-‐diameter of the footprint of ATM laser on the surface, together with a high shot density, allows for the production of large-‐scale, high-‐resolution, geodetic quality DEMs (50 x 50 cm) suitable for fine-‐scale glacial hydrology research.
The ability of the ATM laser altimeters to image glacial hydrological features in 3-‐D could be used for process studies as well as for quantifying melt processes over large scales. Together, these results can make an important contribution to understanding and quantifying changes of the Greenland Ice Sheet over time and their contributions to sea level rise.
1:45 Firn aquifer initial investigations near Helheim Glacier based on geophysical methods and in situ measurements Clément Miège and Rick Forster, University of Utah
Prior to the onset of seasonal surface melt, widespread perennial aquifers are detected in the firn of the Greenland ice sheet using NASA Operation IceBridge (OIB) airborne radar data. Firn aquifers are mainly located within the percolation zone of the southern and southeastern parts of the ice sheet, in high snow accumulation regions. Our study site is located on the upper portion of Helheim Glacier in SE Greenland, ~50 km west of the glacier calving front. We first used repeated airborne radar data collected by CReSIS (before and during OIB) to infer the presence of the firn over the last two decades from missing bed echoes. Recent fieldwork was carried out spring and summer 2015 along the surveyed radar line (16 km). Magnetic resonance soundings and seismic-‐refraction profiles complement the radar data and provide spatial constraints on the base of the aquifer and its volume of water. Piezometers and data-‐logging stations provide hydraulic conductivity measurements and allows monitoring of the water-‐table vertical fluctuations and firn temperature. Water appears to flow laterally in a highly-‐permeable unconfined aquifer, topographically driven by ice-‐sheet surface undulations until water encounters local sinks like crevasses. At the melt onset, it takes about a month to warm up the snow/firn column before water could replenish the aquifer. After the melt season, lateral flow is inferred from pressure-‐transducer data, suggesting a continuous water supply into crevasses likely connected to the englacial system. The base of the firn aquifer and the transition to colder ice are relatively stable spatially, over the studied transect. The aquifer impacts on the ice sheet include firn densification, alteration of the ice thermal state, and water from the aquifer could enter the englacial network system, which would affect ice dynamics and Greenland’s contribution to sea-‐level rise.
2:00 Greenland Ice Sheet meltwater export to oceans Åsa Rennermalm, Rutgers University
The Greenland ice sheet supplies massive amounts of freshwater and sediments to surrounding oceans, contributing to global sea level rise and influencing marine ecosystems. Meltwater runoff reaches the ocean directly at marine terminating glaciers, and through rivers and lakes along the entire perimeter of the ice sheet. Other sources of Greenland freshwater include runoff from tundra areas, peripheral glaciers and ice caps. Here, we present a spatiotemporal investigation of Greenland freshwater export to the ocean. Runoff catchment areas are identified by analyzing high-‐resolution digital elevation models of land and ice sheet surface topography. Discharge from individual catchments are derived from the regional surface mass balance model Modèle Atmosphérique Régional (MAR). This work is part of a larger interdisciplinary project (NASA IDS: Ice Sheet to the Sea), which examine how increasing meltwater runoff from the west Greenland Ice Sheet (GrIS) affects ocean productivity in the coastal waters of Greenland.
2:15 The impact of extreme melt on ocean stratification and productivity near West Greenland Thomas Mote, University of Georgia
While the impact of increasing meltwater from Greenland on global sea level is clear, its potentially important effects on coastal ocean physics, biogeochemistry, and ecology remain elusive. This interdisciplinary project (NASA IDS -‐ Ice Sheet to the Sea) seeks to understand how increasing meltwater runoff from the Greenland Ice Sheet (GrIS) affects ocean productivity in the coastal waters nearby. In particular, we seek to understand how freshwater, sediment, and nutrient input from ice sheet runoff and
surface fluxes impact the evolution of seasonal stratification and ocean productivity differentially along the latitudinal gradient from the Labrador Sea to the Northwater polynya. The target study area is West Greenland, including Davis Strait and the Labrador Sea.
Our work will allow us to understand how well meltwater export can be determined with remotely sensed and modeled parameters, the distribution of ice sheet meltwater export to the ocean, and how the delivery and extent of meltwater can impact ocean stratification and productivity. Remote sensing tools will uniquely support the understanding of those processes controlling the across-‐shelf and along-‐shelf spread of freshwater from runoff, including how runoff from the GrIS affects surface ocean stratification and how it varies latitudinally along the coast of west Greenland.
We use MAR outputs at a spatial resolution of 25 km to calculate GrIS surface mass balance (SMB), initialized by the ERA-‐40 reanalysis (1977–2002) and subsequently the ERA-‐INTERIM reanalysis (post-‐2002). To capture the geographic distribution of ice sheet meltwater export, we derive watersheds from flow directions calculated from the hydropotentiometric surface using surface and basal topographic data. A high-‐resolution numerical ocean model based on the Regional Ocean Modeling System (ROMS) was adopted for use in the Labrador Sea and Davis Straight. Surface forcing conditions for the ROMS model were obtained from satellite measurements and ERA-‐INTERIM reanalysis from ECMWF, while freshwater input will be imposed based on our validated ice sheet runoff model. Finally, a simple phytoplankton model based on classic approaches will use mixed layer depths, light exposure, and residence time output from ROMS model runs to estimate potential impacts on light-‐ and temperature-‐driven primary production. Projected changes for the ROMS study interval (2003-‐2012) are compared to remotely sensed ocean color.
2:30 BREAK ☕ 3:00 Geometric control on the inland propagation of thinning around the Greenland ice sheet Denis Felikson, University of Texas at Austin
Recent mass loss around the margins of the Greenland ice sheet accelerated around 2007, as observed by gravimetry and altimetry, and approximately half of this mass loss can be attributed to outlet glacier dynamics. Thinning initiated near the termini of outlet glaciers propagates inland as a kinematic wave and the distance over which thinning propagates is governed by ice geometry. We use the Peclet number, which characterizes the relative rates advection and diffusion of a thinning perturbation, to identify locations along glacier centerlines beyond which the rate of advection is much higher than the rate of diffusion and the ability of thinning to propagate upglacier is diminished. Using a 1985 digital elevation model (DEM), present-‐day DEMs created from WorldView-‐1 and -‐2 satellite imagery, and surface mass balance from a regional climate model (RACMO2.3), we show that observed dynamic thinning in west Greenland since 1985 extends to locations consistent with local maxima in the Peclet number. The extent of thinning is highly variable throughout the region, with some glacier geometries limiting dynamic thinning to ~10 km from the terminus while other glacier geometries allow thinning to extend ~130 km inland. We then use the Peclet number to predict the extent of future dynamic thinning along glacier centerlines around the entire Greenland ice sheet. We find significant variability in the distance that thinning can propagate into the ice sheet, and that glacier and bed geometry potentially limits future dynamic ice mass loss.
3:15 Tracking seasonal velocity change in Greenland Mark Fahnestock, University of Alaska Fairbanks
Tidewater outlet glaciers manifest several different modes of seasonal variation [Moon et al. 2014] that may evolve over time. We describe the present patterns of seasonal variation in Greenland outlet systems that we are tracking with optical satellite imagery, highlighting glaciers with large seasonal and year-‐to-‐year changes in ice flow. This flow record, now nearly 3 years in duration and covering essentially all tidewater outlet systems, is highly compatible with NASA MEASURES velocity products, which provide more than a decade of context for present seasonal and inter-‐annual variations.
3:30 On the utilization of ice flow models and uncertainty quantification to interpret spatial and temporal patterns in remote-‐sensing measurements of Greenland Ice Sheet mass balance Nicole-‐Jeanne Schlegel, Jet Propulsion Laboratory
With established uncertainty quantification tools embedded within the Ice Sheet System Model (ISSM), we conduct decadal-‐scale forward modeling experiments to 1) quantify the spatial resolution needed to effectively force surface mass balance (SMB) in various regions of the ice sheet and 2) determine the dynamic response of Greenland ice flow to variations in SMB. First, we perform sensitivity analyses to determine how perturbations in SMB affect model output; results allow us to investigate the locations where variations most significantly affect ice flow. Next, we apply Monte-‐Carlo style sampling analyses to determine how errors in SMB propagate through the model as uncertainties in estimates of Greenland ice discharge and regional mass balance. We find that overall, ISSM dynamically responds to SMB on a spatial scale of 23 km; therefore, SMB should be forced at at least a resolution of 23 km to properly capture dynamic ice response. In addition, results suggest that the areas with the largest uncertainty in mass flux are located near the equilibrium line altitude (ELA), upstream of major outlet glaciers in the North and West of the ice sheet. Sensitivity analysis indicates that these areas are also the most vulnerable on the ice sheet to persistent, far-‐field shifts in SMB, suggesting that continued warming, and upstream shift in the ELA, are likely to result in increased velocities, and consequentially SMB-‐induced thinning upstream of major outlet glaciers. Estimates of dynamic thinning, derived from altimetry, exhibit similar spatial patterns near the ELA, offering evidence that upstream thinning over the last decade may be a dynamic signature resulting from recent increases in the amplitude and areal extent of surface melt.
3:45 Winter storage subglacial water modulates glacier velocity sensitivity to summer surface melting in Southwest Greenland Winnie Chu, Columbia University
Along the margins of Greenland Ice Sheet, glaciers velocity increases when surface meltwater reaches the ice bed each summer. Satellite observations show that flow speedup is not uniform across Greenland as glaciers have different sensitivity to the changing melt rates. Variable distribution of subglacial water and bed topography may be crucial in controlling the glaciers response. However, no robust observations of the catchment scale subglacial hydrology are available in Greenland. Here we use IceBridge radar sounding reflectivity corrected for the thermal attenuation of glaciers to map the distribution of subglacial water in southwest Greenland for the first time. In April, the Russell/Isunnguata deep troughs have very low reflectivity (drier condition) and the adjacent ridges have relatively higher reflectivity (wetter condition). Our findings suggest that some of surface water from the previous summer is stored on the ridges in a linked-‐cavity type drainage system while the troughs are relatively dry due to a more efficient drainage system. When the surface melting begins, the relatively dry troughs may be primed to experience a greater change in basal lubrication than the surrounding ridges and could explain the localized summer speedup in these topographic low regions. This first catchment scale observation of subglacial hydrology in Greenland suggests that the difference in storage and drainage of subglacial water may explain the variable sensitivity of glaciers to the changing surface melt rates. Gridded airborne surveys that can cover different bed topographic settings across Greenland are critical to understand ice sheet hydrology-‐dynamics coupling.
4:00 Changes in Greenland and Alaska ice surface roughness and relationships to glacial acceleration – Analyses using altimeter data from ICESat, CryoSat-‐2 and ICESat-‐2 simulator instruments Ute Herzfeld, University of Colorado Boulder
Spatial ice surface roughness is an indicator of many processes that affect the ice surface, including glacial acceleration, ice deformation, crevassing, snowfall, melting, and wind deposition and erosion. We derive ice-‐surface roughness from satellite and airborne observations and investigate the relationships of surface roughness and its changes to glacial acceleration as one of the main manifestations of climate-‐induced changes in the Greenland Ice sheet. Comparing the situation around the Greenland margin and its glaciers with the situation of the recent surge of the Bering Bagley Glacier System, different acceleration types are classified. The analysis is based on ICESat GLAS data (2003-‐2009), CryoSat-‐2 SIRAL data (from 2010), data
collected during four NSF-‐supported flight campaigns in Alaska (2011-‐2013) and data from ICESat-‐2 simulator instruments MABEL and SIMPL (2014, 2015). Our approach uses a spatial statistical concept of generalized spatial surface roughness and characteristic parameters, which are mathematically related to physical concepts including crevassing, deformation and aerodynamic roughness length. To derive micro-‐topographic and roughness information from MABEL and SIMPL data, the Density-‐Dimension Approach (DDA) is introduced. Results demonstrate the expected capabilities of NASA's future ICESat-‐2 mission to map spatially complex ice-‐surface topography with unprecedented resolution and accuracy. The remote-‐sensing data analysis lays the foundation for applied case studies. Roughness and elevation changes in Ilulissat Ice Stream and other outlet glaciers are analyzed to investigate links between glacial acceleration and its causes. The study is rounded off with numerical modeling experiments. Results are relevant for assessment of the sea-‐level rise through mass loss from the Greenland ice sheet and for understanding relationships between observations and physical processes.
4:15 Ice mass changes around Greenland and the 2013 pause in deglaciation Chris Harig, Princeton University
We discuss recent ice mass changes in Greenland and the Canadian Archipelago using a combination of (1) gravimetry from the GRACE mission, (2) GPS displacement data, and (3) seismic tomography. Beginning in Summer 2013, ice mass in these regions diverge from their long-‐term trends, resulting in a positive mass anomaly. In the case of Greenland this anomaly reached almost 500 gigatons (Gt) through the end of 2014, meaning this amount was expected to have been lost based on prior trends, but instead was not. We highlight the regions where this mass flux is different from prior years and relate them to uplift changes seen at GNET GPS stations. In southwest Greenland, where the seismometer network is relatively dense, these interannual changes in surface loading (i.e. mass flux) can also be seen in the time-‐variable seismic wave speed of the upper crust, as estimated by tomography.
4:30 Exploring biases in altimetry assessments of Greenland’s mass balance in a warming climate, with FirnCover compaction data Mike MacFerrin, University of Colorado Boulder
Changes in near-‐surface density are a primary driver of uncertainty in measuring the mass balance of large glaciers and ice sheets with repeat altimetry, where changes in firn structure affect interpretations of altimetry. This problem is compounded in a warming climate where increased melt and refreezing simultaneously change annual compaction signals, the amplitude and phase of seasonal fluctuations in compaction, and the assumed retention of melt water. Using data collected by the Greenland Firn Compaction Verification and Reconnaissance experiment (FirnCover), we explore biases introduced in Greenland mass balance assessments if such considerations are not adequately handled, and discuss observational strategies for resolving these issues.
4:45 Quantitative partitioning of mass losses from Greenland Ice-‐Sheet into net dynamic losses and melt runoff from ICESat measurements H. Jay Zwally, University of Maryland & NASA Goddard Space Flight Center
For 2003 through 2009, the average total mass change (dM/dt) of the Greenland ice sheet (excluding non-‐contiguous ice caps) derived from ICESat dH/dt measurements was -‐169 Gt/yr . Above the equilibrium line (EL), the accumulation-‐driven mass change, dMa/dt, derived from ERA-‐Interim analyses data was +11 Gt/yr, and the resulting dynamic-‐driven mass change, dMd/dt, was -‐47 Gt/yr. Below the EL, the ablation plus dynamic-‐driven mass change, dMbd/dt, was -‐133 Gt/yr. Elevation time series, H(t) = H0(t0) + H1(t 1) + ….. H16(t 16), are constructed using data from the 16 ICESat laser campaigns (~ 33-‐days in Fall, Winter, and Spring over six years) that are adjusted for cross-‐track surface slopes to a common reference track. The H(t) series are constructed at 172 m along-‐track positions and then averaged over 50 km grid cells and over larger areas, in particular for the ablation zone below the EL in each of eight drainage systems (DS). The seasonal cycle of H(t) in the ablation zone is characterized by 1) a linear upward component evident during winter (fall through spring) that is mainly caused by the net ice flow from above the EL minus the ice
discharge at the ice margin and by 2) a superimposed downward component caused by surface melting during the summer. The H(t) for the ablation zone are fitted with a multi-‐variate function with a constant linear component describing the upward component of ice flow and a portion of a sine function describing the superimposed summer melting with variable interannual amplitude. By DS, the H(t) for the ablation zones show accelerations of the mass losses in the northern DS1 and the northwest DS8 that are mostly offset by decelerations of the mass losses in the east-‐central DS3 and the southeast DS4. Overall of the Greenland ablation zone the linear component is 1 m/yr, which indicates a net ice inflow of 177 Gt/yr to the ablation zone. The losses from melting for the summers of 2004 through 2009 are respectively 265, 354, 265, 371, 212, and 380 Gt/yr with an average of 308 Gt/yr. The net losses from the ablation zone range from a low of 35 Gt/yr in 2008 to a high of 203 Gt/yr in 2009 with an average loss of 131 Gt/yr, which is in good agreement with the 133 Gt/yr obtained from the along-‐track dH/dt solutions. Our analysis provides a unique partitioning of the net dynamic input to the ablation zone, which overall has minimal interannual variability, and the losses from melting, which have large interannual variability.
5:00 Greenland ice sheet elevation change and mass balance record and investigation of outlet glacier dynamics Bea Csatho, University at Buffalo
Ice sheet elevation changes are sensitive indicators of ice sheet mass balance. When partitioned into changes caused by ice dynamics, surface mass balance (SMB) anomalies and firn-‐compaction, they allow investigating ice dynamic processes directly. Our research aims at generating a comprehensive Greenland and Antarctic ice sheet elevation changes record by fusing all laser altimetry data since the start of NASA’s ATM mission in 1993. We rely on NASA’s ATM and LVIS observations to bridge the gap between the ICESat and ICESat-‐2 missions. Our current research also focuses on incorporating CryoSat radar altimetry into the record. Our most recent Greenland reconstruction provides a detailed elevation change history at more than 130,000 locations between 1993 and 2014. Elevation changes are partitioned into components due to crustal deformation, firn compaction and ice dynamics using a variety of different glacial isostatic adjustment (GIA), surface mass balance (SMB) and firn-‐densification models (FDM) as well as different estimates of ICESat intermission biases (IIS). and are also converted into annual mass changes. Our high resolution (2 km) annual mass and elevation change rates enables us to compare the altimetry derived mass changes with those derived from gravity changes using GRACE and from vertical crustal deformations measured by GNET. We collaborate with several different research group to complete a comprehensive analysis of Greenland mass balance using these different techniques. In addition to a better knowledge of the GrIS mass balance history, it will also allow the assessment of the different GIA, SMB, FDM and IIS estimates.
The second main component of our research is deriving detailed elevation change histories of Greenland outlet glaciers, by augmenting the altimetry record with digital elevation models from stereo photogrammetry. The new record, partitioned into elevation changes due to ice dynamics and surface processes, allows us to address two major questions regarding the dynamic evolution of the GrIS over the next 100-‐200 years: (1) how representative are the four well-‐studied glaciers (Jakobshavn Isbræ, Helheim, Kangerlussuaq and Petermann glaciers) for other outlet glaciers? (2) what physical processes are the most likely cause for observed glacier changes in Greenland? Outlet glacier changes are analyzed by using the force-‐balance technique and perturbation modeling with longitudinal stress gradient. Moreover, we use ISSM both through the assimilation of the new altimetry record to improve the reconstruction of basal friction and ice viscosity and forward modeling to examine possible mechanism explaining the observed changes. Our results include a comprehensive classification of 120+ outlet glaciers from the altimetry record as well as detailed investigations of Helheim, Kangerlussuaq and Zachariae glaciers.
5:30 POSTER SESSION & COCKTAIL HOUR " GSFC Recreational Center 6:30 DINNER ! GSFC Recreational Center
POSTERS Wednesday, January 20 5:30 PM GSFC Recreation Center, Building 92 Snow and firn densities on the Greenland and Antarctic Ice Sheets from observations, the MAR regional climate model, and the IMAU firn density model Patrick Alexander, NASA Goddard Institute for Space Studies
The density of snow and firn of the Greenland and Antarctic Ice Sheets (GrIS and AIS respectively) is an important parameter for estimates of ice sheet mass balance. Estimates ice sheet mass change derived from ice thickness measurements require simulations of snow and firn density for deriving mass balance, and simulated densities can also impact other parameters such as liquid water storage and blowing snow transport. We evaluate densities simulated in the Modèle Atmosphérique Régionale (MAR v3.5.2) regional climate model and the IMAU firn density model (IMAU-‐FDM v1.0) over the GrIS and AIS using in situ density profiles from the Surface Mass Balance Working Group (SUMup). The models agree well with observations during dry snow conditions for depths of 1 to 15 m. Within the first meter of the snowpack, MAR v3.5.2 consistently underestimates snow density, likely as a result of an underestimated initial snow density. There is a poorer agreement between models and observations when liquid water is present, especially in the case of IMAU-‐FDM v1.0, which tends to overestimate densities in areas of relatively high melt. Both MAR v3.5.2 and IMAU-‐FDM v1.0 suggest that the top 15 m of the GrIS have become denser over the past half-‐century, especially in warmer, wetter areas, but rates of change differ between models, possibly as a result of differences in simulated melt, percolation, and refreezing. Sensitivity studies and evaluation against additional measurements will help reveal reasons for model errors and their impact on mass balance estimates. Using AIRS remotely sensed data to estimate the vapor flux on the Greenland Ice Sheet and comparisons with RACMO2.3 Linette N. Boisvert, University of Maryland & NASA Goddard Space Flight Center
Mass loss from the Greenland ice sheet (GrIS) in recent years has been dominated by runoff from surface melt. Since runoff is the largest ablation term in the surface mass balance (SMB), it is currently being studied extensively, while little interest has been given to the smallest component: the vapor flux, the sum of evaporation and sublimation. Although poorly understood, it is not negligible and could potentially play a larger role in SMB in a warming climate where temperatures are higher, relative humidity decreases and changes in precipitation are uncertain. Here we present an innovative approach to estimate the vapor flux using the Atmospheric Infrared Sounder (AIRS) version 6 data and a modified vapor flux model (BMF13) over the GrIS between 2003-‐2014. When comparing AIRS data with GC-‐Net automatic weather station observations of temperature and humidity, errors of 3.14K and 0.17 g/kg were found. Overall, the average vapor flux from the GrIS between 2003-‐2014 was found to be 23.8 ± 3.0 Gt/yr. No statistically significant trends were found during the data record. This dataset is then compared to the Regional Atmospheric Climate Model (RACMO2.3) vapor flux. Relative to RACMO2.3, BMF13 is found to produce larger vapor fluxes in the summers around the ice sheet edge because the BMF13 model includes a new Multi-‐angle Imaging SpectroRadiometer (MISR) surface aerodynamic roughness product, which likely produces more accurate estimates of the drag coefficient on the ice sheet and also includes evaporation after areas of the ice sheet melt. RACMO2.3 produces less deposition in the winter because its vapor flux is assumed to be zero when drifting snow sublimation is activated in the winter months. Differences in the magnitude of the vapor flux are enhanced by larger skin and 2m temperature differences seen in the AIRS data compared to RACMO2.3. Diagnosing seasonal variability in Jakobshavn Isbræ marginal ice velocity due to melt water induced shear weakening Casey Cavanagh, University of Maryland
The impact of surface melt water on ice dynamics via supraglacial lake drainage and runoff has been well documented. Little attention has been focused on the impact of direct melt water injection into the shear margins
of fast flowing, marine-‐terminating outlet glaciers. Relationships between extra-‐marginal, summer-‐time ice velocities and drainage of water-‐filled crevasses within the shear margins of Jakobshavn Isbræ were examined. High resolution surface velocities were derived from Landsat-‐8 OLI using feature tracking methods. Velocity profiles were extracted along six, 10km long flowlines on the southern margins of the ice stream between May 2013 and September 2015. The proportion of observed extra-‐marginal velocity changes due to weakened shear margins from meltwater was quantified using the Ice Sheet System Model (ISSM). Modeling scenarios assume shear margin weakening as a result of basal lubrication from surface drainage. This work establishes the potential for enhanced ice mass discharge within Jakobshavn Isbræ catchment due to melt water induced shear weakening. Moulin distribution and formation on the southwest Greenland ice sheet Vena W. Chu, University of California Berkeley
River moulins represent a significant connection between surface meltwater generated on the Greenland ice sheet and subglacial drainage networks, where increased meltwater can enhance ice sliding dynamics. In this study, a new highresolution moulin map is created from WorldView-‐1/2 imagery acquired during the 2012 record melt year for a 12,500 km2 area near Russell Glacier in southwest Greenland. A total of 1,236 moulins are mapped and categorized as being located: in crevasse fields, along a single ice fracture, within drained lake basins, or having no visible formation mechanism. We find the presence of moulins up to 1787 m elevation, with 11% of moulins found above 1600 m elevation: higher than previously mapped moulins and where glaciological theory suggests few moulins should form. Our study observes moulins in both extensionaland compressional ice flow regimes (9% of moulins are found in areas of high extensional strain rate >0.005 yr-‐1), suggesting that 2 strain rates are not a strong indicator of the likelihood for moulin formation. Overall, moulin density tends to increase with higher bed elevation, thinner ice, lower surface slope, higher velocity, and higher strain rate. In sum, moulins are most common in crevassed, thinner ice near the ice sheet edge, but significant quantities also develop at high elevations. This indicates that future inland expansion of melting may create hydrologic connections between the surface and the bed at higher elevations than previously thought. Arctic Research Mapping Application (ARMAP): Visualize project-‐level information for U.S. funded research in the Arctic Renee Crain, National Science Foundation
The Arctic Research Mapping Application (ARMAP; http://armap.org/) is a suite of online applications and data services that support Arctic science by providing project tracking information (who’s doing what, when and where in the region) for United States Government funded projects. In collaboration with 17 research agencies, project locations are displayed in a visually enhanced web mapping application. Key information about each project is presented along with links to web pages that provide additional information. The mapping application includes new reference data layers and an updated ship tracks layer. Visual enhancements are achieved by redeveloping the front-‐end from FLEX to HTML5 and JavaScript, which now provide access to mobile users utilizing tablets and cell phone devices. New tools have been added that allow users to navigate, select, draw, measure, print, use a time slider, and more. Other module additions include a back-‐end Apache SOLR search platform that provides users with the capability to perform advance searches throughout the ARMAP database. Furthermore, a new query builder interface has been developed in order to provide more intuitive controls to generate complex queries. These improvements have been made to increase awareness of projects funded by numerous entities in the Arctic, enhance coordination for logistics support, help identify geographic gaps in research efforts and potentially foster more collaboration amongst researchers working in the region. Additionally, ARMAP can be used to demonstrate past, present, and future research efforts supported by the U.S. Government. The Arctic Observing Viewer: A web-‐mapping application for U.S. Arctic observing activities Renee Crain, National Science Foundation
Although a great deal of progress has been made with various arctic observing efforts, it can be difficult to assess such progress when so many agencies, organizations, research groups and others are making such rapid progress over such a large expanse of the Arctic. To help meet the strategic needs of the U.S. SEARCH-‐AON program and facilitate the development of SAON and other related initiatives, the Arctic Observing Viewer (AOV;
http://ArcticObservingViewer.org) has been developed. This web mapping application compiles detailed information pertaining to U.S. Arctic Observing efforts. Contributing partners include the U.S. NSF, USGS, ACADIS, ADIwg, AOOS, a2dc, AON, ARMAP, BAID, IASOA, INTERACT, and others. Over 7700 observation sites are currently in the AOV database and the application allows users to visualize, navigate, select, advance search, draw, print, and more. During 2015, the web mapping application has been enhanced by the addition of a query builder that allows users to create rich and complex queries. AOV is founded on principles of software and data interoperability and includes an emerging "Project" metadata standard, which uses ISO 19115-‐1 and compatible web services. Substantial efforts have focused on maintaining and centralizing all database information. In order to keep up with emerging technologies, the AOV data set has been structured and centralized within a relational database and the application front-‐end has been ported to HTML5 to enable mobile access. Other application enhancements include an embedded Apache Solr search platform which provides users with the capability to perform advance searches and an administration web based data management system that allows administrators to add, update, and delete information in real time. We encourage all collaborators to use AOV tools and services for their own purposes and to help us extend the impact of our efforts and ensure AOV complements other cyber-‐resources. Reinforcing dispersed but interoperable resources in this way will help to ensure improved capacities for conducting activities such as assessing the status of arctic observing efforts, optimizing logistic operations, and for quickly accessing external and project-‐focused web resources for more detailed information and access to scientific data and derived products. Dynamic thinning during glacier retreat alters subglacial hydrology and submarine melt Mason Fried, University of Texas at Austin
Discharge-‐driven submarine melt at tidewater glacier termini provides a dynamic coupling between glacier and ocean systems. Submarine melt rates are largely determined by the geometry of subglacial discharge near the terminus of tidewater glaciers. However, temporal variability of near-‐terminus subglacial hydrology remains unexplored. We examine a tidewater glacier in central West Greenland that underwent an 8 km retreat between 2003 and 2010 and identify changes in the direction of the subglacial hydraulic gradient associated with its dynamic thinning in order to infer synchronous variations in submarine melt. Glacier surface elevation from 2002 to 2015 is reconstructed using 12 co-‐registered 30-‐m ASTER-‐derived DEMs. This is used along with bed/fjord topography from mass-‐conservation and multibeam bathymetry to reconstruct the subglacial hydraulic potential over time. We then pair this with satellite observations of buoyant sediment plumes to verify changes in discharge routing to the terminus. During retreat, surface thinning near the terminus diffuses along-‐flow troughs in hydropotential and reduces across flow surface gradients. Together, these factors result in more distributed water routing to the terminus and may promote rapid channel outlet switching at the ice/ocean interface during retreat. Potential elevation biases for laser altimeters from subsurface scattered photons: Laboratory and model exploration of green light scattering in snow Adam Greeley, University of Maryland & NASA Goddard Space Flight Center
Existing visible light laser altimeters such as MABEL (Multiple Altimeter Beam Experimental Lidar) – a single photon counting simulator for ATLAS (Advanced Topographic Laser Altimeter System) on NASA’s upcoming ICESat-‐2 mission – and ATM (Airborne Topographic Mapper) on NASA’s Operation IceBridge mission provide scientists a view of Earth’s ice sheets, glaciers, and sea ice with unprecedented detail. Precise calibration of these instruments is needed to understand rapidly changing parameters like sea ice freeboard and to measure optical properties of surfaces like snow covered ice sheets using subsurface scattered photons.
Photons travelling into snow, ice, or water before scattering back to the altimeter receiving system (subsurface photons) travel farther and longer than photons scattering off the surface only, causing a bias in the measured elevation. We seek to identify subsurface photons in a laboratory setting using a flight-‐tested laser altimeter (MABEL) and to quantify their effect on surface elevation estimates for laser altimeter systems. We also compare these estimates with previous laboratory measurements of green laser light transmission through snow, as well as Monte Carlo simulations of backscattered photons from snow.
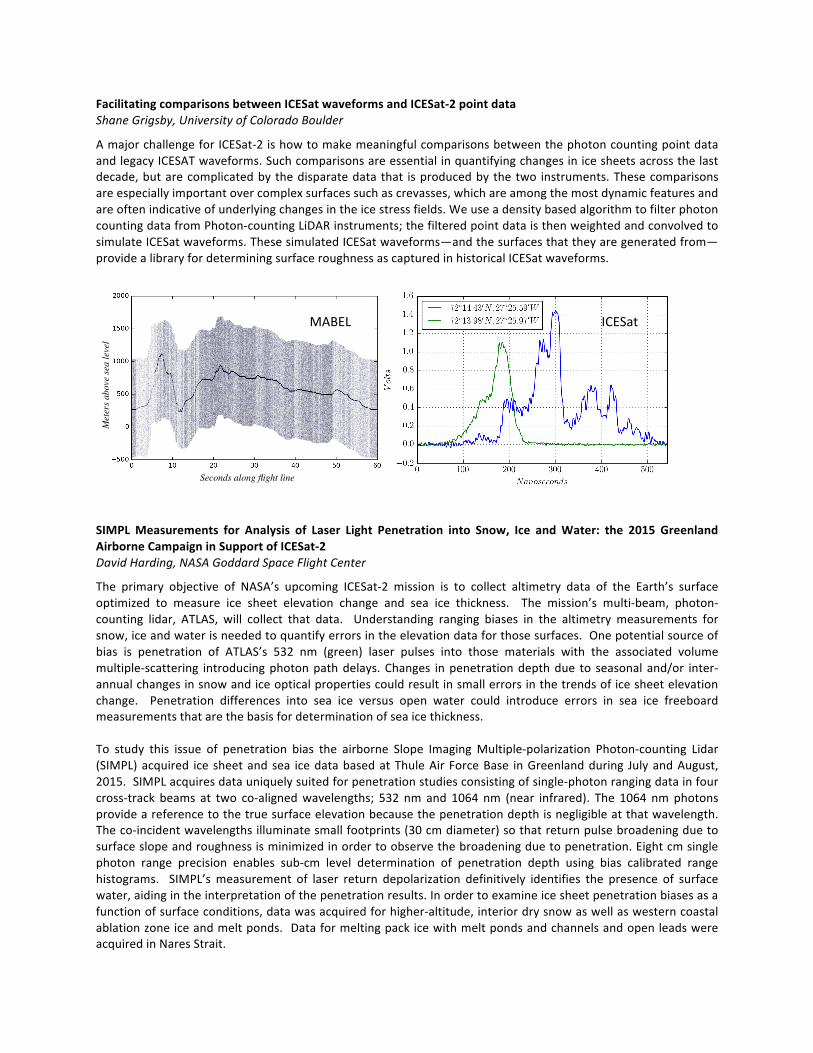
Facilitating comparisons between ICESat waveforms and ICESat-‐2 point data Shane Grigsby, University of Colorado Boulder
A major challenge for ICESat-‐2 is how to make meaningful comparisons between the photon counting point data and legacy ICESAT waveforms. Such comparisons are essential in quantifying changes in ice sheets across the last decade, but are complicated by the disparate data that is produced by the two instruments. These comparisons are especially important over complex surfaces such as crevasses, which are among the most dynamic features and are often indicative of underlying changes in the ice stress fields. We use a density based algorithm to filter photon counting data from Photon-‐counting LiDAR instruments; the filtered point data is then weighted and convolved to simulate ICESat waveforms. These simulated ICESat waveforms—and the surfaces that they are generated from—provide a library for determining surface roughness as captured in historical ICESat waveforms.
SIMPL Measurements for Analysis of Laser Light Penetration into Snow, Ice and Water: the 2015 Greenland Airborne Campaign in Support of ICESat-‐2 David Harding, NASA Goddard Space Flight Center
The primary objective of NASA’s upcoming ICESat-‐2 mission is to collect altimetry data of the Earth’s surface optimized to measure ice sheet elevation change and sea ice thickness. The mission’s multi-‐beam, photon-‐counting lidar, ATLAS, will collect that data. Understanding ranging biases in the altimetry measurements for snow, ice and water is needed to quantify errors in the elevation data for those surfaces. One potential source of bias is penetration of ATLAS’s 532 nm (green) laser pulses into those materials with the associated volume multiple-‐scattering introducing photon path delays. Changes in penetration depth due to seasonal and/or inter-‐annual changes in snow and ice optical properties could result in small errors in the trends of ice sheet elevation change. Penetration differences into sea ice versus open water could introduce errors in sea ice freeboard measurements that are the basis for determination of sea ice thickness. To study this issue of penetration bias the airborne Slope Imaging Multiple-‐polarization Photon-‐counting Lidar (SIMPL) acquired ice sheet and sea ice data based at Thule Air Force Base in Greenland during July and August, 2015. SIMPL acquires data uniquely suited for penetration studies consisting of single-‐photon ranging data in four cross-‐track beams at two co-‐aligned wavelengths; 532 nm and 1064 nm (near infrared). The 1064 nm photons provide a reference to the true surface elevation because the penetration depth is negligible at that wavelength. The co-‐incident wavelengths illuminate small footprints (30 cm diameter) so that return pulse broadening due to surface slope and roughness is minimized in order to observe the broadening due to penetration. Eight cm single photon range precision enables sub-‐cm level determination of penetration depth using bias calibrated range histograms. SIMPL’s measurement of laser return depolarization definitively identifies the presence of surface water, aiding in the interpretation of the penetration results. In order to examine ice sheet penetration biases as a function of surface conditions, data was acquired for higher-‐altitude, interior dry snow as well as western coastal ablation zone ice and melt ponds. Data for melting pack ice with melt ponds and channels and open leads were acquired in Nares Strait.
Seconds along flight line
Met
ers a
bove
sea
leve
l
MABEL ICESat
Spatial and temporal variations of surface temperature over Greenland as observed In AIRS, MODIS, and in-‐situ measurements Jae N. Lee, University of Maryland Baltimore County & NASA Goddard Space Flight Center
This work compares the temporal and spatial characteristics of the AIRS/AMSU (Atmospheric Infrared Sounder/ Advanced Microwave Sounding Unit-‐A) Version-‐6 and MODIS (Moderate-‐resolution Imaging Spectroradiometer) Collection-‐5 derived surface temperatures over Greenland. To estimate uncertainties in space-‐based surface temperature measurements, we re-‐projected the MODIS Ice Surface Temperature (IST) to 0.5 by 0.5 degree spatial resolution. We also re-‐gridded AIRS Skin Temperature (Ts) into the same grid but classified with different cloud conditions and surface types. These co-‐located data sets make intercomparison between the two instruments relatively straightforward. Using this approach, the spatial comparison between the monthly mean AIRS Ts and MODIS IST is in good agreement with RMS <2K for May 2012. This approach also allows the detection of any long-‐term calibration drift and the careful examination of calibration consistency in the MODIS and AIRS temperature data record.
The temporal correlations between temperature data are also compared with those from in-‐situ measurements from GC-‐Net (GCN) and NOAA stations. The coherent time series of surface temperature evident in the correlation between AIRS Ts and GCN temperatures suggest that at monthly time scales both observations capture the same climate signal over Greenland. It is also suggested that AIRS surface air temperature (Ta) can be used to estimate the boundary layer inversion. ATM seasonal elevation change of the Greenland Ice Sheet measured from 2015 IceBridge Spring and Fall surveys Serdar Manizade, Science Systems and Applications Inc. & NASA Wallops Flight Facility
Modeling seasonal variability in surface mass balance of the Greenland ice sheet needs large-‐scale field observations to better quantify spatial and temporal variability of surface processes contributing to seasonal elevation change. ATM laser altimetry measured the surface elevation of the Greenland icesheet during spring (March-‐May) and fall (September-‐October) 2015 IceBridge campaigns. The fall data is still at a preliminary stage of processing and verification. An early look at seasonal elevation change is presented from comparison of the two surveys. A general trend of thinning is observed for outlet glaciers and for the icesheet in a manner related to elevation and latitude. In contrast, some thickening is observed on the west (but not on the east) side of the ice divide above 2200m elevation in the southern half, below latitude 69N. The observed magnitude and spatial patterns of the summer melt signal and can be utilized as input into ice sheet models and for validating reanalysis from regional climate models such as RACMO and MAR. Longitudinal inter-‐comparison of modeled and measured West Greenland ice sheet meltwater runoff losses (2004-‐2014) Samiah Moustafa, Rutgers University
Increased surface meltwater runoff, that exits the Greenland ice sheet (GrIS) margin via supra-‐, en-‐, and sub-‐glacial drainage networks into fjords, pro-‐glacial lakes and rivers, accounts for half or more of total mass loss. Despite its importance, modeled meltwater runoff fluxes are poorly constrained, primarily due to a lack of direct in situ observations. Here, we present the first ever longitudinal inter-‐comparison of a multi-‐year dataset (2004-‐2014) of discharge for four drainage basins – Watson, Akuliarusiarsuup Kuua, Naujat Kuat, and North Rivers -‐ along West Greenland. These in situ hydrologic measurements are compared with modeled runoff output from Modèle Atmosphérique Régional (MAR) regional climate model, and the performance of the model is examined. An analysis of the relationship between modeled and actual ice sheet runoff patterns is assessed, and provides insight into the model’s skill to capture inter-‐annual and intra-‐annual variability, spatiotemporal patterns, and extreme melt events. This study’s findings will inform future development and parameterization of ice sheet surface mass balance models.
An overview of the ISMIP6 effort Sophie Nowicki, NASA Goddard Space Flight Center
The sea level projections made by the glaciological community as part of the Intergovernmental Panel on Climate Change (IPCC) process have often been out of phase with the projections considered by the wider Coupled Model Intercomparison Project (CMIP) community. For instance in AR5, the ice2sea and SeaRISE (Sea-‐level Response to Ice Sheet Evolution) ice sheet projects predominantly worked with AR4 scenarios, while the CMIP5 community used new future scenarios. As the next phase of CMIP is being designed (CMIP6), an effort for ice sheet models to be better integrated in the CMIP6 initiative has been proposed to the CMIP panel.
We present the framework for the new effort, ISMIP6, the Ice Sheet Model Intercomparison Project for CMIP6. The primary goal of ISMIP6 is to improve projections of sea level rise by focusing on the evolution of the Greenland and Antarctic ice sheets under a changing climate, along with a quantification of associated uncertainties (including uncertainty in both climate forcing and ice-‐sheet response). This goal requires an evaluation of AOGCM climate over and surrounding the ice sheets; analysis of simulated ice-‐sheet response from standalone models forced “offline” with CMIP AOGCM outputs and, where possible, with coupled ice sheet-‐AOGCM models; and experiments with standalone ice sheet models targeted at exploring the uncertainty associated with ice sheets physics, dynamics and numerical implementation. A secondary goal is to investigate the role of feedbacks between ice sheets and climate in order to gain insight into the impact of increased mass loss from the ice sheets on regional and global sea level, and of the implied ocean freshening on the coupled ocean-‐atmosphere circulation. These goals map into both Cryosphere and Sea-‐Level Rise Grand Challenges relevant to Climate and Cryosphere (CliC) and the World Climate Research Program (WCRP).
ISMIP6 is primarily focused on the CMIP6 scientific question “How does the Earth System respond to forcing?” and offers the exciting opportunity of widening the current CMIP definition of Earth System to include (for the first time) the ice sheets. The key output will be an ensemble of past and future estimates of ice sheet contribution to sea level. The proposed experiments both use and augment the CMIP6-‐DECK, Historical, ScenarioMIP and PMIP experiments. The emphasis on standalone, ensemble modelling with ice sheet models will also shed light on the question “How can we assess future climate changes given climate variability, predictability and uncertainties in scenario” for the mass budget of the ice sheets and its impact of global sea level. NE Greenland Ice Stream margin stability from geophysical techniques and remote sensing Kiya Riverman, Pennsylvania State University
We describe the formation of long surface troughs in the margins of the NE Greenland Ice Stream and suggest that these troughs control the current ice stream stability by driving subglacial water flow. The Northeast Greenland Ice Stream (NEGIS) is the largest ice stream in Greenland, draining ~8.4% of the ice sheet’s area. The flow pattern of this ice stream is unique to others in Greenland and Antarctica, and merits further study to determine the sensitivity of this ice stream to oceanic forcing.
High resolution Digital Elevation Models of the ice surface show several-‐hundred-‐km-‐long troughs in ice surface elevation coincident with the margins of NEGIS. These troughs drive regional lows in hydropotential. Active seismic and radar surveying reveal parallel bands of wet and drier sediments under these marginal surface troughs that likely limit ice flow across the ice stream margins (Christianson et al., 2014).
Shallow seismic refraction analysis shows significantly thinner firn in the ice stream margins, though high-‐frequency airborne radar indicates that snow accumulation is ~20% higher within the margins. Firn densification within the margins is therefore dependent on the effective stress state as well as overburden pressure. Both stress-‐enhanced marginal firn densification and along-‐flow ice acceleration produce the marginal troughs that drive the observed subglacial hydrology. We hypothesize that downstream drawdown of NEGIS’ outlet glaciers could remove these upstream troughs and drive a fundamental shift in ice flow.
Interannual variability in the biogeochemistry of the waters surrounding Greenland Cecile S. Rousseaux, Universities Space Research Association & NASA Goddard Space Flight Center
At the base of the food chain, phytoplankton not only respond to changes in physical and biogeochemical conditions but has also a direct impact on higher trophic levels. By using state-‐of-‐the-‐art models, including the NASA Ocean Biogeochemical Model (NOBM) and GEOS-‐5, we analyze the interannual variability in nutrients and phytoplankton composition in the waters surrounding Greenland. Biogeochemical parameters are found to vary substantially between 1998 and 2012. The preliminary results are analyzed in the context of previously published literature. More specifically we compare the fraction of the ice in different areas around Greenland with the changes in nutrients and phytoplankton composition. These results provide a first insight into possible connections between recent changes in ice fraction observed in this area of the world and the potential effects that this may have on the ocean carbon cycle and the food chain. Comparison of temperatures from models and AWS with NOAA in situ data at the Greenland Summit Christopher Shuman, University of Maryland Baltimore County & NASA Goddard Space Flight Center
The ability to record temperatures accurately enough to derive climate trends is an area of ongoing research at locations like the Greenland Summit. Originally intended to obtain reasonably accurate and consistent meteorological data year-‐round in support of ice sheet field operations, automatic weather stations (AWS) are being utilized for more challenging goals. These goals include measuring temperature over the decadal-‐length time spans necessary for assessing climate trends and to assess satellite-‐ or model-‐derived parameters. This research compares two traditional, decadal+ length AWS near-‐surface air temperature (TA) data sets to more recent ‘climate quality’ data from NOAA’s instrument suite at Summit. The primary goal of the study is to quantify uncertainties in the model and AWS TA measurements at typical temporal resolutions using data acquired during 2008-‐2013 and to explore possible reasons for observed temperature differences. A flexible transient subglacial hydrology model for the Ice Sheet System Model (ISSM) Aleah Sommers, University of Colorado Boulder
Subglacial hydrology significantly influences diurnal and seasonal velocity variations observed on Greenland’s outlet glaciers. We present a novel and flexible continuum formulation for modeling subglacial hydrology that allows for natural transitions between ‘channelized’ and ‘distributed’ drainage. By combining equations for mass, momentum and energy in flowing water with basal gap dynamics, a nonlinear elliptic PDE is obtained in terms of basal hydraulic head (related to basal water pressure). The model is currently implemented using a 2D finite element formulation as a stand-‐alone diagnostic model in MATLAB and in the Ice Sheet System Model (ISSM) developed at the Jet Propulsion Laboratory (JPL) and University of California, Irvine. We will present our model framework and illustrative results to demonstrate efficient drainage evolution and diurnal response to moulin inputs. Future research will focus on full two-‐way coupling of basal hydrology with ice flow in ISSM, with the objective of explaining the distinctly different seasonal velocity signals observed in different regions of the Greenland ice sheet. Development of a multi-‐sensor elevation time series pole-‐ward of 86°S in support of altimetry validation and ice sheet mass balance studies Michael Studinger, NASA Goddard Space Flight Center
In order to produce a cross-‐calibrated long-‐term record of ice-‐surface elevation change for input into ice sheet models and mass balance studies it is necessary to “link the measurements made by airborne laser altimeters, satellite measurements of ICESat, ICESat-‐2, and CryoSat-‐2” [IceBridge Level 1 Science Requirements, 2012] and determine the biases and the spatial variations between radar altimeters and laser altimeters using different wavelengths. The convergence zones of all ICESat tracks (86°S) and all ICESat-‐2 and CryoSat-‐2 tracks (88°S) are in regions of relatively low accumulation, making them ideal for satellite altimetry calibration. In preparation for ICESat-‐2 validation, the IceBridge and ICESat-‐2 science teams have designed IceBridge data acquisitions around 86°S and 88°S.
Our goal is to develop a cross-‐validated multi-‐sensor time series of surface elevation change pole-‐ward of 86°S that, in combination with measured accumulation rates, will support ICESat-‐2 calibration and validation and ice sheet mass balance studies.
Uncertainties in the altimeter’s position, its pointing angle, mounting biases, timing errors and other factors cause scan-‐related inaccuracies in elevation determination. Identifying and quantifying these biases in the interior of a continental ice sheet is challenging since simultaneous ground truth often does not exist. Several methods can be used to determine the internal consistency of the data, such as cross-‐over estimates, intra-‐scan intersections and averaging over large, relatively flat areas, such as sea ice. Estimating the absolute accuracy is even more challenging. We use intercomparisons between various data sets to approximately evaluate the absolute accuracy of the elevation measurements.
In addition to bias determination several aspects need to be considered when comparing and combining elevation measurements from different radar and laser altimeters, including: a) foot print size and spatial sampling pattern; b) accuracy and precision of each data sets; c) varying signal penetration into the snow; and d) changes in geodetic reference frames over time, such as the International Terrestrial Reference Frame (ITRF) and tidal corrections. To properly interpret the observed elevation change (dh/dt) as mass change, however, the various processes that control surface elevation fluctuations must be quantified and therefore future work will quantify the spatial variability in snow accumulation rates pole-‐ward of 86°S and in particular around 88°S.
The poster will focus on the analysis of several IceBridge flights around 86°S and 88°S with the LVIS and ATM airborne laser altimeters and will evaluate the accuracy and precision of these data sets compared to ground GPS measurements made by the Norwegian-‐U.S. Scientific Traverse of East Antarctica (NUS). The results from Antarctica can be transferred to the Greenland Ice Sheet and can make an important contribution to understanding and quantifying changes of the Greenland Ice Sheet over time and their contributions to sea level rise. Recent Greenland thinning from Operation IceBridge ATM and LVIS Data Tyler Sutterly, University of California Irvine
We investigate regional thinning rates in Greenland using ICESat laser altimetry and two Operation IceBridge lidar instruments, the Airborne Topographic Mapper (ATM) and the Land, Vegetation and Ice Sensor (LVIS). IceBridge and Pre-‐IceBridge ATM data are available from 1993 to present and IceBridge and Pre-‐Icebridge LVIS data are available from 2007 to present. We compare different techniques for combining the two datasets: overlapping footprints from the idhdt4 elevation product and triangulated irregular network meshing. We validate the combination of ATM and LVIS for periods with near term overlap of the two instruments. By combining the lidar datasets, we are able to investigate intra-‐annual, annual, interannual surface elevation change. We investigate both the high melt season of 2012 and the low melt season of 2013. We compare our LVIS/ATM results with surface mass balance outputs from two regional climate models: the Regional Atmospheric Climate Model (RACMO) and the Modéle Atmosphérique Régional (MAR). In addition, we investigate the thinning rates of major outlet glaciers with a particular emphasis on the evolution of Jakobshavn Isbræ. Ice sheet meltwater impacts on coastal biological productivity -‐ models and remote observations for southwest Greenland Patricia Yager, University of Georgia
Surface mass balance observations and models confirm that the Greenland Ice Sheet has experienced accelerating ice mass losses during the past decades. These losses enhance freshwater discharge to the ocean and have important implications for ocean circulation and sea level, but they may also impact marine ecosystems and carbon cycling. High-‐latitude primary productivity is limited by light or nutrients (or both), and phytoplankton access to these limiting factors can be altered by freshwater additions. In many high-‐latitude ecosystems, seasonal sea-‐ice meltwater provides stratification that enhances biological productivity in marginal ice zones. We hypothesized that extreme glacial meltwater discharge could similarly help relieve the light limitation described by previous studies in this region.
Mechanisms for delivering glacial meltwater to the ocean are complex and depend in part on whether the melt occurs at the ice-‐atmosphere or ice-‐ocean interface. Marine-‐terminating glaciers may generate buoyant plumes at depth, similar to upwelling, whereas runoff from land-‐terminating glaciers will behave more like a riverine point source at the ocean surface. Here, we present results from ongoing efforts to understand these impacts in coastal Greenland as part of the NASA-‐IDS Ice Sheet to the Sea project.
Incorporating meltwater discharge from coupled atmospheric (MAR) and hydrologic models, a high-‐resolution (5 km) ocean model (ROMS: Regional Ocean Model System) was used to determine the oceanic fate of the meltwater in the Labrador Sea and Davis Strait. Meltwater was modeled as surface runoff and the resulting shallower mixed layers increased light availability to coastal phytoplankton by 5 – 20 W m-‐2. This enhanced light availability increased potential growth rates by up to 0.21 ± 0.04 d-‐1 or 10%. Model predictions were compared to remotely sensed ocean color observations with mixed results, likely because growth is not the only control on phytoplankton biomass in situ. We also find that the relationship between productivity and meltwater discharge is not direct, since mixed layer depth and light availability also depend on changes in winds and cloud cover associated with the atmospheric conditions of extreme meltwater discharge events. Preliminary results from GEOS-‐5/ISSM coupled simulation over Greenland Ice Sheet Bin Zhao, Science Applications International Corp. & NASA Goddard Space Flight Center
Dynamic ice sheet changes are believed to have strong influences on the atmospheric circulations over long time scales ranging from decades to millennia. Such feedbacks can only be captured by coupling dynamic ice sheet models to Earth System Models, e.g., GEOS-‐5 from GMAO. In this study, we present preliminary results from simulation of the coupled JPL Ice Sheet System Model (ISSM) and GEOS-‐5. The coupling framework is established using Earth System Modeling Framework (ESMF). Each ISSM simulation unit is explicitly represented in GEOS-‐5 as a tile element which serves as an interface, communicating information as required. A geometric downscaling scheme is employed to provide detailed surface forcing to ISSM. Conversely, ISSM surfaces are transferred back to maintain a surface mass balance and elevation feedback via downscaling process. The coupling is done at every ISSM time step. We demonstrate a multi-‐decadal one-‐way forcing experiment with a 1-‐deg AGCM resolution and shallow ice approximation of ISSM.

Page 1 of 3
OIB Science Team Meeting: Sea Ice 20-‐22 January 2015
NASA Goddard Space Flight Center, Greenbelt, MD Building 34, Rm 120a/b
Day 1: Wednesday, 20 Jan
Snow Thickness on Sea Ice Working Group (STOSIWIG)
STOSIWIG Objective: Review and advance work to improve the quality, accessibility and documentation of snow radar data and OIB snow depth estimates through effective collaborations
0900 Welcome and meeting objectives (Gogineni/R-‐Menge) 0910 Evaluation of Operation IceBridge quick-‐look snow depth estimates on sea ice (King)
0930 Review action items from June 2015 meeting (R-‐Menge)
1000 Snow radar data quality: 2009-‐2015 (Leuschen/Paden)
• Status of reprocessing • Quality metrics • Documentation for users: publication plan • Plan for remaining reprocessing and any other unfinished business
1130 Future snow radar acquisitions: Assuring data quality (Leuschen)
• Instrument stability o Anticipated changes in radar configuration o Minimizing impact of changes on data quality
• Data processing: Steps and timeline for 2016
1230 Lunch
1330 NASA Visualization Lab Demo: Snow Radar
1345 Snow depth retrieval
• Review of retrieval algorithms: Presentations (20 minute each) by Kurtz, Newman, Kwok • IceBridge community snow depth product
o Evaluation: Outlining approach for inter-‐comparison o Role of STOSIWIG
1600 Future contributions of STOSIWIG
• Freeboard calculation o Presentation by L. Connor o Availability of lead location data
• Estimates of ice thickness
Page 2 of 3
1700 Adjourn
Day 2: Thursday, 21 Jan
Science Team (Land ice): Ian Joughin, Ian Howat, Mark Fahnestock, Eric Rignot (Lead), Eric Larour, Ben Smith, Lora Koenig. (Sea ice): Jackie Richter-‐Menge (Lead), Sinead Farrell, Lora Koenig, Thorsten Markus, Nathan Kurtz. Tom Neumann (ex-‐officio).
Project Manager: John Woods. Project Scientist: Nathan Kurtz.
Program Managers: Thomas Wagner, Bruce Tagg, Charles Webb.
Instrument Teams: ATM, LVIS (NASA instrument), DMS, MCoRDS, Snow/accumulation radar, Gravimeter (Antarctic only)
Goals of the meeting: Finalize mission planning for OIB Greenland 2016 for land ice and sea ice. Discuss options for Fall Antarctic deployment with GV (Punta Arenas) and Basler (East Antarctica) with LVIS, ATM, MCoRDS, gravity. Discuss Fall/Summer campaign in Greenland with GV. Define a vision for OIB post ICESat-‐2 launch.
0900 Welcome and Announcements (Eric R./ Jackie)
0905 Comments and direction from NASA HQ (Tom W./Bruce T.)
• Post FY16: Science Team Configuration
0920 Comments and directions from OIB Project Science Office, management update, status of flights, summer campaigns, update on range, capabilities, instrumentation (Nathan, John W.)
0945 OIB Instrument update:
1) LVIS NASA Instrument, Antarctic Campaign,
2) ATM Fall/Spring Campaign
3) CRESIS radar instruments, configuration, post FY16 NSF CRESIS
1015 Break
1030 OIB Instrument update continued:
4) Potential new instrument, BESST: High precision, calibrated radiometer (Matt Tooth)
1045 Campaign strategies: Pros and cons:
• Arctic: Spring and Summer/Fall Campaigns
• Antarctic: Coverage in West and East
1115 NSIDC: Demo of new NSIDC portal capabilities (Steve T.)
1130 OIB science objectives for next year and beyond (Eric/Jackie)
• What could be the role for OIB after the launch of ICESat-‐2?
1200 Lunch
OIB Sea Ice Breakout
1300 STOSIWIG: Summary from Day 1 – Action Items (R-‐Menge/Gogineni)
1330 CryoVal: Comparison of IceBridge and CryoSat-‐2 data (Haas)

Page 3 of 3
1400 Spring versus summer/fall campaigns
• Review of 2015 Arctic campaigns: Goals and achievements (R-‐Menge) • Summer/fall: Data quality (Harbeck/Kurtz)
1430 Draft and prioritize flight lines for 2016 Arctic spring campaign (Sonntag)
1) Configuration • NOAA P-‐3 • Instrumentation: ATM, DMS, Snow radar, IR
2) Review previous recommendations 3) Outline possible coordinated flights with other planned activities
• EC: Eureka! (Howell/King) • NRL: Barrow, ICEX2016 ice camp (Brozena/Gardner) • NPS: RASM model support (Roberts) • Satellite under flights: Sentinel-‐3 (planned launch date is Feb 4, 2016), CryoSat-‐2, and
SARAL/AltiKa (Farrell/Connor) • DTC/Forsberg (Casal) • Others?
4) Amend, name and prioritize flight line recommendations
1700 Adjourn
Day 3: Friday, 22 Jan
OIB Sea Ice Team Breakout (Closed Session)
0900 Review of Day 2 (R-‐Menge)
0915 OIB Project Office: Review of current and planned sea ice-‐related work • Brief presentations from each OIB Project Office team member highlighting objectives,
approach, expected outcome, timeline • Plan for peer-‐reviewed publications of product algorithms and results • Optimizing OIB sea ice science team support
1100 Odds ‘n ends
• Finalize flight lines for 2016 Arctic campaign • Rider on NOAA-‐P3, Fairbanks: NPS
1200 Meeting adjourns
Page 1 of 3
OIB Science Team Meeting: Land Ice 20-‐21 January 2015
NASA Goddard Space Flight Center, Greenbelt, MD Building 34, Rm W150
Day 0: Wednesday, 20 Jan PARCA Meeting 8:30am – 5:30pm
Day 1: Thursday, 21 Jan
NASA IceBridge Project: Joint Land/Sea Ice Session Science Team (Land ice): Mark Fahnestock, Ian Howat, Ian Joughin, Lora Koenig, Eric Larour, Eric Rignot (Lead), Ben Smith,. (Sea ice): Sinead Farrell, Lora Koenig, Thorsten Markus, Jackie Richter-‐Menge (Lead), Tom Neumann (ex-‐officio). Project Manager: John Woods. Project Scientist: Nathan Kurtz. Program Managers: Thomas Wagner, Bruce Tagg, Charles Webb. Instrument Teams: ATM, LVIS (NASA instrument), DMS, MCoRDS, Snow/accumulation radar, Gravimeter (Antarctic only)
Goals of the meeting: Finalize mission planning for OIB Greenland 2016 for land and sea ice. Discuss options for Fall Antarctic deployment with GV (Punta Arenas) and Basler (East Antarctica) with LVIS, ATM, MCoRDS, G2 gravity. Discuss Fall/Summer campaigns in Greenland with GV. Define a vision for OIB post ICESat-‐2 launch. 0900 Welcome and Announcements (Eric Rignot/ Jackie Richter-‐Menge)
0905 Comments and direction from NASA HQ (Tom Wagner/Bruce Tagg)
• Post FY16: Science Team Configuration
0920 Comments and directions from OIB Project Science Office, management update, status of flights, summer campaigns, update on range, capabilities, and instrumentation (Nathan Kurtz, John Woods)
0945 OIB Instrument update:
1) LVIS NASA Instrument, Antarctic Campaign (Michelle Hofton),
2) ATM Fall/Spring Campaign (Matt Kinswiler/Serdar Manizade/Michael Studinger/John Sonntag)
3) CRESIS radar instruments, configuration, post FY16 NSF CRESIS (Prasad Gogineni/Carl Leuschen/John Paden).
1015 Break
1030 OIB Instrument update continued:
4) Potential new instrument, BESST: High precision, calibrated radiometer (Matt Tooth)
Page 2 of 3
1045 Campaign strategies: Pros and cons (Jackie Richter-‐Menge/Eric Rignot):
• Arctic: Spring and Summer/Fall Campaigns • Antarctic: Coverage in West and East
1115 NSIDC: Demo of new NSIDC portal capabilities (Steve Tanner)
1130 OIB science objectives for next year and beyond (Eric Rignot/Jackie Richter-‐Menge)
• MABEL (Tom Neumann). • ICESat-‐2 cal/val (Kelly Brunt) • What could be the role for OIB after the launch of ICESat-‐2?
-‐ Antarctic ice thickness/gravity (Mark Fahnestock/Eric Rignot) -‐ Others (All).
1200 Lunch
OIB Land Ice Breakout
1300 Draft and prioritize flight lines for 2016 Arctic spring campaign (John Sonntag)
1) Configuration • NOAA P-‐3 (John Sonntag) • Instrumentation: ATM (John Sonntag), DMS. • Radar performance (sounder, snow radar) and impacts on data quality: CRESIS (Carl
Leuschen, Lora Koenig) • Draft flight plan (John Sonntag)
2) Prioritize flight lines for Spring 2016 (all)
3) Outline of summer campaign 2016 (all)
1400 Fall campaign review and draft flight planning (Mark Fahnestock)
• Review of 2015 Arctic campaigns: Goals and achievements (Mark Fahnestock) • Summer/fall: Data quality (Ben Smith/Mark Fahnestock/Michael Studinger)
1445 Other OIB activities
• OIB Alaska (Mark Fahnestock) • Gravity survey SE Greenland and flight planning (Eric Rignot). • OMG flight planning for GLISTIN and synergy with OIB (Eric Rignot).
1515 Antarctic campaign (Eric Rignot/John Woods)
• Formulate key science objectives and areas for East Antarctica. • Instrument recommendation/selection. • Options for the gravimeter (Kirsty Tinto) • Time schedule for instrument selection, mission planning, deployment schedule

Page 3 of 3
1600 A future for OIB beyond 2016 (Eric Rignot/Mark Fahnestock)
• Formulate key science objectives: What will be missing if OIB stops in 2019? • Instrument selection • White paper?
1700 Adjourn
1800 ST diner, ongoing discussions.