Embed Size (px)
Citation preview
J Econ GrowthDOI 10.1007/s10887-013-9089-x
Parasitical cultures? The cultural origins of institutionsand development
Robbert Maseland
© Springer Science+Business Media New York 2013
Abstract Do cultural attitudes affect institutions and economic performance? This papersuggests they do. To measure the impact of cultural attitudes we use prevalence rates ofthe common parasite Toxoplasma gondii which is known to affect individual attitudes andsocietal values in predictable ways. By using prevalence rates of Toxoplasma as instrumentfor cultural variation, we are able to isolate the effects of cultural attitudes on institutions,distinguishing them from effects of institutions and economic outcomes on culture. We findthat our indicators of cultural attitudes are significant determinants of institutional quality,and strong predictors of long-run economic performance.
Keywords Economic development · Institutions · Culture · Pathogens
JEL Classification O43 · Z10 · N4
‘Character, in the long run, is the decisive factor in the life of an individual and of nations alike.’
Theodore Roosevelt
Institutions matter. There is widespread agreement that secure property rights, rule of law,and low levels of corruption are important conditions for business climate and economicgrowth (Acemoglu et al. 2001; Easterly and Levine 2003; Kaufmann et al. 1999; Rodrik etal. 2004). More challenging is the question where these persistent differences in institutionscome from. In search of the origins of institutions, researchers have retraced institutional dif-ferences to historical variations in conditions, suggesting they have set in motion divergentevolutionary paths (Acemoglu et al. 2001; Engerman and Sokoloff 1997; Greif 1994, 2006;
R. Maseland (B)University of Groningen, P.O. Box 800, 9700 AV Groningen,The Netherlandse-mail: [email protected]
123

J Econ Growth
LaPorta et al. 1998, 2008; North 1990; Tabellini 2010). As part of this literature, interestin attitudinal factors and cultural beliefs as explanations for persistent differences in insti-tutions and economic performance has increased (Beugelsdijk and Maseland 2011; Gorod-nichenko and Roland 2011; Greif 1994; Landes 1998; North 2005; Tabellini 2008, 2010).The impact of cultural variation in attitudes towards trust has especially attracted attention(Aghion et al. 2010; Guiso et al. 2006; Knack and Keefer 1997; Zak and Knack 2001).
Until now, it has been hard to back up cultural explanations with unambiguous empiricalevidence. The problem is not just the familiar one of endogeneity—culture influencing insti-tutions and vice versa—but also the fact that culture and institutions are so closely relatedthat it is hard to empirically isolate one from the other. We often do not know to what extentobserved differences between groups are retraceable to differences in ‘mental programs’(Hofstede 2001; North 1990), or to what extent they are a reflection of similarly programmedagents responding to different contexts (Beugelsdijk 2006; Clarke et al. 1999; Fernandez2010; Maseland and van Hoorn 2011). Do societal levels of trust reflect differences in under-lying cultural attitudes or the fact that it is easier to trust others if one has effective enforcementinstitutions to back trust up? (Beugelsdijk 2006). Efforts to study the impact of culture byturning to historical data (Tabellini 2010) or comparing migrants within a single institutionalsetting (Algan and Cahuc 2010; Fernandez 2007, 2008, 2010; Fernandez and Fogli 2009,2006; Luttmer and Singhal 2011) go some way in addressing endogeneity and intractabilityissues, but in the end offer only partial solutions with limited applicability.
To assess the effects of culture on institutions unambiguously, we need a generally avail-able indicator of culture that only elicits culture in so far as it is not affected by institutions oreconomic performance. This paper provides such an instrument in the form of a biologicaldeterminant of culture; the prevalence of a pathogen called Toxoplasma gondii. Infectionwith this parasite generally causes only temporary, mild flu-like symptoms, but has beenshown to have enduring effects on individual personality (Flegr et al. 1996; Webster 2001).Specifically, infected people tend to be more apprehensive, self-doubting, worried, and inse-cure. Consequently, they are more focused on ego and material possessions, while being lessconcerned with other people, following rules and moral duties (Flegr et al. 1996; Webster2001). As a result of these effects on individuals, the parasite has been shown to affect culturein predictable ways, high prevalence rates being associated with higher scores on culturalmasculinity, for example (Lafferty 2006). What is more, prevalence is common in indus-trialized societies, while prevalence rates vary strongly between them without any apparentrelation to economically relevant differences in social circumstances. These characteristicsmake prevalence rates of Toxoplasma gondii a suitable proxy for cultural attitudes that isindependent of institutional environment.
This paper shows that inter-country differences in seroprevalence rates of toxoplasma arestrongly correlated with cultural variables of trust, uncertainty avoidance, collectivism andpower distance. This effect of toxoplasma seroprevalence on culture explains a large part ofthe variation in institutional quality between societies, and thus of economic performance.These results are robust to controls for geographical features and urbanization patterns,changes in dataset and to variation in measures of institutional quality. Also, the effectsof toxoplasma seroprevalence on culture and institutions are qualitatively unaffected bycontrolling for income levels and prevalence of other non-tropical infectious diseases. Weempirically confirm the thesis, put forward in institutional theory (North 2005; Williamson2000) and historical analysis (Landes 1998), that cultural attitudes have an important impacton institutional development and economic outcomes.
123

J Econ Growth
1 Institutions and culture
1.1 The origins of institutions
Students of economic growth generally agree that the quality of institutions is a crucialfactor in explaining income differences around the world (Acemoglu et al. 2001; Engermanand Sokoloff 1997; Hall and Jones 1999; Easterly and Levine 2003; Kaufmann et al. 1999;Rodrik et al. 2004). In situations where investors feel secure about their property rights,legal and macro-economic risks are limited, bureaucratic hurdles are minimized and accessto functioning markets is secured, businesses are more likely to thrive. Societies whereinvestors face high expropriation risks, recourse to the law is limited, corruption is severe, orbureaucratic demands are stifling, make it less attractive for entrepreneurs to invest.
Why do some societies have better quality institutions than others? Explanations typi-cally go back to the historical roots of current institutions, arguing that initial differencesin circumstances had lasting effects on institutions (Greif 1994, 2006; North et al. 2000;Sokoloff and Robinson 2003; see Bértola (2010) for a discussion of this view). Some traceback differences in institutions to legal origins, determined by whether regions have beenunder (indirect) influence of the Roman empire or influenced by English common law tra-ditions (Beck et al. 2001; Glaeser and Shleifer 2002; LaPorta et al. 1998, 2008; Stulz andWilliamson 2003).
Another line of literature invokes geography and climate. Tropical countries are thoughtto have worse institutions, for a variety of reasons. Europeans were more hesitant to settlein tropical regions because of climate and incidence of diseases, not introducing their highquality institutions there (Beck et al. 2003; Hall and Jones 1999; Kaufmann et al. 1999).Acemoglu et al. (2001) show that in areas with high settler mortality colonizers tended to setup extractive states. Institutions were not focused on protecting property and promoting accessto courts of the general population (as they were in settler colonies), but mainly developedto facilitate exploitation of the land by colonial elites. Sachs and Malaney (2002) add tothis the costs of diseases in terms of loss in education, freedom of movement, and opennessto trade, all limiting the potential for subsequent improvements in institutions (Rodrik andSubramanian 2003). Engerman and Sokoloff 1997 make a similar argument, though focusingon the effects of natural resource endowments. The crops grown in countries around theequator typically demanded large plantations worked by slaves or indigenous labor. Severeinequality in ownership of land associated with this type of production fostered extractiveinstitutions that persist until today (Sokoloff and Zolt 2007). Through path-dependence, theeffects of initial conditions linger on in today’s institutions (Acemoglu et al. 2001; Easterlyand Levine 2003).
1.2 Cultural determinants
Another literature traces differences in institutional quality back to culture (Greif 1994, 2006;Harrison and Huntington 2000; Landes 1998; Tabellini 2008, 2010). The idea that culture mayaffect economic institutions goes back at least to Weber (1992 [1930]), who first argued thatProtestant values and attitudes were responsible for the development of capitalist societies inthe West. Weber’s thesis has inspired a large body of research on the role between attitudes andeconomic institutions, though most of it is outside economics (e.g. Granato et al. 1996; Kahn1979; Kim and Park 2003; Tawney 1926). Within economics, interest in culture resurfacedin the wake of new institutionalism (Beugelsdijk and Maseland 2011). New institutionaleconomics stresses the embedded character of institutions in informal attitudes, values and
123

J Econ Growth
beliefs (North 1990, 2005; Williamson 2000, 2009; the same point has been made by Hofstedeand Hofstede (2005)).
Because institutions are embedded, differences in cultural attitudes and values are partiallyresponsible for enduring differences in institutions. Tabellini (2010) distinguishes three areasof attitudes likely to affect institutions: attitudes about the position of the individual vis-à-vissociety and the state, trust, and generalized versus limited morality.
With respect to the first, WVS data about individual self-confidence and sense of controlare associated with higher quality institutions and economic performance (Tabellini 2010).Licht et al. (2005) argue that a focus on the individual is associated with more rule of lawand control of corruption. The reasoning is that a strong belief in individual control reducesdemands for regulation and increases accountability. In the same vein, Jing and Graham(2008) show that Hofstede’s (2001) power distance and collectivism measures are positivelycorrelated with regulation, inequality, and corruption. In high power distance cultures peopleexpect and accept that institutions such as property rights, taxation, governance structuresand courts are primarily designed to serve a privileged few (Hofstede and Hofstede 2005,p. 67). Husted (1999) show that cultures scoring high on power distance, masculinity anduncertainty avoidance dimensions suffer more from corruption and ineffective institutions.Masculine attitudes are thought to reduce concern for others and society in general (Hofstede2001), while uncertainty avoidance may increase demand for rules while inducing people topass over them in order to secure more certain results for themselves.
The second area of attitudes affecting institutions concerns trust. Trust is generally associ-ated with better and more flexible institutions. Lack of trust in people may inhibit collectivedecision-making, increasing the need for complex and costly enforcement mechanisms (Fine2001; Knack 2002; Putnam et al. 1993). As a result, institutions tend to be inefficient andremain so in low-trust societies, as it becomes hard to mobilize the social resources to changethem. It matters whom you trust, however. Tabellini (2010) argues that in hierarchical cul-tures where codes of conduct and moral guidelines are limited to small circles of relatedpeople, this may hinder the development of neutral legal institutions facilitating economicinteractions beyond the in-group (see also Greif 1994; Greif and Tabellini 2010). Althoughlimited morality may be efficient in small-scale societies, generalized morality is needed foreconomic cooperation beyond the in-group (Greif and Tabellini 2010).
In addition to the attitudes discussed by Tabellini (2010), a wide variety of authors hassuggested that (following Weber 1992 [1930]) attitudes towards work and time are of impor-tance. Tropical climates have been said to induce indolence and a slower rate of activity (seeBarr 1999; Landes 1998; Mahathir 1970; Montesquieu 1750, cited in Easterly and Levine2003). Such characteristics also have repercussions on institutional quality: Jing and Graham(2008) show that the value attached to time in a culture is associated with the speed and costsof setting up a business.
1.3 The empirical challenge: distinguishing culture from institutions
The many suggestions about a link between culture and institutional quality notwithstand-ing, unambiguous empirical confirmation remains elusive. The reason for this is that it ishard to distinguish differences in cultural attitudes from responses to differences in insti-tutional environment (Fernandez 2010; Maseland and van Hoorn 2011). This problem hasa methodological and a theoretical dimension. On the methodological level, it is unclearwhether measures of culture reflect attitudes or circumstances. For instance, Beugelsdijk(2006) shows that trust measures reflect differences in institutional quality that enables peo-ple to trust each other rather than attitudinal traits. More in general, survey measures of
123
J Econ Growth
cultural attitudes have been argued to reflect differences in conditions, not differences inattitudes (Clarke et al. 1999; Maseland and van Hoorn 2009, 2011).
On the theoretical level, the problem is the familiar one of endogeneity; even whenmeasured unambiguously, culture is deemed to determine institutions while institutions aredeemed to determine culture. How can we distinguish between these effects? Many authorsacknowledge the problem, claiming that culture and institutions seem to move together insome kind of symbiotic relationship (Hofstede 2001; Hofstede and Hofstede 2005; North1990; Tabellini 2008). Symbiosis, however, still implies also a causal relation from cultureto institutional development; what kind of empirical support do we have for this thesis?
The problem is most effectively addressed in the literature of the epidemiologicalapproach, mostly associated with Fernandez (Algan and Cahuc 2010; Fernandez 2007, 2008,2010; Fernandez and Fogli 2009, 2006; Luttmer and Singhal 2011). In the epidemiologicalapproach culture is measured by comparing the behavior and attitudes of immigrants, linkingthem to measures of culture of their countries of origin. The argument for focusing on immi-grants is that formal institutions of the host country are homogenous between them, making itpossible to distinguish cultural characteristics from differences in institutional environment.Although an important step forward, this approach does not entirely solve the problem.Different groups of immigrants are likely to encounter different informal institutional envi-ronments (Rauch and Trindade 2002); some may enter in close-knit ethnic communities withstrong social support and strict codes of conduct, others are likely to be on their own in theirnew country. In order to address this, a new line of literature has started looking for trulyexogenous proxies for culture, borrowing from advances in personality research showing thatpersonality structures often have biological roots.
2 Pathogens and culture
Literature linking pathogen prevalence to individual personality and culture is on the rise(Fincher et al. 2008; Murray and Schaller 2010; Schaller and Murray 2008). In this literature,the usual logic is that individuals in environments with a high prevalence of infectious diseasesrespond to the threat posed by their environment by closing off their community and wardingoff potentially infected outsiders. As a result, in-group collective ties are strengthened, andfear of outsiders increases. Societies plagued by infectious diseases consequentially tend tobe more collectivistic and xenophobic, whereas low rates of infection make people more opento outsiders and extravert. On basis of a study of 98 regions throughout the world, Fincheret al. (2008) show that collectivism is related to disease prevalence. Similarly, Schaller andMurray (2008) find evidence for a relation between prevalence and openness to experience,extraversion and sociosexuality. If pathogens are able to explain variation in attitudes, a nextstep is to relate their prevalence to political and economic outcomes induced by these attitudes.Letendre et al. (2010) and Thornhill et al. (2009) thus argue that pathogen prevalence can beused to predict levels of democratization and rates intra-state armed conflict.
Although interesting, the literature about prevalence of infectious diseases in general is asyet too broad and unspecified to be of much help in cross-cultural studies of institutions. Forone thing, different diseases are likely to have different effects on personality and society.If we are to move beyond mere association, we need clearly motivated hypotheses based oncharacteristics of specific pathogens.
Secondly, the evolutionary argument in much of this literature is difficult to match withempirical studies comparing current countries, without making the problematic assumptionthat countries are primordial categories whose development is an entirely internal matter.
123
J Econ Growth
Nations are not biological units. Human history is a constant story of migration, warfare,intermarriage, assimilation, synthesis and imitation. People living in contemporary Franceare not simply the descendants of the people living in the area centuries ago, let alone thatFrench society and institutions developed in isolation from developments elsewhere in theworld. That makes historical prevalence of disease in France a problematic instrument forFrench culture.
Finally, and most seriously for our purposes, the general prevalence of life-threateningdisease has regularly been invoked as a direct determinant of institutional quality (e.g. Ace-moglu et al. 2001; Easterly and Levine 2003). For these reasons, disease prevalence in generaloffers no useful instrument if we seek to investigate the cultural origins of institutions.
2.1 The cultural effects of Toxoplasma gondii
Toxoplasma gondii is a protozoan parasite commonly found in the intestines of cats andother felines. Through cats’ faeces it may move on to other species such as mice or rats(Beverley 1976). Upon infecting the intermediate host, oocysts encyst in the brain and othertissues. They may subsequently infect other species when the intermediate host is eaten, thusmoving up the food chain. If the intermediate host—usually rodents, but also carnivores likehumans—is eaten by felines, the life-cycle is complete (Lafferty 2006).1
A peculiar feature of Toxoplasma gondii is that the parasites may alter the behavior oftheir intermediate hosts. Infected mice and rats have been shown to suffer from impairedmotor performance and coordination (Hutchison et al. 1980), learning deficits (Piekarski etal. 1978; Witting 1979), and reduced avoidance of open spaces and predators (Berdoy et al.1995, 2000; Hay et al. 1983, 1984; Skallova et al. 2006). These traits are believed to be anevolutionary mechanism to increase the chance of hosts being eaten by felines (Moore 2002).
Not only rodents get infected. Latent infection among humans is common, with an esti-mated one third of humanity being exposed to the parasite (Hill and Dubey 2002). Prevalencerates differ strongly between societies, reaching up to 80 % in some countries, while beingclose to zero in others (Derouin and Pelloux 2008; Hill and Dubey 2002; Tenter et al. 2000).These differences are mainly associated with societal norms about keeping cats as pets,cultural dietary practices (as infection may occur by eating meat), and temperate climateswith infrequent freezing and thawing (Dubey and Beattie 1988; Elsheikha 2008; Tenter etal. 2000). Regular contact with soil, which is more likely in agricultural areas, and levels ofhygiene are also relevant factors (Flegr 2007).
In spite of the very wide prevalence of infection, Toxoplasma gondii is a very uncom-mon cause of manifest disease (Havelaar et al. 2007). Immediate effects of infection, usuallycaused by consumption of infected meat or ingestion of oocysts in food or water contaminatedwith feline faeces, are rare and tend to be limited to mild-flu like symptoms in immunocom-petent individuals (Derouin and Pelloux 2008; Hill and Dubey 2002; Kravetz and Federman2005). Only specific groups may experience more serious effects. Prenatal infection may leadto ocular conditions and mental retardation later in life, whereas life-threatening conditionsmay occur among individuals with AIDS or organ transplant patients (Derouin and Pelloux2008; Hill and Dubey 2002; Elsheikha 2008; Flegr 2007; Kasperm and Buzoni-Gatel 1998;Kravetz and Federman 2005; Morris and Potter 1997). Among the general population, thephysical disease burden seems rather limited.
In addition to the generally mild physical health effects of Toxoplasma gondii, there is anincreasing amount of evidence that infected humans also experience a variety of personality
1 Occasions of humans eaten by cats are rather rare, so humans are generally a dead end for the parasite.
123
J Econ Growth
changes. For instance, infection has been associated with neuroticism and schizophrenia, butalso more commonly with slightly less serious characteristics such as reduced intelligenceand novelty-seeking and increased apprehension (Flegr 2007; Lafferty 2006; Skallova etal. 2006; Torrey and Yolken 2003; Yolken et al. 2009). Studies comparing individuals withantibodies to an uninfected control group show that latent toxoplasmosis tends to increaseguilt, vigilance and distrust, at least among men (Flegr et al. 1996; Flegr 2007; Lindova et al.2006). toxoplasma seroprevalence is also associated with a strong focus on competition andpersonal achievement, at the expense of concern for others. Infection is linked to reducedconscientiousness, morality, and rule-conscious behavior among males (which are in mostsocieties disproportionately active in public life and business) (Flegr and Hrdy 1994; Flegret al. 1996; Webster 2001). The underlying mechanism for these behavioral effects are usu-ally thought to be changes in neurotransmitter functions, and more specifically increaseddopamine levels (Skallova et al. 2006; Webster 2001). In addition, there are indications thatincreased testosterone levels play a role (Hodkova et al. 2007; Kankova et al. 2007).
Causality runs from infection to behavioral changes rather than the other way around.For rodents, this has been shown by infecting laboratory animals and observing behavioralchanges (e.g. Skallova et al. 2006). Among humans, evidence shows that personality effectsat a later age are linked to exposure to cats during childhood (Torrey and Yolken 2003). Flegret al. (1996) and Flegr et al. (2000) followed individuals diagnosed with acute toxoplasmosisfor up to 14 years and found that personality shifts increased over time (controlled for generalage effects), also suggesting that infection indeed antecedes behavioral patterns (Flegr et al.1996, 2000; Flegr 2007). The finding that some personality effects appear to be opposite formen and women also suggests that infection drives behavior rather than vice versa (Webster2001). Finally, studies have shown that medication suppressing toxoplasma infection reducesthe behavioral effects as well (Torrey and Yolken 2003; Webster et al. 2006).
Changes in behavior and personality of individuals translate into observable differencesat the societal level (Lafferty 2005, 2006). Infection rates have been shown to explain asignificant portion of inter-country variance in cultural dimensions such as aggregate neu-roticism, uncertainty avoidance, and masculinity (Lafferty 2006). These results are in linewith the changes observed at the individual level and suggest that infection with behaviormanipulating parasites such as Toxoplasma gondii is a source of cultural differences.
2.2 Toxoplasma gondii and institutions
Combining the literature on effects of toxoplasma infection with the literature about culturalorigins of institutions allows us to develop hypotheses about the relation between latent tox-oplasmosis, institutional development and economic performance. First, increased vigilanceand reduced moral consciousness make people more opportunistic and suspicious of thebehavior of others, reducing cultural trust levels in society.
Low levels of trust inhibit cooperation and provision of public goods, blocking effectiveinstitutional development (Alesina et al. 1999; Putnam et al. 1993; Tabellini 2010). Highlevels of distrust are likely to lead to calls for increased regulation to keep opportunisticothers in check (Aghion et al. 2010). At the same time, an opportunistic attitude, disrespectfor rules and a lack of concern with morality erodes the rule of law and quality of governancein societies. Higher corruption and less effective institutions will result (Aghion et al. 2010;Husted 1999; Vitell et al. 1993).
Second, latent toxoplasma infection tends to make people more insecure and worrying aswell as more dogmatic (Flegr et al. 2000; Flegr 2007). At the societal level, higher prevalencehas also been associated with increased neuroticism and anxiety (Lafferty 2006). Insecure
123
J Econ Growth
individuals are more ready to accept large power differences and may actually prefer clearlylaid-down rules. What is more, lower self-confidence makes people less willing to stand upto authorities and pessimistic about the success of social interactions (Bénabou and Tirole2002). Doubts about the commitment of others (Murray et al. 2001) reduces the potential formobilization of civil society. When society does not feel able or willing to keep government incheck, a loss of government responsiveness and accountability is the result (Tabellini 2010).This again is likely to increase abuses such as corruption (Licht et al. 2005; Hofstede 2001;Husted 1999). All in all, we expect that:
Hypothesis 1 The cultural effects of higher prevalence of Toxoplasma gondii lead to lowerinstitutional quality.
Institutional quality is a strong determinant of differences in income between societies (North1990; Acemoglu et al. 2001; Easterly and Levine 2003; Rodrik et al. 2004). Moreover, atti-tudes such as heightened distrust and uncertainty avoidance may dampen economic exchangeand entrepreneurship. For both reasons, the attitudes enhanced by latent toxoplasmosis arelikely to have an impact on economic performance. We thus expect that:
Hypothesis 2 The cultural effects of higher prevalence of Toxoplasma gondii lead to lowereconomic performance.
2.3 Why Toxoplasma gondii is an effective instrument for culture
In building our hypotheses, we have assumed that prevalence of Toxoplasma gondii offers auseful instrument for culture as an explanation for institutional quality. Yet, if we argue thatpathogen prevalence in general offers no good instrument to investigate the effects of cultureon institutions, why would prevalence of Toxoplasma gondii be any better? There are threereasons for this.
First, infection with Toxoplasma gondii has been shown to have direct, specific effectson personality and culture, allowing us to formulate clearly motivated hypotheses withouthaving to rely on indirect, evolutionary arguments.
Second, although infection with Toxoplasma gondii is very common and globally spread,it only rarely has serious direct health-effects. Direct behavioral responses to the threatposed by infection are therefore likely to be limited. The parasite’s widespread occurrence incombination with the limited consequences of infection make it unlikely that differences inprevalence rate are responsible for patterns of settlement, as in the arguments of Acemogluet al. (2001) and Easterly and Levine (2003).
The third reason why prevalence rates of Toxoplasma gondii are an effective instrument forculture is that they are not likely to be determined by differences in institutional environment.That is not to say that exposure to toxoplasma is some kind of magic variable that comesout of nowhere. Risk of toxoplasma infection has known determinants. However, prevalenceis common throughout both rich and poor countries and is mostly related to factors such asdietary habits, frequent contact with soil, climate, and the habit of keeping cats. Except forclimate and contact with soil—which we can control for—none of the known determinantsseem to be plausibly linked to culture or institutional quality. Dietary practices and thepropensity to keep cats as pets may be seen as part of a society’s tradition, but they arenot logically related to culture in the sense of generationally transmitted societal values andbeliefs, which we are interested in here. Since the possibility of alternative channels throughwhich institutions and toxoplasma prevalence are linked would undermine our identificationstrategy, however, we discuss possible threats to this identifying assumption in more detail.
123

J Econ Growth
2.4 Threats to the identifying assumption
A first class of challenges are factors that are driven by institutional quality and affect tox-oplasma seroprevalence in turn. The most obvious candidates for such a role are hygieneand sanitation, and the effectiveness of public health infrastructure in general. A low qualityof sanitation may be a symptom of poorly functioning institutions, while it also triggershigher infection rates (Tenter et al. 2000). Although we cannot rule this channel out the-oretically, we control for it by including information about quality of sanitation. Infectionrates may also reflect differences in effectiveness of health institutions, especially if reducinginfection prevalence is an objective of such institutions. However, since toxoplasma has notgenerally been considered a serious public health risk among the general population, institu-tional awareness and efforts to reduce infection rates have so far been limited to non-existing(Elsheikha 2008; Opsteegh et al. 2011). As we will show, however, adding information aboutthe expenditure rate on health care does not affect our results.
What is more, the effects of both public hygiene and health infrastructure on infectionrates would not be limited to Toxoplasma gondii infection alone (it is actually likely theywould be stronger for infections that are considered serious public health risks). As we willshow, the effects of toxoplasma seroprevalence on institutions are robust for including a widerange of other common infectious diseases as controls in our analysis. This indicates thatToxoplasma gondii is more strongly related to institutional quality than pathogen prevalencein general is.
Institutional quality is also influencing income levels (Acemoglu et al. 2001; Rodrik etal. 2004), which may somehow drive prevalence rates. Alternatively, toxoplasma may eitherdirectly or through its impact on attitudes affect income, which has an effect on institutionalquality. Again, we cannot completely rule out these possibilities on theoretical grounds, but wedo show that our results are qualitatively unaffected by controlling for GNI per capita. Anotherpossibility is that the tendency to keep cats is somehow related to institutional quality.2
Although we consider such a channel unlikely, we include information on cat ownership insome specifications to check for this possibility.
A second source of concerns is that there may be some third, omitted factor that drives bothinstitutions and toxoplasma seroprevalence simultaneously. Of the known determinants oftoxoplasma prevalence, climate and close contact with soil stand out as most likely candidatesfor such a role. For these reasons, we control for these factors in all our analyses. In addition,it may be that there are additional determinants of toxoplasma prevalence that are as yetunknown but may also drive institutional quality. The fact that infection rates differ somewhatbetween regions—being higher in Latin-America and lower in East Asia—perhaps suggestssuch effects. The inclusion of regional dummies in our analysis serves as a partial check onthis. As a further robustness check, we also exploit some within-country regional variationto show that the relation between our instrument and culture holds within countries.3
A third cause for concern may be the existence of factors that affect prevalence rates,and are determined jointly with institutions by an exogenous third factor. The most obviousexample here is dietary practices, more in particular meat-consumption. A common route ofinfection is through consumption of uncooked or undercooked meat (Hill and Dubey 2002;Opsteegh et al. 2011), while the amount of meat in people’s diet is positively related to incomelevels. It may thus be that higher prevalence rates are a reflection of higher incomes, which
2 For instance, people might seek the comfort of cats to alleviate the stress caused by bad institutions. Wethank Pauline Grosjean for this suggestion.3 We thank an anonymous referee for this suggestion.
123

J Econ Growth
also have a positive effect on institutional quality. To address this concern, we control fortotal meat consumption per capita in our analyses. However, if income levels are related to ahigher propensity to eat this meat uncooked—a ‘carpaccio-effect’, so to speak—this may bean alternative channel that we cannot rule out. We consider this possibility less likely thanour identifying assumption, however.
3 Data and analysis
In order to test whether culture affects institutional and economic development, we conductIV regressions of institutions and economic performance on cultural attitudes, with the preva-lence rate of latent toxoplasmosis as instrumental variable. More specifically, we estimatethe following relations:
Qi = μQ + BQCi + X′iγQ + εQi (1)
Ci = μC + BC Ti + X′iγT + εCi (2)
where Qi is the institutional quality in country i, Ci is a measure of culture, and Ti denotesthe toxoplasma prevalence rate. Xi is a vector of other covariates, while εi is a random errorterm. We are interested in BQ , which denotes the effect of culture on institutions. To addressthe fact that the direction of causality between culture and institutions in Eq. (1) is unclear,we first estimate Eq. (2), then use the predicted values of Ci in Eq. (1).
Our primary data (dataset 1) on toxoplasma seroprevalence are derived from the surveysof Bénard et al. (2005); Lafferty (2006), and Pappas et al. (2009), complemented with indi-vidual country studies where these surveys provided only unrepresentative, sub-regional data(El-Nawawy et al. 1996; Guebre-Xabier et al. 1993; Hussein et al. 2001; Nissapatorn et al.2003; Velasco-Castrejon et al. 1992). Together, these studies survey over 100 studies of tox-oplasma prevalence among pregnant women. When more than one study is available percountry, we take the average rate. To control for country differences in the average age ofpregnancy (in countries with older ages of pregnancy, exposure periods have been longer) andensure comparability of prevalence rates between countries, we computed adjusted preva-lence rates to a standard age of 22 years (cf. Lafferty 2006). Also, we limited our surveyto studies dating from after 1990. We have prevalence rates of 61 countries in our dataset.4
Figure 1 shows the global distribution of seroprevalence rates according to this data. Althoughdata from various combining surveys adds to the number of observations, it lowers compara-bility due to differences in methodology. In order to test robustness of our results for changesin the underlying dataset, we also run our analyses on basis of the survey of Lafferty (2006)alone (dataset 2, with 39 countries).
Our measures of culture are derived from Hofstede (2001) and the World Values Survey,waves 1–5 (World Values Survey Association 2009). Measures are based on the aggregation ofindividual responses to survey questions at the national level (cf. Tabellini 2010). On basis ofthis, Hofstede (2001) has distinguished five dimensions of culture. Drawing on the literaturesabout toxoplasma and institutional development, we select the dimensions of power distance,
4 Countries included in our primary analysis are: Argentina, Australia, Austria, Belgium, Burkina Faso,Bahrain, Brazil, China, Colombia, Croatia, Cuba, Czech Republic, Denmark, Egypt, Ethiopia, Finland, France,Germany, Greece, Grenada, Greenland, Hungary, Indonesia, India, Iran, Iraq, Ireland, Israel, Italy, IvoryCoast, Jamaica, Jordan, Japan, Kuwait, Morocco, Mexico, Malaysia, The Netherlands, New Zealand, Norway,Peru, Poland, Romania, Sao Tome and Principe, Serbia, Singapore, Slovakia, Slovenia, South Korea, Spain,Sweden, Switzerland, Sudan, Taiwan, Thailand, Trinidad and Tobago, Turkey, United Kingdom, United States,Venezuela, and Vietnam.
123
J Econ Growth
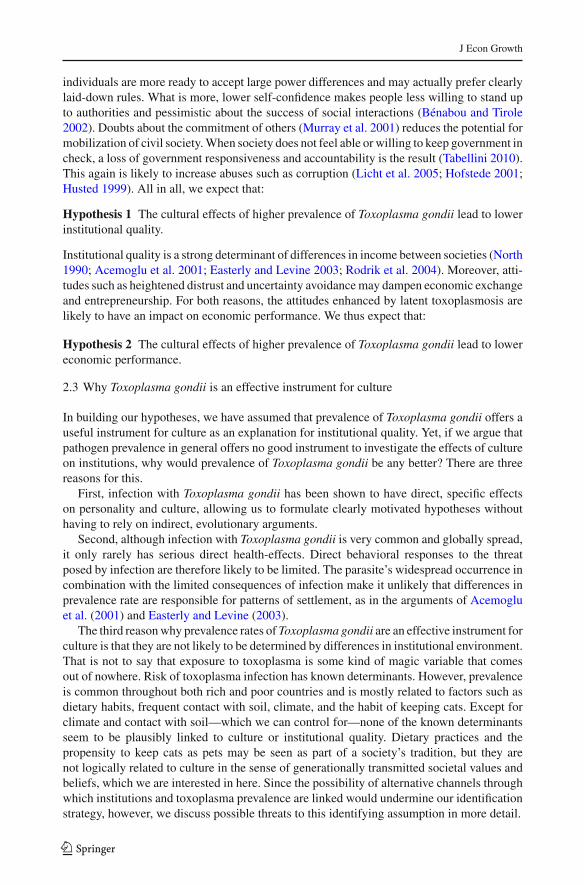
Fig. 1 Distribution of Toxoplasmosis seroprevalence, Note: This figure depicts the prevalence of toxoplasmaper country. Darker colours represent a higher incidence of toxoplasma infection. For white-coloured countrieswe have no data
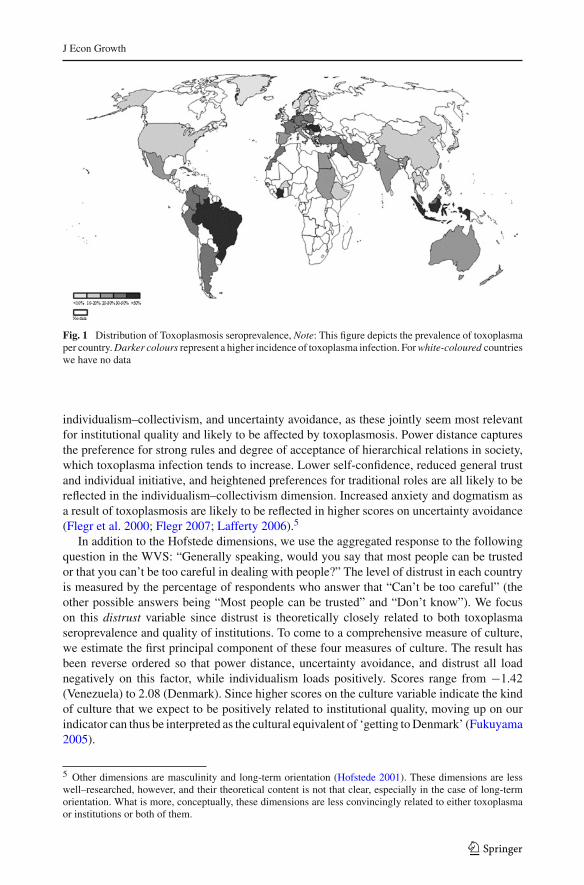
individualism–collectivism, and uncertainty avoidance, as these jointly seem most relevantfor institutional quality and likely to be affected by toxoplasmosis. Power distance capturesthe preference for strong rules and degree of acceptance of hierarchical relations in society,which toxoplasma infection tends to increase. Lower self-confidence, reduced general trustand individual initiative, and heightened preferences for traditional roles are all likely to bereflected in the individualism–collectivism dimension. Increased anxiety and dogmatism asa result of toxoplasmosis are likely to be reflected in higher scores on uncertainty avoidance(Flegr et al. 2000; Flegr 2007; Lafferty 2006).5
In addition to the Hofstede dimensions, we use the aggregated response to the followingquestion in the WVS: “Generally speaking, would you say that most people can be trustedor that you can’t be too careful in dealing with people?” The level of distrust in each countryis measured by the percentage of respondents who answer that “Can’t be too careful” (theother possible answers being “Most people can be trusted” and “Don’t know”). We focuson this distrust variable since distrust is theoretically closely related to both toxoplasmaseroprevalence and quality of institutions. To come to a comprehensive measure of culture,we estimate the first principal component of these four measures of culture. The result hasbeen reverse ordered so that power distance, uncertainty avoidance, and distrust all loadnegatively on this factor, while individualism loads positively. Scores range from −1.42(Venezuela) to 2.08 (Denmark). Since higher scores on the culture variable indicate the kindof culture that we expect to be positively related to institutional quality, moving up on ourindicator can thus be interpreted as the cultural equivalent of ‘getting to Denmark’ (Fukuyama2005).
5 Other dimensions are masculinity and long-term orientation (Hofstede 2001). These dimensions are lesswell–researched, however, and their theoretical content is not that clear, especially in the case of long-termorientation. What is more, conceptually, these dimensions are less convincingly related to either toxoplasmaor institutions or both of them.
123

J Econ Growth
Table 1 Descriptive statistics of main variables
N Minimum Maximum Mean SD Sources
Toxoplasma seropreva-lence 1 (percentage ofthe population)
61 2.53 64.7 31.0 15.3 Bénard et al. (2005), El-Nawawy et al.(1996), Guebre-Xabier et al. (1993),Hussein et al. (2001), Lafferty(2006), Nissapatorn et al. (2003),Pappas et al. (2009),Velasco-Castrejon et al. (1992)
Toxoplasma seropreva-lence 2 (percentage ofthe population)
39 4.30 66.9 32.0 16.8 Lafferty (2006)
Culture (standardized) 47 −1.42 2.08 .000 1.00 First principal component of powerdistance, individualism/ collectivism,uncertainty avoidance (Hofstede2001) and distrust (World ValuesSurvey. www.worldvaluessurvey.org).
Ln GNI per capita 59 5.20 10.7 8.73 1.45 World Bank Development Indicators.data.worldbank.org/indicator
Proportion populationin temperate zone
59 .00 1.00 .52 .452 Gallup and Sachs (2000). http://www.pdx.edu/econ/john-luke-gallup
Institutional quality(standardized)
61 −2.38 1.51 .000 1.00 First principal component of voice andaccountability, political stability,government effectiveness, regulatoryquality, rule of law and control ofcorruption. (www.govindicators.org)
Percentage of popula-tion with access toimproved sanitation
58 8.00 100 82.9 25.8 millenniumindicators.un.org
Urban population share 59 10.8 100 63.2 21.6 World Bank Development Indicators.data.worldbank.org/indicator
Meat consumption percapita (tonnes per year)
56 .004 .126 .060 .034 FAOSTAT food balance sheets http://faostat.fao.org
Health expenditure percapita (current US $)
57 26.3 5.68E3 1.33E3 1.28E3 World Bank Development Indicators.data.worldbank.org/indicator
Cat/human ratio 48 7.22E−4 .297 .101 .079 World Society for Protection ofAnimals. http://www.wspa-international.org
Leprosy (cases per1,000 capita)
58 .000 .200 .012 .034 WHO Global Health Observatory DataRepository, http://apps.who.int/ghodata/
Tetanus (neonatal)(cases per millioncapita)
58 .000 7.61 .221 1.01 WHO Global Health Observatory DataRepository, http://apps.who.int/ghodata/
Pertussis (cases per1,000 capita)
57 .000 1.79 .068 .249 WHO Global Health Observatory DataRepository, http://apps.who.int/ghodata/
Tuberculosis (casesper 1,000 capita)
56 .000 2.36 .380 .492 WHO Global Health Observatory DataRepository, http://apps.who.int/ghodata/
Rubella (cases per1,000 capita)
56 .000 .109 .005 .016 WHO Global Health Observatory DataRepository, http://apps.who.int/ghodata/
Polio (cases permillion capita)
59 .000 2.17 .037 .283 WHO Global Health Observatory DataRepository, http://apps.who.int/ghodata/
Ease of doing businessrank
58 1 178 65.7 51.1 www.doingbusiness.org
123

J Econ Growth
VNM
KOR
CHN
USAGBR
NOR
THA
SWE
IND
ISR
MEX
JPN
DNK
AUS
FIN
ESP
IRL
SVK
ITA
GRC
PER
CHENZL
CZE
NLD
SVN
AUT
VEN
IRN
POLMYS
MARBEL
TTO
ARGCOLHRV
DEUIDN
FRA
YUG
TURBRA
ROM
HUN
-2-1
01
2
Cu
lture
(fa
cto
r)
-40 -20 0 20 40
Toxoplasma Seroprevalencecoef = -.03318146, (robust) se = .00809054, t = -4.1
VNM
KORCHN
USAGBR
NOR
THA
SWE
IND
ISR
MEXJPN
DNKAUS
FIN
ESP
IRL
SVK
ITAGRC
PER
CHE
NZL
CZE
NLD
SVN
AUT
VEN
IRN
POL
MYS
MAR
BEL
TTO
ARG
COL
HRV
DEU
IDNFRA
YUG
TUR
BRA
ROMHUN
-2-1
01
2
Inst
itutio
na
l Qu
alit
y
-40 -20 0 20 40
Toxoplasma Seroprevalencecoef = -.01636205, (robust) se = .0057473, t = -2.85
VNM
KOR
CHN
USA
GBR
NOR
THA
SWE
IND
ISR
MEX
JPN
DNK
AUS
FIN
ESP
IRL
SVK
ITA
GRCPER
CHE
NZL
CZE
NLD
SVN
AUT
VENIRNPOL
MYSMAR
BEL
TTO
ARG
COL
HRV
DEUIDNFRA
YUG
TUR
BRAROM
HUN
-2-1
01
2
Ln
GN
I p
er
cap
ita
-40 -20 0 20 40
Toxoplasma Seroprevalencecoef = -.01474193, (robust) se = .00662872, t = -2.22
Fig. 2 Reduced form relationships between toxoplasma, culture, institutions and income. These figures depictthe negative relations between toxoplasma prevalence and our indicators of culture, instituitonal quality and percapita income (ln). Figures depict residuals. Culture (factor) and institutional quality are in standard deviationsfrom the sample mean
As our main dependent variables, we use the indicators of institutional quality developedby Kaufmann et al. (2009).6 This dataset provides information on six institutional dimensions,covering the quality of political institutions (voice and accountability and political stability),governance (government effectiveness and regulatory quality), and rule of law (corruptionand rule of law). Our main measure is the first principal component of these indicators. Totest for robustness, we replace this variable by the ease of doing business rank (World Bank2010), the social infrastructure index of Hall and Jones (1999), and Polity IV indicators ofdemocracy and constraints on the executive in some specifications (Marshall and Jaggers2005). To see whether the effect of toxoplasma-induced cultural attitudes on institutions haseconomic relevance, we use GNI per capita as measure of economic performance. Data aretaken from the World Bank’s (2011) World Development Indicators dataset.
Our main selection of control variables is informed by the above mentioned determinants oftoxoplasma seroprevalence rates. To control for the potential influence of climate, we includethe proportion of people living in temperate zones, taken from Gallup and Sachs (2000). Also,we suspect that rural areas may simultaneously suffer from lower quality institutions, andfrom higher rates of toxoplasma seroprevalence due to regular contact with the soil. To controlfor this, we add the urbanization rate per country (World Bank 2011) to our models. Data
6 Data are publicly available at www.govindicators.org. We take the average of year scores for the period1996–2009.
123

J Econ Growth
on quality of sanitation comes from the United Nations (2010), which reports the proportionof population with access to improved sanitation. We also include the yearly consumptionof meat per person (FAOSTAT 2011) and the number of cats held as pets per capita (WSPA2008) as control variables. Finally, we use prevalence rates of six other common, non-tropicalinfectious diseases (neonatal tetanus, rubella, pertussis, polio, tuberculosis, and leprosy) ascontrols, taken from the Global Health Observatory Data Repository (WHO 2011). Table 1provides summary statistics for the main variables and controls.
4 Results
4.1 The effect of culture on institutions
We are interested in the effects of culture on institutions and long-term growth. Figure 2 illus-trates the reduced form relationships, showing the effect of infection rates on our measuresof culture, institutional quality, and economic performance (controlled for sanitation, meatconsumption, urbanization, and climate). For all these measures, we observe a clear rela-tionship. This tells us that countries suffering from high toxoplasma rates enjoy substantiallydifferent cultures, and experience worse institutions and growth.
Tables 2 and 3 show us how these relations between toxoplasma seroprevalence rates,culture, and institutions work. Table 2 presents evidence in support of the hypothesis thattoxoplasma seroprevalence rates are associated with our cultural measure. Columns 1–4 showthe relationship between seroprevalence and culture, with and without our standard set ofcontrols and for different datasets of toxoplasma seroprevalence (OLS). These specificationswill be the first stage for our main instrumental variables estimates. They tell us that thereis a significant relation between seroprevalence and culture, regardless of the dataset we useor the addition of our standard control variables. The results confirm the basic finding byLafferty (2006) that the prevalence of toxoplasma infection affects aggregate culture.
In order to see whether the relation between toxoplasma and culture upholds when isolatingthe effects of toxoplasma from institutional effects, we have repeated our initial analysisfor regions within a single country (India). Since institutions are generally believed to berelatively homogenous within a single country (Tabellini 2010), regional analysis allows usto see whether the observed differences in culture are caused by toxoplasma or by differencesin institutions. Toxoplasma seroprevalence data in this analysis are based on Dhumne et al.(2007). Since the Hofstede cultural indicators are available only at the country level, we takethe first principal component of traditionality, autonomy, and distrust (WVS) reverse orderedto mimic our main cultural variable for this analysis. We again control for climate (usingdummies for dominant Köppen-Geigen climate zone), urbanization, and sanitation. Data formeat consumption is not available at the regional level and is excluded. Results are reportedin Column 7. Although this regional analysis is rather limited due to data availability, weagain observe a strongly significant effect of toxoplasma seroprevalence on culture. Thisadds weight to the interpretation that it is toxoplasma and not institutions or some othercountry-invariant factor that is driving the cultural differences we observe.
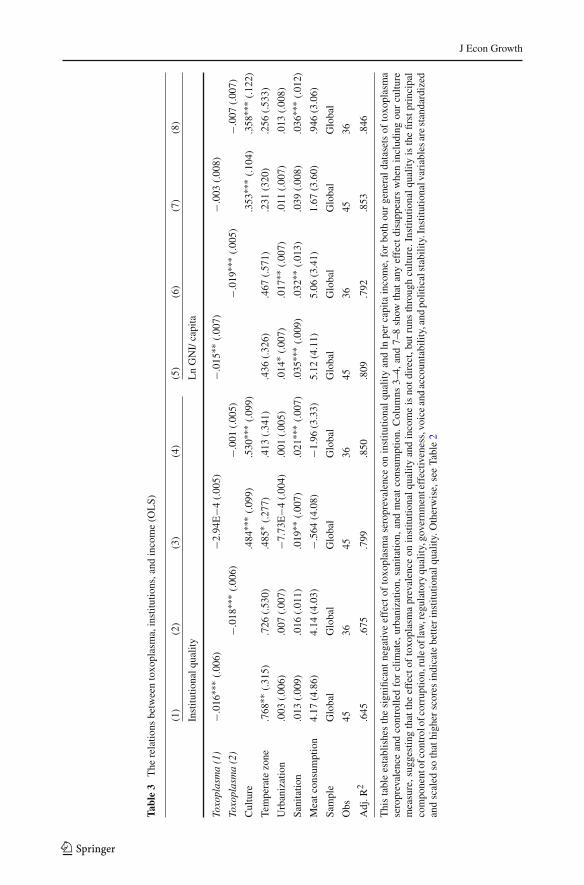
Moving to Table 3, columns 1–2 present the effect of toxoplasma seroprevalence oninstitutional quality, for both our general datasets. In accordance with Fig. 2, we find thatseroprevalence is negatively associated with institutional quality. A 10 % point increase intoxoplasma infection rates translates in a drop on the institutional quality index of aboutbetween .16 and .18 points, which is between one and a half and two times the differencebetween the USA and France. Columns 3–4 indicate that the effect of toxoplasma on insti-
123

J Econ Growth
Tabl
e2
The
rela
tion
betw
een
toxo
plas
ma
and
cultu
re(O
LS)
(1)
(2)
(3)
(4)
(5)
Cul
ture
Cul
ture
(WV
S)
Toxo
plas
ma
(1)
−.03
4∗∗∗
(.00
9)−.
033∗
∗∗(.
008)
Toxo
plas
ma
(2)
−.03
3∗∗∗
(.00
8)−.
033∗
∗∗(.
008)
Toxo
plas
ma
(Ind
ia)
−.05
6∗∗∗
(.01
6)
Tem
pera
tezo
ne.5
84(.
338)
.589
(.52
2)
Urb
aniz
atio
n−.
009
(.00
7).0
12(.
009)
4.15
E−4
(3.6
2E−3
)
Sani
tatio
n−.
011
(.00
8)−.
010
(.01
4)−.
003
(.00
7)
Mea
tcon
sum
ptio
n−9
.78∗
(5.2
8)11
.5∗∗
(4.9
7)
Tro
pica
lwet
−2.6
4∗∗∗
(.62
2)
Tro
pica
lwet
and
dry
−.57
2∗(.
283)
Hum
idse
mi-
trop
ical
−.32
1(.
180)
Sem
i-ar
id−.
668∗
∗∗(.
193)
Sam
ple
Glo
bal
Glo
bal
Glo
bal
Glo
bal
Indi
a
Obs
4545
3636
18
Adj
R2
.243
.472
.289
.527
.715
Thi
sta
ble
esta
blis
hes
the
sign
ifica
ntne
gativ
eef
fect
ofto
xopl
asm
ase
ropr
eval
ence
onou
rin
dica
tor
ofcu
lture
,for
both
our
gene
ral
data
sets
ofto
xopl
asm
ase
ropr
eval
ence
and
cont
rolle
dfo
rcl
imat
e,ur
bani
zatio
n,sa
nita
tion,
and
mea
tco
nsum
ptio
n.C
olum
n7
confi
rms
the
effe
ctof
toxo
plas
ma
sero
prev
alen
ceon
cultu
reat
the
sub-
coun
try
leve
lw
ithin
Indi
a.E
stim
atio
nm
etho
dis
OL
S.R
obus
tsta
ndar
der
rors
are
inpa
rent
hese
s.∗∗
∗ ind
icat
essi
gnifi
cant
at1%
;∗∗ s
igni
fican
tat5
%;∗
sign
ifica
ntat
10%
.Tox
opla
sma
(1)
isth
efu
ll,co
mbi
ned
data
set.
Toxo
plas
ma
(2)i
sth
eL
affe
rty
(200
6)da
tase
t.To
xopl
asm
a(I
ndia
)is
the
Dhu
mne
etal
.(20
07)s
et.A
llre
fert
ope
rcen
tage
sof
the
popu
latio
n.C
ultu
reis
the
first
prin
cipa
lcom
pone
nt(s
tand
ardi
zed)
ofdi
stru
st,u
ncer
tain
tyav
oida
nce,
indi
vidu
alis
m,a
ndpo
wer
dist
ance
,sca
led
soth
atdi
stru
st,u
ncer
tain
tyav
oida
nce
and
pow
erdi
stan
celo
adne
gativ
ely
and
indi
vidu
alis
mlo
ads
posi
tivel
y.C
ultu
re(W
VS)
isth
efir
stpr
inci
pal
com
pone
ntof
dist
rust
,aut
onom
y,an
dtr
aditi
onal
ity(s
tand
ardi
zed
and
scal
edso
that
dist
rust
and
trad
ition
ality
load
nega
tivel
yan
dau
tono
my
posi
tivel
y).U
rban
izat
ion
data
for
Indi
afr
omth
eC
ensu
sof
Indi
a(G
over
nmen
tof
Indi
a20
11).
Clim
ate
zone
sfo
rIn
dia
are
base
don
Kot
tek
etal
.(20
06);
arid
isth
eba
seca
tego
ry.S
eeTa
ble
1fo
rm
ore
deta
iled
vari
able
defin
ition
san
dso
urce
s
123
J Econ Growth
Tabl
e3
The
rela
tions
betw
een
toxo
plas
ma,
inst
itutio
ns,a
ndin
com
e(O
LS)
(1)
(2)
(3)
(4)
(5)
(6)
(7)
(8)
Inst
itutio
nalq
ualit
yL
nG
NI/
capi
ta
Toxo
plas
ma
(1)
−.01
6∗∗∗
(.00
6)−2
.94E
−4(.
005)
−.01
5∗∗ (
.007
)−.
003
(.00
8)
Toxo
plas
ma
(2)
−.01
8∗∗∗
(.00
6)−.
001
(.00
5)−.
019∗
∗∗(.
005)
−.00
7(.
007)
Cul
ture
.484
∗∗∗ (
.099
).5
30∗∗
∗ (.0
99)
.353
∗∗∗ (
.104
).3
58∗∗
∗ (.1
22)
Tem
pera
tezo
ne.7
68∗∗
(.31
5).7
26(.
530)
.485
∗ (.2
77)
.413
(.34
1).4
36(.
326)
.467
(.57
1).2
31(3
20)
.256
(.53
3)
Urb
aniz
atio
n.0
03(.
006)
.007
(.00
7)−7
.73E
−4(.
004)
.001
(.00
5).0
14∗ (
.007
).0
17∗∗
(.00
7).0
11(.
007)
.013
(.00
8)
Sani
tatio
n.0
13(.
009)
.016
(.01
1).0
19∗∗
(.00
7).0
21∗∗
∗ (.0
07)
.035
∗∗∗ (
.009
).0
32∗∗
(.01
3).0
39(.
008)
.036
∗∗∗ (
.012
)
Mea
tcon
sum
ptio
n4.
17(4
.86)
4.14
(4.0
3)−.
564
(4.0
8)−1
.96
(3.3
3)5.
12(4
.11)
5.06
(3.4
1)1.
67(3
.60)
.946
(3.0
6)
Sam
ple
Glo
bal
Glo
bal
Glo
bal
Glo
bal
Glo
bal
Glo
bal
Glo
bal
Glo
bal
Obs
4536
4536
4536
4536
Adj
.R2
.645
.675
.799
.850
.809
.792
.853
.846
Thi
sta
ble
esta
blis
hes
the
sign
ifica
ntne
gativ
eef
fect
ofto
xopl
asm
ase
ropr
eval
ence
onin
stitu
tiona
lqua
lity
and
lnpe
rca
pita
inco
me,
for
both
our
gene
rald
atas
ets
ofto
xopl
asm
ase
ropr
eval
ence
and
cont
rolle
dfo
rcl
imat
e,ur
bani
zatio
n,sa
nita
tion,
and
mea
tco
nsum
ptio
n.C
olum
ns3–
4,an
d7–
8sh
owth
atan
yef
fect
disa
ppea
rsw
hen
incl
udin
gou
rcu
lture
mea
sure
,sug
gest
ing
that
the
effe
ctof
toxo
plas
ma
prev
alen
ceon
inst
itutio
nalq
ualit
yan
din
com
eis
notd
irec
t,bu
trun
sth
roug
hcu
lture
.Ins
titut
iona
lqua
lity
isth
efir
stpr
inci
pal
com
pone
ntof
cont
rolo
fcor
rupt
ion,
rule
ofla
w,r
egul
ator
yqu
ality
,gov
ernm
ente
ffec
tiven
ess,
voic
ean
dac
coun
tabi
lity,
and
polit
ical
stab
ility
.Ins
titut
iona
lvar
iabl
esar
est
anda
rdiz
edan
dsc
aled
soth
athi
gher
scor
esin
dica
tebe
tter
inst
itutio
nalq
ualit
y.O
ther
wis
e,se
eTa
ble
2
123

J Econ Growth
Tabl
e4
Inst
rum
enta
lvar
iabl
ere
gres
sion
sof
inst
itutio
nalq
ualit
y
Inst
itutio
nalq
ualit
y(1
)(2
)(3
)(4
)(5
)(6
)
Cul
ture
.736
∗∗∗ (
.168
).4
93∗∗
∗ (.1
19)
.822
∗∗∗ (
.126
).5
63∗∗
∗ (.1
17)
.413
∗∗(.
163)
.564
∗∗∗ (
.174
)
Tem
pera
tezo
ne.4
80∗∗
(.23
6).3
94(.
301)
.635
∗∗(2
68)
.421
(.43
6)
Urb
aniz
atio
n−8
.49E
−4(.
004)
8.73
E−4
(.00
5)6.
55E−4
(.00
6)7.
88E−4
(.00
6)
Sani
tatio
n.0
19∗∗
∗ (.0
06)
.022
∗∗∗ (
.006
).0
12∗∗
(.00
5).0
18(.
006)
Mea
tcon
sum
ptio
n−.
651
(3.4
9)−2
.33
(3.0
2)1.
20(5
.42)
−1.5
3(4
.92)
Inst
rum
ent
Toxo
plas
ma
1To
xopl
asm
a1
Toxo
plas
ma
2To
xopl
asm
a2
Toxo
plas
ma
1To
xopl
asm
a2
Sam
ple
Stan
dard
Stan
dard
Stan
dard
Stan
dard
Impu
ted
Impu
ted
Obs
.45
4536
3655
39
Thi
sta
ble
esta
blis
hes
the
sign
ifica
ntef
fect
ofcu
lture
,in
stru
men
ted
byto
xopl
asm
ase
ropr
eval
ence
,on
inst
itutio
nal
qual
ity.
Col
umns
1–2
repo
rtth
isfo
rth
em
ain
toxo
plas
ma
indi
cato
r,C
olum
ns3–
4fo
rth
eal
tern
ativ
e,m
ore
rest
rict
edin
dica
tor.
Col
umns
1–4
are
base
don
obse
rvat
ions
for
whi
chda
taon
cultu
rear
eav
aila
ble.
Col
umns
5an
d6
pres
ent
OL
Sre
sults
ofin
stitu
tiona
lqua
lity
oncu
lture
aspr
edic
ted
byto
xopl
asm
apr
eval
ence
,inc
ludi
ngim
pute
dob
serv
atio
nsfo
rth
ose
coun
trie
sw
here
toxo
plas
ma
data
isav
aila
ble
but
the
cultu
reva
riab
leis
not.
All
cova
riat
esth
atar
ein
clud
edin
the
seco
ndst
age,
such
aste
mpe
rate
zone
,urb
aniz
atio
n,m
eatc
onsu
mpt
ion
and
sani
tati
on,a
real
soin
clud
edin
the
first
stag
e.Si
nce
the
first
stag
ere
sults
have
been
repo
rted
inpr
evio
usta
bles
and
are
ofno
maj
orsi
gnifi
canc
efo
rou
rar
gum
ent,
we
dono
trep
ortt
hem
here
tosa
vesp
ace.
Oth
erw
ise,
see
Tabl
e2.
123

J Econ Growth
tutions disappears when adding culture to the model, which cautiously suggests that theobserved effect runs through culture.
Columns 5–8 show the results of the same exercise for GNI/capita. Although we cannot besure from these reduced form results whether it is the cultural and institutional effects of toxo-plasmosis that affect economic performance, we observe a clear negative association betweentoxoplasma seroprevalence and per capita income levels, indicating the economic relevanceof toxoplasmosis. This effect is quite sizable: all else being equal, if the United States’ tox-oplasma prevalence rate (11.65 %) would rise to that or Argentina (46.21 %), its per capitaincome would fall to about 0.6 of the current level. That implies that toxoplasma-induced insti-tutional differences account for approximately 60 % of the actual income difference betweenArgentina and the USA. Toxoplasma thus appears to be significantly related to cross-countrydifferences in per capita income. Interestingly enough, the effect disappears when addingculture to the model (columns 7–8), suggesting again that the relation runs through culture.Across all models, control variables such as access to sanitation and urbanization behave asexpected.
4.2 Instrumental variables estimates
Instrumental variable estimates of Eq. (1) are presented in Table 4. Columns 1–4 give the IVestimates of the effects of culture on institutional quality for various specifications. Estimatesof the impact of culture on institutional quality are in the range of .493–.822. The resultingeffect sizes are almost identical to the reduced form results. Lack of availability of the cul-ture variable brings down the number of observations in the IV analysis to 45, whereas wehave Toxoplasma seroprevalence data for 61 countries. To see whether this drop in observa-tions matters, we also run regressions of institutional quality on culture scores predicted bytoxoplasma seroprevalence, imputing observations where actual culture scores are lacking.Columns 5, 6 present results of this endeavor. Results are qualitatively the same in this widersample.
To get an idea of the order of magnitude of these effects, we compare two countries scoringhigh and low on our cultural measure: Brazil and the USA. We pick these countries becausetheir predicted cultural values are close to their actual values scores, i.e. they are practicallyon the first stage regression lines. The results in model 2 imply that if Brazil were to havethe USA’s culture, its score on institutional quality would be about 1.16 points higher than itis (on a scale ranging from −2.38 to 1.51), all else equal. This suggests that the effects sizesof culture on institutional quality are substantial.
How relevant is this for economic performance? A way to assess the income effect of thedifferences in institutional quality triggered by toxoplasmosis is by interpreting our previousresults on institutional quality in terms of the results of other studies relating institutions toincome. The results shown in Table 4 indicate that a move from the least affected to the mostaffected country in our sample is associated with an improvement in institutions to the sizeof 1.01 points on our institutional quality measure, all else being equal. Combining this withthe results of Easterly and Levine (2003) or Rodrik et al. (2004), who consistently reportimpacts of the Kaufmann-institutional indicators on log per capita income of about 2.00, thissuggests that this translates into an approximately 200 log point difference in income. Sincethe measures for institutional quality are not exactly similar between studies and effect sizesdiffer between specifications, these figures only give an extremely rough approximation ofthe impact size of toxoplasma. They do indicate that the effect of toxoplasma seroprevalence-induced culture and institutions on economic performance is substantial, however. Culture,apparently, matters.
123
J Econ Growth
4.3 Threats to the identification strategy
As we noted, the validity of our identification strategy depends on the assumption that tox-oplasma seroprevalence rates are not related to institutional quality in any other way thanthrough the channel of culture. To reduce this possibility, we have already controlled for cli-mate, meat consumption, urbanization and sanitation in our standard models. Those factorsare theoretically most plausibly linked both to seroprevalence and institutional quality. Toscrutinize our identification strategy further, we explore alternative channels through whichtoxoplasmosis may be related to institutions, and control for these possibilities.
Table 5 presents the results of this endeavor. Column 1 provides the results of our standardIV model with regional dummies added. Toxoplasma seroprevalence appears to be subject toregional variation, prevalence rates being on average lower in Asia and higher in the Americas.It may therefore be that our results are driven by some additional factor that is correlatedwith regional differences. When checking for this possibility, we find that our results remainqualitatively the same. Toxoplasma-induced culture continues to have a significant effect oninstitutional quality.
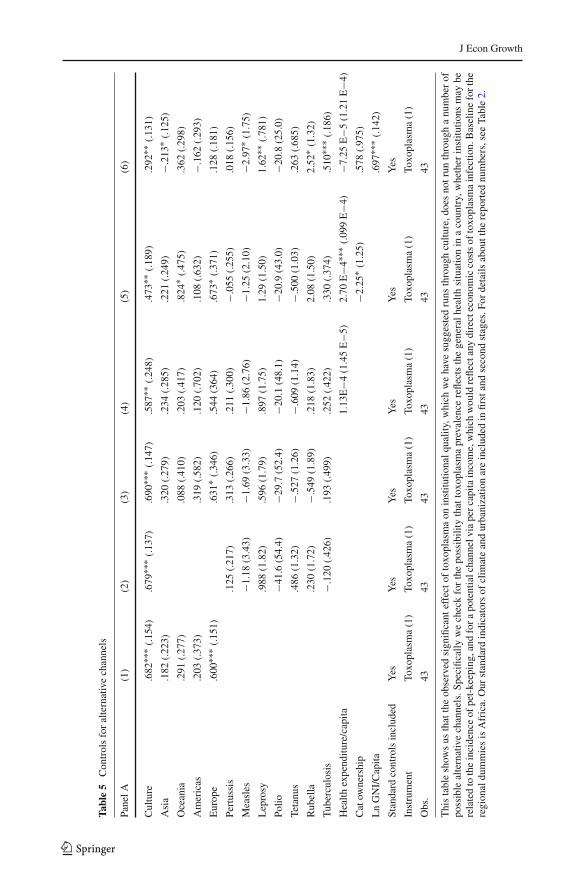
A leading threat to our identification strategy is that better institutional quality improveshealth infrastructure and reduces infection rates of diseases in general, and that this drivesour results. In order to control for that, we include a set of common infectious diseases ascontrols. Columns 2, 3 show the effect of toxoplasma-induced culture on institutional quality(with and without regional dummies), controlled for other infectious diseases. The effect ofculture remains significant in both models with and without regional dummies. In Column4 we add health expenditure per capita to the model as well, with similar results. Althoughwe see no obvious logical link with institutional quality, we add cat ownership as a controlin Column 5 as well. Results remain unchanged.
We have suggested that toxoplasma seroprevalence has no serious direct health effects,and therefore does not influence institutions and economic performance in the way that otherdiseases do as shown by Acemoglu et al. (2001). According to our argument, the effectof toxoplasma runs through its impact on cultural attitudes, either influencing economicperformance directly or through institutions. Since we have only one instrumental variable inour analysis, however, we cannot run overidentification tests to assess the exclusion restrictiondirectly. What we can do is control for income per capita in our regressions of institutionalquality, as this is likely to capture any direct, health-related costs of the disease. Column6 adds GNI per capita levels as controls to our IV regressions. Note that since institutionalquality has been shown to have an effect on GNI per capita (e.g. Acemoglu et al. 2001), this isan overtly strong control. Any effect on institutional quality of toxoplasmosis is likely to alsogenerate an effect on GNI per capita, so that controlling for income takes away a large part ofthe impact on institutions. This notwithstanding, we observe that the effects of toxoplasmosisseroprevalence on institutional quality remain unaltered when adding GNI per capita.
Although these controls capture the most plausible alternative routes by which toxoplasmaseroprevalence and institutions may be linked, it is still theoretically possible that there areother omitted variables that explain our results. To investigate the likeliness of this scenario,we have estimated the potential bias in our results caused by omitting unobserved covariates,following the approach of Altonji et al. (2005). Using the assumption that omitted covariateshave the same effect as the covariates included in our main model, we derive biases of .010,.007, and .004 for our estimated effects of toxoplasma on culture, institutional quality andGNI per capita respectively. This implies that the effects of unobserved covariates must be atleast 3.29 times as strong as that of the observables to take away our results about culture; 2.28times as strong to take away our results about institutional quality; and 3.37 times as strong to
123
J Econ Growth
Tabl
e5
Con
trol
sfo
ral
tern
ativ
ech
anne
ls
Pane
lA(1
)(2
)(3
)(4
)(5
)(6
)
Cul
ture
.682
∗∗∗ (
.154
).6
79∗∗
∗ (.1
37)
.690
∗∗∗ (
.147
).5
87∗∗
(.24
8).4
73∗∗
(.18
9).2
92∗∗
(.13
1)
Asi
a.1
82(.
223)
.320
(.27
9).2
34(.
285)
.221
(.24
9)−.
213∗
(.12
5)
Oce
ania
.291
(.27
7).0
88(.
410)
.203
(.41
7).8
24∗ (
.475
).3
62(.
298)
Am
eric
as.2
03(.
373)
.319
(.58
2).1
20(.
702)
.108
(.63
2)−.
162
(.29
3)
Eur
ope
.600
∗∗∗ (
.151
).6
31∗ (
.346
).5
44(3
64)
.673
∗ (.3
71)
.128
(.18
1)
Pert
ussi
s.1
25(.
217)
.313
(.26
6).2
11(.
300)
−.05
5(.
255)
.018
(.15
6)
Mea
sles
−1.1
8(3
.43)
−1.6
9(3
.33)
−1.8
6(2
.76)
−1.2
5(2
.10)
−2.9
7∗(1
.75)
Lep
rosy
.988
(1.8
2).5
96(1
.79)
.897
(1.7
5)1.
29(1
.50)
1.62
∗∗(.
781)
Polio
−41.
6(5
4.4)
−29.
7(5
2.4)
−20.
1(4
8.1)
−20.
9(4
3.0)
−20.
8(2
5.0)
Teta
nus
.486
(1.3
2)−.
527
(1.2
6)−.
609
(1.1
4)−.
500
(1.0
3).2
63(.
685)
Rub
ella
.230
(1.7
2)−.
549
(1.8
9).2
18(1
.83)
2.08
(1.5
0)2.
52∗ (
1.32
)
Tub
ercu
losi
s−.
120
(.42
6).1
93(.
499)
.252
(.42
2).3
30(.
374)
.510
∗∗∗ (
.186
)
Hea
lthex
pend
iture
/cap
ita1.
13E−4
(1.4
5E−5
)2.
70E−4
∗∗∗ (
.099
E−4
)−7
.25
E−5
(1.2
1E−4
)
Cat
owne
rshi
p−2
.25∗
(1.2
5).5
78(.
975)
Ln
GN
I/C
apita
.697
∗∗∗ (
.142
)
Stan
dard
cont
rols
incl
uded
Yes
Yes
Yes
Yes
Yes
Yes
Inst
rum
ent
Toxo
plas
ma
(1)
Toxo
plas
ma
(1)
Toxo
plas
ma
(1)
Toxo
plas
ma
(1)
Toxo
plas
ma
(1)
Toxo
plas
ma
(1)
Obs
.43
4343
4343
43
Thi
sta
ble
show
sus
that
the
obse
rved
sign
ifica
ntef
fect
ofto
xopl
asm
aon
inst
itutio
nalq
ualit
y,w
hich
we
have
sugg
este
dru
nsth
roug
hcu
lture
,doe
sno
trun
thro
ugh
anu
mbe
rof
poss
ible
alte
rnat
ive
chan
nels
.Spe
cific
ally
we
chec
kfo
rth
epo
ssib
ility
that
toxo
plas
ma
prev
alen
cere
flect
sth
ege
nera
lhea
lthsi
tuat
ion
ina
coun
try,
whe
ther
inst
itutio
nsm
aybe
rela
ted
toth
ein
cide
nce
ofpe
t-ke
epin
g,an
dfo
rapo
tent
ialc
hann
elvi
ape
rcap
itain
com
e,w
hich
wou
ldre
flect
any
dire
ctec
onom
icco
sts
ofto
xopl
asm
ain
fect
ion.
Bas
elin
efo
rthe
regi
onal
dum
mie
sis
Afr
ica.
Our
stan
dard
indi
cato
rsof
clim
ate
and
urba
niza
tion
are
incl
uded
infir
stan
dse
cond
stag
es.F
orde
tails
abou
tthe
repo
rted
num
bers
,see
Tabl
e2.
123

J Econ Growth
take away our estimated effect on GNI per capita. For a model including all potential controlvariables (i.e. those included in Table 5, model 6) we find that the effect of unobservablesmust still be 2.04 times (for the effect on culture), 2.50 times (for the effect on institutionalquality) and 1.74 (for the effect on ln GNI/capita)7 times as large as the effect of observablesto explain away the results. Since the included covariates are the most plausible ones andmay therefore be reasonably expected to have a larger effect than any unobservables, thisgives us additional confidence in our results.
All in all, our results appear pretty robust to various controls for alternative channels. Thisgives us reasonable confidence in the validity of our identification strategy. We conclude thatculture indeed seems to affect institutions.
4.4 Further robustness checks
So far, our results suggest that toxoplasma seroprevalence affects institutional quality, andhence economic performance, through its effect on culture. One may worry, however, thatour results depend on the choice of institutional indicator. To check this, we have rerun ourregressions replacing our institutional quality measure (the first principal component of thesix Kaufmann et al. (2009) indicators of institutions), by the ease of doing business rank, thesocial infrastructure index of Hall and Jones (1999) and the Polity IV indicators of democracyand constraints on the executive (Marshall and Jaggers 2005). Results are similar for variousindicators of institutional quality. Culture (instrumented by seroprevalence) has a significanteffect on all measures of institutional quality, although for the polity IV variables significancefalls to the 5 % level (results not reported). We conclude that our results do not qualitativelydepend on the choice of indicator.
Results are also robust for limiting the sample to OECD-countries only (results notreported) and for inclusion of additional covariates that have been linked to institutionalquality in the literature. Table 6 presents the results of the latter, replicating our main IVregression of institutional quality with additional controls. Column 1 represents our bench-mark regression including urbanization and temperate zone indicators as controls. Column2 shows results with latitude and the percentage of arable land added, with the time passedsince the Neolithic revolution included in Column 3 (data from Ashraf and Galor 2013).Negative effects on institutional quality continue to be significant. Column 4 presents resultsfor a model including shares of major religions (LaPorta et al. 1999) and the share of thepopulation of European descent (Hall and Jones 1999). Culture continues to be significant.Column 5 shows that the same applies to models including colonial links. Adding legal originindicators (LaPorta et al. 2008) does not alter the picture either (Column 6).
The effects of culture are also robust to including a measure of ethno-linguistic frac-tionalization (Alesina et al. 2003) in Column 7. OPEC membership has a highly significantnegative effect on institutional quality (Column 8), but the effect of our cultural variablesis not qualitatively affected by this variable. Finally, we have controlled for the effect ofspatial linkages between countries (cf. Bosker and Garretsen 2009) by including the meaninstitutional quality of all neighbouring countries in the model (column 9). This does notaffect our results either. Toxoplasma-induced culture continues to be significantly related toinstitutional quality.
Moving to the right in Table 6, we are approaching the limits to the numberof control variables it makes sense to include given the number of observations. Toaddress this, we have alternatively added the controls in combinations of three to
7 Ln GNI/capita not included as covariate.
123

J Econ Growth
Tabl
e6
Rob
ustn
ess
chec
ksfo
rIV
regr
essi
ons
onin
stitu
tiona
lqua
lity
(1)
(2)
(3)
(4)
(5)
(6)
(7)
(8)
(9)
Inst
itutio
nalq
ualit
y
Cul
ture
.731
∗∗∗
(.18
8).7
86∗∗
∗(.
197)
.783
∗∗∗
(.20
8).9
75∗∗
∗(.
315)
1.01
∗∗∗
(.33
4)1.
02∗∗
∗(.
347)
1.08
∗∗∗
(.40
8).7
93∗∗
∗(.
239)
.842
∗∗(.
355)
Log
perc
enta
geof
arab
lela
nd.0
08(.
120)
.014
(.13
9).1
13(.
141)
.074
(.14
3).0
84(.
149)
.074
(.15
3).0
48(.
112)
.061
(.12
4)
Log
abso
lute
latit
ude
−.50
6∗∗
(.24
2)−.
505∗
∗(.
243)
−.55
4∗∗
(.22
6)−.
604∗
∗∗(.
209)
−.62
5∗∗∗
(.23
1)−.
639∗
∗∗(.
242)
−.49
5∗∗∗
(.17
2)−.
534∗
∗(.
249)
Log
neol
ithic
tran
sitio
ntim
ing
−.05
4(.
458)
−.19
1(.
421)
−.29
8(.
444)
−.24
4(4
52)
−.18
3(.
495)
−.35
4(.
330)
−.32
6(.
343)
Cat
holic
.002
(.00
3)−8
.02E
−4(.
004)
−.00
1(.
004)
−.00
2(.
004)
−.00
1(.
003)
−5.3
2E−4
(.00
3)
Prot
esta
nt.0
04(.
007)
−.00
5(.
004)
−.00
6(.
008)
−.00
7(.
009)
−.00
3(.
006)
−.00
1(.
005)
Mus
lim−.
004
(.00
4)−.
004
(.00
4)−.
005
(.00
4)−.
006
(.00
4)−.
002
(.00
3)−.
002
(.00
3)
Eur
opea
nla
ngua
gesh
are
−.01
6(.
253)
.284
(.29
5).2
81(.
292)
.269
(.29
8).2
56(.
223)
.276
(.21
1)
Form
erco
lony
−.11
1(.
205)
−.09
0(.
217)
−.05
4(.
253)
−.20
7(.
188)
−.20
8(.
190)
Form
erB
ritis
hse
ttlem
ent
−.76
7∗(.
420)
−.69
5(.
462)
−.78
0(.
520)
−.42
6(.
305)
−513
(.43
6)
Civ
illa
w.1
07(.
273)
.249
(.27
4).1
39(.
210)
.128
(.19
9)
Eth
nic
frac
tiona
lizat
ion
.329
(594
).0
27(.
479)
.190
(.77
0)
OPE
Cm
embe
rshi
p−1
.10∗
∗∗(.
225)
−1.1
0∗∗∗
(.22
5)
Inst
itutio
nalq
ualit
yne
ighb
ors
−.07
8(.
124)
Stan
dard
cont
rols
incl
uded
Yes
Yes
Yes
Yes
Yes
Yes
Yes
Yes
Yes
Inst
rum
ent
Toxo
(1)
Toxo
(1)
Toxo
(1)
Toxo
(1)
Toxo
(1)
Toxo
(1)
Toxo
(1)
Toxo
(1)
Toxo
(1)
Obs
.46
4545
4141
4141
4141
Thi
sta
ble
esta
blis
hes
that
the
sign
ifica
ntef
fect
ofcu
lture
,ins
trum
ente
dby
toxo
plas
ma
prev
alen
ce,o
nin
stitu
tions
isro
bust
toad
ding
abr
oad
rang
eof
com
mon
dete
rmin
ants
ofin
stitu
tiona
lqua
lity
asco
ntro
ls.S
tand
ard
cont
rols
for
urba
niza
tion
and
clim
ate
are
incl
uded
inal
lfirs
tand
seco
ndst
ages
.For
mor
ede
tails
,see
Tabl
es2
and
4.
123

J Econ Growth
the main model. Results are presented in the Appendix (Table 7) and show that cul-ture, instrumented by toxoplasma, easily passes the common CDF decision rule, withCDF scores in the range from .95 to 1.00 for the various indicators of institutionalquality (Sala-i-Martin 1997). These results confirm our basic finding that cultural dif-ferences are an important source of variation in institutional quality between coun-tries.
5 Conclusion
This paper investigates the influence of culture on institutions and economic performance.In order to isolate the effect of culture on institutions, it uses an instrument in the form ofprevalence rates of Toxoplasma gondii. This parasite is known to influence attitudes and cul-ture, while its prevalence is largely independent from economic institutions and conditions,determined primarily by factors such as cat ownership and dietary practices. We find thatprevalence rates of latent toxoplasmosis are significant predictors of institutions and institu-tional quality, and we offer suggestive evidence as well as a priori arguments that these effectsrun through culture. Also, we find that this has repercussions on per capita income levels.Cultures characterized by low levels of trust, high acceptance of power distance, uncertaintyavoidance and collectivism tend to have lower levels of development. These results are robustfor a large set of control variables. We conclude that culture has an effect on institutions andon economic development, confirming empirically what others have argued theoretically oron basis of historical analysis. Culture matters and is an important part of what determinesthe wealth of nations.
There are some obvious pitfalls to avoid in interpreting these results. It is important to notethat we do not intend to pass a verdict on the quality of different cultures. We do not believethat any culture is inherently ‘better’ than others. Our study merely aims to point out some ofthe consequences of cultural characteristics, in order to increase understanding of what drivesdifferences in behavior and in long-term historical outcomes. From a policy perspective, thefact that culture matters does not necessarily mean that societies unlucky enough to havecultural attitudes associated with low-quality institutions are always condemned to weakinstitutions and economic underperformance. Rather, the results of this study could be takenas a reason to intensify efforts to create good institutions in societies that are apparentlynot culturally induced to develop those themselves. Identifying the effects of culture oninstitutions and development allows us to develop more targeted and effective policies.
To do so, more economic research is needed in the area of culture in the near future, inthe same vein that economists have taken up the institutional agenda in recent decades. Thispaper has shown that culture matters. We hope this is an inspiration for others to increaseresearch in this area.
Acknowledgements We thank Lee Benham, Sjoerd Beugelsdijk, Eelke de Jong, Sonja Opper, Harry Garret-sen, participants of the ISNIE 2011 Conference at Stanford University, seminar participants at the University ofLund, Oded Galor and two anonymous reviewers for their support and useful comments. Technical assistanceby Dimitrios Soudis is greatly appreciated. All views expressed in this paper are the author’s alone.
6 Appendix
See Appendix Table 7.
123

J Econ Growth
Table 7 The effect of culture (IV) on institutional quality: extreme bounds analysis results
Institutionalquality
Socialinfrastructure
Democracy Executiveconstraints
Ease of doingbusiness rank
Mean beta .710 .297 2.52 1.23 −46.7
Mean SD .237 .123 1.41 .688 19.7
CDF 1.00 .991 .953 .955 .990
Mean N 44.5 39.4 44.5 44.5 44.5
This table presents the results of an extreme bounds analysis for our standard IV model including a numberof extra controls in combinations of three, for five different measures of institutional quality. It shows thattoxoplasma-induced culture significantly affects institutional quality, and this effect is robust across specifi-cations and quality indicators. All institutional quality indicators pass the conventional decision criterion of aCDF > 0.95 (Sala-i-Martin 1997). Controls included are absolute latitude, arable land, time since Neolithic,colony dummies, meat consumption, cat ownership, sanitation, percentage speaking European languages, per-centage Catholics, Protestants and Muslims, ethnic fractionalization, continent dummies, legal origin, OPECmembership, and institutional quality of neighbours. A higher score on the ease of doing business rank indicatesbetter institutional quality. For all other indicators, higher scores indicate better institutional quality.
References
Acemoglu, D., Johnson, S., & Robinson, J. (2001). The colonial origins of comparative development: Anempirical investigation. American Economic Review, 91(5), 1369–1401.
Aghion, P., Algan, Y., Cahuc, P., & Shleifer, A. (2010). Regulation and distrust. The Quarterly Journal ofEconomics, 125(3), 1015–1049.
Alesina, A., Baqir, R., & Easterly, W. (1999). Public goods and ethnic divisions. Quarterly Journal of Eco-nomics, 114(4), 1243–1284.
Alesina, A., Devleeschauwer, A., Easterly, W., Kurlat, S., & Wacziarg, R. (2003). Fractionalization. Journalof Economic Growth, 8(2), 155–194.
Algan, Y., & Cahuc, P. (2010). Inherited trust and growth. American Economic Review, 100(5), 2060–92.Altonji, J., Elder, T., & Taber, C. (2005). Selection on observed and unobserved variables: Assessing the
effectiveness of Catholic schools. Journal of Political Economy, 113(1), 151–184.Ashraf, Q., & Galor, O. (2013). The ‘Out of Africa’ hypothesis, human genetic diversity, and comparative
economic development. American Economic Review, 103(1), 1–46.Barr, M. (1999). Lee Kuan Yew: Race, culture and genes. Journal of Contemporary Asia, 29(2), 145–166.Beck, T., Demirgüç-Kunt, A., & Levine, R. (2003). Law, endowments and finance. Journal of Financial
Economics, 70, 137–181.Beck, T., Demirgüç-Kunt, A., & Levine, R. (2001). Legal theories of financial development. Oxford Review
of Economic Policy, 17(4), 483–501.Bénabou, R., & Tirole, J. (2002). Self-confidence and personal motivation. The Quarterly Journal of Eco-
nomics, 117(3), 871–915.Bénard, A., Salmi, R., & Mouillet, E. (2005). Systematic review on the burden of congenital toxoplasmosis
in Europe [unpublished report for Panel 1 of the Eurotoxo group.]. Bordeaux, France: The EUROTOXOGroup.
Berdoy, M., Webster, J., & MacDonald, D. (1995). Parasite-altered behaviour: Is the effect of Toxoplasmagondii on Rattus norvegicus specific? Parasitology, 111(4), 403–409.
Berdoy, M., Webster, J., & Macdonald, D. (2000). Fatal attraction in rats infected with Toxoplasma gondii.Proceedings of the Royal Society B, 267, 1591–1594.
Bértola, L. (2010). Institutions and the historical roots of Latin American divergence. In J. A. Ocampo &J. Ros (Eds.), The Oxford handbook of Latin American economics (Chap. 2). Oxford: Oxford UniversityPress.
Beugelsdijk, S., & Maseland, R. (2011). Culture in economics: History, methodological reflections and con-temporary applications. Cambridge, UK.: Cambridge University Press.
Beugelsdijk, S. (2006). A note to the theory and measurement of trust in explaining differences in economicgrowth. Cambridge Journal of Economics, 30, 371–387.
Beverley, J. (1976). Toxoplasmosis in animals. The Veterinary Record, 99, 123–127.
123

J Econ Growth
Bosker, M., & Garretsen, H. (2009). Economic development and the geography of institutions. Journal ofEconomic Geography, 9(3), 295–328.
Clarke, H., Kornberg, A., McIntyre, C., Bauer-Kaase, P., & Kaase, M. (1999). The effect of economic prioritieson the measurement of value change. American Political Science Review, 93, 637–647.
Derouin, F., & Pelloux, H. (2008). Prevention of toxoplasmosis in transplant patients. Clinical Microbiologyand Infection, 14, 1089–1101.
Dhumne, M., Sengupta, C., Kadival, G., Rathinaswamy, A., & Velumani, A. (2007). National seroprevalenceof Toxoplasma gondii in India. Journal of Parasitology, 93(6), 1520–1521.
Dubey, J., & Beattie, C. (1988). Toxoplasmosis of animals and man. Boca Raton, FL: CRC Press.Easterly, W., & Levine, R. (2003). Tropics, germs and crops: How endowments influence economic develop-
ment. Journal of Monetary Economics, 50, 3–39.El-Nawawy, A., Soliman, A., el Azzouni, O., El-Sayed, A., Karim, M., Demian, S., et al. (1996). Maternal
and neonatal prevalence of toxoplasma and cytomegalovirus antibodies and hepatitis A antigens in anEgyptian rural area. Journal of Tropical Pediatrics, 42(3), 154–157.
Elsheikha, H. (2008). Congenital toxoplasmosis: Priorities for further health promotion action. Public Health,122, 335–353.
Engerman, S., & Sokoloff, K. (1997). Factor endowments, institutions, and differential paths of growth amongnew world economies. In S. Haber (Ed.), How Latin America fell behind (pp. 260–304). Stanford, CA:Stanford University Press.
FAOSTAT. (2011). Food balance sheets. Retrieved January, 11, 2012 from http://faostat.fao.org/.Fernandez, R. (2007). Women, work, and culture. Journal of the European Economic Association, 5(2–3),
305–332.Fernandez, R. (2008). Culture and economics. In S. Durlauf & L. Blume (Eds.), New palgrave dictionary of
economics (2nd ed.). London and New York: Macmillan.Fernandez, R. (2010). Does culture matter? In J. Benhabib, M. Jackson, & A. Bisin (Eds.), Handbook of social
economics 1a (pp. 481–510). Amsterdam: North Holland.Fernandez, R., & Fogli, A. (2006). Fertility: The role of culture and family experience. Journal of the European
Economic Association, 4(2), 552–561.Fernandez, R., & Fogli, A. (2009). Culture: An empirical investigation of beliefs, work, and fertility. American
Economic Journal: Macroeconomics, 1(1), 146–77.Fincher, C., Thornhill, R., Murray, D., & Schaller, M. (2008). Pathogen prevalence predicts human cross-
cultural variability in individualism/collectivism. Proceedings of the Royal Society B, 275, 1279–1285.Fine, B. (2001). Social capital versus social theory: Political economy and social science at the turn of the
millennium. New York: Routledge.Flegr, J., & Hrdy, I. (1994). Influence of chronic toxoplasmosis on some human personality factors. Folia
Parasitologica, 41, 122–126.Flegr, J. (2007). Effects of toxoplasma on human behavior. Schizophrenia Bulletin, 33(3), 757–760.Flegr, J., Kodym, P., & Tolarova, V. (2000). Correlation of duration of latent Toxoplasma gondii infection with
personality changes in women. Biological Psychology, 53, 57–68.Flegr, J., Zitkova, S., Kodym, P., & Frynta, D. (1996). Induction of changes in human behaviour by the parasitic
protozoan Toxoplasma gondii. Parasitology, 113, 49–54.Fukuyama, F. (2005). State building: Governance and world order in the twenty-first century. London: Profile
Books.Gallup, J. L., & Sachs, J. (2000). Agriculture, climate, and technology: Why are the tropics falling behind?
American Journal of Agricultural economics, 82, 731–737.Glaeser, E., & Shleifer, A. (2002). Legal origins. Quarterly Journal of Economics, 117(4), 1193–1229.Gorodnichenko, Y., & Roland, G. (2011). Individualism, innovation and long-run growth. Proceedings of the
National Academy of Sciences, 108(4), 21316–21319.Government of India. (2011). Provisional population statistics. Census of India.Granato, J., Inglehart, R., & Leblang, D. (1996). The effect of cultural values on economic development:
Theory, hypotheses, and some empirical tests. American Journal of Political Science, 40, 607–631.Greif, A. (1994). Cultural beliefs and the organization of society: A historical and theoretical reflection on
collectivist and individualist societies. Journal of Political Economy, 102(5), 912–950.Greif, A. (2006). Institutions and the path to the modern economy; lessons from medieval trade. Cambridge,
UK: Cambridge University Press.Greif, A., & Tabellini, G. (2010). Cultural and institutional bifurcation: China and Europe compared. American
Economic Review: Papers & Proceedings, 100, 135–140.Guebre-Xabier, M., Nurilign, A., Gebre-Hiwot, A., Hailu, A., Sissay, Y., Getachew, E., et al. (1993). Sero-
epidemiological survey of Toxoplasma gondii infection in Ethiopia. Ethiopian Medical Journal, 31(3),201–208.
123
J Econ Growth
Guiso, L., Sapienza, P., & Zingales, L. (2006). Does culture affect economic outcomes? The journal of economicperspectives, 20(2), 23–48.
Hall, R., & Jones, C. (1999). Why do some countries produce so much more output per worker than others?Quarterly Journal of Economics, 114, 83–116.
Harrison, L., & Huntington, S. (2000). Culture matters: How values shape human progress. New York: BasicBooks.
Havelaar, A., Kemmeren, J., & Kortbeek, L. (2007). Disease burden of congenital toxoplasmosis. ClinicalInfectious Diseases, 44, 1467–74.
Hay, J., Aitken, P., Hair, D., Hutchison, W., & Graham, D. (1984). The effect of congenital toxoplasmainfection on mouse activity and relative preference for exposed areas over a series of trials. Annals ofTropical Medicine and Parasitology, 78, 611–618.
Hay, J., Hutchison, W., Aitken, P., & Graham, D. (1983). The effect of congenital and adult-acquired toxoplasmainfections on activity and responsiveness to novel stimulation in mice. Annals of Tropical Medicine andParasitology, 77, 483–495.
Hill, D., & Dubey, J. (2002). Toxoplasma gondii: Transmission, diagnosis and prevention. Clinical Microbi-ology and Infection, 8, 634–640.
Hodkova, H., Kolbekova, P., Skallova, A., Lindova, J., & Flegr, J. (2007). Higher perceived dominance inToxoplasma infected men—a new evidence for role of increased level of testosterone in toxoplasmosis-associated changes in human behavior. Neuroendocrinology Letters, 28(2), 110–114.
Hofstede, G., & Hofstede, G. (2005). Cultures and organizations: Software of the mind. New York:McGrawHill.
Hofstede, G. (2001). Culture’s consequences: Comparing values, behaviors, institutions and organizationsacross nations (2nd ed.). Beverly Hills, CA: Sage Publications.
Hussein, A., Ali, A., Saleh, M., Nagaty, I., & Rezk, A. (2001). Prevalence of toxoplasma infection in Qualyobagovernate, Egypt. Journal of the Egyptian Society of Parasitology, 31(2), 355–363.
Husted, B. (1999). Instituto tecnologico y de estudios “Wealth, Culture, and Corruption”. Journal of Interna-tional Business Studies, 30(2), 339–359.
Hutchison, W., Bradley, M., Cheyne, W., Wells, B., & Hay, J. (1980). Behavioural abnormalities in toxoplasma-infected mice. Annals of Tropical Medicine and Parasitology, 74, 337–345.
Jing, R., & Graham, J. (2008). Values versus regulations: How culture plays its role. Journal of BusinessEthics, 80, 791–806.
Kahn, H. (1979). World economic development: 1979 and beyond. Boulder, CO: Westview Press.Kankova, S., Sulc, J., Nouzova, K., Fajfrlik, K., Frynta, D., & Flegr, J. (2007). Women infected with parasite
Toxoplasma have more sons. Naturwissenschaften, 94, 122–127.Kasperm, L., & Buzoni-Gatel, D. (1998). Some opportunistic parasitic infections in AIDS: Candidiasis,
pneumocystosis, cryptosporidiosis, toxoplasmosis. Parasitology Today, 14(4), 150–6.Kaufmann, D., Kraay, A., & Mastruzzi, M. (2009). Governance matters VIII: Governance indicators for
1996–2008. World Bank Policy Research.Kaufmann, D., Kraay, A., & Zoido-Lobatón, P. (1999). Governance matters. World Bank Policy Research
Department Working Paper 2196.Kim, A. E., & Park, G. (2003). Nationalism, confucianism, work ethic and industrialization in the South.
Journal of Contemporary Asia, 33(1), 37–49.Knack, S. (2002). Social capital and the quality of government: Evidence from the U.S. States. American
Journal of Political Science, 4, 772–785.Knack, S., & Keefer, P. (1997). Does social capital have an economic payoff? A cross-country investigation.
Quarterly Journal of Economics, 112(4), 1252–88.Kottek, M., Grieser, J., Beck, C., Rudolf, B., & Rubel, F. (2006). World map of the Köppen-Geiger climate
classification updated. Meteorologische Zeitschrift, 15(3), 259e63.Kravetz, J., & Federman, D. (2005). Toxoplasmosis in pregnancy. American Journal of Medicine., 118(3),
212–6.Lafferty, K. (2005). Look what the cat dragged in: Do parasites contribute to human cultural diversity?
Behavioural Processes, 68, 279–282.Lafferty, K. (2006). Can the common brain parasite, Toxoplasma gondii, influence human culture? Proceedings
of the Royal Society B: Biological Sciences, 273(1602), 2749–2755.Landes, D. (1998). The wealth and poverty of nations. London: Abacus.LaPorta, R., Lopez-de-Silanes, F., Shleifer, A., & Vishny, R. (1998). Law and finance. Journal of Political
Economy, 106, 1113–1155.LaPorta, R., Lopez-de-Silanes, F., Shleifer, A., & Vishny. (1999). The quality of government. Journal of Law,
Economics, and Organization, 15(1), 222–279.
123

J Econ Growth
LaPorta, R., Lopez-de-Silanes, F., & Shleifer, A. (2008). The economic consequences of legal origin. Journalof Economic Literature, 46(2), 285–332.
Letendre, K., Fincher, C., & Thornhill, R. (2010). Does infectious disease cause global variation in thefrequency of intrastate armed conflict and civil war? Biological Review, 85, 669–683.
Licht, A., Goldschmidt, C., & Schwartz, S. (2005). Culture, law, and corporate governance. InternationalReview of Law and Economics, 25, 229–255.
Lindova, J., Novotna, M., Havlıcek, J., Jozifkova, E., Skallova, A., & Kolbekova, P., et al. (2006). Genderdifferences in behavioural changes induced by latent toxoplasmosis. International Journal for Parasitology,36, 1485–1492.
Luttmer, E., & Singhal, M. (2011). Culture, context, and the taste for redistribution. American EconomicJournal: Economic Policy, 3(1), 157–79.
Mahathir, B. M. (1970). The Malay dilemma. Singapore: Times Books.Marshall, M., & Jaggers, K. (2005). Polity IV project: Political regime characteristics and transitions, 1800–
2004. In Center for systemic peace, Vienna, VA. Retrieved August 1, 2007 from www.systemicpeace.org/polity/polity4.htm.
Maseland, R., & van Hoorn, A. (2009). Explaining the negative correlation between values and practices.Journal of International Business Studies, 40(3), 527–532.
Maseland, R., & van Hoorn, A. (2011). Why Muslims like democracy yet have so little of it. Public Choice,147, 481–496.
Moore, J. (2002). Parasites and the behavior of animals. Oxford: Oxford University Press.Morris, J., & Potter, M. (1997). Emergence of new pathogens as a function of changes in host susceptibility.
Emerging Infectious Diseases, 3(4), 433–441.Murray, D., & Schaller, M. (2010). Historical prevalence of infectious diseases within 230 geopolitical regions:
A tool for investigating origins of culture. Journal of Cross-Cultural Psychology, 41(1), 99–108.Murray, S., Holmes, J., Griffin, D., Bellavia, G., & Rose, P. (2001). The mismeasure of love: How self-doubt
contaminates relationship beliefs. Personality and Social Psychology Bulletin, 27(4), 423–436.Nissapatorn, V., Noor Azmi, A., Cho, S., Fong, M., Init, I., Rohela, M., et al. (2003). Toxoplasmosis: Prevalence
and risk factors. Journal of Obstetrics and Gynaecology, 23(6), 618–624.North, D., Weingast, B., & Summerhill, W. (2000). Order, disorder and economic change. Latin America
versus North America. In B. B. de Mesquita & H. L. Root (Eds.), Governing for prosperity (pp. 17–58).New Haven: Yale University Press.
North, D. (1990). institutions, institutional change and economic performance. Cambridge, UK: CambridgeUniversity Press.
North, D. (2005). Understanding the process of economic change. Princeton, NJ: Princeton University Press.Opsteegh, M., Verbeek, L., & van der Giessen, J. (2011). Policy advice concerning the intervention measures
to prevent toxoplasmosis in The Netherlands. The Netherlands: Rijksinstituut voor Volksgezondheid enMilieu.
Pappas, G., Roussos, N., & Falagas, M. (2009). Toxoplasmosis snapshots: Global status of Toxoplasma gondiiseroprevalence and implications for pregnancy and congenital toxoplasmosis. International Journal forParasitology, 39, 1385–1394.
Piekarski, G., Zippelius, H.-M., & Witting, P. (1978). Auswirkungen einer latenten Toxoplasma-Infektion aufdas Lernvermogen von weissen Laboratoriumsratten and mausen. Zeitschrift für Parasitenkunde, 57, 1–15.
Putnam, R., Leonardi, R., & Nanetti, R. (1993). Making democracy work. Princeton, NJ: Princeton UniversityPress.
Rauch, J., & Trindade, V. (2002). Ethnic Chinese networks in international trade. The Review of Economicsand Statistics, 84(1), 116–130.
Rodrik, D., & Subramanian, A. (2003). The primacy of institutions. Finance and Development, 40, 31–34.Rodrik, D., Subramanian, A., & Trebbi, F. (2004). Institutions rule: The primacy of institutions over geography
and integration in economic development. Journal of Economic Growth, 9(2), 131–165.Sachs, J., & Malaney, P. (2002). The economic and social burden of malaria. Nature, 415, 681–685.Sala-i-Martin, X. (1997). I just ran two million regressions. American Economic Review, 87(2), 178–183.Schaller, M., & Murray, D. (2008). Pathogens, personality, and culture: Disease prevalence predicts worldwide
variability in sociosexuality, extraversion, and openness to experience. Journal of Personality and SocialPsychology, 95(1), 212–221.
Skallova, A., Kodym, P., Frynta, D., & Flegr, J. (2006). The role of dopamine in toxoplasma-induced behavour-ial alterations in mice: An ethological and ethopharmacological study. Parasitology, 133, 525–535.
Sokoloff, K., & Robinson, S. (2003). Historical roots of inequality in Latin America and the Caribbean.Inequality in Latin America & the Caribbean: Breaking with history? (pp. 171–190). Washington DC:World Bank.
123

J Econ Growth
Sokoloff, K., & Zolt, E. (2007). Inequality and the evolution of institutions of taxation: Evidence from theeconomic history of the Americas. In S. Edwards, G. Esquivel, & G. Márquez (Eds.), The decline of theLatin American economies. Growth, institutions and crisis (pp. 83–136). Chicago: University of ChicagoPress.
Stulz, R., & Williamson, R. (2003). Culture, openness, and finance. Journal of Financial Economics, 70,313–49.
Tabellini, G. (2008). Presidential Address. Journal of the European Economic Association Papers and Pro-ceedings, 6(2–3), 255–294.
Tabellini, G. (2010). Culture and institutions: Economic development in the regions of Europe. Journal of theEuropean Economic Association, 8(4), 677–716.
Tawney, R. (1926). Religion and the rise of capitalism. New York: Harper and Row.Tenter, A., Heckeroth, A., & Weiss, L. (2000). Toxoplasma gondii: From animals to humans. International
Journal of Parasitology., 30, 1217–1258.Thornhill, R., Fincher, C., & Aran, D. (2009). Parasites, democratization, and the liberalization of values
across contemporary countries. Biological Review, 84, 113–131.Torrey, F., & Yolken, R. (2003). Toxoplasma gondii and schizophrenia. Emerging Infectious Disease, 9(11),
1375–1380.United Nations. (2010). Millennium indicators database. Statistics division internet site. Retrieved November
8, 2011, from http://millenniumindicators.un.orgVelasco-Castrejon, O., Salvatierra-Izaba, B., Valdespino, J., Sedano-Lara, A., Galindo-Virgen, S., Magos, C.,
et al. (1992). Seroepidemologia de la Toxoplasmosis en Mexico. Salud Publica de Mexico, 34(2), 222–229.Vitell, S., Nwachukwu, S., & Barnes, J. (1993). The effects of culture on ethical decision-making: An appli-
cation of Hofstede’s typology. Journal of Business Ethics, 12, 753–60.Weber, M. (1992) [1930]. The Protestant ethic and the spirit of capitalism. Translated by T. Parsons. London,
New York: Routledge.Webster, J. (2001). Rats, cats, people and parasites: The impact of latent toxoplasmosis on behaviour. Microbes
and Infection., 3(2), 1037–1045.Webster, J., Lamberton, P., Donnely, C., & Torrey, E. (2006). Parasites as causative agents of human affective
disorders? The impact of anti-psychotic, mood-stabilizer and anti-parasite medication on Toxoplasmagondii’s ability to alter host behavior. Proceedings of the Royal Society B, 273, 1023–1030.
WHO. (2011). Global health observatory data repository. Retrieved December 21, 2011, from http://apps.who.int/ghodata/.
Williamson, C. (2009). Informal institutions rule: Institutional arrangements and economic performance.Public Choice, 139, 371–387.
Williamson, O. (2000). The new institutional economics: Taking stock, looking ahead. Journal of EconomicLiterature, 38, 595–613.
Witting, P. (1979). Learning capacity and memory of normal and toxoplasma-infected laboratory rats andmice. Zeitschrift für Parasitenkunde, 61, 29–51.
World Bank. (2011). World development indicators. Retrieved September 27, 2011 from http://data.worldbank.org/.
World Bank. (2010). Doing business 2011: Making a difference for entrepreneurs. Washington, DC: WorldBank.
World Society for the Protection of Animals. (2008). Global companion animal ownership and trade: Projectsummary. Retrieved November 27, 2012, from http://www.wspa-international.org.
World Values Survey Association. (2009). World values survey 1981–2008 official aggregate v. 20090901,2009. www.worldvaluessurvey.org. Madrid: ASEP/JDS.
Yolken, R., Dickerson, F., & Fuller Torre, E. (2009). Toxoplasma and schizophrenia. Parasite Immunology,31(11), 706–715.
Zak, P., & Knack, S. (2001). Trust and growth. Economic Journal, 111, 295–321.
123