Embed Size (px)
Citation preview
SAN DIEGO CITY EMPLOYEES’ RETIREMENT SYSTEM (SDCERS)PERFORMANCE REVIEW
January 12, 2017
This material has been prepared for the exclusive use of SDCERS in a one-on-one presentation only.
2
This material has been prepared for the exclusive use of SDCERS in a one-on-one presentation only.
Performance ReviewThird Quarter 2016 -
Firm Overview 3
PIOS® (Policy Implementation Overlay Service)*
– Program Review for SDCERS 11
Risks 20
Appendices 22
TABLE OF CONTENTS
*PIOS is a trademark registered in the U.S. Patent and Trademark Office.
Justin Henne, CFA
Managing Director – Customized Exposure Management
952-767-7718
Ben Lazarus
Senior Director, Institutional Relationships
952-767-7707

3This material has been prepared for the exclusive use of
SDCERS in a one-on-one presentation only.
FIRM OVERVIEW
4
This material has been prepared for the exclusive use of SDCERS in a one-on-one presentation only.
Performance ReviewThird Quarter 2016 -
WHO WE ARE
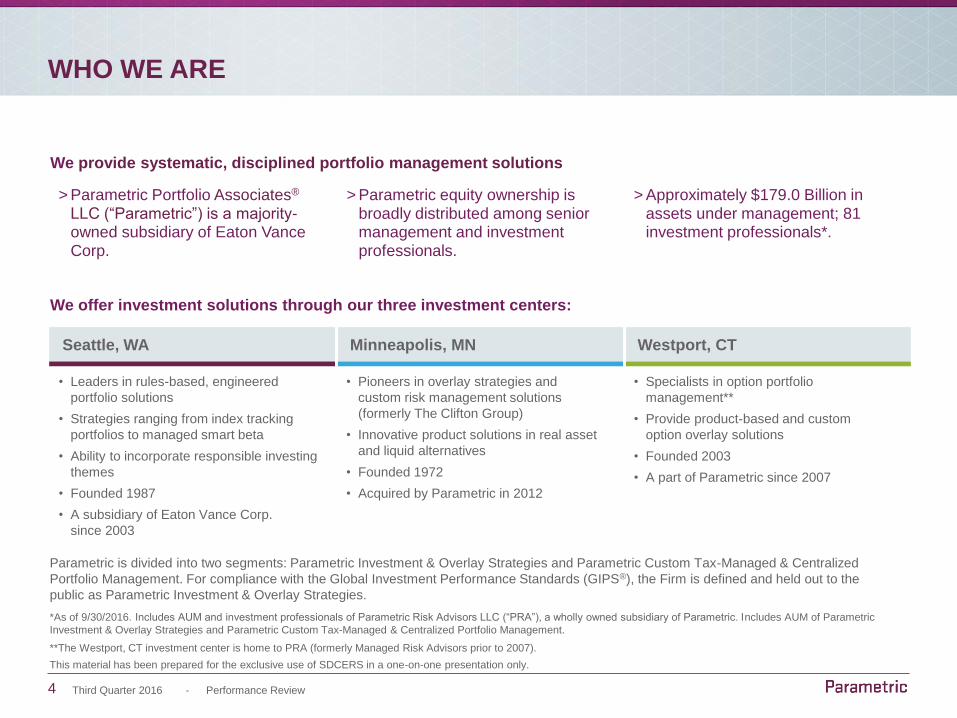
Parametric is divided into two segments: Parametric Investment & Overlay Strategies and Parametric Custom Tax-Managed & Centralized
Portfolio Management. For compliance with the Global Investment Performance Standards (GIPS®), the Firm is defined and held out to the
public as Parametric Investment & Overlay Strategies.
*As of 9/30/2016. Includes AUM and investment professionals of Parametric Risk Advisors LLC (“PRA”), a wholly owned subsidiary of Parametric. Includes AUM of Parametric
Investment & Overlay Strategies and Parametric Custom Tax-Managed & Centralized Portfolio Management.
**The Westport, CT investment center is home to PRA (formerly Managed Risk Advisors prior to 2007).
Seattle, WA Minneapolis, MN Westport, CT
• Leaders in rules-based, engineered
portfolio solutions
• Strategies ranging from index tracking
portfolios to managed smart beta
• Ability to incorporate responsible investing
themes
• Founded 1987
• A subsidiary of Eaton Vance Corp.
since 2003
• Pioneers in overlay strategies and
custom risk management solutions
(formerly The Clifton Group)
• Innovative product solutions in real asset
and liquid alternatives
• Founded 1972
• Acquired by Parametric in 2012
• Specialists in option portfolio
management**
• Provide product-based and custom
option overlay solutions
• Founded 2003
• A part of Parametric since 2007
We provide systematic, disciplined portfolio management solutions
We offer investment solutions through our three investment centers:
> Parametric Portfolio Associates®
LLC (“Parametric”) is a majority-owned subsidiary of Eaton Vance Corp.
> Parametric equity ownership is broadly distributed among senior management and investment professionals.
> Approximately $179.0 Billion in assets under management; 81 investment professionals*.
5
This material has been prepared for the exclusive use of SDCERS in a one-on-one presentation only.
Performance ReviewThird Quarter 2016 -
KEY DIFFERENTIATORS
Aligned investment philosophy across three investment centers, where we:
• Dismiss traditional market forecasts
• Seek to add value through portfolio construction
• Implement a disciplined, transparent investment process, with extensive
risk management
Self-managed, with a culture of innovation and pragmatism
Deep, experienced, and stable team
Client-centered with a focus on service
6
This material has been prepared for the exclusive use of SDCERS in a one-on-one presentation only.
Performance ReviewThird Quarter 2016 -
PARAMETRIC INVESTMENT PLATFORM
7
This material has been prepared for the exclusive use of SDCERS in a one-on-one presentation only.
Performance ReviewThird Quarter 2016 -
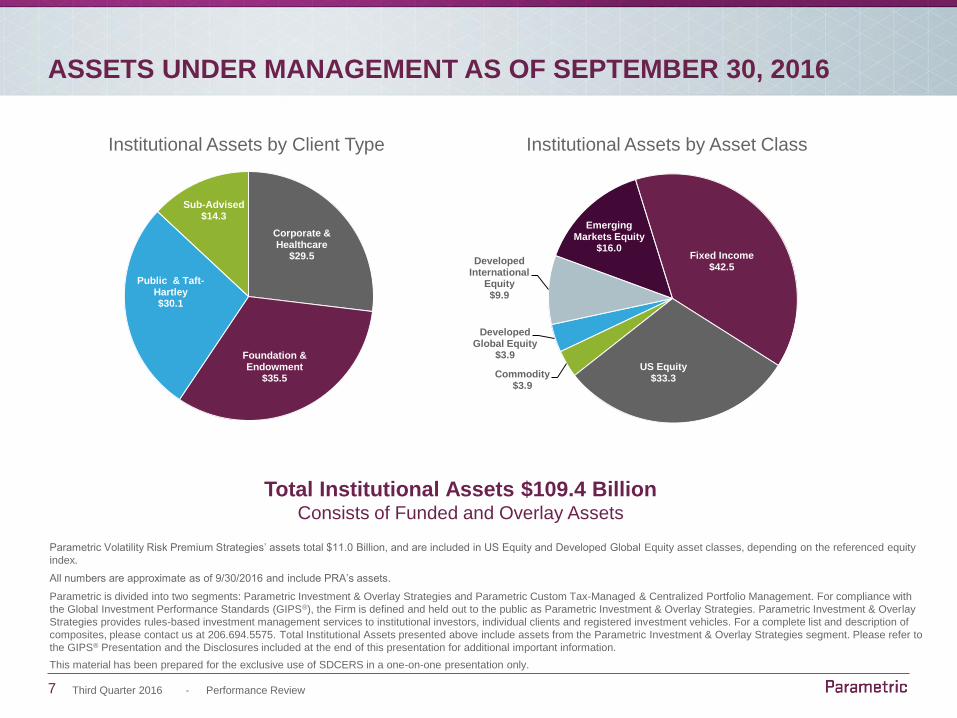
ASSETS UNDER MANAGEMENT AS OF SEPTEMBER 30, 2016
Institutional Assets by Client Type Institutional Assets by Asset Class
Parametric Volatility Risk Premium Strategies’ assets total $11.0 Billion, and are included in US Equity and Developed Global Equity asset classes, depending on the referenced equity
index.
All numbers are approximate as of 9/30/2016 and include PRA’s assets.
Parametric is divided into two segments: Parametric Investment & Overlay Strategies and Parametric Custom Tax-Managed & Centralized Portfolio Management. For compliance with
the Global Investment Performance Standards (GIPS®), the Firm is defined and held out to the public as Parametric Investment & Overlay Strategies. Parametric Investment & Overlay
Strategies provides rules-based investment management services to institutional investors, individual clients and registered investment vehicles. For a complete list and description of
composites, please contact us at 206.694.5575. Total Institutional Assets presented above include assets from the Parametric Investment & Overlay Strategies segment. Please refer to
the GIPS® Presentation and the Disclosures included at the end of this presentation for additional important information.
Total Institutional Assets $109.4 BillionConsists of Funded and Overlay Assets
Corporate & Healthcare
$29.5
Foundation & Endowment
$35.5
Public & Taft-Hartley$30.1
Sub-Advised$14.3
Commodity$3.9
Developed Global Equity
$3.9
Developed International
Equity$9.9
Emerging Markets Equity
$16.0Fixed Income
$42.5
US Equity$33.3

8
This material has been prepared for the exclusive use of SDCERS in a one-on-one presentation only.
Performance ReviewThird Quarter 2016 -
REPRESENTATIVE CLIENT LIST AS OF SEPTEMBER 30, 2016
It is not known whether the listed clients approve or disapprove of the adviser. The partial list of clients included herein were selected as being representative of the different types of
institutional clients and businesses serviced by Parametric. Performance-based data was not a determining factor in their selection.
>Public
Alaska Retirement Management Board
Arizona State Retirement System
California State Teachers’ Retirement System
East Bay Municipal Utility District
Fairfax County Retirement Systems
Houston Police Officers’ Pension System
Manhattan & Bronx Surface Transit Operating Authority Pension Plan
Marin County Employees’ Retirement Association
Massachusetts Pension Reserves Investment Management Board
New Mexico Public Employees' Retirement Association
Oakland Police and Fire Retirement System
San Joaquin County Employees’ Retirement Association
San Luis Obispo County
San Mateo County Employees’ Retirement Association
Seattle City Employees’ Retirement System
Wisconsin Investment Board
>Endowments
Indiana University & Foundation
Pepperdine University
Texas Christian University
University of Minnesota Foundation
University of Missouri System
University of Pittsburgh
University of St. Thomas
Regents of the University of Michigan
>Faith Based
Covenant Ministries of Benevolence
Ministers & Missionaries’ Benefit Board of American Baptist Churches
Pension Fund of the Christian Church
>Healthcare
Advocate Health Care Network
North Memorial Health Care
OhioHealth Corporation
Trinity Health
>Taft-Hartley
Board of Trustees ABC-NABET Retirement Trust Fund
Boilermaker-Blacksmith National Pension Trust
Central Laborers’ Pension Fund
Electrical Workers, IBEW, Pacific Coast Fund
Chicago Laborers’ Pension & Welfare Funds
National Retirement Fund
Teamsters, Western Pennsylvania
>Foundations
Auburn University
The Doris Duke Charitable Foundation & Related Entities
The John D. & Catherine T. MacArthur Foundation
The McKnight Foundation
>Corporate
Cargill, Inc.
Macy's, Inc.
3M Company
Nestlé USA, Inc.
Eversource Energy
Target Corporation
United Technologies Corporation
9
This material has been prepared for the exclusive use of SDCERS in a one-on-one presentation only.
Performance ReviewThird Quarter 2016 -
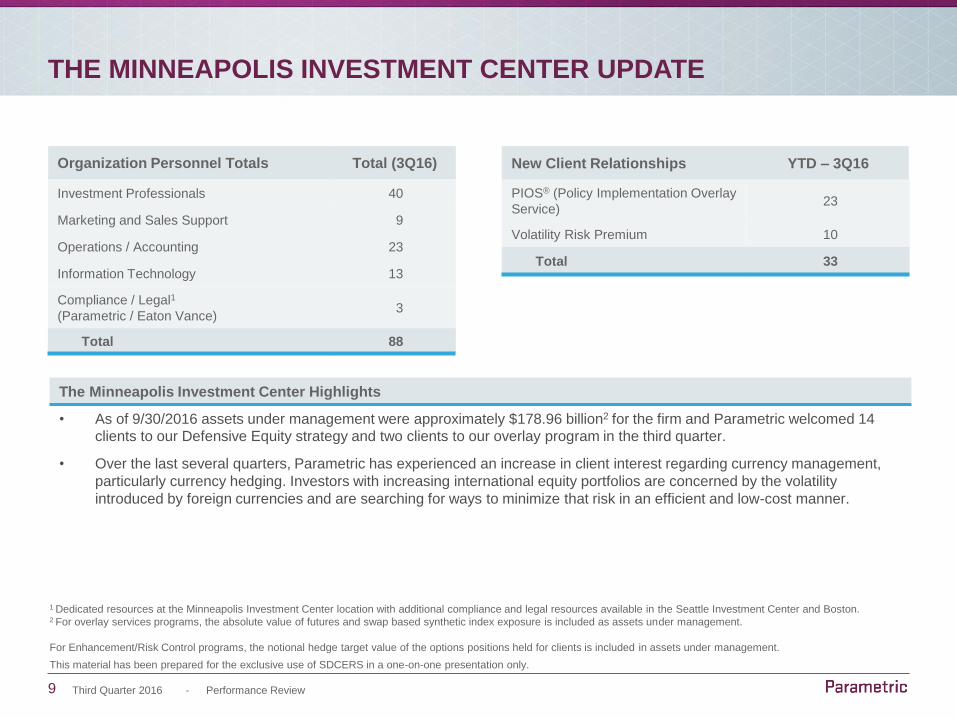
1 Dedicated resources at the Minneapolis Investment Center location with additional compliance and legal resources available in the Seattle Investment Center and Boston.2 For overlay services programs, the absolute value of futures and swap based synthetic index exposure is included as assets under management.
For Enhancement/Risk Control programs, the notional hedge target value of the options positions held for clients is included in assets under management.
THE MINNEAPOLIS INVESTMENT CENTER UPDATE
The Minneapolis Investment Center Highlights
• As of 9/30/2016 assets under management were approximately $178.96 billion2 for the firm and Parametric welcomed 14
clients to our Defensive Equity strategy and two clients to our overlay program in the third quarter.
• Over the last several quarters, Parametric has experienced an increase in client interest regarding currency management,
particularly currency hedging. Investors with increasing international equity portfolios are concerned by the volatility
introduced by foreign currencies and are searching for ways to minimize that risk in an efficient and low-cost manner.
New Client Relationships YTD – 3Q16
PIOS® (Policy Implementation Overlay
Service)23
Volatility Risk Premium 10
Total 33
Organization Personnel Totals Total (3Q16)
Investment Professionals 40
Marketing and Sales Support 9
Operations / Accounting 23
Information Technology 13
Compliance / Legal1
(Parametric / Eaton Vance)3
Total 88
10This material has been prepared for the exclusive use of
SDCERS in a one-on-one presentation only.
PROGRAM REVIEW FOR SDCERS
11
This material has been prepared for the exclusive use of SDCERS in a one-on-one presentation only.
Performance ReviewThird Quarter 2016 -
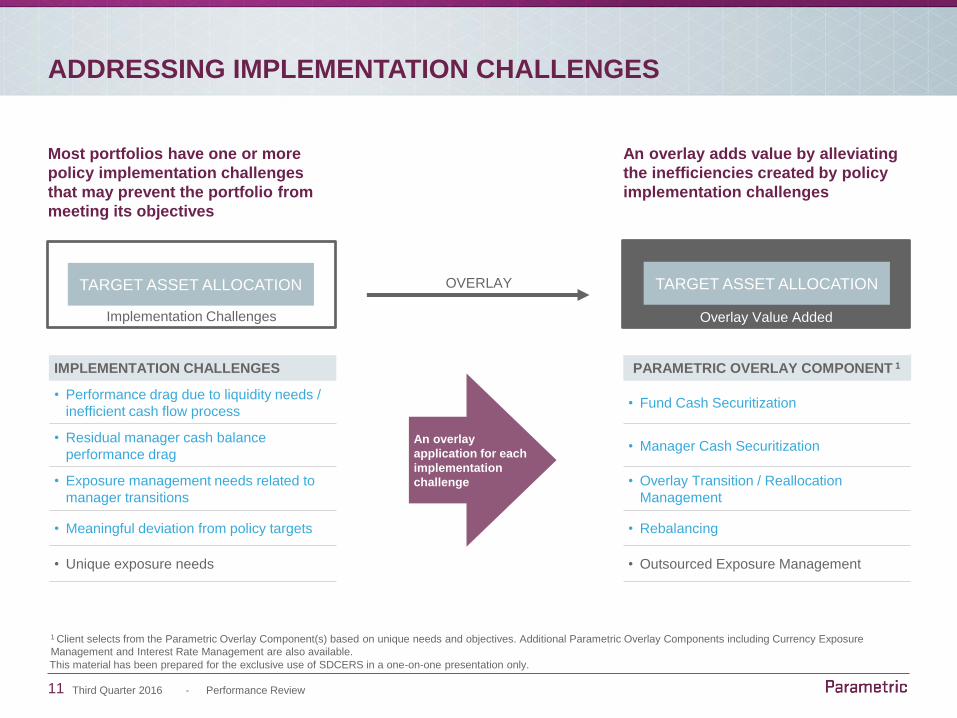
IMPLEMENTATION CHALLENGES PARAMETRIC OVERLAY COMPONENT 1
• Performance drag due to liquidity needs /
inefficient cash flow process• Fund Cash Securitization
• Residual manager cash balance
performance drag• Manager Cash Securitization
• Exposure management needs related to
manager transitions
• Overlay Transition / Reallocation
Management
• Meaningful deviation from policy targets • Rebalancing
• Unique exposure needs • Outsourced Exposure Management
ADDRESSING IMPLEMENTATION CHALLENGES
Most portfolios have one or more
policy implementation challenges
that may prevent the portfolio from
meeting its objectives
An overlay adds value by alleviating
the inefficiencies created by policy
implementation challenges
An overlay
application for each
implementation
challenge
TARGET ASSET ALLOCATIONOVERLAY
Implementation Challenges Overlay Value Added
TARGET ASSET ALLOCATION
1 Client selects from the Parametric Overlay Component(s) based on unique needs and objectives. Additional Parametric Overlay Components including Currency Exposure
Management and Interest Rate Management are also available.
12
This material has been prepared for the exclusive use of SDCERS in a one-on-one presentation only.
Performance ReviewThird Quarter 2016 -
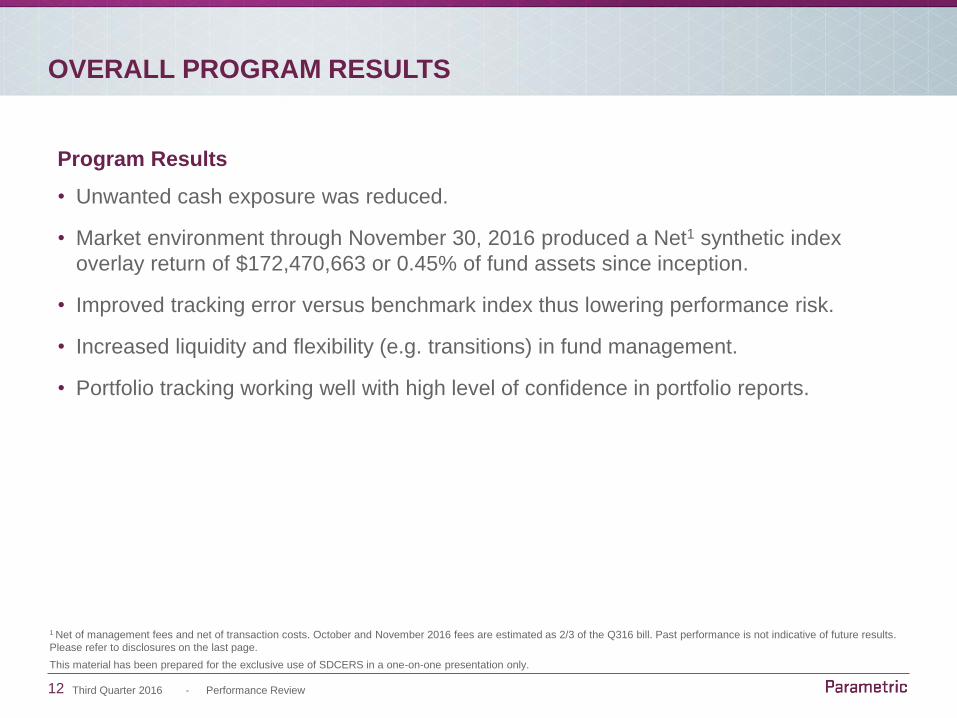
OVERALL PROGRAM RESULTS
1 Net of management fees and net of transaction costs. October and November 2016 fees are estimated as 2/3 of the Q316 bill. Past performance is not indicative of future results.
Please refer to disclosures on the last page.
Program Results
• Unwanted cash exposure was reduced.
• Market environment through November 30, 2016 produced a Net1 synthetic index
overlay return of $172,470,663 or 0.45% of fund assets since inception.
• Improved tracking error versus benchmark index thus lowering performance risk.
• Increased liquidity and flexibility (e.g. transitions) in fund management.
• Portfolio tracking working well with high level of confidence in portfolio reports.
13
This material has been prepared for the exclusive use of SDCERS in a one-on-one presentation only.
Performance ReviewThird Quarter 2016 -
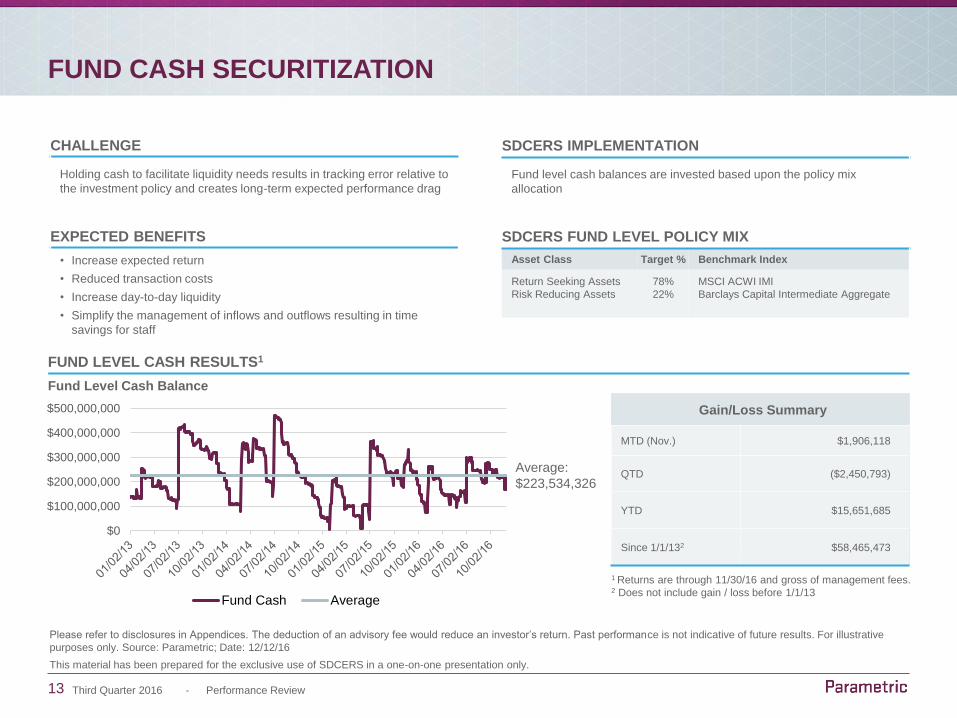
FUND CASH SECURITIZATION
Please refer to disclosures in Appendices. The deduction of an advisory fee would reduce an investor’s return. Past performance is not indicative of future results. For illustrative
purposes only. Source: Parametric; Date: 12/12/16
CHALLENGE
Holding cash to facilitate liquidity needs results in tracking error relative to
the investment policy and creates long-term expected performance drag
EXPECTED BENEFITS
• Increase expected return
• Reduced transaction costs
• Increase day-to-day liquidity
• Simplify the management of inflows and outflows resulting in time
savings for staff
FUND LEVEL CASH RESULTS1
Fund Level Cash Balance
SDCERS IMPLEMENTATION
Fund level cash balances are invested based upon the policy mix
allocation
SDCERS FUND LEVEL POLICY MIX
Asset Class Target % Benchmark Index
Return Seeking Assets
Risk Reducing Assets
78%
22%
MSCI ACWI IMI
Barclays Capital Intermediate Aggregate
Gain/Loss Summary
MTD (Nov.) $1,906,118
QTD ($2,450,793)
YTD $15,651,685
Since 1/1/132 $58,465,473
1 Returns are through 11/30/16 and gross of management fees.2 Does not include gain / loss before 1/1/13
Average:
$223,534,326
$0
$100,000,000
$200,000,000
$300,000,000
$400,000,000
$500,000,000
Fund Cash Average
14
This material has been prepared for the exclusive use of SDCERS in a one-on-one presentation only.
Performance ReviewThird Quarter 2016 -
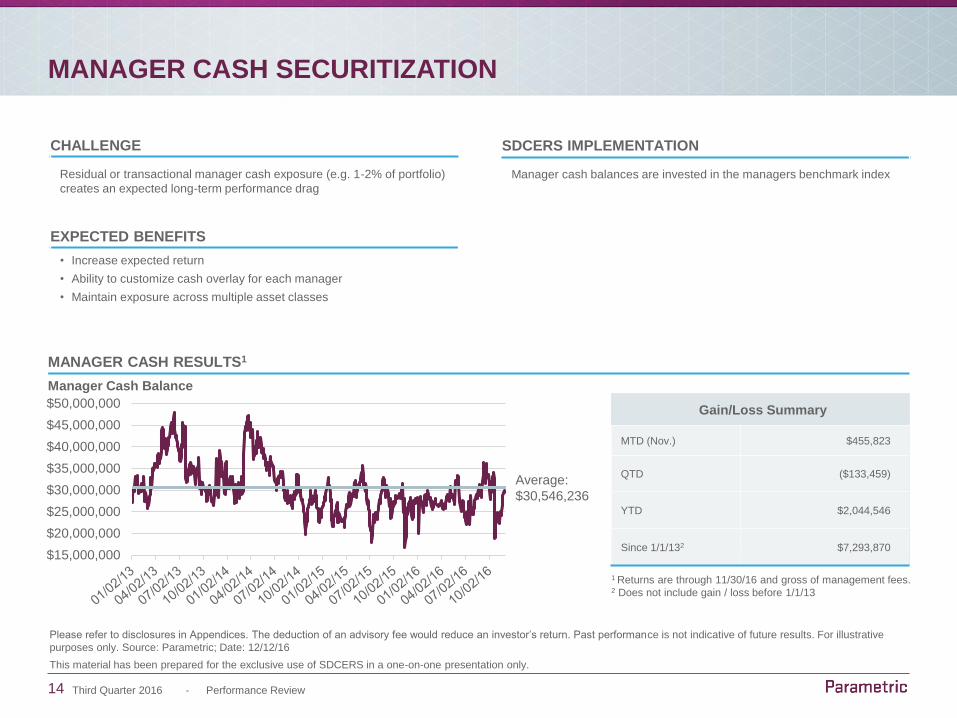
MANAGER CASH SECURITIZATION
CHALLENGE
Residual or transactional manager cash exposure (e.g. 1-2% of portfolio)
creates an expected long-term performance drag
EXPECTED BENEFITS
• Increase expected return
• Ability to customize cash overlay for each manager
• Maintain exposure across multiple asset classes
MANAGER CASH RESULTS1
Manager Cash Balance
SDCERS IMPLEMENTATION
Manager cash balances are invested in the managers benchmark index
Please refer to disclosures in Appendices. The deduction of an advisory fee would reduce an investor’s return. Past performance is not indicative of future results. For illustrative
purposes only. Source: Parametric; Date: 12/12/16
Average:
$30,546,236
Gain/Loss Summary
MTD (Nov.) $455,823
QTD ($133,459)
YTD $2,044,546
Since 1/1/132 $7,293,870
1 Returns are through 11/30/16 and gross of management fees.2 Does not include gain / loss before 1/1/13
$15,000,000
$20,000,000
$25,000,000
$30,000,000
$35,000,000
$40,000,000
$45,000,000
$50,000,000
15
This material has been prepared for the exclusive use of SDCERS in a one-on-one presentation only.
Performance ReviewThird Quarter 2016 -
TRANSITION / REALLOCATION MANAGEMENT
CHALLENGE
Manager changes, manager reallocations, liquidation of illiquid holdings
(e.g. hedge funds), change to target allocations, etc. which cause the fund
to meaningfully deviate from target exposures
EXPECTED BENEFITS
• Mitigation of exposure gaps which reduces performance risk
• The manager termination point can be accelerated or new manager
search period can be extended as long as needed without losing
targeted market exposure
• Note: Parametric works closely with transition service providers but
does not transition physical portfolio holdings
TRANSITION RESULTS1
SDCERS IMPLEMENTATION
Reduce or eliminate exposure gaps using index overlays or ETF’s
1 Returns are through 11/30/16 and gross of management fees.2 Does not include gain / loss before 1/1/13
Please refer to disclosures in Appendices. The deduction of an advisory fee would reduce an investor’s return. Past performance is not indicative of future results. For illustrative
purposes only. Source: Parametric; Date: 12/12/16
• Since 1/1/13, transition management has returned ($5,986,505)2
• In 2016, Parametric assisted in 2 transition events.
• Bridged the exposure gap in October 2016 as assets were raised to fund the Allianz Structured Alpha portfolio.
• Currently maintaining a client instructed $100 million fixed income position that was initiated on July 1, 2016.
16
This material has been prepared for the exclusive use of SDCERS in a one-on-one presentation only.
Performance ReviewThird Quarter 2016 -
REBALANCING
CHALLENGE
Asset class exposures which deviate meaningfully from long-term policy
targets or short-term tactical preferences may result in unwanted
exposures and increased tracking error
EXPECTED BENEFITS
• Reduced transaction costs
• Timely and efficient reallocation of portfolio exposures
• Reduction of tracking error versus policy mix
REBALANCING RESULTS1
SDCERS IMPLEMENTATION
Parametric monitors Fund exposures relative to the target asset allocation
each day. If fund exposures deviate from target by a predetermined
threshold (+/-3%), contact with staff is initiated. Synthetic rebalancing only
occurs at staff direction
1 Returns are through 11/30/16 and gross of management fees.2 Does not include gain / loss before 1/1/13
Please refer to disclosures in Appendices. The deduction of an advisory fee would reduce an investor’s return. Past performance is not indicative of future results. For illustrative
purposes only. Source: Parametric; Date: 12/12/16
• Parametric carried a client directed rebalancing position from December 2013 – February 2014. The rebalancing component has generated an estimated
incremental return of $1,492,0392 since 1/1/13.
17
This material has been prepared for the exclusive use of SDCERS in a one-on-one presentation only.
Performance ReviewThird Quarter 2016 -
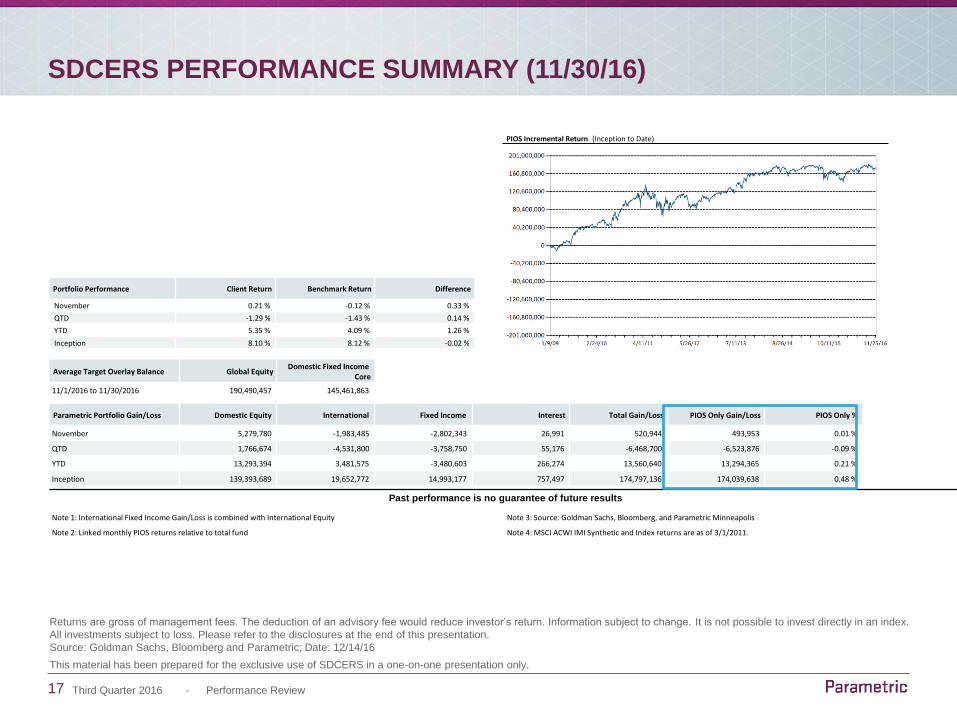
Average Target Overlay Balance Global EquityDomestic Fixed Income
Core
11/1/2016 to 11/30/2016 190,490,457 145,461,863
Parametric Portfolio Gain/Loss Domestic Equity International Fixed Income Interest Total Gain/Loss PIOS Only Gain/Loss PIOS Only %
November 5,279,780 -1,983,485 -2,802,343 26,991 520,944 493,953 0.01 %
QTD 1,766,674 -4,531,800 -3,758,750 55,176 -6,468,700 -6,523,876 -0.09 %
YTD 13,293,394 3,481,575 -3,480,603 266,274 13,560,640 13,294,365 0.21 %
Inception 139,393,689 19,652,772 14,993,177 757,497 174,797,136 174,039,638 0.48 %
Past performance is no guarantee of future results
Note 1: International Fixed Income Gain/Loss is combined with International Equity Note 3: Source: Goldman Sachs, Bloomberg, and Parametric Minneapolis
Note 2: Linked monthly PIOS returns relative to total fund Note 4: MSCI ACWI IMI Synthetic and Index returns are as of 3/1/2011.
SDCERS PERFORMANCE SUMMARY (11/30/16)
Returns are gross of management fees. The deduction of an advisory fee would reduce investor’s return. Information subject to change. It is not possible to invest directly in an index.
All investments subject to loss. Please refer to the disclosures at the end of this presentation.
Source: Goldman Sachs, Bloomberg and Parametric; Date: 12/14/16
PIOS Incremental Return (Inception to Date)
Portfolio Performance Client Return Benchmark Return Difference
November 0.21 % -0.12 % 0.33 %
QTD -1.29 % -1.43 % 0.14 %
YTD 5.35 % 4.09 % 1.26 %
Inception 8.10 % 8.12 % -0.02 %

18This material has been prepared for the exclusive use of
SDCERS in a one-on-one presentation only.
RISKS
19
This material has been prepared for the exclusive use of SDCERS in a one-on-one presentation only.
Performance ReviewThird Quarter 2016 -
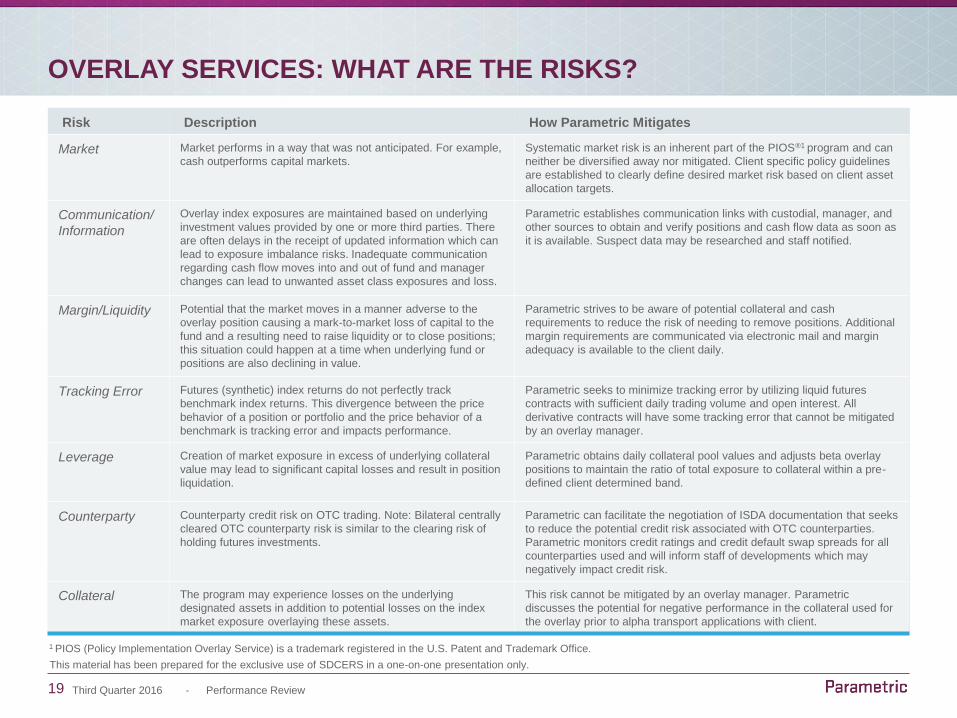
OVERLAY SERVICES: WHAT ARE THE RISKS?
1 PIOS (Policy Implementation Overlay Service) is a trademark registered in the U.S. Patent and Trademark Office.
Risk Description How Parametric Mitigates
Market Market performs in a way that was not anticipated. For example,
cash outperforms capital markets.
Systematic market risk is an inherent part of the PIOS®1 program and can
neither be diversified away nor mitigated. Client specific policy guidelines
are established to clearly define desired market risk based on client asset
allocation targets.
Communication/
Information
Overlay index exposures are maintained based on underlying
investment values provided by one or more third parties. There
are often delays in the receipt of updated information which can
lead to exposure imbalance risks. Inadequate communication
regarding cash flow moves into and out of fund and manager
changes can lead to unwanted asset class exposures and loss.
Parametric establishes communication links with custodial, manager, and
other sources to obtain and verify positions and cash flow data as soon as
it is available. Suspect data may be researched and staff notified.
Margin/Liquidity Potential that the market moves in a manner adverse to the
overlay position causing a mark-to-market loss of capital to the
fund and a resulting need to raise liquidity or to close positions;
this situation could happen at a time when underlying fund or
positions are also declining in value.
Parametric strives to be aware of potential collateral and cash
requirements to reduce the risk of needing to remove positions. Additional
margin requirements are communicated via electronic mail and margin
adequacy is available to the client daily.
Tracking Error Futures (synthetic) index returns do not perfectly track
benchmark index returns. This divergence between the price
behavior of a position or portfolio and the price behavior of a
benchmark is tracking error and impacts performance.
Parametric seeks to minimize tracking error by utilizing liquid futures
contracts with sufficient daily trading volume and open interest. All
derivative contracts will have some tracking error that cannot be mitigated
by an overlay manager.
Leverage Creation of market exposure in excess of underlying collateral
value may lead to significant capital losses and result in position
liquidation.
Parametric obtains daily collateral pool values and adjusts beta overlay
positions to maintain the ratio of total exposure to collateral within a pre-
defined client determined band.
Counterparty Counterparty credit risk on OTC trading. Note: Bilateral centrally
cleared OTC counterparty risk is similar to the clearing risk of
holding futures investments.
Parametric can facilitate the negotiation of ISDA documentation that seeks
to reduce the potential credit risk associated with OTC counterparties.
Parametric monitors credit ratings and credit default swap spreads for all
counterparties used and will inform staff of developments which may
negatively impact credit risk.
Collateral The program may experience losses on the underlying
designated assets in addition to potential losses on the index
market exposure overlaying these assets.
This risk cannot be mitigated by an overlay manager. Parametric
discusses the potential for negative performance in the collateral used for
the overlay prior to alpha transport applications with client.
20This material has been prepared for the exclusive use of
SDCERS in a one-on-one presentation only.
APPENDICES
21
This material has been prepared for the exclusive use of SDCERS in a one-on-one presentation only.
Performance ReviewThird Quarter 2016 -
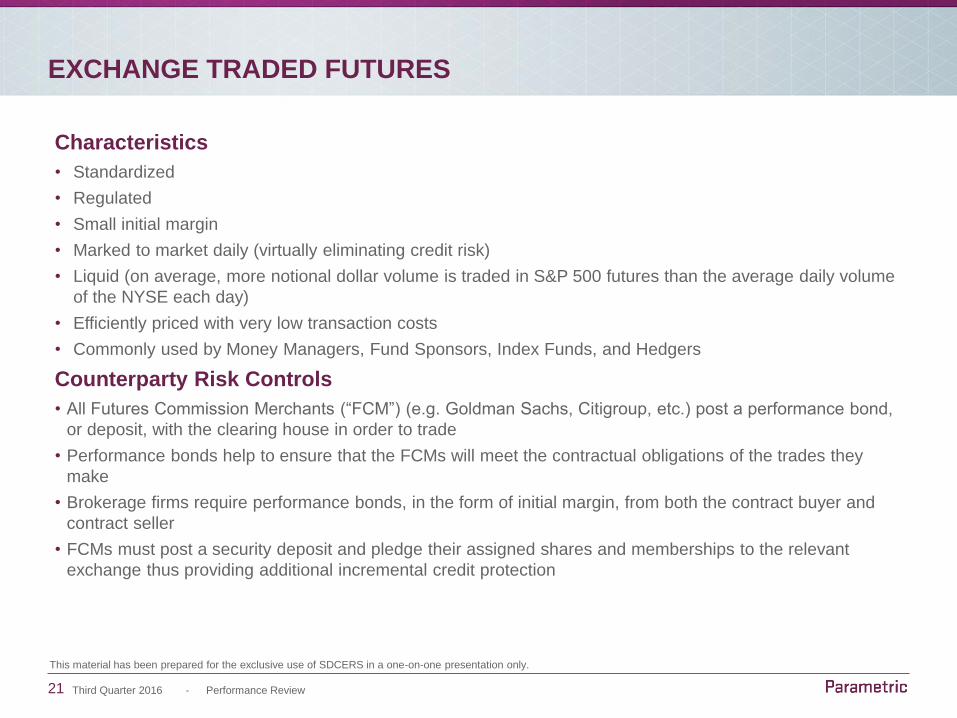
EXCHANGE TRADED FUTURES
Characteristics
• Standardized
• Regulated
• Small initial margin
• Marked to market daily (virtually eliminating credit risk)
• Liquid (on average, more notional dollar volume is traded in S&P 500 futures than the average daily volume
of the NYSE each day)
• Efficiently priced with very low transaction costs
• Commonly used by Money Managers, Fund Sponsors, Index Funds, and Hedgers
Counterparty Risk Controls
• All Futures Commission Merchants (“FCM”) (e.g. Goldman Sachs, Citigroup, etc.) post a performance bond,
or deposit, with the clearing house in order to trade
• Performance bonds help to ensure that the FCMs will meet the contractual obligations of the trades they
make
• Brokerage firms require performance bonds, in the form of initial margin, from both the contract buyer and
contract seller
• FCMs must post a security deposit and pledge their assigned shares and memberships to the relevant
exchange thus providing additional incremental credit protection
22
This material has been prepared for the exclusive use of SDCERS in a one-on-one presentation only.
Performance ReviewThird Quarter 2016 -
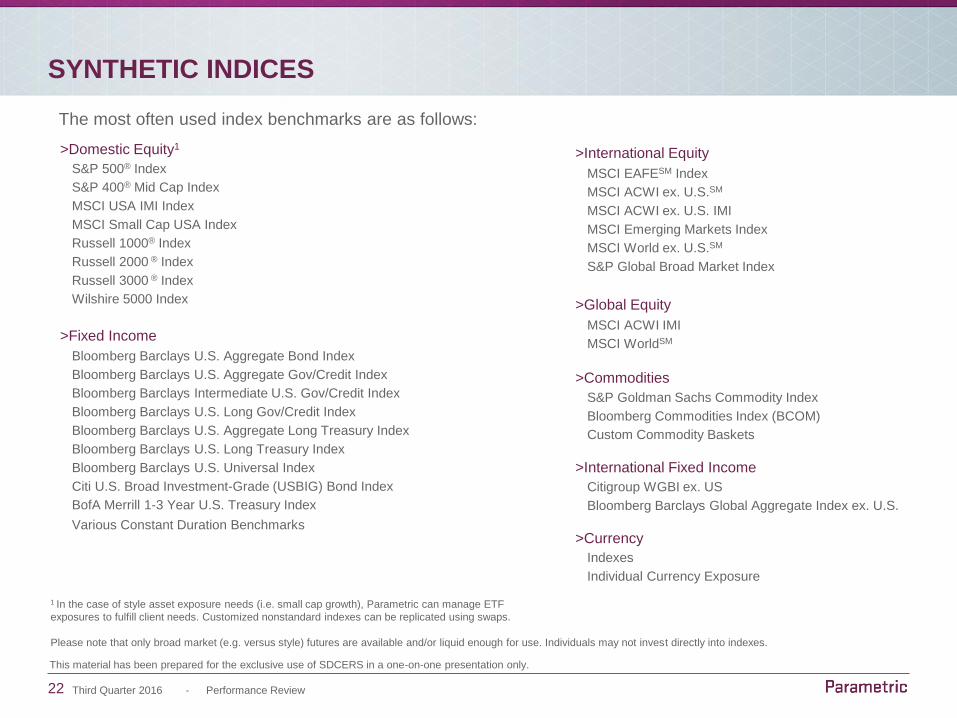
SYNTHETIC INDICES
1 In the case of style asset exposure needs (i.e. small cap growth), Parametric can manage ETF
exposures to fulfill client needs. Customized nonstandard indexes can be replicated using swaps.
Please note that only broad market (e.g. versus style) futures are available and/or liquid enough for use. Individuals may not invest directly into indexes.
>Domestic Equity1
S&P 500® Index
S&P 400® Mid Cap Index
MSCI USA IMI Index
MSCI Small Cap USA Index
Russell 1000® Index
Russell 2000 ® Index
Russell 3000 ® Index
Wilshire 5000 Index
>Fixed Income
Bloomberg Barclays U.S. Aggregate Bond Index
Bloomberg Barclays U.S. Aggregate Gov/Credit Index
Bloomberg Barclays Intermediate U.S. Gov/Credit Index
Bloomberg Barclays U.S. Long Gov/Credit Index
Bloomberg Barclays U.S. Aggregate Long Treasury Index
Bloomberg Barclays U.S. Long Treasury Index
Bloomberg Barclays U.S. Universal Index
Citi U.S. Broad Investment-Grade (USBIG) Bond Index
BofA Merrill 1-3 Year U.S. Treasury Index
Various Constant Duration Benchmarks
>International Equity
MSCI EAFESM Index
MSCI ACWI ex. U.S.SM
MSCI ACWI ex. U.S. IMI
MSCI Emerging Markets Index
MSCI World ex. U.S.SM
S&P Global Broad Market Index
>Global Equity
MSCI ACWI IMI
MSCI WorldSM
>Commodities
S&P Goldman Sachs Commodity Index
Bloomberg Commodities Index (BCOM)
Custom Commodity Baskets
>International Fixed Income
Citigroup WGBI ex. US
Bloomberg Barclays Global Aggregate Index ex. U.S.
>Currency
Indexes
Individual Currency Exposure
The most often used index benchmarks are as follows:
23
This material has been prepared for the exclusive use of SDCERS in a one-on-one presentation only.
Performance ReviewThird Quarter 2016 -
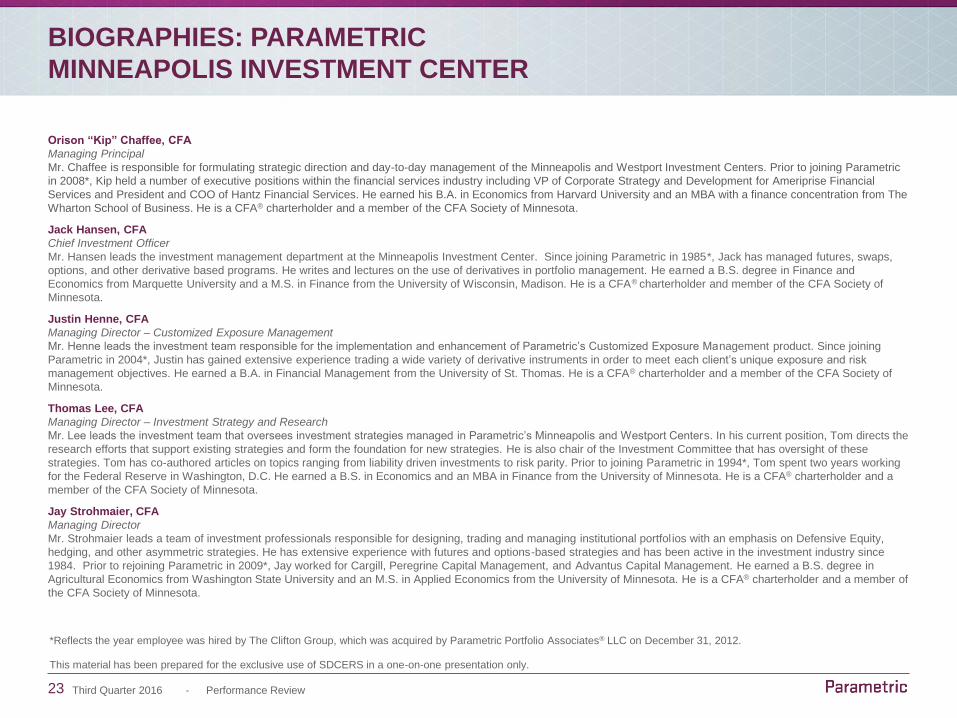
BIOGRAPHIES: PARAMETRIC
MINNEAPOLIS INVESTMENT CENTER
Orison “Kip” Chaffee, CFA
Managing Principal
Mr. Chaffee is responsible for formulating strategic direction and day-to-day management of the Minneapolis and Westport Investment Centers. Prior to joining Parametric
in 2008*, Kip held a number of executive positions within the financial services industry including VP of Corporate Strategy and Development for Ameriprise Financial
Services and President and COO of Hantz Financial Services. He earned his B.A. in Economics from Harvard University and an MBA with a finance concentration from The
Wharton School of Business. He is a CFA® charterholder and a member of the CFA Society of Minnesota.
Jack Hansen, CFA
Chief Investment Officer
Mr. Hansen leads the investment management department at the Minneapolis Investment Center. Since joining Parametric in 1985*, Jack has managed futures, swaps,
options, and other derivative based programs. He writes and lectures on the use of derivatives in portfolio management. He earned a B.S. degree in Finance and
Economics from Marquette University and a M.S. in Finance from the University of Wisconsin, Madison. He is a CFA® charterholder and member of the CFA Society of
Minnesota.
Justin Henne, CFA
Managing Director – Customized Exposure Management
Mr. Henne leads the investment team responsible for the implementation and enhancement of Parametric’s Customized Exposure Management product. Since joining
Parametric in 2004*, Justin has gained extensive experience trading a wide variety of derivative instruments in order to meet each client’s unique exposure and risk
management objectives. He earned a B.A. in Financial Management from the University of St. Thomas. He is a CFA® charterholder and a member of the CFA Society of
Minnesota.
Thomas Lee, CFA
Managing Director – Investment Strategy and Research
Mr. Lee leads the investment team that oversees investment strategies managed in Parametric’s Minneapolis and Westport Centers. In his current position, Tom directs the
research efforts that support existing strategies and form the foundation for new strategies. He is also chair of the Investment Committee that has oversight of these
strategies. Tom has co-authored articles on topics ranging from liability driven investments to risk parity. Prior to joining Parametric in 1994*, Tom spent two years working
for the Federal Reserve in Washington, D.C. He earned a B.S. in Economics and an MBA in Finance from the University of Minnesota. He is a CFA® charterholder and a
member of the CFA Society of Minnesota.
Jay Strohmaier, CFA
Managing Director
Mr. Strohmaier leads a team of investment professionals responsible for designing, trading and managing institutional portfol ios with an emphasis on Defensive Equity,
hedging, and other asymmetric strategies. He has extensive experience with futures and options-based strategies and has been active in the investment industry since
1984. Prior to rejoining Parametric in 2009*, Jay worked for Cargill, Peregrine Capital Management, and Advantus Capital Management. He earned a B.S. degree in
Agricultural Economics from Washington State University and an M.S. in Applied Economics from the University of Minnesota. He is a CFA® charterholder and a member of
the CFA Society of Minnesota.
*Reflects the year employee was hired by The Clifton Group, which was acquired by Parametric Portfolio Associates® LLC on December 31, 2012.
24
This material has been prepared for the exclusive use of SDCERS in a one-on-one presentation only.
Performance ReviewThird Quarter 2016 -
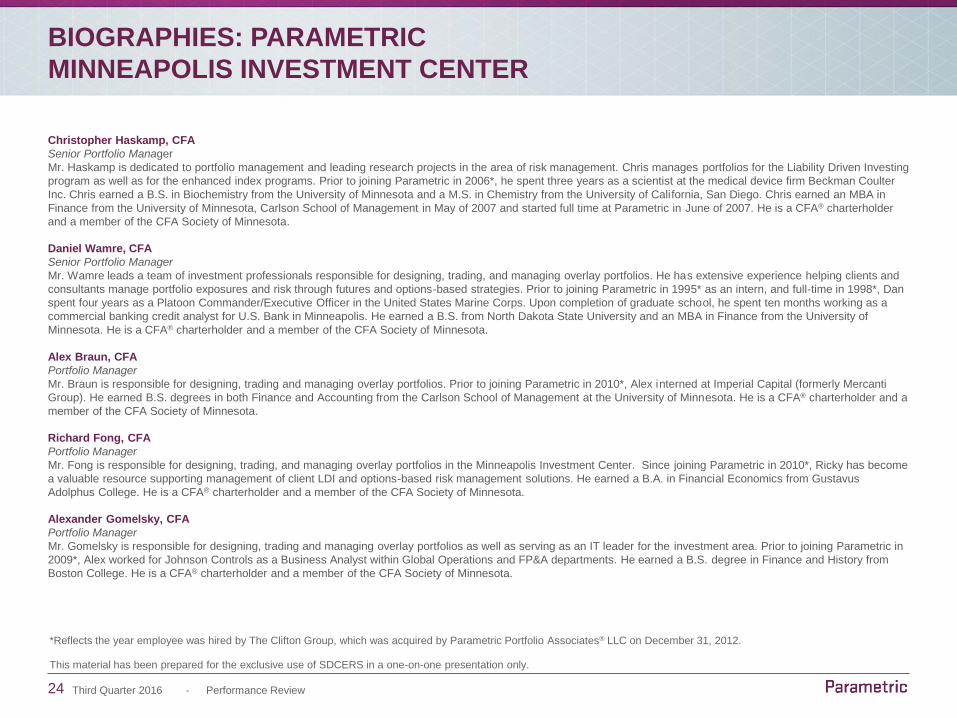
BIOGRAPHIES: PARAMETRIC
MINNEAPOLIS INVESTMENT CENTER
Christopher Haskamp, CFA
Senior Portfolio Manager
Mr. Haskamp is dedicated to portfolio management and leading research projects in the area of risk management. Chris manages portfolios for the Liability Driven Investing
program as well as for the enhanced index programs. Prior to joining Parametric in 2006*, he spent three years as a scientist at the medical device firm Beckman Coulter
Inc. Chris earned a B.S. in Biochemistry from the University of Minnesota and a M.S. in Chemistry from the University of California, San Diego. Chris earned an MBA in
Finance from the University of Minnesota, Carlson School of Management in May of 2007 and started full time at Parametric in June of 2007. He is a CFA® charterholder
and a member of the CFA Society of Minnesota.
Daniel Wamre, CFA
Senior Portfolio Manager
Mr. Wamre leads a team of investment professionals responsible for designing, trading, and managing overlay portfolios. He has extensive experience helping clients and
consultants manage portfolio exposures and risk through futures and options-based strategies. Prior to joining Parametric in 1995* as an intern, and full-time in 1998*, Dan
spent four years as a Platoon Commander/Executive Officer in the United States Marine Corps. Upon completion of graduate school, he spent ten months working as a
commercial banking credit analyst for U.S. Bank in Minneapolis. He earned a B.S. from North Dakota State University and an MBA in Finance from the University of
Minnesota. He is a CFA® charterholder and a member of the CFA Society of Minnesota.
Alex Braun, CFA
Portfolio Manager
Mr. Braun is responsible for designing, trading and managing overlay portfolios. Prior to joining Parametric in 2010*, Alex interned at Imperial Capital (formerly Mercanti
Group). He earned B.S. degrees in both Finance and Accounting from the Carlson School of Management at the University of Minnesota. He is a CFA® charterholder and a
member of the CFA Society of Minnesota.
Richard Fong, CFA
Portfolio Manager
Mr. Fong is responsible for designing, trading, and managing overlay portfolios in the Minneapolis Investment Center. Since joining Parametric in 2010*, Ricky has become
a valuable resource supporting management of client LDI and options-based risk management solutions. He earned a B.A. in Financial Economics from Gustavus
Adolphus College. He is a CFA® charterholder and a member of the CFA Society of Minnesota.
Alexander Gomelsky, CFA
Portfolio Manager
Mr. Gomelsky is responsible for designing, trading and managing overlay portfolios as well as serving as an IT leader for the investment area. Prior to joining Parametric in
2009*, Alex worked for Johnson Controls as a Business Analyst within Global Operations and FP&A departments. He earned a B.S. degree in Finance and History from
Boston College. He is a CFA® charterholder and a member of the CFA Society of Minnesota.
*Reflects the year employee was hired by The Clifton Group, which was acquired by Parametric Portfolio Associates® LLC on December 31, 2012.
25
This material has been prepared for the exclusive use of SDCERS in a one-on-one presentation only.
Performance ReviewThird Quarter 2016 -
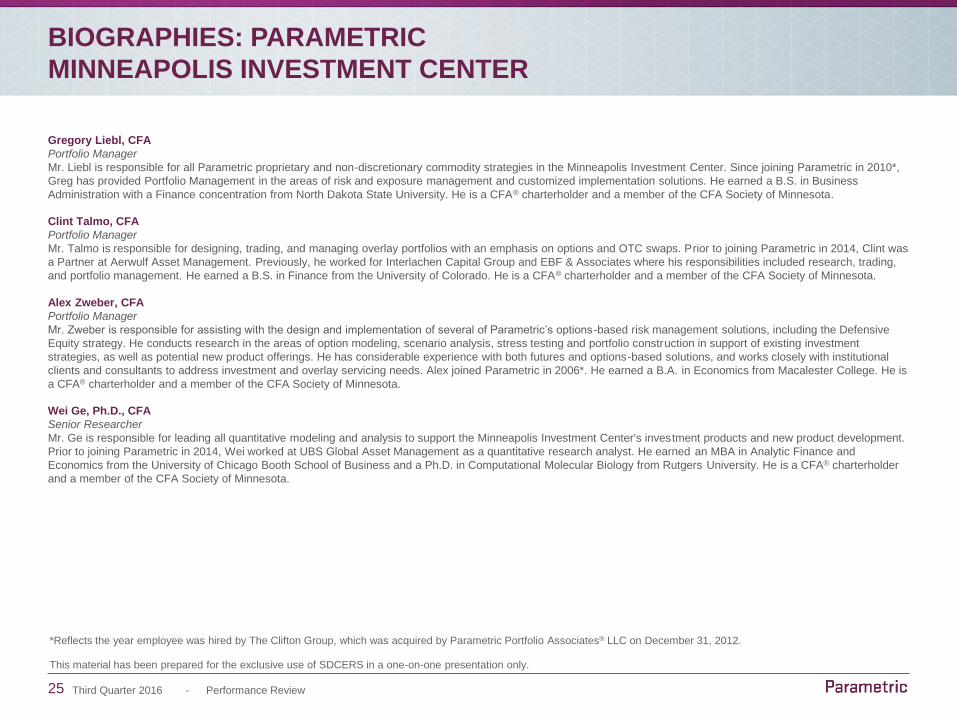
BIOGRAPHIES: PARAMETRIC
MINNEAPOLIS INVESTMENT CENTER
Gregory Liebl, CFA
Portfolio Manager
Mr. Liebl is responsible for all Parametric proprietary and non-discretionary commodity strategies in the Minneapolis Investment Center. Since joining Parametric in 2010*,
Greg has provided Portfolio Management in the areas of risk and exposure management and customized implementation solutions. He earned a B.S. in Business
Administration with a Finance concentration from North Dakota State University. He is a CFA® charterholder and a member of the CFA Society of Minnesota.
Clint Talmo, CFA
Portfolio Manager
Mr. Talmo is responsible for designing, trading, and managing overlay portfolios with an emphasis on options and OTC swaps. Prior to joining Parametric in 2014, Clint was
a Partner at Aerwulf Asset Management. Previously, he worked for Interlachen Capital Group and EBF & Associates where his responsibilities included research, trading,
and portfolio management. He earned a B.S. in Finance from the University of Colorado. He is a CFA® charterholder and a member of the CFA Society of Minnesota.
Alex Zweber, CFA
Portfolio Manager
Mr. Zweber is responsible for assisting with the design and implementation of several of Parametric’s options-based risk management solutions, including the Defensive
Equity strategy. He conducts research in the areas of option modeling, scenario analysis, stress testing and portfolio construction in support of existing investment
strategies, as well as potential new product offerings. He has considerable experience with both futures and options-based solutions, and works closely with institutional
clients and consultants to address investment and overlay servicing needs. Alex joined Parametric in 2006*. He earned a B.A. in Economics from Macalester College. He is
a CFA® charterholder and a member of the CFA Society of Minnesota.
Wei Ge, Ph.D., CFA
Senior Researcher
Mr. Ge is responsible for leading all quantitative modeling and analysis to support the Minneapolis Investment Center's investment products and new product development.
Prior to joining Parametric in 2014, Wei worked at UBS Global Asset Management as a quantitative research analyst. He earned an MBA in Analytic Finance and
Economics from the University of Chicago Booth School of Business and a Ph.D. in Computational Molecular Biology from Rutgers University. He is a CFA® charterholder
and a member of the CFA Society of Minnesota.
*Reflects the year employee was hired by The Clifton Group, which was acquired by Parametric Portfolio Associates® LLC on December 31, 2012.
26
This material has been prepared for the exclusive use of SDCERS in a one-on-one presentation only.
Performance ReviewThird Quarter 2016 -
BIOGRAPHIES: PARAMETRIC
INSTITUTIONAL INVESTMENT SOLUTIONS
Ben Lazarus, CFA
Senior Director – Institutional Relationships – Western North America
Mr. Lazarus joined the firm in 2004*. He is responsible for developing, coordinating, and executing the business development and client services plan for Parametric unique
family of products with emphasis on the Western region of the United States and Canada. In addition, Ben works on developing and managing new partnerships for
Parametric and has presented on the use of derivatives at different industry events. From 2015 to 2016, he was the Senior Vice President of US Sales at Nuveen
Investments in Minneapolis, Minnesota. Ben earned a B.A. in Psychology from the University of California, San Diego and an MBA in Marketing and Strategic Management
from the University of Minnesota. He is a CFA® charterholder and a member of the CFA Society of Minnesota.
Gregory Baranivsky, CFA
Director – Institutional Relationships – Central North America
Mr. Baranivsky is responsible for developing, coordinating, and executing the sales and marketing strategies for Parametric’s unique family of products in the Central sales
territory. Prior to joining Parametric in 2010*, Greg spent 12 years at First American Funds/FAF Advisors (now Nuveen Asset Management) in various sales, national
accounts, and product management leadership roles. Prior to First American Funds/FAF Advisors, Greg worked for Van Kampen Investments (now Invesco) within its
product management group. He earned a B.A. from Benedictine University and an MBA from the Illinois Institute of Technology. He is a CFA® charterholder, is a member of
the CFA Institute and the CFA Society of Minnesota where he previously served as a member of its board of directors.
Gregory Bauer, CFA, CAIA
Director – Institutional Relationships – Southeastern North America
Mr. Bauer is responsible for developing, coordinating, and executing the sales and marketing strategies for Parametric’s unique family of products in the Southeast region
of the United States. Prior to joining Parametric in 2015, Greg worked at Crawford Investment Counsel where he was the Director of Institutional Services, responsible for
leading the institutional sales and consultant relations efforts. Prior to Crawford, Greg worked for both Callan Associates and NEPC. Greg earned a B.A. from Brown
University and an MBA from the Georgia Institute of Technology. Greg is a CFA® charterholder and a member of the CFA Society of Atlanta. He also holds a CAIA
designation.
Christopher Uhas, CFA
Director – Institutional Relationships – Eastern North America
Mr. Uhas joined Parametric in 2007* and is responsible for developing, coordinating, and executing sales and marketing strategies for Parametric’s products in the Eastern
region of the United States and Canada. Before entering the investment management industry, he was the Director of New Product Launch for Seagate Technology, based
in Singapore, and also served for five years as a nuclear-trained submarine officer in the United States Navy. He earned a B.S. in Electrical Engineering from the University
of Notre Dame, and an MBA from the University of Chicago Booth School of Business. He is a CFA® charterholder and a member of the CFA Society of Minnesota.
Brendan MacKenzie, CFA
Associate Director – Institutional Relationships – Eastern North America
Mr. MacKenzie is responsible for developing, coordinating, and executing sales and marketing strategies for Parametric’s products in the Northeast. Prior to joining
Parametric in 2016, Brendan worked in a Business Development role on the Defined Contribution & Sub-Advisory Services Team at Eaton Vance. He earned a B.S. from
the University of Vermont and an MBA from the Carroll Graduate School of Management at Boston College. He is a CFA® charterholder and a member of the Boston
Security Analysts Society.
*Reflects the year employee was hired by The Clifton Group, which was acquired by Parametric Portfolio Associates® LLC on December 31, 2012.
27
This material has been prepared for the exclusive use of SDCERS in a one-on-one presentation only.
Performance ReviewThird Quarter 2016 -
BIOGRAPHIES: PARAMETRIC
INSTITUTIONAL INVESTMENT SOLUTIONS
Julianne Williams
Associate Director – Institutional Relationships – Western North America
Ms. Williams is responsible for building institutional relationships in the Western region of the United States. Prior to joining Parametric in 2015, Julie worked at Russell
Investments as the Director of Client Service. She managed a global client service organization and oversaw more than 1,000 client relationships. She earned a B.A. in
Political Science and Economics from Pacific Lutheran University.
Michi McDonough, CFA, CAIA
Managing Director – Consultant Relations
Ms. McDonough is responsible for the direct oversight of our consultant relations effort across North America and for the coordination of Parametric’s consultant relations
efforts globally. She is also responsible for developing and maintaining relationships within the institutional investment consultant community. Prior to joining Parametric in
2013, Michi was Vice President and Consultant Relations Manager at Wellington Management. She earned a B.A. in Economics from Emory University and an MBA,
magna cum laude, from Babson College. She is a CFA® charterholder and a member of the CFA Society of Boston and holds a CAIA designation.
Christopher Wisdom, CFA
Director – Consultant Relations
Mr. Wisdom is responsible for developing and maintaining relationships within the institutional investment consultant community. He serves as a key contact for consultant
inquiries and coordinates new business opportunities, working in conjunction with the Sales and Portfolio Management teams. Prior to joining Parametric in 2013, Chris
held various roles at Dimensional Fund Advisors, MSCI, and Towers Watson. He earned a B.A. in Mathematics and Statistics from the University of Windsor. He is a CFA®
charterholder and a member of the CFA Society of San Diego.
William Busch
Associate Director – Consultant Relations
Mr. Busch is responsible for developing and maintaining relationships within the institutional investment consultant community. Prior to joining Parametric in 2015, Bill held
positions at State Street Global Advisors in Consultant Relations and as a Product Analyst. Bill earned a B. A. in Sociology and Spanish from Bowdoin College, and an MBA
from the Carroll School of Management at Boston College.
Daniel Ryan
Managing Director – Client Relationship Management
Mr. Ryan is responsible for the direct oversight of our U.S. institutional client servicing efforts. This includes managing and directing the day-to-day activities of our
relationship management team. Dan is also responsible for managing client relationships throughout the Western U.S. Prior to joining Parametric in 2013, Dan was Vice
President and Senior Relationship Manager at State Street Global Advisors. He earned a B.A. in History from the University of Michigan.
Jason Chalmers
Director – Client Relationship Management
Mr. Chalmers is based in Boston and is responsible for managing client relationships throughout the Eastern United States. Prior to joining Parametric in 2014, Jason was a
Vice President and Relationship Manager at Acadian Asset Management LLC. He earned a B.S., Economics, Northeastern University, and a M.S., Finance, Boston College
Carroll School of Management.
28
This material has been prepared for the exclusive use of SDCERS in a one-on-one presentation only.
Performance ReviewThird Quarter 2016 -
DISCLOSURE
Parametric, headquartered in Seattle, WA, is a leading global asset management firm, providing investment strategies and customized exposure management to institutions and
individual investors around the world. Parametric offers a variety of rules-based, risk-controlled investment strategies, including alpha-seeking equity, alternative and options
strategies, as well as implementation services, including customized equity, traditional overlay and centralized portfolio management. Parametric is a majority-owned subsidiary of
Eaton Vance Corp. and offers these capabilities through investment centers in Seattle, WA, Minneapolis, MN and Westport, CT (home to Parametric subsidiary Parametric Risk
Advisors LLC, an SEC-registered investment adviser).
Parametric is divided into two segments: Parametric Investment & Overlay Strategies and Parametric Custom Tax-Managed & Centralized Portfolio Management. For compliance with
the Global Investment Performance Standards (GIPS®), the Firm is defined and held out to the public as Parametric Investment & Overlay Strategies. Parametric Investment &
Overlay Strategies provides rules-based investment management services to institutional investors, individual clients and registered investment vehicles, including Engineered Alpha
Strategies, Specialty Index, and PIOS® (Policy Implementation Overlay Service). The Firm has complied with the GIPS standards retroactive to January 1, 2000.
This information is intended solely to report on investment strategies and opportunities identified by Parametric. Opinions and estimates offered constitute our judgment and are
subject to change without notice, as are statements of financial market trends, which are based on current market conditions. We believe the information provided here is reliable, but
do not warrant its accuracy or completeness. This material is not intended as an offer or solicitation for the purchase or sale of any financial instrument. Past performance does not
indicate future returns. The views and strategies described may not be suitable for all investors. Parametric does not provide legal, tax and/or accounting advice or services. Clients
should consult with their own tax or legal advisor prior to entering into any transaction or strategy described here.
Charts, graphs and other visual presentations and text information were derived from internal, proprietary, and/or service vendor technology sources and/or may have been extracted
from other firm data bases. As a result, the tabulation of certain reports may not precisely match other published data. Data may have originated from various sources including but
not limited to Bloomberg, MSCI/Barra, FactSet, and/or other systems and programs. Please refer to the specific service provider’s web site for complete details on all indices.
Parametric makes no representation or endorsement concerning the accuracy or propriety of information received from any other third party.
This presentation contains back-tested hypothetical and/or model performance data and may not be relied upon for investment decisions. This material may contain confidential
and/or proprietary information and/or assumptions and may only be relied on for this report. Detailed account inclusion/exclusion policies and back-tested data are available upon
request. Perspectives, opinions, and testing data may change without notice. Decisions and information were based on available research at the time and as data may contain back-
tested hypothetical results, returns may not be realized and specific action or lack of action is not known for certainty. No securities, sectors, industries, or other information mentioned
herein may be considered as an offer to purchase or sell a firm product or security. The information presented, including, but not limited to, objectives, allocations and portfolio
characteristics, is intended to provide a general example of the implementation of the strategy and does not represent the experience of any particular client. Actual client portfolio
holdings, performance, allocations and portfolio characteristics will vary for each client. Any positive comments regarding specific data may no longer be applicable and should not be
relied on for investment purposes.
Returns presented were generated using Parametric’s proprietary investment methodology as described in Parametric’s Form ADV Part 2A. Returns are unaudited, and may not
correspond to quarterly calculated performance for any other client account in the stated discipline. Returns are calculated in U.S. dollars using the internal rate of return, reflect the
reinvestment of dividends, interest, gains and other income, include transaction costs but exclude account and custodial services fees, and do not take individual investor tax
categories into consideration. After-tax estimates are a “best scenario” provision for illustrative purposes. Specific periods of returns are not meant to imply that the portfolio would
have been profitable had the client only invested in the market for this time period. All investments are subject to loss.
29
This material has been prepared for the exclusive use of SDCERS in a one-on-one presentation only.
Performance ReviewThird Quarter 2016 -
DISCLOSURE
Hypothetical performance results have many inherent limitations, some of which are described below. No representation is being made that any account will or is likely to achieve
profits or losses similar to those shown. In fact, there are frequently sharp differences between hypothetical performance results and the actual results subsequently achieved by any
particular trading program. One of the limitations of hypothetical performance results is that they are generally prepared with the benefit of hindsight. In addition, simulated trading
does not involve financial risk, and no simulated trading record can completely account for the impact of financial risk in actual trading. For example, the ability to withstand losses or
to adhere to a particular trading program in spite of trading losses are material points which can also adversely affect actual trading results. There are numerous other factors related
to the markets in general or to the implementation of any specific trading program which cannot be fully accounted for in the preparation of hypothetical performance results and all of
which can adversely affect actual trading results. Because there are no actual trading results to compare to the simulated performance results, clients should be particularly wary of
placing undue reliance on these simulated results.
Benchmark/index information provided is for illustrative purposes only. Investors cannot invest directly in an index. Returns for indexes are calculated gross of management fees.
Deviations from the benchmarks provided herein may include but are not limited to factors such as: the purchase of higher risk securities, over/under weighting specific sectors and
countries, limitations in market capitalization, company revenue sources, and/or client restrictions. Parametric’s proprietary investment process considers factors such as additional
guidelines, restrictions, weightings, allocations, market conditions and other investment characteristics. Thus returns may at times materially differ from the stated benchmark and/or
other disciplines and funds provided for comparison
All contents copyright 2016 Parametric Portfolio Associates® LLC. All rights reserved. Parametric Portfolio Associates®, PIOS®, and Parametric with the iris flower logo are all
trademarks registered in the US Patent and Trademark Office.
Parametric is headquartered at 1918 8th Avenue, Suite 3100, Seattle, WA 98101. Parametric’s Minneapolis investment center is located at 3600 Minnesota Drive, Suite 325,
Minneapolis, MN 55435. For more information regarding Parametric and its investment strategies, or to request a copy of Parametric’s Form ADV, please contact us at 206.694.5575
(Seattle) or 952.767.7700 (Minneapolis), or visit our website, www.parametricportfolio.com.