Embed Size (px)
Citation preview

resources
Article
Parameters of Sustainable Development: Case of ArcticLiquefied Natural Gas Projects
Alexey Cherepovitsyn * and Olga Evseeva
�����������������
Citation: Cherepovitsyn, A.; Evseeva, O.
Parameters of Sustainable Development:
Case of Arctic Liquefied Natural Gas
Projects. Resources 2021, 10, 1. https://
dx.doi.org/10.3390/resources10010001
Received: 20 October 2020
Accepted: 17 December 2020
Published: 23 December 2020
Publisher’s Note: MDPI stays neu-
tral with regard to jurisdictional claims
in published maps and institutional
affiliations.
Copyright: © 2020 by the authors. Li-
censee MDPI, Basel, Switzerland. This
article is an open access article distributed
under the terms and conditions of the
Creative Commons Attribution (CC BY)
license (https://creativecommons.org/
licenses/by/4.0/).
Economics, Organization and Management Department, Saint-Petersburg Mining University, Vasilievsky Island,21 line 2, 199106 Saint-Petersburg, Russia; [email protected]* Correspondence: [email protected]; Tel.: +8-921-919-54-55
Abstract: Effective management of the social and economic development of the Arctic zone of theRussian Federation is today a significant scientific and practical task. It requires an integratedapproach to meet the expectations of the state, business and society. The main drivers of growthfor remote Arctic territories are large investment projects, which not only create production andsectorial results, but also stimulate the development of related sectors of the economy. Additionally,they contribute to the formation of modern infrastructure in the region and create conditions for thebroad introduction of innovative technologies. The current problem with territorial developmentstrategic planning is the assessment of the results that have been achieved. This includes approvedlists of indicators that do not allow for a full assessment of the impact of the implemented projects.Assessment on the achievement of the region goals is also murky. This indicates a lack of consistencyin regional development management. This article defines the importance of the indicators foran assessment of sustainable development management. The model of achieving external effectsin project activities is described. The concept of sustainability of large-capacity complexes for theproduction of liquefied natural gas (LNG) is also formulated. Based on the needs of micro- andmacro-environment projects, a list of indicators for assessing the sustainability of LNG projects hasbeen proposed. On the basis of the proposed indicator list, a sustainability analysis of three ArcticLNG projects was carried out. Based on the example of LNG production, it was concluded thatapproaches to assessing the sustainable socio-economic development of the Arctic region and itsindustrial systems are interrelated, but there are differences between them.
Keywords: sustainability; sustainable development; socio-economic development of the northernterritories; innovation; projects; Arctic; liquefied natural gas
1. Introduction
The implementation of Russian strategic goals in the field of geopolitics, the economicdevelopment of Northern territories and a surge in hydrocarbon and other mineral rawmaterials production today is closely related to the development of the Arctic. The Arcticregion has enormous energy and mineral resources concentrated in large and uniquedeposits [1,2]. Experts estimate that 20–25% of the world hydrocarbon resources arelocated in the Russian Arctic zone and today about 80% of gas and 60% of oil from thetotal production of the country are produced there [3,4]. The Arctic mining complex isrepresented by deposits of iron, apatite, phosphorus, titanium, tungsten, copper, nickel,antimony, mercury, cobalt, gold, silver, platinum, rare metals and rare-earth elements [5,6].
The resource potential of the Russian Arctic is a national priority. The implementationof Arctic commodity projects will allow for the launch of innovative processes aimed attesting unique technological solutions and developing organizational and project manage-ment tools [7,8]. Among the most important tasks of Arctic hydrocarbon projects is thesocio-economic development of northern territories, extended reproduction, and effectiveuse of mineral and raw materials resources. Furthermore, the technological development of
Resources 2021, 10, 1. https://dx.doi.org/10.3390/resources10010001 https://www.mdpi.com/journal/resources

Resources 2021, 10, 1 2 of 27
industrial systems, ensuring the sustainability of natural ecosystems, and ensuring energyand national security of the country as a whole, are significant goals [9].
There are serious challenges and requirements for the implementation of oil andgas projects in the coordinated system, especially the area of region-industrial systems-ecology [10,11]. Often, promising areas for oil and gas production are removed from pointsof consumption. In this case, the lack of transport and industrial infrastructure may delaymaking investment decisions on projects. In addition, such areas may be located in theterritories of indigenous peoples. There is a small degree of geological exploration ofexisting deposits, which increases the risk for new projects. Difficult operational conditionsrequire the introduction of advanced technological solutions [12]. It is also expedient toconsider the environmental factor since the activities of oil and gas companies have asignificant impact on the environment, including the fact that new projects should leave alow carbon footprint [13–15]. The existing institutional environment must also be optimizedand must contribute to the intensification of investment activities in the region. Legislativeinitiatives need to be supported by long-term strategic planning that reflects an effectiveset of measures for the development of businesses, social environments, integration aspectsand environmental balance mechanisms [16].
The long-term goals of the state on the development of the Arctic are connected withthe creation of large-scale transport and logistics, power, information and communicationsystems, safety and environmental protection complexes. There is a need to develop socialinfrastructure facilities, stimulate R&D and increase demand for domestic technologiesand equipment. It is expected to increase the geological study of the subsurface and in-crease the production of Arctic raw materials [17]. The indicated effects are planned to beobtained through the implementation of large investment projects, including the use ofpublic-private partnership mechanisms. In this regard, sustainable regional developmentrequires project participants to not only accumulate productive and financial resources, butalso to take a specific approach. This approach allows for the development of industrialand infrastructural mineral-raw-material systems in conditions of high instability in en-ergy markets and the objective complexity of solving technological and socio-economicproblems [18,19].
An important element of effective regional development management is indicativeplanning and monitoring aimed at quantitative measurement and control of target results.It is obvious that the relationship of new investment projects with regional goals, whichhas been repeatedly noted in strategic planning documents, requires an appropriate list ofindicators. These indicators take into account not only the technological characteristics ofindustrial development, but also the impact on the regional economy, population, and thestate of the environment. It is noted that the idea of sustainable development is acquiringparticular relevance in the Arctic [20].
One of the main directions of the Russian Arctic fuel and energy complex develop-ment is the implementation of liquefied natural gas (LNG) projects. The importance ofLNG production today is largely determined by the need to diversify Russian gas exportmarkets [21]. The implementation of large-scale Arctic LNG projects creates substantialopportunities for using the mineral resource potential of the region with a course forcomprehensive infrastructure development of remote Northern territories, inter-industryinteraction, ecological, innovative and technological development [22].
The feasibility of the development of the LNG industry in the Arctic is determined by anumber of factors. These factors include large gas reserves in the coastal zone, low averagetemperatures in the region, the relatively low cost of natural gas production, and a goodgeographical location relative to key markets. Combined, these variables determine thehigh competitiveness of Arctic LNG compared to the leading countries of the LNG market.
Currently, there is one large-capacity LNG plant operating in the Arctic region—YamalLNG. Two more LNG projects are planned for implementation: Arctic LNG-2 and Ob LNG.Their main characteristics are shown in Table 1.

Resources 2021, 10, 1 3 of 27
Table 1. Characteristics of Arctic LNG projects. Based on open data of operating companies. Budget efficiency is determinedon the basis of discounting tax revenues to the regional budget for the period of project implementation.
Yamal LNG Arctic LNG-2 Ob LNG
Capacity, million tons 17.5 19.8 4.8
Starting year of the 1st lines 2017 2023 2022
Number of production lines 4 3 3
Resource base The South-Tambeyskoye field Utrenneye fieldVerkhnetiuteyskoye andZapadno-Seyakhinskoye
fields
CAPEX, $ billion 27.5 21.3 5.7
Project participantNovatek, Total, China NationalPetroleum Corporation (CNPC),
Silk Road Fund (SRF)
Novatek, Total, CNPC, ChinaNational Offshore Oil
Corporation (CNOOC), JapanArctic LNG
Novatek
Regional infrastructureobjects that are driven by
the project
Sabetta seaport, Sabetta airport,shift settlement, mobile phone
tower networkUtrenniy terminal No data
Job creation 32,000 No data No data
Budget efficiency at theregional level, $ million 1228 1664 409
The experience of the Yamal LNG project has shown that its results not only show thebeginning of development of the South Tambey gas condensate field and an increase in theshare of Russian LNG in the global market, but also the creation of a major transport hubin the town of Sabetta, including a seaport and international airport, a shift settlement, afleet of gas tankers and icebreakers and the development of the first Russian liquefactiontechnology. Also, the contribution to the development of the Northern Sea Route isparamount [23]. The construction of communication lines has provided access to high-speed data transmission in several cities of the Far North, and the project has createda significant number of jobs. The functioning asset is a stable source of revenue to thefederal and regional budgets. According to experts of the SKOLKOVO Energy Center, thedevelopment of the LNG industry in the Arctic has already had a great synergistic effect inthe preparation of some projects in the field of coal, gold, non-ferrous and rare metal oreproduction, which indicates the impact of increasing the investment attractiveness of theregion especially for foreign investors [24].
Therefore, it can be concluded that the implementation of LNG projects has an impacton both the development of the region and the development of related industries throughthe formation of demand for related products and services, which indicates the presenceof pronounced external effects. Given the previously noted relationship between theresults of large-scale industrial projects and the development goals of the Arctic region,such effects need to be quantified and systematized, creating the possibility of managingtheir achievement.
The purpose of this study is to develop and test a list of sustainability indicatorsfor large-scale LNG production complexes in accordance with the needs of the regionand business interests. To achieve this goal, it is necessary to answer the following re-search questions:
(1) What is the value of a quantitative assessment of the results in sustainable develop-ment management and why is it needed for Arctic industrial systems?
(2) What is the concept of sustainability for LNG projects?(3) What is the potential of Arctic LNG projects to generate positive economic, social,
and environmental outcomes?
Resources 2021, 10, 1 4 of 27
(4) What should the sustainability indicators in a project approach be, and how will itdiffer from a corporate level assessment?
2. Theoretical Background for Defining the Concept of Project Sustainability
The term “sustainable development” became widely used after the “Our CommonFuture” report was presented by the Brundtland Commission [25]. The report provided aclassic definition of sustainable development, which refers to “a process of change in whichthe exploitation of resources, the direction of investments, the orientation of technologicaldevelopment, and institutional change are all in harmony and enhance both current andfuture potential to meet human needs and aspirations” [26].
Russia approved the “Concept of the Russian Federation’s Transition to SustainableDevelopment”, presenting its own vision of the idea of sustainable development. Accord-ing to the document, sustainable development means “stable socio-economic developmentthat does not destroy its natural basis”. The purpose of the gradual transition was deter-mined “to ensure in the long term, a balanced solution to the problems of socio-economicdevelopment and preservation of a favorable environment and natural resource potential,meeting the needs of present and future generations of people”.
Sustainable development is seen as a paradigm for thinking about the future, in whichenvironmental, social and economic aspects are balanced in an effort to improve the qualityof human life [27]. At the same time, the development itself testifies to a certain dynamicprocess. The term “sustainability” is used to describe the state of the system and its generaltarget vision [28].
The most common description of sustainability involves three interconnected pillars,encompassing economic, social and environmental factors [29]. The sustainability model inscholarly writing is often depicted through three intersecting circles: society, environmentand economy, with sustainability at the intersection of these spheres [30]. A similarrelationship underlies the idea of the Triple Bottom Line (TBL) proposed by John Elkingtonand is often identified with the acronym “3P” (People, Planet, Profit) [31,32].
The characteristics of the interpretation and approach to sustainability assessmentdepend on the level of economic activity within which the evaluation object is considered.The Schukina L.V. study suggested that the following levels of sustainable developmentshould be identified [33]:
- International (global)- National- Regional- Sectorial- Corporate
Despite the close relationship between the levels, each level has its own target trajec-tory of development. Sustainable development at the global level is focused on interna-tional partnerships to fight poverty and hunger, protect health and human rights, addressclimate change, preserve the biodiversity of the planet and its natural resources, preventhostilities and protect the world’s oceans [34].
At the national level, using the example of the Russian Federation, sustainable de-velopment involves ensuring national and environmental security, geopolitical interests,balanced development of economic sectors, resource availability, promotion of the well-being of the nation and realization of citizens’ rights.
The components of sustainable development at the regional level include the stablefunctioning of industrial complexes, socio-economic and ecological systems of individualentities, comprehensive improvement of territories and settlements, provision of housingand communal services. These components create an impact on the population, industry,social, energy and transport infrastructure, improvement of well-being and the quality oflocal people’s life, which ensures the preservation of culture and traditions [35].
Sustainable development of industry is determined by its competitiveness in domesticand foreign markets, innovation and technological potential, balanced functioning of
Resources 2021, 10, 1 5 of 27
production and economic units and their safety for the environment, efficiency of activityand the ability to provide necessary intra-industry proportions and connections [15,36].
Sustainable development at the level of economic entities (corporate level) includesthe creation of effective economic results while respecting the safety of production cycles,ensuring a high level of quality of produced products, minimization of a negative impacton the environment, development, social support and protection of workers’ rights, im-plementation of CSR programs and implementation of advanced resource managementpractices [37–39].
Consequently, sustainable development goals and targets are largely defined by keychallenges, opportunities, and constraints at each specific level. Sustainable developmentis closely linked to stakeholder theory, which is based on the principle of the harmonizationof interests and expectations of direct and indirect participants in relation to ongoingprocesses [40,41]. Sustainable development of global and local systems is the result of inter-action of the state, business and society in economic, social and environmental spheres [42].Table 2 shows the main expectations of each group of stakeholders in relation to the threeareas of sustainability.
Table 2. Challenges in social, ecology and economic spheres in the system of regional authorities –business-society.
State (Region) Business Society
Social sphere Ensuring humanitarian securityand social stability in the region. Human capital development. Universal access to quality
social services.
EcologyPreservation of a favorableenvironment, biodiversity,
reproduction of natural resources.
Rational use of resources,minimization of anthropogenic
impact on the environment.
Safe state of the environment andubiquitous access to natural
resources according to basic needs.
Economy
Achieving maximum welfare ofthe region’s population, stable
growth of the territory’s economy,integration and penetration intoother local and global markets.
Stable maintenance ofcompetitiveness, growth of
profit and capitalization.
Adequate standard of living(compared to the regional average
value and above) and minimizationof social differentiation.
An integral part of sustainable development is the sustainability assessment. Accord-ing to Kates et al., the assessment of sustainability focused on providing decision makersthe results of the analysis of global and local systems “nature-society” in the short andlong term to help them determine what actions should or should not be taken in tryingto make society more sustainable [43]. At the corporate level, sustainability indicators arealso used in decision-making in addition to non-financial reporting. C. Searcy clarifies thisapplication of assessment separately in board-level decision-making, corporate governanceand supply chain management [44]. The latter is especially relevant for the LNG industrywith a long value chain (gas production, gas liquefaction, LNG transportation, LNG regasi-fication), since the high total value of a product requires sufficient attention at every stageof its creation [45].
According to Wu & Wu, quantitative indicators clarify the meaning of sustainabledevelopment and allow for increasing the understanding of the complex interrelationshipsbetween the components of sustainability in practical terms, and thereby contribute to thedevelopment of science and practice of sustainable development [46]. When developing alist of sustainability indicators, it is necessary to specify which aspects of sustainability inthe existing concept should be measured, which of the previously aspects not yet consideredshould be added and how these properties should be related to each other.
Indicators arise from the content of value illustrated by the phrase “we measure whatwe are concerned about” and at the same time form that value, which is concurrentlyillustrated by the phrase “we are concerned about what we are measuring” [47]. Eachdeveloped indicator allows for the qualitative or quantitative evaluation of a specificcharacteristic of a system striving for sustainability. Grouped into independent lists, they
Resources 2021, 10, 1 6 of 27
reflect the totality of stakeholders’ interests and make it possible to assess progress inrealizing their expectations.
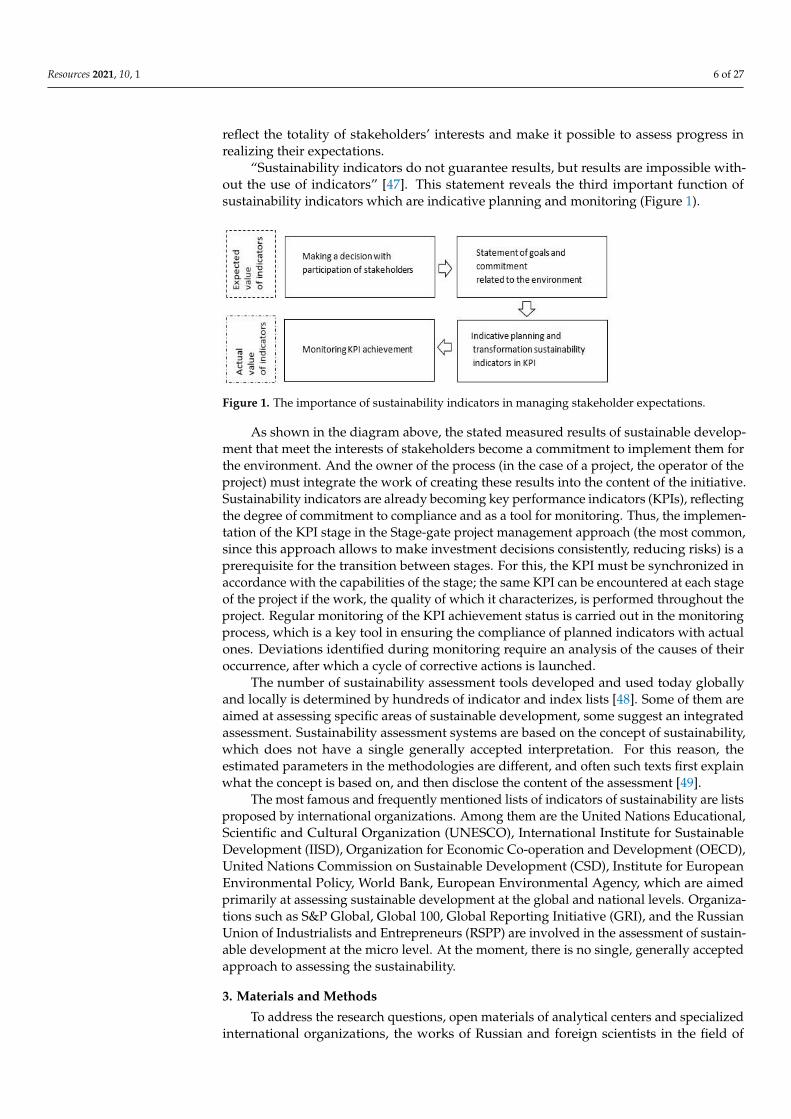
“Sustainability indicators do not guarantee results, but results are impossible with-out the use of indicators” [47]. This statement reveals the third important function ofsustainability indicators which are indicative planning and monitoring (Figure 1).
Figure 1. The importance of sustainability indicators in managing stakeholder expectations.
As shown in the diagram above, the stated measured results of sustainable develop-ment that meet the interests of stakeholders become a commitment to implement them forthe environment. And the owner of the process (in the case of a project, the operator of theproject) must integrate the work of creating these results into the content of the initiative.Sustainability indicators are already becoming key performance indicators (KPIs), reflectingthe degree of commitment to compliance and as a tool for monitoring. Thus, the implemen-tation of the KPI stage in the Stage-gate project management approach (the most common,since this approach allows to make investment decisions consistently, reducing risks) is aprerequisite for the transition between stages. For this, the KPI must be synchronized inaccordance with the capabilities of the stage; the same KPI can be encountered at each stageof the project if the work, the quality of which it characterizes, is performed throughout theproject. Regular monitoring of the KPI achievement status is carried out in the monitoringprocess, which is a key tool in ensuring the compliance of planned indicators with actualones. Deviations identified during monitoring require an analysis of the causes of theiroccurrence, after which a cycle of corrective actions is launched.
The number of sustainability assessment tools developed and used today globallyand locally is determined by hundreds of indicator and index lists [48]. Some of them areaimed at assessing specific areas of sustainable development, some suggest an integratedassessment. Sustainability assessment systems are based on the concept of sustainability,which does not have a single generally accepted interpretation. For this reason, theestimated parameters in the methodologies are different, and often such texts first explainwhat the concept is based on, and then disclose the content of the assessment [49].
The most famous and frequently mentioned lists of indicators of sustainability are listsproposed by international organizations. Among them are the United Nations Educational,Scientific and Cultural Organization (UNESCO), International Institute for SustainableDevelopment (IISD), Organization for Economic Co-operation and Development (OECD),United Nations Commission on Sustainable Development (CSD), Institute for EuropeanEnvironmental Policy, World Bank, European Environmental Agency, which are aimedprimarily at assessing sustainable development at the global and national levels. Organiza-tions such as S&P Global, Global 100, Global Reporting Initiative (GRI), and the RussianUnion of Industrialists and Entrepreneurs (RSPP) are involved in the assessment of sustain-able development at the micro level. At the moment, there is no single, generally acceptedapproach to assessing the sustainability.
3. Materials and Methods
To address the research questions, open materials of analytical centers and specializedinternational organizations, the works of Russian and foreign scientists in the field of
Resources 2021, 10, 1 7 of 27
project management theory, sustainable development, strategic management, as well asregulatory and methodological documentation on research issues were used. A complexapproach to the development of a list of sustainability indicators was provided by the use ofmethods of synthesis, analogy, grouping, comparison, as well as tools for strategic analysis,investment assessment and socio-economic forecasting, using the method of forward andbackward linkages. The content of the indicator list is based on the key principles ofsustainability assessment noted in the works of a researchers mentioned above.
The Arctic zone of the Russian Federation, which includes the territories of nineconstituent entities of the Russian Federation, has been allocated to a separate objectof state administration [50,51]. According to the state program titled “Socio-economicdevelopment of the Arctic zone of the Russian Federation”, it is planned to providea comprehensive solution of strategic tasks through the implementation of three Sub-Programs. These include the “formation of support development zones and ensuring theirfunctioning, creation of conditions for accelerated social and economic development ofthe Arctic zone of the Russian Federation”, “development of the Northern Sea Route andprovision of navigation in the Arctic”, and the “creation of equipment and technologiesof oil and gas and industrial engineering necessary for the development of mineral andraw materials resources of the Arctic zone of the Russian Federation”. The names ofsubprograms reveal the priority areas of development in the region, and the indicatorspresented in the document clarify the content of the target results.
It is assumed that the dynamics of a number of indicators may be influenced byindustrial complexes operating in the region. Thus, the intensification of productionactivities largely determines the improvement of macroeconomic indicators, as well as thegrowth of cargo turnover of the Northern Sea Route. Construction and modernizationof industrial systems contributes to the growth of indicators characterizing innovativeactivity. As a result, it is possible to assess the contribution of industrial complexes to thesocio-economic development of the region.
At the same time, each indicator list is aimed at a comprehensive assessment of theobject to which it relates. In view of this, the unification of indicators is incorrect and anindustrial project, even if it is focused on achieving regional goals, cannot be fully evaluatedby the list of regional development indicators. This makes it necessary to develop separatelist of indicators, taking into account the capabilities of projects and the interests of theirstakeholders.
It should be noted that the assessment of indicators can be done in different ways(Table 3) [52–55].
Based on the analysis, it can be concluded that the assessment tool depends on thepurpose of the analysis. The purpose of the analysis, in turn, can influence the list ofindicators used, i.e., different indicator systems can be used for different analysis purposes.Their consistency in this case is determined by order, integrity in terms of analyzed char-acteristics coverage, connection with the final goal of the assessment and the presence ofgeneral principles in terms of the approach to the assessment.
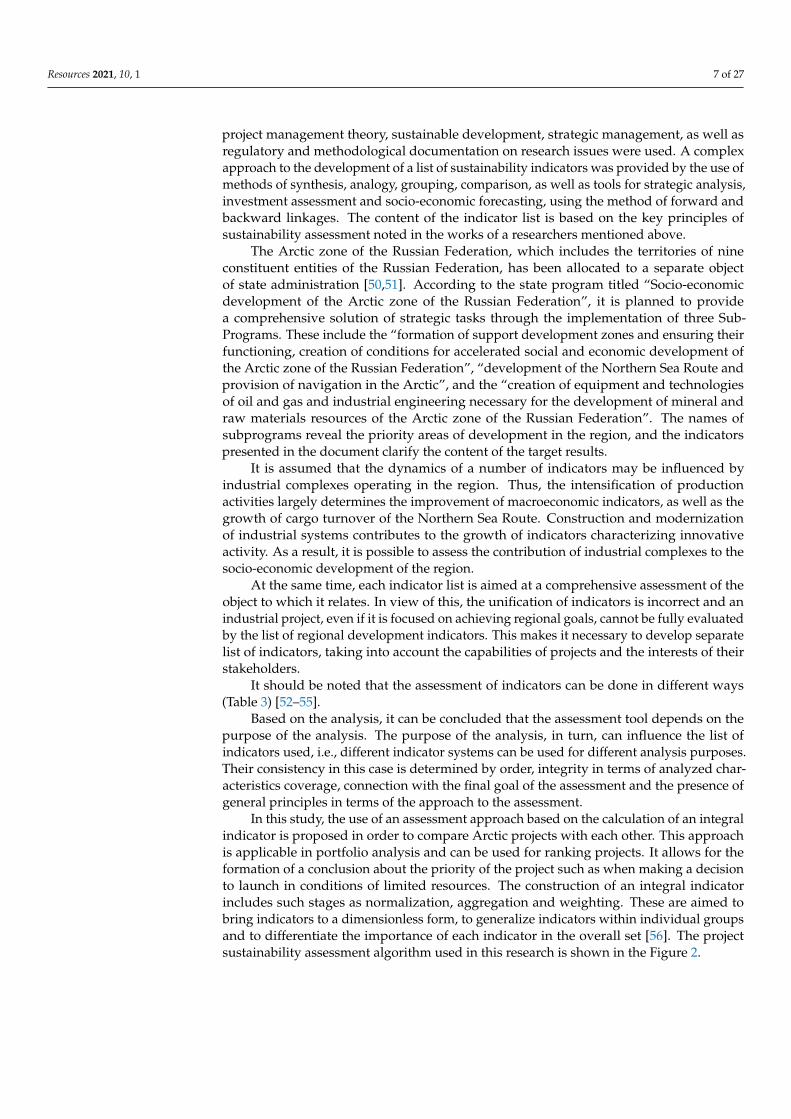
In this study, the use of an assessment approach based on the calculation of an integralindicator is proposed in order to compare Arctic projects with each other. This approachis applicable in portfolio analysis and can be used for ranking projects. It allows for theformation of a conclusion about the priority of the project such as when making a decisionto launch in conditions of limited resources. The construction of an integral indicatorincludes such stages as normalization, aggregation and weighting. These are aimed tobring indicators to a dimensionless form, to generalize indicators within individual groupsand to differentiate the importance of each indicator in the overall set [56]. The projectsustainability assessment algorithm used in this research is shown in the Figure 2.
Resources 2021, 10, 1 8 of 27
Table 3. Sustainability indicators assessment tools.
Tool Description Benefits Disadvantages
Qualitative indicatorsassessment
Description of the indicatorscontent without using quantitative
characteristics.
Not all the indicators can beevaluated; not every indicator
fully discloses its content innumerical terms.
Lack of objective indicatorscomparability.
Benchmarking
Evaluation of indicators indimension relative to the best
analogues (values from themaximum/minimum).
Unified dimension of valuesand their relativity, calculations
in terms of industry limits.
Need for the best practicescontinuous monitoring;
limited access to informationon each indicator.
Scoring Experts put points on variousindicators within a regulated scale.
Simplicity of the method anduniform dimension of values.
High subjectivity ofthe assessment.
The integralindicator calculation
All the values are reduced to asingle indicator. In most cases, thisis done using a system of weights
and normalization of values.
Allows to compare evaluationobjects with each other
comprehensively.
The subjectivity when settingthe weights.
Indicators quantifica-tion without integralindicator calculation
Evaluation of each indicator basedon quantitative values.
The objectivity of thecalculations.
Lack of consistency andconclusion about the most
sustainable project oran alternative.
Figure 2. The project sustainability assessment algorithm.
The project sustainability assessment process involves an analytical stage, duringwhich the potential for creating results is analyzed. Understanding current needs willallow to create maximum value for the environment, but it should be noted that the term“current needs” is dynamic, which means that the needs of the environment may change.This indicates a need for sustainable development management processes to functionthroughout the project, where sustainability indicators are reviewed and refined.
On this stage, special attention should be paid to approved strategies and programsthat determine the current needs in the state-business-society system, as well as approvedindicators for monitoring the implementation of these strategies and programs. Sources ofinformation about needs in the external environment can be information from the media,as well as the use of various communication methods such as communication sessions,meetings, forums, conferences, etc.
On the next stage, it is necessary to analyze possibilities of LNG projects in solvingurgent problems on regional, sectorial and national levels and compare them with the three-
Resources 2021, 10, 1 9 of 27
pillar conception of sustainability, structuring potential results in the fields of economy,social sphere and ecology.
The following stage involves forming a list of indicators. To do this, it is necessaryto offer a quantitative characteristic for each potentially created result that corresponds toa certain interest (with units of measurement) and have previously formed requirementsfor its content. The requirements for the content of indicators determine the consistencyof the list that they form. Furthermore, all the characteristics are grouped to reflect thecompleteness of the overall result assessment for each direction.
The next stage is weighting by spheres and groups. The individual areas of economy,ecology and social sphere may have an unequal number of indicators, and if not usingweights, the assessment of each area may be distorted. Weighting within groups has thesame goal. The philosophy of sustainable development is based on the principle of balanceand equal coverage of the results in the aforementioned three areas. The same logic shouldbe transposed to interest groups, which involves creating an alternative that providesmaximum coverage in each interest group and will be more sustainable. In addition,even in strategic documents, goals may overlap. Indicators for these goals will give ahigher value in total than for other goals. To avoid this, these indicators need to be alignedwithin groups. The weighting is based on the expert scores assigned for each indicator.
The final stage is to evaluate the project based on the developed list of indicators.Considering that each indicator has different scale and unit of measurement, it is neces-sary to use a normalization method aimed at reducing the indicators to a dimensionlessform [56]. Since the purpose of the evaluation is to compare projects based on the principleof best matching their results to the needs of the environment, it is proposed to use thenormalization method. In this case, each indicator correlates with a standard among alter-natives. The benchmark in this case is the best value of the indicator among the projectsunder consideration. It should be noted that the benchmark can be both the largest and thelowest value of the indicator, for which it is necessary to have previously determined theorientation of each indicator.
4. Results and Discussion
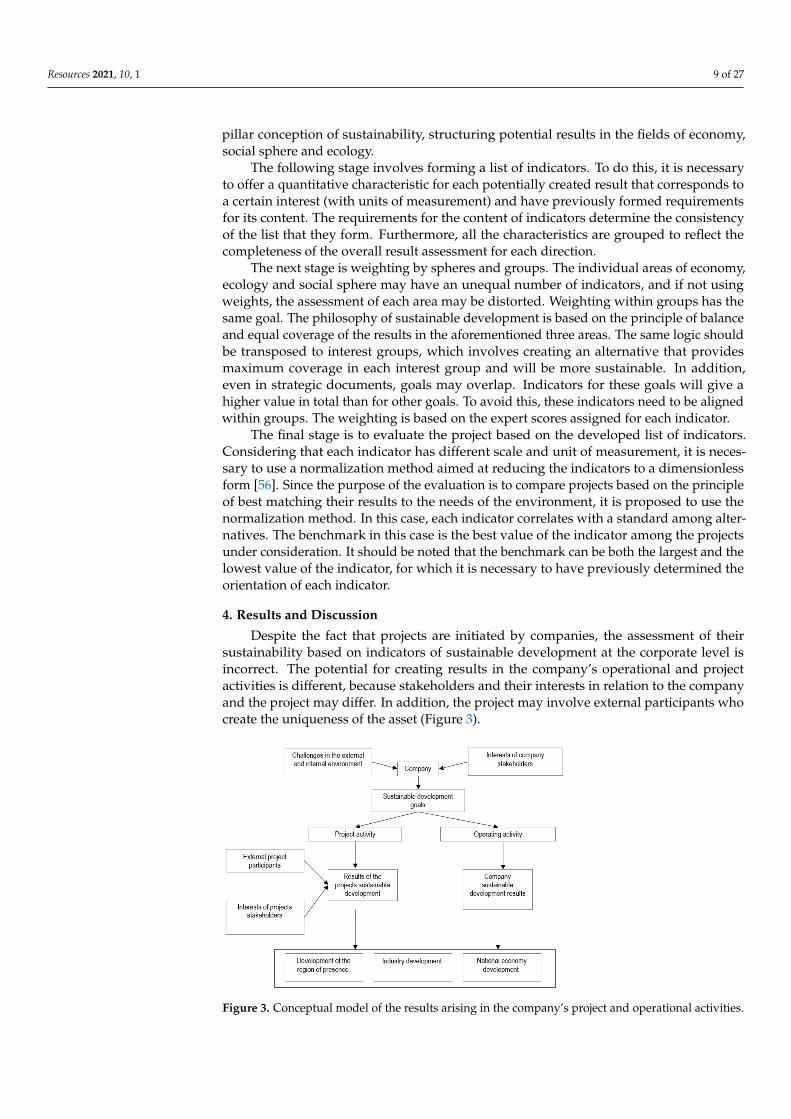
Despite the fact that projects are initiated by companies, the assessment of theirsustainability based on indicators of sustainable development at the corporate level isincorrect. The potential for creating results in the company’s operational and projectactivities is different, because stakeholders and their interests in relation to the companyand the project may differ. In addition, the project may involve external participants whocreate the uniqueness of the asset (Figure 3).
Figure 3. Conceptual model of the results arising in the company’s project and operational activities.
Resources 2021, 10, 1 10 of 27
In addition to the different potential for creating results, the approach to evaluatingproject activities will also be different:
(1) The object of project evaluation is its unique result, material or non-material. Whenevaluating operating activities, the management system is mainly evaluated.
(2) The project is evaluated through effects on the level of influence on a certain object.When analyzing operating activities, usually volatile, constantly changing indicatorsare used, measured in dynamics.
(3) Project effects can be evaluated before the project is launched (with a certain probabil-ity of achievement).
(4) Project effects are focused on the long term and are calculated for the entire periodof its implementation, which is strictly limited, with the possibility of clarificationduring the project lifecycle. Operating indicators are calculated primarily for report-ing periods.
(5) Project effects are estimated, as a rule, according to the forecast principle, operatingactivities according to the actual one.
(6) Approaches to project impact assessment are less standardized than approachesto operational performance assessment. It is generally accepted that the invest-ment performance of a project should be evaluated solely based on discounted cashflow modeling.
The external environment of project implementation is similar to the perimeter ofthe company that implements it. Accordingly, the external results of projects will affectthe same areas as the company’s activities, and will mainly affect the development of theregion of presence, the industry and the national economy of the country as a whole, whilesimultaneously affecting the company’s activities and satisfying the interests of projectinvestors. The assessment of such an impact is made in the process of project sustainabilityanalysis, aimed at a comprehensive assessment of the project results from the point of viewof interests in the state-business-society system.
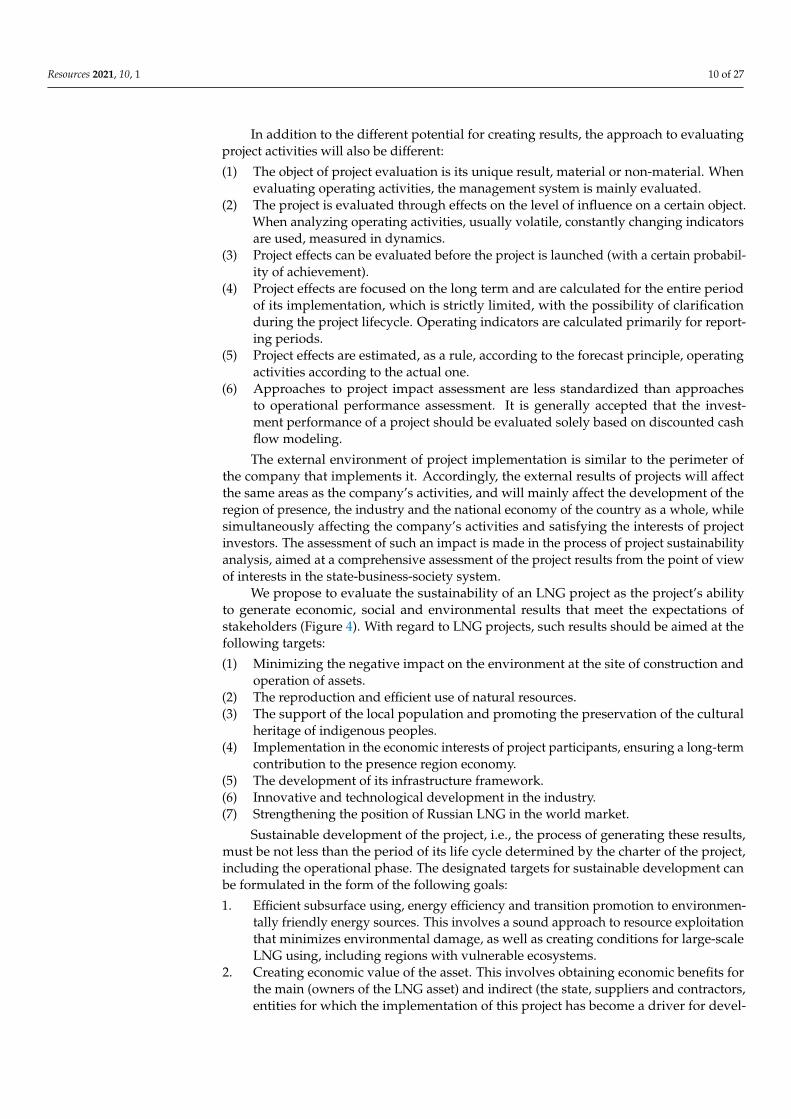
We propose to evaluate the sustainability of an LNG project as the project’s abilityto generate economic, social and environmental results that meet the expectations ofstakeholders (Figure 4). With regard to LNG projects, such results should be aimed at thefollowing targets:
(1) Minimizing the negative impact on the environment at the site of construction andoperation of assets.
(2) The reproduction and efficient use of natural resources.(3) The support of the local population and promoting the preservation of the cultural
heritage of indigenous peoples.(4) Implementation in the economic interests of project participants, ensuring a long-term
contribution to the presence region economy.(5) The development of its infrastructure framework.(6) Innovative and technological development in the industry.(7) Strengthening the position of Russian LNG in the world market.
Sustainable development of the project, i.e., the process of generating these results,must be not less than the period of its life cycle determined by the charter of the project,including the operational phase. The designated targets for sustainable development canbe formulated in the form of the following goals:
1. Efficient subsurface using, energy efficiency and transition promotion to environmen-tally friendly energy sources. This involves a sound approach to resource exploitationthat minimizes environmental damage, as well as creating conditions for large-scaleLNG using, including regions with vulnerable ecosystems.
2. Creating economic value of the asset. This involves obtaining economic benefits forthe main (owners of the LNG asset) and indirect (the state, suppliers and contractors,entities for which the implementation of this project has become a driver for devel-
Resources 2021, 10, 1 11 of 27
opment) project participants. It also includes the results that will become sources ofadditional growth in the future.
3. Participation in solving socially significant problems in the region of presence. This in-volves the implementation of CSR programs focused on the needs of local population.
Figure 4. The concept of sustainability LNG project.
Sustainable development of the system is related to its ability to create economic,social and environmental results that meet the interests of stakeholders under existingrestrictions. Based on the analysis of LNG projects implementing experience in Russia andin the world, we identified the main groups of stakeholders, their interests and potentialcontribution to the implementation of projects (Appendix A, Table A1).
For large-scale LNG projects, the list of expectations of stakeholders is quite high,which determines the number of possible effects that reflect its investment attractiveness.Moreover, the consequences of the project’s implementation in the external environment,which determine its significance for the region and the industry (Appendix A, Table A2).It is important to note that the geographical and climatic features of the Arctic region inconditions of high dependence on foreign technologies and equipment require the activa-tion of the innovative component at all stages of a project. This includes the organizationand conduct of geological exploration, logistic support to industrial systems, organizationand conduct of construction and installation work, the operation of production assets, andsales of finished products [57].
It is necessary to involve specialized universities and research institutes, scientific andtechnical centers and other participants offering advanced technological solutions for safeand efficient work in the extreme conditions of the North. For this reason, the effects ofprojects related to the development of innovations must also be taken into account.
Based on the analysis of the potential of Arctic LNG projects, the following groups ofindicators can be identified for a comprehensive assessment of the results of such projects—macroeconomic, international integration, investment, infrastructure, sectorial, inter-projectcooperation, innovative, human development, development of regional culture, improvingliving standards, environmental pollution, transition to clean energy and energy efficiency(Appendix A, Table A3).
Indicators for assessing the sustainable development of industrial systems, in ouropinion, should meet the following requirements:
1. Be universal in relation to other projects in the region of the same sector with an identicalset of links in the production chain (for example, production-processing-sales).
2. Meet the interests of stakeholders of the project.3. Be applicable for evaluation at any stage of the project, including pre-project develop-
ment.
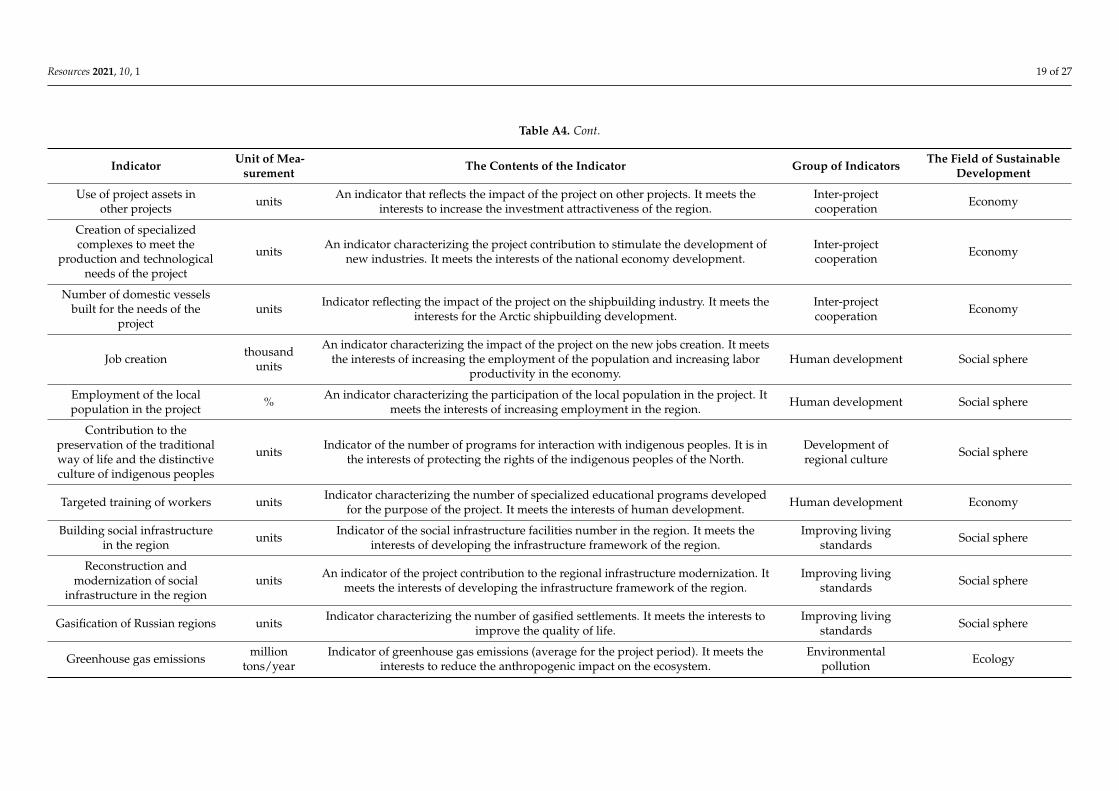
In accordance with the specified requirements, the following list of indicators forassessing the sustainability of Arctic LNG projects is proposed (Appendix A, Table A4).
Resources 2021, 10, 1 12 of 27
This list was tested in assessing the sustainability of the Yamal LNG project, as well as onthe Arctic LNG-2 project planned for implementation with an investment decision alreadyhaving been made. Lastly, it will be used on the Ob LNG project, on which an investmentdecision has not been made yet.
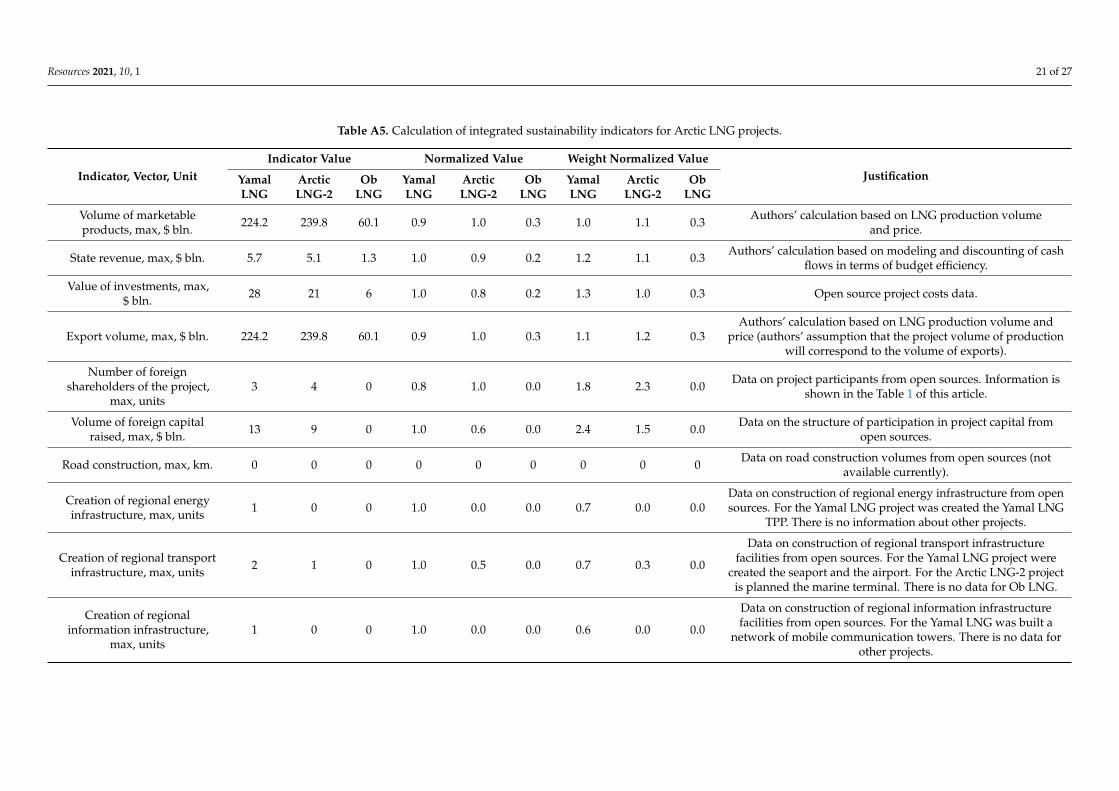
The indicators were evaluated using data from open sources, as well as the authors’own calculations. To set the weight coefficients, we used expert assessments obtainedduring a survey of a group of five experts in the field of project management and sustainabledevelopment of Russian oil and gas company. The principle of setting weights is describedin the Methodology section. Bringing the indicators to a single view was also performedaccording to the principle described earlier—through the ratio of the indicator value to thebest among the projects.
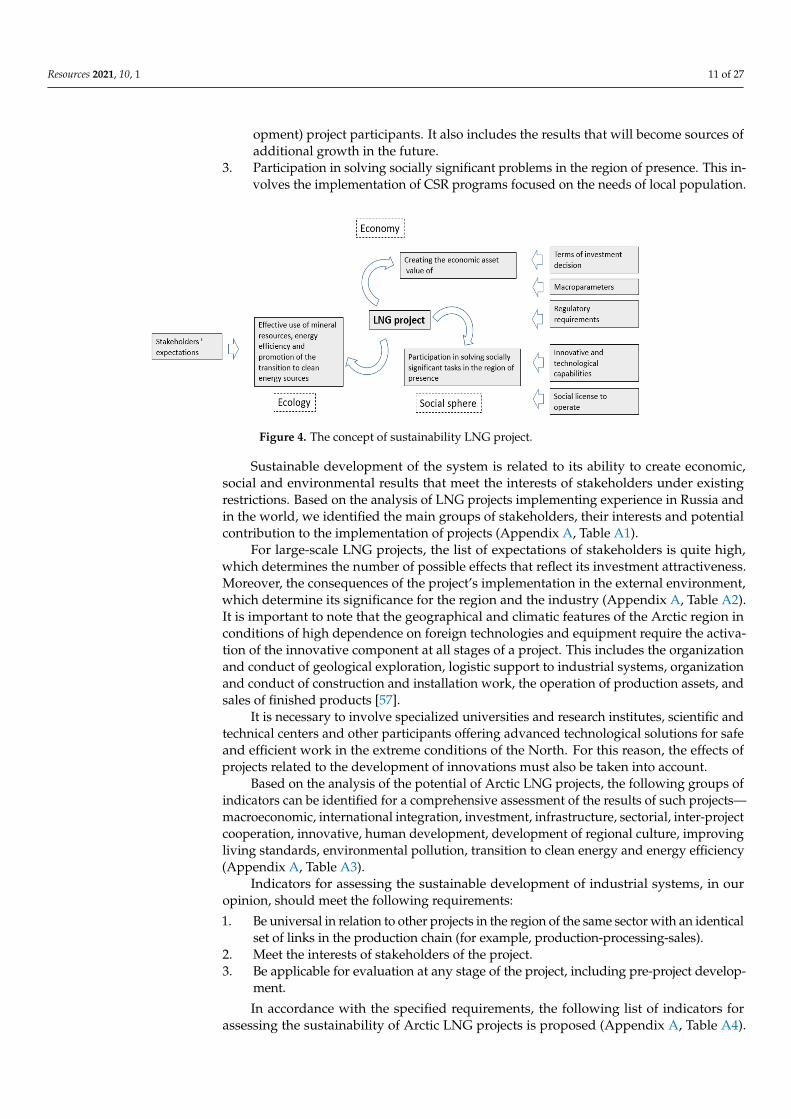
Calculations are given in Appendix A in Table A5 and based on data from opensources. The results of the calculations show that the Yamal LNG project is the mostsustainable in terms of the characteristics of results that correspond to the interests ofstakeholders (Figure 5). However, it is necessary to take into account the high estimationerror associated with the limited amount of data on planned projects in open access, whichis typical for the Ob LNG project. Even with limited data on the Arctic LNG-2 project, it canbe concluded that there is sufficient potential to create results in the external environmentcomparable to the Yamal LNG project.
Figure 5. Integrated sustainability indicators for Arctic LNG projects and their distribution by sustainable development areas.
A rating system based on weights, the sum of which gives the final value “100”,and normalized according to the principle of bringing to the best result, assumes that themaximum value that can be obtained is 100. This allows us to consider the integral stabilityindicator not only as an absolute value, but also as a relative one. However, it should benoted that sustainability indicators have different sensitivity to certain project parametersand not every indicator in the project can be increased/decreased to the reference one.For example, a number of indicators depend on the production capacity of a plant, whichmeans that a less productive plant has a certain limit in generating economic, environmentaland social results compared to a larger asset. This indicates that sustainability cannot havecriteria and the conclusion about it is made in comparison with another object. A moresustainable option is one that provides the greatest coverage of the project results for thekey interests of stakeholders in each area of sustainable development.
The proposed assessment approach is applicable in portfolio analysis, since it pro-vides a summary of the status of each project in a specific area, which in this case, isin the field of sustainable development. However, it should be noted that with such anassessment system, the company should not seek to equalize the indicators since this canbe achieved by reducing the benchmark indicators, but rather to search for additionalpotential improvements in lagging areas. Therefore, the sustainability portfolio should bemonitored comprehensively for all projects with dynamic changes analysis in the values ofeach indicator.
Resources 2021, 10, 1 13 of 27
A promising area of application of the proposed indicators is mentioned early manage-ment of socio-economic development of the region. Large-scale LNG projects are system-forming in regional design and form the core for further development, inter-industry andinter-territorial interaction. The unique results of the projects created in the context ofregional expectations and requirements should be evaluated on an early stage, includedin comprehensive profile programs and regional development plans, and become specificobjects of management, thereby creating maximum value for sustainable development ofbusiness, government and society in the long term.
5. Conclusions
Turning a strategy into real action requires quantifying the expected results, and thusallowing for evaluation of the effectiveness of the processes being launched. The existingsystem of strategic management of the socio-economic development of the Arctic region isin the process of formation. It has complex goals to ensure a functional approach to thecreation of modern industrial complexes in remote Northern territories, linking productionopportunities with the solution of social and environmental problems. There is an obviousneed to synchronize government goals with the production programs of existing industrialsystems as well as those that are planned or under development.
Large investment projects initiated on the basis of promising fields are system-forming,participate in solving the problems of integrated spatial development of the Arctic region,generate multiplicative effects for the industry to which they belong, as well as relatedindustries, and stimulate the development of other promising local projects. The specifics ofproject management in relation to standard processes of production and economic activitydetermine a specific approach to evaluating the effectiveness of decisions made.
Indicators of sustainable socio-economic development of the region will differ fromindicators of industrial systems development. This is due primarily to the fact that eachproject has its own industry affiliation. The corresponding composition of participants whodetermine the target vector of development and the profile of interaction with the externalenvironment also contribute to this. Secondly, the indicators of regional development char-acterize, among other things, socio-demographic processes and the state of the ecosystem,which are determined by general regional trends and depend on the pace of developmentof the Arctic sectors of the economy as a whole. Subsequently, when conducting compre-hensive monitoring of the solution of strategic tasks, an indicator assessment of both thesocio-economic development of the region and industrial systems is necessary.
The proposed indicator list takes into account the needs of the Arctic region in thecontext of LNG projects capabilities. At the same time, the variable nature of the indicatorsshould be noted, such as the list of indicators formed in response to the challenges in thestate-business society system. These can be adjusted and clarified as the trends in theexternal and internal environment of the project change.
Author Contributions: Conceptualization, A.C.; Methodology O.E. and A.C., Formal Analysis O.E.;List of indicators O.E. and A.C., Writing—Original Draft Preparation O.E.; Supervision A.C. Allauthors have read and agreed to the published version of the manuscript.
Funding: The research was carried out with the financial support of a grant by the President ofthe Russian Federation for the state support of leading scientific schools of the Russian Federation,the number of the project NSh-2692.2020.5 “Modelling of ecological-balanced and economicallysustainable development of hydrocarbon resources of the Arctic”.
Data Availability Statement: The research is based on open available data. When calculating theprojects integrated sustainability indicator (Appendix A, Table A5), data based on expert surveyfor indicator weighing were used. The calculated values of the projects integrated sustainabilityindicators (Appendix A, Table A5) and of projects budget efficiency at the regional level (Table 1)are original.
Conflicts of Interest: The authors declare no conflict of interest.

Resources 2021, 10, 1 14 of 27
Appendix A
Table A1. The main groups of LNG project’s stakeholders, their interests and potential contribution to project implementation.
Category of Stakeholders Main Areas of Interests Potential Contribution to Project Development
Public authoritiesDiversification of gas export supplies, development of the raw material base,
innovative, technological and socio-economic development, improvement of thecountry’s image on the world stage, budget revenues from projects.
State support for projects in the form of participation in financingand providing tax incentives, opportunities for lobbying, LNG
projects integration in industry and regional strategies andpromoting their implementation in the context of socio-economic
development of regions and the country as a whole.
Investors and credit organizations
Return on investment, sustainable development and socially responsible investment,creating and strengthening partnerships with companies participating in projects,
diversifying the project portfolio, and gaining experience in participating inLNG projects.
Provision of financial and other resources forproject implementation.
Industrial companies(potential operators)
Achievement of project goals, their implementation in accordance with deadlinesand budgets, technological development of companies, increasing the investment
attractiveness of business.
Full responsibility for the projects implementation, promoting thedevelopment of Russian LNG industry.
Local communitiesSafety of used technologies, possibility of employment in the jobs created within theprojects, participation of the operator company in socio-economic development of
the region, preservation of traditional way of life.
Human resources, an ability to purchase local goods and services,“social license to operate”.
Non-governmental environmentalorganizations
Safety and scientific feasibility of technologies, compliance with all environmentalstandards and requirements in projects implementation, minimizing negative impact
on ecosystems.
Opportunities for lobbying due to credibility of a number ofNGOs among the public.
Media Transparency and accessibility of project information, open dialogue with operatorcompanies and project participants.
A communication tool that contributes to positive reputationformation of operating companies.
Control, supervision andregulation bodies
Reliability and regularity of project data provided, implementation of projects withinthe framework of current legislation. Favorable institutional conditions for conducting project work.
Project teams Social responsibility of operator companies, high wages, decent working conditions,opportunities for professional development.
The main impact on the achievement of project goals andperformance indicators.
Suppliers and Contractors Long-term contracts and the stability of the interaction. The main impact on project performance in terms of cost, timing,and quality.
Consumers Stable access to energy that is sold at market prices and meets quality requirements. Stable demand for LNG.
Resources 2021, 10, 1 15 of 27
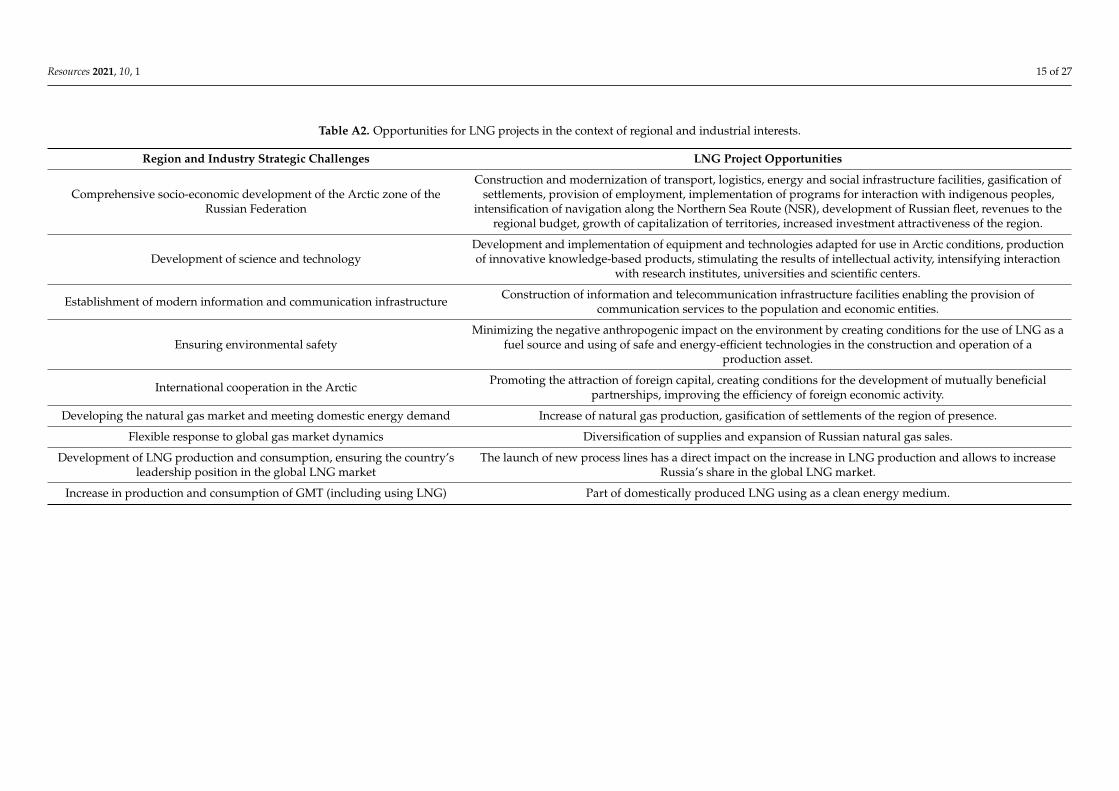
Table A2. Opportunities for LNG projects in the context of regional and industrial interests.
Region and Industry Strategic Challenges LNG Project Opportunities
Comprehensive socio-economic development of the Arctic zone of theRussian Federation
Construction and modernization of transport, logistics, energy and social infrastructure facilities, gasification ofsettlements, provision of employment, implementation of programs for interaction with indigenous peoples,
intensification of navigation along the Northern Sea Route (NSR), development of Russian fleet, revenues to theregional budget, growth of capitalization of territories, increased investment attractiveness of the region.
Development of science and technologyDevelopment and implementation of equipment and technologies adapted for use in Arctic conditions, productionof innovative knowledge-based products, stimulating the results of intellectual activity, intensifying interaction
with research institutes, universities and scientific centers.
Establishment of modern information and communication infrastructure Construction of information and telecommunication infrastructure facilities enabling the provision ofcommunication services to the population and economic entities.
Ensuring environmental safetyMinimizing the negative anthropogenic impact on the environment by creating conditions for the use of LNG as a
fuel source and using of safe and energy-efficient technologies in the construction and operation of aproduction asset.
International cooperation in the Arctic Promoting the attraction of foreign capital, creating conditions for the development of mutually beneficialpartnerships, improving the efficiency of foreign economic activity.
Developing the natural gas market and meeting domestic energy demand Increase of natural gas production, gasification of settlements of the region of presence.
Flexible response to global gas market dynamics Diversification of supplies and expansion of Russian natural gas sales.
Development of LNG production and consumption, ensuring the country’sleadership position in the global LNG market
The launch of new process lines has a direct impact on the increase in LNG production and allows to increaseRussia’s share in the global LNG market.
Increase in production and consumption of GMT (including using LNG) Part of domestically produced LNG using as a clean energy medium.

Resources 2021, 10, 1 16 of 27
Table A3. Indicator groups for LNG project sustainability assessment.
Indicator Group Indicator Group Description
Macroeconomic Reflect the project’s contribution to macroeconomic indicators. They correspond to the interests of increasing the capitalization of territories,increasing investment activity, increasing trade volumes, developing the budget system and the national economy as a whole.
International integration They reflect the project’s contribution to increasing the investment attractiveness of Russian projects for foreign partners. They correspond tointerests of developing international Arctic cooperation.
Investment Reflect return and return on investment. They correspond to interests on investment efficiency of the project.
Infrastructure They reflect the number of new, as well as reconstructed and modernized regional infrastructure facilities. They correspond to the interests ofdeveloping the infrastructure framework of the region.
Sectorial They reflect the efficiency of using assets, as well as the project’s contribution to increasing the production potential of LNG, increasing production,and intensifying gas exports. It is consistent with the interests of developing the resource base and diversifying the export supply of Russian gas.
Inter-project cooperation Reflect the impact on the development of related projects. They correspond to the interests of increasing the investment attractiveness of the region,the development of Arctic shipbuilding and the development of the national economy as a whole.
Innovative They reflect the impact of the project on the increase of domestic developments in specialized areas. They correspond to interests in the field ofinnovative development and import substitution.
Human developmentThey reflect the impact of the project on increasing the level of employment of the population, the competitiveness of the labor force, and theexpansion of choice opportunities. They correspond to the interests of providing opportunities for professional development and increasing
demand in the labor market.
Development of regional culture They reflect the impact of the project on the preservation of the cultural heritage of the region, including the life of the indigenous peoples of theNorth. They correspond to the interests of preserving the traditional way of life of local population.
Improving living standards They reflect the impact of the project on extending the perimeter of access to social benefits. They correspond to the interests of reducing socialdifferentiation of society.
Environmental pollution They reflect negative impact of the project on the state of the environment and characterize the volume of emissions of harmful substances into theatmosphere. They correspond to the interest to reduce anthropogenic impact on the environment.
Transition to clean energy Reflect the impact of the project on increasing the share of clean energy in transport and energy sectors. They are in line with the interests ofreducing greenhouse gas emissions in the national economy.
Energy efficiency They characterize the quality of energy resources used in production process. They are consistent with the interests of effective energy using.

Resources 2021, 10, 1 17 of 27
Table A4. LNG project sustainability indicators list.
Indicator Unit of Mea-surement The Contents of the Indicator Group of Indicators The Field of Sustainable
Development
State revenue $ bln. An indicator of the project contribution to budget revenues. It meets the interests ofthe budget system development. Macroeconomic Economy
Value of investments $ bln. An indicator of the project contribution to the total investment in the fixed capital ofthe region. It meets the interests to increase investment activity. Macroeconomic Economy
Volume of marketableproducts $ bln. An indicator that reflects the project contribution to production growth. It meets the
interests of the national economy development. Macroeconomic Economy
Export Volume $ bln. An indicator that reflects the project contribution to increasing exports of products. Itmeets the interests of the national economy development. Macroeconomic Economy
Number of foreignshareholders of the project units Indicator characterizing the project contribution to attract foreign partners. It is in the
interests of developing Arctic international cooperation.Internationalintegration Economy
Volume of foreigncapital raised $ bln. An indicator characterizing the project contribution to attract foreign capital. It meets
interests of developing Arctic international cooperation.Internationalintegration Economy
Road construction km. An indicator of the project contribution to regional road construction. It meets theinterests of developing the infrastructure framework of the region. Infrastructure Economy
Creation of regional energyinfrastructure units Indicator of the energy infrastructure facilities number in the region. It meets the
interests of developing the infrastructure framework of the region. Infrastructure Economy
Creation of regional transportinfrastructure units Indicator of the transport infrastructure facilities number in the region. It meets the
interests of developing the infrastructure framework of the region. Infrastructure Economy
Creation of regionalinformation infrastructure units Indicator of the information infrastructure facilities number in the region. It meets the
interests of developing the infrastructure framework of the region. Infrastructure Economy
Reconstruction andmodernization of existingtransport infrastructure
units An indicator of the project contribution to the regional infrastructure modernization.It meets the interests of developing the infrastructure framework of the region. Infrastructure Economy
Reconstruction andmodernization of existing
energy infrastructureunits An indicator of the project contribution to the regional infrastructure modernization.
It meets the interests of developing the infrastructure framework of the region. Infrastructure Economy
Volume of transportationby NSR
one milliontons/year
Indicator characterizing the increase in cargo flow along the routes of the Northern SeaRoute (average for the period of the project implementation). It meets the interests to
increase the NSR turnover.Infrastructure Economy

Resources 2021, 10, 1 18 of 27
Table A4. Cont.
Indicator Unit of Mea-surement The Contents of the Indicator Group of Indicators The Field of Sustainable
Development
Payback Period years An indicator that reflects the period of return of investments. It meets the interests ofthe investment efficiency of the project. Investment Economy
NPV $ bln. Indicator reflecting the income of the project for the investor. It meets the interests ofthe investment efficiency of the project. Investment Economy
PI - Indicator reflecting the effectiveness of investment for the investor. It meets theinterests of the investment efficiency of the project. Investment Economy
Increased gas production billion m3 Indicator characterizing the increase in Russian gas production. It meets the interestsof developing the resource base. Sectorial Economy
Production capacity one milliontons/year
Indicator reflecting the amount of LNG produced per year (average for the projectperiod). It meets the interests of building the productive capacity of the industry. Sectorial Economy
Capacity utilization %/yearIndicator reflecting the annual load level of the asset (average for the period of the
project implementation). It meets the interests of efficient productioncapabilities using.
Sectorial Economy
Entering new markets units An indicator characterizing the number of countries that are new destinations ofRussian exports. It meets the interests to diversify the distribution of Russian gas. Sectorial Economy
Creation of domesticfundamentally new
technologies in naturalgas production
unitsIndicator characterizing the number of new Russian developments in the field
of production. It meets the interests of innovative development and importsubstitution industrialization.
Innovative Economy
Creation of domesticfundamentally new
technologies ingas liquefaction
unitsIndicator of the new Russian developments number in the field of natural gas
liquefaction. It meets the interests of innovative development and importsubstitution industrialization.
Innovative Economy
Creation of domesticfundamentally new
technologies in offshore gastransportation and
icebreaking operations
unitsIndicator characterizing the new Russian developments number in the field of Arcticshipping and icebreaking operations. It meets the interests of innovative development
and import substitution industrialization.Innovative Economy
Share of Russian equipmentand technologies in
project assets%
An indicator characterizing the volume of domestic products using in theimplementation of the project. It meets the interests of innovative development and
import substitution industrialization.Innovative Economy
Resources 2021, 10, 1 19 of 27
Table A4. Cont.
Indicator Unit of Mea-surement The Contents of the Indicator Group of Indicators The Field of Sustainable
Development
Use of project assets inother projects units An indicator that reflects the impact of the project on other projects. It meets the
interests to increase the investment attractiveness of the region.Inter-projectcooperation Economy
Creation of specializedcomplexes to meet the
production and technologicalneeds of the project
units An indicator characterizing the project contribution to stimulate the development ofnew industries. It meets the interests of the national economy development.
Inter-projectcooperation Economy
Number of domestic vesselsbuilt for the needs of the
projectunits Indicator reflecting the impact of the project on the shipbuilding industry. It meets the
interests for the Arctic shipbuilding development.Inter-projectcooperation Economy
Job creation thousandunits
An indicator characterizing the impact of the project on the new jobs creation. It meetsthe interests of increasing the employment of the population and increasing labor
productivity in the economy.Human development Social sphere
Employment of the localpopulation in the project % An indicator characterizing the participation of the local population in the project. It
meets the interests of increasing employment in the region. Human development Social sphere
Contribution to thepreservation of the traditionalway of life and the distinctiveculture of indigenous peoples
units Indicator of the number of programs for interaction with indigenous peoples. It is inthe interests of protecting the rights of the indigenous peoples of the North.
Development ofregional culture Social sphere
Targeted training of workers units Indicator characterizing the number of specialized educational programs developedfor the purpose of the project. It meets the interests of human development. Human development Economy
Building social infrastructurein the region units Indicator of the social infrastructure facilities number in the region. It meets the
interests of developing the infrastructure framework of the region.Improving living
standards Social sphere
Reconstruction andmodernization of social
infrastructure in the regionunits An indicator of the project contribution to the regional infrastructure modernization. It
meets the interests of developing the infrastructure framework of the region.Improving living
standards Social sphere
Gasification of Russian regions units Indicator characterizing the number of gasified settlements. It meets the interests toimprove the quality of life.
Improving livingstandards Social sphere
Greenhouse gas emissions milliontons/year
Indicator of greenhouse gas emissions (average for the project period). It meets theinterests to reduce the anthropogenic impact on the ecosystem.
Environmentalpollution Ecology

Resources 2021, 10, 1 20 of 27
Table A4. Cont.
Indicator Unit of Mea-surement The Contents of the Indicator Group of Indicators The Field of Sustainable
Development
Energy intensity of production LNG KW/ton Indicator of production energy efficiency. It meets the interests of rational useof resources. Energy efficiency Ecology
Gas flaring thousand m3 Indicator characterizing the amount of gas burned. It meets the interests to reduce theanthropogenic impact on the ecosystem.
Environmentalpollution Ecology
LNG utilization volumes fordomestic vessel refueling thousand m3 An indicator of the increase in the use of LNG in marine refueling. It meets the
interests to reduce the anthropogenic impact on the ecosystem.Transition toclean energy Ecology
Volume of LNG used as gasengine fuel for motor vehicles
and large machinerythousand m3 An indicator of the increase in the use of LNG as motor fuel. It meets the interests to
reduce the anthropogenic impact on the ecosystem.Transition toclean energy Ecology
LNG usage volumes forpower generation thousand m3 An indicator of the increase in the use of LNG as a source for electricity generation. It
meets the interests to reduce the anthropogenic impact on the ecosystem.Transition toclean energy Ecology
Resources 2021, 10, 1 21 of 27
Table A5. Calculation of integrated sustainability indicators for Arctic LNG projects.
Indicator, Vector, UnitIndicator Value Normalized Value Weight Normalized Value
JustificationYamalLNG
ArcticLNG-2
ObLNG
YamalLNG
ArcticLNG-2
ObLNG
YamalLNG
ArcticLNG-2
ObLNG
Volume of marketableproducts, max, $ bln. 224.2 239.8 60.1 0.9 1.0 0.3 1.0 1.1 0.3 Authors’ calculation based on LNG production volume
and price.
State revenue, max, $ bln. 5.7 5.1 1.3 1.0 0.9 0.2 1.2 1.1 0.3 Authors’ calculation based on modeling and discounting of cashflows in terms of budget efficiency.
Value of investments, max,$ bln. 28 21 6 1.0 0.8 0.2 1.3 1.0 0.3 Open source project costs data.
Export volume, max, $ bln. 224.2 239.8 60.1 0.9 1.0 0.3 1.1 1.2 0.3Authors’ calculation based on LNG production volume and
price (authors’ assumption that the project volume of productionwill correspond to the volume of exports).
Number of foreignshareholders of the project,
max, units3 4 0 0.8 1.0 0.0 1.8 2.3 0.0 Data on project participants from open sources. Information is
shown in the Table 1 of this article.
Volume of foreign capitalraised, max, $ bln. 13 9 0 1.0 0.6 0.0 2.4 1.5 0.0 Data on the structure of participation in project capital from
open sources.
Road construction, max, km. 0 0 0 0 0 0 0 0 0 Data on road construction volumes from open sources (notavailable currently).
Creation of regional energyinfrastructure, max, units 1 0 0 1.0 0.0 0.0 0.7 0.0 0.0
Data on construction of regional energy infrastructure from opensources. For the Yamal LNG project was created the Yamal LNG
TPP. There is no information about other projects.
Creation of regional transportinfrastructure, max, units 2 1 0 1.0 0.5 0.0 0.7 0.3 0.0
Data on construction of regional transport infrastructurefacilities from open sources. For the Yamal LNG project were
created the seaport and the airport. For the Arctic LNG-2 projectis planned the marine terminal. There is no data for Ob LNG.
Creation of regionalinformation infrastructure,
max, units1 0 0 1.0 0.0 0.0 0.6 0.0 0.0
Data on construction of regional information infrastructurefacilities from open sources. For the Yamal LNG was built a
network of mobile communication towers. There is no data forother projects.

Resources 2021, 10, 1 22 of 27
Table A5. Cont.
Indicator, Vector, UnitIndicator Value Normalized Value Weight Normalized Value
JustificationYamalLNG
ArcticLNG-2
ObLNG
YamalLNG
ArcticLNG-2
ObLNG
YamalLNG
ArcticLNG-2
ObLNG
Reconstruction andmodernization of existingtransport infrastructure,
max, units
0 0 0 0 0 0 0 0 0 Data on reconstruction and modernization of facilities from opensources (not available currently).
Reconstruction andmodernization of existing
energy infrastructure0 0 0 0 0 0 0 0 0 Data on reconstruction and modernization of facilities from open
sources (not available currently).
Volume of transportation byNSR, max, one million
tons/year17.5 19.8 4.8 0.9 1.0 0.2 0.6 0.7 0.2 On the basis of data on production capacity.
Payback Period, min, years 20 16 10 0.5 0.6 1.0 0.8 1.0 1.6 Authors’ calculation based on modeling and discounting thecash flows in terms of commercial efficiency.
NPV, max, $ bln. 4.9 5.2 1.2 0.9 1.0 0.2 1.5 1.6 0.4
Authors’ calculation based on modeling and discounting thecash flows in terms of commercial efficiency. For the Yamal LNG
project, tax benefits are included in the cash flows. For otherprojects, there is no data on tax benefits yet. The calculations are
based on the project capacity of the plant, taking into accountcurrent prices and authors’ assumption of 100% export sales
(data on domestic use are not available) and 40-year operationalphase period. We also assumed that domestic consumption can
be achieved by exceeding the project capacity due to lowtemperatures. Excess of project plant capacity was not taken into
account in the cash flow calculations.
PI, max 1.26 1.57 1.54 0.8 1.0 1.0 1.3 1.6 1.6 Authors’ calculation based on modeling and discounting thecash flows in terms of commercial efficiency.
Increased gas production, max,billion m3 540 560 140 1.0 1.0 0.3 1.2 1.3 0.3 Authors’ calculation based on the production demand in the raw
material base of the liquefaction plant.
Production capacity, max, onemillion tons/year 17.5 19.8 4.8 0.9 1.0 0.2 1.0 1.1 0.3 Open source data. Information is shown in the Table 1 of this
article.
Resources 2021, 10, 1 23 of 27
Table A5. Cont.
Indicator, Vector, UnitIndicator Value Normalized Value Weight Normalized Value
JustificationYamalLNG
ArcticLNG-2
ObLNG
YamalLNG
ArcticLNG-2
ObLNG
YamalLNG
ArcticLNG-2
ObLNG
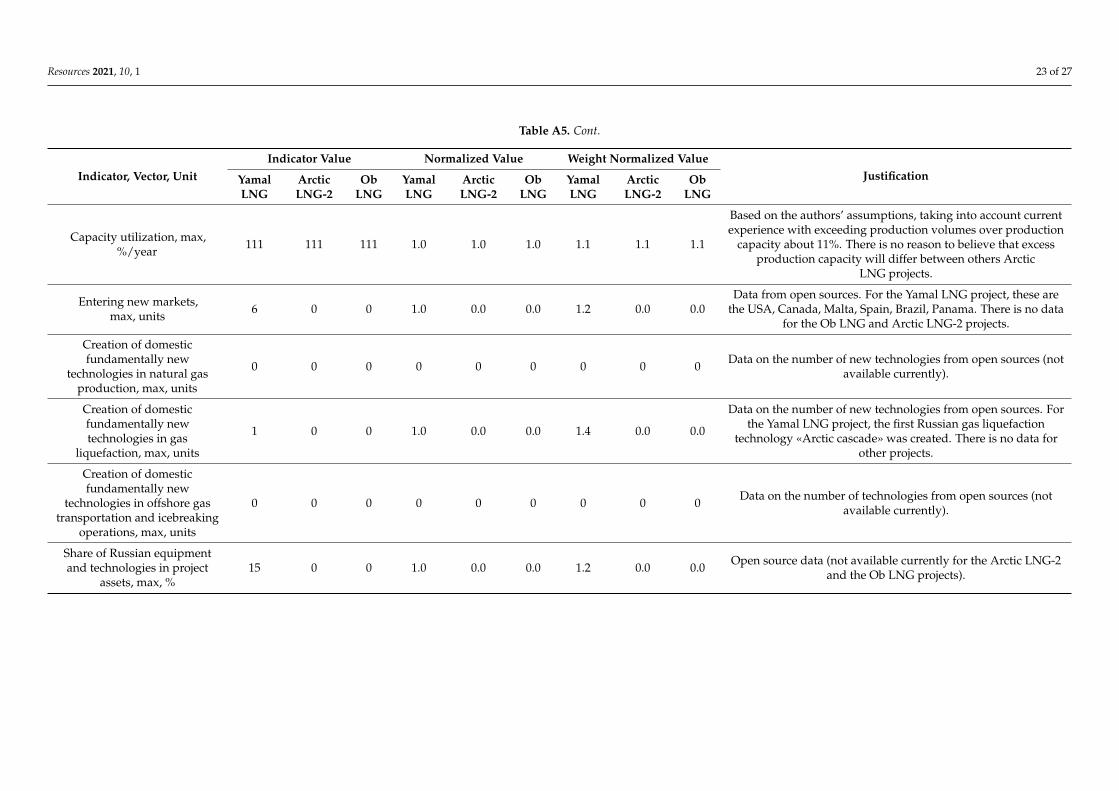
Capacity utilization, max,%/year 111 111 111 1.0 1.0 1.0 1.1 1.1 1.1
Based on the authors’ assumptions, taking into account currentexperience with exceeding production volumes over production
capacity about 11%. There is no reason to believe that excessproduction capacity will differ between others Arctic
LNG projects.
Entering new markets,max, units 6 0 0 1.0 0.0 0.0 1.2 0.0 0.0
Data from open sources. For the Yamal LNG project, these arethe USA, Canada, Malta, Spain, Brazil, Panama. There is no data
for the Ob LNG and Arctic LNG-2 projects.
Creation of domesticfundamentally new
technologies in natural gasproduction, max, units
0 0 0 0 0 0 0 0 0 Data on the number of new technologies from open sources (notavailable currently).
Creation of domesticfundamentally newtechnologies in gas
liquefaction, max, units
1 0 0 1.0 0.0 0.0 1.4 0.0 0.0
Data on the number of new technologies from open sources. Forthe Yamal LNG project, the first Russian gas liquefaction
technology «Arctic cascade» was created. There is no data forother projects.
Creation of domesticfundamentally new
technologies in offshore gastransportation and icebreaking
operations, max, units
0 0 0 0 0 0 0 0 0 Data on the number of technologies from open sources (notavailable currently).
Share of Russian equipmentand technologies in project
assets, max, %15 0 0 1.0 0.0 0.0 1.2 0.0 0.0 Open source data (not available currently for the Arctic LNG-2
and the Ob LNG projects).

Resources 2021, 10, 1 24 of 27
Table A5. Cont.
Indicator, Vector, UnitIndicator Value Normalized Value Weight Normalized Value
JustificationYamalLNG
ArcticLNG-2
ObLNG
YamalLNG
ArcticLNG-2
ObLNG
YamalLNG
ArcticLNG-2
ObLNG
Use of project assets in otherprojects, max, units 8 0 0 1.0 0.0 0.0 1.6 0.0 0.0
According to data from open sources, the Yamal LNG projectinfrastructure will be used to implement the Arctic LNG-2, Ob
LNG, Arctic LNG-1, Arctic LNG-3 projects, and project ofproduction coal, gold, non-ferrous and rare metal ores (the
number and projects titles are not reported, the calculation takesinto account the value 4). There is no publicly available data for
other projects.
Creation of specializedcomplexes to meet the
production and technologicalneeds of the project max, units
0 1 0 0.0 1.0 0.0 0.0 1.4 0.0For the Arctic LNG-2 project, it is a Center for the construction of
large-capacity offshore structures. There is no data forother projects.
Number of domestic vesselsbuilt for the needs of the
project max, units0 15 0 0.0 1.0 0.0 0.0 1.8 0.0 Open source data. No data available for the Ob LNG project.
Job creation max,thousand units 32 24.7 6.7 1.0 0.8 0.2 3.9 3.0 0.8
Open source data for the Yamal LNG project and the authors’assumption that for the other projects the approximate numberof jobs will depend on the amount of investment (specific value
of the jobs number per investment unit).
Employment of the localpopulation in the project
max, %0 0 0 0 0 0 0 0 0 Open source data (not available currently).
Targeted training for workersmax, units 1 0 0 1.0 0.0 0.0 4.0 0.0 0.0
Open source data. For the Yamal LNG project, it is a specializedtraining program based on the «Innopolis» center. For other
projects there is no information.
Contribution to thepreservation of the traditionalway of life and the distinctiveculture of indigenous peoples
max, units
1 0 0 1.0 0.0 0.0 11.1 0.0 0.0 Open source data. For the Yamal LNG project transitions fordeer were built. For other projects there is no information.

Resources 2021, 10, 1 25 of 27
Table A5. Cont.
Indicator, Vector, UnitIndicator Value Normalized Value Weight Normalized Value
JustificationYamalLNG
ArcticLNG-2
ObLNG
YamalLNG
ArcticLNG-2
ObLNG
YamalLNG
ArcticLNG-2
ObLNG
Creation of social infrastructurein the region max, units 3 0 0 1.0 0.0 0.0 3.3 0.0 0.0
Open source data. For the Yamal LNG project, it is a shiftsettlement, a hospital, and a sports complex. For other projects
there is no information.
Reconstruction andmodernization of social
infrastructure in the regionmax, units
0 0 0 0 0 0 0 0 0 Open source data (not available currently).
Gasification of Russian regionsmax, units 0 0 0 0 0 0 0 0 0 Open source data (not available currently).
Greenhouse gas emissions,min, million tons/year 1 1 1 1.0 1.0 1.0 5.8 5.8 5.8
Based on the assumption of similar liquefaction technologies,there is no reason to believe that greenhouse gas emissions will
be different.
Gas flaring, min, thousand m3 1 1 1 1.0 1.0 1.0 5.3 5.3 5.3Based on the assumption of liquefaction technologies similar intechnological characteristics, there is no reason to believe that the
volumes of gas flaring will be different.
Energy intensity of production,min, LNG KW/ton 1 1 1 1.0 1.0 1.0 11.1 11.1 11.1
Based on the assumption of liquefaction technologies similar intechnological characteristics, there is no reason to believe that the
energy intensity of production will be different.
LNG utilization volumes fordomestic vessel refueling, max,
thousand m30 0 0 0 0 0 0 0 0 Open source data (not available currently).
Volume of LNG used as gasengine fuel for motor vehicles
and large machinery, max,thousand m3
1 1 1 1.0 1.0 1.0 3.7 3.7 3.7
Based on the information on the plans for the integrated use ofthe Arctic LNG in Chukotka for electric generation and
transport, there is no reason to believe that the consumptionvolumes will vary between projects.
LNG usage volumes for powergeneration, max, thousand m3 1 1 1 1.0 1.0 1.0 3.6 3.6 3.6
Based on the information on the plans for the integrated use ofthe Arctic LNG in Chukotka for electric generation and
transport, there is no reason to believe that the consumptionvolumes will vary between projects.
Total 75.5 52.6 36.9

Resources 2021, 10, 1 26 of 27
References1. Moe, A. The dynamics of arctic development. In Asia in the Arctic. Narratives, Perspectives and Policies; Sakhuja, V., Narula, K., Eds.;
Springer: Singapore, 2016; pp. 3–15.2. Glomsrod, S.; Mäenpää, I.; Lindholt, L.; McDonald, H.; Goldsmith, S. Arctic economies within the Arctic nations. In The Economy
of the North; Glomsrod, S., Aslaksen, I., Eds.; Statistics Norway: Oslo, Norway, 2008; pp. 37–68.3. Russian International Affairs Council. Arctic Region: Problems of International Cooperation. Volume 1; Ivanov, I.S., Ed.; Aspect Press:
Moscow, Russia, 2013. (In Russian)4. Center for Strategic Research. Arctic 18-24-35: The View of the Young. 2018. Available online: https://www.csr.ru/upload/
iblock/077/077bf5da0f50eeea20d3459409938f6a.pdf (accessed on 15 May 2020). (In Russian).5. Nikulin, A.A. Mineral resources of Russia: Opportunities and prospects for development. Natl. Strategy Probl. 2017, 40, 163–187.
(In Russian)6. Dodin, D.A.; Kaminskiy, V.D.; Suprunenko, O.I.; Pavlenko, V.I. Nodal problems of ensuring the economic development of the
Russian Arctic. Arct. Ecol. Econ. 2011, 4, 64–79. (In Russian)7. Asheim, B.T.; Smith, H.L.; Oughton, C. Regional innovation systems: Theory, empirics and policy. Reg. Stud. 2011, 45, 875–891.
[CrossRef]8. Skufyina, T.P. Alternatives for the development of the Russian North. Reg. Econ. Theory Pract. 2011, 187, 2–9. (In Russian)9. Krivovichev, S.V. Editorial for special issue “Arctic mineral resources: Science and technology”. Minerals 2019, 9, 192. [CrossRef]10. Gaynanov, D.A.; Kirillova, S.A.; Kuznetsova, Y.A. Russian Arctic in the context of sustainable development. Econ. Soc. Chang.
Facts Trends Forecast 2013, 30, 79–88. (In Russian)11. Smirnova, O.O.; Lipina, S.A.; Sokolov, M.S. Modern prospects and challenges for sustainable development of the Arctic zone of
the Russian Federation. Trends Manag. 2017, 1, 1–15. (In Russian) [CrossRef]12. Ermida, G. Strategic decisions of international oil companies: Arctic versus other regions. Energy Strategy Rev. 2014, 2, 265–272.
[CrossRef]13. Petrov, A.N.; BurnSilver, S.; Chapin, F.S., III; Fondahl, G.; Graybill, J.K.; Keil, K.; Nilsson, A.E.; Riedlsperger, R.; Schweitzer, P.
Arctic Sustainability Research: Past, Present and Future; Taylor & Francis Group Ltd.: Oxford, UK, 2017.14. Carson, M.; Sommerkorn, M.; Behe, C.; Cornell, S.; Gamble, T.; Mustonen, T.; Peterson, G.; Vlasova, T.; Chapin, F.S., III. An Arctic
resilience assessment. In Arctic Resilience Report; Carson, M., Peterson, G., Eds.; Arctic Council: Stockholm, Sweden, 2016;pp. 2–26.
15. Elhuni, M.R.; Ahmad, M.M. Key performance indicators for sustainable production evaluation in oil and gas sector. Procedia Manuf.2017, 11, 718–724. [CrossRef]
16. Dale, B.; Veland, S.; Hansen, A. Petroleum as a challenge to arctic societies: Ontological security and the oil-driven ‘push to thenorth’. Extr. Ind. Soc. 2019, 6, 367–377. [CrossRef]
17. Bogachev, V.F.; Veretennikov, N.P.; Sokolov, P.V. Regional interests of Russia in the concept of development of the Arctic.Vestnik MGTU 2015, 18, 373–376. (In Russian)
18. O’Garra, T. Economic value of ecosystem services, minerals and oil in a melting Arctic: A preliminary assessment. Ecosyst. Serv.2017, 24, 180–186. [CrossRef]
19. Ilinova, A.; Chanysheva, A. Algorithm for assessing the prospects of offshore oil and gas projects in the Arctic. Energy Rep. 2020,6, 504. [CrossRef]
20. Nilsson, A.E.; Larsen, J.N. Making regional sense of global sustainable development indicators for the Arctic. Sustainability 2020,12, 1027. [CrossRef]
21. Litvinenko, V. The role of hydrocarbons in the global energy agenda: The focus on liquefied natural gas. Resources 2020, 9, 59.[CrossRef]
22. Hönig, V.; Prochazka, P.; Obergruber, M.; Smutka, L.; Kucerová, V. Economic and technological analysis of commercial LNGproduction in the EU. Energies 2019, 12, 1565. [CrossRef]
23. Moe, A. A new Russian policy for the Northern sea route? State interests, key stakeholders and economic opportunities inchanging times. Polar J. 2020. [CrossRef]
24. Mitrova, T.; Kapitonov, S.; Klimentiev, A. Volume 2. Russian Small and Medium-Sized LNG. Regional Series. Arctic. 2019.Available online: https://energy.skolkovo.ru/downloads/documents/SEneC/Research/SKOLKOVO_EneC_RU_Arc_Vol2.pdf(accessed on 15 May 2020).
25. Holden, E.; Linnerud, K.; Banister, D. Sustainable development: Our common future revisited. Glob. Environ. Chang. 2014, 26,130–139. [CrossRef]
26. Report of the World Commission on Environment and Development: Our Common Future. 1987. Available online: https://sustainabledevelopment.un.org/content/documents/5987our-common-future.pdf (accessed on 25 November 2020).
27. Giddings, B.; Hopwood, B.; O’Brien, G. Environment, economy and society: Fitting them together into sustainable development.Sustain. Dev. 2002, 10, 187–196. [CrossRef]
28. Jeronen, E. Sustainability and sustainable development. In Encyclopedia of Corporate Social Responsibility; Idowu, S.O., Capaldi, N.,Zu, L., Gupta, A.D., Eds.; Springer: Berlin, Germany, 2013.

Resources 2021, 10, 1 27 of 27
29. Purvis, B.; Mao, Y.; Robinson, D. Three pillars of sustainability: In search of conceptual origins. Sustain. Sci. 2019, 14, 681–695.[CrossRef]
30. Barbier, E.B. The concept of sustainable economic development. Environ. Conserv. 1987, 14, 101–110. [CrossRef]31. Elkington, J. Cannibals with Forks: The Triple Bottom Line of 21st Century Business; Capstone Publishing: Oxford, UK, 1997.32. Coskun Arslan, M.; Kisacik, H. The corporate sustainability solution: Triple bottom line. J. Acc. Fin. 2017, 18–34.33. Shchukina, L.V. Theoretical aspects of sustainable development of regional socio-economic systems. Pskov Reg. J. 2015, 21, 38–50.
(In Russian)34. UN. Transforming Our World: The 2030 Agenda for Sustainable Development. Available online: https://sustainabledevelopment.
un.org/post2015/transformingourworld (accessed on 11 November 2020).35. Stepanova, N.; Gritsenko, D.; Gavrilyeva, T.; Belokur, A. Sustainable development in sparsely populated territories: Case of the
Russian Arctic and far east. Sustainability 2020, 12, 2367. [CrossRef]36. Azapagic, A. Developing a framework for sustainable development indicators for the mining and minerals industry. J. Clean. Prod.
2004, 12, 639–662. [CrossRef]37. Ville, M.; Yang, L.; Tzong-Ru, L.; Jurgen, P. Extracting key factors for sustainable development of enterprises: Case study of SMEs
in Taiwan. J. Clean. Prod. 2018, 209. [CrossRef]38. Dvoráková, L.; Zborkova, J. Integration of sustainable development at enterprise level. Procedia Eng. 2014, 69, 686–695. [CrossRef]39. Padash, A.; Ghatari, A. Toward an innovative green strategic formulation methodology: Empowerment of corporate social,
health, safety and environment. J. Clean. Prod. 2020, 261, 121075. [CrossRef]40. Filho, W.; Brandli, L. Engaging Stakeholders in Education for Sustainable Development at University Level; World Sustainability Series;
Springer: Cham, Switzerland, 2016. [CrossRef]41. Donaldson, T.; Preston, L. The stakeholder theory of the corporation: Concepts, evidence, and implications. Acad. Manag. Rev.
1995, 4, 65–91. [CrossRef]42. Cherepovitsyn, A.E.; Ilinova, A.A.; Evseeva, O.O. Stakeholders management of carbon sequestration project in the state–business–
society system. J. Min. Inst. 2019, 240, 731–742. [CrossRef]43. Kates, R.W.; Clark, W.C.; Corell, R.; Hall, M.J.; Jaeger, C.C.; Lowe, I.; McCarthy, J.J.; Schellnhuber, H.J.; Bolin, B.; Dickson, N.M.
Sustainability science. Science 2001, 292, 641–642. [CrossRef] [PubMed]44. Searcy, C. The Role of Sustainable Development Indicators in Corporate Decision-Making; International Institute for Sustainable
Development: Winnipeg, MB, Canada, 2009.45. Wang, J.; Chi, H.-L.; Shou, W.; Chong, H.-Y.; Wang, X.A. Coordinated approach for supply-chain tracking in the liquefied Natural
gas industry. Sustainability 2018, 10, 4822. [CrossRef]46. Wu, J.; Wu, T. Sustainability indicators and indices: An overview. In Handbook of Sustainability Management; Madu, C.N., Kuei,
C.-H., Eds.; World Scientific Publishing: Singapore, 2012; pp. 65–86. [CrossRef]47. Meadows, D. Indicators and Information Systems for Sustainable Development. Available online: http://donellameadows.org/
wp-content/userfiles/IndicatorsInformation.pdf (accessed on 15 May 2020).48. Poveda, C.A. Sustainability Assessment: A Rating System Framework for Best Practices; Emerald Publishing Limited: Bingley,
UK, 2017.49. Gunnarsdottir, I.; Davidsdottir, B.; Worrell, E.; Sigurgeirsdottir, S. Review of indicators for sustainable energy development.
Renew. Sustain. Energy Rev. 2020, 133, 110294. [CrossRef]50. Official Website of the Ministry of Economic Development of the Russian Federation. Available online: https://economy.gov.ru/
(accessed on 22 April 2020). (In Russian)51. Official Website of the Ministry of the Russian Federation for the Development of the Far East and the Arctic. Available online:
https://eng.minvr.ru/ (accessed on 22 April 2020).52. Velasquez, M.; Hester, P. An analysis of multi-criteria decision making methods. Int. J. Oper. Res. 2013, 10, 56–66.53. Abdelli, A.; Mokdad, L.; Hammal, Y. Dealing with value constraints in decision making using MCDM methods. J. Comput. Sci.
2020, 44. [CrossRef]54. Lamichhane, S.; Egilmez, G.; Bhutta, M.K.; Gedik, R.; Erenay, B. Benchmarking OECD countries’ sustainable development
performance: A goal-specific principal component analysis approach. J. Clean. Prod. 2020, 125040. [CrossRef]55. Tilla, I.; Blumberga, D. Qualitative indicator analysis of a sustainable remediation. Energy Procedia 2018, 147, 588–593. [CrossRef]56. Zhou, L.; Tokos, H.; Krajnc, D.; Yang, Y. Sustainability performance evaluation in industry by composite sustainability index.
Clean Technol. Environ. Policy 2012, 14. [CrossRef]57. Litvinenko, V.S.; Sergeev, I.B. Innovations as a factor in the development of the natural resources sector. Stud. Russ. Econ. Dev.
2019, 30, 637–645. [CrossRef]