Embed Size (px)
Citation preview

PARAMETER ESTIMATION AND OUTLIER DETECTION FOR SOME TYPES OF CIRCULAR MODEL
SITI ZANARIAH BINTI SATARI
INSTITUTE OF GRADUATE STUDIESUNIVERSITY OF MALAYA
KUALA LUMPUR
2015

PARAMETER ESTIMATION AND OUTLIER DETECTION FOR SOME TYPES OF CIRCULAR MODEL
SITI ZANARIAH BINTI SATARI
THESIS SUBMITTED IN FULFILMENT OF THEREQUIREMENTS FOR THE DEGREE OF DOCTOR OF
PHILOSOPHY
INSTITUTE OF GRADUATE STUDIESUNIVERSITY OF MALAYA
KUALA LUMPUR
2015

ii
ABSTRACT
This study focuses on the parameter estimation and outlier detection for some
types of the circular model. We first look at the concentration parameter of von Mises
distribution. The von Mises distribution is the most commonly used probability
distribution of a circular random variable, and the concentration of a circular data set is
measured using the mean resultant length. We propose a new and efficient
approximation of the concentration parameter estimates using two approaches, namely,
the roots of a polynomial function and minimizing the negative value of the log-
likelihood function in this study.
Secondly, we consider the construction of confidence interval for the unknown
parameter of a type of circular regression model, namely the model by Down and
Mardia (2002). The parameters being considered in this study is the error concentration
parameter. The confidence interval of the error concentration parameter is not straight
forward due to the complexity of getting a closed form and the wrap-around nature of
the data. In this study, we propose an alternative method of constructing a confidence
interval based from the distribution of the estimated value of error concentration
parameter obtained from the Fisher information matrix.
Thirdly, a new functional relationship model for circular variables, which is an
extended version of a circular regression model as proposed by Down and Mardia
(2002), is developed in this study. Both the dependent and independent variables in the
model are subjected to errors. We derive the maximum likelihood estimation of
parameters as well as the variance-covariance of parameters. Later, we assess the

iii
performance of confidence interval for error concentration parameter for the new
functional relationship model via simulation study.
Lastly, we consider the problem of detecting multiple outliers in circular
regression models based on the clustering algorithm. We develop the clustering-based
procedure for the predicted and residual values obtained from the Down and Mardia
model fit of a circular-circular data set. Here, we introduce a measure of similarity
based on the circular distance and obtain a cluster tree using the single linkage
clustering algorithm. Then, a stopping rule for the cluster tree based on the mean
direction and circular standard deviation of the tree height is proposed. We classify the
cluster group that exceeds the stopping rule as potential outliers.
Model verification of all method and model proposed in this study are examined
using the simulation study. As illustration, applications are displayed using wind and
wave circular data sets.

iv
ABSTRAK
Kajian ini memberi tumpuan kepada penganggaran parameter dan ujian
pengesanan titik terpencil dalam beberapa jenis model bulatan. Pertama, kita akan
melihat parameter menumpu bagi taburan von Mises. Taburan von Mises adalah
taburan kebarangkalian yang paling kerap digunakan bagi pemboleh ubah rawak bulat
dan penumpuan bagi set data bulatan dikira menggunakan min paduan panjang. Dalam
kajian ini, nilai anggaran yang baharu dan efisien bagi parameter menumpu data
membulat tersebut telah dicadangkan dengan menggunakan dua pendekatan iaitu, nilai
punca fungsi polinomial dan meminimumkan nilai negatif bagi fungsi log-
kemungkinan.
Kedua, kami mempertimbangkan pembinaan selang keyakinan untuk parameter
yang tidak diketahui bagi sejenis model regresi membulat, iaitu model Down dan
Mardia (2002). Parameter yang dipertimbangkan dalam model ini adalah parameter
menumpu bagi ralat. Selang keyakinan parameter menumpu bagi ralat tidak boleh
ditulis secara langsung kerana kerumitan mendapatkan bentuk yang tertutup dan
membalut sekitar sifat data. Dalam kajian ini, kami mencadangkan satu kaedah
alternatif dalam membina selang keyakinan berasaskan taburan bagi nilai anggaran
parameter menumpu ralat yang diperolehi daripada Matriks Fisher Bermaklumat.
Ketiga, satu model hubungan berfungsi yang baharu bagi pembolehubah
bulatan, yang mana merupakan lanjutan daripada model regresi bulatan yang
dicadangkan oleh Down dan Mardia (2002) dibangunkan dalam kajian ini. Kedua-dua
pembolehubah bersandar dan tak bersandar dalam model ini adalah tertakluk kepada
ralat. Kami memperoleh nilai anggaran kemungkinan maksimum bagi parameter

v
beserta parameter varians-kovarians. Seterusnya, kami juga menilai prestasi selang
keyakinan untuk parameter menumpu nilai ralat bagi model hubungan berfungsi yang
baharu ini melalui kajian simulasi.
Akhir sekali, kami mempertimbangkan masalah mengesan titik terpencil
berganda dalam model regresi bulatan berdasarkan algoritma berkelompok. Kami
membangunkan prosedur berasaskan kelompok ini untuk nilai ramalan dan reja yang
diperoleh daripada penyuaian model Down dan Mardia bagi set data bulatan. Di sini,
kami memperkenalkan ukuran persamaan berasaskan jarak bulatan, dan seterusnya
membina pokok kelompok dengan menggunakan algoritma hubungan kelompok
tunggal. Kemudian, kami mencadangkan satu nilai potongan untuk pokok kelompok
berdasarkan min terarah dan sisihan piawai bulatan bagi ketinggian pokok tersebut.
Kami mengklasifikasikan kumpulan data yang melebihi titik potongan ini sebagai titik
terpencil.
Pengesahan model bagi semua kaedah dan model yang dicadangkan dalam
kajian ini diuji menggunakan kajian simulasi. Sebagai contoh, aplikasi dipaparkan
menggunakan data arah angin dan gelombang.

vi
ACKNOWLEDGEMENTS
“In the name of Allah the All-Merciful, the All-Compassionate.”
All praise is to Allah for giving me the strength and chance to complete this
thesis. A very great gratitude and appreciation is expressed to all those who contributes
towards the completion of the thesis entitle “Parameter Estimation and Outlier
Detection for Some Types of Circular Model”, either directly or indirectly. Particularly,
I would like to express my grateful and sincere appreciation to my supervisors,
Associate Professor Dr. Yong Zulina Zubairi and Professor Dr. Abdul Ghapor Hussin
for their support, guidance, commentaries and advices. Also huge thanks, for their trust
and confidence on my capability to complete this thesis.
My gratitude and special thanks also go to my family for their support, love and
encouragement throughout the course of my study in University of Malaya (UM).
Thank you for always being patient and considerate. Last but not least, a huge thank
you to my fellows’ postgraduate friends for their support, assistance, and cooperation.
My sincere appreciation also extends to all my friends and others who have provided
assistance at various occasions. Their view and tips are useful indeed. With blessing
from everyone, I am very grateful to eventually complete this study.
vii
TABLE OF CONTENTS
ABSTRACT ii
ABSTRAK iv
ACKNOWLEDGEMENTS vi
TABLE OF CONTENTS vii
LIST OF TABLES xii
LIST OF FIGURES xv
LIST OF SYMBOLS xviii
LIST OF ABBREVIATIONS xx
CHAPTER 1 : RESEARCH FRAMEWORK
1.1 Background of the Study 1
1.2 Problem Statement 3
1.3 Objectives 5
1.4 Flow of Study and Methodology 6
1.5 Source of Data 7
1.6 Thesis organization 9
CHAPTER 2 : LITERATURE REVIEW
2.1 Introduction 10
2.2 Circular Data and Its Representation 10
2.2.1 Graphical Representations 11
2.2.2 Measure of Location and Measure of Concentration 13
2.2.3 Measure of Dispersion 15
2.2.4 Special Software for Circular Data 17

viii
2.3 Von Mises Distribution 18
2.4 Goodness of Fit Test for Von Mises Model 21
2.5 Confidence Interval for Concentration Parameter of Von Mises Distribution 23
2.6 Circular Regression Models for Bivariate Circular Data 26
2.6.1 Review on Various Circular-Circular Regression Models 28
2.7 Functional Relationship Models for Bivariate Circular Data 32
2.8 Outliers Detection for Circular Regression Model 38
2.9 Clustering Algorithm for Outliers Detection 43
2.9.1 Similarity Measure 45
2.9.2 Clustering Method 46
2.10 Summary 50
CHAPTER 3 : A NEW EFFICIENT APPROXIMATION OF
CONCENTRATION PARAMETER
3.1 Introduction 52
3.2 The General Construction of Mean Resultant Length 53
3.3 Approximate Solution of the Concentration Parameter 58
3.4 New Approximation of Mean Resultant Length 62
3.4.1 Power Series Expansion of 0
1
I 63
3.4.2 First Approach: Piecewise Approximation 66
3.4.3 Second Approach: Maximum Likelihood Estimator 67
3.5 Numerical Approximation of Mean Resultant Length and Concentration
Parameter 71
3.6 New Estimation of Concentration Parameter using Polyroot Function 72
3.7 New Estimation of Concentration Parameter using Minimum Sum Function 73

ix
3.8 Simulation Study for Polyroot and Minimum Sum (MS) Methods 74
3.9 Illustrative Examples 81
3.10 Case Study: Analysis of Concentration Parameter for Malaysian Wind Data 83
3.11 Summary 86
CHAPTER 4 : ERROR CONCENTRATION PARAMETER OF DOWN AND
MARDIA CIRCULAR-CIRCULAR REGRESSION MODEL
4.1 Introduction 88
4.2 Down and Mardia Circular-Circular Regression Model 89
4.3 Maximum Likelihood Estimation of Parameters in Down and Mardia Model 91
4.4 Variance-Covariance Matrix of Down and Mardia Model 93
4.5 Error Concentration Parameter for Down and Mardia Model 94
4.6 Confidence Interval for Error Concentration Parameter of Down and Mardia
Model 95
4.7 Simulation Study for Confidence Interval of Error Concentration Parameter 97
4.8 Illustrative Examples 100
4.9 Summary 103
CHAPTER 5 : A NEW CIRCULAR FUNCTIONAL RELATIONSHIP MODEL
5.1 Introduction 105
5.2 A New Circular Functional Relationship Model 106
5.3 Parameters Estimation 107
5.3.1 Simulation Study and Findings 110
5.4 Variance-Covariance Matrix 116
5.5 Confidence Interval for Error Concentration Parameter 120
5.5.1 Simulation Study and Findings 122

x
5.5.2 Bootstrap Method 124
5.6 Illustrative Examples 126
5.7 Summary 130
CHAPTER 6 : MULTIPLE OUTLIERS DETECTION IN CIRCULAR
REGRESSION MODELS USING CLUSTERING ALGORITHM
6.1 Introduction 131
6.2 New Similarity Measure for Circular Variables 132
6.3 Single Linkage Clustering Algorithm for Circular Variables 133
6.4 Stopping Rule for Outliers Detection 138
6.5 New Clustering Algorithm for Multiple Outliers Detection in Circular
Regression Model 142
6.6 Power of Performance of the Clustering Algorithm on Down and Mardia (DM)
Circular-Circular Regression Model 144
6.6.1 Simulation Study 145
6.6.2 Results and Findings 147
6.7 Practical Examples 158
6.7.1 Humberside Wind Direction Data (W129) 158
6.7.2 Simulated Data 162
6.8 Summary 165
CHAPTER 7 : CONCLUSIONS
7.1 Concluding Remarks 167
7.2 Contributions 171
7.3 Further Research 174

xi
REFERENCES 175
LIST OF ISI PUBLICATIONS AND PAPERS PRESENTED 183
APPENDIX A: Circular Data Set and Rose Diagram 185
APPENDIX B: SPlus Code for the New Efficient Approximation of Concentration
Parameter 191
APPENDIX C: SPlus Code for the Error Concentration Parameter of Down and Mardia
Circular-Circular Regression Model 195
APPENDIX D: SPlus Code for the New Functional Circular Relationship Model 201
APPENDIX E: SPlus Code for Multiple Outliers Detection in Circular Regression
Model Using Clustering Algorithm 211
APPENDIX F: ISI PUBLICATIONS 214

xii
LIST OF TABLES
TABLE PAGE
Table 2.1: The list of the confidence interval for concentration parameter of von
Mises distribution 25
Table 2.2: The historical development of circular-circular regression model 31
Table 2.3: The historical development of functional relationship model for circular
variables 34
Table 2.4: The historical development of outlier detection in circular regression
model 42
Table 3.1: Numerical approximation of mean resultant length 71
Table 3.2: Simulation results for various values of concentration parameter with
sample size 30n 76
Table 3.3: Simulation results for various values of concentration parameter with
sample size 50n 76
Table 3.4: Simulation results for various values of concentration parameter with
sample size 100n 77
Table 3.5: Simulation results for various values of concentration parameter with
sample size 120n 78
Table 3.6: The best approximation solution for various values of concentration
parameter with sample sizes 30, 50, 100,120n 79
Table 3.7: Approximation solution of concentration parameter for various data set 82
Table 3.8: Statistical summary of wind direction data recorded at maximum wind
speed at west Peninsular Malaysia from 1999 to 2008 during southwest
monsoon 84
xiii
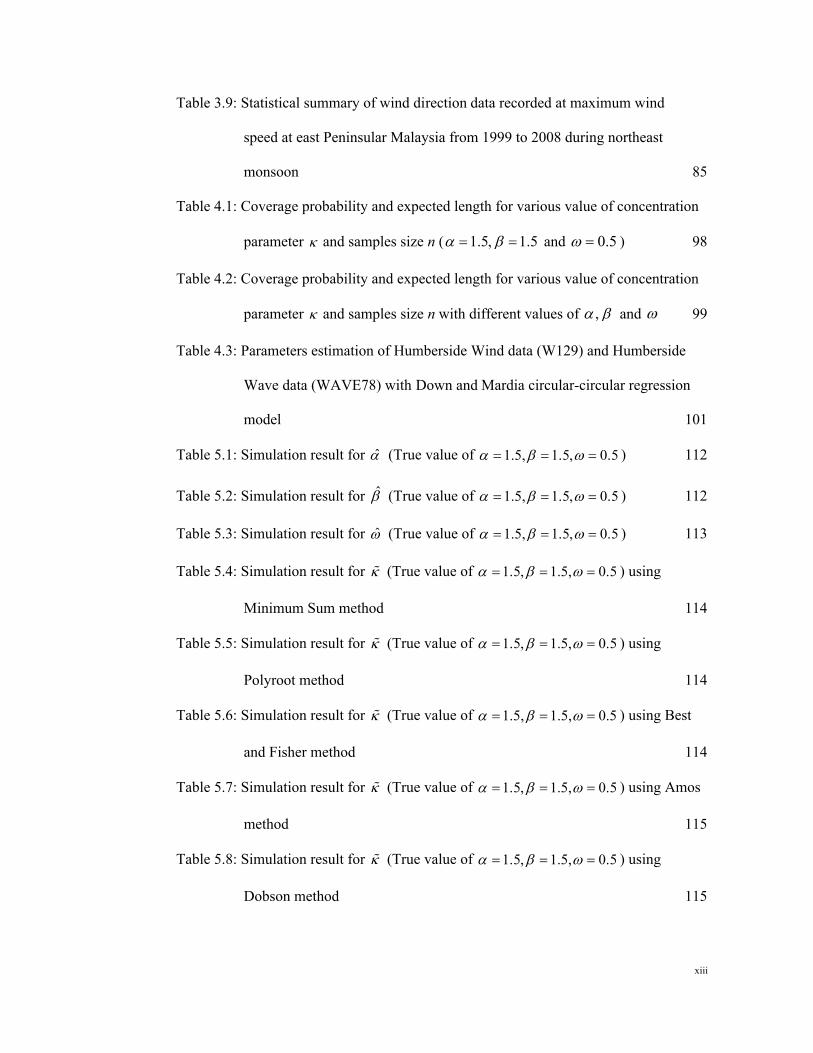
Table 3.9: Statistical summary of wind direction data recorded at maximum wind
speed at east Peninsular Malaysia from 1999 to 2008 during northeast
monsoon 85
Table 4.1: Coverage probability and expected length for various value of concentration
parameter and samples size n ( 1.5, 1.5 and 0.5 ) 98
Table 4.2: Coverage probability and expected length for various value of concentration
parameter and samples size n with different values of , and 99
Table 4.3: Parameters estimation of Humberside Wind data (W129) and Humberside
Wave data (WAVE78) with Down and Mardia circular-circular regression
model 101
Table 5.1: Simulation result for (True value of 1.5, 1.5, 0.5 ) 112
Table 5.2: Simulation result for (True value of 1.5, 1.5, 0.5 ) 112
Table 5.3: Simulation result for (True value of 1.5, 1.5, 0.5 ) 113
Table 5.4: Simulation result for (True value of 1.5, 1.5, 0.5 ) using
Minimum Sum method 114
Table 5.5: Simulation result for (True value of 1.5, 1.5, 0.5 ) using
Polyroot method 114
Table 5.6: Simulation result for (True value of 1.5, 1.5, 0.5 ) using Best
and Fisher method 114
Table 5.7: Simulation result for (True value of 1.5, 1.5, 0.5 ) using Amos
method 115
Table 5.8: Simulation result for (True value of 1.5, 1.5, 0.5 ) using
Dobson method 115

xiv
Table 5.9: Coverage probability and expected length of ME1 and ME2 for various
value of and samples size n 123
Table 5.10: Coverage probability and expected length of ME1, ME2, and Bootstrap
for 10 and 100n 125
Table 5.11: Parameters estimation of Humberside Wind data A (W129) and
Humberside Wave data (WAVE72) with the new functional relationship
model 126
Table 6.1: Observations (in radian) used to illustrate the similarity measure 132
Table 6.2: Example of similarity matrix 133
Table 6.3 135
Table 6.4 136
Table 6.5 136
Table 6.6: The power of performance of the clustering method using “success”
probability (pout) 148
Table 6.7: The power of performance of the clustering method using masking error
(pmask) 151
Table 6.8: The power of performance of the clustering method using swamping
error (pswamp) 154
Table 6.9: Parameters estimation of Humberside Wind data (W129) and
Humberside Wind data (W127) with Down and Mardia circular-circular
regression model 161

xv
LIST OF FIGURES
FIGURE PAGE
Figure 1.1: Initial direction and orientation of the circle 2
Figure 1.2: Flow of the study 7
Figure 2.1: Representation of direction x by angle θ or as a unit complex number z
on a circle 11
Figure 2.2: (a) Circular raw data plot (b) Circular histogram 12
Figure 2.3: (a) Linear histogram (b) Rose diagram 13
Figure 2.4: The arithmetic mean points the wrong way 14
Figure 2.5: Von Mises densities for 0 and different value of 20
Figure 2.6: Branches and root in hierarchical clustering methods 47
Figure 2.7: Representation of (a) Single linkage, (b) Complete linkage, (c) Average
linkage, and (d) Centroid 49
Figure 4.1: Scatter plot of HF radar (x) and anchored buoy (y) with the fitted Down
and Mardia regression line for Humberside Wind data (W129) 102
Figure 4.2: Von Mises quantile plot of circular residuals for Humberside wind data
(W129) 103
Figure 5.1: Scatter plot of HF radar (x) and anchored buoy (y) with the fitted new
functional relationship model for Humberside wind data (W129) 127
Figure 5.2: Von Mises quantile plot of circular residuals with the fitted new
functional relationship model for Humberside wind data (W129) 129
Figure 6.1: Steps in single linkage clustering algorithm 134
Figure 6.2: Cluster tree to illustrate the single linkage algorithm 137
Figure 6.3: The output from SPlus agglomerative hierarchical clustering 137

xvi
Figure 6.4: Plot of observations used to illustrate the single linkage clustering
algorithm 141
Figure 6.5: Steps in clustering algorithm for circular variables 143
Figure 6.6: Flowchart summarizing performance assessment of methodology 145
Figure 6.7: Plot of “success” probability (pout) versus the level of contamination
for 30, 50,100,120n and 150 and various values of error
concentration parameter . 149
Figure 6.8: Plot of “success” probability (pout) for 5,10, 15 and 20 and various
values sample size n 150
Figure 6.9: Plot of masking error (pmask) for 30, 50,100,120n and 150 and
various values of error concentration parameter 152
Figure 6.10: Plot of masking error (pmask) for 5,10,15 and 20 and various
values sample size n 154
Figure 6.11: Plot of swamping error (pswamp) for 30, 50,100,120n and 150 and
various values of error concentration parameter 156
Figure 6.12: Plot of swamping error (pswamp) for 5,10,15 and 20 and various
values sample size n 157
Figure 6.13: The scatter plot of Humberside wind direction data (W129) with the
highlighted outlier observations 159
Figure 6.14: The scatter plot of predicted and residual values for the Humberside
wind direction data (W129) from the Down and Mardia circular-circular
regression model fit. 159
Figure 6.15: The cluster tree and corresponding cut height for Humberside wind
direction data (W129) 160

xvii
Figure 6.16: The scatter plot of simulated data set with the highlighted outlier
observations 163
Figure 6.17: The scatter plot of predicted and residual values for the simulated data
from the Down and Mardia circular-circular regression model fit. 163
Figure 6.18: The cluster tree and corresponding cut height for simulated data set 164

xviii
LIST OF SYMBOLS
Concentration parameter
Estimate value of concentration parameter
x A unit vector in the plane
θ An angle on the circle (A circular data)
z A unit complex number on a circle
R Resultant length
R Sample Mean resultant length
Sample Mean direction
Mean direction
Estimate value of Mean direction
Mean resultant length (precision parameter)
A Mean resultant length for von Mises distribution
n Sample sizes
Sample Median direction
V Sample circular variance
Sample circular standard deviation
Sample circular dispersion
0d Circular mean deviation
0D Circular mean difference
pI The modified Bessel function of the first kind and order p
B Bootstrap sample sizes

xix
y Dependent (response) variable
x Independent (predictor) variable
e Angular error
e Fitted error
Circular random error for dependent variable
Circular random error for independent variable
Ratio of error concentration parameters in a functional
relationship model
h Height of a cluster tree
h Average height of a cluster tree
hs Sample standard deviation of the heights of a cluster tree
d Circular distance
ijd Distance between observation i and j
means of concentration parameter
v Dependent (response) variable for Down and Mardia model
u Independent (predictor) variable for Down and Mardia model
v Predicted (fitted) values
s Number of simulation
Y Dependent random variable for a functional relationship model
X Independent random variable for a functional relationship model
Corrected estimator of concentration parameter
I Fisher information matrix

xx
LIST OF ABBREVIATIONS
AC Agglomerative coefficient
AEB Absolute Estimated Bias
cdf Cumulative distribution function
CI Confidence interval
cov Covariance
DM Down and Mardia
DMCE Difference Mean Circular Error
DMCEs Difference Mean Circular Error Statistic
EAE Estimated Absolute Error
EIV Error in variables
ERE Estimated Relative Error
ESE Estimated Standard Error
ERMSE Estimated Root Mean square Error
JS Jammalamadaka and SenGupta
LS Least square
ME1 Method 1
ME2 Method 2
MLE Maximum likelihood estimation
MS Minimum sum method
ms Minimum sum function
pdf Probability density function
Prob Probability
pmask Masking error

xxi
pswamp Swamping error
polyroot Polyroot method
pout “Success” probability of detecting outliers
se Standard error
var Variance
VM Von Mises distribution

1
CHAPTER 1 : RESEARCH FRAMEWORK
1.1 Background of the Study
Circular statistics is a branch of statistics that involve circular data in the form of
direction or cyclic time. Circular data are measured in degree 0 , 360 or radian
0, 2 . Examples of circular data include the days of the week and compass direction.
Since the data are cyclic, Monday is said to be closer to Sunday than to Wednesday,
while 350o closer to 1o than to 300o. We can found the applications of circular statistics
in various areas such as in biology, geology, geography and medical. For example,
biologist used circular statistics to study the orientation of an animal while
meteorologist used this method to study the direction of the wind. Mardia and Jupp
(2000) stated that circular data can also be identified in waves of sound, the human
perception under various conditions, the orientation of ridges of fingerprints, the
orientation of sand grains from a beach, the death due to a disease at various times in a
year, and astronomical observations.
Circular data are usually measured using a compass, clock, protractor or other
circular measuring instruments. We represent a single circular observation θ˚ as a point
on a circle of unit radius or unit vector. Generally, the researchers will choose an initial
direction and an orientation of the circle based on the needs and nature of the studies.
This situation is described and illustrated in Figure 1.1. The idea is to choose an
orthogonal coordinate system on the plane. Then, each circular observation can be
specified by the angle from the initial direction to a point on the circle corresponding to
the observation (Mardia and Jupp, 2000).

Figure 1
New theories and statistical methods of circular data are
years. However, we believe that many statistical aspects
refined. In particular,
distribution. The von Mises distribution is the most common continuous probability
distribution on the circle and known as the circular normal distribution
close relationship to the normal distribution in
statistical inferences on the circle such as
and prediction. One of the parameter
the concentration parameter. According to Mardia and Jupp (2002, p39
Jammaladaka and SenGupta (2001, p35
distribution describes how concentrated the d
can be found in the literature
parameter cannot be obtained analytically
Apart from univariate circular data, researchers sometimes
circular data. Many researchers show strong interests in circular regression models and
circular functional relationship models.
circular regression methods have been used in many diverse applications since 1957.
1.1: Initial direction and orientation of the circle
New theories and statistical methods of circular data are developed over the
. However, we believe that many statistical aspects can further be improved and
In particular, we may focus on the parameter estimation of
he von Mises distribution is the most common continuous probability
distribution on the circle and known as the circular normal distribution
close relationship to the normal distribution in a real line. It plays a major role in many
statistical inferences on the circle such as the sampling distribution, confidence interval,
One of the parameters being considered in the von Mises distribution
concentration parameter. According to Mardia and Jupp (2002, p39
Jammaladaka and SenGupta (2001, p35-42), the concentration parameter in
describes how concentrated the data is towards the center. Several solutions
can be found in the literature since the parameter estimation of the concentration
parameter cannot be obtained analytically.
Apart from univariate circular data, researchers sometimes deal with
Many researchers show strong interests in circular regression models and
circular functional relationship models. According to Down and Mardia (2002),
circular regression methods have been used in many diverse applications since 1957.
2
ircle
developed over the
be improved and
the parameter estimation of the von Mises
he von Mises distribution is the most common continuous probability
distribution on the circle and known as the circular normal distribution because of its
real line. It plays a major role in many
sampling distribution, confidence interval,
von Mises distribution is
concentration parameter. According to Mardia and Jupp (2002, p39-41) and
the concentration parameter in von Mises
ata is towards the center. Several solutions
the parameter estimation of the concentration
deal with bivariate
Many researchers show strong interests in circular regression models and
According to Down and Mardia (2002),
circular regression methods have been used in many diverse applications since 1957.