Embed Size (px)
Citation preview

Water and sustainability
Practical Test
Paramecium – Fajans titration – Blue energy
December, 9th 2017
Carefully read the “EXAMINATION RULES” and “EXPERIMENT INSTRUCTIONS”

14th IJSO 2017, Nijmegen, The Netherlands ‒ Practical test ‒ Dec. 9th 2017 page 2 of 19
EXAMINATION RULES
1. You are NOT allowed to bring any personal items into the examination room, except for
personal medicine or approved personal medical equipment.
2. You must sit at your designated table.
3. Check the stationery items (pen, calculator, ruler, and scrap paper) provided by the
organizers.
4. Do NOT start your experiments before the “START” signal.
5. You are NOT allowed to leave the examination room during the experiment, except in
an emergency in which case you will be accompanied by a
supervisor/volunteer/invigilator.
6. Do NOT disturb other competitors. If you need assistance, raise your hand and wait for a
supervisor to come.
7. You can ONLY ask questions and discuss the experiments with your own team members.
You must STAY at your table until the end of the time allocated for the experiments,
even if you have finished the experiments or do not wish to continue.
8. At the end of the experiment time you will hear the “STOP” signal. Do NOT write
anything more on the answer sheet after this stop signal. Arrange the exam, answer
sheets, and the stationary items (pen, calculator, ruler, and scrap paper) neatly on your
desk. Do NOT leave the room before all the answer sheets have been collected.

14th IJSO 2017, Nijmegen, The Netherlands ‒ Practical test ‒ Dec. 9th 2017 page 3 of 19
EXPERIMENT INSTRUCTIONS
1. After the “START” signal, you will have 15 minutes to read the experiments. In this
time, it is NOT allowed to conduct the experiment yet, or answer the questions.
2. After the first 15 minutes, another whistleblow will indicate that you can start the
experiment and start answering question. From this moment you have three hours to
complete the test.
3. Use only the pen and pencil provided by the organizers.
4. The total number of experiments is 3. Check if you have a complete set of the exam
sheets (16 pages, page 4 – page 19) and answer sheets (28 pages - including the front
page). Raise your hand, if you find any sheets missing.
5. Check that your name, code and country are filled in on your answer sheets and sign
every page of the answer sheets. Raise your hand, if you find any sheets missing.
6. Read the experimental procedures and questions carefully and write your answers in
the corresponding boxes of the answer sheets.
7. When units are provided in the answer sheets, you have to write the answers correctly
for the units.
8. Always show your calculations if room for this is provided. If you do not show your
calculations, no points are awarded for the question.
9. You should write your final answers down in the appropriate number of digits.
10. You MUST wear a Lab Coat and Safety Glasses during the experiments.
11. You will be provided with two sets of translated answer sheets. Only the YELLOW
answer sheets will be evaluated. You can split up the white answer sheets among your
team and use them as scrap paper, but they will NOT be evaluated.
12. The YELLOW answer sheets should be kept behind the cardboard shield.
13. The number of points that can be obtained is indicated for each question.
14. Use of micropipette (Gilson pipette):
a) Set the volume with the thumb wheel. Maximum volume for P1000 is 1000 µL
(indicated by a red one (1) and two black zeros (0), the bars on the last wheel
indicate the third decimal); for P20 the maximum is 20 µL. (Black two (2),
black zero (0) and red zero (0)). Do not exceed the maximum volume!
b) Fit the pipette tip to the pipette.
c) Push the pushbutton until the first stop.
d) For liquid take up: insert tip under liquid level and slowly release the pushbutton.
e) For liquid dispensing: place tip in another container and push the pushbutton until
the second stop.
f) Remove the tip.

14th IJSO 2017, Nijmegen, The Netherlands ‒ Practical test ‒ Dec. 9th 2017 Biology – Paramecia page 4 of 19
Biology - The contractile vacuole of Paramecium
Introduction
Paramecia are one of the best known
and most studied types of unicellular
organism. The shape of a Paramecium
cell somewhat resembles a slipper,
although the front is located at the
'heel' and the back at the ‘toes’ of the
slipper (Figure 1).
Paramecia are mostly cultivated in 'hay
infusion' (water in which hay has been
boiled for about ten minutes). Bacteria
feed on the degradation products of
the hay and readily grow in this
medium. Paramecia in turn consume
the bacteria, allowing them to thrive in
the medium as well.
Paramecia contain some interesting
cell organelles named ‘contractile
vacuoles’. These vacuoles are used to
pump water out of the cell.
In this experiment, you will investigate
the contraction frequency of the
anterior (= ‘at the front’) contractile
vacuole of Paramecium caudatum for
two salt concentrations of the surroundings.
Read the protocol and answer question 1 on the answer sheet.
Figure 1 – Schematic drawing of a Paramecium cell with contractile vacuoles and some other cell
organelles indicated.
Cilia
Anterior contractile
vacuole
Posterior contractile
vacuole
Food vacuoles
Macronucleus
Radial channels
Micronucleus

14th IJSO 2017, Nijmegen, The Netherlands ‒ Practical test ‒ Dec. 9th 2017 Biology – Paramecia page 5 of 19
Protocol
Investigation of the contraction frequency of the anterior contractile
vacuole
To be able to investigate the contraction frequency of Paramecium's anterior contractile
vacuole, you must study live Paramecia under the microscope. For this, you will prepare
your own microscopy samples following these steps: First, you will concentrate the
Paramecia from the hay infusion (section A). Then, you will prepare a microscopy sample
of the concentrated Paramecium culture (sections B and C). Finally, you will analyse the
Paramecia under the microscope (section D).
ATTENTION! It is important that the Paramecia in the microscopy samples are as fresh as
possible when you analyse them. Therefore, perform all sections (A, B, C and D) for one
salt concentration before moving on to the other salt concentration.
ATTENTION! It is possible that some Paramecia do not survive the preparation of the
microscopy sample. Do not analyse Paramecia that are not healthy (swollen or shrunken or
with protruding vesicles), that do not show any movement at all or whose vacuoles
contract less than once per minute. If your sample does not contain enough healthy
Paramecia, you have to make a new sample. You are allowed to use more than one droplet
for your observations.
Materials
A 50 mL Erlenmeyer flask with water
A plastic 15 mL tube labelled ‘P—’, containing a Paramecium culture in hay infusion
without any additions
A plastic 15 mL tube labelled ‘P+’, containing a Paramecium culture with extra sodium
chloride added to increase the salt concentration by 0.03 mol/L
A 15 mL tube rack
An empty 1.5 mL microcentrifuge tube labelled with ‘P—’ and your group number
An empty 1.5 mL microcentrifuge tube labelled with ‘P+’ and your group number
An empty 1.5 mL microcentrifuge tube labelled ‘•’
Three spare microcentrifuge tubes
A P1000 micropipette with blue pipette tips
A P20 micropipette with yellow pipette tips
A microcentrifuge, at one side of the lab, managed by a supervisor
A plastic 15 mL tube labelled ‘G—’, containing methylcellulose gel without any
additions
A plastic 15 mL tube labelled ‘G+’, containing methylcellulose gel with added sodium
chloride to a concentration of 0.03 mol/L
A microcentrifuge rack
Microscopy slides
Cover slips
A microscope
A stopwatch
A small waste bin
Dissection needle

14th IJSO 2017, Nijmegen, The Netherlands ‒ Practical test ‒ Dec. 9th 2017 Biology – Paramecia page 6 of 19
Experimental Procedure
A. Concentrating Paramecia
1. Use a P1000 micropipette to transfer 1.5 mL water to the microcentrifuge tube labelled
‘•’. Tightly close the tube with the attached cap.
2. Use a P1000 micropipette to transfer 1.5 mL Paramecium culture from the 15 mL tube
labelled ‘P—’ to the 1.5 mL microcentrifuge tube with the same label. Tightly close the
tube with the attached cap.
3. Have a supervisor centrifuge the microcentrifuge
tube labelled with ‘P—’ and your group number,
and the tube labeled ‘•’ for 3 minutes at 3000
rpm. The tube labelled with ‘•’ is used as
counterbalance.
4. Obtain the centrifuged tubes. The Paramecia are
now collected in a so-called ‘pellet’, at the
bottom of the tube with your group number, a
little to the side of the tube where the cap
attaches (see Figure 2).
5. Set the P1000 micropipette to 1 mL and, immediately after centrifugation, extract 1
mL of the supernatant (the liquid above the pellet) from the microcentrifuge tube.
Take care NOT to take up the pellet, so do NOT put the pipette tip at the bottom of
the tube! Dispose of the 1 mL of supernatant in a sink.
6. Close the tube and firmly tap the bottom of the tube a couple of times with your finger
to resuspend the Paramecia. After that, make sure all liquid is collected at the bottom
of the tube again.
7. You now have 0.5 mL concentrated Paramecium suspension. Every time when using this
suspension for preparing a microscopy sample, first tap it with your finger to
homogenise.
B Preparing a microscopy sample for inspection by a supervisor
1. Set your P20 micropipette to 5 µL and leave it at this setting. Use this micropipette to
place 4 droplets of 5 µL of the concentrated Paramecium suspension on a microscopy
slide, as shown in Figure 3.
2. Place the microscopy slide with the droplets on the stage
of the microscope.
3. Use the correct procedure to magnify the sample 40x (10x
ocular lens and 4x objective) and make sure a
Paramecium is in focus.
4. Raise your finger to attract the attention of a supervisor.
He or she will inspect your sample and award points in
question 2 depending on your preparations.
5. After your sample has been inspected, read question 3 on the answer sheet, but do
not answer it yet until after performing section D. Magnify the sample 100x and
observe the Paramecia.
Figure 2 – Schematic drawing of a micro- centrifuge tube with a pellet (grey
area).
Figure 3 – schematic drawing of a microscopy
slide with 4 droplets.

14th IJSO 2017, Nijmegen, The Netherlands ‒ Practical test ‒ Dec. 9th 2017 Biology – Paramecia page 7 of 19
C. Preparing a microscopy sample for analysis
1. Use the P20 micropipette to place a total of 25 µL of the methylcellulose gel from the
tube labelled ‘G—’ in the middle of a microscopy slide. ATTENTION: move the plunger
of the pipette in a slow manner to avoid air bubbles in the tip.
2. Now, again use the P20 micropipette to take up 5 µL of the Paramecium suspension and
carefully deliver it into the gel droplet on the microscopy slide.
3. Use a dissection needle to carefully but thoroughly mix the Paramecia with the gel. Try
to prevent the droplet from spreading over the slide and try to prevent the formation
of air bubbles.
4. Carefully place a coverslip on the gel droplet, but do NOT press it! Your microscopy
sample is now ready for use.
D Observing Paramecia
1. Place the microscopy slide with the sample on the stage of the microscope.
2. Use the correct procedure to magnify the sample 100x.
3. Take a good look at the Paramecia.
Answer question 3.
The Paramecia have two contractile vacuoles, one at the front (the anterior contractile
vacuole) and one at the back (the posterior one) of the cells (see Figure 1). During the
entire experiment, observe the anterior contractile vacuoles.
4. Observe six consecutive contractions of the anterior vacuole of a Paramecium. Note
down the total time between contraction 1 and contraction 6 in Table A2 in question 4
on your answer sheet. Repeat this for eight more Paramecia.
Repeat the procedures in sections A, C and D for the Paramecium culture with the higher
concentration labelled ‘P+’. You do NOT have to get your sample checked, i.e. you should
skip section B completely. In section C, use the methylcellulose gel from the tube labelled
‘G+’ instead of the ‘G—’ gel.
Answer questions 5-12.

14th IJSO 2017, Nijmegen, The Netherlands ‒ Practical test ‒ Dec. 9th 2017 Chemistry – Fajans titration page 8 of 19
Chemistry - Determining the concentration of a
sodium chloride solution using the Fajans titration
procedure
Introduction
Sea water contains about 35 g of salts per liter, most of which is sodium chloride. From the
difference in salt concentrations between sea water and fresh water, electrical energy can
be generated using so-called ‘blue energy’ techniques.
Weighing titration
To determine the chloride concentration of water, a technique that is called weighing
titration can be employed.
In a ‘normal’ (volumetric) titration, a solution of a substance X with an unknown
concentration is pipetted into an Erlenmeyer flask. An indicator is added and the solution
of X in the Erlenmeyer flask is titrated with a second solution with a known concentration
of reagent by slowly adding this solution from a burette. When the indicator changes
colour, the end point of the titration is reached and the concentration of substance X can
be calculated from the volume of the solution of X, the volume of the reagent solution that
was added, the concentration of the reagent solution, and the ratio in which the
substances react with each other.
In a weighing titration both the solution of X and the reagent solution are contained in
syringes. Both syringes are weighed before the titration is started. Then, a certain amount
of the solution of X is transferred from its syringe into an Erlenmeyer flask. An indicator is
added and the solution of X in the Erlenmeyer flask is titrated with the second solution
with a known concentration of reagent by slowly adding this solution from the second
syringe. When the indicator changes colour, the end point of the titration is reached and
both syringes are weighed again. The concentration of substance X can be calculated from
the densities of both solutions, the masses of the solutions that were transferred to the
Erlenmeyer flask, the concentration of the reagent solution, and the ratio in which the
substances react with each other.
Importantly, in a weighing titration, it is very easy to correct for adding too much reagent
solution (‘overshooting the end point’) by adding a bit of the solution of X again until the
indicator has regained its original colour and then titrating the solution again with the
reagent solution. Both syringes are only weighed when the end point has been reached
exactly.

14th IJSO 2017, Nijmegen, The Netherlands ‒ Practical test ‒ Dec. 9th 2017 Chemistry – Fajans titration page 9 of 19
Figure 1 – A disposable plastic pipette with scale marks indicated by arrows.
The experiment
In this experiment, you will use the so-called Fajans titration to determine the
concentration of a solution of sodium chloride (NaCl). The Fajans titration involves
titrating the sodium chloride solution with a solution of silver nitrate (AgNO3), resulting in
a white precipitate according to the following reaction:
Ag+(aq) + Cl—(aq) AgCl(s)
Some dextrin (a kind of starch) is added to prevent the precipitate from coagulating too
much. Dichlorofluorescein functions as the indicator. It changes from yellow to pink when
the end point of the titration is reached.
Materials
ATTENTION! The amounts of provided materials, detailed in the list below, are more than
sufficient to carry out the experiments in full. In case you inadvertently spill, break or use
too much of something, replacement / replenishment is available, but it will cost you and
your team one full mark out of the thirteen you can earn for this experiment. The only
exception is demineralized water, which you can obtain at no cost in marks by handing in
your empty bottle to a supervisor. You will receive a full bottle in return.
• A 250 mL or 300 mL
Erlenmeyer flask
• Two 50 mL beakers
• Two 20 mL plastic syringes
• Two blunt needles
• A small spatula
• A P1000 micropipette
• A pipette stand
• Two blue micropipette tips
• Paper towels
• A waste canister, labelled
‘Waste’
• A permanent marker pen
• Disposable gloves (available
from boxes at a central point
in the lab)
• A cardboard cover for the
table
• A plastic bottle, labelled ‘NaCl’, containing 100 mL
of a sodium chloride solution of unknown
concentration
• A black plastic bottle, labelled ‘AgNO3’, containing
75 mL of a 20.00 g/L silver nitrate solution
• A 15 mL centrifuge tube, labelled ‘DCF’,
containing a 1 mg/mL solution of
dichlorofluorescein in 96% ethanol
• A centrifuge tube rack
• A wash bottle with demineralized water
• A capped glass vial, labelled ‘Dextrin’, filled with
dextrin
• Two 10 mL glass vials
• An accurate scale (shared by two teams)
• A 1.0 mL disposable plastic pipette with scale
marks (see Figure 1 below)
0.25 mL 0.50 mL 0.75 mL 1.0 mL

14th IJSO 2017, Nijmegen, The Netherlands ‒ Practical test ‒ Dec. 9th 2017 Chemistry – Fajans titration page 10 of 19
Data
In table 1 below, you can find the standard atomic weights of some elements:
Table 1 – Standard atomic weights
of some elements
Element Standard atomic weight
N 14.01
O 16.00
Na 22.99
Cl 35.45
Ag 107.87
Safety precautions
ATTENTION! You are required to wear gloves during the entire experiment. Although the
solutions used are quite harmless, spilled silver nitrate solution can lead to ugly brown
spots on your skin. The same holds for your clothes, the table and the floor, so try to
prevent spilling the solution and, if you accidentally spill something, clean up any droplets
immediately with a paper towel.
Before using the solutions of NaCl and AgNO3 pour them in a beaker.
Do not attempt to remove any air bubbles out of the syringes.

14th IJSO 2017, Nijmegen, The Netherlands ‒ Practical test ‒ Dec. 9th 2017 Chemistry – Fajans titration page 11 of 19
A. Determining the densities of the solutions
Use the scale, the micropipette (and tips!) and the glass vials to determine the densities
of the solutions of sodium chloride and silver nitrate. Make sure that you obtain highly
accurate values for the densities of the solutions! Write your measurements, calculations
and answers on the answer sheet.
B. A trial titration
Goals
The trial titration has two goals:
estimating the approximate volume of silver nitrate solution that needs to be added to
a certain amount of the sodium chloride solution to reach the end point.
observing the colour change of the indicator at the end point. Note that the colour of
the yellow solution gradually becomes somewhat orange; this is NOT the end point of
the titration. The end point is reached when the yellow-orange colour of the
suspension has just (i.e. with the addition of a single droplet) clearly changed to pink
and remains pink also after you thoroughly swirled the contents of the Erlenmeyer flask.
Procedure
1. Equip one of the syringes with a blunt needle.
2. Fill the syringe up to the 15 mL mark with the sodium chloride solution.
3. Dry off any liquid on the outside of the syringe and the needle, also from the needle tip.
Do not worry about the air bubble in the syringe.
4. Carefully empty the syringe into the 250 mL Erlenmeyer flask.
5. Add about 85 mL of demineralized water to the solution in the Erlenmeyer flask.
6. Add three spatulas full of dextrin to the Erlenmeyer flask. Swirl the flask to suspend
the dextrin.
7. Use the disposable pipette to add about 0.5 mL of dichlorofluorescein solution to the
Erlenmeyer flask.
8. Equip the other syringe with the second blunt needle.
9. Fill the syringe up to the 20 mL mark with silver nitrate solution.
10. Dry off any liquid on the outside of the syringe and the needle, also from the needle tip.
11. Now, titrate the sodium chloride solution with the silver nitrate solution by adding
silver nitrate solution to the sodium chloride solution in the Erlenmeyer flask while
constantly or intermittently swirling the contents of the flask. Keep adding silver
nitrate solution until you have reached the end point
12. Read off the remaining volume of silver nitrate solution in the syringe and calculate the
volume of silver nitrate solution that you have added.
13. If you like, you may experiment a little by adding a few droplets of sodium chloride
solution again, followed by some droplets of silver nitrate solution, so you get an idea
of the principle of weighing titration.
14. When you are finished, pour the suspension from the Erlenmeyer flask into the waste
canister. Thoroughly rinse the Erlenmeyer flask three times with demineralized water.
Also pour the rinsings into the waste canister.
C. Accurate titrations
ATTENTION! To accurately titrate the sodium chloride solution, it is important that you
add the indicator solution only just before the end point of the titration is reached.

14th IJSO 2017, Nijmegen, The Netherlands ‒ Practical test ‒ Dec. 9th 2017 Chemistry – Fajans titration page 12 of 19
Procedure
1. Fill the first syringe up to the 20 mL mark with the sodium chloride solution.
2. Dry off any liquid on the outside of the syringe and the needle, also from the needle tip.
3. Weigh the syringe in the upright position with the solution. Write the initial mass on
the answer sheet.
4. Carefully empty the syringe down to the 5 mL mark into the 250 mL Erlenmeyer flask.
So, only expel about 15 mL from the syringe; it is important that some sodium chloride
solution remains in the syringe!
5. Add about 85 mL of demineralized water to the Erlenmeyer flask.
6. Add three spatulas full of dextrin to the Erlenmeyer flask. Swirl the flask to suspend
the dextrin.
7. Fill the second syringe up to the 20 mL mark with silver nitrate solution.
8. Dry off any liquid on the outside of the syringe, also from the tip.
9. Weigh the syringe with the solution. Write the initial mass on the answer sheet.
10. Now, titrate the sodium chloride solution with the silver nitrate solution until you are
about 1 mL away from the end point.
11. Use the disposable pipette to add 0.5 mL of dichlorofluorescein solution to the
Erlenmeyer flask.
12. Complete the titration.
13. When you are satisfied that you have exactly reached the end point, weigh both
syringes and write down their final masses on the answer sheet.
14. When you are finished, pour the suspension from the Erlenmeyer into the waste
canister. Thoroughly rinse the Erlenmeyer flask three times with demineralized water.
Also pour the rinsings into the waste canister.
Repeat the accurate titration two times (so three accurate titrations in total). Then work
out the questions on the answer sheets.

14th IJSO 2017, Nijmegen, The Netherlands ‒ Practical test ‒ Dec. 9 2017 Physics – Blue energy page 13 of 19
Physics - Blue energy
Introduction
In 1932, in the Netherlands, a dyke was built
that dammed off the former Southern Sea from
the Wadden Sea (Figure 1). That dyke, called the
Closure Dyke, caused the former salty Southern
Sea to become the fresh-water Lake IJssel,
named after the river IJssel that feeds it. To
regulate the water level in the lake, water is
drained through the Closure Dyke into the
Wadden Sea at low tide.
From the difference in salt concentrations
between sea water and fresh water, electrical
energy can be generated. The general name for
electrical energy generated from differences in
salt concentration is ‘Blue energy’. One of the
ways to generate electrical energy in an energy
power plant is called ‘Reverse ElectroDialysis’
(RED). In such a plant, salt and fresh water are
physically separated by membranes that allow
either positively charged ions or negatively
charged ions to pass through. Due to the
concentration difference, ions from the salt water migrate to the fresh water. This charge
transport can be used to generate electricity. Blue energy is a renewable source of energy
that does not result in the production of greenhouse gases such as CO2, NOx and SOx.
Goals and experimental setup.
You will use two experimental setups to generate results that you can use to estimate how
much energy can maximally be generated from the difference in salt concentrations
between using a Blue Energy power plant. The complete experiment consists of three parts:
A. Setup A: The concentration cell
You will use this setup to measure the voltage ( = the electric potential difference)
between salt solutions of different concentrations.
B. Setup B: Conductivity
You will use this setup to measure the electrical conductivity of the different salt
solutions.
C. Carrying out a number of calculations.
Figure 1 – The Lake IJssel with the Closure Dyke in the North. The contours of the former Southern Sea are indicated by the bold line.
Closure Dyke

14th IJSO 2017, Nijmegen, The Netherlands ‒ Practical test ‒ Dec. 9 2017 Physics – Blue energy page 14 of 19
Equation sheet
Ohm’s law: Δ𝑉 = 𝐼 ⋅ 𝑅
Electrical conductance: 𝐺 =1
𝑅 ; unit is siemens: [𝐺] = S =Ω−1
Specific electrical conductivity: 𝜎 = 𝐺𝑙
𝐴
Electrical power 𝑃 = Δ𝑉 ⋅ 𝐼
Circumference of a circle: 2𝜋𝑟
Area of a circle: 𝜋𝑟2

14th IJSO 2017, Nijmegen, The Netherlands ‒ Practical test ‒ Dec. 9 2017 Physics – Blue energy page 15 of 19
A. Measuring potential differences using the concentration cell
Goals of the experiment
1. Measuring the potential differences between solution X0 and solutions X1 X4.
2. Determining the concentration of solution X0.
The experiment
Setup
A photograph of the experimental setup is provided in Figure 2 (start situation).
Materials
Two beakers of 100 mL (indicated by A in Figure 2)
A stand with clamps
A salt bridge (B)
Two silver/silver chloride electrodes (C)
A plastic holder for the salt bridge and the
electrodes (D)
A digital multimeter
A red electrical wire
A black electrical wire
One 250 mL flask labeled X0, containing a salt
solution of unknown concentration
Four 250 mL flasks labeled X1 to X4, containing salt
solutions of different known concentrations. (Note:
you also need these flasks in experiment B)
A list of concentrations is provided with the setup.
Paper towels
ATTENTION!
Be careful using the electrodes! Always store them with their wires in a salt solution
except while changing solutions. Do not rinse them with demineralized water.
Do NOT use the Ω-position of the multimeter switch, the silver chloride electrodes will
be severely damaged and thereafter useless.
If the multimeter beeps, press the RANGE button to prevent it from switching off. If it
switched off, turn the dial to OFF and then back to mV .
If you have any other problems regarding the multimeters, please contact the lab
assistants.
B
C C
D
A A
Figure 2 – Experimental setup,
start situation

14th IJSO 2017, Nijmegen, The Netherlands ‒ Practical test ‒ Dec. 9 2017 Physics – Blue energy page 16 of 19
Performing the experiment
At the start of the experiment the setup is as depicted in Figure 2. The salt bridge and
electrodes are both submerged in salt solution X0. During the experiment the content of
the left beaker is replaced by solutions X1 to X4, the right beaker stays filled with the X0
solution.
1. Set the dial of the multimeter to mV and press the blue button to select direct
current (DC).
2. Connect carefully the right electrode with the red electrical wire to the 𝑉Ω port of the
multimeter and the left electrode with the black electrical wire to the COM port of the
multimeter.
3. Wait until the multimeter indicates a reasonably stable voltage. Write down the
voltage in table A1 on the answer sheet (Note: the voltage can have a positive or
negative value). If the voltage is larger than 3 mV (or less than -3 mV), ask the lab
assistant for a new set of electrodes!
4. Raise the clamp with holder such that the salt bridge and electrodes are removed from
the solutions. Empty the left beaker in the sink. Dry the inside of the beaker
thoroughly with a paper towel.
5. Pour approximately 80 mL of solution X1 in the beaker and place it back on the stand
base.
6. Lower the clamp with the holder such that the salt bridge and electrodes properly hang
in the solutions again.
7. Wait for the voltage to stabilize (max 5 minutes), you can gently shake the beakers
during this period. Write down the voltage in table A1 on the answer sheet.
8. Repeat steps 4 to 7 for solutions X2, X3 and X4.
9. When you are finished, leave the setup with the electrodes and salt bridge hanging in
the solutions, disconnect the electrical wires and switch off the multimeter. Ask the
lab assistant to pick up the electrodes and salt bridge for safe storage. If you need the
electrodes later again, you can ask for them.
Answer questions 1 to 5 on the answer sheets.

14th IJSO 2017, Nijmegen, The Netherlands ‒ Practical test ‒ Dec. 9 2017 Physics – Blue energy page 17 of 19
B. Measuring the electrical conductance of the solutions
Goals of the experiment
Measuring the electrical conductance of solutions X0 and X1‒X4.
Determining the concentration of X0.
Determining the specific electrical conductivity of X0 and X1‒X4.
The experiment
Materials
Two beakers of 100 mL
A set of two gold-plated electrodes (part
A in Figure 3)
AC power supply box (B) (without cable)
Two digital multimeters (C)
Four 250 mL flasks labeled X1 to X4,
containing salt solutions of different
concentrations (the same flasks as in
part A)
One 250 mL flask labeled X0, containing
a salt solution of unknown concentration
Paper towels
One set square (in your pencil case)
Four electricity wires (red, black, 2x
blue) (D) and two wires of a multimeter
(red, black) (E)
A stand with clamps
Setup
In this experiment the electrical conductance of the salt solutions will be determined with
the materials depicted in Figure 3. A set of gold plated electrodes is submerged in a
beaker containing the salt solution. The electrodes must be connected to a power supply,
which delivers an alternating voltage with a high frequency (1 kHz) and a low voltage. This
is needed to prevent electrolysis of the salt solution. From the measurement of voltage
across and current through the electrodes the electrical conductance can be determined.
In Figure 4 a schematic of the power supply is shown, with the AC voltage supply depicted
as the box with the triangle shaped symbol. During the experiment we will connect the
ports on the right side with the electrodes for the conductance measurements.
In order to measure the current, the box contains a resistor 𝑅1 = 10 Ω and an amplifier to
amplify the voltage across the resistor 10 times. The output is measured between the two
upper ports.
Figure 3 - Materials for the setup of the
experiment
A
B
C
C
D
E

14th IJSO 2017, Nijmegen, The Netherlands ‒ Practical test ‒ Dec. 9 2017 Physics – Blue energy page 18 of 19
Performing the experiment
1. Pour 80 mL of solution X0 in both beakers.
Beaker 1 will be used for measurements,
beaker 2 for rinsing with X0 in between
measurements.
2. Submerge the set of electrodes in beaker 1
such that the circular gold plated surfaces are
fully submerged in the solution.
3. Build the electrical circuit using the schematic
from Figure 4. Make sure the multimeters are
in the mV , AC setting (using the blue button
so that ‘AC’ appears in the display) for
alternating current, and connected to the appropriate sockets.
Ask a lab assistant to check your circuit and to connect your power supply.
Let the lab assistant sign the answer sheet before proceeding with the experiment!
4. Now plug the power supply in the wall socket and wait a moment until both
multimeters show a more or less constant value. If the reading of a multimeter is “OL”
(out of limit), change the range with the RANGE button, or turn the dial to V~. Write
the values in Table B1 at question 7 on the answer sheets, and complete the symbols of
the measuring quantities with the correct units in the top row.
5. Lift the electrodes out of beaker 1, and lower them in beaker 2 for rinsing.
6. Pour the contents of beaker 1 down the drain and dry the inside of the beaker.
7. Fill beaker 1 with solution X1.
8. Take the electrodes out of the clamp, shake them gently and put them back in beaker
1 in the same way as at step 2. Take the readings from the multimeters and write them
down in Table B1 at question 7 on the answer sheets.
9. Repeat the measurements (steps 5 ‒ 8) for the remaining solutions X2, X3, and X4.
Write down the readings on the answer sheet.
10. Finally, remove the power supply from the wall socket. Clean the beakers and
electrodes.
Answer questions 8 to 10 on the answer sheets
The conductance you measured is dependent on the distance between the electrodes and
the area of the conducting surface. The specific conductivity, however, is a property of
the solution and does not depend on the setup used. The relationship between
conductance and specific conductivity 𝜎 is:
𝜎 = 𝐺 ⋅ 𝑙
𝐴 in S/m.
In this equation 𝑙 is the distance between the electrodes and 𝐴 the conductive area of the
electrodes. In the cell you used this is the area of the gold plated circle.
Answer questions 11 and 12 on your answer sheets.
Figure 4 – Schematic of the power supply
box. The symbol is used for the electrodes.
14th IJSO 2017, Nijmegen, The Netherlands ‒ Practical test ‒ Dec. 9 2017 Physics – Blue energy page 19 of 19
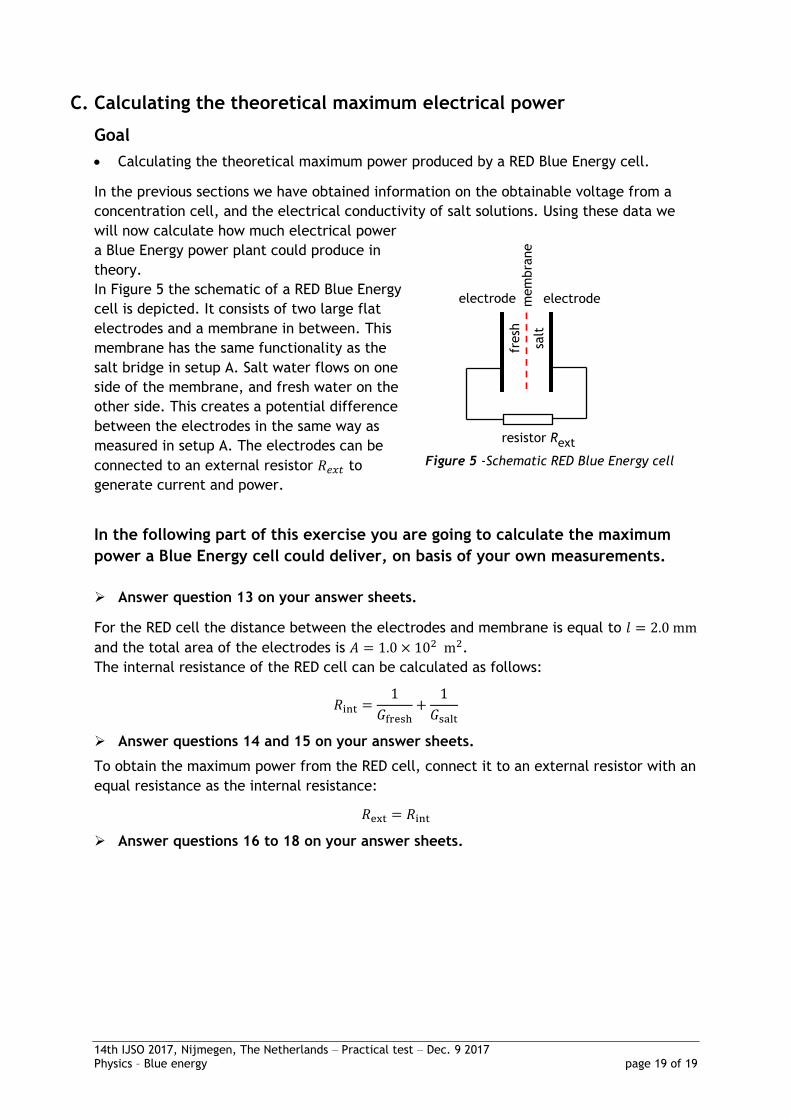
C. Calculating the theoretical maximum electrical power
Goal
Calculating the theoretical maximum power produced by a RED Blue Energy cell.
In the previous sections we have obtained information on the obtainable voltage from a
concentration cell, and the electrical conductivity of salt solutions. Using these data we
will now calculate how much electrical power
a Blue Energy power plant could produce in
theory.
In Figure 5 the schematic of a RED Blue Energy
cell is depicted. It consists of two large flat
electrodes and a membrane in between. This
membrane has the same functionality as the
salt bridge in setup A. Salt water flows on one
side of the membrane, and fresh water on the
other side. This creates a potential difference
between the electrodes in the same way as
measured in setup A. The electrodes can be
connected to an external resistor 𝑅𝑒𝑥𝑡 to
generate current and power.
In the following part of this exercise you are going to calculate the maximum
power a Blue Energy cell could deliver, on basis of your own measurements.
Answer question 13 on your answer sheets.
For the RED cell the distance between the electrodes and membrane is equal to 𝑙 = 2.0 mm
and the total area of the electrodes is 𝐴 = 1.0 × 10² m2.
The internal resistance of the RED cell can be calculated as follows:
𝑅int =1
𝐺fresh+
1
𝐺salt
Answer questions 14 and 15 on your answer sheets.
To obtain the maximum power from the RED cell, connect it to an external resistor with an
equal resistance as the internal resistance:
𝑅ext = 𝑅int
Answer questions 16 to 18 on your answer sheets.
Electrode
Resistor
Figure 5 -Schematic RED Blue Energy cell
electrode electrode
fresh
salt
resistor Rext
mem
bra
ne

Water and sustainability
Practical Test
Answer sheets
December, 9th 2017

Signature:
14th IJSO 2017, Nijmegen, The Netherlands ‒ Practical test ‒ Dec. 9th 2017 Biology - Paramecium – answer sheets page 2 of 28
The contractile vacuole of Paramecium
1. (1 point) Below, five possible statements about the experiment are given. (Note that the
statements are not necessarily correct!). Indicate in Table A1 which statements represent
hypotheses and which statements represent predictions, while making sure to match
corresponding hypotheses and their predictions if the hypotheses were true. You have to
use one statement twice.
a. The contraction frequency of the anterior vacuole is the same for both salt
concentrations.
b. Paramecium regulates water outflow by changing the contraction frequency of the
vacuole when the osmotic value of the surroundings changes.
c. Salt concentration does not affect Paramecium.
d. Paramecium counterbalances water inflow in different environments by changing only
the volume that is pumped out per contraction of the vacuole.
e. The anterior vacuole contracts more often for the lower salt concentration than for
the higher salt concentration.
Table A1 – Hypothesis and prediction
Hypothesis Prediction
1
2
3

Signature:
14th IJSO 2017, Nijmegen, The Netherlands ‒ Practical test ‒ Dec. 9th 2017 Biology - Paramecium – answer sheets page 3 of 28
2. (2.1 points) One of your supervisors will note down the scores you obtained for your
microscopy sample on his/her own sheet. He/she will tick one of the boxes below when
he/she has scored your work. DO NOT fill anything in these boxes.
3. (0.7 points) Compare the Paramecia in the samples with and without the methylcellulose
gel. What is the most appropriate reason to use a gel to make the samples? Tick the
correct answer.
A The gel provides a constant 'base level' osmotic value, so the difference
in salt concentrations between the two cultures is better defined.
B The gel inhibits the movements of the Paramecia, so it is easier to
observe them, and their contractile vacuoles, under the microscope.
C The gel prevents the water in the sample from evaporating, so the salt
concentration stays constant over time.
D The gel provides an abundant food source for the Paramecia, so they do
not have to move around anymore to collect food. As a result, it is
easier to observe them, and their contractile vacuoles, under the
microscope.
E The gel prevents the cover slip from crushing the Paramecia.

Signature:
14th IJSO 2017, Nijmegen, The Netherlands ‒ Practical test ‒ Dec. 9th 2017 Biology - Paramecium – answer sheets page 4 of 28
4. (3.9 points) Observe six consecutive contractions of the anterior vacuole of a Paramecium.
Note down the total time between contraction 1 and contraction 6 in the correct column
of Table A2 below.
Table A2. The total time between six consecutive contractions of the anterior contractile vacuoles of nine Paramecia at two different salt concentrations.
𝑡6 contractions (s) Culture →
Paramecium no. ↓
'P—' 'P+'
1
2
3
4
5
6
7
8
9
Signature:
14th IJSO 2017, Nijmegen, The Netherlands ‒ Practical test ‒ Dec. 9th 2017 Biology - Paramecium – answer sheets page 5 of 28
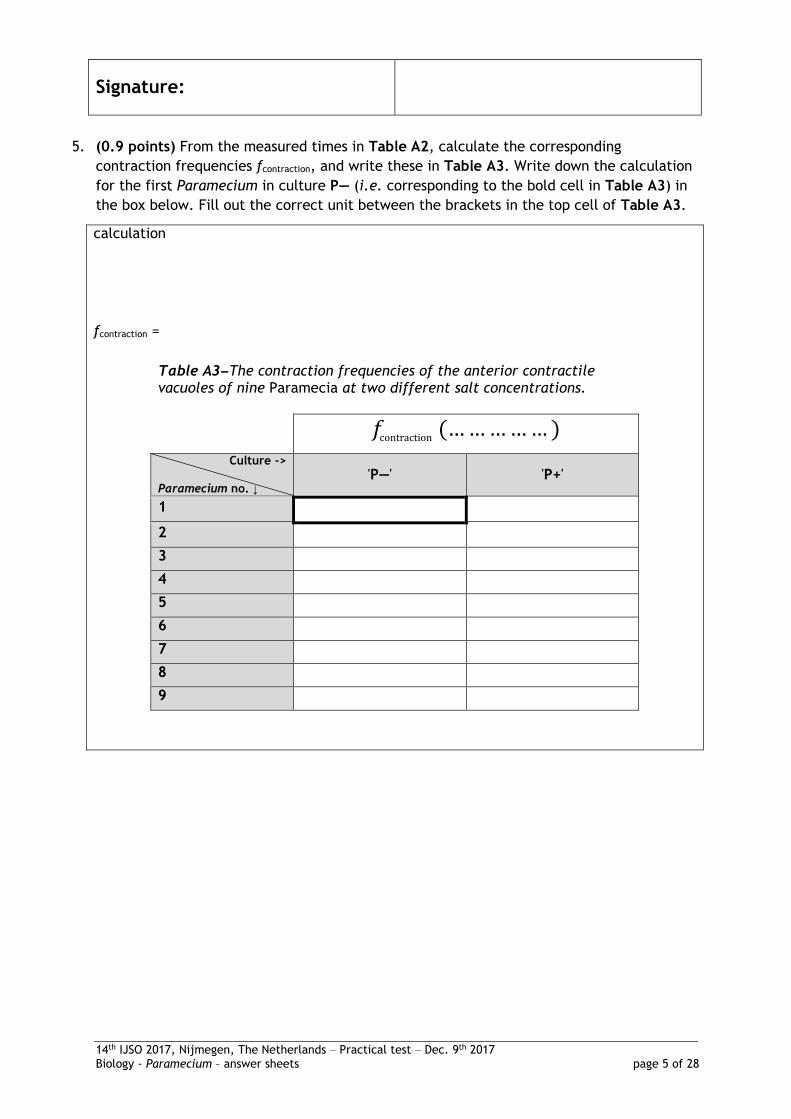
5. (0.9 points) From the measured times in Table A2, calculate the corresponding
contraction frequencies fcontraction, and write these in Table A3. Write down the calculation
for the first Paramecium in culture P— (i.e. corresponding to the bold cell in Table A3) in
the box below. Fill out the correct unit between the brackets in the top cell of Table A3.
calculation
fcontraction =
Table A3 The contraction frequencies of the anterior contractile vacuoles of nine Paramecia at two different salt concentrations.
𝑓contraction (… … … … … )
Culture -> Paramecium no. ↓
'P—' 'P+'
1
2
3
4
5
6
7
8
9

Signature:
14th IJSO 2017, Nijmegen, The Netherlands ‒ Practical test ‒ Dec. 9th 2017 Biology - Paramecium – answer sheets page 6 of 28
6. (0.8 points) From the numbers in Table A3, calculate the average contraction frequencies
of the anterior contractile vacuoles for each culture and write them in Table A4. Write
down your calculation for the 'P—' culture (i.e. corresponding to the bold cell in Table A4)
in the box below.
calculation
𝑓contraction, average, 'P—' =
Table A4 The average contraction frequencies of the anterior contractile vacuoles of nine Paramecia at two different salt concentrations.
Culture → ‘P—’ ‘P+’
𝒇contraction, average (… )
Instead of the average, scientists sometimes determine the so-called 'median' of a number of data points. The median can be found by arranging the data points from small to large (or the other way round); the median then is the middle number. If the number of data points is even, there is no middle number and the median is calculated as the average of the two middle numbers.

Signature:
14th IJSO 2017, Nijmegen, The Netherlands ‒ Practical test ‒ Dec. 9th 2017 Biology - Paramecium – answer sheets page 7 of 28
7. (0.2 points) Per culture, copy the contraction frequencies from Table A3 to Table A5, but
order them from small to large.
Table A5 The contraction frequencies of the anterior contractile
vacuoles of nine Paramecia at two different salt concentrations,
ordered from small to large.
𝑓contraction (… )
Culture →
Paramecium no. ↓ ‘P—’ ‘P+’
1
2
3
4
5
6
7
8
9

Signature:
14th IJSO 2017, Nijmegen, The Netherlands ‒ Practical test ‒ Dec. 9th 2017 Biology - Paramecium – answer sheets page 8 of 28
8. (0.4 points) For each culture, determine the median of the contraction frequencies of the
anterior contractile vacuoles of nine Paramecia and write them in Table A6.
Table A6 The median contraction frequencies of the anterior contractile vacuoles of nine Paramecia at two different salt concentrations.
Culture → ‘P—’ ‘P+’
𝒇contraction, median (… )
9. (0.8 points) What, in general, is the advantage of the using the median over the average?
And what is the disadvantage? (N.B. ‘extreme values’ are either very large or very small
values). Tick one correct advantage and one correct disadvantage.
Advantage:
A The median is less sensitive to extreme values than the average.
B If there are no extreme values, the median is a more accurate description
of the data than the average.
C The median is easier to calculate, since it is only based on one (for an odd
number of values) or two (for an even number of values) values, whereas
the average uses all values.
Disadvantage:
A Since the median is based on only one or two values, it is a less accurate
description of the data than the mean.
B The median is more sensitive to extreme values.
C If there are no extreme values, the median is a less accurate description
of the data than the average.

Signature:
14th IJSO 2017, Nijmegen, The Netherlands ‒ Practical test ‒ Dec. 9th 2017 Biology - Paramecium – answer sheets page 9 of 28
10. (0.8 points) Can each of the following conclusions be drawn based on this experiment?
YES NO
I The volume of water displaced by one contraction of the
contractile vacuoles is constant across salt concentrations.
II The iso-osmotic value of Paramecium is higher than the osmotic
value of both 'P—' and 'P+'.
III The contraction frequency of the contractile vacuoles is
constant over time.
IV A change in salt concentration of the environment does not
affect Paramecium.

Signature:
14th IJSO 2017, Nijmegen, The Netherlands ‒ Practical test ‒ Dec. 9th 2017 Biology - Paramecium – answer sheets page 10 of 28
11. (0.7 points) Paramecium has the ability to adjust its internal osmotic value (O) to its
surroundings over the course of several hours. Of course there is a limit to this ability.
Assume that the minimum osmotic value Paramecium can achieve is equal to that of the
surroundings in the 'P+' culture. Call this osmotic value O+.
Four graphs are shown. Tick the graph that correctly depicts: Case I: the osmotic value of a Paramecium cell over time when it is transferred from an
iso-osmotic environment (where Paramecium had the same osmotic value as its
environment) equal to 1.5×O+ into an environment with an osmotic value of O+.
Case II: the osmotic value of a Paramecium cell over time when it is transferred from an
iso-osmotic environment equal to 1.5×O+ into an environment with an osmotic value
O— equal to that of the 'P—' culture.
Time Time Time
Time
Osm
oti
c v
alu
e
Osm
oti
c v
alu
e
Osm
oti
c v
alu
e
Osm
oti
c v
alu
e
Time

Signature:
14th IJSO 2017, Nijmegen, The Netherlands ‒ Practical test ‒ Dec. 9th 2017 Biology - Paramecium – answer sheets page 11 of 28
12. (0.7 points) Similarly, tick the graph below that correctly depicts the contraction
frequencies of the contractile vacuoles of the Paramecia in cases I and II over time.
Time Time Time Time
Fre
quency
Fre
quency
Fre
quency
Fre
quency

Signature:
14th IJSO 2017, Nijmegen, The Netherlands ‒ Practical test ‒ Dec. 9th 2017 Chemistry – Fajans titration – answer sheets page 12 of 28
Determining the chloride concentration of a
sodium chloride solution using the Fajans titration
A. Determining the densities of the solutions
1. (1.9 points – 0.6 points for the calculation and 1.3 points for accuracy of the result)
Calculate the density of the sodium chloride solution in g/mL. Only if you are unable to
get a result, use the arbitrary value of 1.12 g/mL for subsequent questions.
measurements
calculation
answer: 𝜌NaCl sln = g/mL

Signature:
14th IJSO 2017, Nijmegen, The Netherlands ‒ Practical test ‒ Dec. 9th 2017 Chemistry – Fajans titration – answer sheets page 13 of 28
2. (1.9 points – 0.6 points for the calculation and 1.3 points for accuracy of the result)
Calculate the density of the silver nitrate solution in g/mL. Only if you are unable to get a
result, use the arbitrary value of 1.05 g/mL for subsequent questions.
measurements
calculation
answer: 𝜌AgNO3 sln = g/mL

Signature:
14th IJSO 2017, Nijmegen, The Netherlands ‒ Practical test ‒ Dec. 9th 2017 Chemistry – Fajans titration – answer sheets page 14 of 28
B. Trial titration
Write the results of the trial titration in this box (you will get no marks for this).
C. Accurate titrations
3. (0.4 points) For every accurate titration, write down the initial (i) and final (f) masses of
the syringes containing the sodium chloride solution and the silver nitrate solution.
𝑚NaCl syringe, i (g) 𝑚NaCl syringe, f (g) 𝑚AgNO3 syringe, i (g) 𝑚AgNO3 syringe, f (g)
Titration 1
Titration 2
Titration 3

Signature:
14th IJSO 2017, Nijmegen, The Netherlands ‒ Practical test ‒ Dec. 9th 2017 Chemistry – Fajans titration – answer sheets page 15 of 28
4. (0.85 points) Calculate the volumes of sodium chloride solution that you titrated. Show
the calculation for titration 1 only. Complete the table.
calculation
𝑉NaCl solution
Titration 1
Titration 2
Titration 3
5. (0.85 points) Calculate the volumes of silver nitrate solution that you used to titrate the
sodium chloride solution. Show the calculation for titration 1 only. Complete the table.
calculation
𝑉AgNO3 solution
Titration 1
Titration 2
Titration 3

Signature:
14th IJSO 2017, Nijmegen, The Netherlands ‒ Practical test ‒ Dec. 9th 2017 Chemistry – Fajans titration – answer sheets page 16 of 28
6. (0.4 points) Calculate the molarity (i.e. the concentration in mol/L) of silver nitrate in
the solution. Only if you are unable to calculate the molarity, use the arbitrary value of
0.440 mol/L for subsequent calculations.
calculation
molarity: mol/L
7. (2.9 points – 0.9 points for calculation and 2.0 points for consistency of practical work)
Calculate the molarities of chloride in mol/L that follow from the three accurate titrations.
Show the calculation for titration 1 only.
calculation
𝐶Cl− (mol/L)
Titration 1
Titration 2
Titration 3

Signature:
14th IJSO 2017, Nijmegen, The Netherlands ‒ Practical test ‒ Dec. 9th 2017 Chemistry – Fajans titration – answer sheets page 17 of 28
8. (3.2 points – 0.2 points for calculation and 3.0 points for accuracy of practical work)
Calculate the average 𝐶Cl− in mol/L of the three chloride concentrations that you
calculated in question 7.
calculation
answer: 𝐶Cl− = mol/L
9. (0.6 points) Calculate the sodium chloride concentration of the solution in g/L.
calculation
answer: 𝐶mass, NaCl sln = g/L
Do not write in the box below
Penalty for using extra materials
Signature of lab assistant

Signature:
14th IJSO 2017, Nijmegen, The Netherlands ‒ Practical test ‒ Dec. 9th 2017 Physics – Blue energy – answer sheets page 18 of 28
Blue energy
A. Measuring potential differences using the concentration cell
1. (1.2 points) Fill out the remaining columns of Table A1.
Table A1 – Measurement results of the voltage for solutions X0 to X4.
Solution 𝐶NaCl (g/L) log (𝐶𝑁𝑎𝐶𝑙) 𝑉 (mV)
X0
X1
X2
X3
X4

Signature:
14th IJSO 2017, Nijmegen, The Netherlands ‒ Practical test ‒ Dec. 9th 2017 Physics – Blue energy – answer sheets page 19 of 28
2. (1.4 points) Plot the values of 𝑉 against log (𝐶). Draw the data points as clear dots. Draw
the straight line of best fit through the data points using the set square.
Figure A1 – Graph of the measurements: voltage as function of log(𝐶).
Signature:
14th IJSO 2017, Nijmegen, The Netherlands ‒ Practical test ‒ Dec. 9th 2017 Physics – Blue energy – answer sheets page 20 of 28
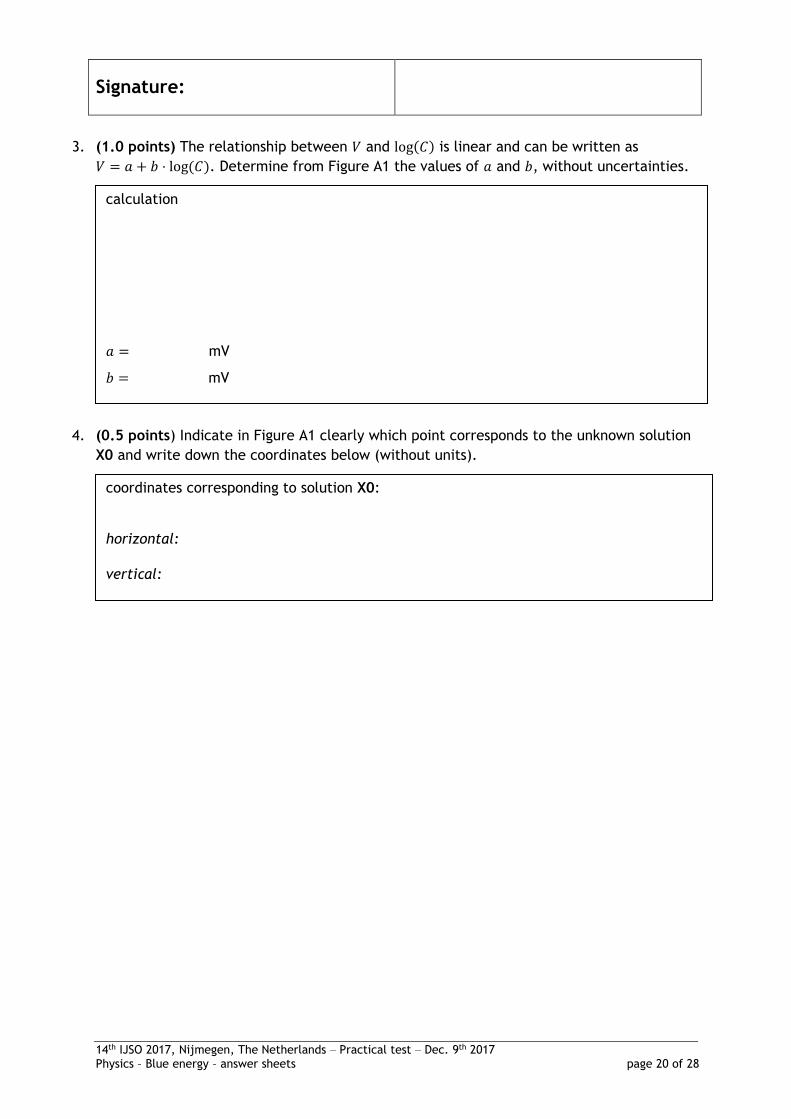
3. (1.0 points) The relationship between 𝑉 and log(𝐶) is linear and can be written as
𝑉 = 𝑎 + 𝑏 ⋅ log (𝐶). Determine from Figure A1 the values of 𝑎 and 𝑏, without uncertainties.
4. (0.5 points) Indicate in Figure A1 clearly which point corresponds to the unknown solution
X0 and write down the coordinates below (without units).
calculation
𝑎 = mV
𝑏 = mV
coordinates corresponding to solution X0: horizontal:
vertical:

Signature:
14th IJSO 2017, Nijmegen, The Netherlands ‒ Practical test ‒ Dec. 9th 2017 Physics – Blue energy – answer sheets page 21 of 28
5. (0.9 points) Determine the concentration 𝐶0 of solution X0.
B. Measuring the electrical conductance of the solutions
6. (0.4 points). Let the lab assistant check your electrical circuit.
You may not write in the next box.
calculation
answer: 𝐶0 = g/L
Correct circuit: Remarks: yes
no
Signature lab assistant:

Signature:
14th IJSO 2017, Nijmegen, The Netherlands ‒ Practical test ‒ Dec. 9th 2017 Physics – Blue energy – answer sheets page 22 of 28
Use table B1 in questions 7 to 12 and use the information in your procedure sheets to
complete this table.
Table B1 – Measurement results for salt solutions X1 to X4 and X0. Also write down the
missing units in the column headings.
Solution 𝐶NaCl (g/L) 𝑉1(_______) 𝑉2(_______) 𝐼 (_______) 𝐺 ( _______) 𝜎 ( _______)
X0
X1
X2
X3
X4
7. (1.0 points) Write the readings of the multimeters in Table B1, and complete the symbols
of the measuring quantities with the correct units in the top row.

Signature:
14th IJSO 2017, Nijmegen, The Netherlands ‒ Practical test ‒ Dec. 9th 2017 Physics – Blue energy – answer sheets page 23 of 28
8. (0.8 points) Calculate from your measurements the current 𝐼 which went through the
setup, and calculate for each known salt concentration the conductance 𝐺. Enter your
results in Table B1. Show in the box below the calculations for X1 only.
The conductance is the reverse of the resistance and has as unit S (which stands for
Siemens). See the equation sheet for more information, and enter the results in Table B1 .
calculation of the current 𝐼 for X1
calculation of the conductance 𝐺 for X1
Signature:
14th IJSO 2017, Nijmegen, The Netherlands ‒ Practical test ‒ Dec. 9th 2017 Physics – Blue energy – answer sheets page 24 of 28
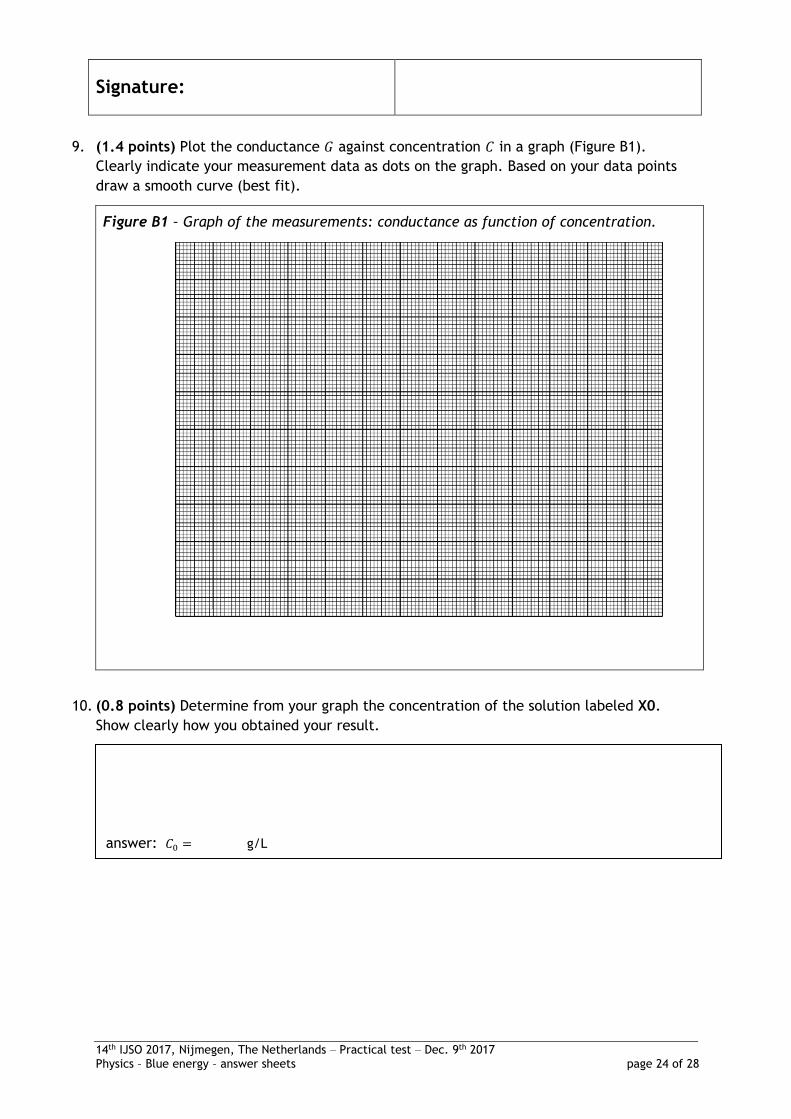
9. (1.4 points) Plot the conductance 𝐺 against concentration 𝐶 in a graph (Figure B1).
Clearly indicate your measurement data as dots on the graph. Based on your data points
draw a smooth curve (best fit).
Figure B1 – Graph of the measurements: conductance as function of concentration.
10. (0.8 points) Determine from your graph the concentration of the solution labeled X0.
Show clearly how you obtained your result.
answer: 𝐶0 = g/L

Signature:
14th IJSO 2017, Nijmegen, The Netherlands ‒ Practical test ‒ Dec. 9th 2017 Physics – Blue energy – answer sheets page 25 of 28
11. (0.8 points) Determine values for 𝑙 and 𝐴 of the pair of electrodes. Use SI units, so 𝑙 in m
and 𝐴 in m2.
12. (0.4 points) Calculate the specific conductivities of solutions X0 and X1 to X4 and write
down the results in Table B1. Show in the box below the calculation for X0 only.
calculation answers: 𝑙 = m
𝐴 = m2
calculation
answer for X0: 𝜎 = S/m

Signature:
14th IJSO 2017, Nijmegen, The Netherlands ‒ Practical test ‒ Dec. 9th 2017 Physics – Blue energy – answer sheets page 26 of 28
C. Calculating the theoretical maximum electrical power
13. Consider your graph in Figure A1 and answer the following questions.
a) (0.2 points) If you want to obtain the maximum voltage from the RED cell, which of
the solutions X0 to X4 should you use for the salt water?
b) (0.2 points) Which of the solutions X0 to X4 should you use for the fresh water?
c) (0.5 points) Read from Figure A1 how large the potential difference Δ𝑉 is across the
cell when using the solutions you chose in questions 13a and 13b.
solution to be used for the salt water:
solution to be used for the fresh water:
Δ𝑉 = mV

Signature:
14th IJSO 2017, Nijmegen, The Netherlands ‒ Practical test ‒ Dec. 9th 2017 Physics – Blue energy – answer sheets page 27 of 28
14. (0.5 points) Calculate the conductance 𝐺fresh of the fresh water side and 𝐺salt of the salt
water side of the RED cell. Use the specific conductivities from Table B1 on the answer
sheet.
Note: if you don’t have data for 𝜎, use 𝜎fresh = 0.99 S/m and 𝜎salt = 11.6 S/m for your
calculations.
15. (0.5 points) Calculate the internal resistance of the RED cell.
calculations
answers: 𝐺fresh =
𝐺salt =
calculation
𝑅int =

Signature:
14th IJSO 2017, Nijmegen, The Netherlands ‒ Practical test ‒ Dec. 9th 2017 Physics – Blue energy – answer sheets page 28 of 28
16. (0.8 points) Calculate the current 𝐼 through the external resistor. Use the potential
difference Δ𝑉 you found in question 13.
Note: if you don’t have a value for Δ𝑉, use Δ𝑉 = 55.0 mV as a value for your calculation.
17. (0.4 points) Calculate the power 𝑃 this RED cell delivers to the external resistor.
18. (0.3 points) How many of these RED cells you need for a power plant to generate 1.0 MW?
calculation
𝐼 = A
calculation
𝑃 = W
answer:


![RNAi pathway components and function in Paramecium bursaria · 2021. 5. 20. · Paramecium tetaurelia Cid1 (Marker, 2014) [PTETP9100013001] Paramecium biaurelia [PBIGNP26212] Paramecium](https://img.pdfslide.us/doc/110x75/613a827d0051793c8c011555/rnai-pathway-components-and-function-in-paramecium-bursaria-2021-5-20-paramecium.jpg)