Embed Size (px)
Citation preview
1
Parallel Performance Analysis Tools
Shirley Moore
CS594
April 25, 2007
2
Outline
• Introduction to performance analysis
• PAPI
• TAU
• Vampir/VNG
• Jumpshot
• KOJAK
2
3
Goals
• This tutorial is an introduction to portable performance evaluation tools.
• You should leave here with a better understanding of…– Concepts and steps involved in performance evaluation– How to collect and analyze data from hardware performance counters– How to instrument your programs with TAU
– Automatic instrumentation at the routine level and outer loop level– Manual instrumentation at the loop/statement level
– Measurement options provided by TAU– Environment variables used for choosing metrics, generating performance data– How to use the TAU’s profile browser, ParaProf– How to use TAU’s database for storing and retrieving performance data– General familiarity with TAU’s use for Fortran, C++,C, MPI for mixed language
programming– How to generate trace data in different formats– How to analyze trace data using KOJAK, Vampir, and Jumpshot
4
More Information
• PAPI References:– PAPI documentation page available from the PAPI website:
http://icl.cs.utk.edu/papi/
• TAU References:– TAU Users Guide and papers available from the TAU website:
http://www.cs.uoregon.edu/research/tau/
• VAMPIR References– VAMPIR-NG website
http://www.vampir-ng.de/
• KOJAK References– KOJAK documentation page
http://www.fz-juelich.de/zam/kojak/documentation/
3
5
Performance Evaluation
• Profiling– Presents summary statistics of performance metrics
– number of times a routine was invoked– exclusive, inclusive time/hpm counts spent executing it– number of instrumented child routines invoked, etc. – structure of invocations (calltrees/callgraphs)– memory, message communication sizes also tracked
• Tracing– Presents when and where events took place along a global
timeline– timestamped log of events– message communication events (sends/receives) are tracked
– shows when and where messages were sent– large volume of performance data generated leads to more perturbation
in the program
6
Definitions – Profiling
• Profiling– Recording of summary information during execution
– inclusive, exclusive time, # calls, hardware statistics, …– Reflects performance behavior of program entities
– functions, loops, basic blocks– user-defined “semantic” entities
– Very good for low-cost performance assessment– Helps to expose performance bottlenecks and hotspots– Implemented through
– sampling: periodic OS interrupts or hardware counter traps– instrumentation: direct insertion of measurement code
4
7
Definitions – Tracing
• Tracing– Recording of information about significant points (events) during
program execution– entering/exiting code region (function, loop, block, …)– thread/process interactions (e.g., send/receive message)
– Save information in event record– timestamp– CPU identifier, thread identifier– Event type and event-specific information
– Event trace is a time-sequenced stream of event records– Can be used to reconstruct dynamic program behavior– Typically requires code instrumentation
8
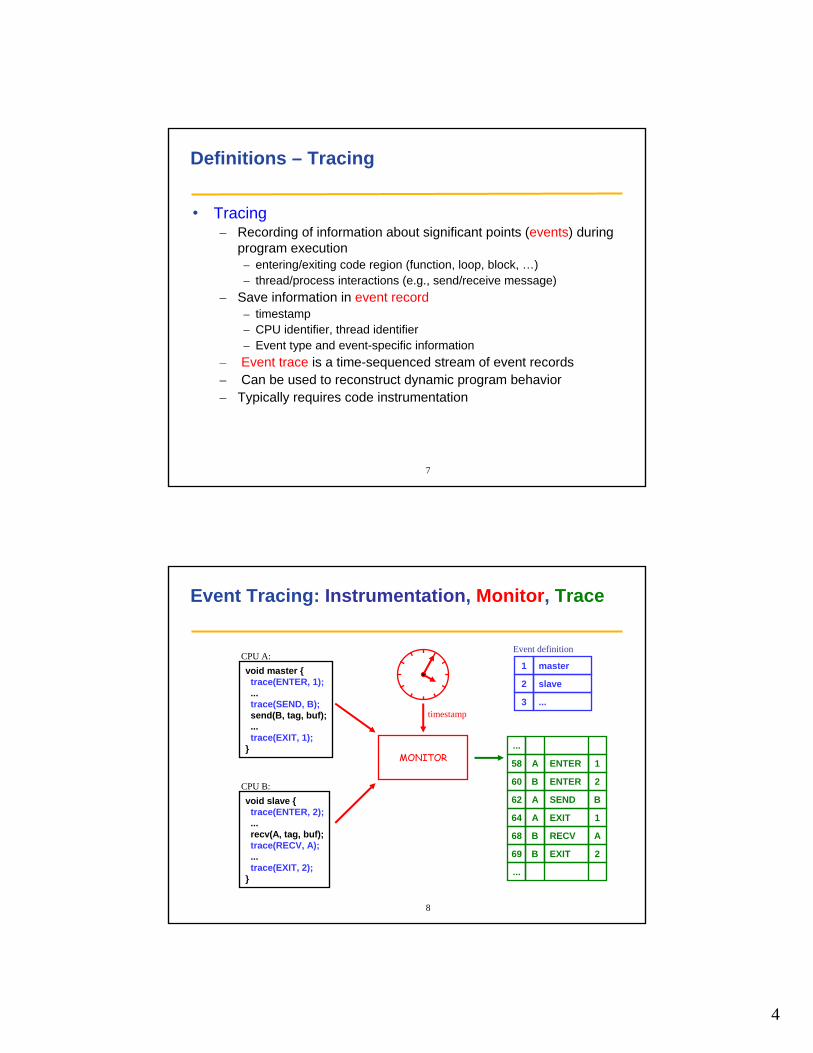
Event Tracing: Instrumentation, Monitor, Trace
1 master
2 slave
3 ...
void slave {trace(ENTER, 2);...recv(A, tag, buf);trace(RECV, A);...trace(EXIT, 2);
}
void master {trace(ENTER, 1);...trace(SEND, B);send(B, tag, buf);...trace(EXIT, 1);
}MONITOR 58 A ENTER 1
60 B ENTER 2
62 A SEND B
64 A EXIT 1
68 B RECV A
...
69 B EXIT 2
...
CPU A:
CPU B:
Event definition
timestamp
5
9
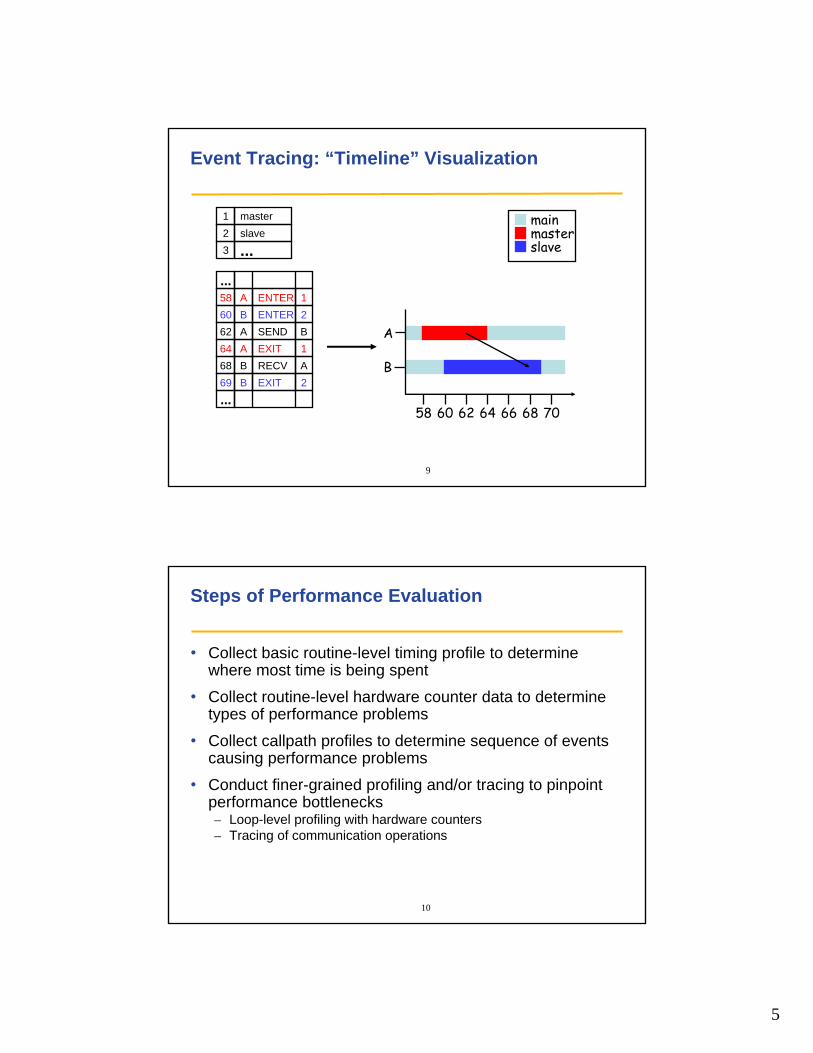
Event Tracing: “Timeline” Visualization
1 master2 slave3 ...
58 A ENTER 160 B ENTER 262 A SEND B64 A EXIT 168 B RECV A
...
69 B EXIT 2
...
mainmasterslave
58 60 62 64 66 68 70
B
A
10
Steps of Performance Evaluation
• Collect basic routine-level timing profile to determine where most time is being spent
• Collect routine-level hardware counter data to determine types of performance problems
• Collect callpath profiles to determine sequence of events causing performance problems
• Conduct finer-grained profiling and/or tracing to pinpoint performance bottlenecks– Loop-level profiling with hardware counters– Tracing of communication operations
6
11
PAPI
• Performance Application Programming Interface– The purpose of the PAPI project is to design, standardize
and implement a portable and efficient API to access the hardware performance monitor counters found on most modern microprocessors.
• Parallel Tools Consortium project started in 1998
• Developed by University of Tennessee, Knoxville
• http://icl.cs.utk.edu/papi/
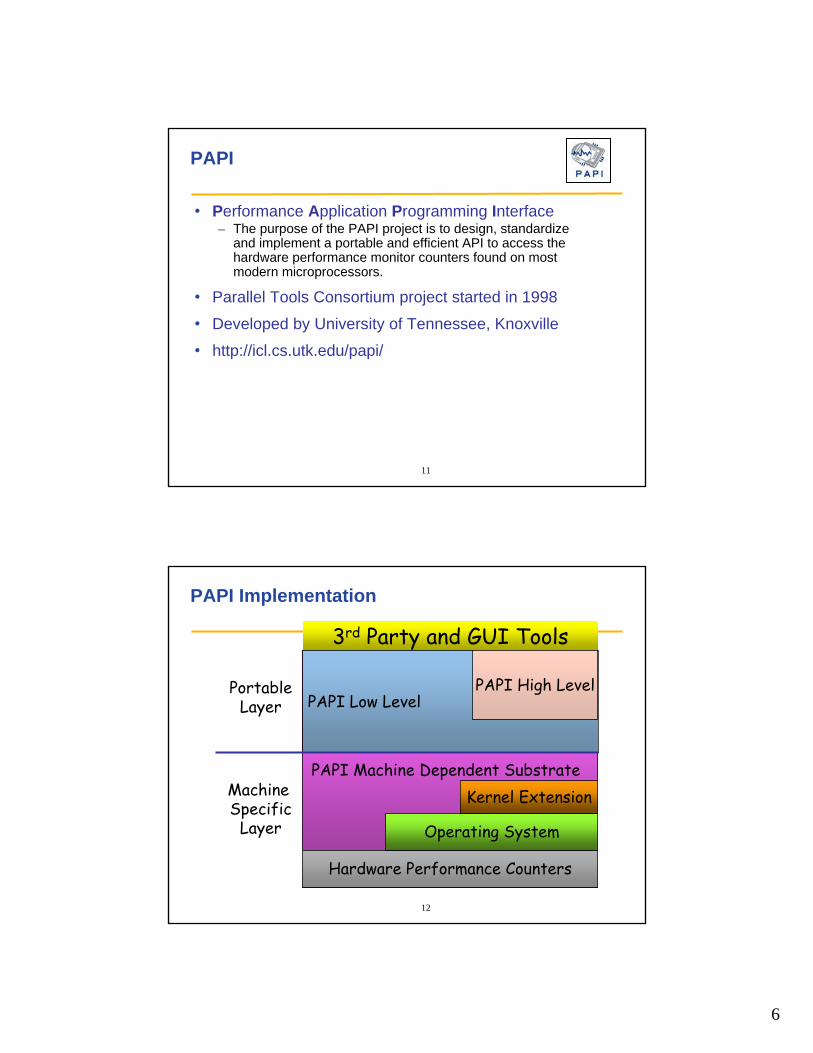
12
3rd Party and GUI Tools
PAPI Low Level
Machine Specific
Layer
PortableLayer
PAPI Machine Dependent Substrate
PAPI Implementation
PAPI High Level
Hardware Performance Counters
Operating System
Kernel Extension
7
13
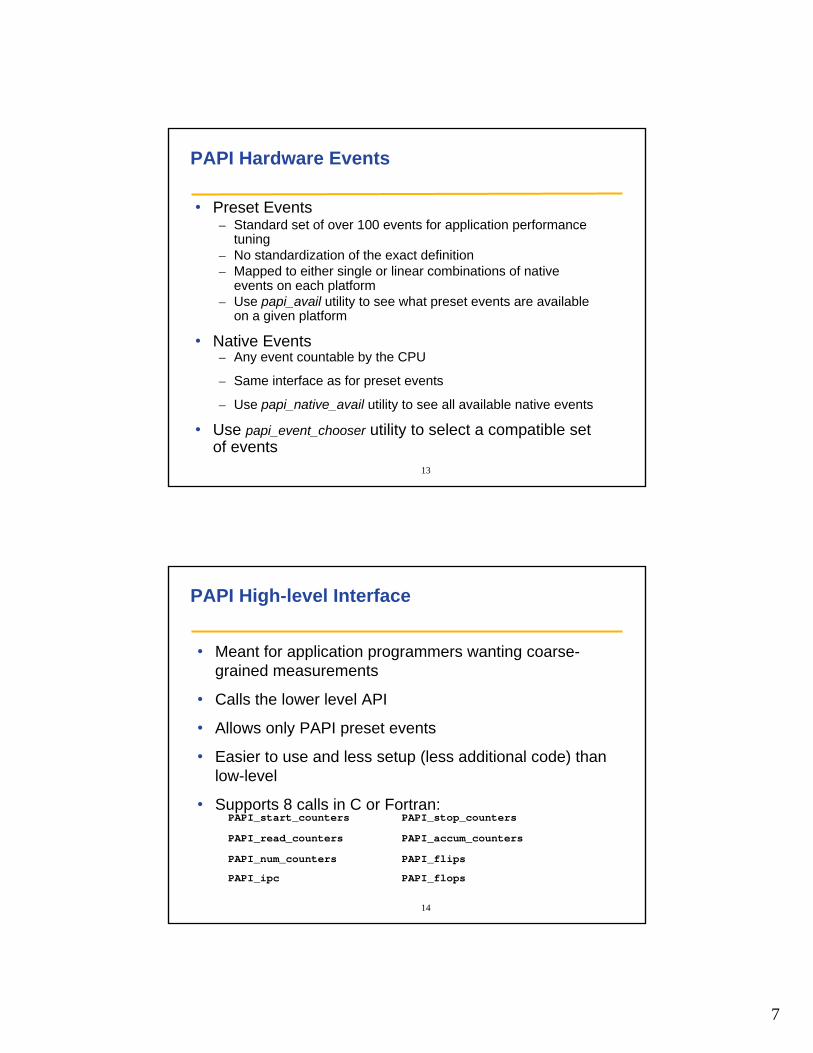
PAPI Hardware Events
• Preset Events– Standard set of over 100 events for application performance
tuning– No standardization of the exact definition– Mapped to either single or linear combinations of native
events on each platform– Use papi_avail utility to see what preset events are available
on a given platform
• Native Events– Any event countable by the CPU
– Same interface as for preset events
– Use papi_native_avail utility to see all available native events
• Use papi_event_chooser utility to select a compatible set of events
14
PAPI High-level Interface
• Meant for application programmers wanting coarse-grained measurements
• Calls the lower level API
• Allows only PAPI preset events
• Easier to use and less setup (less additional code) than low-level
• Supports 8 calls in C or Fortran:
PAPI_flips
PAPI_flops
PAPI_num_counters
PAPI_ipc
PAPI_accum_countersPAPI_read_counters
PAPI_stop_countersPAPI_start_counters
8
15
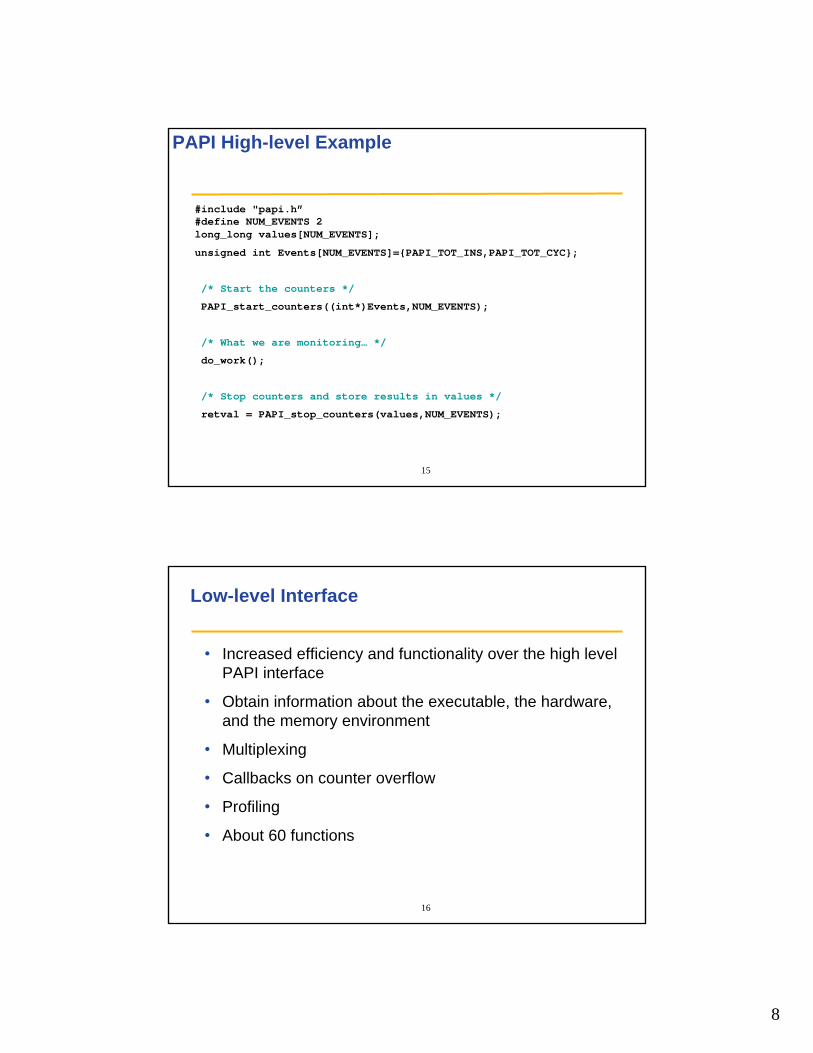
PAPI High-level Example
#include "papi.h”#define NUM_EVENTS 2long_long values[NUM_EVENTS];
unsigned int Events[NUM_EVENTS]={PAPI_TOT_INS,PAPI_TOT_CYC};
/* Start the counters */
PAPI_start_counters((int*)Events,NUM_EVENTS);
/* What we are monitoring… */
do_work();
/* Stop counters and store results in values */
retval = PAPI_stop_counters(values,NUM_EVENTS);
16
Low-level Interface
• Increased efficiency and functionality over the high level PAPI interface
• Obtain information about the executable, the hardware, and the memory environment
• Multiplexing
• Callbacks on counter overflow
• Profiling
• About 60 functions
9
17
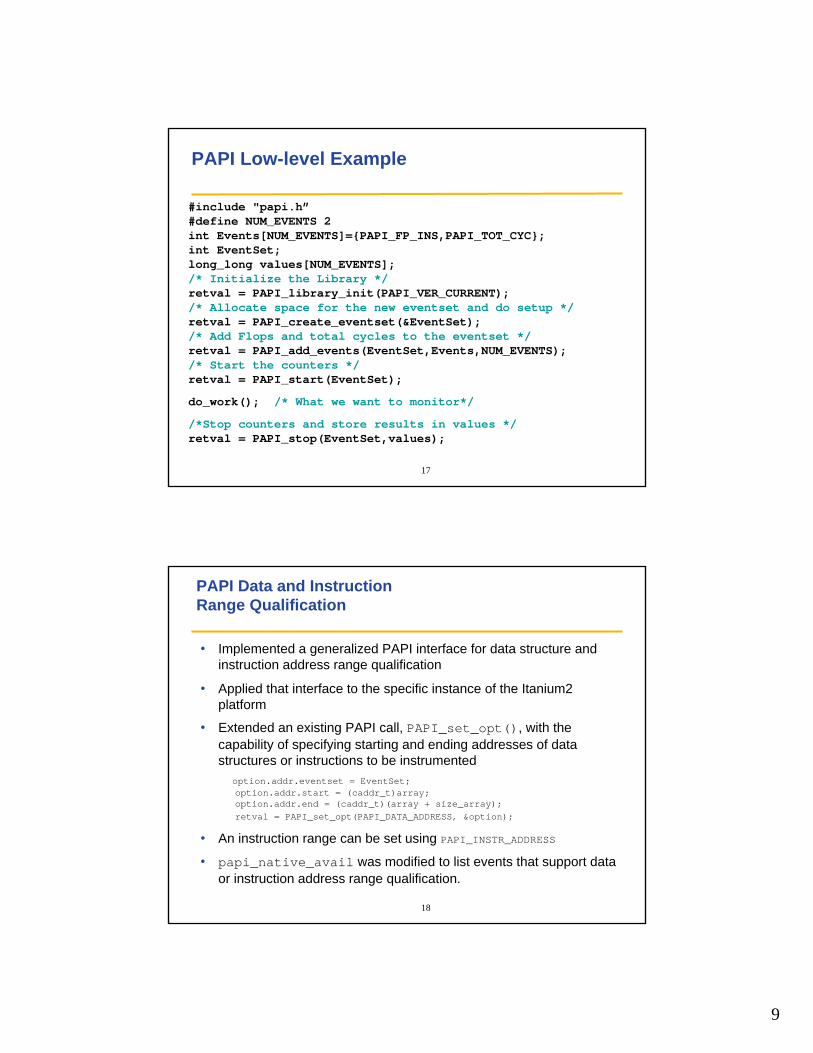
PAPI Low-level Example
#include "papi.h”#define NUM_EVENTS 2int Events[NUM_EVENTS]={PAPI_FP_INS,PAPI_TOT_CYC};int EventSet;long_long values[NUM_EVENTS];/* Initialize the Library */retval = PAPI_library_init(PAPI_VER_CURRENT);/* Allocate space for the new eventset and do setup */retval = PAPI_create_eventset(&EventSet);/* Add Flops and total cycles to the eventset */retval = PAPI_add_events(EventSet,Events,NUM_EVENTS);/* Start the counters */retval = PAPI_start(EventSet);
do_work(); /* What we want to monitor*/
/*Stop counters and store results in values */retval = PAPI_stop(EventSet,values);
18
PAPI Data and Instruction Range Qualification
• Implemented a generalized PAPI interface for data structure and instruction address range qualification
• Applied that interface to the specific instance of the Itanium2 platform
• Extended an existing PAPI call, PAPI_set_opt(), with the capability of specifying starting and ending addresses of data structures or instructions to be instrumented
option.addr.eventset = EventSet; option.addr.start = (caddr_t)array; option.addr.end = (caddr_t)(array + size_array); retval = PAPI_set_opt(PAPI_DATA_ADDRESS, &option);
• An instruction range can be set using PAPI_INSTR_ADDRESS
• papi_native_avail was modified to list events that support data or instruction address range qualification.
10
19
Component PAPI (PAPI-C)
• Goals:– Support simultaneous access to on- and off-processor
counters– Isolate hardware dependent code in a separable ‘substrate’
module– Extend platform independent code to support multiple
simultaneous substrates– Add or modify API calls to support access to any of several
substrates– Modify build environment for easy selection and
configuration of multiple available substrates
• Will be released as PAPI 4.0
20
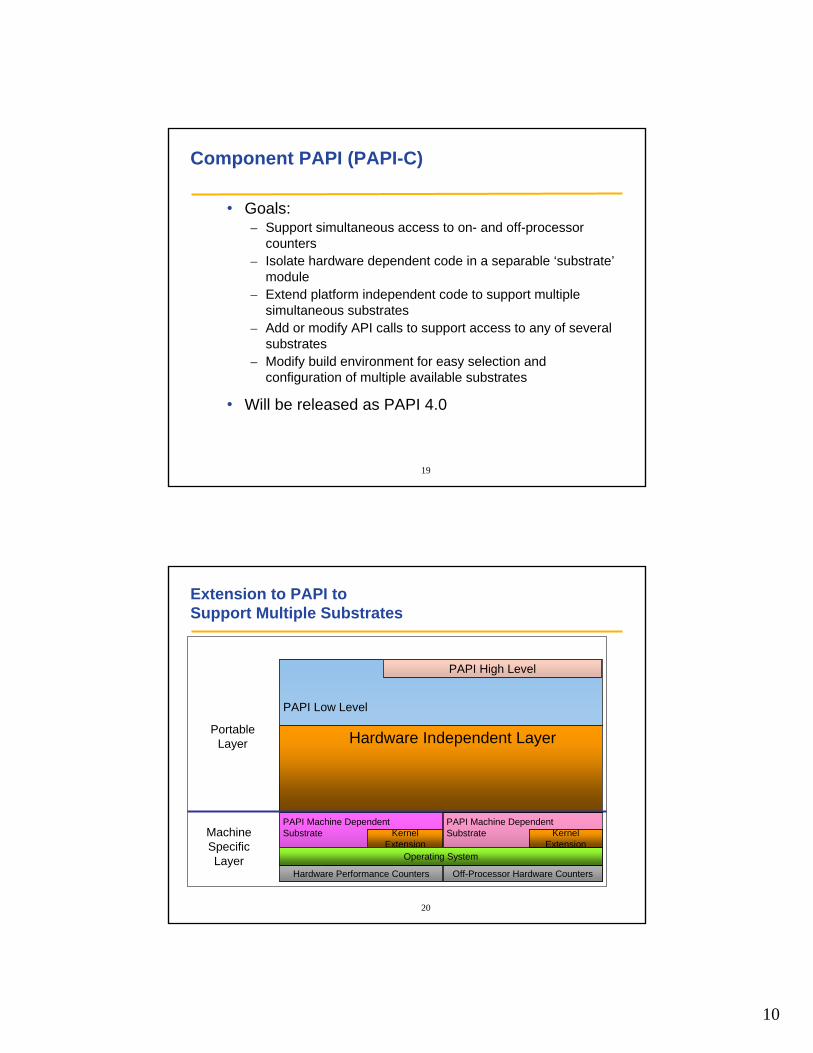
Extension to PAPI to Support Multiple Substrates
PAPI Low Level
Machine SpecificLayer
PortableLayer
PAPI High Level
PAPI Machine DependentSubstrate
Hardware Performance Counters
Operating System
KernelExtension
Hardware Independent Layer
PAPI Machine DependentSubstrate
Off-Processor Hardware Counters
Operating System
KernelExtension
11
21
PAPI-C Status
• PAPI 3.9 pre-release available with documentation
• Implemented Myrinet substrate (native counters)
• Implemented ACPI temperature sensor substrate
• Working on Inifinband and Cray Seastar substrates (access toSeastar counters not available under Catamount but expected under CNL)
• Asked by Cray engineers for input on desired metrics for next network switch
• Tested on HPC Challenge benchmarks
• Tested platforms include Pentium III, Pentium 4, Core2Duo, Itanium (I and II) and AMD Opteron
• Installed and tested on ARL MSRC Linux clusters and ASC MSRC SGI Altix
22
PAPI-C New Routines
• PAPI_get_component_info()
• PAPI_num_cmp_hwctrs()
• PAPI_get_cmp_opt()
• PAPI_set_cmp_opt()
• PAPI_set_cmp_domain()
• PAPI_set_cmp(granularity)
12
23
PAPI-C Building and Linking
• CPU components are automatically detected by configure and included in the build
• CPU component assumed to be present and always configured as component 0
• To include additional components, use configure option
--with-<cmp> = yes
• Currently supported components– with-acpi = yes– with-mx = yes– with-net = yes
• The make process compiles and links sources for all requested components into a single library
24
Myrinet MX CountersROUTE_DISPERSIONOUT_OF_SEND_HANDLESOUT_OF_PULL_HANDLESOUT_OF_PUSH_HANDLESMEDIUM_CONT_RACECMD_TYPE_UNKNOWNUREQ_TYPE_UNKNOWNINTERRUPTS_OVERRUNWAITING_FOR_INTERRUPT_DMAWAITING_FOR_INTERRUPT_ACKWAITING_FOR_INTERRUPT_TIMERSLABS_RECYCLINGSLABS_PRESSURESLABS_STARVATIONOUT_OF_RDMA_HANDLESEVENTQ_FULLBUFFER_DROPMEMORY_DROPHARDWARE_FLOW_CONTROLSIMULATED_PACKETS_LOSTLOGGING_FRAMES_DUMPEDWAKE_INTERRUPTSAVERTED_WAKEUP_RACEDMA_METADATA_RACE
REPLY_SENDREPLY_RECVQUERY_UNKNOWNDATA_SEND_NULLDATA_SEND_SMALLDATA_SEND_MEDIUMDATA_SEND_RNDVDATA_SEND_PULLDATA_RECV_NULLDATA_RECV_SMALL_INLINEDATA_RECV_SMALL_COPYDATA_RECV_MEDIUMDATA_RECV_RNDVDATA_RECV_PULLETHER_SEND_UNICAST_CNTETHER_SEND_MULTICAST_CNTETHER_RECV_SMALL_CNTETHER_RECV_BIG_CNTETHER_OVERRUNETHER_OVERSIZEDDATA_RECV_NO_CREDITSPACKETS_RESENTPACKETS_DROPPEDMAPPER_ROUTES_UPDATE
ACK_NACK_FRAMES_IN_PIPENACK_BAD_ENDPTNACK_ENDPT_CLOSEDNACK_BAD_SESSIONNACK_BAD_RDMAWINNACK_EVENTQ_FULLSEND_BAD_RDMAWINCONNECT_TIMEOUTCONNECT_SRC_UNKNOWNQUERY_BAD_MAGICQUERY_TIMED_OUTQUERY_SRC_UNKNOWNRAW_SENDSRAW_RECEIVESRAW_OVERSIZED_PACKETSRAW_RECV_OVERRUNRAW_DISABLEDCONNECT_SENDCONNECT_RECVACK_SENDACK_RECVPUSH_SENDPUSH_RECVQUERY_SENDQUERY_RECV
LANAI_UPTIMECOUNTERS_UPTIMEBAD_CRC8BAD_CRC32UNSTRIPPED_ROUTEPKT_DESC_INVALIDRECV_PKT_ERRORSPKT_MISROUTEDDATA_SRC_UNKNOWNDATA_BAD_ENDPTDATA_ENDPT_CLOSEDDATA_BAD_SESSIONPUSH_BAD_WINDOWPUSH_DUPLICATEPUSH_OBSOLETEPUSH_RACE_DRIVERPUSH_BAD_SEND_HANDLE_MAGICPUSH_BAD_SRC_MAGICPULL_OBSOLETEPULL_NOTIFY_OBSOLETEPULL_RACE_DRIVERACK_BAD_TYPEACK_BAD_MAGICACK_RESEND_RACELATE_ACKh
13
25
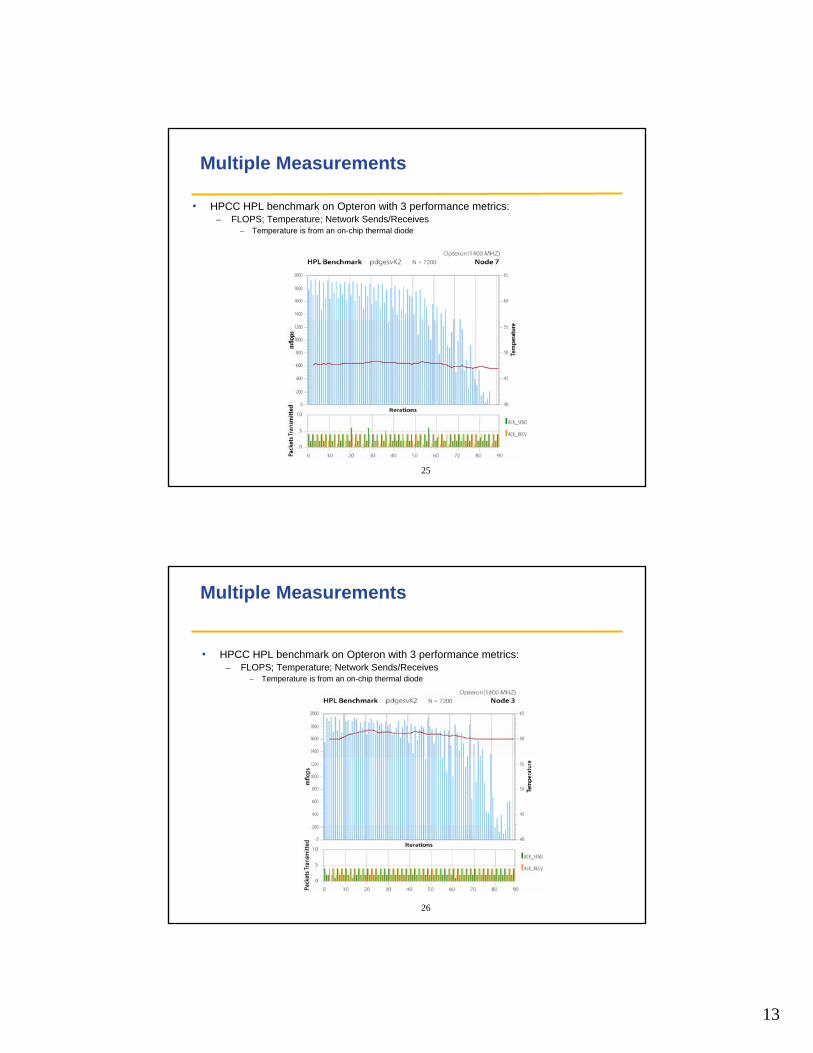
Multiple Measurements
• HPCC HPL benchmark on Opteron with 3 performance metrics:– FLOPS; Temperature; Network Sends/Receives
– Temperature is from an on-chip thermal diode
26
Multiple Measurements
• HPCC HPL benchmark on Opteron with 3 performance metrics:– FLOPS; Temperature; Network Sends/Receives
– Temperature is from an on-chip thermal diode
14
27
• TAU (U Oregon) http://www.cs.uoregon.edu/research/tau/
• HPCToolkit (Rice Univ) http://hipersoft.cs.rice.edu/hpctoolkit/
• KOJAK (UTK, FZ Juelich) http://icl.cs.utk.edu/kojak/
• PerfSuite (NCSA) http://perfsuite.ncsa.uiuc.edu/
• Titanium (UC Berkeley) http://www.cs.berkeley.edu/Research/Projects/titanium/
• SCALEA (Thomas Fahringer, U Innsbruck) http://www.par.univie.ac.at/project/scalea/
• Open|Speedshop (SGI) http://oss.sgi.com/projects/openspeedshop/
• SvPablo (UNC Renaissance Computing Institute)http://www.renci.unc.edu/Software/Pablo/pablo.htm
Tools that use PAPIMost users access PAPI from higher-level tools
28
TAU Parallel Performance System
• http://www.cs.uoregon.edu/research/tau/
• Multi-level performance instrumentation– Multi-language automatic source instrumentation
• Flexible and configurable performance measurement
• Widely-ported parallel performance profiling system– Computer system architectures and operating systems– Different programming languages and compilers
• Support for multiple parallel programming paradigms– Multi-threading, message passing, mixed-mode, hybrid
• Integration in complex software, systems, applications
15
29
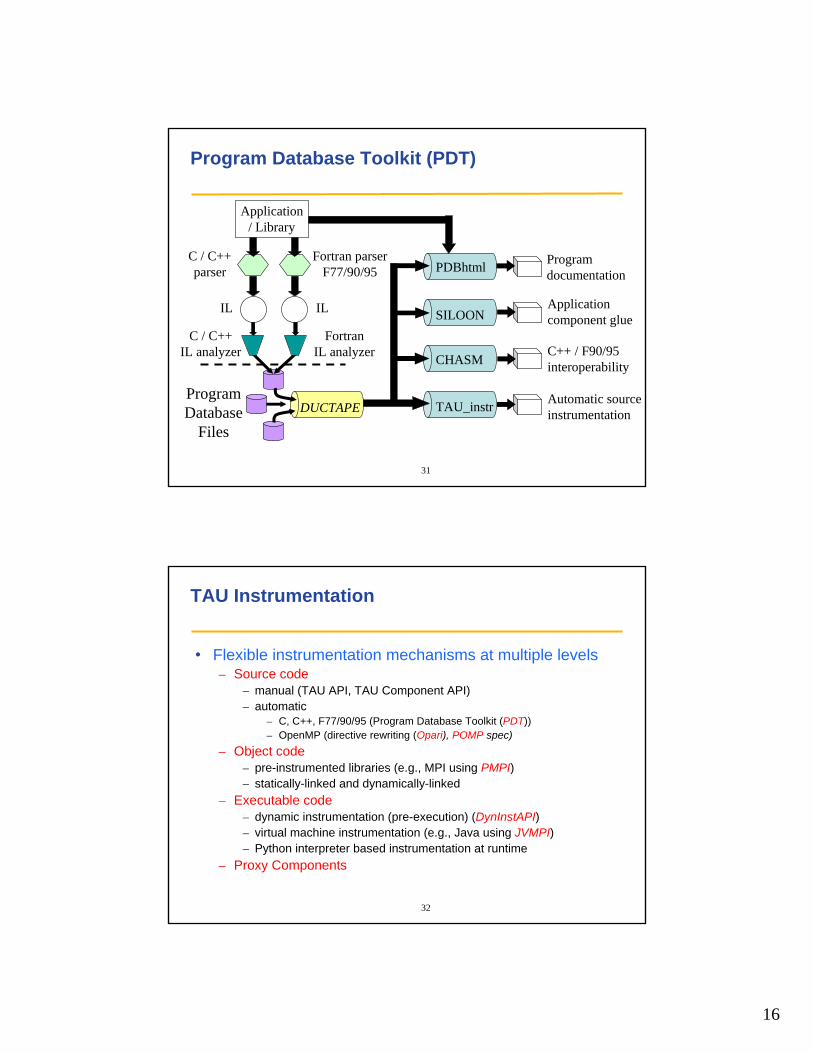
TAU Performance System Architecture
eventselection
30
TAU Performance System Architecture
16
31
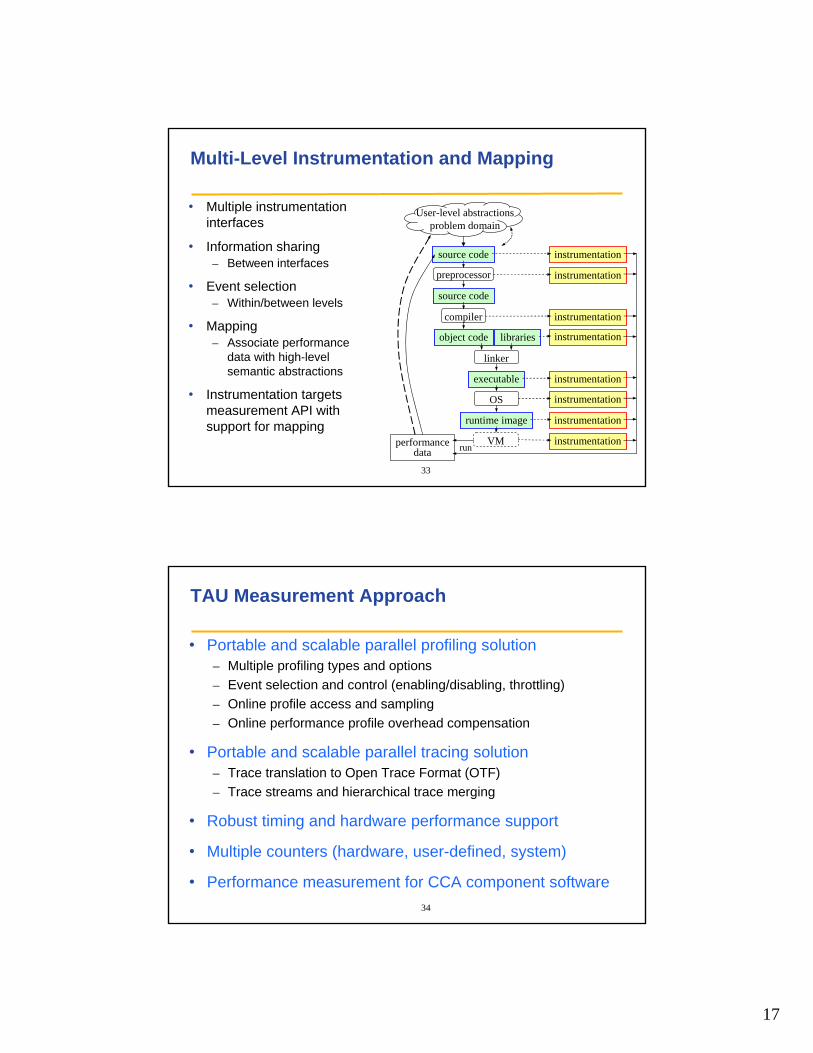
Program Database Toolkit (PDT)
Application/ Library
C / C++parser
Fortran parserF77/90/95
C / C++IL analyzer
FortranIL analyzer
ProgramDatabase
Files
IL IL
DUCTAPE
PDBhtml
SILOON
CHASM
TAU_instr
Programdocumentation
Applicationcomponent glue
C++ / F90/95interoperability
Automatic sourceinstrumentation
32
TAU Instrumentation
• Flexible instrumentation mechanisms at multiple levels– Source code
– manual (TAU API, TAU Component API)– automatic
– C, C++, F77/90/95 (Program Database Toolkit (PDT))– OpenMP (directive rewriting (Opari), POMP spec)
– Object code– pre-instrumented libraries (e.g., MPI using PMPI)– statically-linked and dynamically-linked
– Executable code– dynamic instrumentation (pre-execution) (DynInstAPI)– virtual machine instrumentation (e.g., Java using JVMPI)– Python interpreter based instrumentation at runtime
– Proxy Components
17
33
Multi-Level Instrumentation and Mapping
• Multiple instrumentation interfaces
• Information sharing– Between interfaces
• Event selection– Within/between levels
• Mapping– Associate performance
data with high-level semantic abstractions
• Instrumentation targets measurement API with support for mapping
User-level abstractionsproblem domain
source code
source code
object code libraries
instrumentation
instrumentation
executable
runtime image
compiler
linker
OS
VM
instrumentation
instrumentation
instrumentation
instrumentation
instrumentation
instrumentationperformancedata run
preprocessor
34
TAU Measurement Approach
• Portable and scalable parallel profiling solution– Multiple profiling types and options– Event selection and control (enabling/disabling, throttling)– Online profile access and sampling– Online performance profile overhead compensation
• Portable and scalable parallel tracing solution– Trace translation to Open Trace Format (OTF)– Trace streams and hierarchical trace merging
• Robust timing and hardware performance support
• Multiple counters (hardware, user-defined, system)
• Performance measurement for CCA component software
18
35
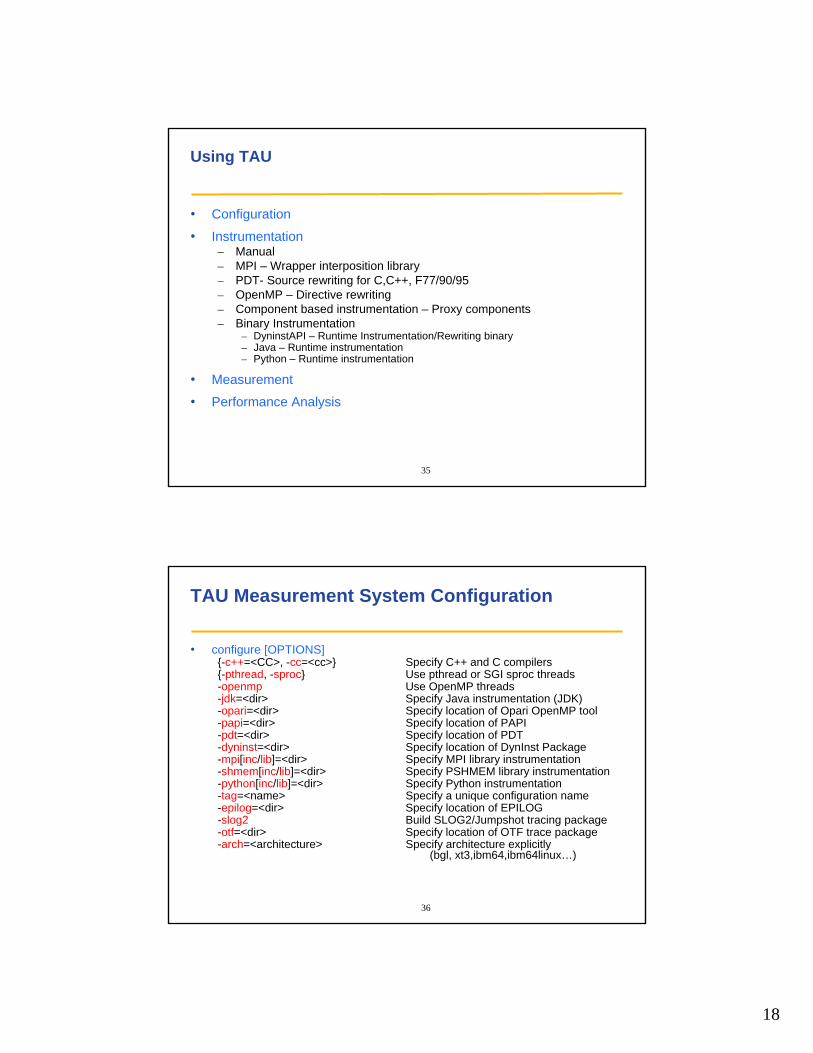
Using TAU
• Configuration
• Instrumentation– Manual– MPI – Wrapper interposition library– PDT- Source rewriting for C,C++, F77/90/95– OpenMP – Directive rewriting– Component based instrumentation – Proxy components– Binary Instrumentation
– DyninstAPI – Runtime Instrumentation/Rewriting binary– Java – Runtime instrumentation– Python – Runtime instrumentation
• Measurement
• Performance Analysis
36
TAU Measurement System Configuration
• configure [OPTIONS]{-c++=<CC>, -cc=<cc>} Specify C++ and C compilers{-pthread, -sproc} Use pthread or SGI sproc threads-openmp Use OpenMP threads-jdk=<dir> Specify Java instrumentation (JDK) -opari=<dir> Specify location of Opari OpenMP tool-papi=<dir> Specify location of PAPI -pdt=<dir> Specify location of PDT-dyninst=<dir> Specify location of DynInst Package-mpi[inc/lib]=<dir> Specify MPI library instrumentation-shmem[inc/lib]=<dir> Specify PSHMEM library instrumentation-python[inc/lib]=<dir> Specify Python instrumentation-tag=<name> Specify a unique configuration name-epilog=<dir> Specify location of EPILOG -slog2 Build SLOG2/Jumpshot tracing package-otf=<dir> Specify location of OTF trace package-arch=<architecture> Specify architecture explicitly
(bgl, xt3,ibm64,ibm64linux…)
19
37
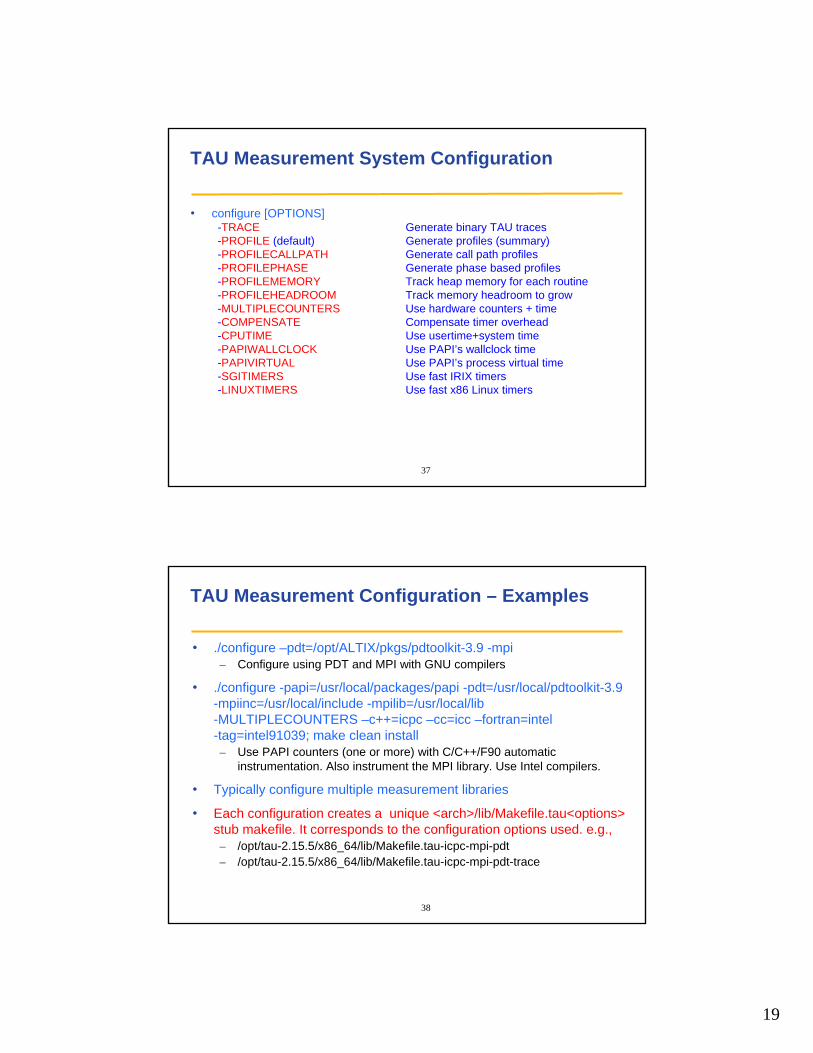
TAU Measurement System Configuration
• configure [OPTIONS]-TRACE Generate binary TAU traces-PROFILE (default) Generate profiles (summary)-PROFILECALLPATH Generate call path profiles-PROFILEPHASE Generate phase based profiles-PROFILEMEMORY Track heap memory for each routine-PROFILEHEADROOM Track memory headroom to grow-MULTIPLECOUNTERS Use hardware counters + time-COMPENSATE Compensate timer overhead-CPUTIME Use usertime+system time -PAPIWALLCLOCK Use PAPI’s wallclock time-PAPIVIRTUAL Use PAPI’s process virtual time-SGITIMERS Use fast IRIX timers-LINUXTIMERS Use fast x86 Linux timers
38
TAU Measurement Configuration – Examples
• ./configure –pdt=/opt/ALTIX/pkgs/pdtoolkit-3.9 -mpi– Configure using PDT and MPI with GNU compilers
• ./configure -papi=/usr/local/packages/papi -pdt=/usr/local/pdtoolkit-3.9 -mpiinc=/usr/local/include -mpilib=/usr/local/lib -MULTIPLECOUNTERS –c++=icpc –cc=icc –fortran=intel -tag=intel91039; make clean install– Use PAPI counters (one or more) with C/C++/F90 automatic
instrumentation. Also instrument the MPI library. Use Intel compilers.
• Typically configure multiple measurement libraries
• Each configuration creates a unique <arch>/lib/Makefile.tau<options> stub makefile. It corresponds to the configuration options used. e.g.,– /opt/tau-2.15.5/x86_64/lib/Makefile.tau-icpc-mpi-pdt– /opt/tau-2.15.5/x86_64/lib/Makefile.tau-icpc-mpi-pdt-trace
20
39
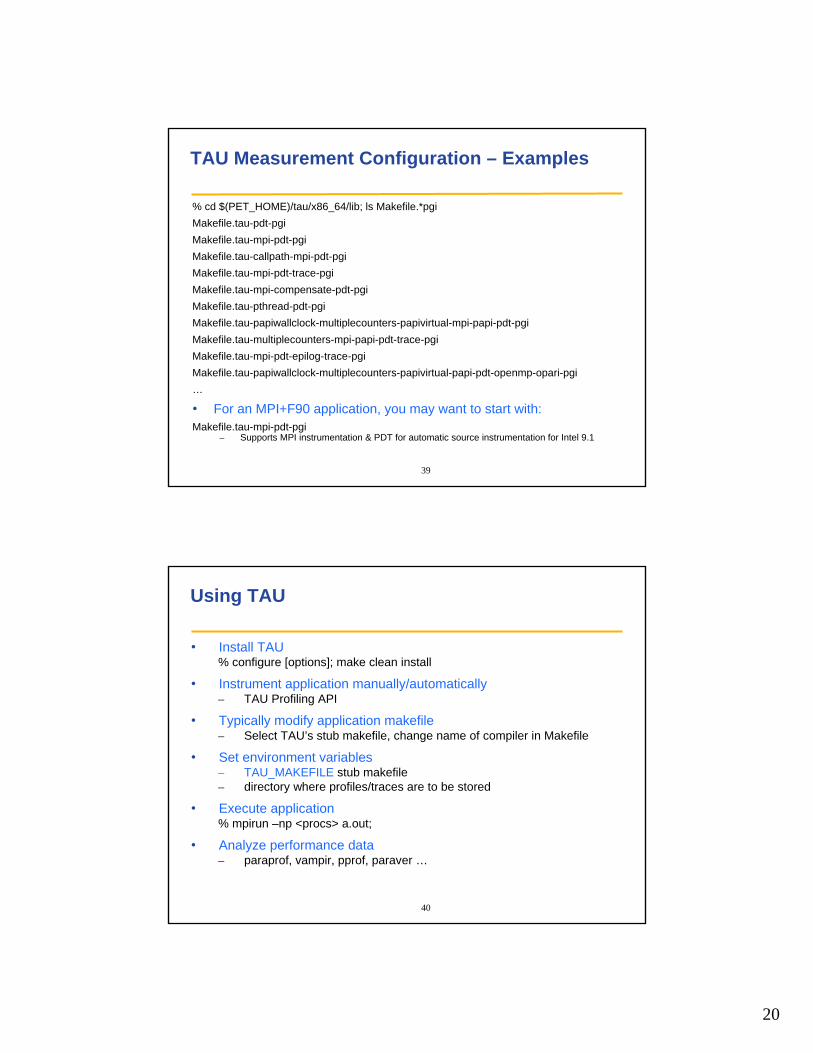
TAU Measurement Configuration – Examples
% cd $(PET_HOME)/tau/x86_64/lib; ls Makefile.*pgiMakefile.tau-pdt-pgiMakefile.tau-mpi-pdt-pgiMakefile.tau-callpath-mpi-pdt-pgiMakefile.tau-mpi-pdt-trace-pgiMakefile.tau-mpi-compensate-pdt-pgiMakefile.tau-pthread-pdt-pgiMakefile.tau-papiwallclock-multiplecounters-papivirtual-mpi-papi-pdt-pgiMakefile.tau-multiplecounters-mpi-papi-pdt-trace-pgiMakefile.tau-mpi-pdt-epilog-trace-pgiMakefile.tau-papiwallclock-multiplecounters-papivirtual-papi-pdt-openmp-opari-pgi…
• For an MPI+F90 application, you may want to start with:Makefile.tau-mpi-pdt-pgi
– Supports MPI instrumentation & PDT for automatic source instrumentation for Intel 9.1
40
Using TAU
• Install TAU% configure [options]; make clean install
• Instrument application manually/automatically– TAU Profiling API
• Typically modify application makefile– Select TAU’s stub makefile, change name of compiler in Makefile
• Set environment variables– TAU_MAKEFILE stub makefile– directory where profiles/traces are to be stored
• Execute application% mpirun –np <procs> a.out;
• Analyze performance data– paraprof, vampir, pprof, paraver …
21
41
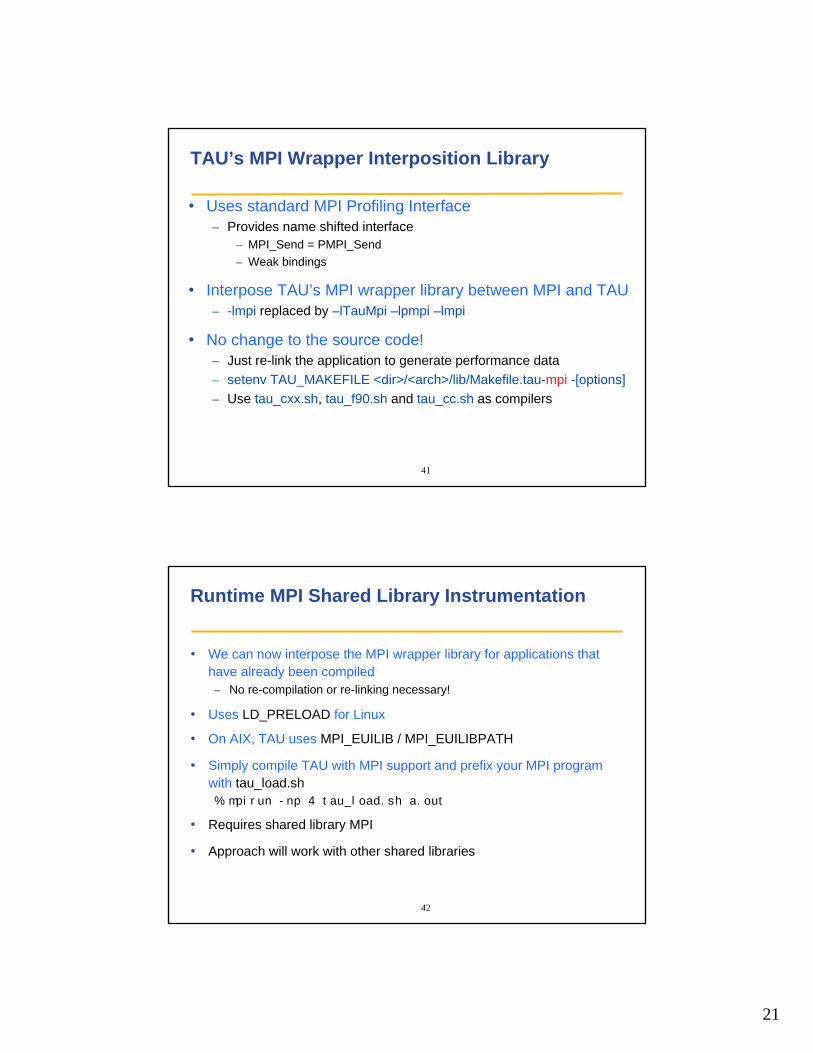
TAU’s MPI Wrapper Interposition Library
• Uses standard MPI Profiling Interface– Provides name shifted interface
– MPI_Send = PMPI_Send– Weak bindings
• Interpose TAU’s MPI wrapper library between MPI and TAU– -lmpi replaced by –lTauMpi –lpmpi –lmpi
• No change to the source code!– Just re-link the application to generate performance data– setenv TAU_MAKEFILE <dir>/<arch>/lib/Makefile.tau-mpi -[options]– Use tau_cxx.sh, tau_f90.sh and tau_cc.sh as compilers
42
Runtime MPI Shared Library Instrumentation
• We can now interpose the MPI wrapper library for applications that have already been compiled– No re-compilation or re-linking necessary!
• Uses LD_PRELOAD for Linux
• On AIX, TAU uses MPI_EUILIB / MPI_EUILIBPATH
• Simply compile TAU with MPI support and prefix your MPI program with tau_load.sh% mpirun -np 4 tau_load.sh a.out
• Requires shared library MPI
• Approach will work with other shared libraries
22
43
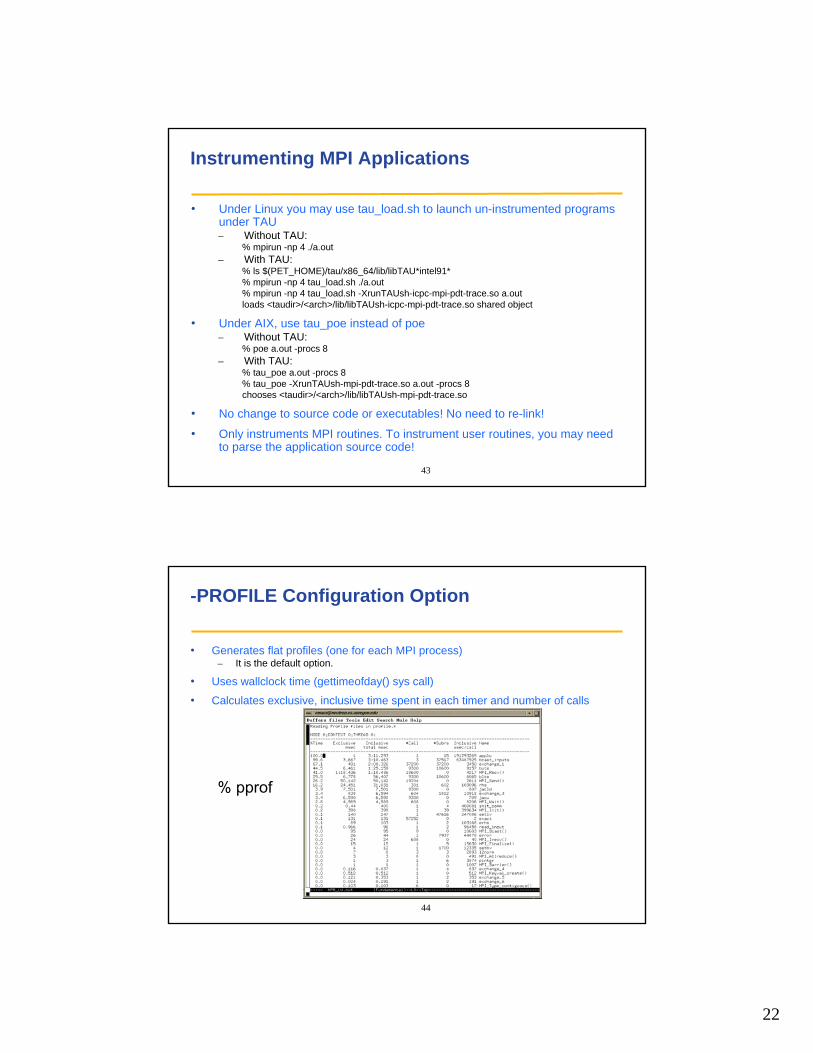
Instrumenting MPI Applications
• Under Linux you may use tau_load.sh to launch un-instrumented programs under TAU– Without TAU:
% mpirun -np 4 ./a.out– With TAU:
% ls $(PET_HOME)/tau/x86_64/lib/libTAU*intel91*% mpirun -np 4 tau_load.sh ./a.out% mpirun -np 4 tau_load.sh -XrunTAUsh-icpc-mpi-pdt-trace.so a.outloads <taudir>/<arch>/lib/libTAUsh-icpc-mpi-pdt-trace.so shared object
• Under AIX, use tau_poe instead of poe– Without TAU:
% poe a.out -procs 8– With TAU:
% tau_poe a.out -procs 8% tau_poe -XrunTAUsh-mpi-pdt-trace.so a.out -procs 8chooses <taudir>/<arch>/lib/libTAUsh-mpi-pdt-trace.so
• No change to source code or executables! No need to re-link!
• Only instruments MPI routines. To instrument user routines, you may need to parse the application source code!
44
-PROFILE Configuration Option
• Generates flat profiles (one for each MPI process)– It is the default option.
• Uses wallclock time (gettimeofday() sys call)
• Calculates exclusive, inclusive time spent in each timer and number of calls
% pprof
23
45
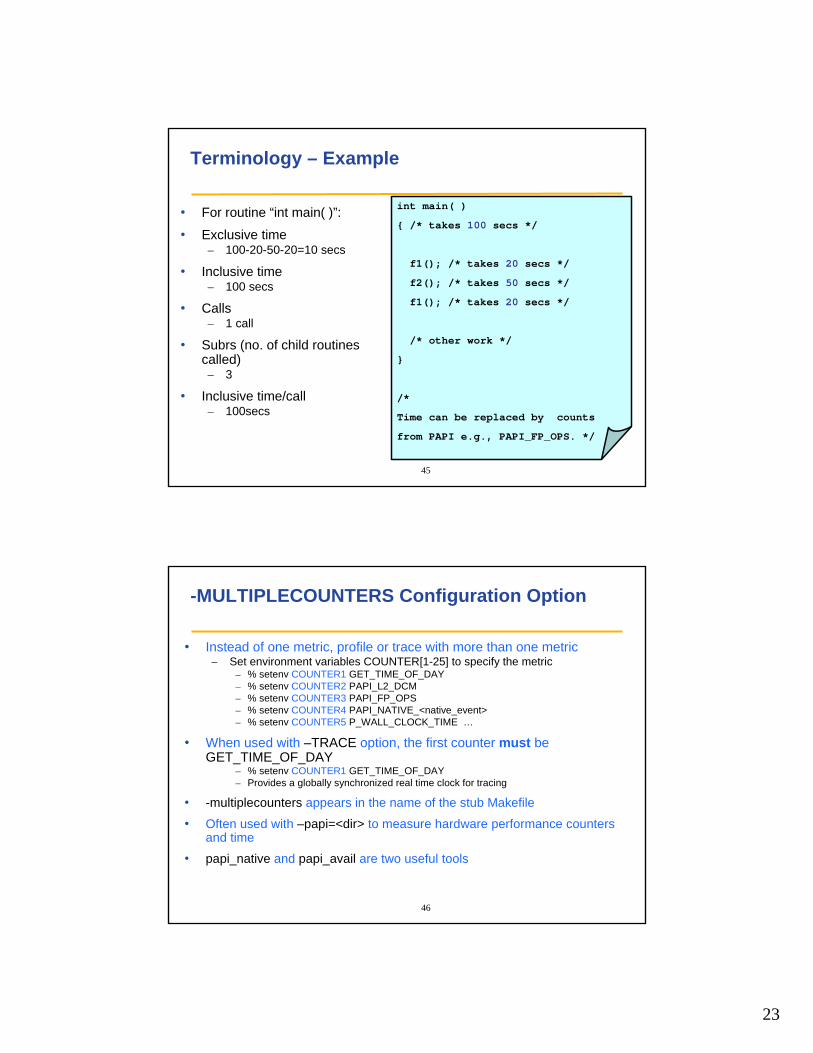
Terminology – Example
• For routine “int main( )”:
• Exclusive time – 100-20-50-20=10 secs
• Inclusive time – 100 secs
• Calls– 1 call
• Subrs (no. of child routines called)– 3
• Inclusive time/call – 100secs
int main( )
{ /* takes 100 secs */
f1(); /* takes 20 secs */
f2(); /* takes 50 secs */
f1(); /* takes 20 secs */
/* other work */
}
/*
Time can be replaced by counts
from PAPI e.g., PAPI_FP_OPS. */
46
-MULTIPLECOUNTERS Configuration Option
• Instead of one metric, profile or trace with more than one metric– Set environment variables COUNTER[1-25] to specify the metric
– % setenv COUNTER1 GET_TIME_OF_DAY– % setenv COUNTER2 PAPI_L2_DCM– % setenv COUNTER3 PAPI_FP_OPS– % setenv COUNTER4 PAPI_NATIVE_<native_event>– % setenv COUNTER5 P_WALL_CLOCK_TIME …
• When used with –TRACE option, the first counter must be GET_TIME_OF_DAY
– % setenv COUNTER1 GET_TIME_OF_DAY– Provides a globally synchronized real time clock for tracing
• -multiplecounters appears in the name of the stub Makefile
• Often used with –papi=<dir> to measure hardware performance counters and time
• papi_native and papi_avail are two useful tools
24
47
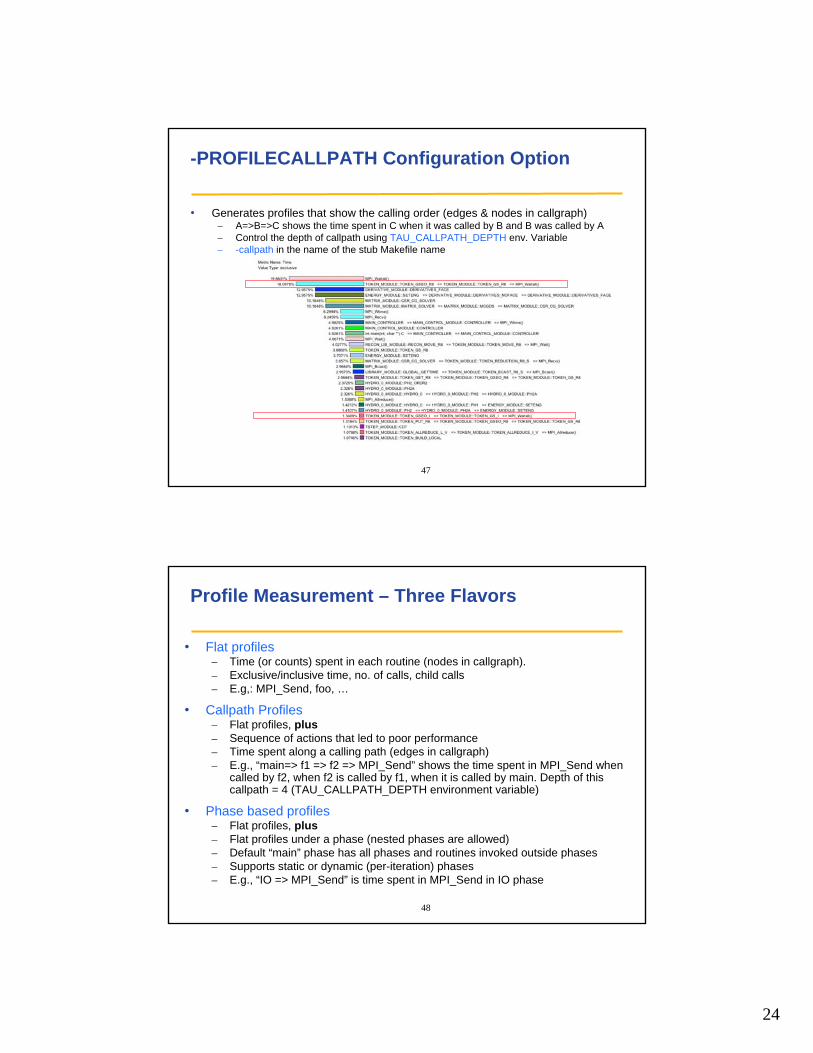
-PROFILECALLPATH Configuration Option
• Generates profiles that show the calling order (edges & nodes in callgraph)– A=>B=>C shows the time spent in C when it was called by B and B was called by A– Control the depth of callpath using TAU_CALLPATH_DEPTH env. Variable– -callpath in the name of the stub Makefile name
48
Profile Measurement – Three Flavors
• Flat profiles– Time (or counts) spent in each routine (nodes in callgraph).– Exclusive/inclusive time, no. of calls, child calls– E.g,: MPI_Send, foo, …
• Callpath Profiles– Flat profiles, plus– Sequence of actions that led to poor performance– Time spent along a calling path (edges in callgraph)– E.g., “main=> f1 => f2 => MPI_Send” shows the time spent in MPI_Send when
called by f2, when f2 is called by f1, when it is called by main. Depth of this callpath = 4 (TAU_CALLPATH_DEPTH environment variable)
• Phase based profiles– Flat profiles, plus– Flat profiles under a phase (nested phases are allowed)– Default “main” phase has all phases and routines invoked outside phases– Supports static or dynamic (per-iteration) phases– E.g., “IO => MPI_Send” is time spent in MPI_Send in IO phase
25
49
-DEPTHLIMIT Configuration Option
• Allows users to enable instrumentation at runtime based on the depth of a calling routine on a callstack.– Disables instrumentation in all routines a certain depth away from the root in
a callgraph
• TAU_DEPTH_LIMIT environment variable specifies depth % setenv TAU_DEPTH_LIMIT 1enables instrumentation in only “main”% setenv TAU_DEPTH_LIMIT 2enables instrumentation in main and routines that are directly called by main
• Stub makefile has -depthlimit in its name:setenv TAU_MAKEFILE <taudir>/<arch>/lib/Makefile.tau-icpc-mpi-depthlimit-pdt
50
-COMPENSATE Configuration Option
• Specifies online compensation of performance perturbation
• TAU computes its timer overhead and subtracts it from the profiles
• Works well with time or instructions based metrics
• Does not work with level 1/2 data cache misses
26
51
-TRACE Configuration Option
• Generates event-trace logs, rather than summary profiles
• Traces show when and where an event occurred in terms of location and the process that executed it
• Traces from multiple processes are merged:% tau_treemerge.pl
– generates tau.trc and tau.edf as merged trace and event definition file
• TAU traces can be converted to Vampir’s OTF/VTF3, Jumpshot SLOG2, Paraver trace formats:
% tau2otf tau.trc tau.edf app.otf % tau2vtf tau.trc tau.edf app.vpt.gz% tau2slog2 tau.trc tau.edf -o app.slog2% tau_convert -paraver tau.trc tau.edf app.prv
• Stub Makefile has -trace in its name% setenv TAU_MAKEFILE <taudir>/<arch>/lib/
Makefile.tau-icpc-mpi-pdt-trace
52
Memory Profiling in TAU
• Configuration option –PROFILEMEMORY– Records global heap memory utilization for each function– Takes one sample at beginning of each function and associates the sample
with function name
• Configuration option -PROFILEHEADROOM– Records headroom (amount of free memory to grow) for each function– Takes one sample at beginning of each function and associates it with the
callstack [TAU_CALLPATH_DEPTH env variable]– Useful for debugging memory usage on IBM BG/L.
• Independent of instrumentation/measurement options selected
• No need to insert macros/calls in the source code
• User defined atomic events appear in profiles/traces
27
53
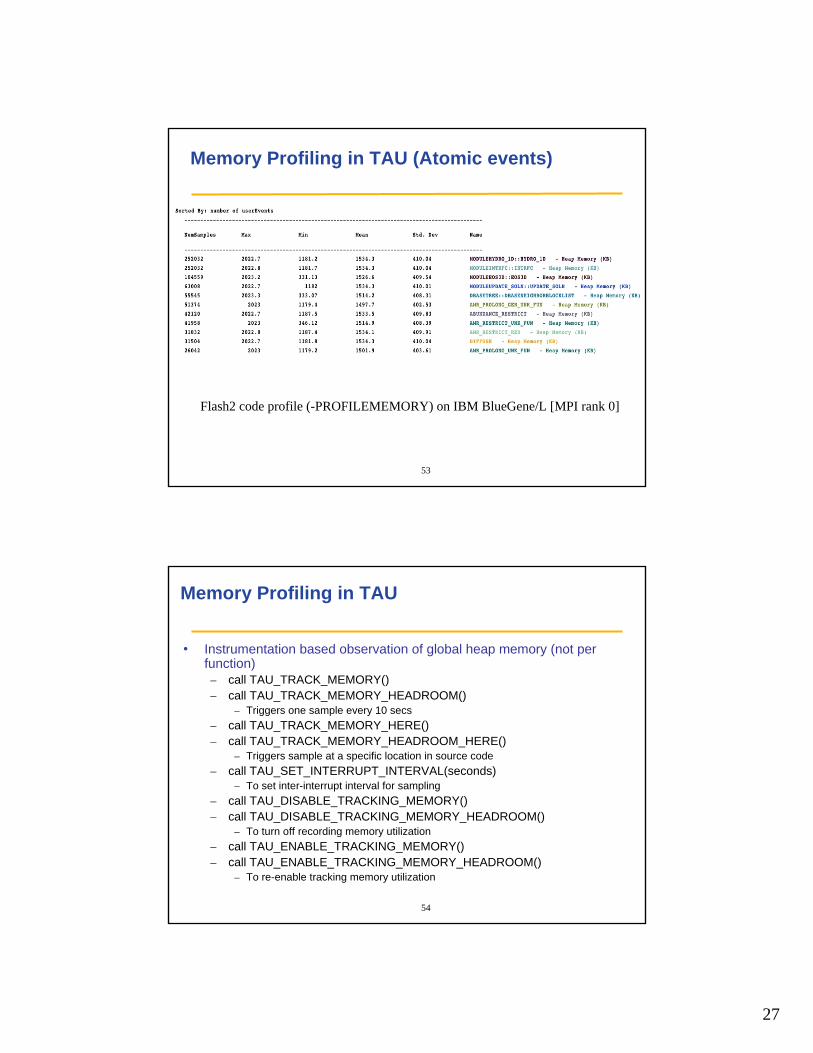
Memory Profiling in TAU (Atomic events)
Flash2 code profile (-PROFILEMEMORY) on IBM BlueGene/L [MPI rank 0]
54
Memory Profiling in TAU
• Instrumentation based observation of global heap memory (not perfunction)– call TAU_TRACK_MEMORY()– call TAU_TRACK_MEMORY_HEADROOM()
– Triggers one sample every 10 secs – call TAU_TRACK_MEMORY_HERE()– call TAU_TRACK_MEMORY_HEADROOM_HERE()
– Triggers sample at a specific location in source code– call TAU_SET_INTERRUPT_INTERVAL(seconds)
– To set inter-interrupt interval for sampling– call TAU_DISABLE_TRACKING_MEMORY()– call TAU_DISABLE_TRACKING_MEMORY_HEADROOM()
– To turn off recording memory utilization– call TAU_ENABLE_TRACKING_MEMORY()– call TAU_ENABLE_TRACKING_MEMORY_HEADROOM()
– To re-enable tracking memory utilization
28
55
Detecting Memory Leaks in C/C++
• TAU wrapper library for malloc/realloc/free
• During instrumentation, specify-optDetectMemoryLeaks option to TAU_COMPILER
% setenv TAU_OPTIONS ‘-optVerbose -optDetectMemoryLeaks’% setenv TAU_MAKEFILE <taudir>/<arch>/lib/Makefile.tau-icpc-mpi-pdt...% tau_cxx.sh foo.cpp ...
• Tracks each memory allocation/de-allocation in parsed files
• Correlates each memory event with the executing callstack
• At the end of execution, TAU detects memory leaks
• TAU reports leaks based on allocations and the executing callstack
• Set TAU_CALLPATH_DEPTH environment variable to limit callpath data– default is 2
• Future work– Support for C++ new/delete planned– Support for Fortran 90/95 allocate/deallocate planned
56
Detecting Memory Leaks in C/C++
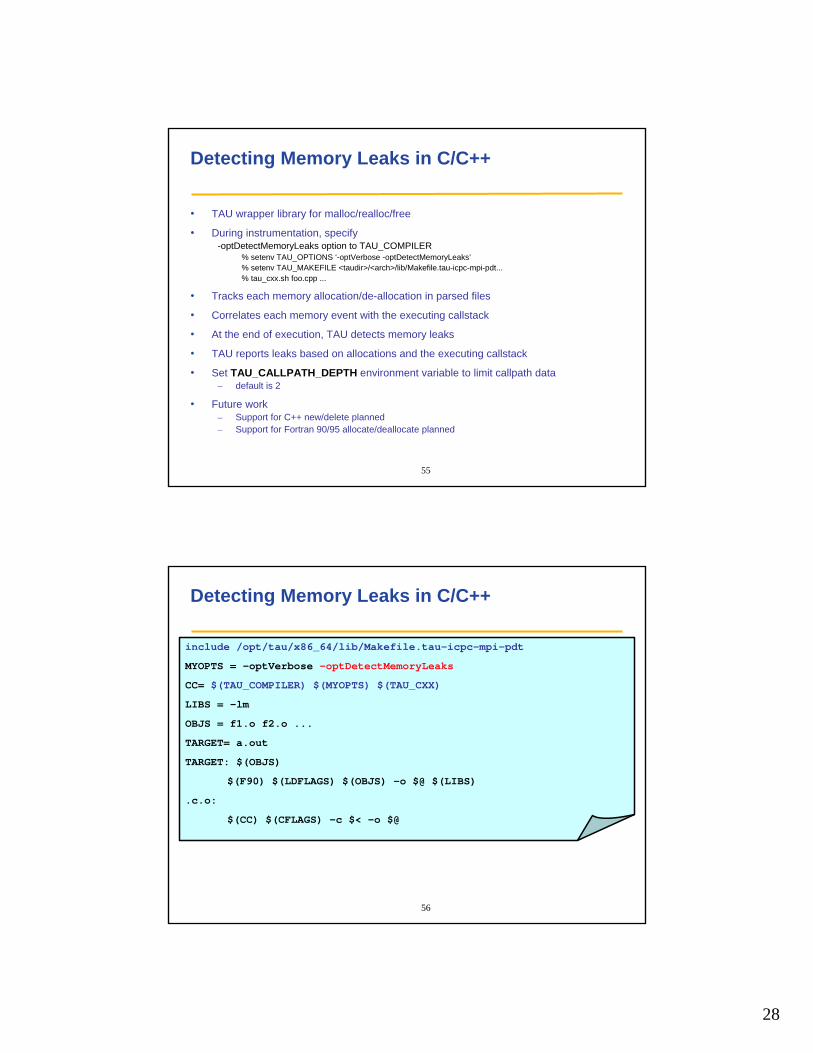
include /opt/tau/x86_64/lib/Makefile.tau-icpc-mpi-pdt
MYOPTS = -optVerbose -optDetectMemoryLeaks
CC= $(TAU_COMPILER) $(MYOPTS) $(TAU_CXX)
LIBS = -lm
OBJS = f1.o f2.o ...
TARGET= a.out
TARGET: $(OBJS)
$(F90) $(LDFLAGS) $(OBJS) -o $@ $(LIBS)
.c.o:
$(CC) $(CFLAGS) -c $< -o $@

29
57
Memory Leak Detection
58
TAU Manual Instrumentation API for C/C++
• Initialization and runtime configuration– TAU_PROFILE_INIT(argc, argv);
TAU_PROFILE_SET_NODE(myNode);TAU_PROFILE_SET_CONTEXT(myContext);TAU_PROFILE_EXIT(message);TAU_REGISTER_THREAD();
• Function and class methods for C++ only:– TAU_PROFILE(name, type, group);– TAU_PROFILE ( name, type, group);
• Template– TAU_TYPE_STRING(variable, type);
TAU_PROFILE(name, type, group);CT (variable);
• User-defined timing– TAU_PROFILE_TIMER(timer, name, type, group);
TAU_PROFILE_START(timer);TAU_PROFILE_STOP(timer);
30
59
TAU Measurement API (continued)
• Defining application phases– TAU_PHASE_CREATE_STATIC( var, name, type, group);– TAU_PHASE_CREATE_DYNAMIC( var, name, type, group);– TAU_PHASE_START(var)– TAU_PHASE_STOP (var)
• User-defined events– TAU_REGISTER_EVENT(variable, event_name);
TAU_EVENT(variable, value);TAU_PROFILE_STMT(statement);
• Heap Memory Tracking:– TAU_TRACK_MEMORY();– TAU_TRACK_MEMORY_HEADROOM();– TAU_SET_INTERRUPT_INTERVAL(seconds);– TAU_DISABLE_TRACKING_MEMORY[_HEADROOM]();– TAU_ENABLE_TRACKING_MEMORY[_HEADROOM]();
60
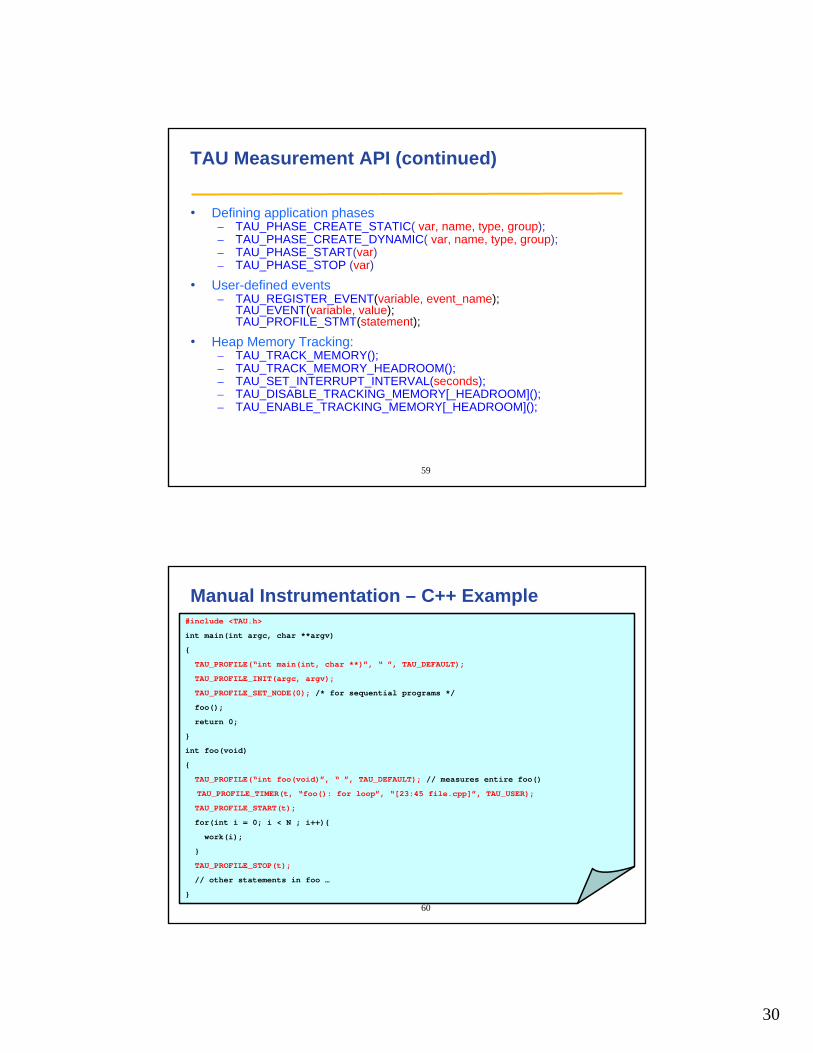
Manual Instrumentation – C++ Example#include <TAU.h>
int main(int argc, char **argv)
{
TAU_PROFILE(“int main(int, char **)”, “ ”, TAU_DEFAULT);
TAU_PROFILE_INIT(argc, argv);
TAU_PROFILE_SET_NODE(0); /* for sequential programs */
foo();
return 0;
}
int foo(void)
{
TAU_PROFILE(“int foo(void)”, “ ”, TAU_DEFAULT); // measures entire foo()
TAU_PROFILE_TIMER(t, “foo(): for loop”, “[23:45 file.cpp]”, TAU_USER);
TAU_PROFILE_START(t);
for(int i = 0; i < N ; i++){
work(i);
}
TAU_PROFILE_STOP(t);
// other statements in foo …
}
31
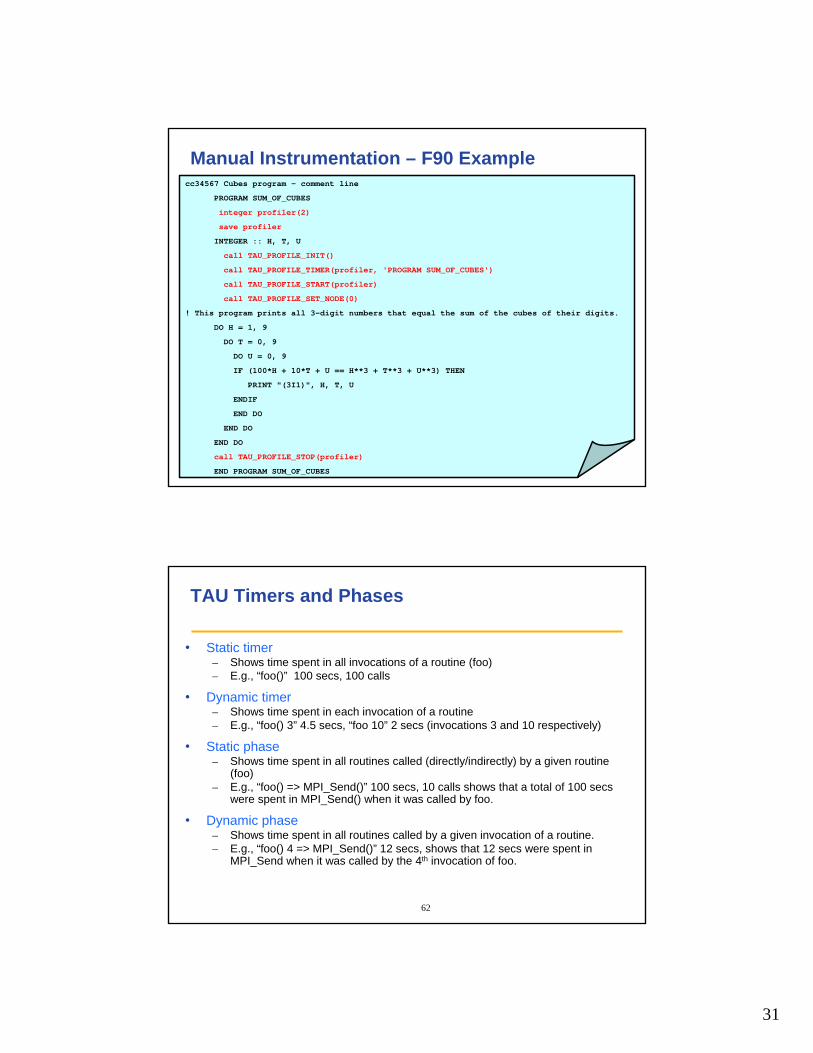
61
Manual Instrumentation – F90 Examplecc34567 Cubes program – comment line
PROGRAM SUM_OF_CUBES
integer profiler(2)
save profiler
INTEGER :: H, T, U
call TAU_PROFILE_INIT()
call TAU_PROFILE_TIMER(profiler, 'PROGRAM SUM_OF_CUBES')
call TAU_PROFILE_START(profiler)
call TAU_PROFILE_SET_NODE(0)
! This program prints all 3-digit numbers that equal the sum of the cubes of their digits.
DO H = 1, 9
DO T = 0, 9
DO U = 0, 9
IF (100*H + 10*T + U == H**3 + T**3 + U**3) THEN
PRINT "(3I1)", H, T, U
ENDIF
END DO
END DO
END DO
call TAU_PROFILE_STOP(profiler)
END PROGRAM SUM_OF_CUBES
62
TAU Timers and Phases
• Static timer– Shows time spent in all invocations of a routine (foo)– E.g., “foo()” 100 secs, 100 calls
• Dynamic timer– Shows time spent in each invocation of a routine– E.g., “foo() 3” 4.5 secs, “foo 10” 2 secs (invocations 3 and 10 respectively)
• Static phase– Shows time spent in all routines called (directly/indirectly) by a given routine
(foo)– E.g., “foo() => MPI_Send()” 100 secs, 10 calls shows that a total of 100 secs
were spent in MPI_Send() when it was called by foo.
• Dynamic phase– Shows time spent in all routines called by a given invocation of a routine.– E.g., “foo() 4 => MPI_Send()” 12 secs, shows that 12 secs were spent in
MPI_Send when it was called by the 4th invocation of foo.
32
63
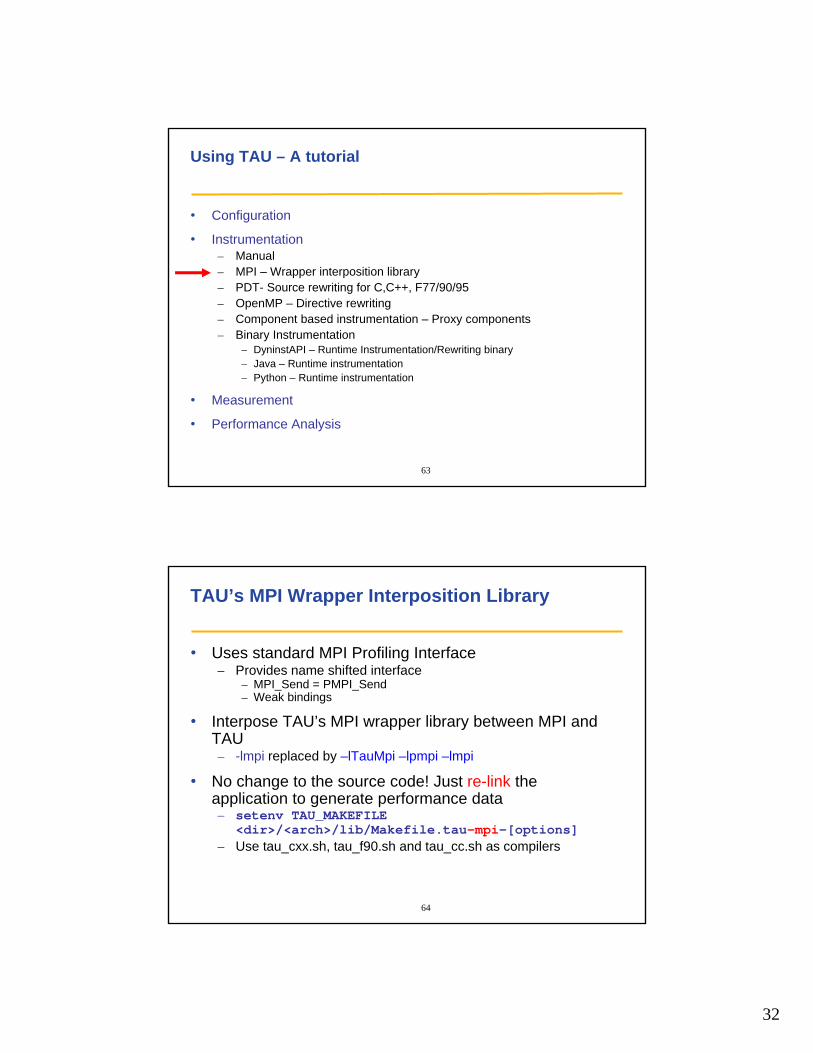
Using TAU – A tutorial
• Configuration
• Instrumentation– Manual– MPI – Wrapper interposition library– PDT- Source rewriting for C,C++, F77/90/95– OpenMP – Directive rewriting– Component based instrumentation – Proxy components– Binary Instrumentation
– DyninstAPI – Runtime Instrumentation/Rewriting binary– Java – Runtime instrumentation– Python – Runtime instrumentation
• Measurement
• Performance Analysis
64
TAU’s MPI Wrapper Interposition Library
• Uses standard MPI Profiling Interface– Provides name shifted interface
– MPI_Send = PMPI_Send– Weak bindings
• Interpose TAU’s MPI wrapper library between MPI and TAU– -lmpi replaced by –lTauMpi –lpmpi –lmpi
• No change to the source code! Just re-link the application to generate performance data– setenv TAU_MAKEFILE
<dir>/<arch>/lib/Makefile.tau-mpi-[options]– Use tau_cxx.sh, tau_f90.sh and tau_cc.sh as compilers
33
65
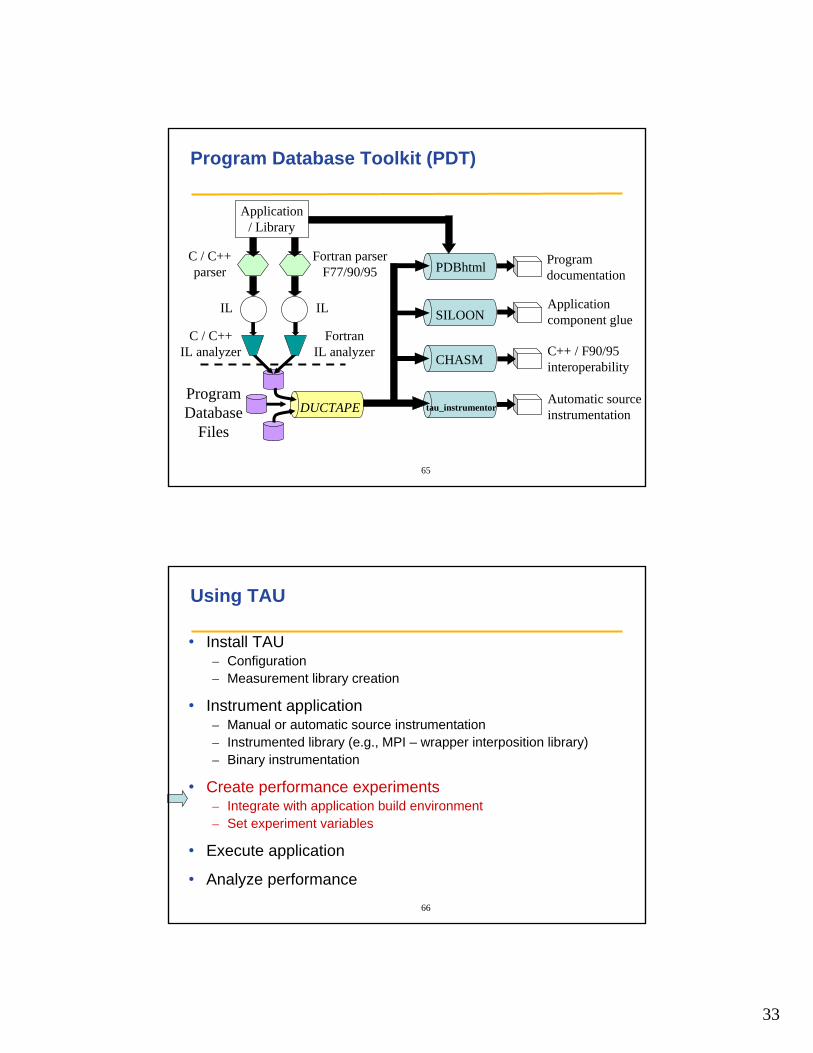
Program Database Toolkit (PDT)
Application/ Library
C / C++parser
Fortran parserF77/90/95
C / C++IL analyzer
FortranIL analyzer
ProgramDatabase
Files
IL IL
DUCTAPE
PDBhtml
SILOON
CHASM
tau_instrumentor
Programdocumentation
Applicationcomponent glue
C++ / F90/95interoperability
Automatic sourceinstrumentation
66
Using TAU
• Install TAU– Configuration– Measurement library creation
• Instrument application– Manual or automatic source instrumentation– Instrumented library (e.g., MPI – wrapper interposition library)– Binary instrumentation
• Create performance experiments– Integrate with application build environment– Set experiment variables
• Execute application
• Analyze performance
34
67
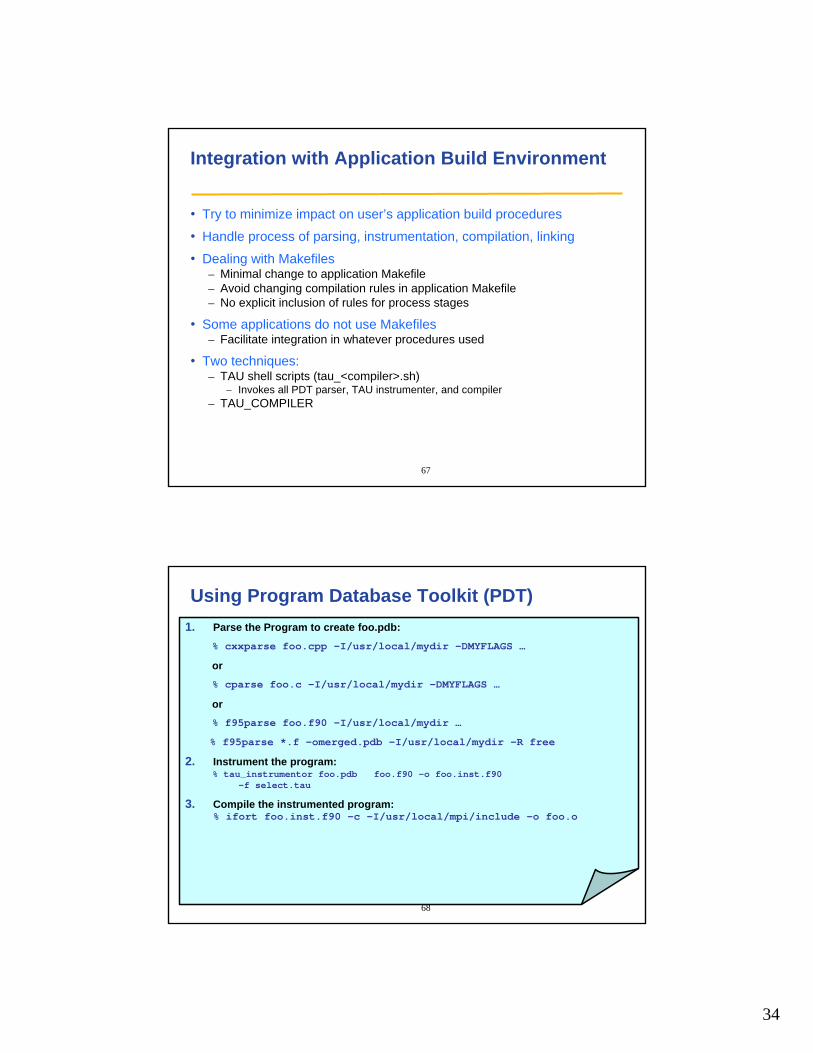
Integration with Application Build Environment
• Try to minimize impact on user’s application build procedures
• Handle process of parsing, instrumentation, compilation, linking
• Dealing with Makefiles– Minimal change to application Makefile– Avoid changing compilation rules in application Makefile– No explicit inclusion of rules for process stages
• Some applications do not use Makefiles– Facilitate integration in whatever procedures used
• Two techniques:– TAU shell scripts (tau_<compiler>.sh)
– Invokes all PDT parser, TAU instrumenter, and compiler– TAU_COMPILER
68
Using Program Database Toolkit (PDT)1. Parse the Program to create foo.pdb:
% cxxparse foo.cpp –I/usr/local/mydir –DMYFLAGS …
or% cparse foo.c –I/usr/local/mydir –DMYFLAGS …
or% f95parse foo.f90 –I/usr/local/mydir …
% f95parse *.f –omerged.pdb –I/usr/local/mydir –R free
2. Instrument the program:% tau_instrumentor foo.pdb foo.f90 –o foo.inst.f90
–f select.tau
3. Compile the instrumented program:% ifort foo.inst.f90 –c –I/usr/local/mpi/include –o foo.o
35
69
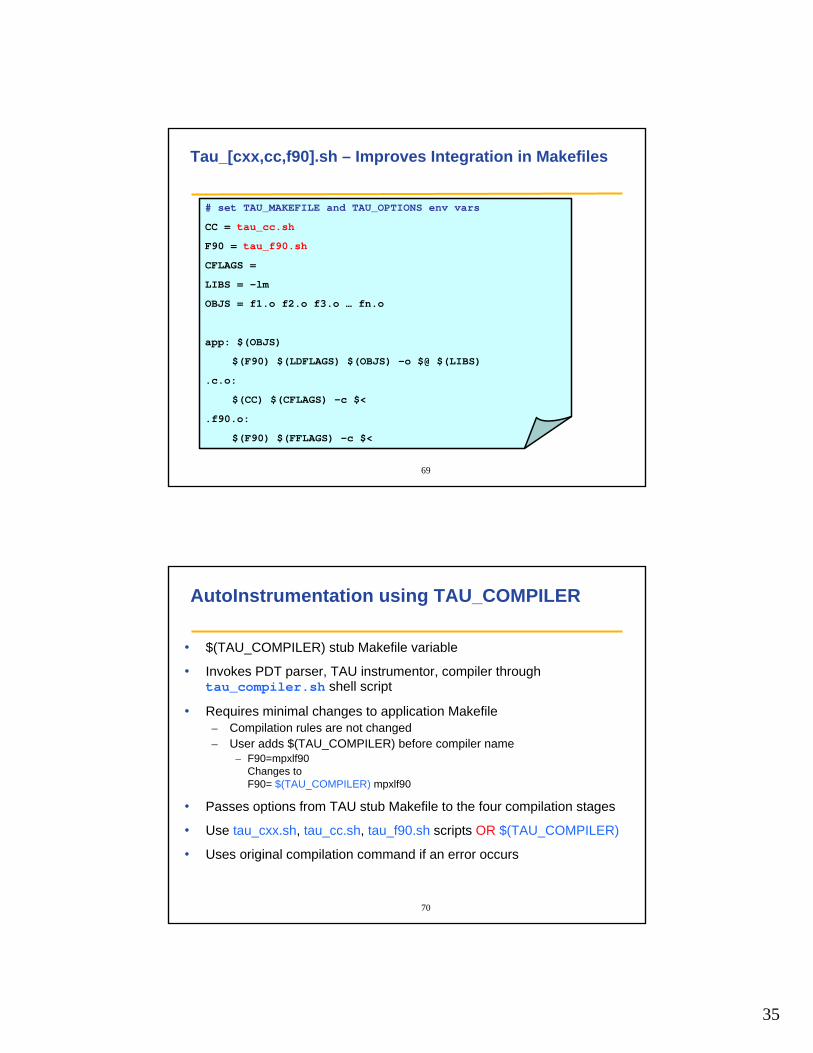
Tau_[cxx,cc,f90].sh – Improves Integration in Makefiles
# set TAU_MAKEFILE and TAU_OPTIONS env vars
CC = tau_cc.sh
F90 = tau_f90.sh
CFLAGS =
LIBS = -lm
OBJS = f1.o f2.o f3.o … fn.o
app: $(OBJS)
$(F90) $(LDFLAGS) $(OBJS) -o $@ $(LIBS)
.c.o:
$(CC) $(CFLAGS) -c $<
.f90.o:
$(F90) $(FFLAGS) –c $<
70
AutoInstrumentation using TAU_COMPILER
• $(TAU_COMPILER) stub Makefile variable
• Invokes PDT parser, TAU instrumentor, compiler through tau_compiler.sh shell script
• Requires minimal changes to application Makefile– Compilation rules are not changed– User adds $(TAU_COMPILER) before compiler name
– F90=mpxlf90Changes toF90= $(TAU_COMPILER) mpxlf90
• Passes options from TAU stub Makefile to the four compilation stages
• Use tau_cxx.sh, tau_cc.sh, tau_f90.sh scripts OR $(TAU_COMPILER)
• Uses original compilation command if an error occurs
36
71
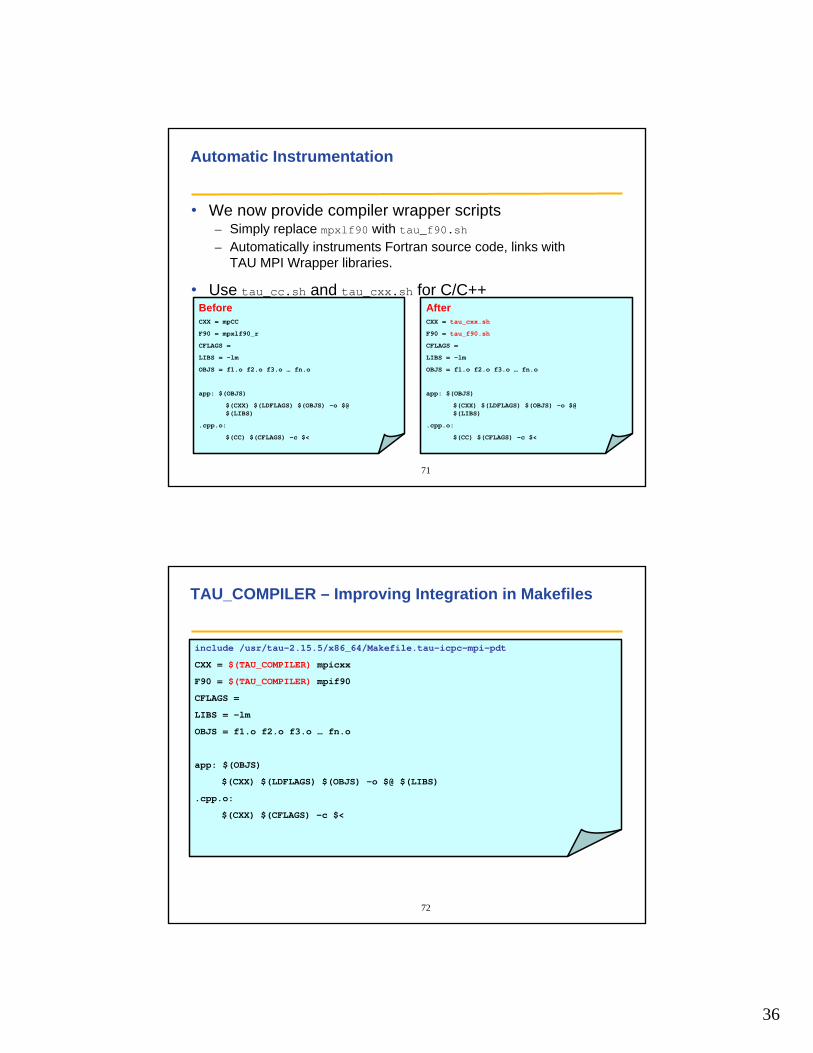
Automatic Instrumentation
• We now provide compiler wrapper scripts– Simply replace mpxlf90 with tau_f90.sh– Automatically instruments Fortran source code, links with
TAU MPI Wrapper libraries.
• Use tau_cc.sh and tau_cxx.sh for C/C++BeforeCXX = mpCC
F90 = mpxlf90_r
CFLAGS =
LIBS = -lm
OBJS = f1.o f2.o f3.o … fn.o
app: $(OBJS)
$(CXX) $(LDFLAGS) $(OBJS) -o $@ $(LIBS)
.cpp.o:
$(CC) $(CFLAGS) -c $<
AfterCXX = tau_cxx.sh
F90 = tau_f90.sh
CFLAGS =
LIBS = -lm
OBJS = f1.o f2.o f3.o … fn.o
app: $(OBJS)
$(CXX) $(LDFLAGS) $(OBJS) -o $@ $(LIBS)
.cpp.o:
$(CC) $(CFLAGS) -c $<
72
TAU_COMPILER – Improving Integration in Makefiles
include /usr/tau-2.15.5/x86_64/Makefile.tau-icpc-mpi-pdt
CXX = $(TAU_COMPILER) mpicxx
F90 = $(TAU_COMPILER) mpif90
CFLAGS =
LIBS = -lm
OBJS = f1.o f2.o f3.o … fn.o
app: $(OBJS)
$(CXX) $(LDFLAGS) $(OBJS) -o $@ $(LIBS)
.cpp.o:
$(CXX) $(CFLAGS) -c $<
37
73
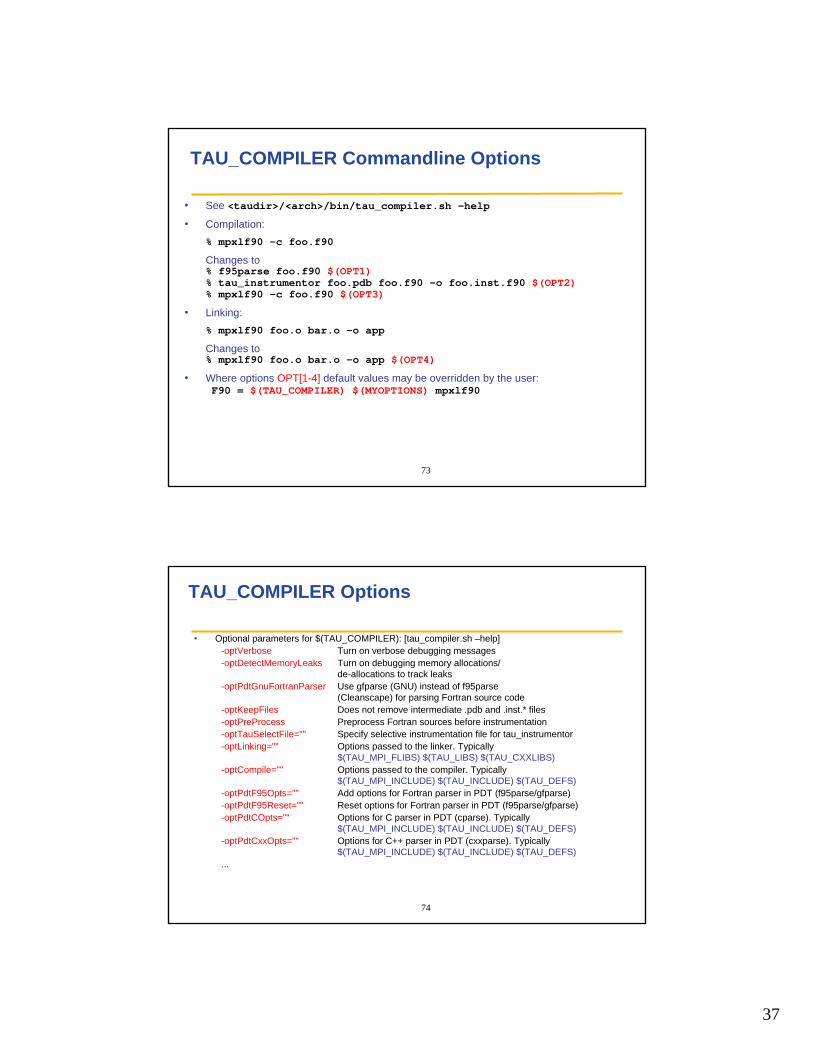
TAU_COMPILER Commandline Options
• See <taudir>/<arch>/bin/tau_compiler.sh –help
• Compilation:% mpxlf90 -c foo.f90
Changes to% f95parse foo.f90 $(OPT1)% tau_instrumentor foo.pdb foo.f90 –o foo.inst.f90 $(OPT2)% mpxlf90 –c foo.f90 $(OPT3)
• Linking:% mpxlf90 foo.o bar.o –o app
Changes to% mpxlf90 foo.o bar.o –o app $(OPT4)
• Where options OPT[1-4] default values may be overridden by the user:F90 = $(TAU_COMPILER) $(MYOPTIONS) mpxlf90
74
TAU_COMPILER Options
• Optional parameters for $(TAU_COMPILER): [tau_compiler.sh –help]-optVerbose Turn on verbose debugging messages-optDetectMemoryLeaks Turn on debugging memory allocations/
de-allocations to track leaks-optPdtGnuFortranParser Use gfparse (GNU) instead of f95parse
(Cleanscape) for parsing Fortran source code-optKeepFiles Does not remove intermediate .pdb and .inst.* files-optPreProcess Preprocess Fortran sources before instrumentation-optTauSelectFile="" Specify selective instrumentation file for tau_instrumentor-optLinking="" Options passed to the linker. Typically
$(TAU_MPI_FLIBS) $(TAU_LIBS) $(TAU_CXXLIBS)-optCompile="" Options passed to the compiler. Typically
$(TAU_MPI_INCLUDE) $(TAU_INCLUDE) $(TAU_DEFS)-optPdtF95Opts="" Add options for Fortran parser in PDT (f95parse/gfparse)-optPdtF95Reset="" Reset options for Fortran parser in PDT (f95parse/gfparse)-optPdtCOpts="" Options for C parser in PDT (cparse). Typically
$(TAU_MPI_INCLUDE) $(TAU_INCLUDE) $(TAU_DEFS)-optPdtCxxOpts="" Options for C++ parser in PDT (cxxparse). Typically
$(TAU_MPI_INCLUDE) $(TAU_INCLUDE) $(TAU_DEFS)...
38
75
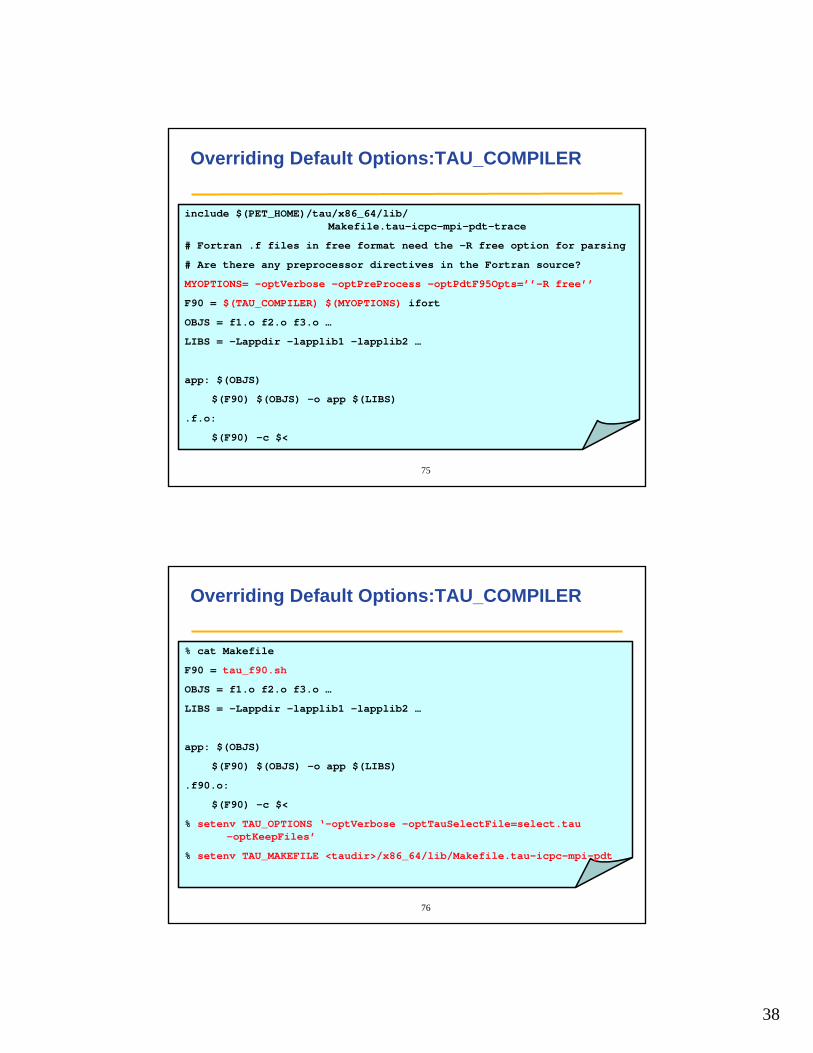
Overriding Default Options:TAU_COMPILER
include $(PET_HOME)/tau/x86_64/lib/Makefile.tau-icpc-mpi-pdt-trace
# Fortran .f files in free format need the -R free option for parsing
# Are there any preprocessor directives in the Fortran source?
MYOPTIONS= -optVerbose –optPreProcess -optPdtF95Opts=’’-R free’’
F90 = $(TAU_COMPILER) $(MYOPTIONS) ifort
OBJS = f1.o f2.o f3.o …
LIBS = -Lappdir –lapplib1 –lapplib2 …
app: $(OBJS)
$(F90) $(OBJS) –o app $(LIBS)
.f.o:
$(F90) –c $<
76
Overriding Default Options:TAU_COMPILER
% cat Makefile
F90 = tau_f90.sh
OBJS = f1.o f2.o f3.o …
LIBS = -Lappdir –lapplib1 –lapplib2 …
app: $(OBJS)
$(F90) $(OBJS) –o app $(LIBS)
.f90.o:
$(F90) –c $<
% setenv TAU_OPTIONS ‘-optVerbose -optTauSelectFile=select.tau -optKeepFiles’
% setenv TAU_MAKEFILE <taudir>/x86_64/lib/Makefile.tau-icpc-mpi-pdt
39
77
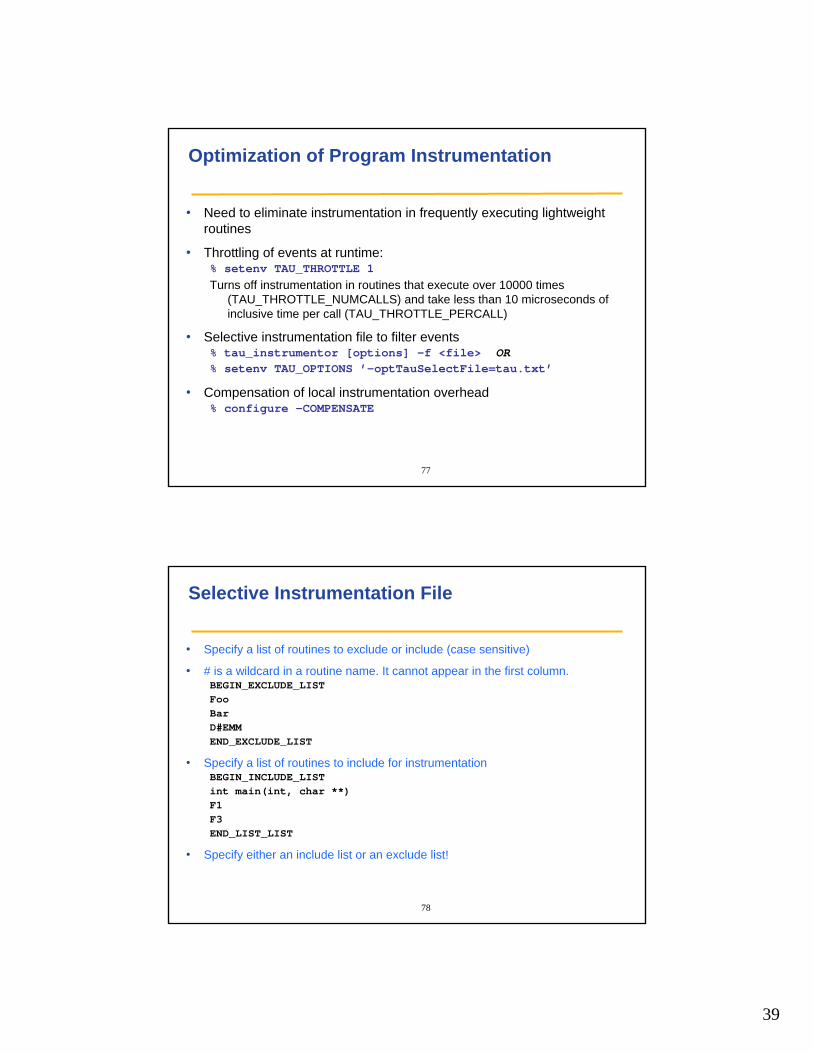
Optimization of Program Instrumentation
• Need to eliminate instrumentation in frequently executing lightweight routines
• Throttling of events at runtime:% setenv TAU_THROTTLE 1Turns off instrumentation in routines that execute over 10000 times
(TAU_THROTTLE_NUMCALLS) and take less than 10 microseconds of inclusive time per call (TAU_THROTTLE_PERCALL)
• Selective instrumentation file to filter events% tau_instrumentor [options] –f <file> OR% setenv TAU_OPTIONS ’-optTauSelectFile=tau.txt’
• Compensation of local instrumentation overhead % configure -COMPENSATE
78
Selective Instrumentation File
• Specify a list of routines to exclude or include (case sensitive)
• # is a wildcard in a routine name. It cannot appear in the first column.BEGIN_EXCLUDE_LISTFooBarD#EMM END_EXCLUDE_LIST
• Specify a list of routines to include for instrumentationBEGIN_INCLUDE_LISTint main(int, char **)F1F3END_LIST_LIST
• Specify either an include list or an exclude list!
40
79
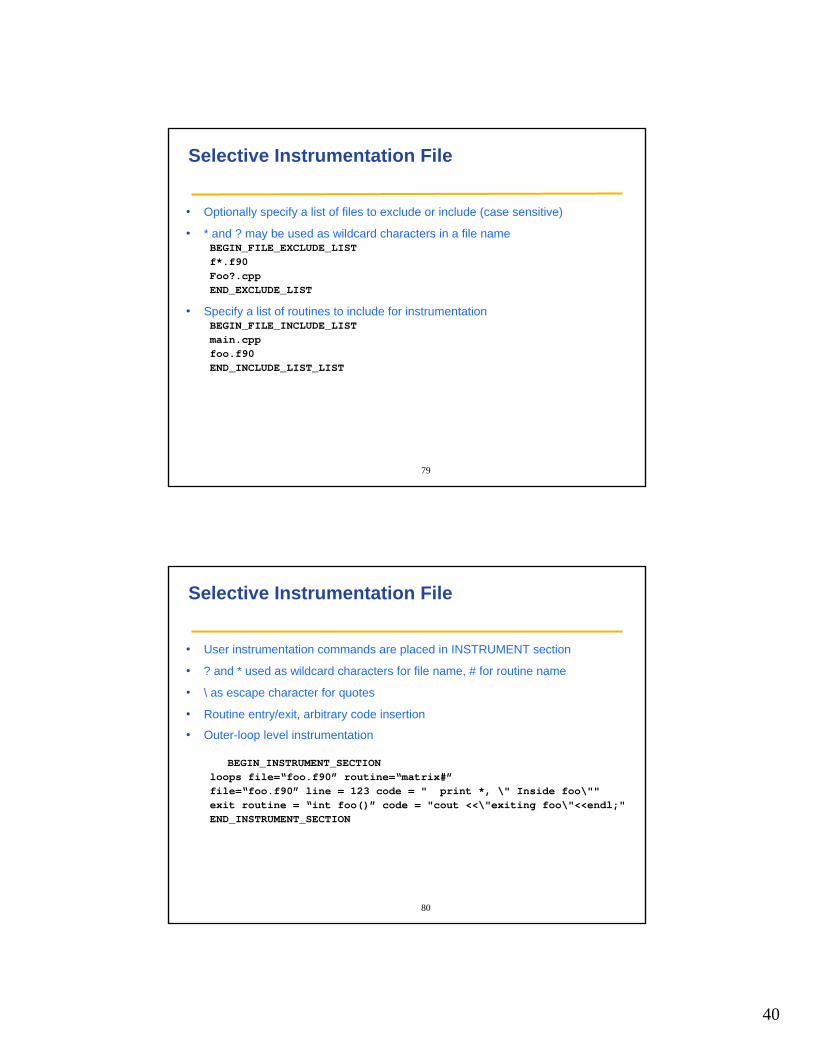
Selective Instrumentation File
• Optionally specify a list of files to exclude or include (case sensitive)
• * and ? may be used as wildcard characters in a file nameBEGIN_FILE_EXCLUDE_LISTf*.f90Foo?.cpp END_EXCLUDE_LIST
• Specify a list of routines to include for instrumentationBEGIN_FILE_INCLUDE_LISTmain.cppfoo.f90END_INCLUDE_LIST_LIST
80
Selective Instrumentation File
• User instrumentation commands are placed in INSTRUMENT section
• ? and * used as wildcard characters for file name, # for routine name
• \ as escape character for quotes
• Routine entry/exit, arbitrary code insertion
• Outer-loop level instrumentation
BEGIN_INSTRUMENT_SECTIONloops file=“foo.f90” routine=“matrix#”file=“foo.f90” line = 123 code = " print *, \" Inside foo\""exit routine = “int foo()” code = "cout <<\"exiting foo\"<<endl;"END_INSTRUMENT_SECTION
41
81
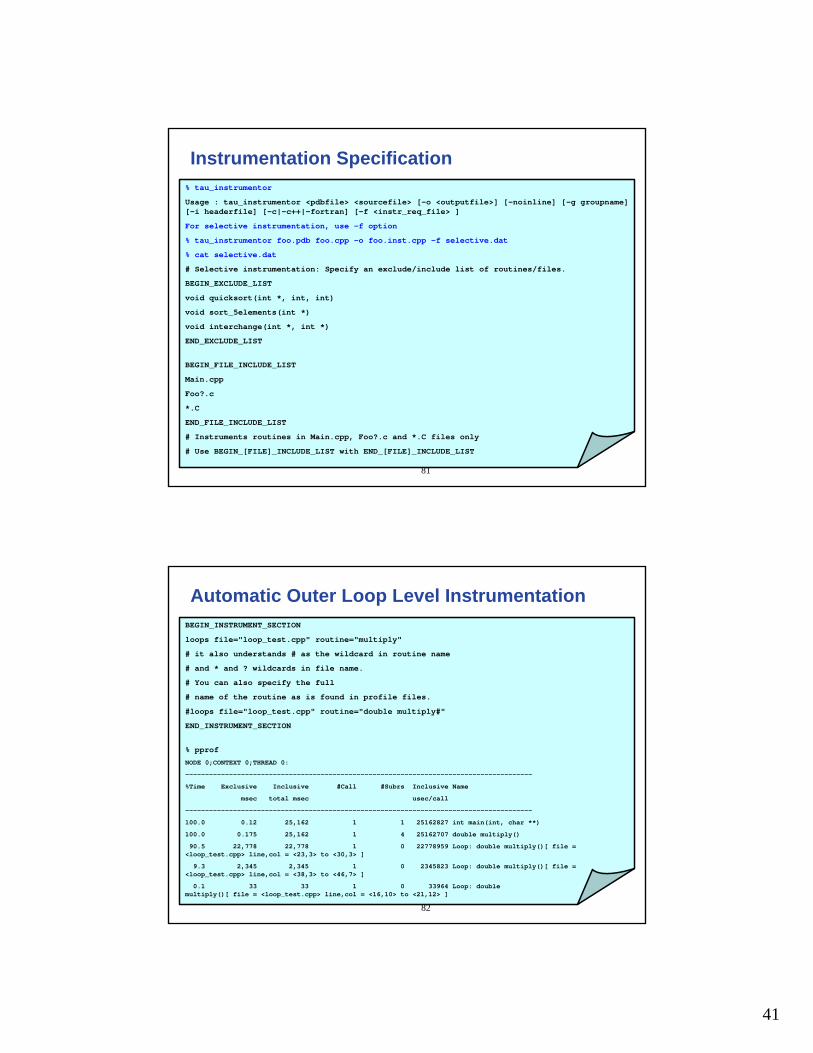
Instrumentation Specification% tau_instrumentor
Usage : tau_instrumentor <pdbfile> <sourcefile> [-o <outputfile>] [-noinline] [-g groupname] [-i headerfile] [-c|-c++|-fortran] [-f <instr_req_file> ]
For selective instrumentation, use –f option
% tau_instrumentor foo.pdb foo.cpp –o foo.inst.cpp –f selective.dat
% cat selective.dat
# Selective instrumentation: Specify an exclude/include list of routines/files.
BEGIN_EXCLUDE_LIST
void quicksort(int *, int, int)
void sort_5elements(int *)
void interchange(int *, int *)
END_EXCLUDE_LIST
BEGIN_FILE_INCLUDE_LIST
Main.cpp
Foo?.c
*.C
END_FILE_INCLUDE_LIST
# Instruments routines in Main.cpp, Foo?.c and *.C files only
# Use BEGIN_[FILE]_INCLUDE_LIST with END_[FILE]_INCLUDE_LIST
82
Automatic Outer Loop Level InstrumentationBEGIN_INSTRUMENT_SECTION
loops file="loop_test.cpp" routine="multiply"
# it also understands # as the wildcard in routine name
# and * and ? wildcards in file name.
# You can also specify the full
# name of the routine as is found in profile files.
#loops file="loop_test.cpp" routine="double multiply#"
END_INSTRUMENT_SECTION
% pprof
NODE 0;CONTEXT 0;THREAD 0:
---------------------------------------------------------------------------------------
%Time Exclusive Inclusive #Call #Subrs Inclusive Name
msec total msec usec/call
---------------------------------------------------------------------------------------
100.0 0.12 25,162 1 1 25162827 int main(int, char **)
100.0 0.175 25,162 1 4 25162707 double multiply()
90.5 22,778 22,778 1 0 22778959 Loop: double multiply()[ file = <loop_test.cpp> line,col = <23,3> to <30,3> ]
9.3 2,345 2,345 1 0 2345823 Loop: double multiply()[ file = <loop_test.cpp> line,col = <38,3> to <46,7> ]
0.1 33 33 1 0 33964 Loop: double multiply()[ file = <loop_test.cpp> line,col = <16,10> to <21,12> ]
42
83
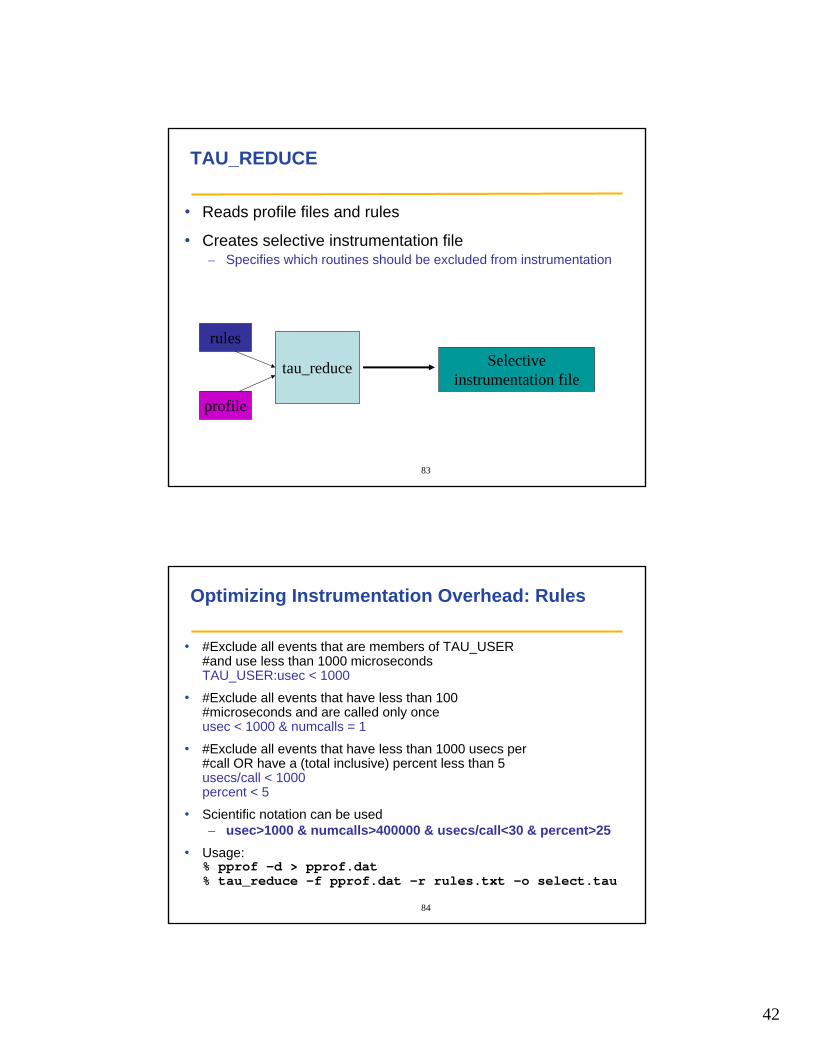
TAU_REDUCE
• Reads profile files and rules
• Creates selective instrumentation file – Specifies which routines should be excluded from instrumentation
tau_reduce
rules
profile
Selectiveinstrumentation file
84
Optimizing Instrumentation Overhead: Rules
• #Exclude all events that are members of TAU_USER #and use less than 1000 microsecondsTAU_USER:usec < 1000
• #Exclude all events that have less than 100 #microseconds and are called only onceusec < 1000 & numcalls = 1
• #Exclude all events that have less than 1000 usecs per #call OR have a (total inclusive) percent less than 5usecs/call < 1000percent < 5
• Scientific notation can be used– usec>1000 & numcalls>400000 & usecs/call<30 & percent>25
• Usage:% pprof –d > pprof.dat % tau_reduce –f pprof.dat –r rules.txt –o select.tau
43
85
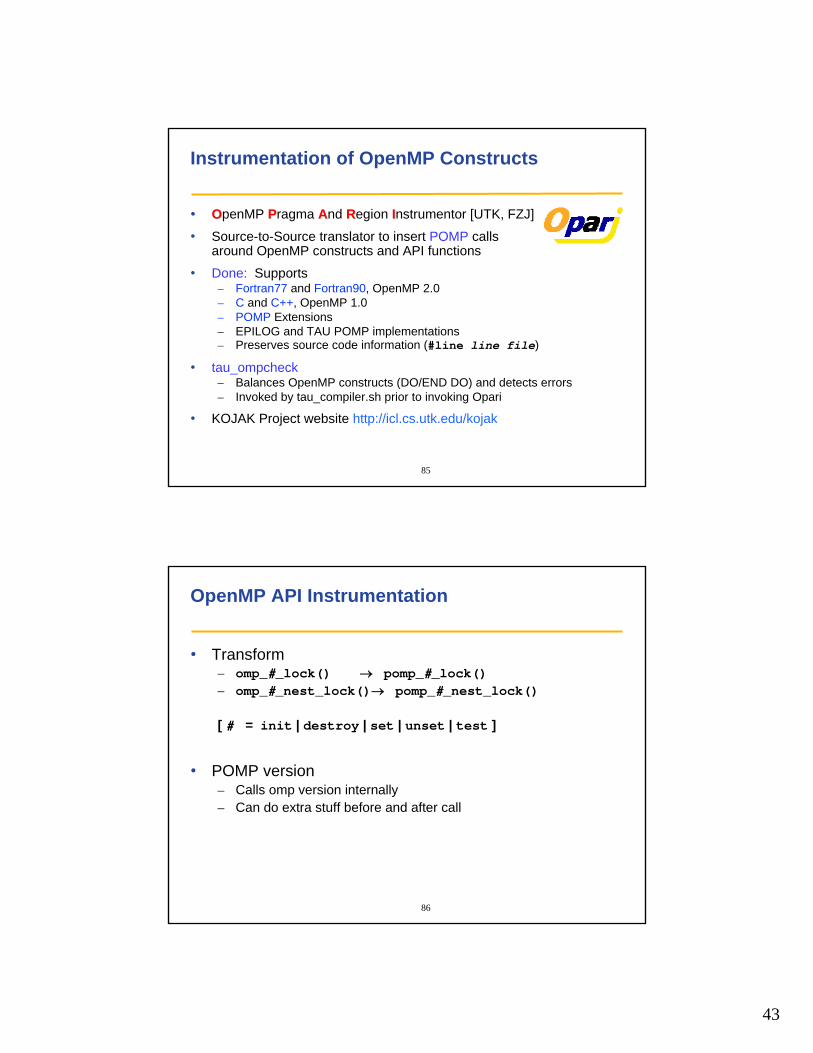
Instrumentation of OpenMP Constructs
•• OOpenMP PPragma AAnd RRegion IInstrumentor [UTK, FZJ]
• Source-to-Source translator to insert POMP callsaround OpenMP constructs and API functions
• Done: Supports– Fortran77 and Fortran90, OpenMP 2.0– C and C++, OpenMP 1.0– POMP Extensions– EPILOG and TAU POMP implementations– Preserves source code information (#line line file)
• tau_ompcheck– Balances OpenMP constructs (DO/END DO) and detects errors– Invoked by tau_compiler.sh prior to invoking Opari
• KOJAK Project website http://icl.cs.utk.edu/kojak
86
OpenMP API Instrumentation
• Transform– omp_#_lock() → pomp_#_lock()– omp_#_nest_lock()→ pomp_#_nest_lock()
[ # = init | destroy | set | unset | test ]
• POMP version– Calls omp version internally– Can do extra stuff before and after call
44
87
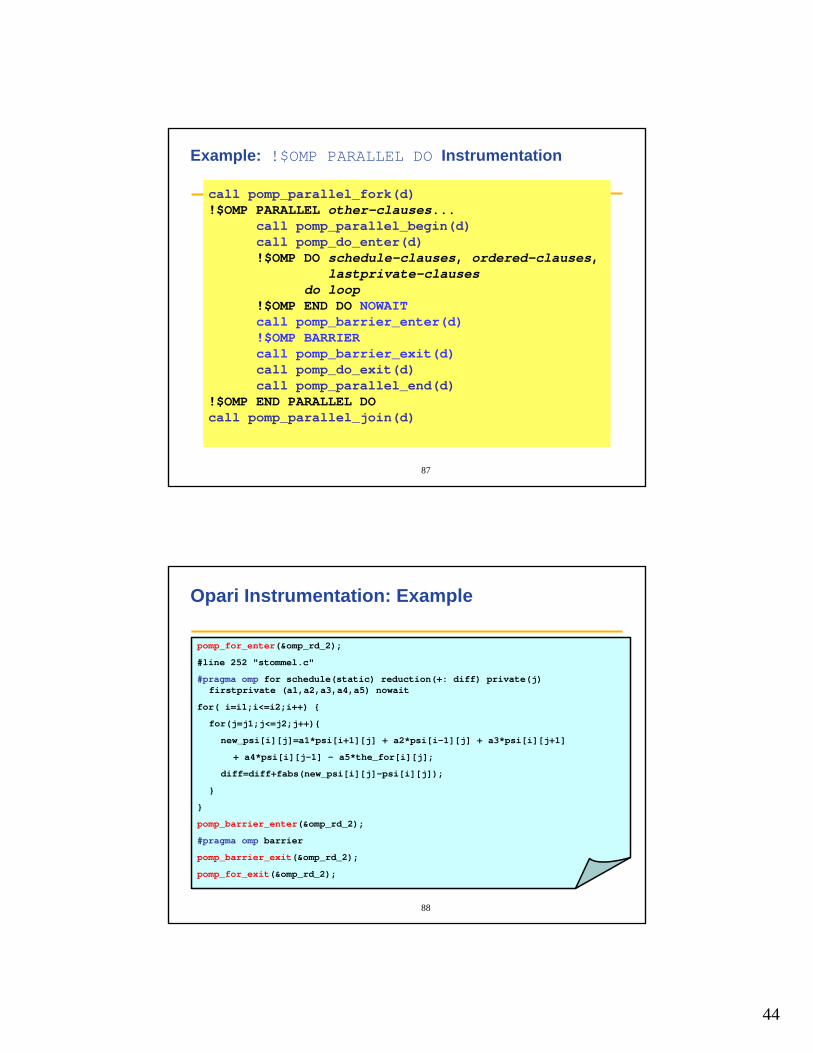
Example: !$OMP PARALLEL DO Instrumentation
!$OMP PARALLEL DO clauses...
do loop
!$OMP END PARALLEL DO
!$OMP PARALLEL other-clauses...
!$OMP DO schedule-clauses, ordered-clauses,lastprivate-clauses
do loop!$OMP END DO
!$OMP END PARALLEL DO
NOWAIT
!$OMP BARRIER
call pomp_parallel_fork(d)
call pomp_parallel_begin(d)
call pomp_parallel_end(d)
call pomp_parallel_join(d)
call pomp_do_enter(d)
call pomp_do_exit(d)
call pomp_barrier_enter(d)
call pomp_barrier_exit(d)
88
Opari Instrumentation: Example
• OpenMP directive instrumentationpomp_for_enter(&omp_rd_2);
#line 252 "stommel.c"
#pragma omp for schedule(static) reduction(+: diff) private(j) firstprivate (a1,a2,a3,a4,a5) nowait
for( i=i1;i<=i2;i++) {
for(j=j1;j<=j2;j++){
new_psi[i][j]=a1*psi[i+1][j] + a2*psi[i-1][j] + a3*psi[i][j+1]
+ a4*psi[i][j-1] - a5*the_for[i][j];
diff=diff+fabs(new_psi[i][j]-psi[i][j]);
}
}
pomp_barrier_enter(&omp_rd_2);
#pragma omp barrier
pomp_barrier_exit(&omp_rd_2);
pomp_for_exit(&omp_rd_2);
45
89
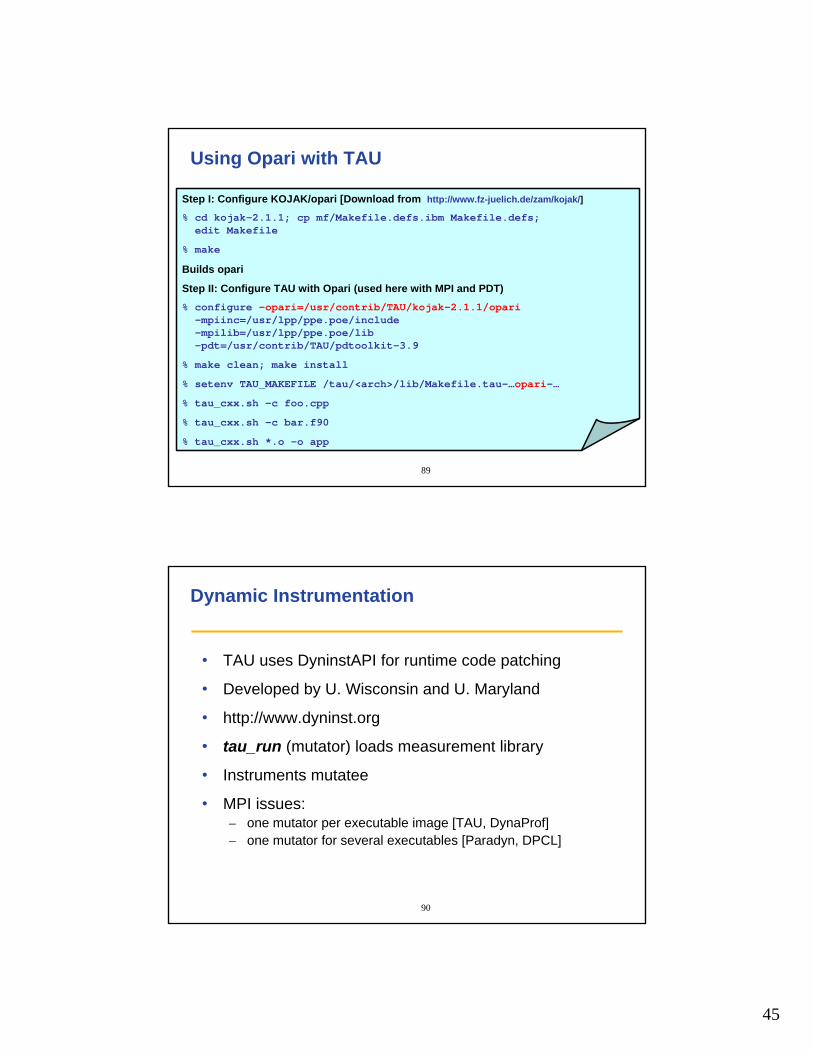
Using Opari with TAU
Step I: Configure KOJAK/opari [Download from http://www.fz-juelich.de/zam/kojak/]
% cd kojak-2.1.1; cp mf/Makefile.defs.ibm Makefile.defs; edit Makefile
% make
Builds opari
Step II: Configure TAU with Opari (used here with MPI and PDT)% configure –opari=/usr/contrib/TAU/kojak-2.1.1/opari
-mpiinc=/usr/lpp/ppe.poe/include–mpilib=/usr/lpp/ppe.poe/lib–pdt=/usr/contrib/TAU/pdtoolkit-3.9
% make clean; make install
% setenv TAU_MAKEFILE /tau/<arch>/lib/Makefile.tau-…opari-…
% tau_cxx.sh -c foo.cpp
% tau_cxx.sh -c bar.f90
% tau_cxx.sh *.o -o app
90
Dynamic Instrumentation
• TAU uses DyninstAPI for runtime code patching
• Developed by U. Wisconsin and U. Maryland
• http://www.dyninst.org
• tau_run (mutator) loads measurement library
• Instruments mutatee
• MPI issues:– one mutator per executable image [TAU, DynaProf]– one mutator for several executables [Paradyn, DPCL]
46
91
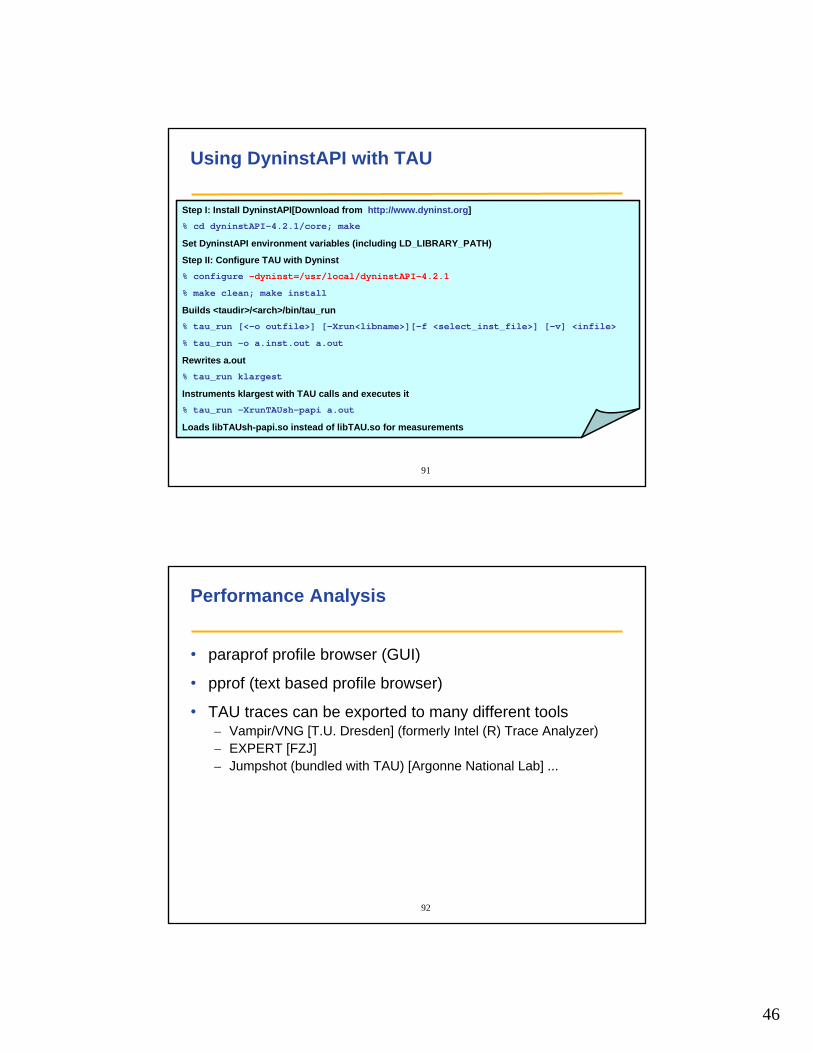
Using DyninstAPI with TAU
Step I: Install DyninstAPI[Download from http://www.dyninst.org]% cd dyninstAPI-4.2.1/core; make
Set DyninstAPI environment variables (including LD_LIBRARY_PATH)
Step II: Configure TAU with Dyninst % configure –dyninst=/usr/local/dyninstAPI-4.2.1
% make clean; make install
Builds <taudir>/<arch>/bin/tau_run% tau_run [<-o outfile>] [-Xrun<libname>][-f <select_inst_file>] [-v] <infile>
% tau_run –o a.inst.out a.out
Rewrites a.out% tau_run klargest
Instruments klargest with TAU calls and executes it% tau_run -XrunTAUsh-papi a.out
Loads libTAUsh-papi.so instead of libTAU.so for measurements
92
Performance Analysis
• paraprof profile browser (GUI)
• pprof (text based profile browser)
• TAU traces can be exported to many different tools– Vampir/VNG [T.U. Dresden] (formerly Intel (R) Trace Analyzer)– EXPERT [FZJ] – Jumpshot (bundled with TAU) [Argonne National Lab] ...
47
93
Building Bridges to Other Tools: TAU
94
TAU Performance System Interfaces
• PDT [U. Oregon, LANL, FZJ] for instrumentation of C++, C99, F95 source code• PAPI [UTK] for accessing hardware performance counters data• DyninstAPI [U. Maryland, U. Wisconsin] for runtime instrumentation• KOJAK [FZJ, UTK]
– Epilog trace generation library– CUBE callgraph visualizer– Opari OpenMP directive rewriting tool
• Vampir/VNG Trace Analyzer [TU Dresden]• VTF3/OTF trace generation library [TU Dresden] (available from TAU website)• Paraver trace visualizer [CEPBA]• Jumpshot-4 trace visualizer [MPICH, ANL]• JVMPI from JDK for Java program instrumentation [Sun]• Paraprof profile browser/PerfDMF database supports:
– TAU format– Gprof [GNU]– HPM Toolkit [IBM]– MpiP [ORNL, LLNL]– Dynaprof [UTK]– PSRun [NCSA]
48
95
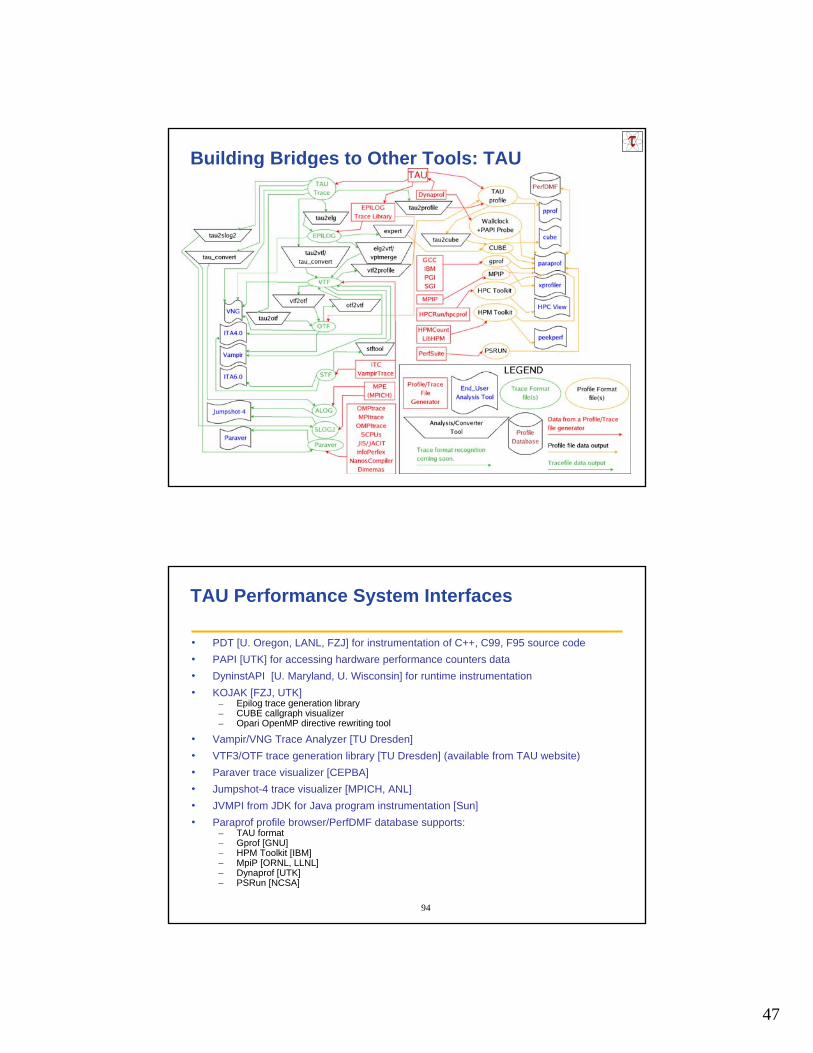
ParaProf – Manager Window
performancedatabase
metadata
96
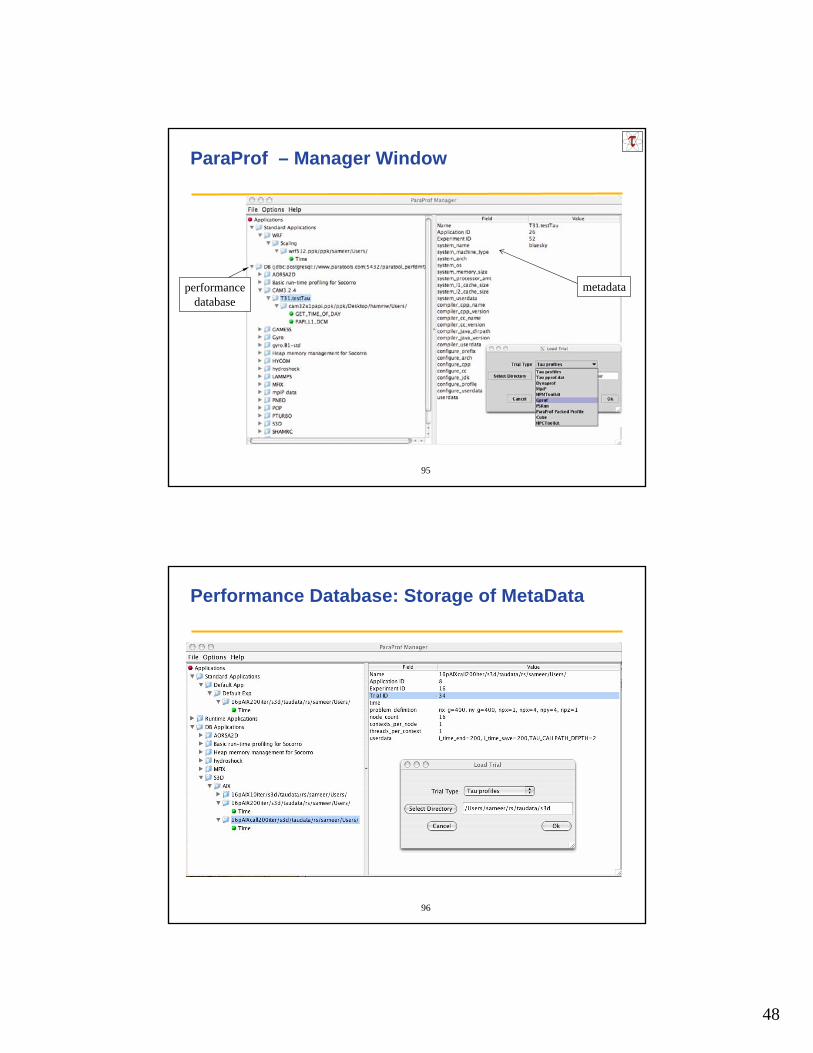
Performance Database: Storage of MetaData
49
97
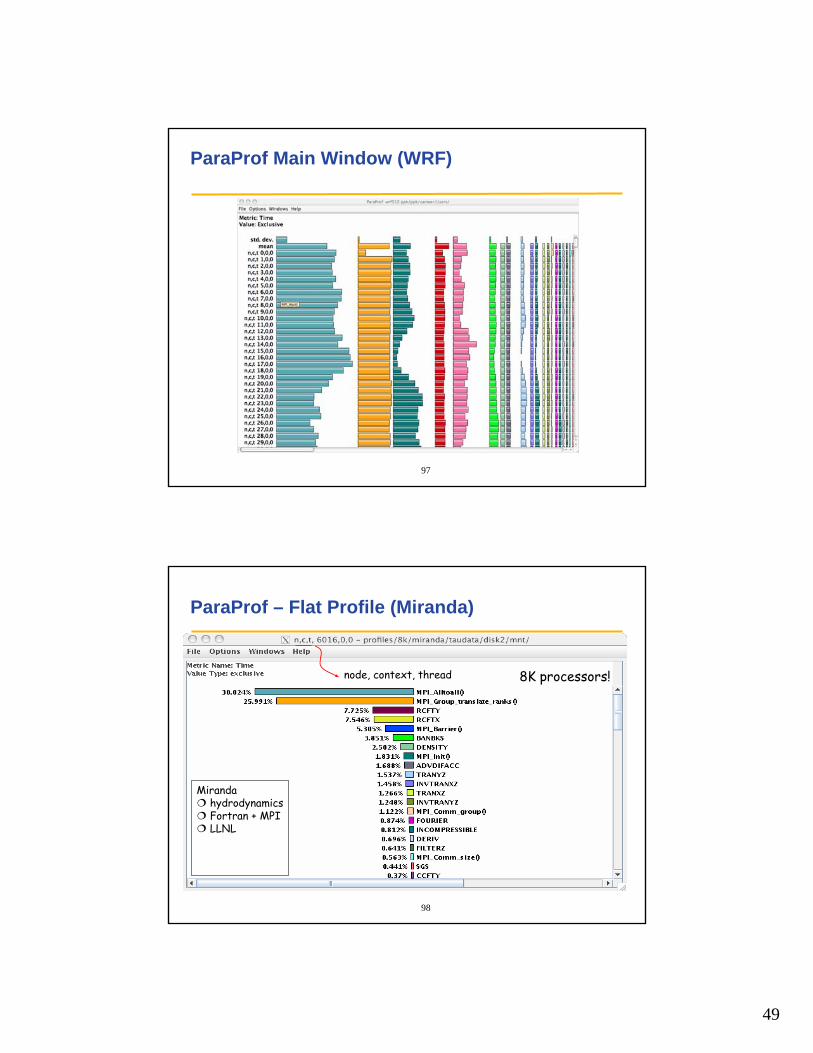
ParaProf Main Window (WRF)
98
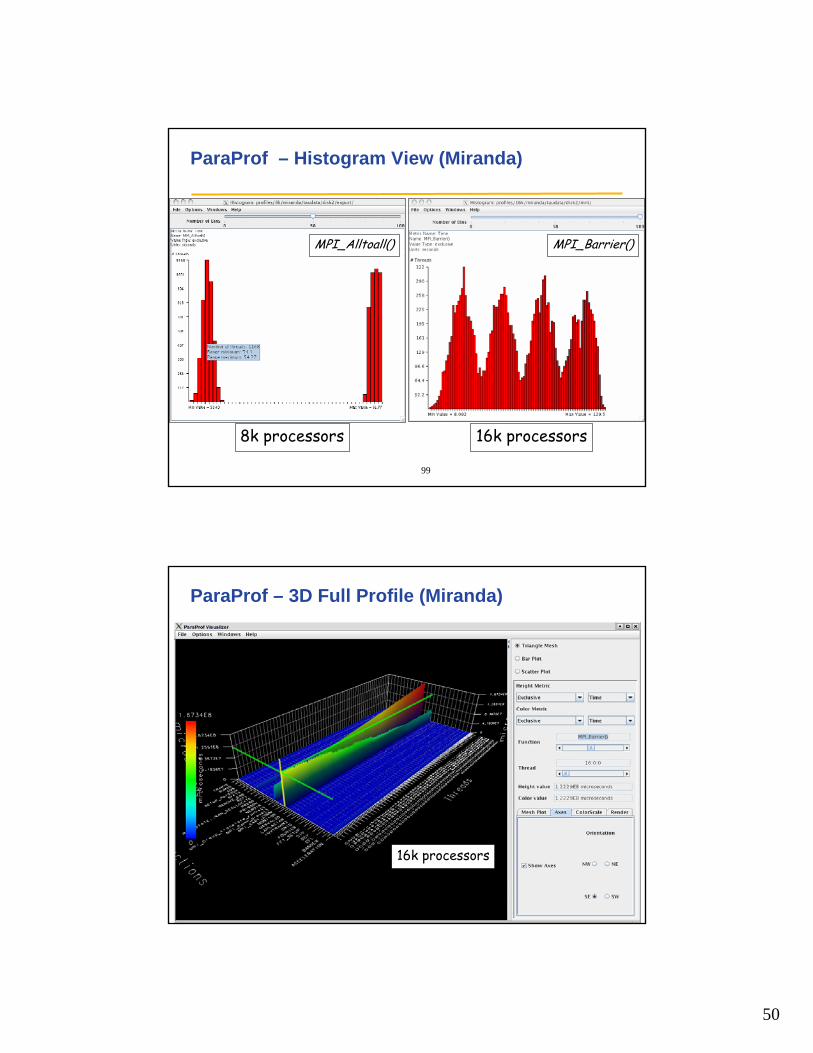
ParaProf – Flat Profile (Miranda)
8K processors!node, context, thread
MirandahydrodynamicsFortran + MPILLNL
50
99
ParaProf – Histogram View (Miranda)
8k processors 16k processors
MPI_Alltoall() MPI_Barrier()
100
ParaProf – 3D Full Profile (Miranda)
16k processors
51
101
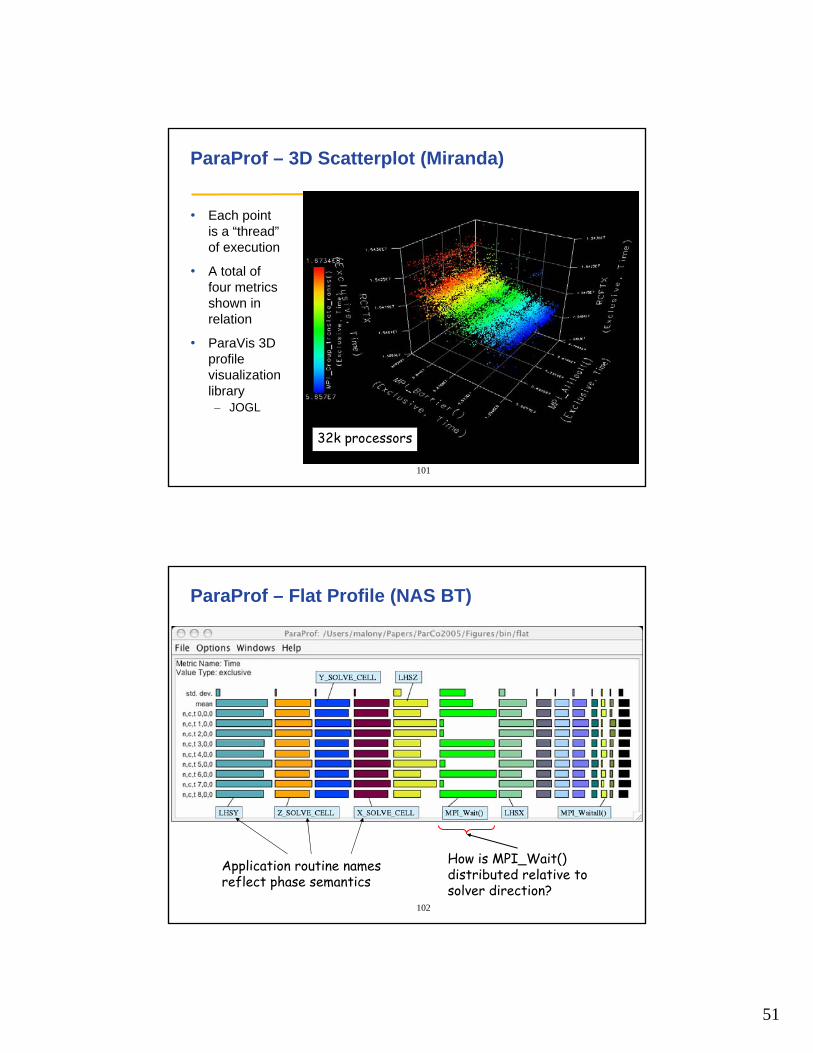
ParaProf – 3D Scatterplot (Miranda)
• Each pointis a “thread”of execution
• A total offour metricsshown inrelation
• ParaVis 3Dprofilevisualizationlibrary– JOGL
32k processors
102
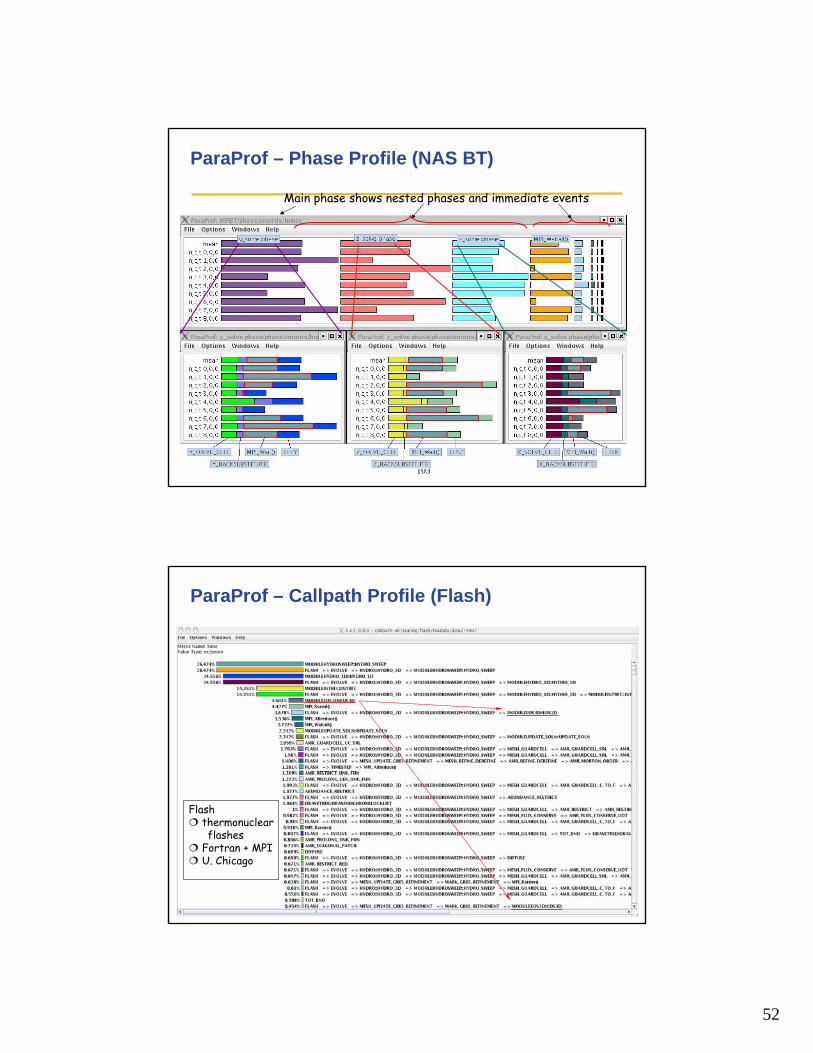
ParaProf – Flat Profile (NAS BT)
How is MPI_Wait()distributed relative tosolver direction?
Application routine namesreflect phase semantics
52
103
ParaProf – Phase Profile (NAS BT)
Main phase shows nested phases and immediate events
104
ParaProf – Callpath Profile (Flash)
Flashthermonuclearflashes
Fortran + MPIU. Chicago
53
105
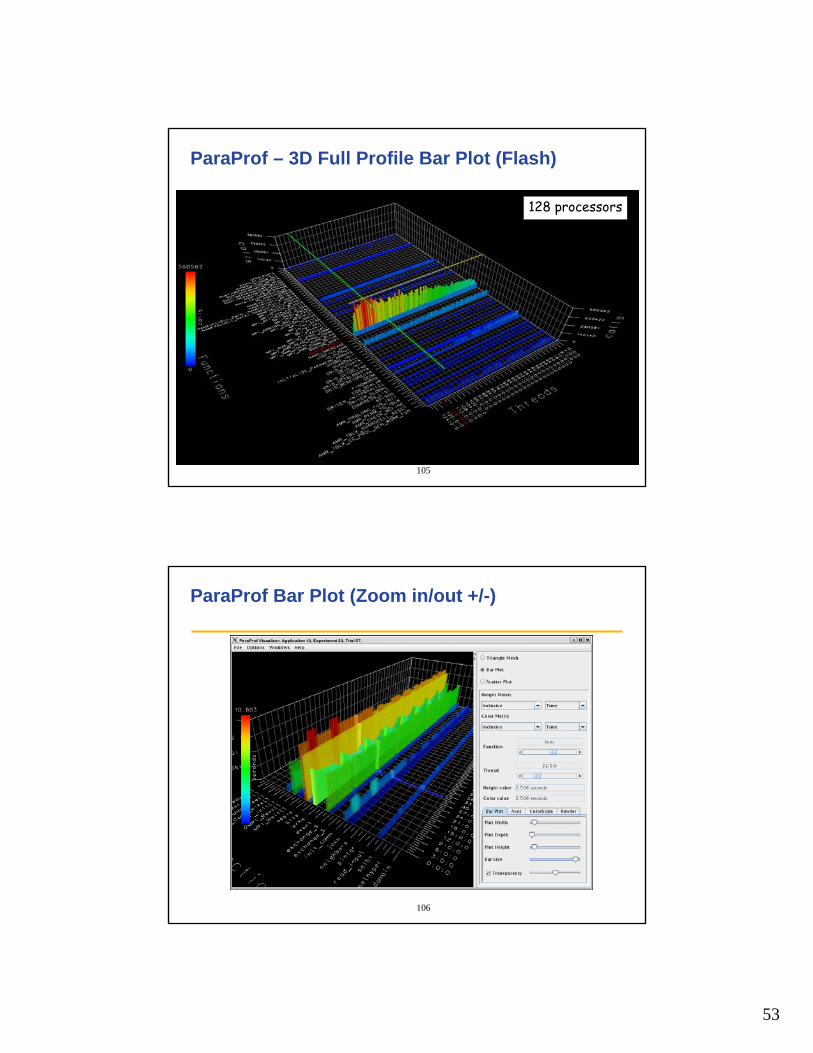
ParaProf – 3D Full Profile Bar Plot (Flash)
128 processors
106
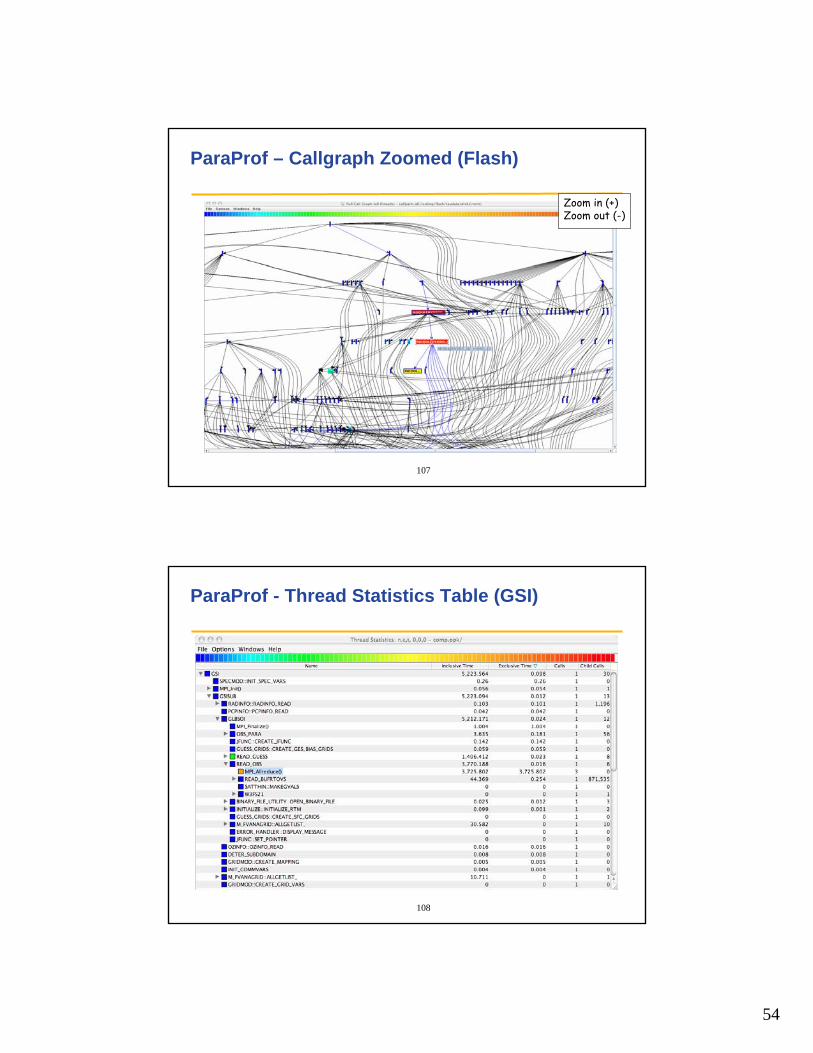
ParaProf Bar Plot (Zoom in/out +/-)
54
107
ParaProf – Callgraph Zoomed (Flash)
Zoom in (+)Zoom out (-)
108
ParaProf - Thread Statistics Table (GSI)
55
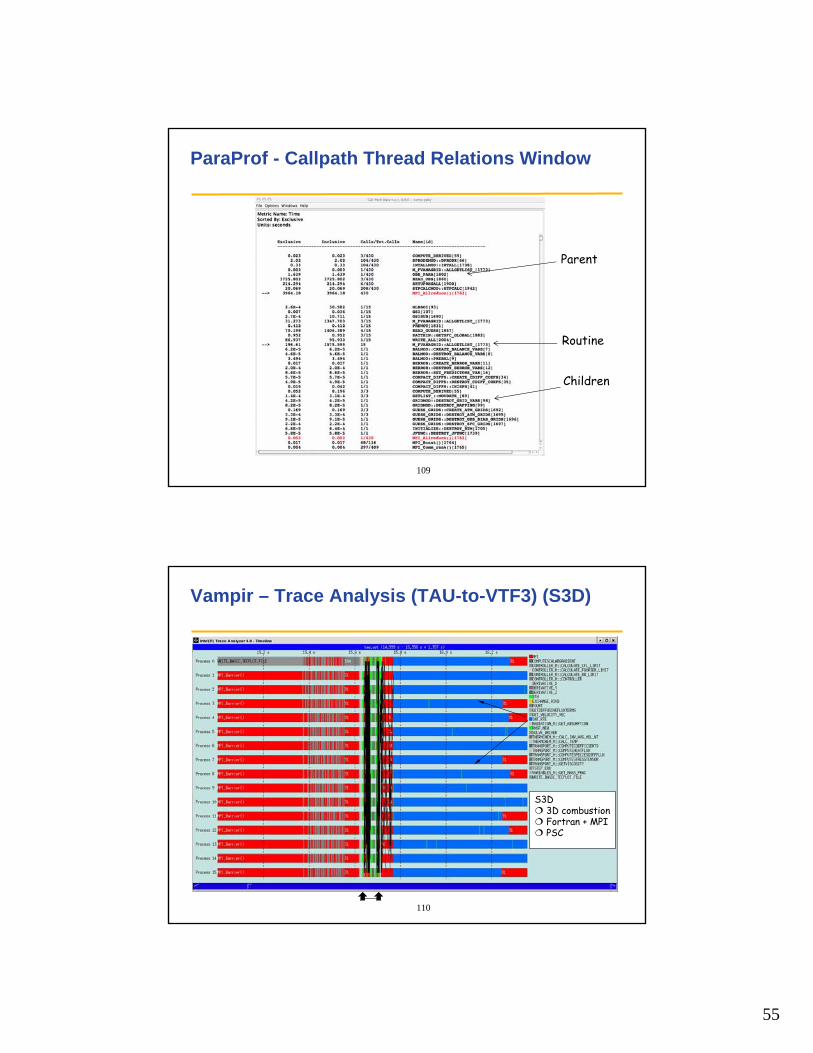
109
ParaProf - Callpath Thread Relations Window
Parent
Routine
Children
110
Vampir – Trace Analysis (TAU-to-VTF3) (S3D)
S3D3D combustionFortran + MPIPSC
56
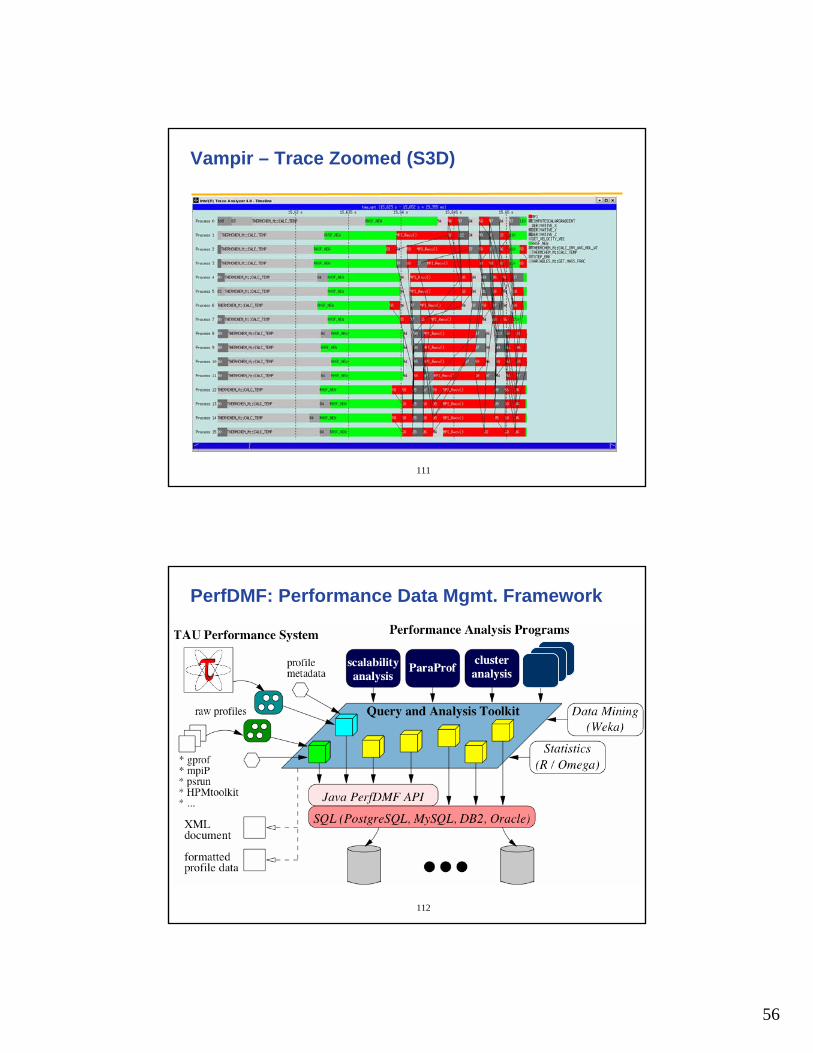
111
Vampir – Trace Zoomed (S3D)
112
PerfDMF: Performance Data Mgmt. Framework
57
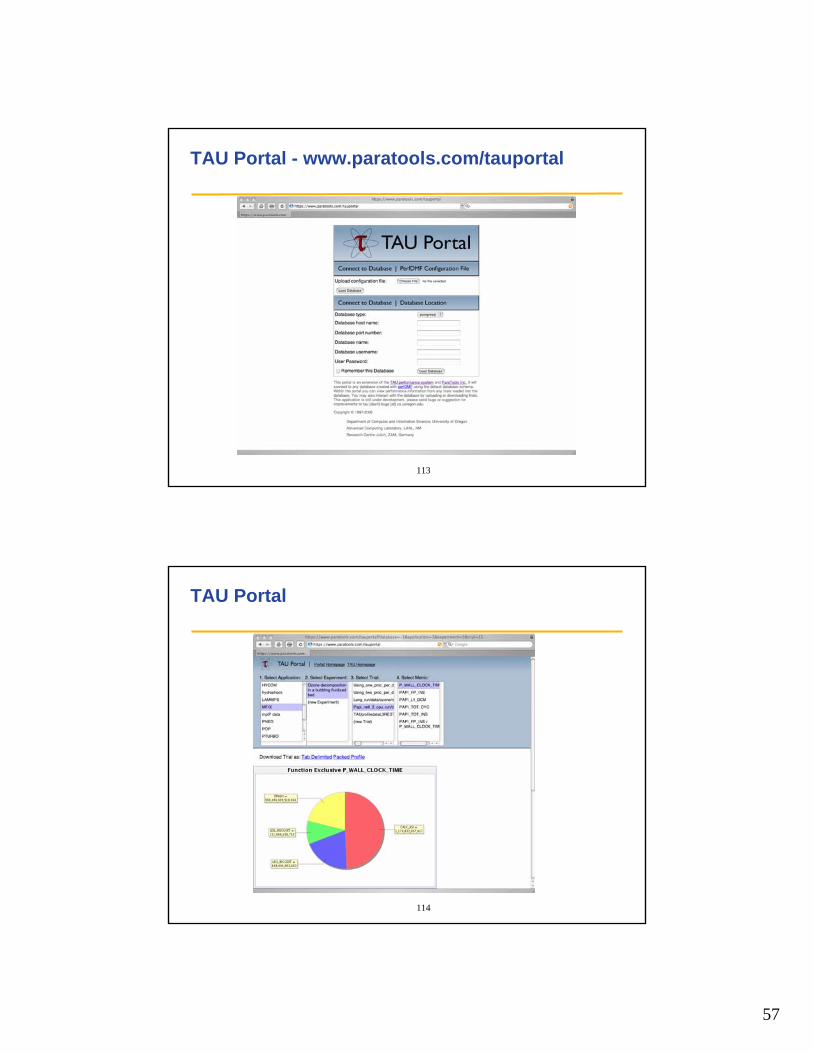
113
TAU Portal - www.paratools.com/tauportal
114
TAU Portal
58
115
Using Performance Database (PerfDMF)
• Configure PerfDMF (Done by each user)% perfdmf_configure
– Choose derby, PostgreSQL, MySQL, Oracle or DB2 – Hostname– Username– Password– Say yes to downloading required drivers (we are not allowed to distribute
these)– Stores parameters in your ~/.ParaProf/perfdmf.cfg file
• Configure PerfExplorer (Done by each user)% perfexplorer_configure
• Execute PerfExplorer% perfexplorer
116
Performance Data Mining (Objectives)
• Conduct parallel performance analysis process– In a systematic, collaborative and reusable manner– Manage performance complexity– Discover performance relationship and properties– Automate process
• Multi-experiment performance analysis
• Large-scale performance data reduction– Summarize characteristics of large processor runs
• Implement extensible analysis framework– Abstraction / automation of data mining operations– Interface to existing analysis and data mining tools
59
117
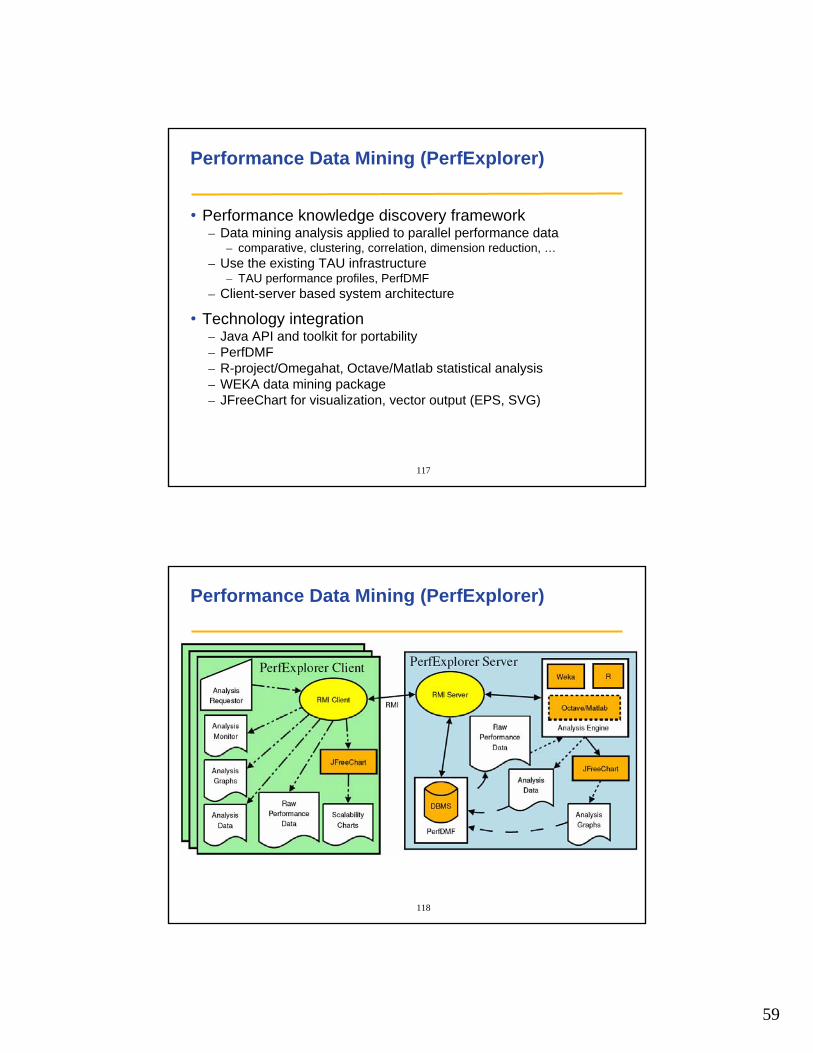
Performance Data Mining (PerfExplorer)
• Performance knowledge discovery framework– Data mining analysis applied to parallel performance data
– comparative, clustering, correlation, dimension reduction, …– Use the existing TAU infrastructure
– TAU performance profiles, PerfDMF– Client-server based system architecture
• Technology integration– Java API and toolkit for portability– PerfDMF– R-project/Omegahat, Octave/Matlab statistical analysis– WEKA data mining package– JFreeChart for visualization, vector output (EPS, SVG)
118
Performance Data Mining (PerfExplorer)
60
119
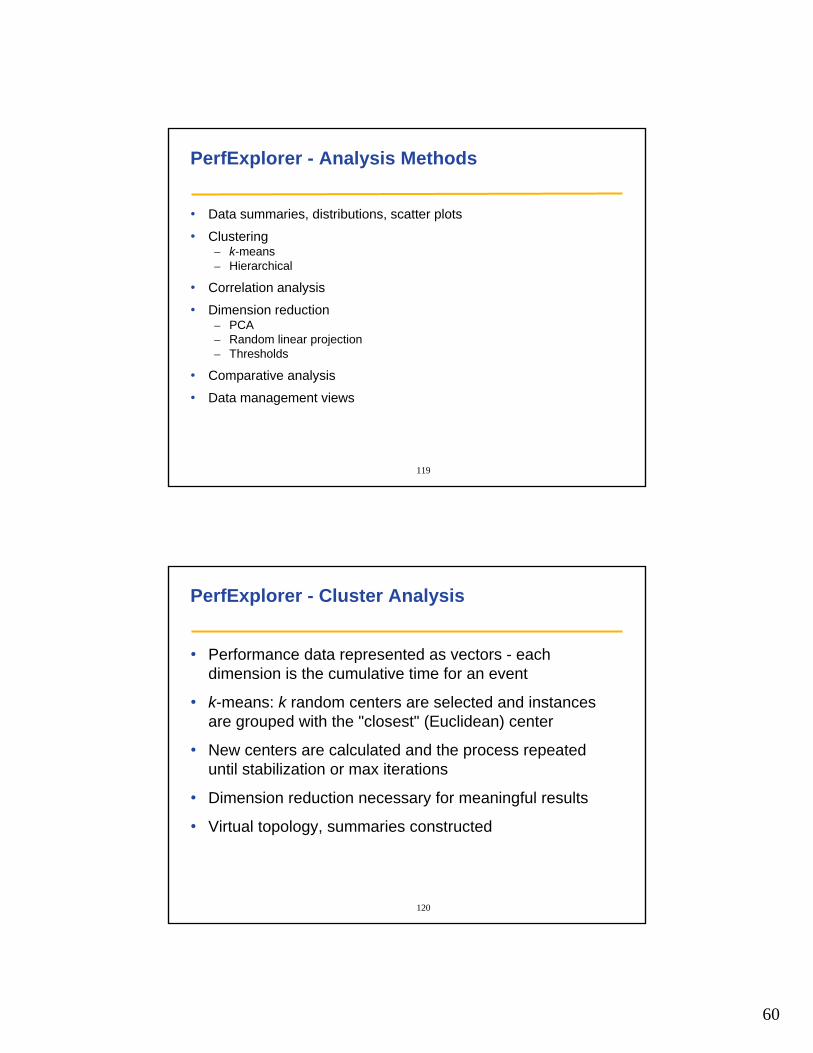
PerfExplorer - Analysis Methods
• Data summaries, distributions, scatter plots
• Clustering– k-means– Hierarchical
• Correlation analysis
• Dimension reduction– PCA– Random linear projection– Thresholds
• Comparative analysis
• Data management views
120
PerfExplorer - Cluster Analysis
• Performance data represented as vectors - each dimension is the cumulative time for an event
• k-means: k random centers are selected and instances are grouped with the "closest" (Euclidean) center
• New centers are calculated and the process repeated until stabilization or max iterations
• Dimension reduction necessary for meaningful results
• Virtual topology, summaries constructed
61
121
PerfExplorer - Cluster Analysis (sPPM)
122
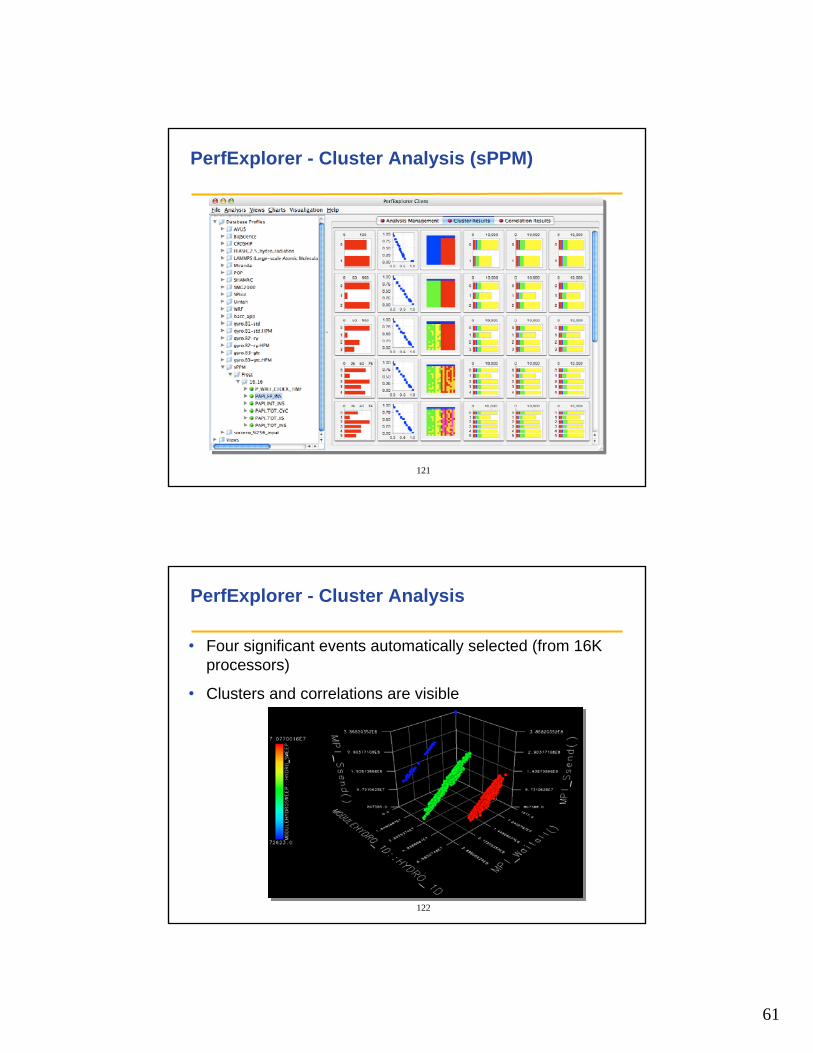
PerfExplorer - Cluster Analysis
• Four significant events automatically selected (from 16K processors)
• Clusters and correlations are visible
62
123
PerfExplorer - Correlation Analysis (Flash)
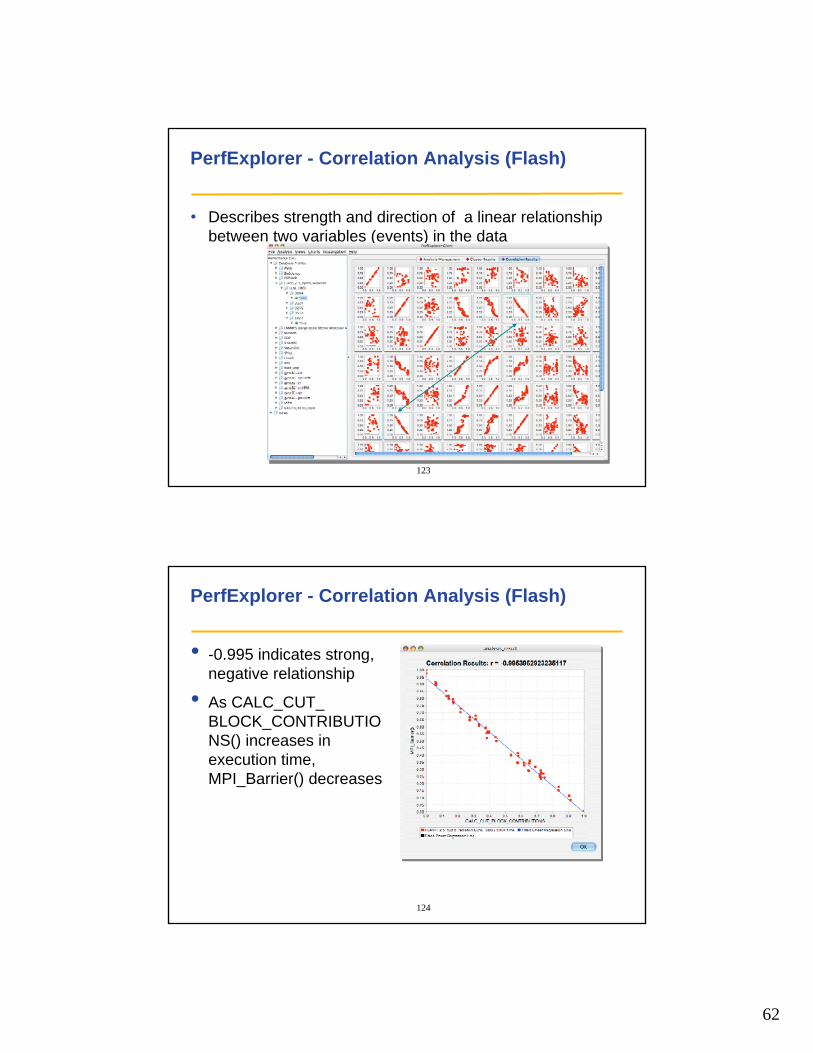
• Describes strength and direction of a linear relationship between two variables (events) in the data
124
PerfExplorer - Correlation Analysis (Flash)
• -0.995 indicates strong, negative relationship
• As CALC_CUT_BLOCK_CONTRIBUTIONS() increases in execution time, MPI_Barrier() decreases
63
125
PerfExplorer - Comparative Analysis
• Relative speedup, efficiency– total runtime, by event, one event, by phase
• Breakdown of total runtime
• Group fraction of total runtime
• Correlating events to total runtime
• Timesteps per second
• Performance Evaluation Research Center (PERC)– PERC tools study (led by ORNL, Pat Worley)– In-depth performance analysis of select applications– Evaluation performance analysis requirements– Test tool functionality and ease of use
126
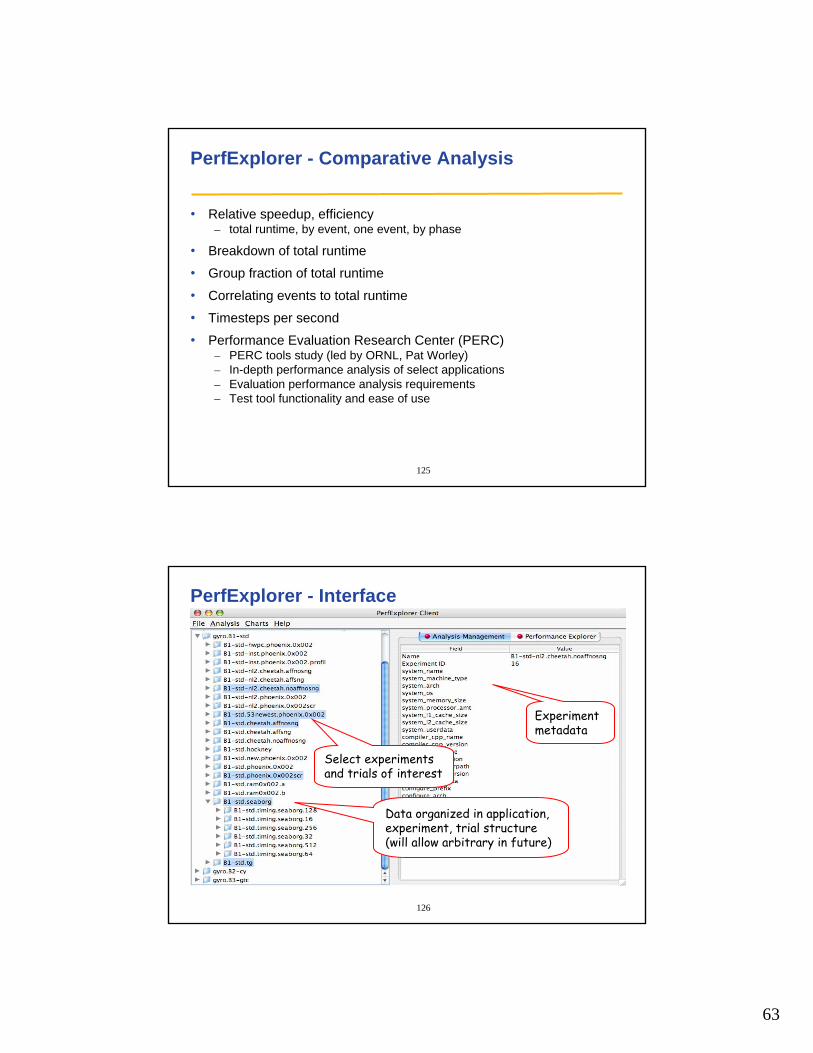
PerfExplorer - Interface
Select experiments and trials of interest
Data organized in application, experiment, trial structure(will allow arbitrary in future)
Experimentmetadata
64
127
PerfExplorer - Interface
Select analysis
128
B3-gtc
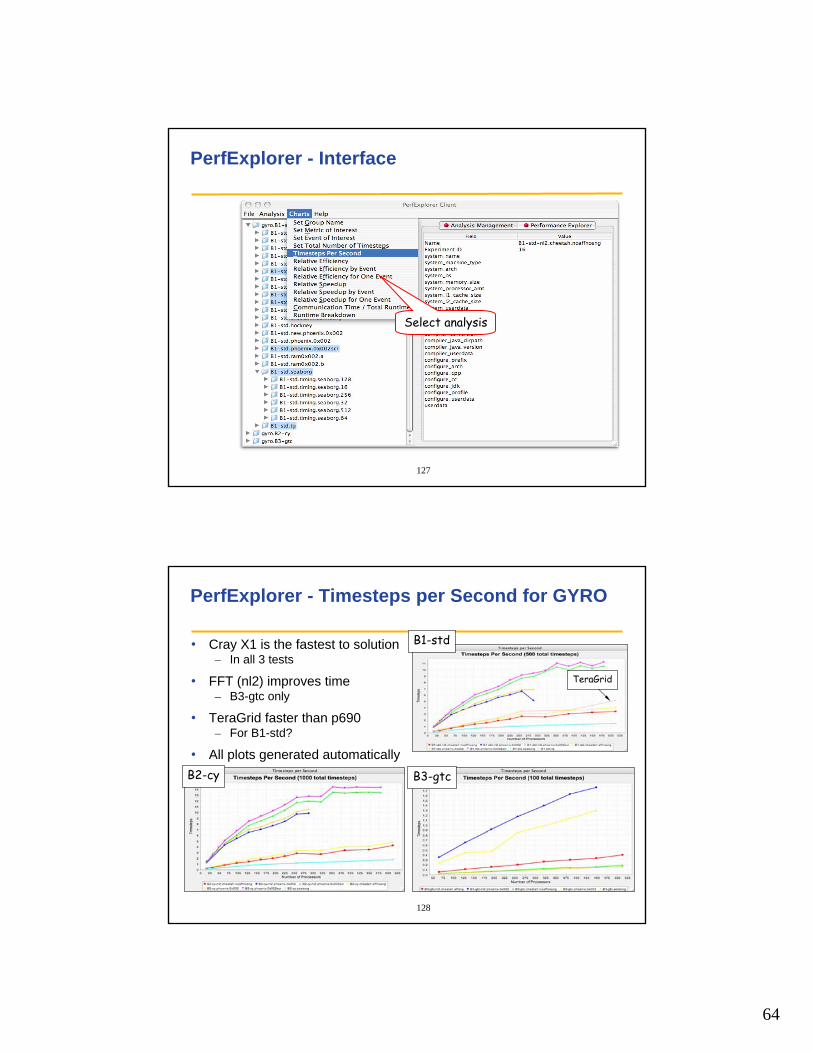
PerfExplorer - Timesteps per Second for GYRO
• Cray X1 is the fastest to solution– In all 3 tests
• FFT (nl2) improves time– B3-gtc only
• TeraGrid faster than p690– For B1-std?
• All plots generated automatically
B1-std
B2-cy B3-gtc
TeraGrid
65
129
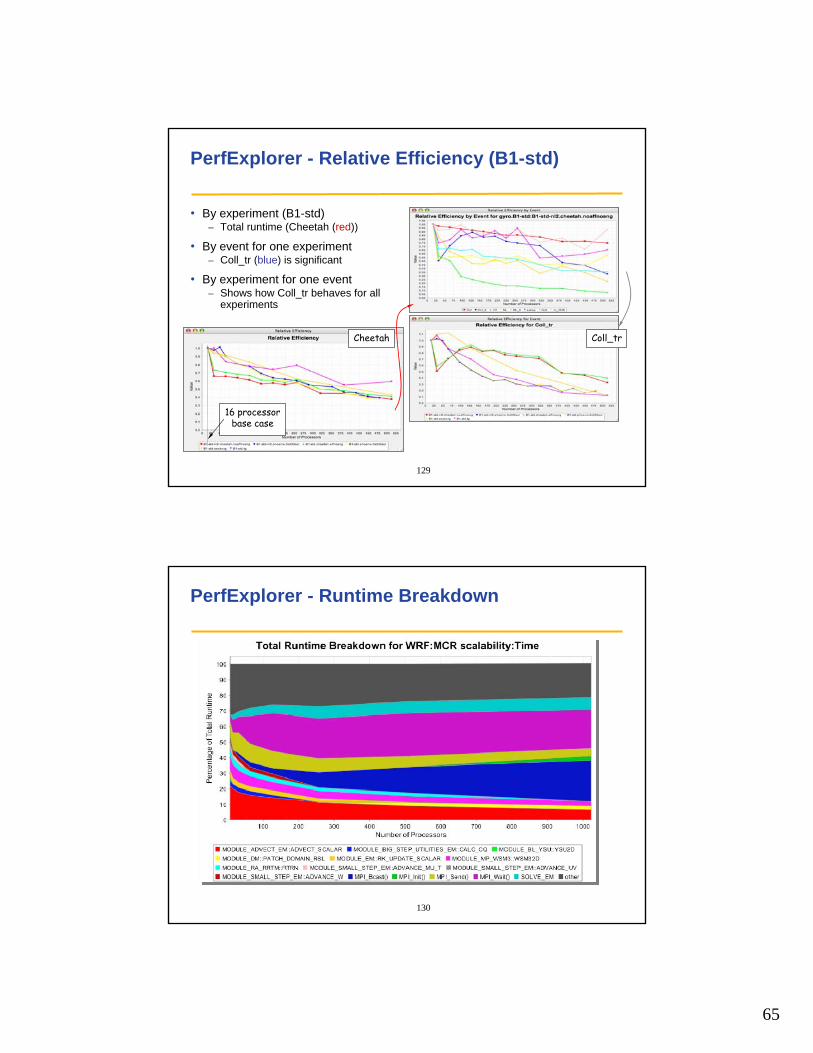
PerfExplorer - Relative Efficiency (B1-std)
• By experiment (B1-std)– Total runtime (Cheetah (red))
• By event for one experiment– Coll_tr (blue) is significant
• By experiment for one event– Shows how Coll_tr behaves for all
experiments
16 processorbase case
Cheetah Coll_tr
130
PerfExplorer - Runtime Breakdown
66
131
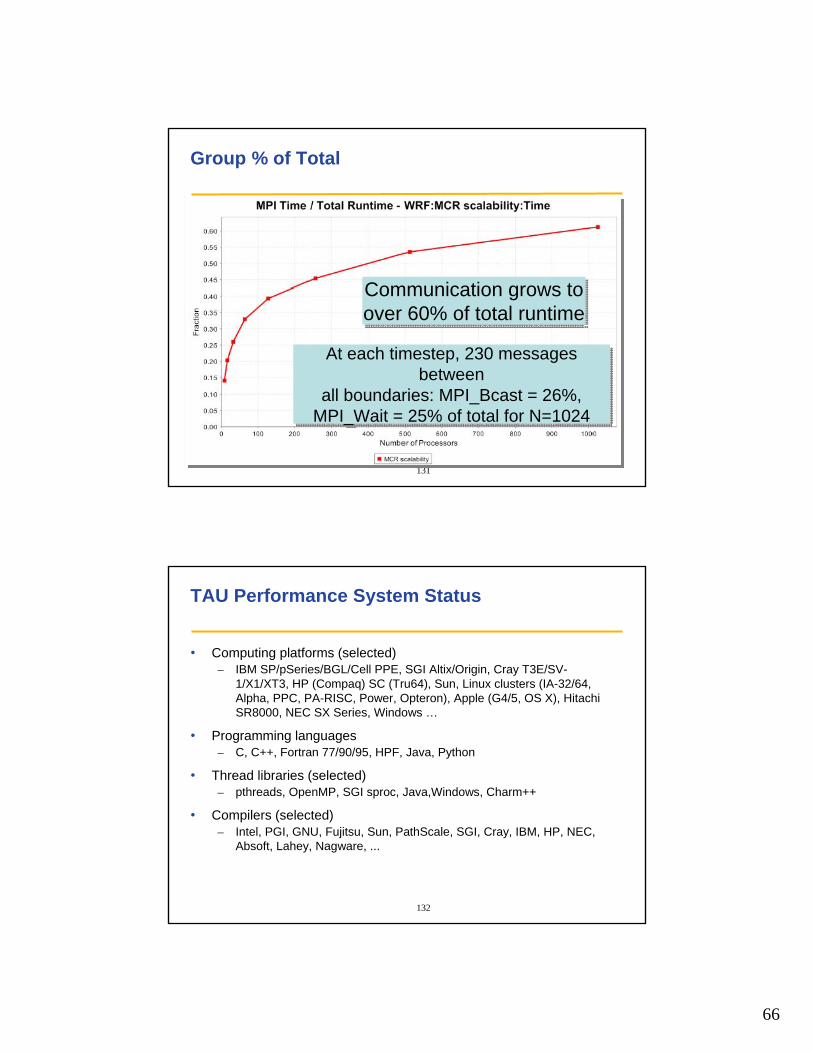
Group % of Total
Communication grows toover 60% of total runtimeCommunication grows toover 60% of total runtime
At each timestep, 230 messages between
all boundaries: MPI_Bcast = 26%,MPI_Wait = 25% of total for N=1024
At each timestep, 230 messages between
all boundaries: MPI_Bcast = 26%,MPI_Wait = 25% of total for N=1024
132
TAU Performance System Status
• Computing platforms (selected)– IBM SP/pSeries/BGL/Cell PPE, SGI Altix/Origin, Cray T3E/SV-
1/X1/XT3, HP (Compaq) SC (Tru64), Sun, Linux clusters (IA-32/64, Alpha, PPC, PA-RISC, Power, Opteron), Apple (G4/5, OS X), Hitachi SR8000, NEC SX Series, Windows …
• Programming languages– C, C++, Fortran 77/90/95, HPF, Java, Python
• Thread libraries (selected)– pthreads, OpenMP, SGI sproc, Java,Windows, Charm++
• Compilers (selected)– Intel, PGI, GNU, Fujitsu, Sun, PathScale, SGI, Cray, IBM, HP, NEC,
Absoft, Lahey, Nagware, ...
67
133
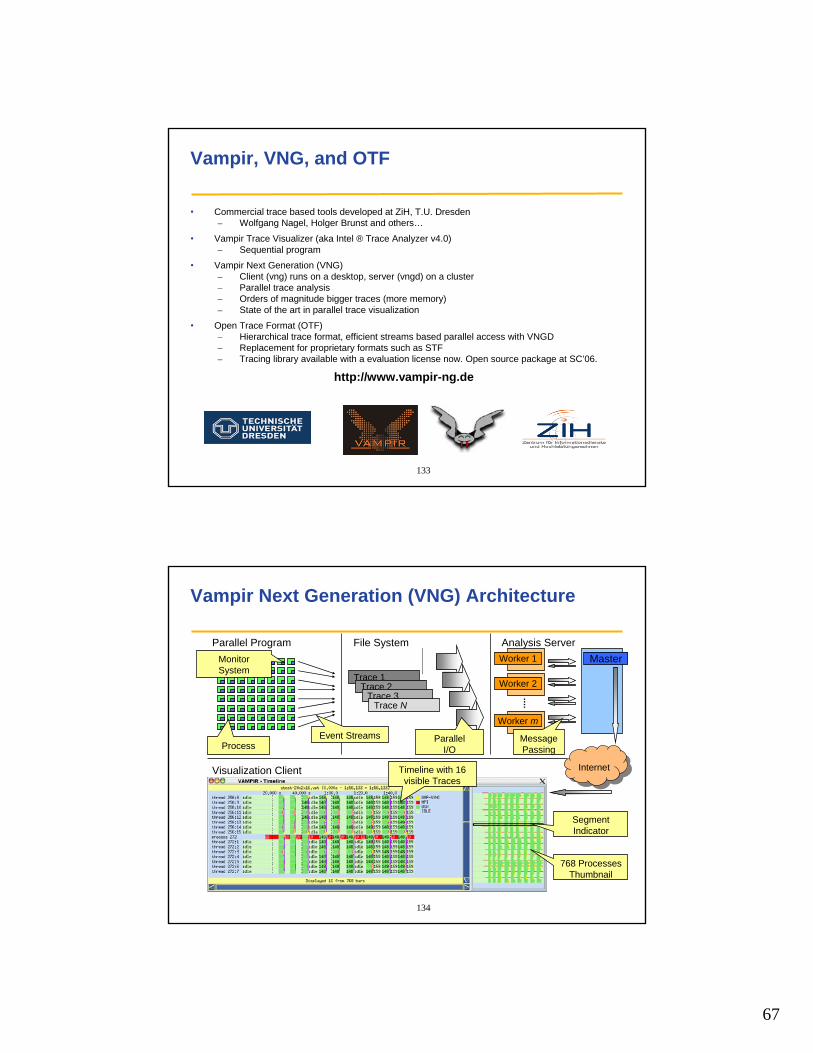
Vampir, VNG, and OTF
• Commercial trace based tools developed at ZiH, T.U. Dresden– Wolfgang Nagel, Holger Brunst and others…
• Vampir Trace Visualizer (aka Intel ® Trace Analyzer v4.0)– Sequential program
• Vampir Next Generation (VNG)– Client (vng) runs on a desktop, server (vngd) on a cluster– Parallel trace analysis– Orders of magnitude bigger traces (more memory)– State of the art in parallel trace visualization
• Open Trace Format (OTF)– Hierarchical trace format, efficient streams based parallel access with VNGD– Replacement for proprietary formats such as STF– Tracing library available with a evaluation license now. Open source package at SC’06.
http://www.vampir-ng.de
134
Vampir Next Generation (VNG) Architecture
MergedTraces
Analysis Server
Classic Analysis:
monolithic
sequential
Worker 1
Worker 2
Worker m
Master
Trace 1Trace 2
Trace 3Trace N
File System
InternetInternet
Parallel ProgramMonitor System
Event Streams
Visualization Client
Segment Indicator
768 Processes Thumbnail
Timeline with 16 visible Traces
ProcessParallel
I/OMessage Passing
68
135
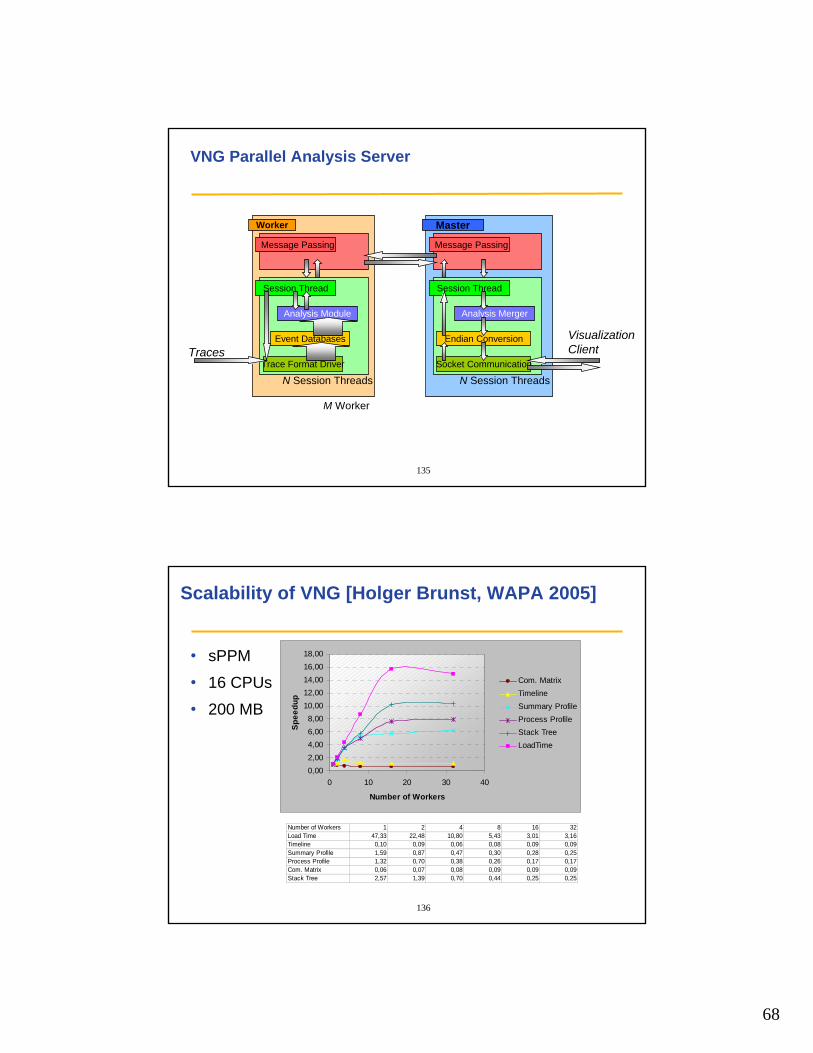
VNG Parallel Analysis Server
Worker 1
Worker 2
Worker m
Master
Worker
Session Thread
Analysis Module
Event Databases
Message Passing
Trace Format Driver
Master
Session Thread
Analysis Merger
Endian Conversion
Message Passing
Socket Communication
VisualizationClient
M Worker
N Session Threads N Session Threads
Traces
136
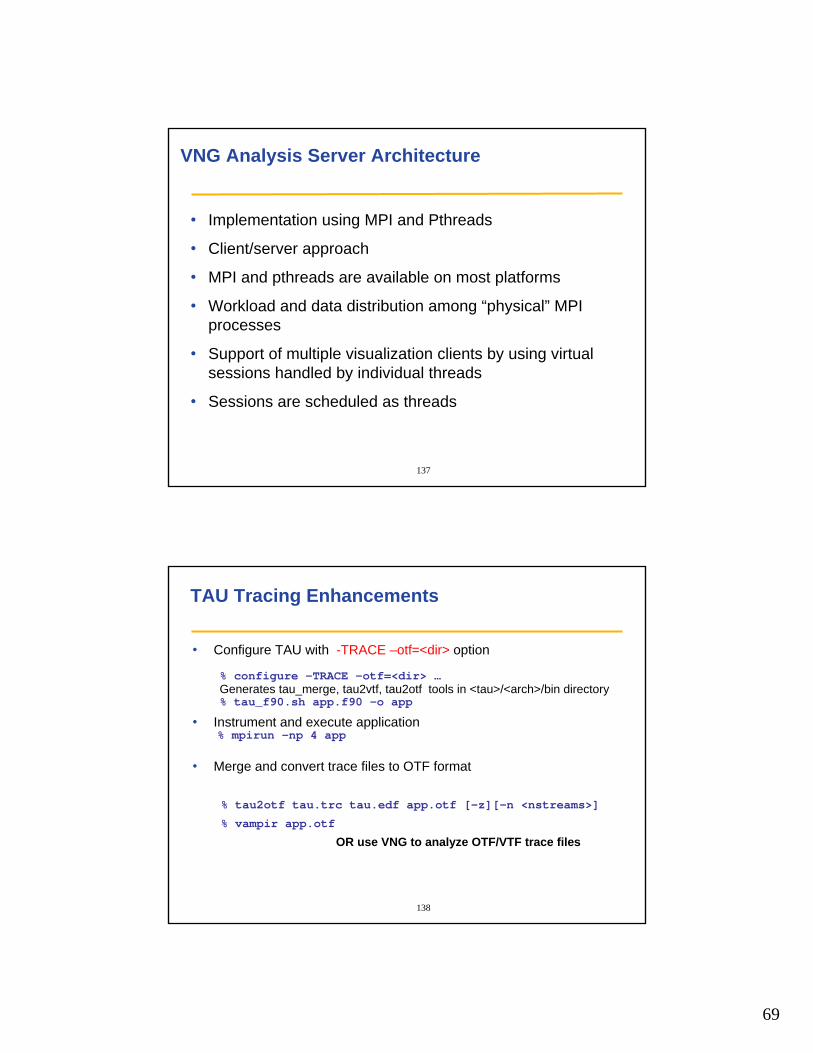
Scalability of VNG [Holger Brunst, WAPA 2005]
• sPPM
• 16 CPUs
• 200 MB
0,002,004,006,008,00
10,0012,0014,0016,0018,00
0 10 20 30 40
Number of Workers
Spee
dup
Com. MatrixTimelineSummary ProfileProcess ProfileStack TreeLoadTime
Number of Workers 1 2 4 8 16 32Load Time 47,33 22,48 10,80 5,43 3,01 3,16Timeline 0,10 0,09 0,06 0,08 0,09 0,09Summary Profile 1,59 0,87 0,47 0,30 0,28 0,25Process Profile 1,32 0,70 0,38 0,26 0,17 0,17Com. Matrix 0,06 0,07 0,08 0,09 0,09 0,09Stack Tree 2,57 1,39 0,70 0,44 0,25 0,25
69
137
VNG Analysis Server Architecture
• Implementation using MPI and Pthreads
• Client/server approach
• MPI and pthreads are available on most platforms
• Workload and data distribution among “physical” MPI processes
• Support of multiple visualization clients by using virtual sessions handled by individual threads
• Sessions are scheduled as threads
138
TAU Tracing Enhancements
• Configure TAU with -TRACE –otf=<dir> option
% configure –TRACE –otf=<dir> …Generates tau_merge, tau2vtf, tau2otf tools in <tau>/<arch>/bin directory% tau_f90.sh app.f90 –o app
• Instrument and execute application % mpirun -np 4 app
• Merge and convert trace files to OTF format
% tau2otf tau.trc tau.edf app.otf [-z][–n <nstreams>]
% vampir app.otf
OR use VNG to analyze OTF/VTF trace files
70
139
Environment Variables
• Configure TAU with -TRACE –otf=<dir> option% configure –TRACE –otf=<dir>
-MULTIPLECOUNTERS –papi=<dir> -mpi –pdt=dir …
• Set environment variables% setenv TRACEDIR /p/gm1/<login>/traces% setenv COUNTER1 GET_TIME_OF_DAY (reqd)% setenv COUNTER2 PAPI_FP_INS% setenv COUNTER3 PAPI_TOT_CYC …
• Execute application% mpirun -np 32 ./a.out [args]
% tau_treemerge.pl; tau2otf/tau2vtf ...
140
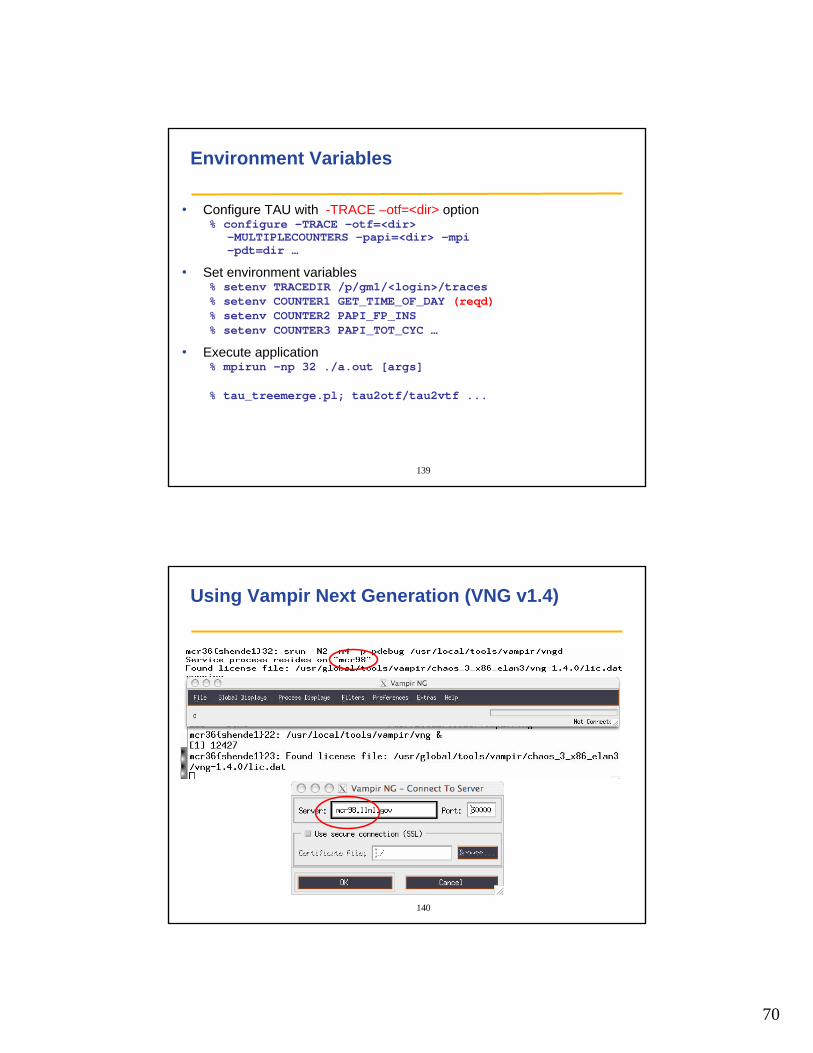
Using Vampir Next Generation (VNG v1.4)
71
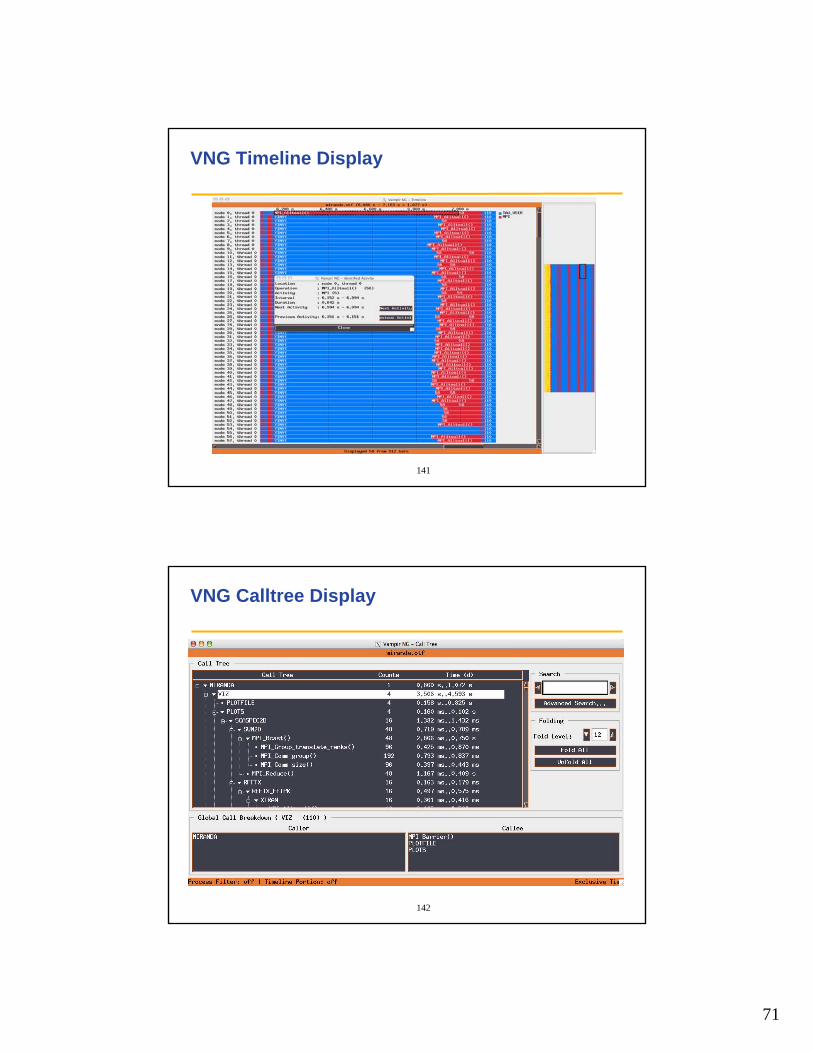
141
VNG Timeline Display
142
VNG Calltree Display
72
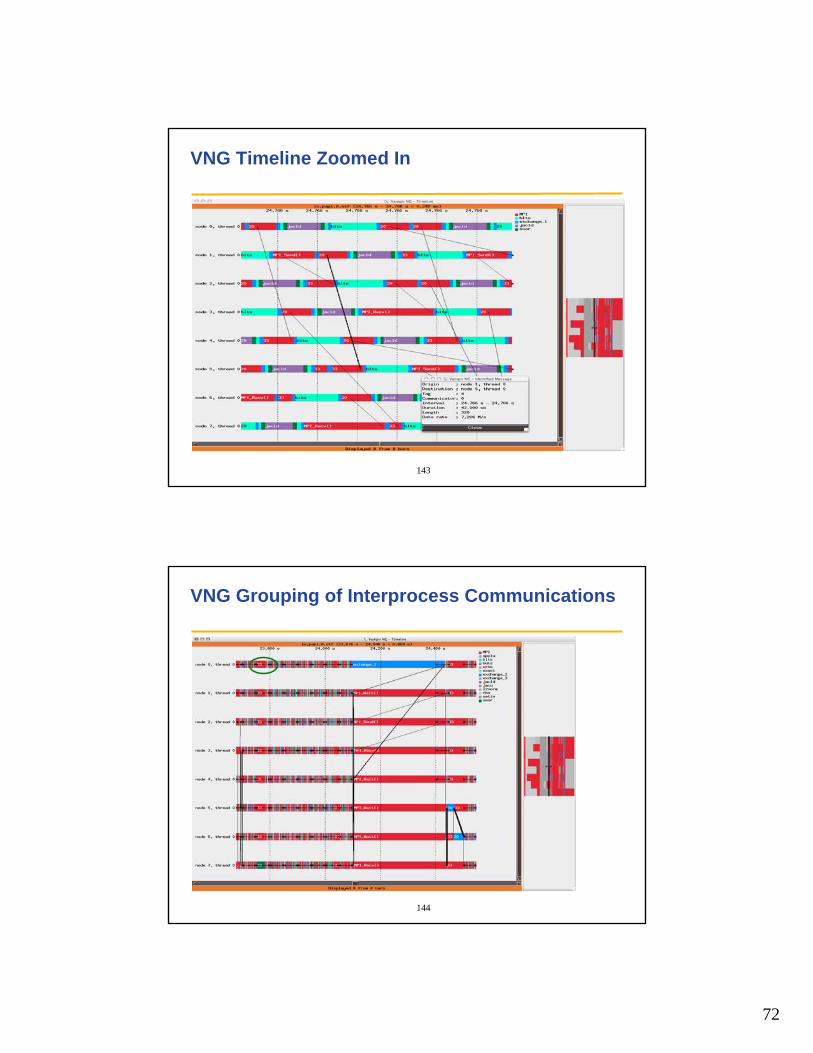
143
VNG Timeline Zoomed In
144
VNG Grouping of Interprocess Communications
73
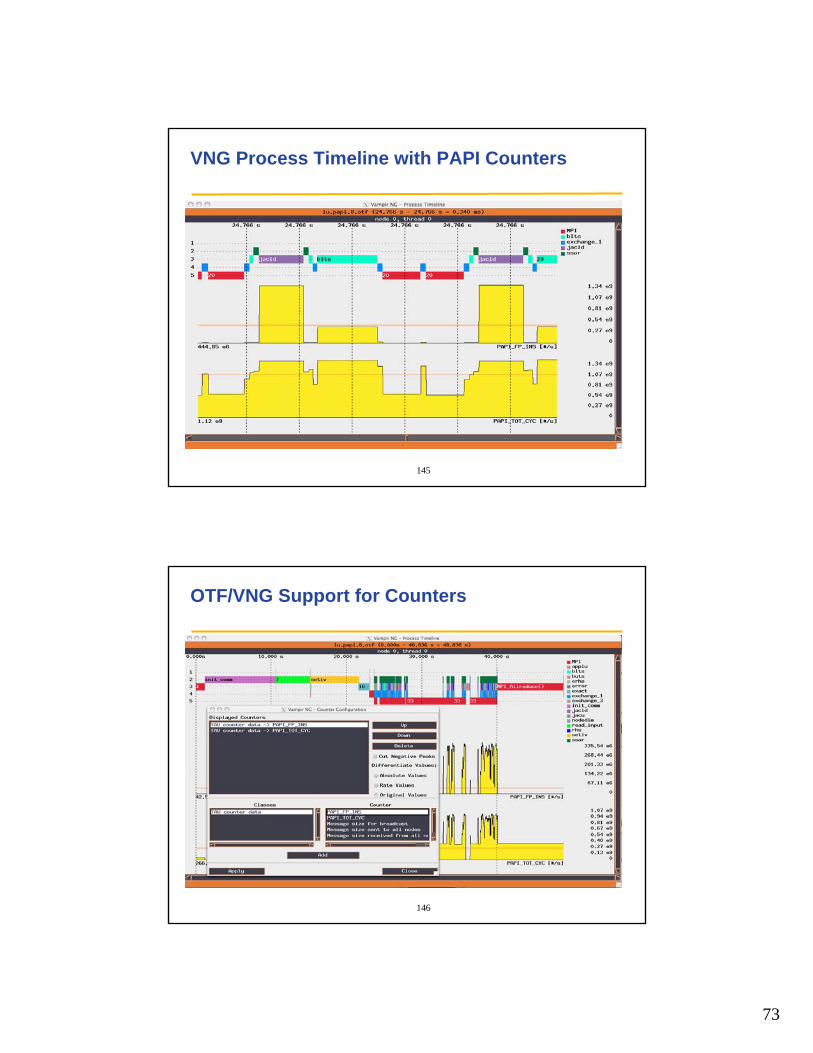
145
VNG Process Timeline with PAPI Counters
146
OTF/VNG Support for Counters
74
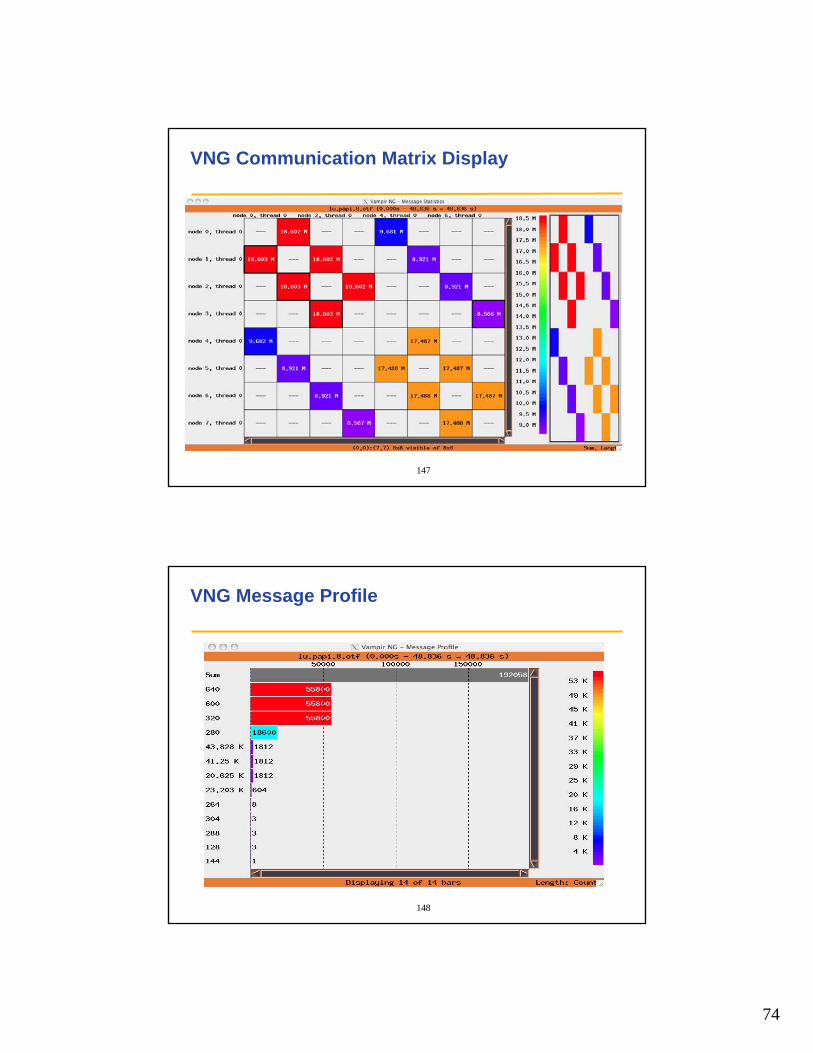
147
VNG Communication Matrix Display
148
VNG Message Profile
75
149
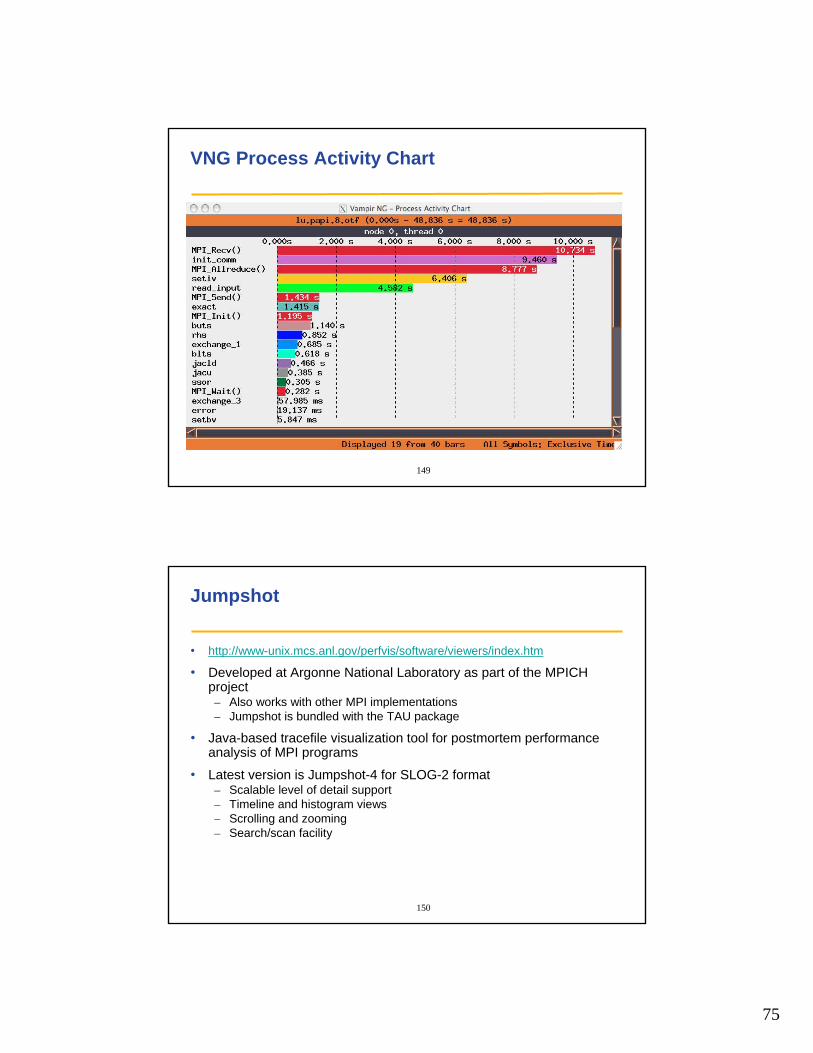
VNG Process Activity Chart
150
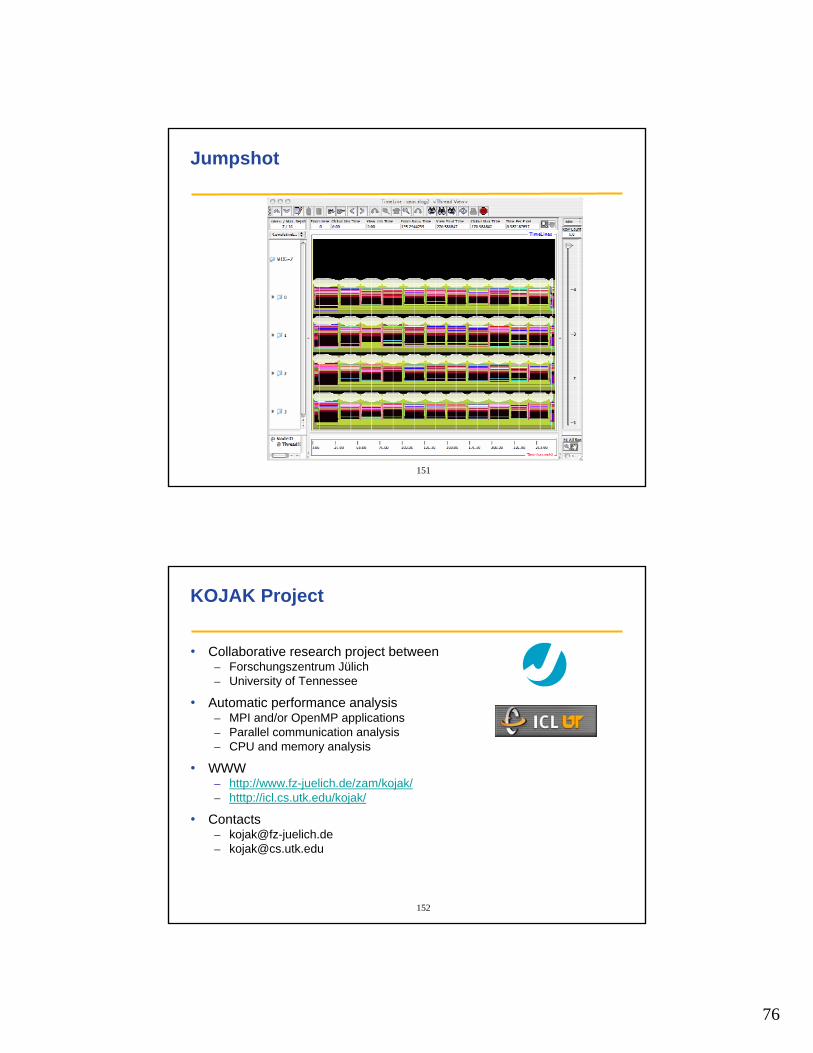
Jumpshot
• http://www-unix.mcs.anl.gov/perfvis/software/viewers/index.htm
• Developed at Argonne National Laboratory as part of the MPICH project– Also works with other MPI implementations– Jumpshot is bundled with the TAU package
• Java-based tracefile visualization tool for postmortem performance analysis of MPI programs
• Latest version is Jumpshot-4 for SLOG-2 format– Scalable level of detail support– Timeline and histogram views– Scrolling and zooming– Search/scan facility
76
151
Jumpshot
152
KOJAK Project
• Collaborative research project between – Forschungszentrum Jülich– University of Tennessee
• Automatic performance analysis – MPI and/or OpenMP applications– Parallel communication analysis– CPU and memory analysis
• WWW– http://www.fz-juelich.de/zam/kojak/– htttp://icl.cs.utk.edu/kojak/
• Contacts– [email protected]– [email protected]
77
153
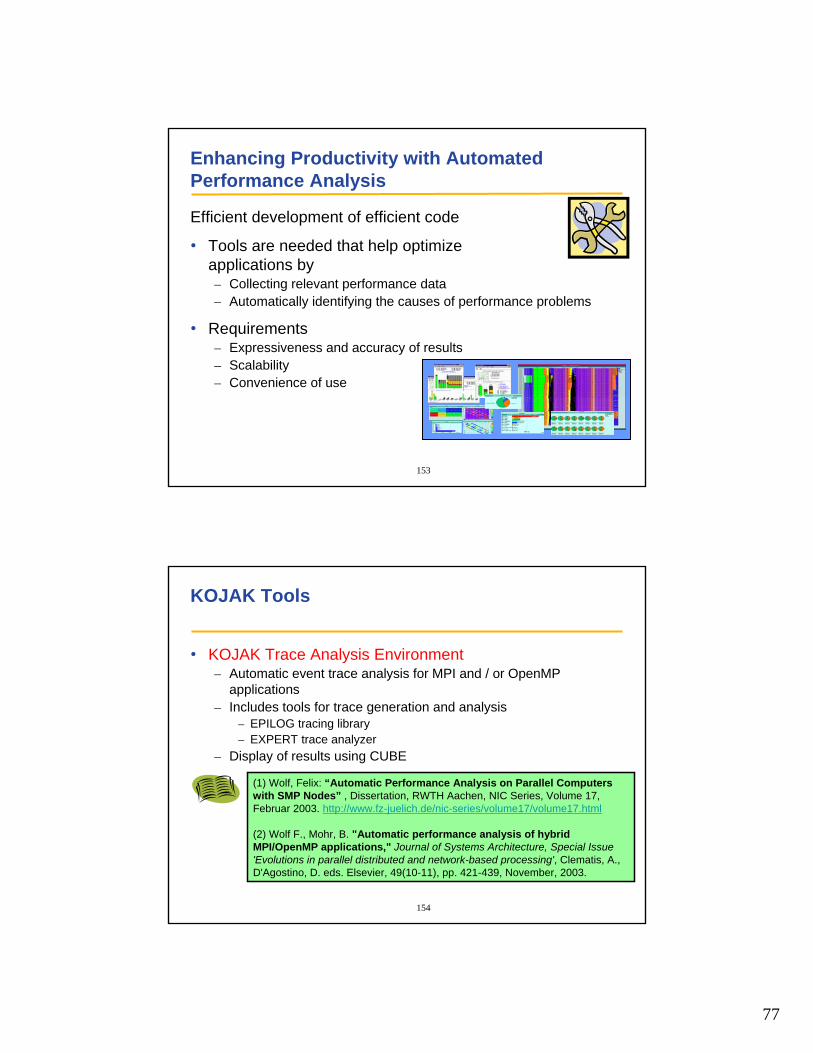
Enhancing Productivity with Automated Performance Analysis
Efficient development of efficient code
• Tools are needed that help optimize applications by– Collecting relevant performance data – Automatically identifying the causes of performance problems
• Requirements– Expressiveness and accuracy of results– Scalability – Convenience of use
154
KOJAK Tools
• KOJAK Trace Analysis Environment– Automatic event trace analysis for MPI and / or OpenMP
applications– Includes tools for trace generation and analysis
– EPILOG tracing library– EXPERT trace analyzer
– Display of results using CUBE
(1) Wolf, Felix: “Automatic Performance Analysis on Parallel Computers with SMP Nodes” , Dissertation, RWTH Aachen, NIC Series, Volume 17, Februar 2003. http://www.fz-juelich.de/nic-series/volume17/volume17.html
(2) Wolf F., Mohr, B. "Automatic performance analysis of hybrid MPI/OpenMP applications," Journal of Systems Architecture, Special Issue 'Evolutions in parallel distributed and network-based processing', Clematis, A.,D'Agostino, D. eds. Elsevier, 49(10-11), pp. 421-439, November, 2003.
78
155
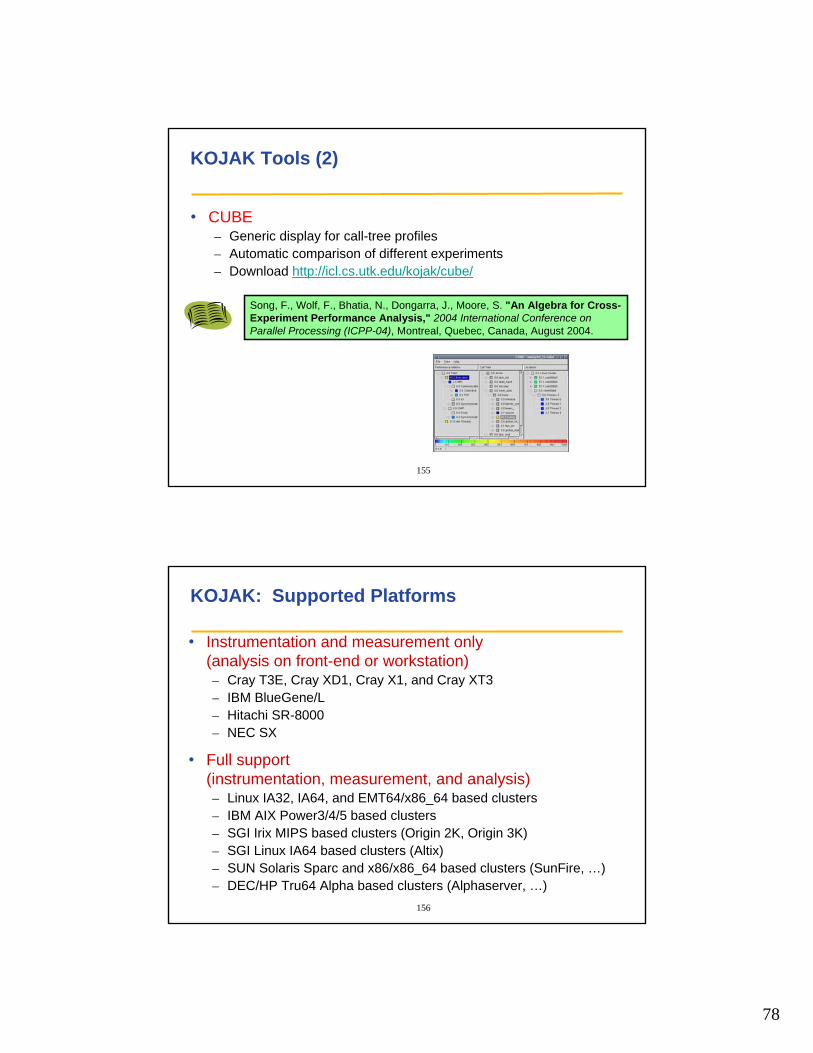
KOJAK Tools (2)
• CUBE– Generic display for call-tree profiles– Automatic comparison of different experiments– Download http://icl.cs.utk.edu/kojak/cube/
Song, F., Wolf, F., Bhatia, N., Dongarra, J., Moore, S. "An Algebra for Cross-Experiment Performance Analysis," 2004 International Conference on Parallel Processing (ICPP-04), Montreal, Quebec, Canada, August 2004.
156
KOJAK: Supported Platforms
• Instrumentation and measurement only(analysis on front-end or workstation)– Cray T3E, Cray XD1, Cray X1, and Cray XT3– IBM BlueGene/L– Hitachi SR-8000– NEC SX
• Full support(instrumentation, measurement, and analysis)– Linux IA32, IA64, and EMT64/x86_64 based clusters – IBM AIX Power3/4/5 based clusters– SGI Irix MIPS based clusters (Origin 2K, Origin 3K)– SGI Linux IA64 based clusters (Altix)– SUN Solaris Sparc and x86/x86_64 based clusters (SunFire, …)– DEC/HP Tru64 Alpha based clusters (Alphaserver, …)
79
157
Installation
• Install wxWidgets http://www.wxwidgets.org
• Install libxml2 http://www.xmlsoft.org
• The following commands should be in your search path– xml2-config– gtk-conifg– wx-config– If you only have xml2-conifg, then the CUBE GUI will not be built
• Download KOJAK from http://www.fz-juelich.de/zam/kojak/– Unpack the distribution and follow the installation instructions in
./INSTALL
• Can also download CUBE 2.2.1 viewer from http://icl.cs.utk.edu/kojak/cube/ and install by itself – If your platform supports only instrumentation and measurement, then
transfer the .cube file to a workstation where CUBE is installed to view it, or use ParaProf to view it.
158
KOJAK Documentation
• Installation– File INSTALL in top-level build directory
• Usage instructions– File USAGE in $(PREFIX)/doc directory
• Complementary documentation– CUBE documentation
– http://icl.cs.utk.edu/kojak/cube/– Specification of EPILOG trace format
– File epilog.ps in $(PREFIX)/epilog/doc/epilog.ps or– http://www.fz-juelich.de/zam/docs/autoren2004/wolf/
80
159
Low-level View of Performance Behavior
160
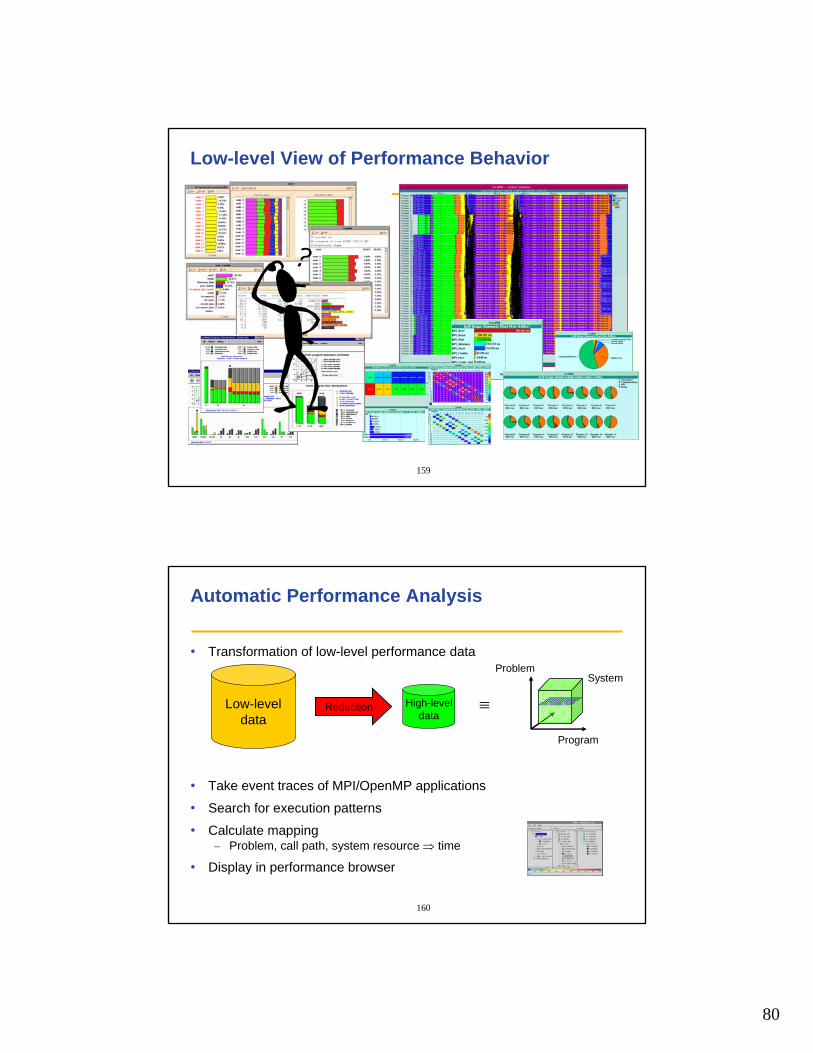
Automatic Performance Analysis
• Transformation of low-level performance data
• Take event traces of MPI/OpenMP applications
• Search for execution patterns
• Calculate mapping– Problem, call path, system resource ⇒ time
• Display in performance browser
Low-leveldata
High-leveldata
Reduction
SystemProblem
Program
≡
81
161
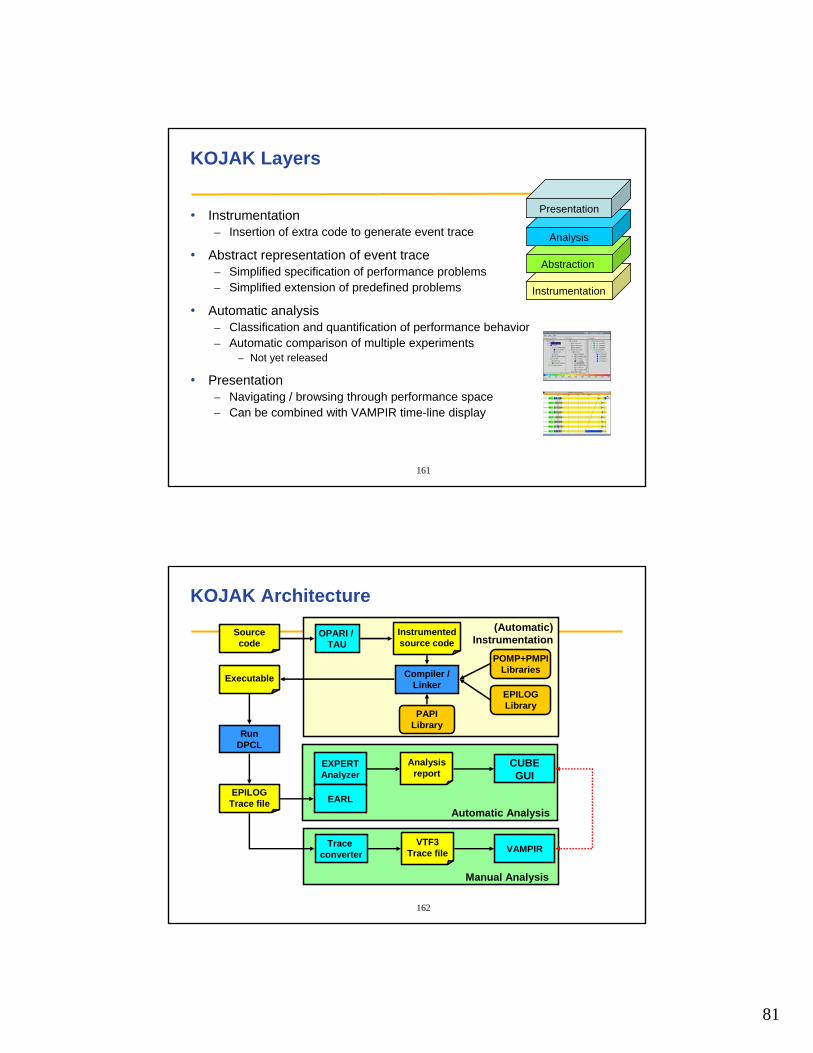
KOJAK Layers
• Instrumentation– Insertion of extra code to generate event trace
• Abstract representation of event trace– Simplified specification of performance problems– Simplified extension of predefined problems
• Automatic analysis– Classification and quantification of performance behavior– Automatic comparison of multiple experiments
– Not yet released
• Presentation– Navigating / browsing through performance space – Can be combined with VAMPIR time-line display
Instrumentation
Abstraction
Analysis
Presentation
162
KOJAK Architecture
RunDPCL
EPILOGTrace file
(Automatic)Instrumentation
POMP+PMPILibraries
PAPILibrary
Compiler /Linker
Automatic Analysis
EXPERTAnalyzer
EARL
Analysisreport
Manual Analysis
VTF3Trace file
OPARI / TAU
Trace converter
CUBEGUI
VAMPIR
Instrumentedsource code
Executable
Sourcecode
EPILOGLibrary
82
163
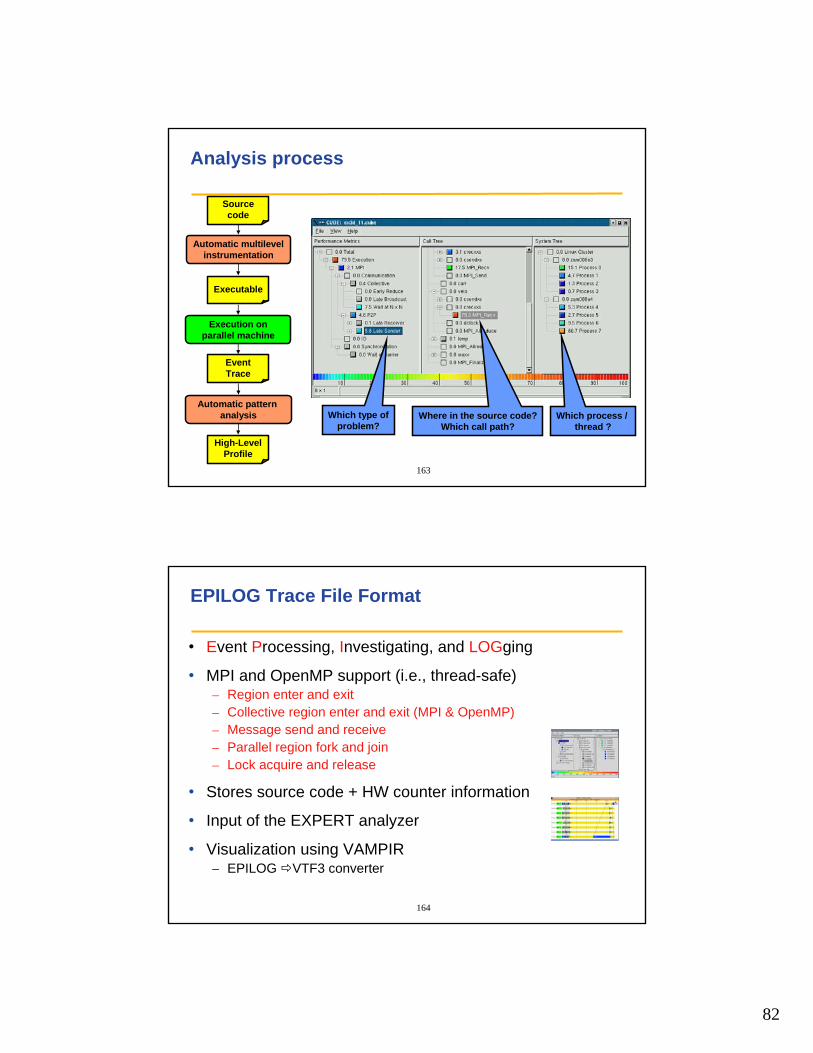
Analysis process
Sourcecode
Automatic multilevelinstrumentation
Execution onparallel machine
Executable
EventTrace
Automatic pattern analysis
High-LevelProfile
Which type ofproblem?
Where in the source code?Which call path?
Which process / thread ?
164
EPILOG Trace File Format
• Event Processing, Investigating, and LOGging
• MPI and OpenMP support (i.e., thread-safe)– Region enter and exit– Collective region enter and exit (MPI & OpenMP)– Message send and receive– Parallel region fork and join– Lock acquire and release
• Stores source code + HW counter information
• Input of the EXPERT analyzer
• Visualization using VAMPIR – EPILOG VTF3 converter
83
165
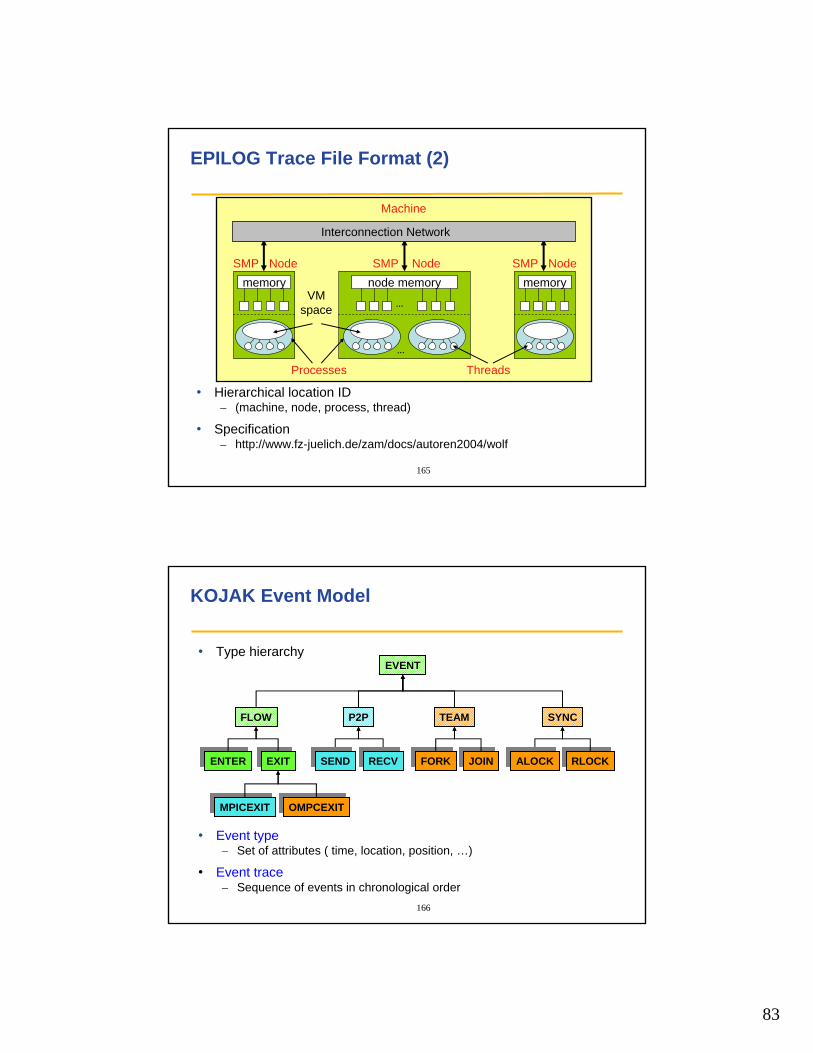
EPILOG Trace File Format (2)
• Hierarchical location ID– (machine, node, process, thread)
• Specification – http://www.fz-juelich.de/zam/docs/autoren2004/wolf
Machine
memory memorySMP Node SMP Node SMP Node
VMspace
Processes Threads
node memory…
…
Interconnection Network
166
KOJAK Event Model
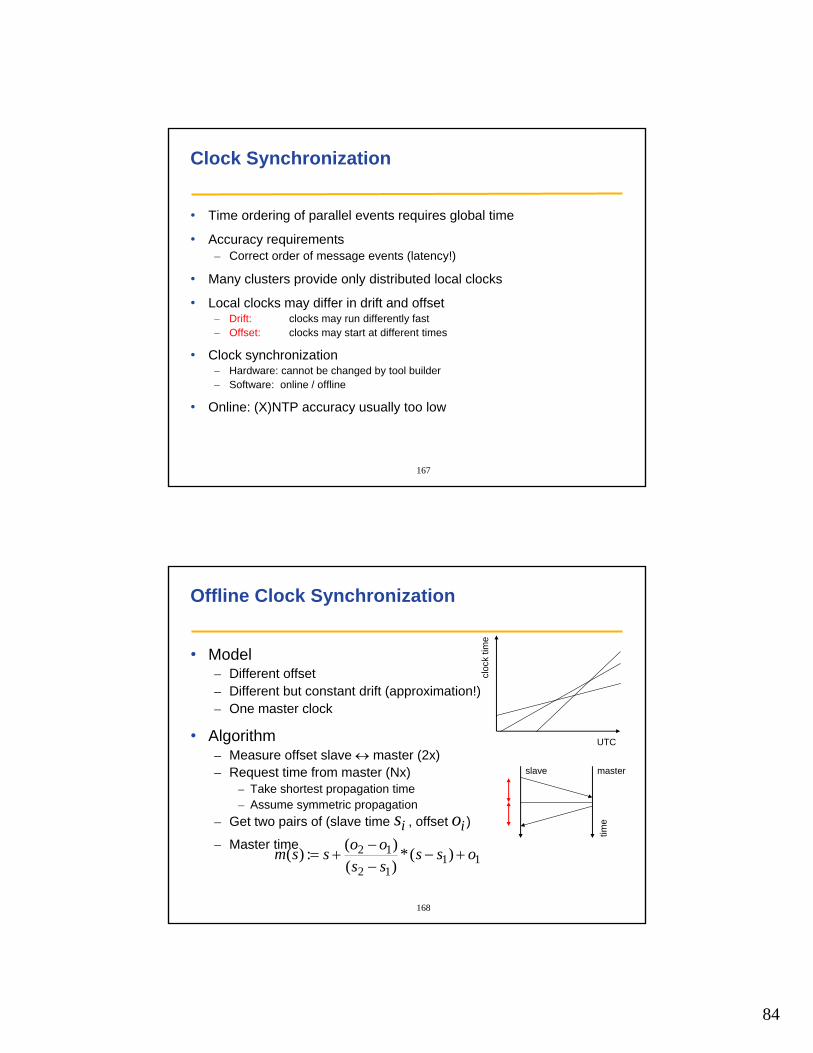
• Type hierarchy
• Event type– Set of attributes ( time, location, position, …)
• Event trace– Sequence of events in chronological order
EVENT
FLOW
ENTERENTER EXITEXIT
P2P
MPICEXITMPICEXIT
SENDSEND RECVRECV
OMPCEXITOMPCEXIT
SYNC
RLOCKRLOCK
TEAM
FORKFORK JOINJOIN ALOCKALOCK
84
167
Clock Synchronization
• Time ordering of parallel events requires global time
• Accuracy requirements– Correct order of message events (latency!)
• Many clusters provide only distributed local clocks
• Local clocks may differ in drift and offset– Drift: clocks may run differently fast– Offset: clocks may start at different times
• Clock synchronization– Hardware: cannot be changed by tool builder– Software: online / offline
• Online: (X)NTP accuracy usually too low
168
Offline Clock Synchronization
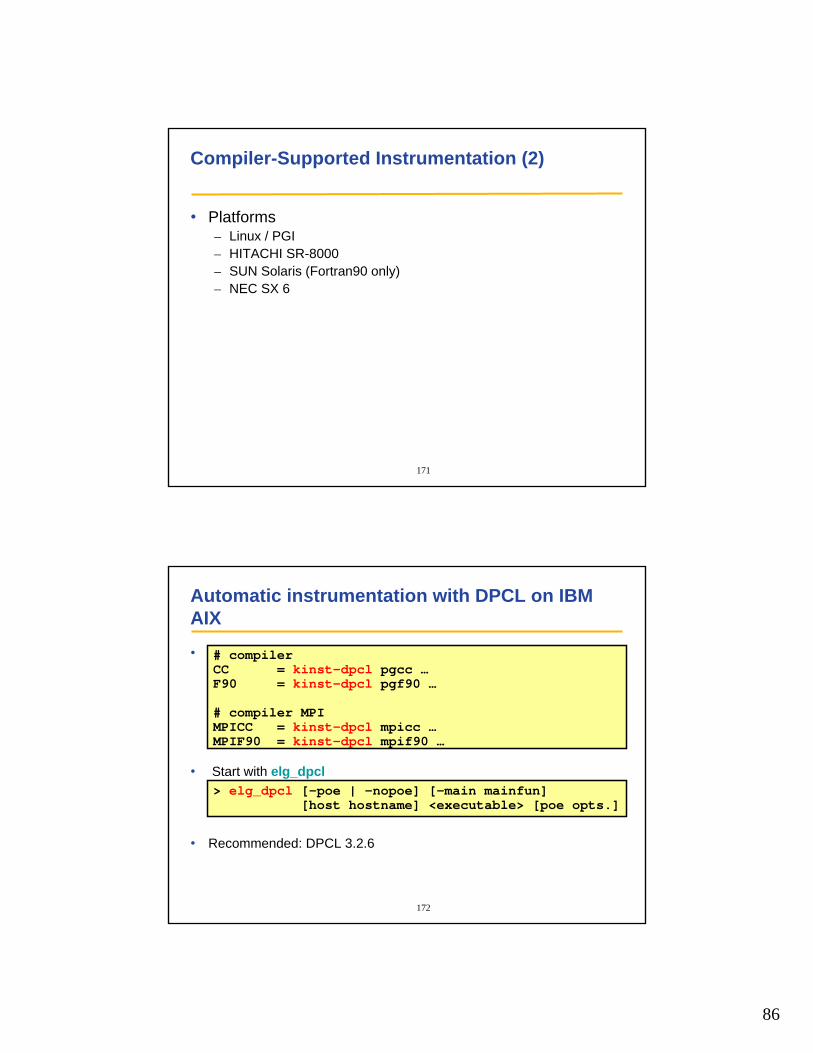
• Model– Different offset– Different but constant drift (approximation!)– One master clock
• Algorithm – Measure offset slave ↔ master (2x)– Request time from master (Nx)
– Take shortest propagation time– Assume symmetric propagation
– Get two pairs of (slave time , offset )
– Master timeis io
1112
12 )(*)()(:)( oss
ssoossm +−
−−
+=
UTC
cloc
k tim
e
slave master
time
85
169
Instrumentation
• Generating event traces requires extra code to be inserted into the application
• Supported programming languages – C, C++, Fortran
• Automatic instrumentation of MPI– PMPI wrapper library
• Automatic instrumentation of OpenMP– POMP wrapper library in combination with OPARI
• Automatic instrumentation of user code / functions– Using compiler-supplied profiling interface and kinst tool– Using TAU
• Manual instrumentation of user code / functions– Using POMP directives and kinst-pomp tool
170
Compiler-Supported Instrumentation
• Put kinst in front of every compile and link line in your makefile
• Build as usual, everything else is taken care off– Instrumentation of MPI / OpenMP constructs– Instrumentation of user functions
# compilerCC = kinst pgcc …F90 = kinst pgf90 …
# compiler MPIMPICC = kinst mpicc …MPIF90 = kinst mpif90 …
86
171
Compiler-Supported Instrumentation (2)
• Platforms– Linux / PGI– HITACHI SR-8000– SUN Solaris (Fortran90 only)– NEC SX 6
172
Automatic instrumentation with DPCL on IBM AIX
• Put kinst-dpcl in front of compile / link statements
• Start with elg_dpcl
• Recommended: DPCL 3.2.6
# compilerCC = kinst-dpcl pgcc …F90 = kinst-dpcl pgf90 …
# compiler MPIMPICC = kinst-dpcl mpicc …MPIF90 = kinst-dpcl mpif90 …
> elg_dpcl [-poe | -nopoe] [-main mainfun] [host hostname] <executable> [poe opts.]
87
173
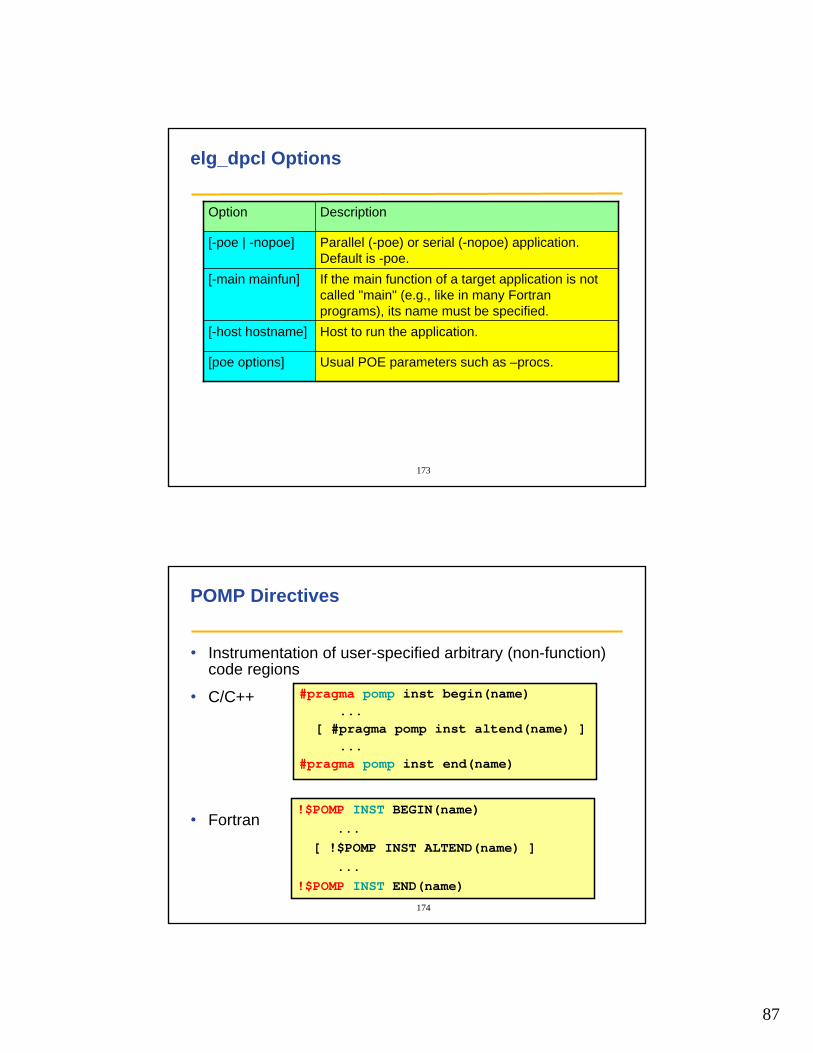
elg_dpcl Options
Usual POE parameters such as –procs. [poe options]
Host to run the application.[-host hostname]
If the main function of a target application is not called "main" (e.g., like in many Fortran programs), its name must be specified.
[-main mainfun]
Parallel (-poe) or serial (-nopoe) application. Default is -poe.
[-poe | -nopoe]
DescriptionOption
174
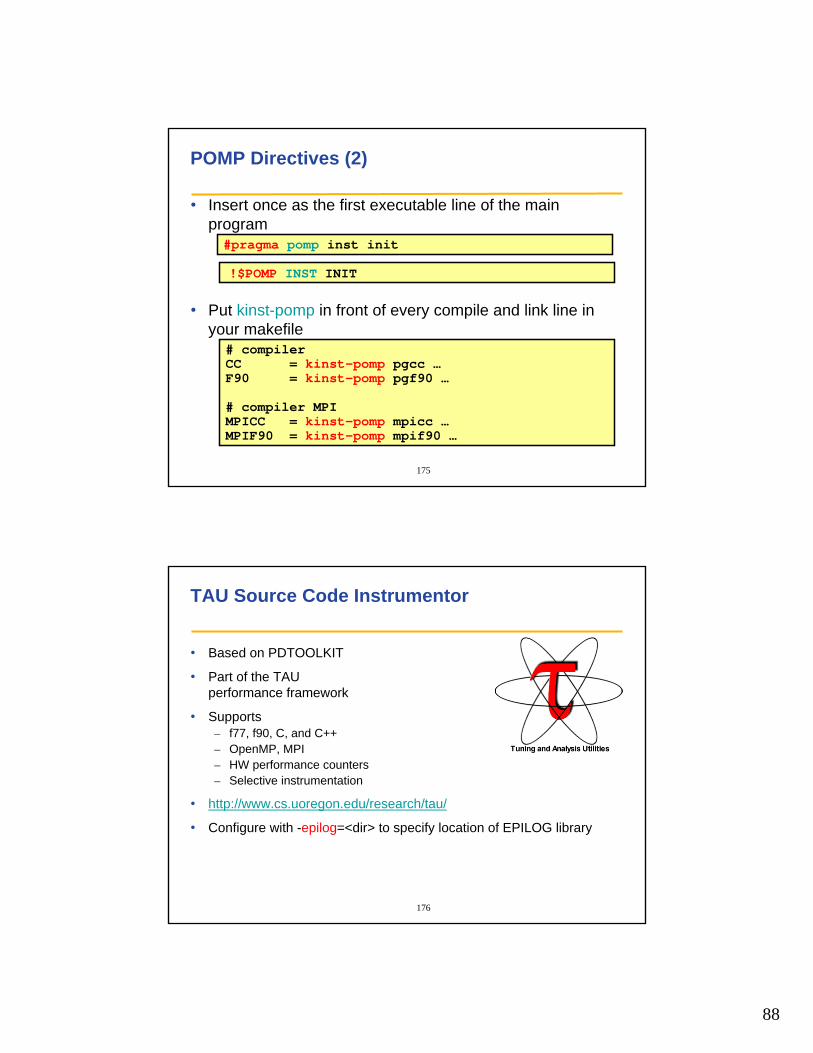
• Instrumentation of user-specified arbitrary (non-function) code regions
• C/C++
• Fortran
#pragma pomp inst begin(name)...
[ #pragma pomp inst altend(name) ]...
#pragma pomp inst end(name)
POMP Directives
!$POMP INST BEGIN(name)...
[ !$POMP INST ALTEND(name) ]...
!$POMP INST END(name)
88
175
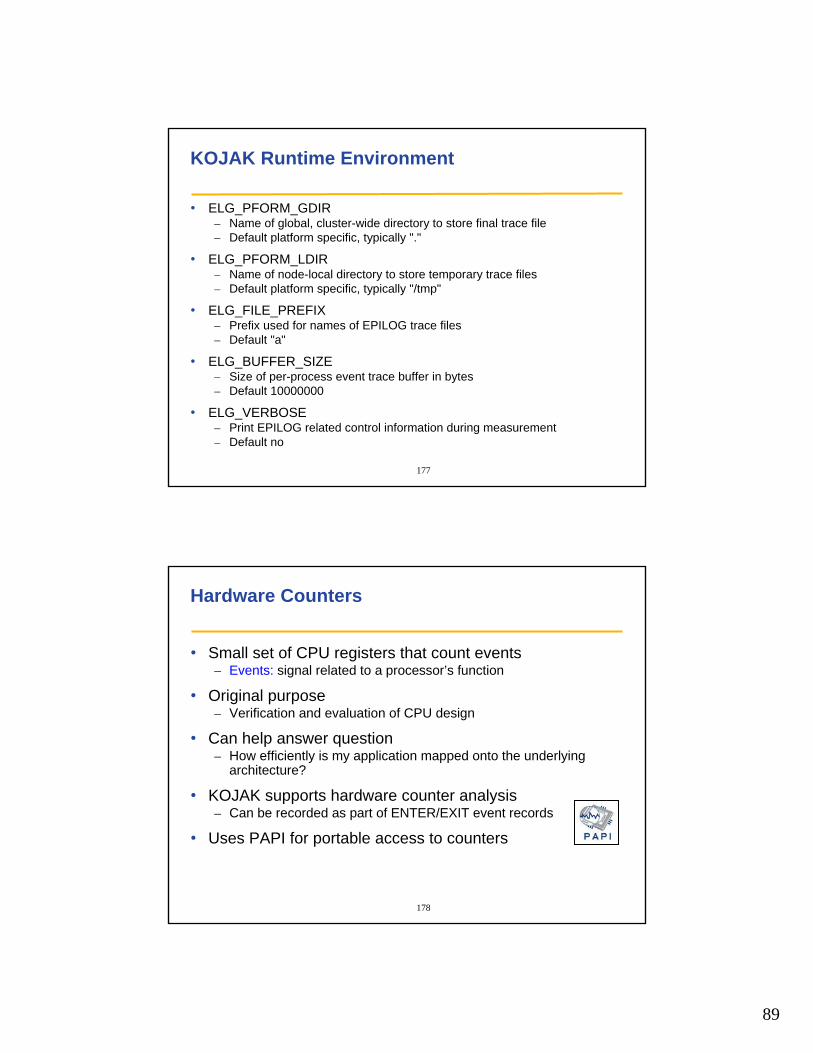
POMP Directives (2)
• Insert once as the first executable line of the main program
• Put kinst-pomp in front of every compile and link line in your makefile
# compilerCC = kinst-pomp pgcc …F90 = kinst-pomp pgf90 …
# compiler MPIMPICC = kinst-pomp mpicc …MPIF90 = kinst-pomp mpif90 …
#pragma pomp inst init
!$POMP INST INIT
176
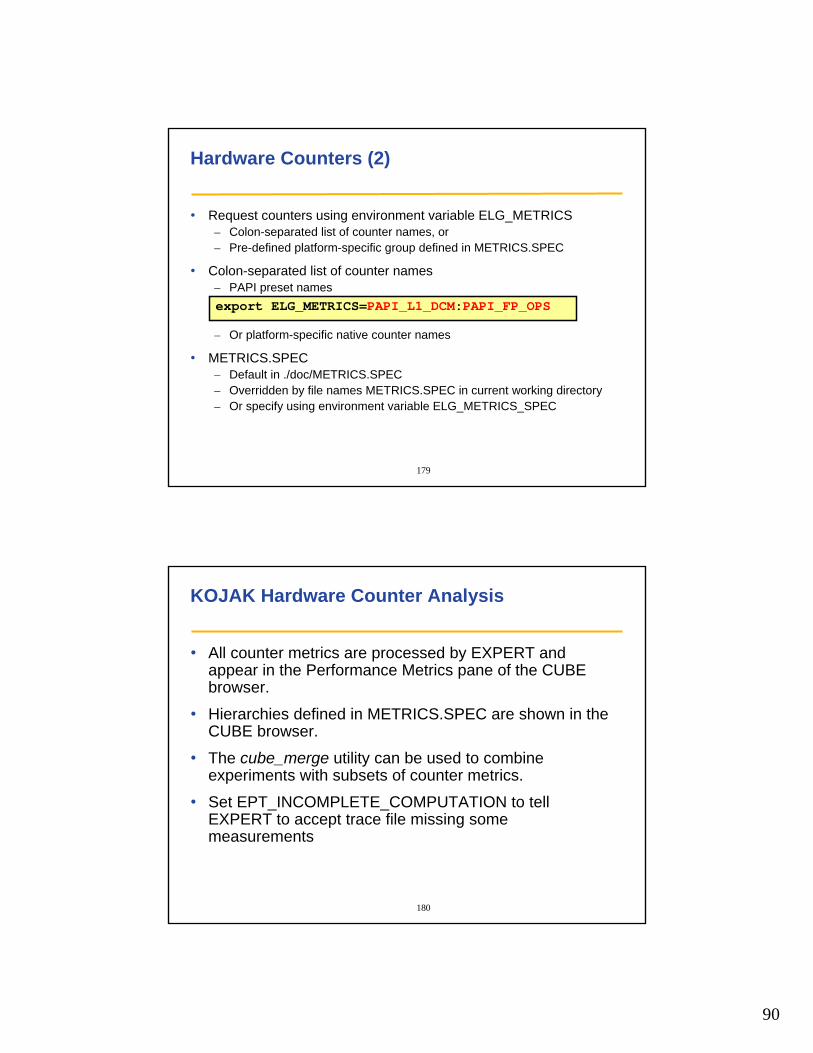
TAU Source Code Instrumentor
• Based on PDTOOLKIT
• Part of the TAUperformance framework
• Supports– f77, f90, C, and C++– OpenMP, MPI – HW performance counters– Selective instrumentation
• http://www.cs.uoregon.edu/research/tau/
• Configure with -epilog=<dir> to specify location of EPILOG library
89
177
KOJAK Runtime Environment
• ELG_PFORM_GDIR – Name of global, cluster-wide directory to store final trace file– Default platform specific, typically "."
• ELG_PFORM_LDIR – Name of node-local directory to store temporary trace files – Default platform specific, typically "/tmp"
• ELG_FILE_PREFIX – Prefix used for names of EPILOG trace files– Default "a"
• ELG_BUFFER_SIZE – Size of per-process event trace buffer in bytes– Default 10000000
• ELG_VERBOSE – Print EPILOG related control information during measurement– Default no
178
Hardware Counters
• Small set of CPU registers that count events – Events: signal related to a processor’s function
• Original purpose– Verification and evaluation of CPU design
• Can help answer question– How efficiently is my application mapped onto the underlying
architecture?
• KOJAK supports hardware counter analysis– Can be recorded as part of ENTER/EXIT event records
• Uses PAPI for portable access to counters
90
179
Hardware Counters (2)
• Request counters using environment variable ELG_METRICS– Colon-separated list of counter names, or– Pre-defined platform-specific group defined in METRICS.SPEC
• Colon-separated list of counter names– PAPI preset names
– Or platform-specific native counter names
• METRICS.SPEC– Default in ./doc/METRICS.SPEC– Overridden by file names METRICS.SPEC in current working directory– Or specify using environment variable ELG_METRICS_SPEC
export ELG_METRICS=PAPI_L1_DCM:PAPI_FP_OPS
180
KOJAK Hardware Counter Analysis
• All counter metrics are processed by EXPERT and appear in the Performance Metrics pane of the CUBE browser.
• Hierarchies defined in METRICS.SPEC are shown in the CUBE browser.
• The cube_merge utility can be used to combine experiments with subsets of counter metrics.
• Set EPT_INCOMPLETE_COMPUTATION to tell EXPERT to accept trace file missing some measurements
91
181
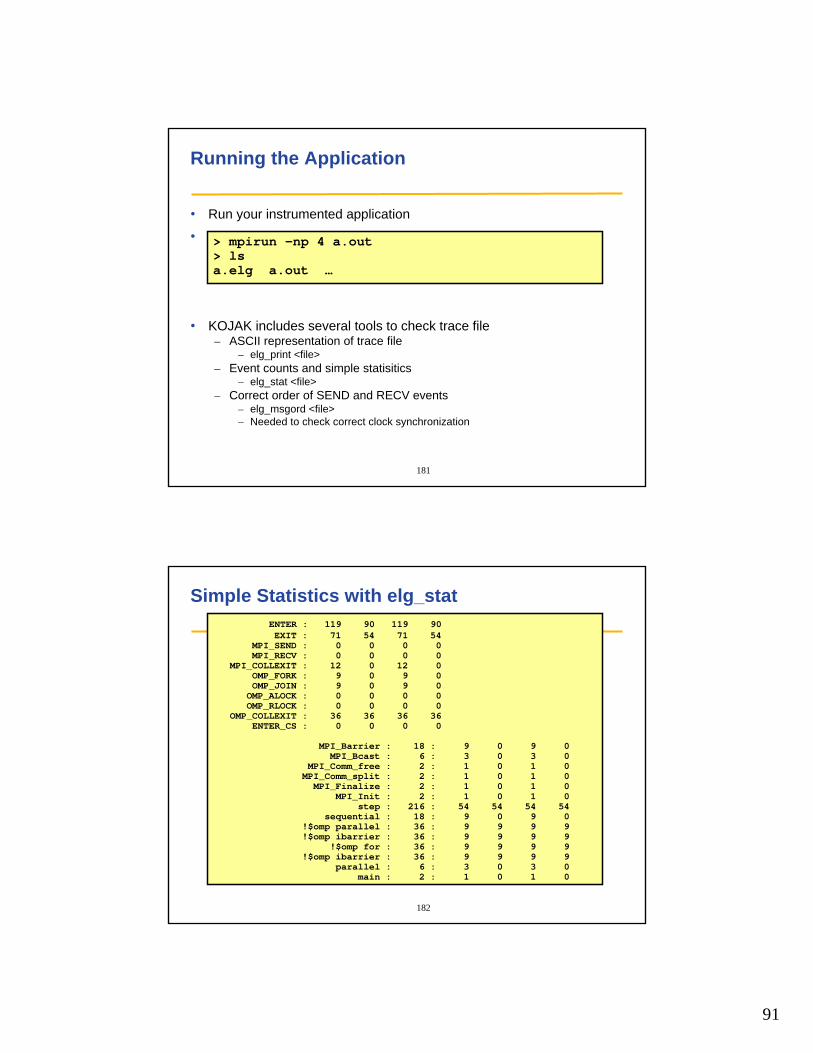
Running the Application
• Run your instrumented application
• Application will generate a trace file a.elg
• KOJAK includes several tools to check trace file– ASCII representation of trace file
– elg_print <file>– Event counts and simple statisitics
– elg_stat <file>– Correct order of SEND and RECV events
– elg_msgord <file>– Needed to check correct clock synchronization
> mpirun –np 4 a.out> lsa.elg a.out …
182
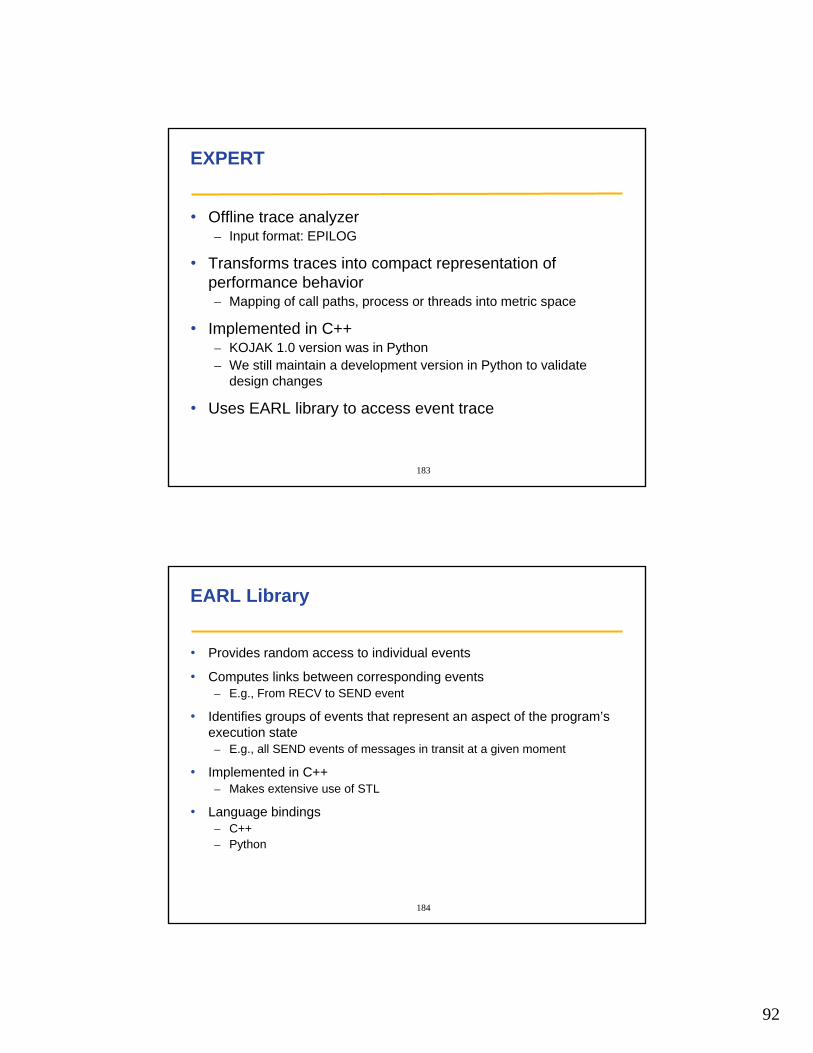
Simple Statistics with elg_statENTER : 119 90 119 90EXIT : 71 54 71 54
MPI_SEND : 0 0 0 0MPI_RECV : 0 0 0 0
MPI_COLLEXIT : 12 0 12 0OMP_FORK : 9 0 9 0OMP_JOIN : 9 0 9 0OMP_ALOCK : 0 0 0 0OMP_RLOCK : 0 0 0 0
OMP_COLLEXIT : 36 36 36 36ENTER_CS : 0 0 0 0
MPI_Barrier : 18 : 9 0 9 0MPI_Bcast : 6 : 3 0 3 0
MPI_Comm_free : 2 : 1 0 1 0MPI_Comm_split : 2 : 1 0 1 0MPI_Finalize : 2 : 1 0 1 0
MPI_Init : 2 : 1 0 1 0step : 216 : 54 54 54 54
sequential : 18 : 9 0 9 0!$omp parallel : 36 : 9 9 9 9!$omp ibarrier : 36 : 9 9 9 9
!$omp for : 36 : 9 9 9 9!$omp ibarrier : 36 : 9 9 9 9
parallel : 6 : 3 0 3 0main : 2 : 1 0 1 0
92
183
EXPERT
• Offline trace analyzer– Input format: EPILOG
• Transforms traces into compact representation of performance behavior– Mapping of call paths, process or threads into metric space
• Implemented in C++– KOJAK 1.0 version was in Python– We still maintain a development version in Python to validate
design changes
• Uses EARL library to access event trace
184
EARL Library
• Provides random access to individual events
• Computes links between corresponding events– E.g., From RECV to SEND event
• Identifies groups of events that represent an aspect of the program’s execution state– E.g., all SEND events of messages in transit at a given moment
• Implemented in C++– Makes extensive use of STL
• Language bindings– C++– Python

93
185
Pattern Specification
• Pattern – Compound event– Set of primitive events (= constitutents)– Relationships between constituents– Constraints
• Patterns specified as C++ class– Provides callback method to be called upon occurrence of a
specific event type in event stream (root event)– Uses links or state information to find remaining constituents– Calculates (call path, location) matrix containing the time spent on
a specific behavior in a particular (call path, location) pair– Location can be a process or a thread
186
Pattern Specification (2)
• Two types of patterns
• Profiling patterns– Simple profiling information
– E.g.,How much time was spent in MPI calls?– Described by pairs of events
– ENTER and EXIT of certain routine (e.g., MPI)
• Patterns describing complex inefficiency situations– Usually described by more than two events– E.g., late sender or synchronization before all-to-all operations
• All patterns are arranged in an inclusion hierarchy– Inclusion of execution-time interval sets exhibiting the performance
behavior– E.g., execution time includes communication time
94
187
Pattern hierarchy
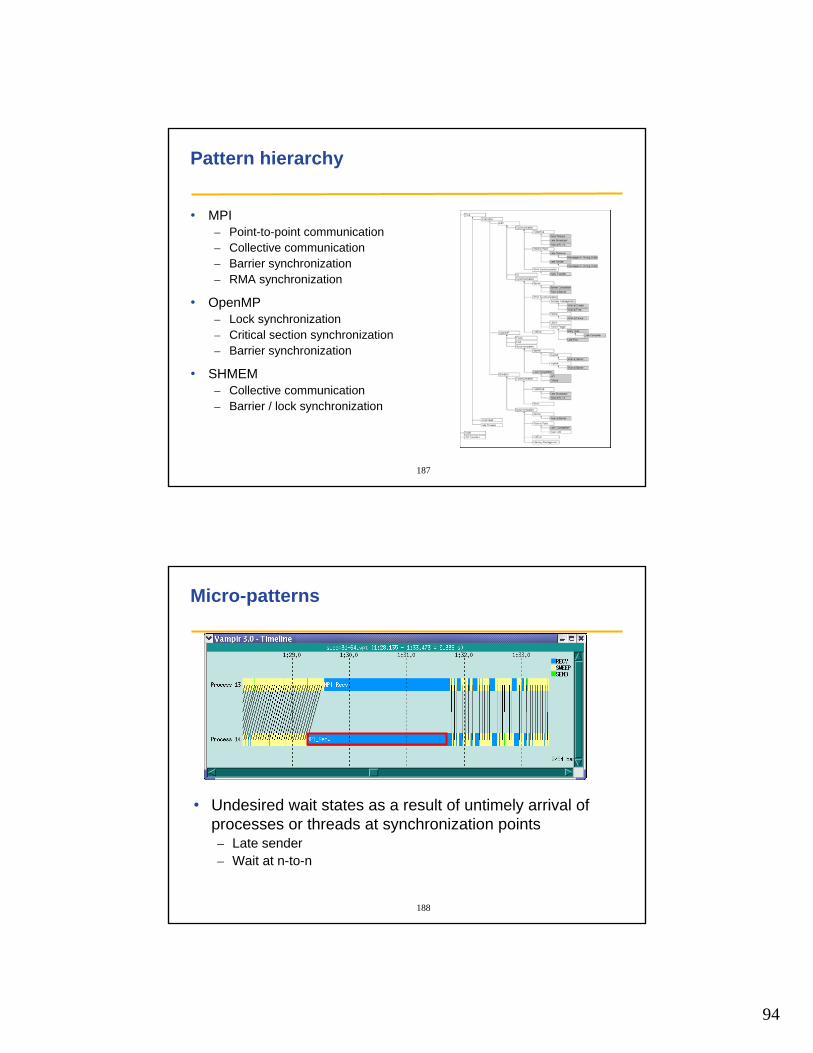
• MPI– Point-to-point communication– Collective communication– Barrier synchronization– RMA synchronization
• OpenMP– Lock synchronization– Critical section synchronization– Barrier synchronization
• SHMEM– Collective communication– Barrier / lock synchronization
188
Micro-patterns
• Undesired wait states as a result of untimely arrival of processes or threads at synchronization points– Late sender– Wait at n-to-n
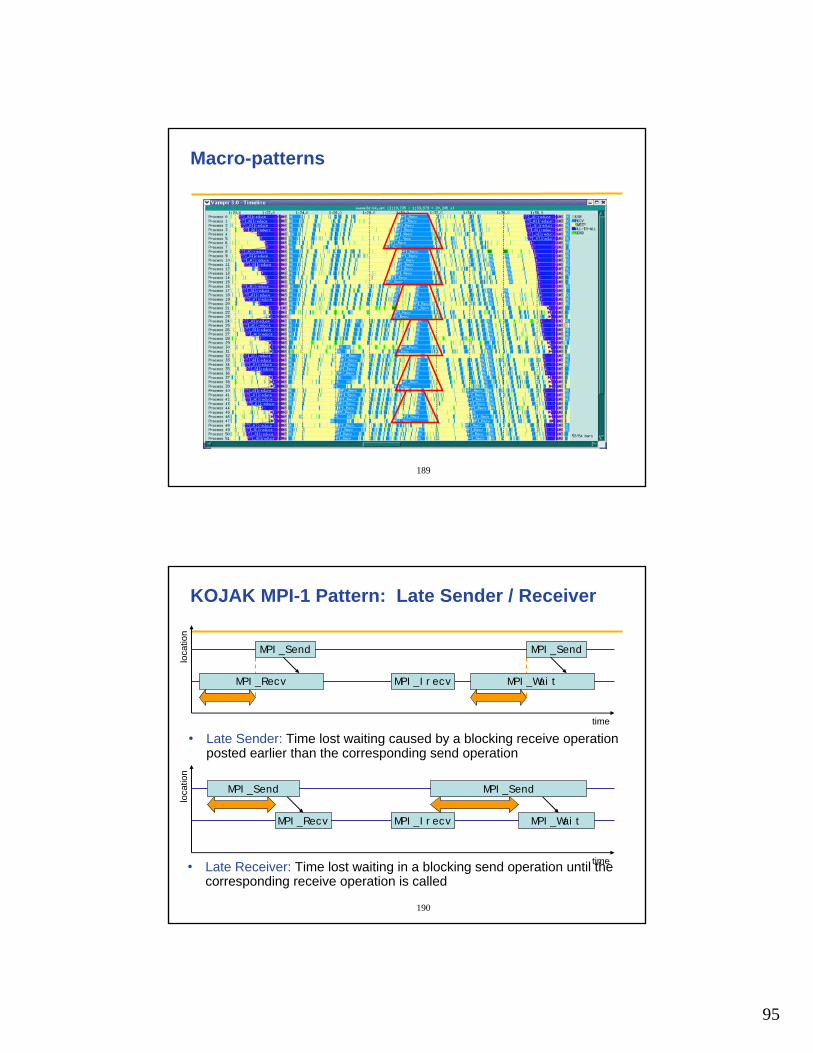
95
189
Macro-patterns
190
KOJAK MPI-1 Pattern: Late Sender / Receiver
• Late Sender: Time lost waiting caused by a blocking receive operation posted earlier than the corresponding send operation
loca
tion
time
MPI_Send MPI_Send
MPI_Recv MPI_WaitMPI_Irecv
• Late Receiver: Time lost waiting in a blocking send operation until the corresponding receive operation is called
loca
tion
time
MPI_Send MPI_Send
MPI_Recv MPI_WaitMPI_Irecv
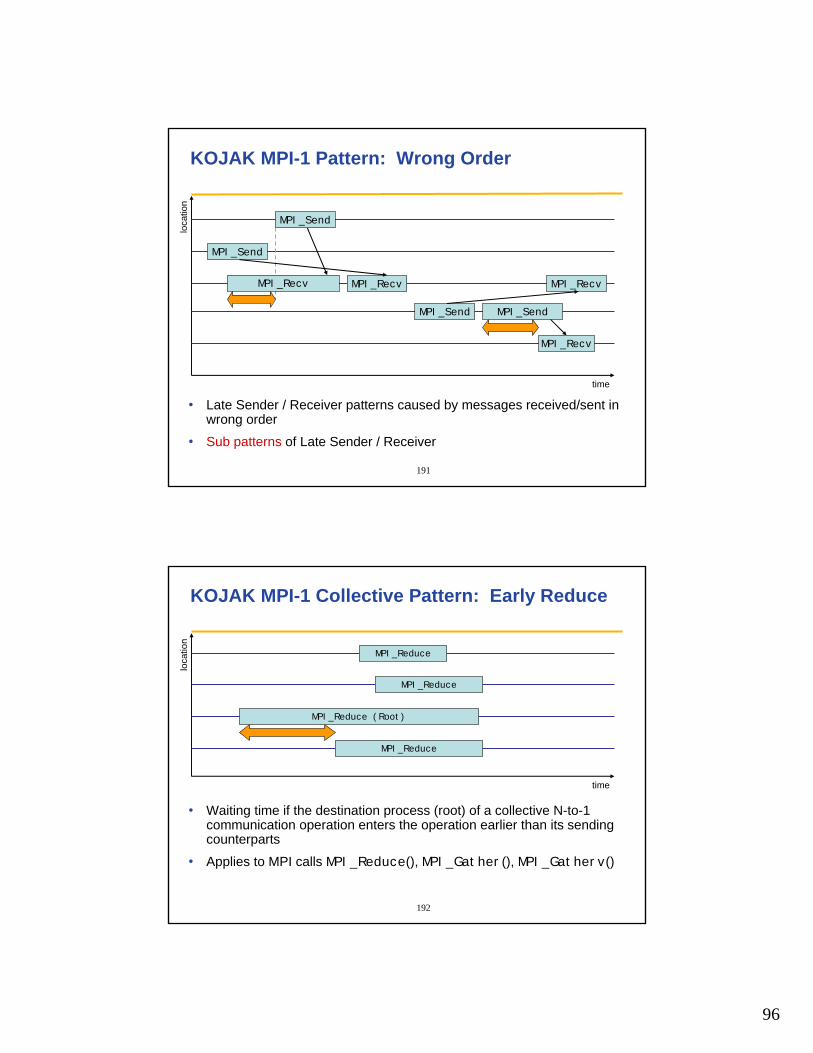
96
191
KOJAK MPI-1 Pattern: Wrong Order
• Late Sender / Receiver patterns caused by messages received/sent in wrong order
• Sub patterns of Late Sender / Receiver
loca
tion
MPI_Recv
MPI_Send
MPI_Send
MPI_Recv
time
MPI_Send
MPI_Recv
MPI_Send
MPI_Recv
192
KOJAK MPI-1 Collective Pattern: Early Reduce
• Waiting time if the destination process (root) of a collective N-to-1 communication operation enters the operation earlier than its sending counterparts
• Applies to MPI calls MPI_Reduce(), MPI_Gather(), MPI_Gatherv()
MPI_Reduce
time
MPI_Reduce
MPI_Reduce (Root)
MPI_Reduce
loca
tion
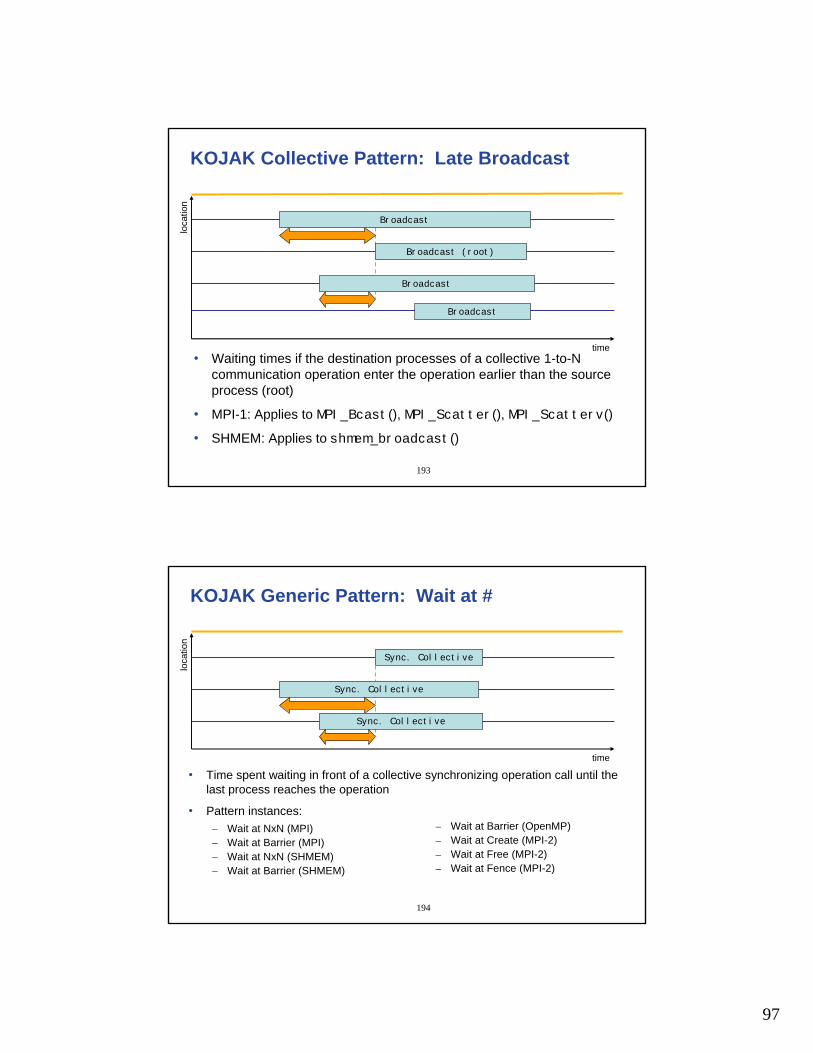
97
193
KOJAK Collective Pattern: Late Broadcastlo
catio
n
Broadcast
Broadcast
time
Broadcast
• Waiting times if the destination processes of a collective 1-to-N communication operation enter the operation earlier than the source process (root)
• MPI-1: Applies to MPI_Bcast(), MPI_Scatter(), MPI_Scatterv()
• SHMEM: Applies to shmem_broadcast()
Broadcast (root)
194
KOJAK Generic Pattern: Wait at #
• Time spent waiting in front of a collective synchronizing operation call until the last process reaches the operation
• Pattern instances:
loca
tion
Sync. Collective
time
Sync. Collective
Sync. Collective
– Wait at NxN (MPI)– Wait at Barrier (MPI) – Wait at NxN (SHMEM) – Wait at Barrier (SHMEM)
– Wait at Barrier (OpenMP)– Wait at Create (MPI-2)– Wait at Free (MPI-2)– Wait at Fence (MPI-2)
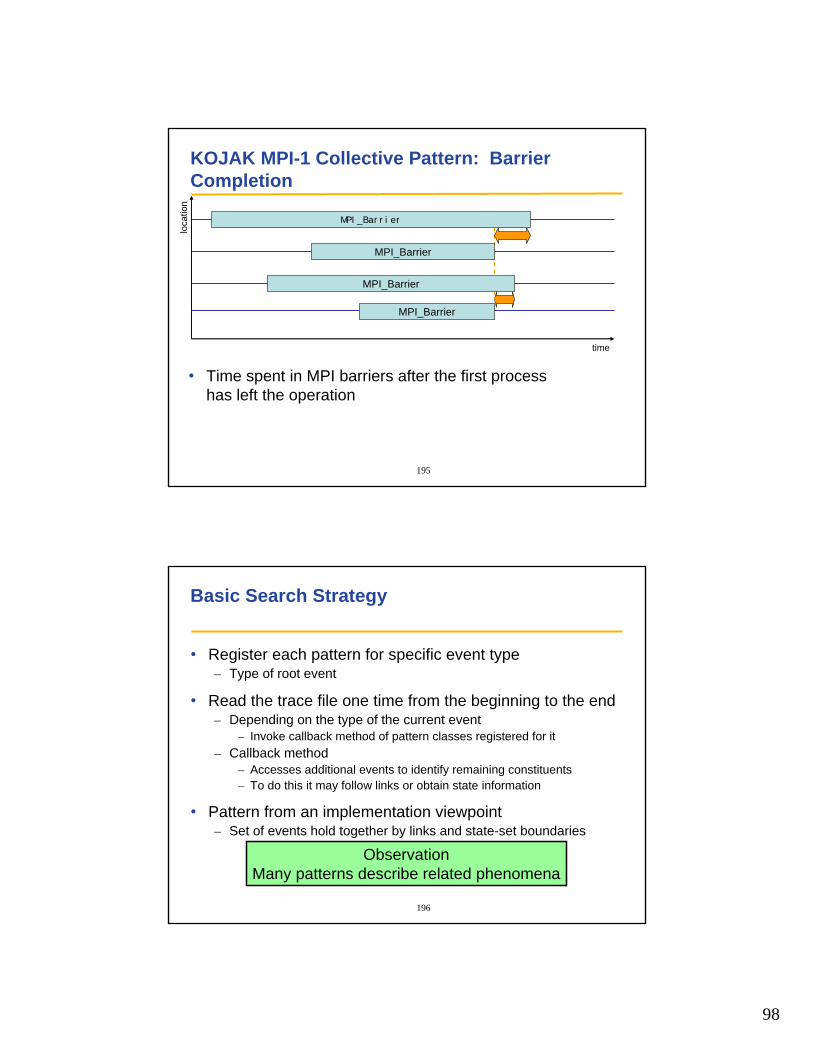
98
195
KOJAK MPI-1 Collective Pattern: Barrier Completion
loca
tion
MPI_Barrier
MPI_Barrier
time
MPI_Barrier
• Time spent in MPI barriers after the first processhas left the operation
MPI_Barrier
196
Basic Search Strategy
• Register each pattern for specific event type– Type of root event
• Read the trace file one time from the beginning to the end– Depending on the type of the current event
– Invoke callback method of pattern classes registered for it – Callback method
– Accesses additional events to identify remaining constituents– To do this it may follow links or obtain state information
• Pattern from an implementation viewpoint– Set of events hold together by links and state-set boundaries
ObservationMany patterns describe related phenomena
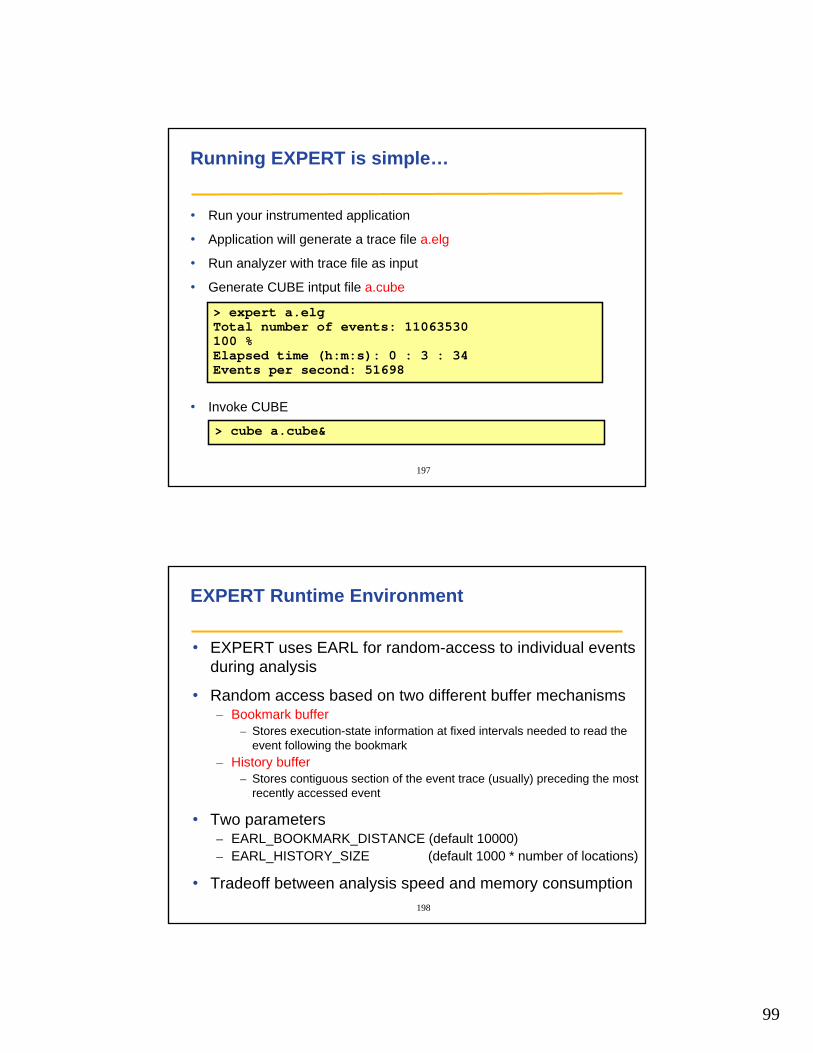
99
197
Running EXPERT is simple…
• Run your instrumented application
• Application will generate a trace file a.elg
• Run analyzer with trace file as input
• Generate CUBE intput file a.cube
• Invoke CUBE
> expert a.elgTotal number of events: 11063530100 %Elapsed time (h:m:s): 0 : 3 : 34 Events per second: 51698
> cube a.cube&
198
EXPERT Runtime Environment
• EXPERT uses EARL for random-access to individual events during analysis
• Random access based on two different buffer mechanisms– Bookmark buffer
– Stores execution-state information at fixed intervals needed to read the event following the bookmark
– History buffer– Stores contiguous section of the event trace (usually) preceding the most
recently accessed event
• Two parameters– EARL_BOOKMARK_DISTANCE (default 10000)– EARL_HISTORY_SIZE (default 1000 * number of locations)
• Tradeoff between analysis speed and memory consumption
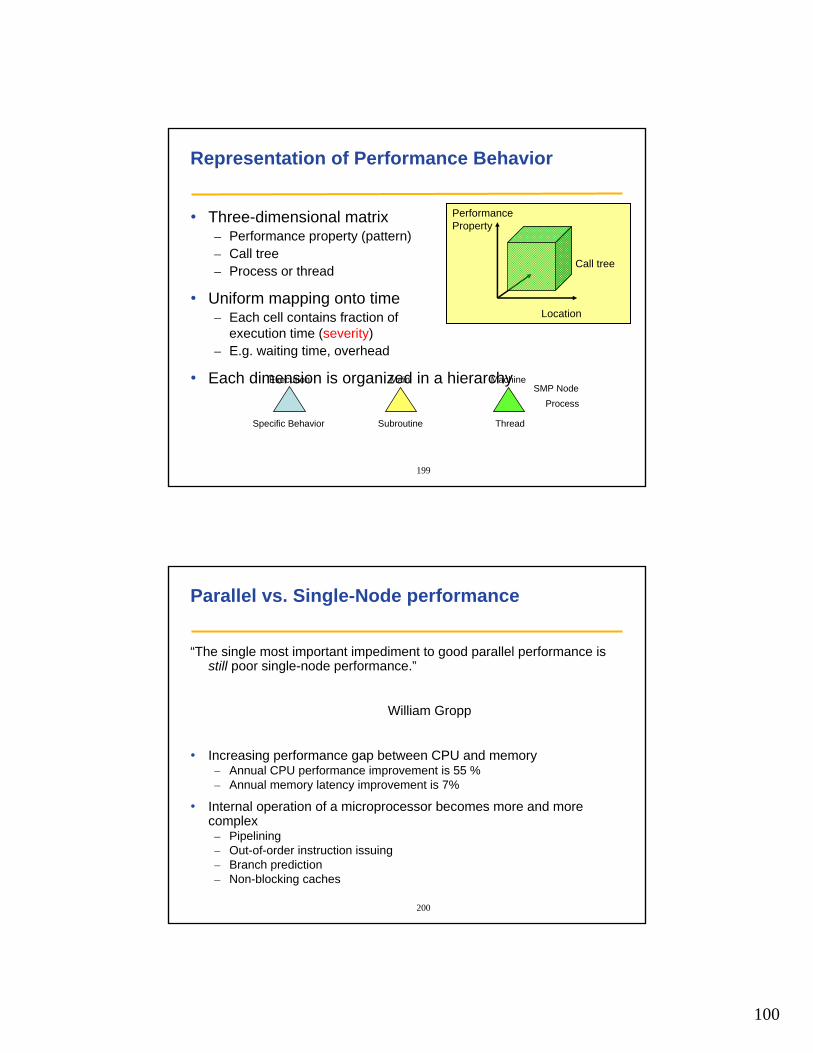
100
199
Representation of Performance Behavior
• Three-dimensional matrix– Performance property (pattern)– Call tree– Process or thread
• Uniform mapping onto time– Each cell contains fraction of
execution time (severity)– E.g. waiting time, overhead
• Each dimension is organized in a hierarchy
Ort
PerformanceProperty
Call tree
Location
Execution
Specific Behavior
Main
Subroutine
Machine
Thread
SMP Node Process
200
Parallel vs. Single-Node performance
“The single most important impediment to good parallel performance is still poor single-node performance.”
William Gropp
• Increasing performance gap between CPU and memory– Annual CPU performance improvement is 55 %– Annual memory latency improvement is 7%
• Internal operation of a microprocessor becomes more and more complex– Pipelining– Out-of-order instruction issuing– Branch prediction– Non-blocking caches
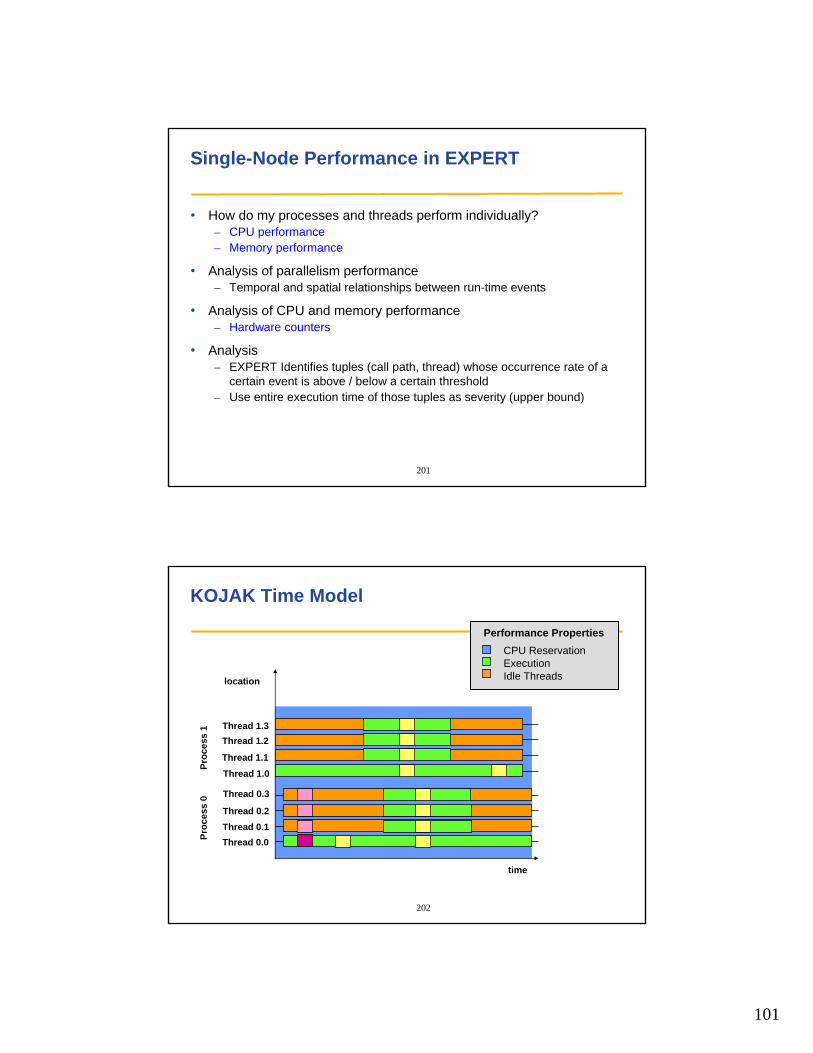
101
201
Single-Node Performance in EXPERT
• How do my processes and threads perform individually?– CPU performance– Memory performance
• Analysis of parallelism performance– Temporal and spatial relationships between run-time events
• Analysis of CPU and memory performance– Hardware counters
• Analysis– EXPERT Identifies tuples (call path, thread) whose occurrence rate of a
certain event is above / below a certain threshold– Use entire execution time of those tuples as severity (upper bound)
202
KOJAK Time Model
location
time
Thread 1.3Thread 1.2
Thread 1.1Thread 1.0
Thread 0.3
Thread 0.2Thread 0.1Thread 0.0
Proc
ess
1Pr
oces
s 0
CPU ReservationExecutionIdle Threads
Performance Properties
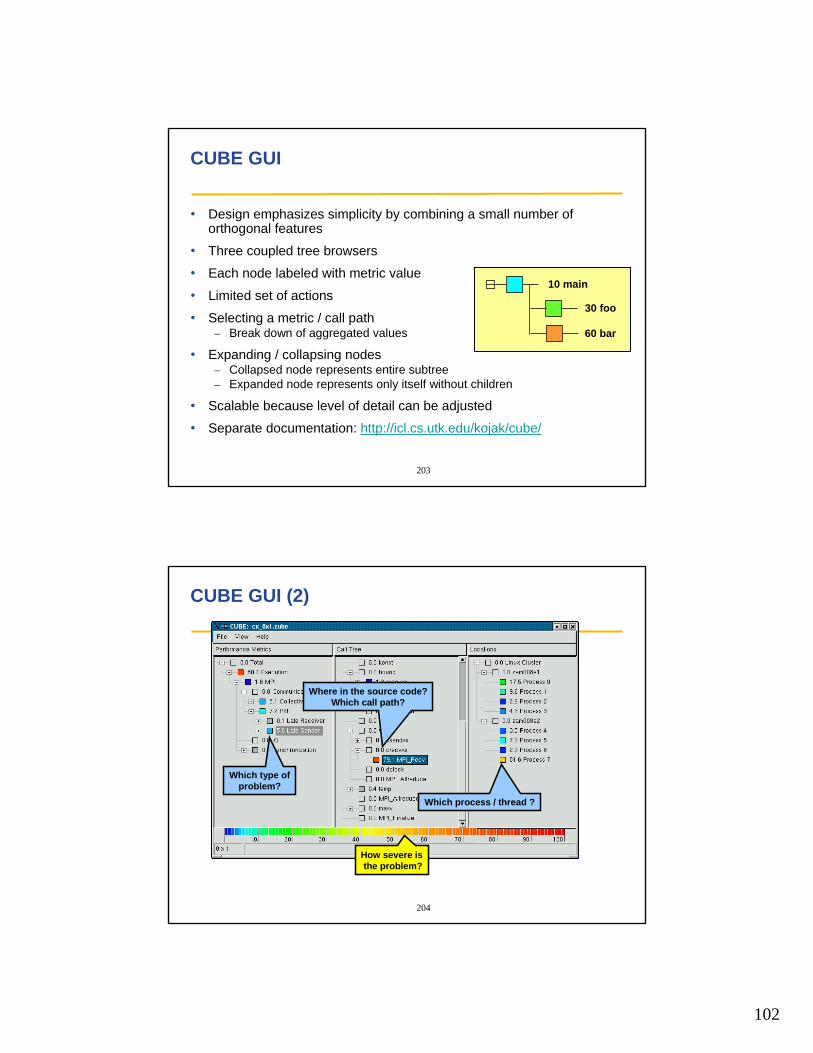
102
203
CUBE GUI
• Design emphasizes simplicity by combining a small number of orthogonal features
• Three coupled tree browsers
• Each node labeled with metric value
• Limited set of actions
• Selecting a metric / call path– Break down of aggregated values
• Expanding / collapsing nodes– Collapsed node represents entire subtree– Expanded node represents only itself without children
• Scalable because level of detail can be adjusted
• Separate documentation: http://icl.cs.utk.edu/kojak/cube/
100 main
60 bar
10 main
30 foo
204
CUBE GUI (2)
Which type ofproblem?
Where in the source code?Which call path?
Which process / thread ?
How severe isthe problem?
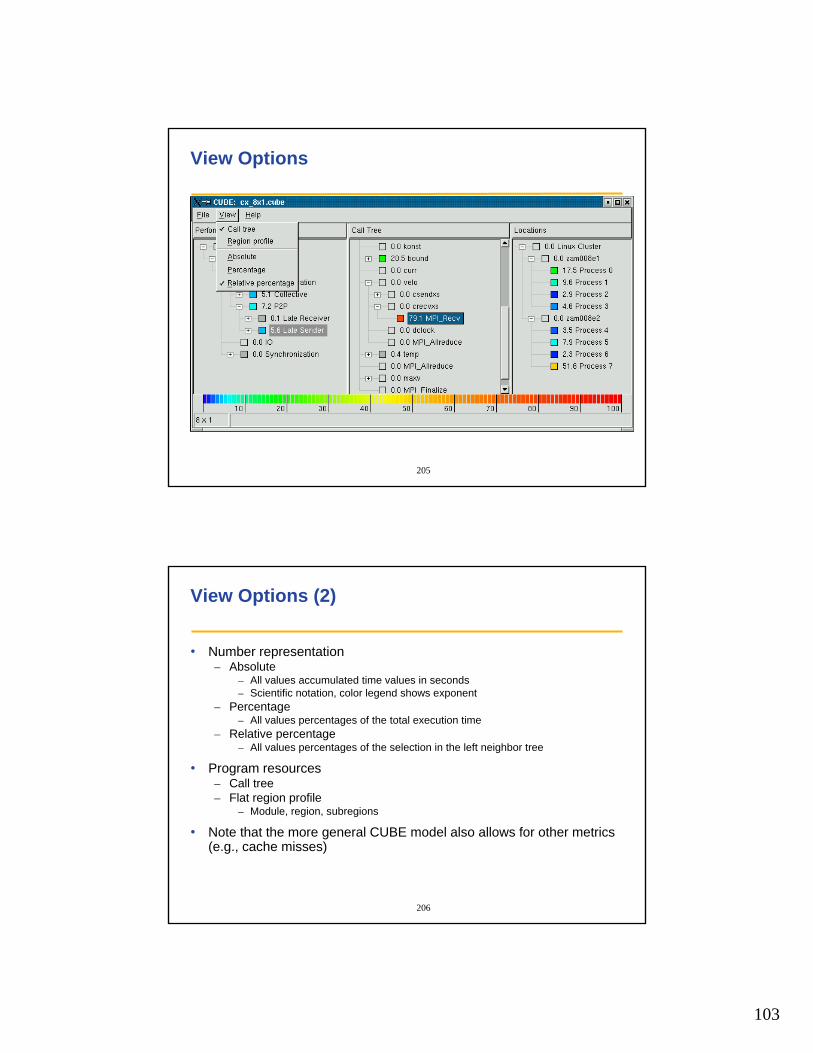
103
205
View Options
206
View Options (2)
• Number representation– Absolute
– All values accumulated time values in seconds– Scientific notation, color legend shows exponent
– Percentage– All values percentages of the total execution time
– Relative percentage– All values percentages of the selection in the left neighbor tree
• Program resources– Call tree– Flat region profile
– Module, region, subregions
• Note that the more general CUBE model also allows for other metrics (e.g., cache misses)
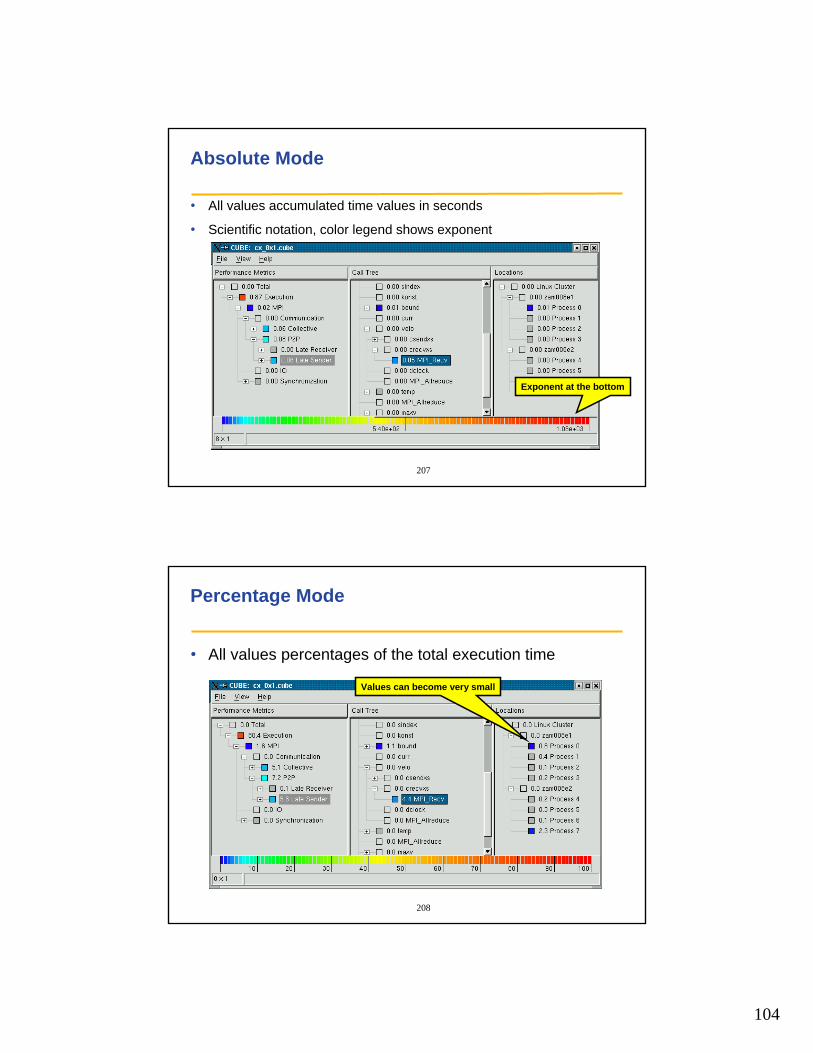
104
207
Absolute Mode
• All values accumulated time values in seconds
• Scientific notation, color legend shows exponent
Exponent at the bottom
208
Percentage Mode
• All values percentages of the total execution time
Values can become very small
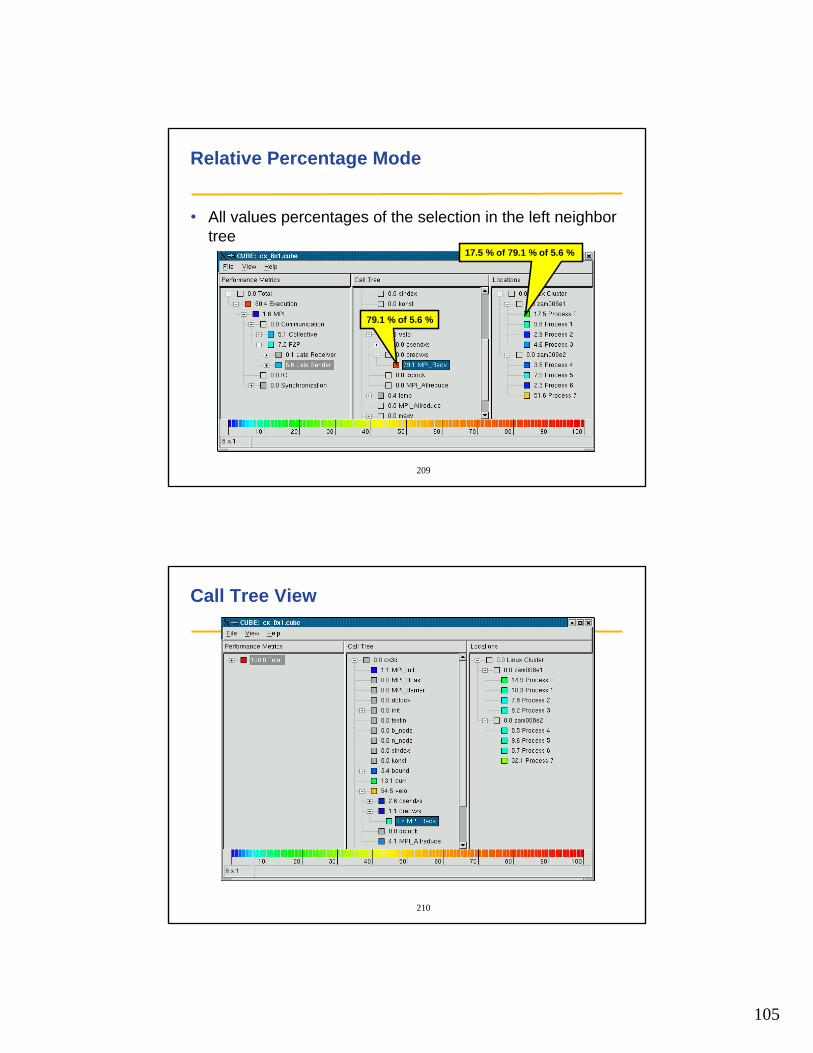
105
209
Relative Percentage Mode
• All values percentages of the selection in the left neighbor tree
79.1 % of 5.6 %
17.5 % of 79.1 % of 5.6 %
210
Call Tree View
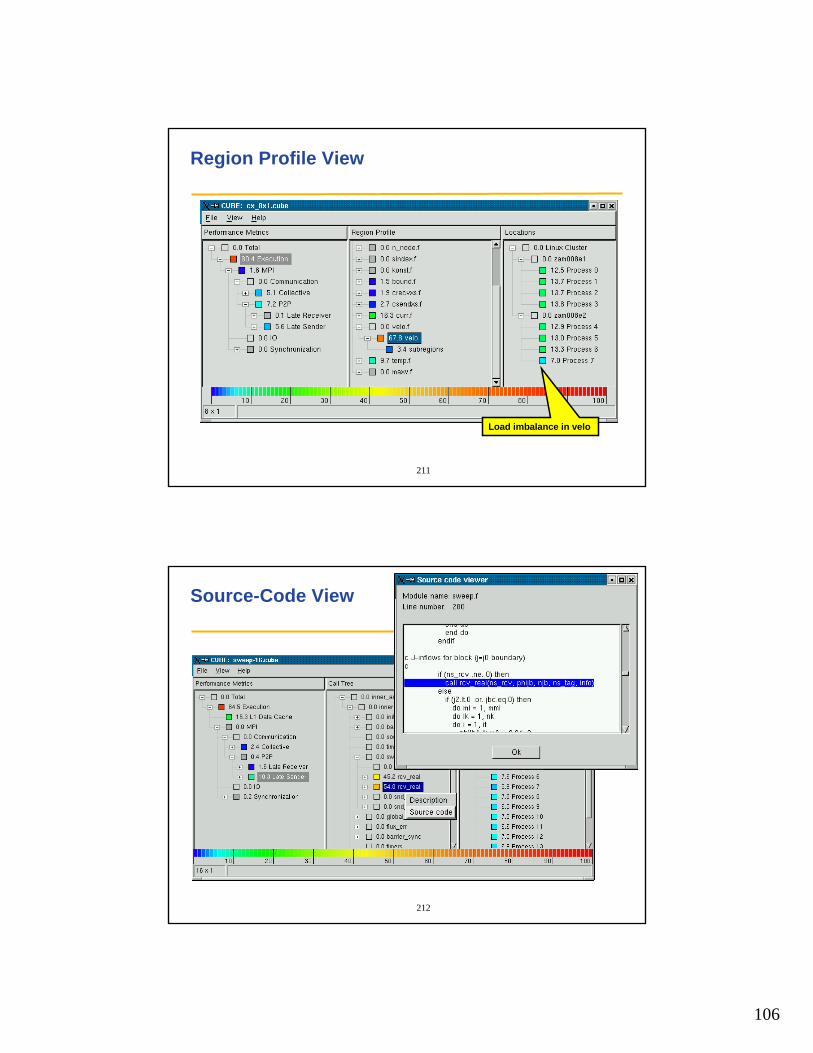
106
211
Region Profile View
Load imbalance in velo
212
Source-Code View
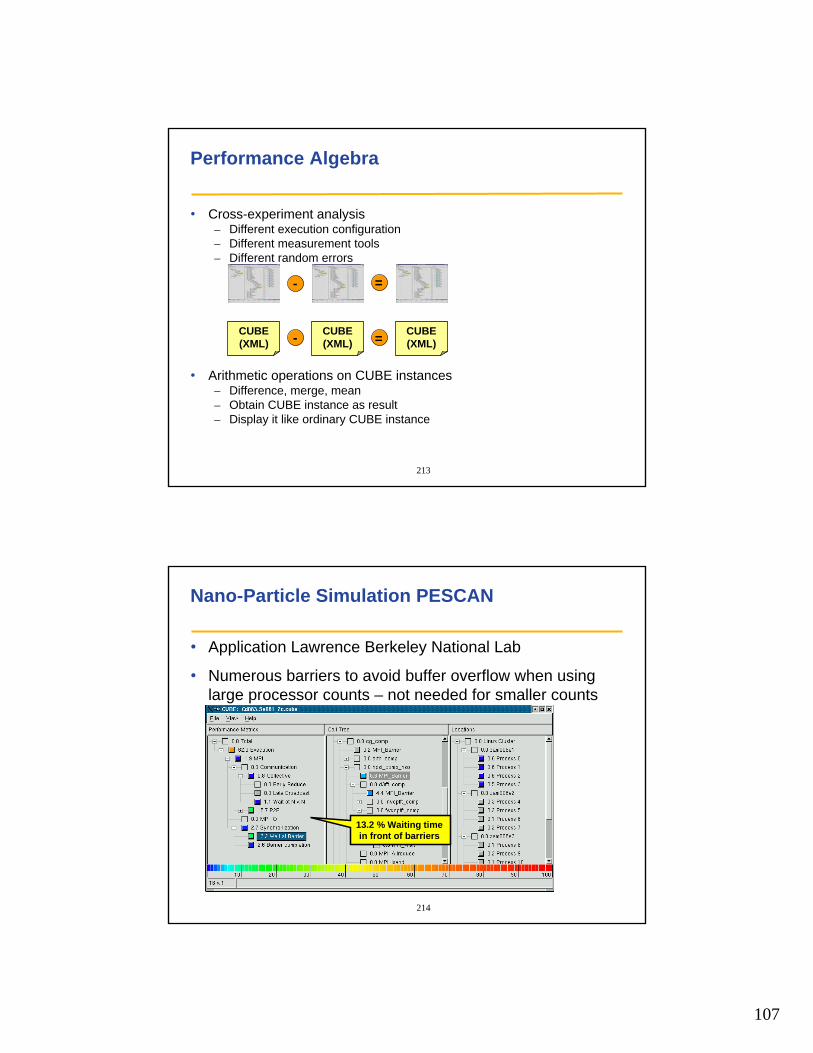
107
213
• Cross-experiment analysis– Different execution configuration– Different measurement tools– Different random errors
• Arithmetic operations on CUBE instances– Difference, merge, mean– Obtain CUBE instance as result– Display it like ordinary CUBE instance
Performance Algebra
-
CUBE(XML)
CUBE(XML)
CUBE(XML)-
=
=
214
Nano-Particle Simulation PESCAN
• Application Lawrence Berkeley National Lab
• Numerous barriers to avoid buffer overflow when using large processor counts – not needed for smaller counts
13.2 % Waiting time in front of barriers
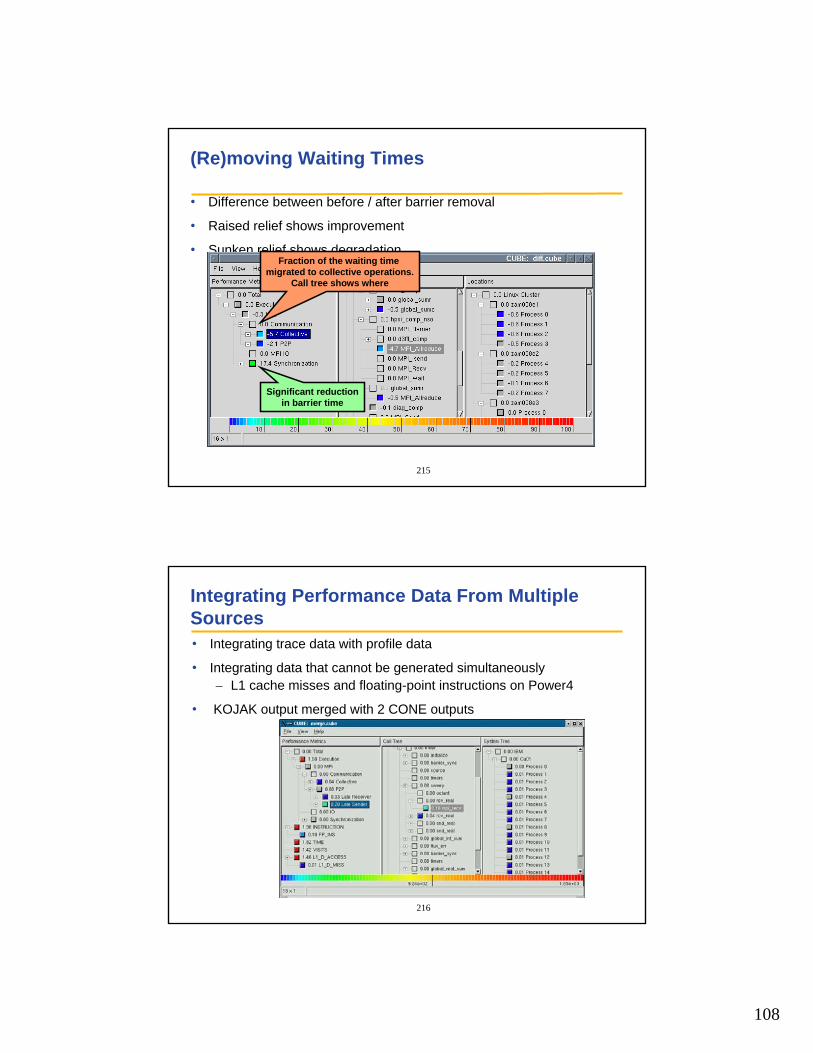
108
215
(Re)moving Waiting Times
• Difference between before / after barrier removal
• Raised relief shows improvement
• Sunken relief shows degradation
Significant reductionin barrier time
Fraction of the waiting time migrated to collective operations.
Call tree shows where
216
Integrating Performance Data From Multiple Sources• Integrating trace data with profile data
• Integrating data that cannot be generated simultaneously– L1 cache misses and floating-point instructions on Power4
• KOJAK output merged with 2 CONE outputs
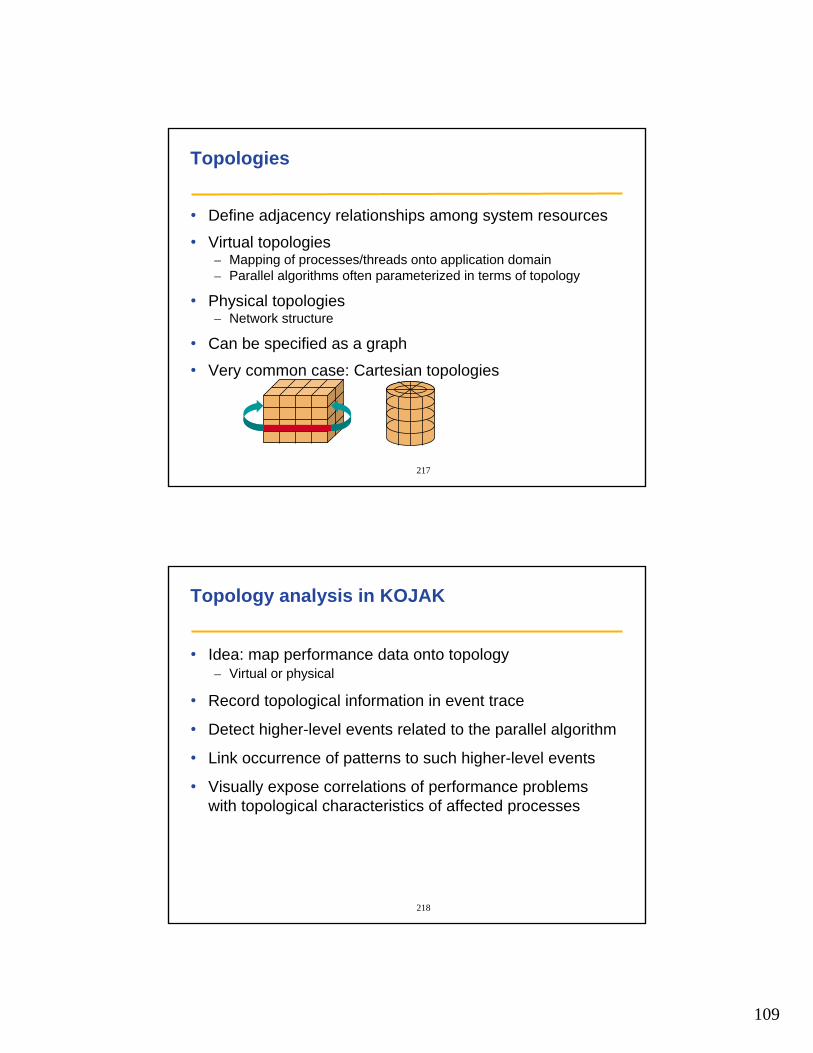
109
217
Topologies
• Define adjacency relationships among system resources
• Virtual topologies – Mapping of processes/threads onto application domain– Parallel algorithms often parameterized in terms of topology
• Physical topologies– Network structure
• Can be specified as a graph
• Very common case: Cartesian topologies
218
Topology analysis in KOJAK
• Idea: map performance data onto topology – Virtual or physical
• Record topological information in event trace
• Detect higher-level events related to the parallel algorithm
• Link occurrence of patterns to such higher-level events
• Visually expose correlations of performance problems with topological characteristics of affected processes
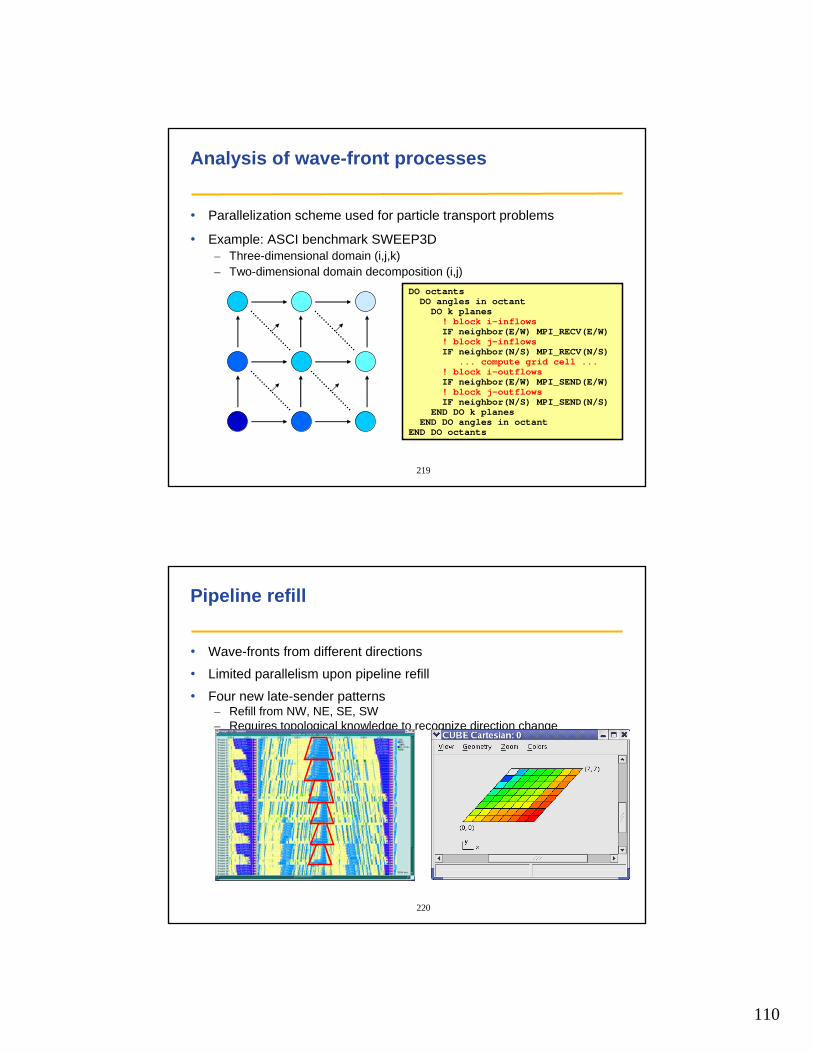
110
219
Analysis of wave-front processes
• Parallelization scheme used for particle transport problems
• Example: ASCI benchmark SWEEP3D– Three-dimensional domain (i,j,k)– Two-dimensional domain decomposition (i,j)
DO octantsDO angles in octantDO k planes! block i-inflowsIF neighbor(E/W) MPI_RECV(E/W)! block j-inflowsIF neighbor(N/S) MPI_RECV(N/S)
... compute grid cell ...! block i-outflowsIF neighbor(E/W) MPI_SEND(E/W)! block j-outflowsIF neighbor(N/S) MPI_SEND(N/S)
END DO k planesEND DO angles in octant
END DO octants
220
Pipeline refill
• Wave-fronts from different directions
• Limited parallelism upon pipeline refill
• Four new late-sender patterns– Refill from NW, NE, SE, SW– Requires topological knowledge to recognize direction change
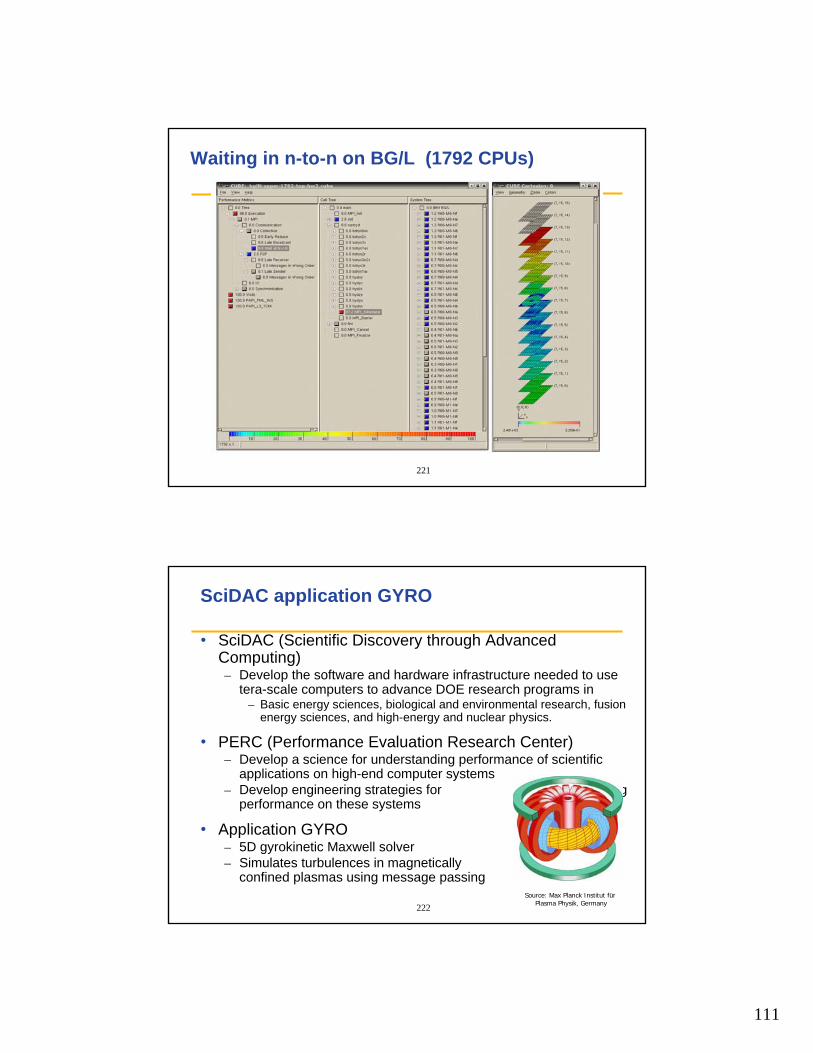
111
221
Waiting in n-to-n on BG/L (1792 CPUs)
222
SciDAC application GYRO
• SciDAC (Scientific Discovery through Advanced Computing) – Develop the software and hardware infrastructure needed to use
tera-scale computers to advance DOE research programs in – Basic energy sciences, biological and environmental research, fusion
energy sciences, and high-energy and nuclear physics.
• PERC (Performance Evaluation Research Center)– Develop a science for understanding performance of scientific
applications on high-end computer systems – Develop engineering strategies for improving
performance on these systems
• Application GYRO– 5D gyrokinetic Maxwell solver– Simulates turbulences in magnetically
confined plasmas using message passingSource: Max Planck Institut für
Plasma Physik, Germany
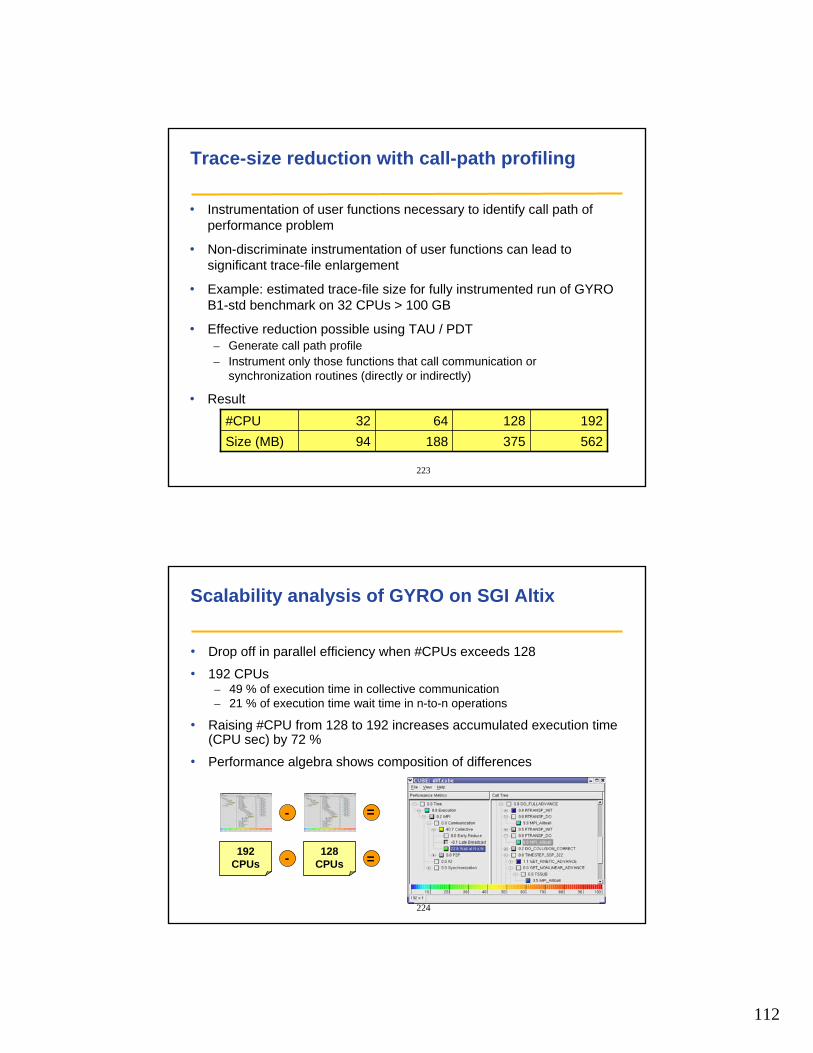
112
223
Trace-size reduction with call-path profiling
• Instrumentation of user functions necessary to identify call path of performance problem
• Non-discriminate instrumentation of user functions can lead to significant trace-file enlargement
• Example: estimated trace-file size for fully instrumented run of GYRO B1-std benchmark on 32 CPUs > 100 GB
• Effective reduction possible using TAU / PDT– Generate call path profile– Instrument only those functions that call communication or
synchronization routines (directly or indirectly)
• Result
56237518894Size (MB)1921286432#CPU
224
Scalability analysis of GYRO on SGI Altix
• Drop off in parallel efficiency when #CPUs exceeds 128
• 192 CPUs– 49 % of execution time in collective communication– 21 % of execution time wait time in n-to-n operations
• Raising #CPU from 128 to 192 increases accumulated execution time (CPU sec) by 72 %
• Performance algebra shows composition of differences
-
192CPUs
128CPUs-
=
=
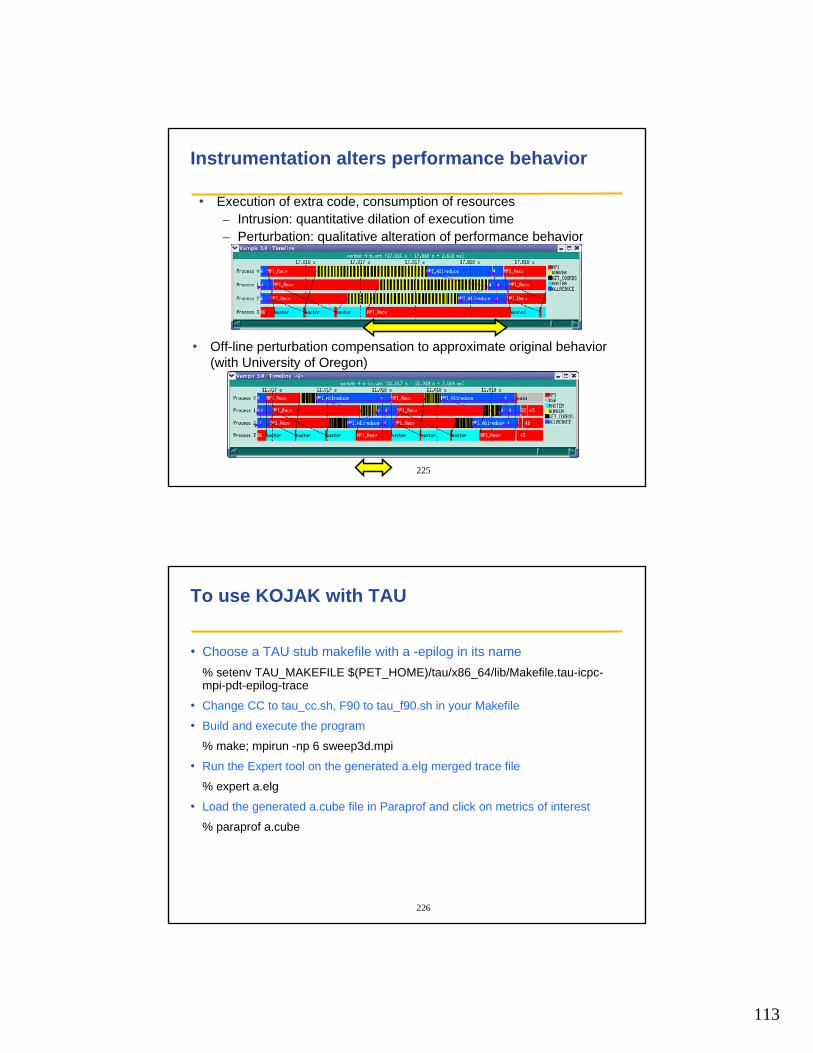
113
225
Instrumentation alters performance behavior
• Execution of extra code, consumption of resources– Intrusion: quantitative dilation of execution time – Perturbation: qualitative alteration of performance behavior
• Off-line perturbation compensation to approximate original behavior (with University of Oregon)
226
To use KOJAK with TAU
• Choose a TAU stub makefile with a -epilog in its name% setenv TAU_MAKEFILE $(PET_HOME)/tau/x86_64/lib/Makefile.tau-icpc-mpi-pdt-epilog-trace
• Change CC to tau_cc.sh, F90 to tau_f90.sh in your Makefile
• Build and execute the program
% make; mpirun -np 6 sweep3d.mpi
• Run the Expert tool on the generated a.elg merged trace file
% expert a.elg
• Load the generated a.cube file in Paraprof and click on metrics of interest
% paraprof a.cube
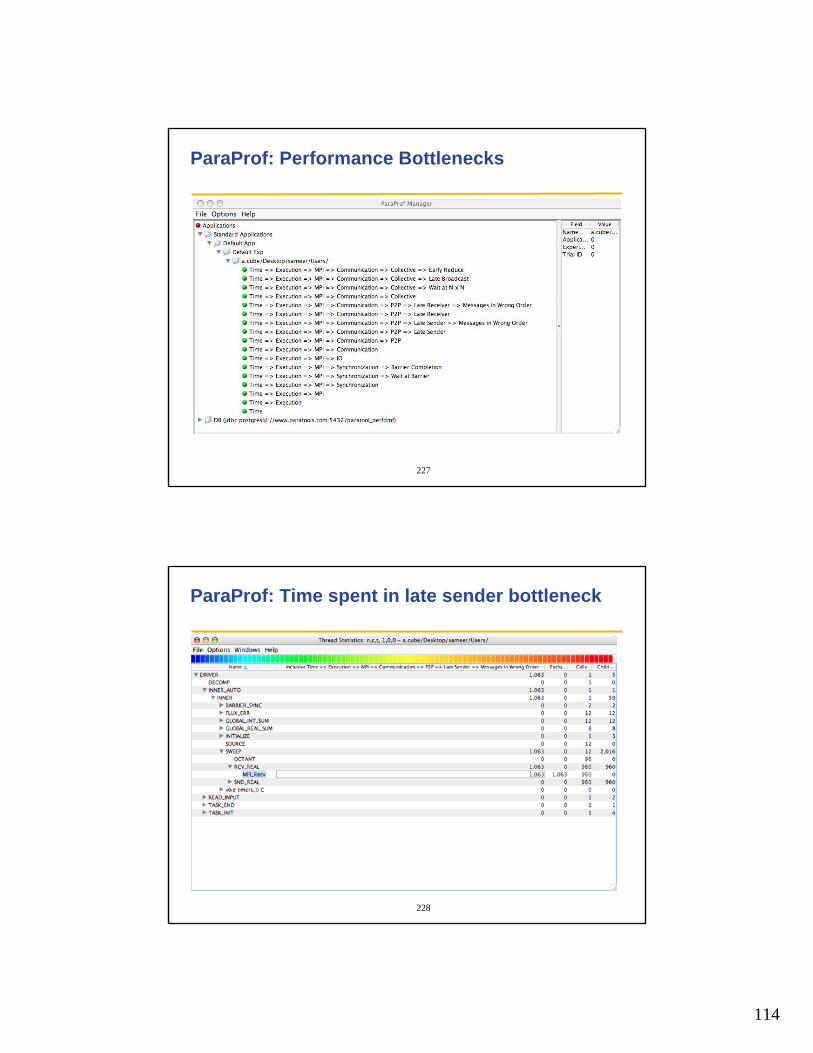
114
227
ParaProf: Performance Bottlenecks
228
ParaProf: Time spent in late sender bottleneck
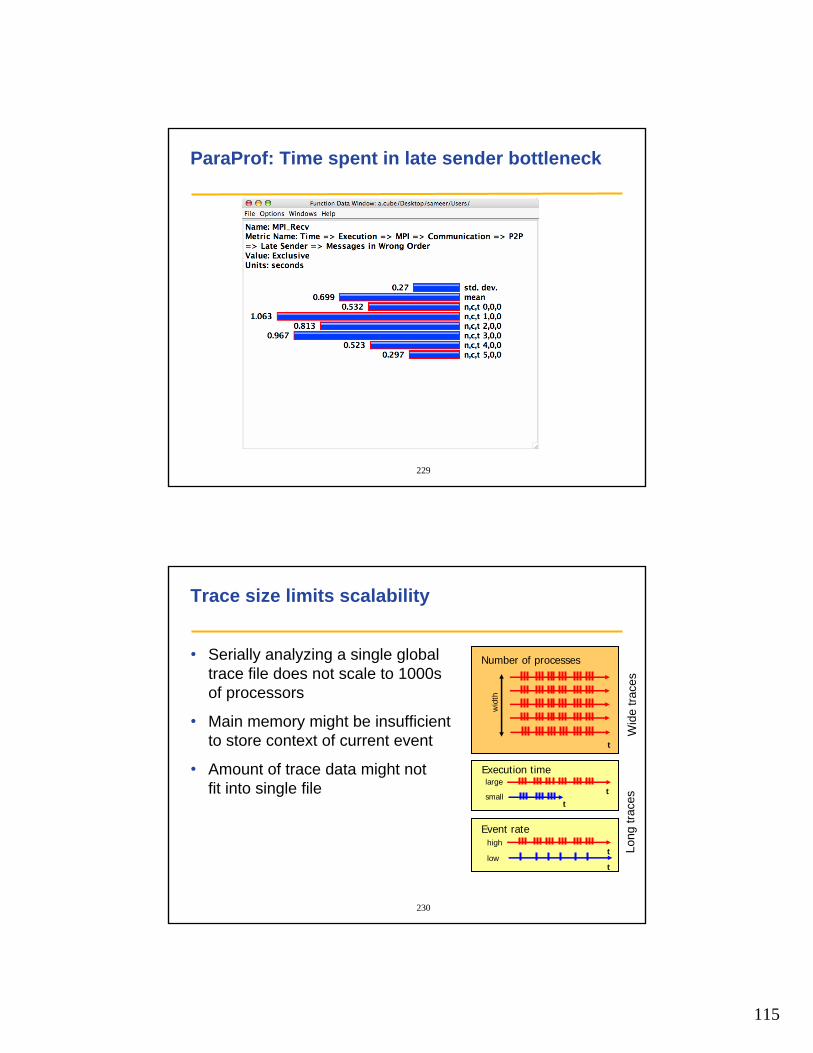
115
229
ParaProf: Time spent in late sender bottleneck
230
Trace size limits scalability
Execution time
tt
large
small
Event rate
t
t
high
low
Number of processes
t
wid
th
• Serially analyzing a single global trace file does not scale to 1000s of processors
• Main memory might be insufficient to store context of current event
• Amount of trace data might not fit into single file
Long
trac
esW
ide
trace
s
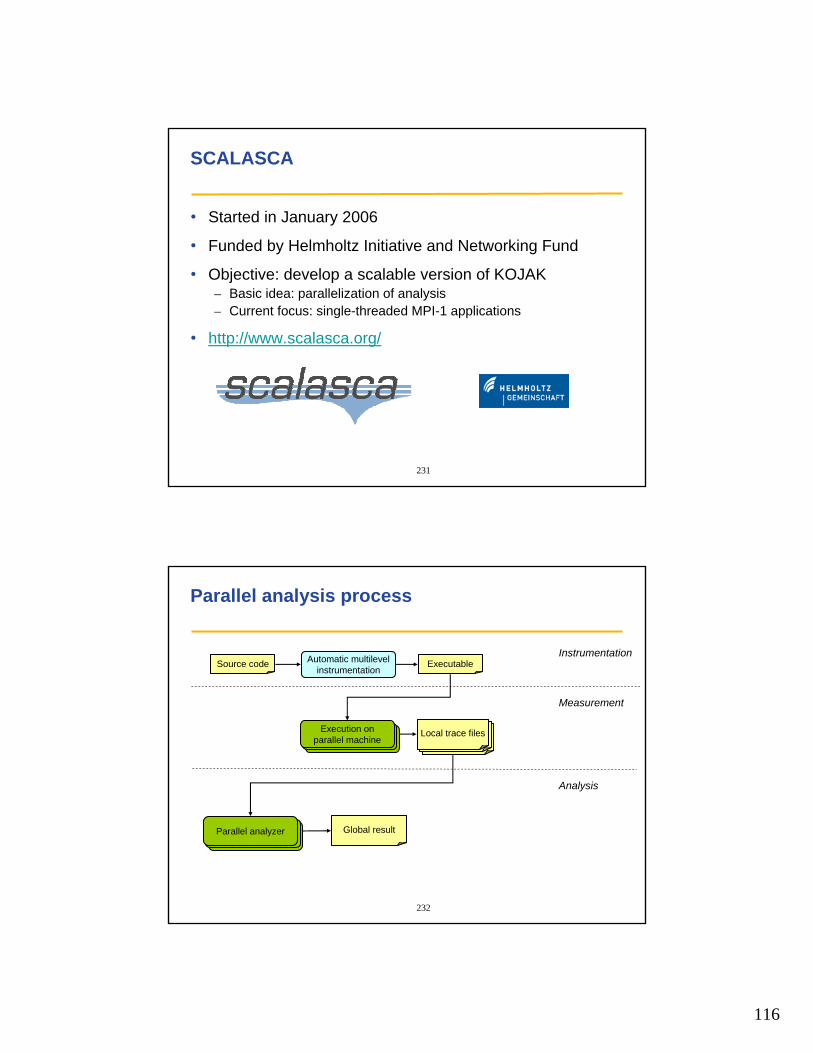
116
231
SCALASCA
• Started in January 2006
• Funded by Helmholtz Initiative and Networking Fund
• Objective: develop a scalable version of KOJAK– Basic idea: parallelization of analysis– Current focus: single-threaded MPI-1 applications
• http://www.scalasca.org/
232
Parallel analysis process
Global resultParallel analyzer
Source code Automatic multilevelinstrumentation
Executable
Execution onparallel machine
Local trace files
Instrumentation
Measurement
Analysis
117
233
Parallel pattern analysis
• Analyze separate local trace files in parallel– Exploit distributed memory and processing capabilities– Often allows keeping whole trace in main memory
• Parallel replay of target application‘s communication behavior– Analyze communication with an operation of the same type– Traverse local traces in parallel– Exchange data at synchronization points of target application
234
Parallel abstraction mechanisms
• Efficient performance-transparent random access– Local traces kept in main memory– (Generous) limit for amount of local trace data– Different data structures for event storage
– Linear list, complete call graph (CCG)
• Higher-level abstractions– Local execution state– Local pointer attributes (can point backward & forward)
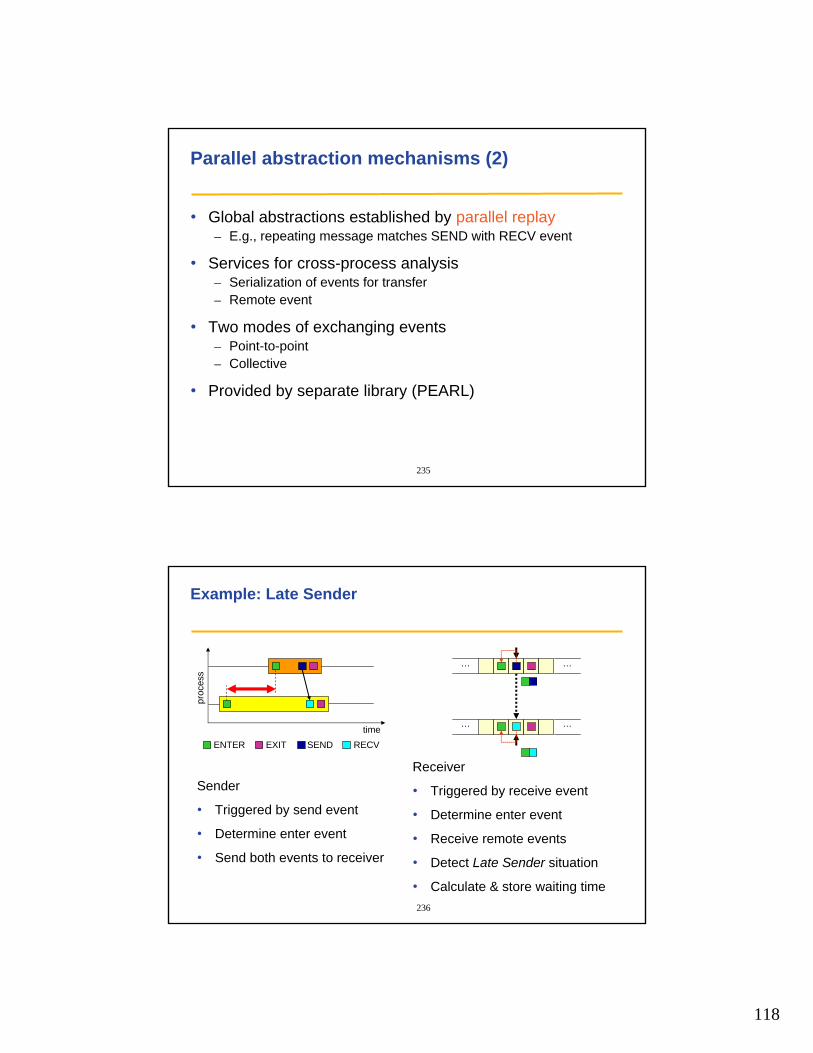
118
235
Parallel abstraction mechanisms (2)
• Global abstractions established by parallel replay– E.g., repeating message matches SEND with RECV event
• Services for cross-process analysis– Serialization of events for transfer– Remote event
• Two modes of exchanging events– Point-to-point– Collective
• Provided by separate library (PEARL)
236
Example: Late Sender
Sender
• Triggered by send event
• Determine enter event
• Send both events to receiver
Receiver
• Triggered by receive event
• Determine enter event
• Receive remote events
• Detect Late Sender situation
• Calculate & store waiting time
time
proc
ess
ENTER EXIT SEND RECV
… …
… …
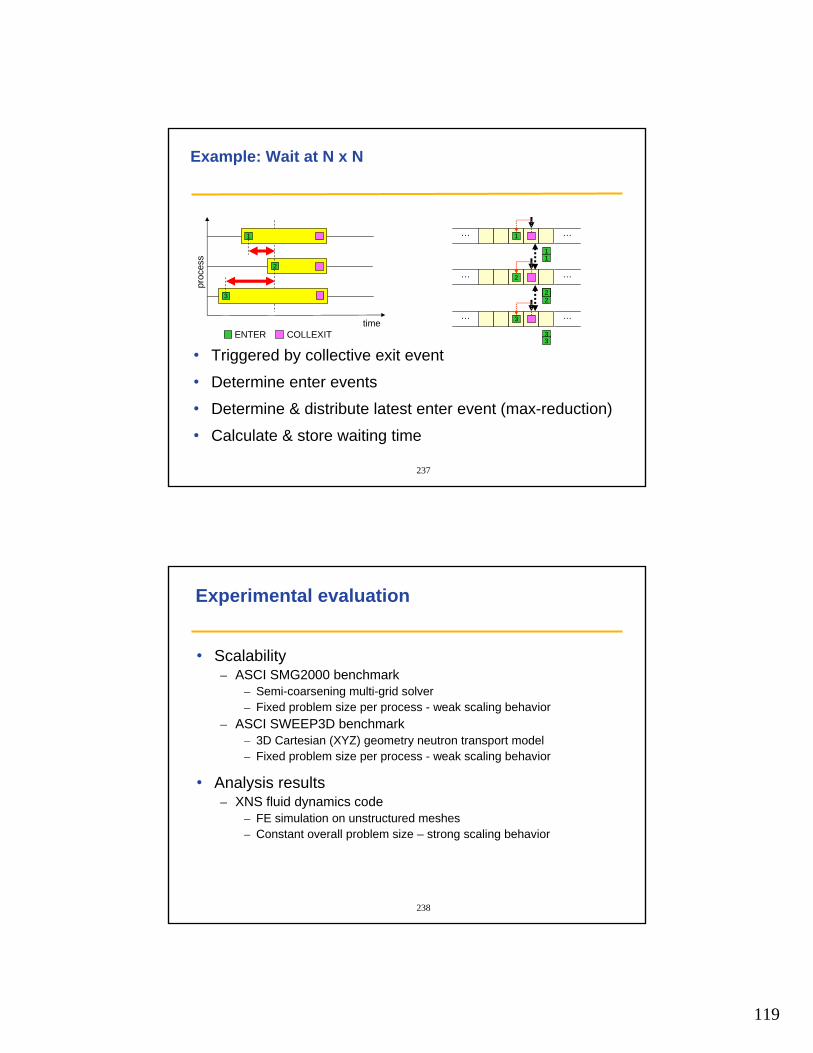
119
237
Example: Wait at N x N
• Triggered by collective exit event
• Determine enter events
• Determine & distribute latest enter event (max-reduction)
• Calculate & store waiting time
time
proc
ess
ENTER COLLEXIT
2
1 1… …
3… …
2… …
1
2
3
22
1
2
3
3
238
Experimental evaluation
• Scalability– ASCI SMG2000 benchmark
– Semi-coarsening multi-grid solver– Fixed problem size per process - weak scaling behavior
– ASCI SWEEP3D benchmark– 3D Cartesian (XYZ) geometry neutron transport model – Fixed problem size per process - weak scaling behavior
• Analysis results– XNS fluid dynamics code
– FE simulation on unstructured meshes– Constant overall problem size – strong scaling behavior
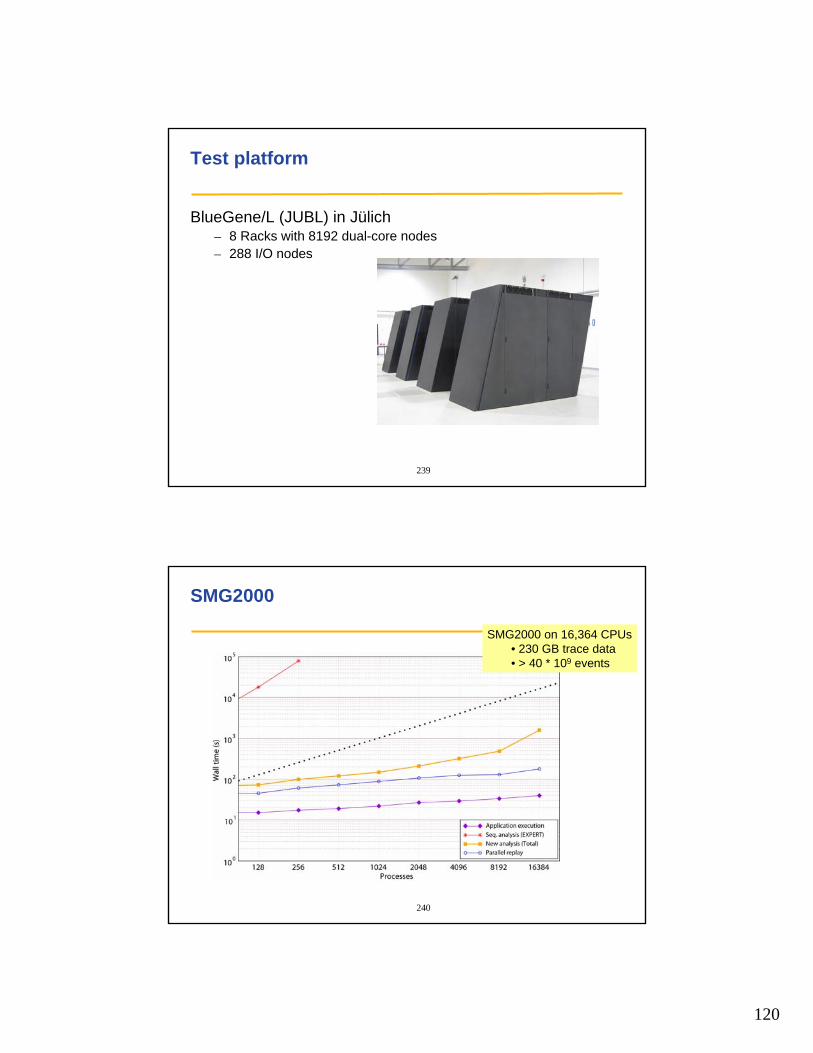
120
239
Test platform
BlueGene/L (JUBL) in Jülich– 8 Racks with 8192 dual-core nodes– 288 I/O nodes
240
SMG2000
SMG2000 on 16,364 CPUs• 230 GB trace data• > 40 * 109 events
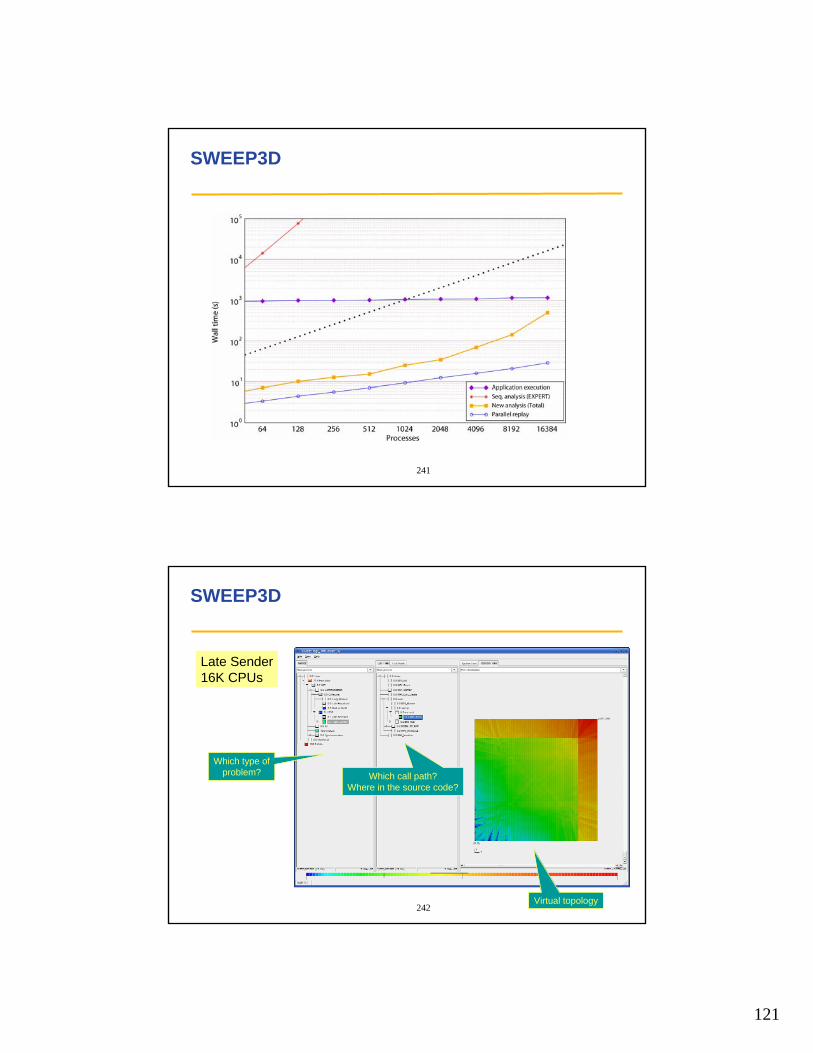
121
241
SWEEP3D
242
SWEEP3D
Late Sender16K CPUs
Which type ofproblem? Which call path?
Where in the source code?
Virtual topology
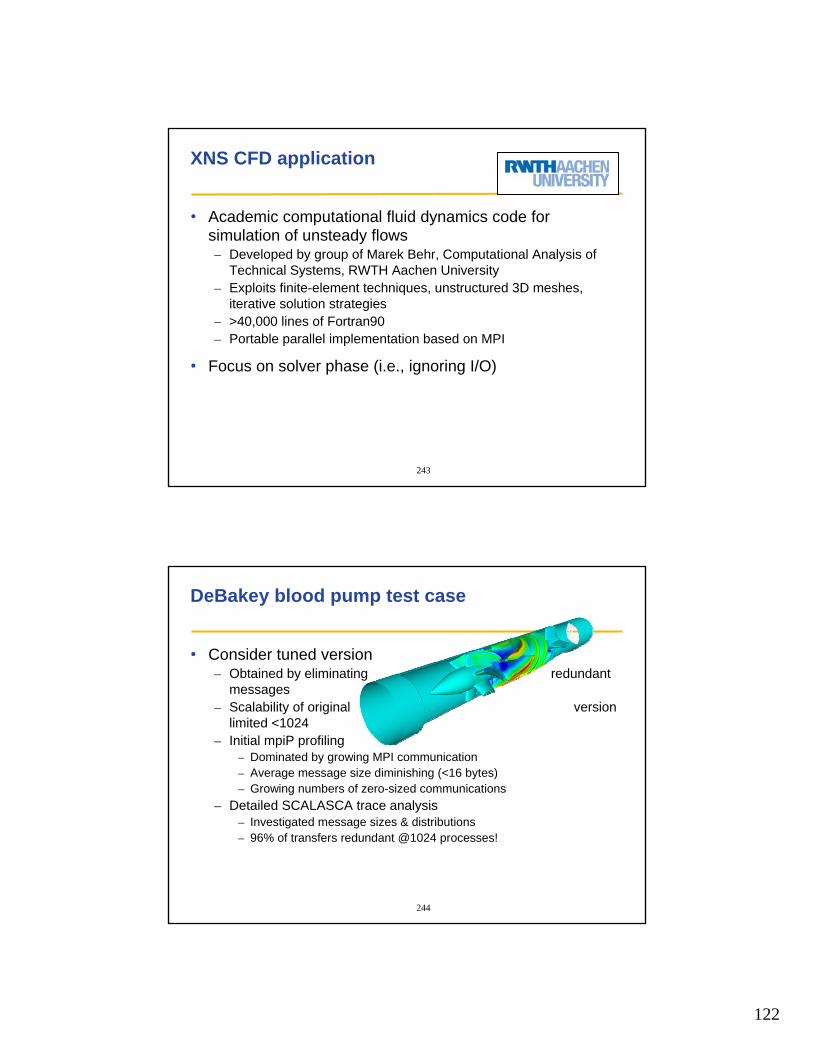
122
243
XNS CFD application
• Academic computational fluid dynamics code for simulation of unsteady flows– Developed by group of Marek Behr, Computational Analysis of
Technical Systems, RWTH Aachen University– Exploits finite-element techniques, unstructured 3D meshes,
iterative solution strategies– >40,000 lines of Fortran90– Portable parallel implementation based on MPI
• Focus on solver phase (i.e., ignoring I/O)
244
DeBakey blood pump test case
• Consider tuned version– Obtained by eliminating redundant
messages– Scalability of original version
limited <1024– Initial mpiP profiling
– Dominated by growing MPI communication– Average message size diminishing (<16 bytes)– Growing numbers of zero-sized communications
– Detailed SCALASCA trace analysis– Investigated message sizes & distributions– 96% of transfers redundant @1024 processes!
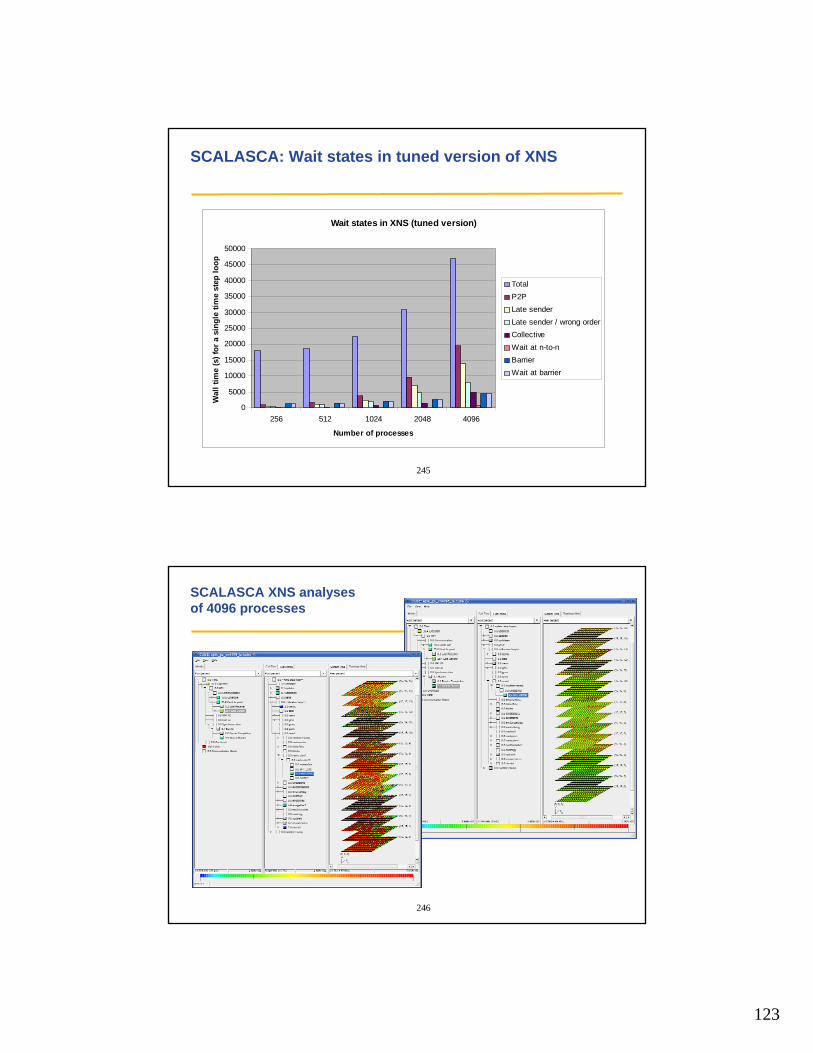
123
245
SCALASCA: Wait states in tuned version of XNS
Wait states in XNS (tuned version)
0
5000
10000
15000
20000
25000
30000
35000
40000
45000
50000
256 512 1024 2048 4096
Number of processes
Wal
l tim
e (s
) for
a s
ingl
e tim
e st
ep lo
op
TotalP2PLate senderLate sender / wrong orderCollectiveWait at n-to-nBarrierWait at barrier
246
SCALASCA XNS analyses of 4096 processes
124
247
Conclusion
• Wait states addressed by our analysis can be a significant performance problem – especially at larger scales
• Scalability of the analysis can be addressed by parallelization– Process local trace files in parallel– Replay target applications communication behavior
• Promising results with prototype implementations– Analysis scales up to 16,384 processes– Enables analyzing traces of previously impractical size
248
Scalasca Future Work
• Reduce number of events per process (trace length)– Selective tracing– Eliminate redundancy
• Find causes of wait states– Derive hypotheses from measurements– Validate hypotheses using simulation
• Extend (scalable) approach to other programming models– Shared memory– Partitioned global address space languages
– MPI-RMA, UPC
125
249
Technology preview release
• SCALASCA Version 0.5
• Tested on the following platforms– IBM Blue Gene/L– Cray XT3– IBM p690 clusters– SGI Altix– Sunfire clusters
• Download from:– http://www.scalasca.org
• If you need installation support, please contact:– [email protected]
250
Performance Tool Current and Future Work
• Development of a flexible, modular open-source performance analysis framework based on PAPI, TAU, and KOJAK (illustrated on the next slide)
• Extension of PAPI to off-processor counters and sensors (e.g., network counters, memory controllers, accelerators, and temperature sensors)
• Perfmon2 access to hardware counters on Linux/x86 systems, integration of Perfmon2 with Linux kernel to eliminate need for kernel patch
• Extension of TAU I/O instrumentation and analysis
• Definition of new KOJAK patterns for detecting inefficient program behavior– Based on hardware counter metrics (including derived metrics) and loop-
level profile data– Architecture-specific patterns – e.g., topology-based– Use of off-processor counter and sensor data
• Distributed trace file analysis
• Support new languages and parallel programming paradigms
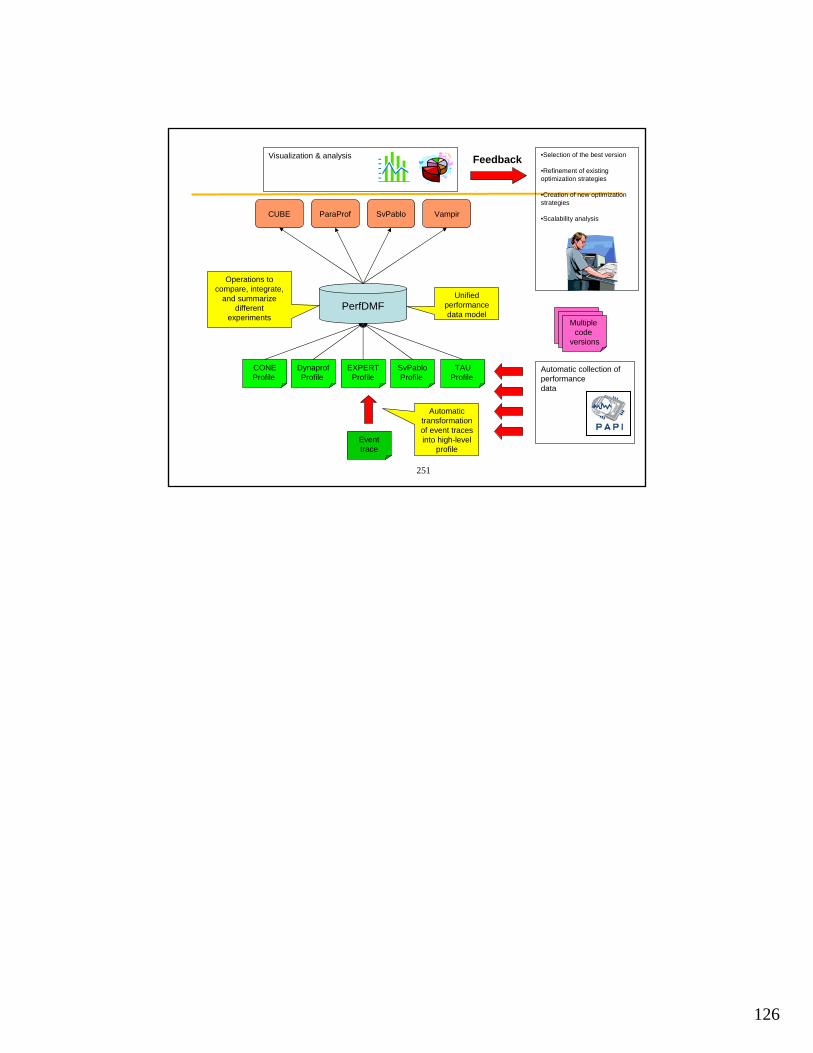
126
251
Automatic collection of performancedata
•Selection of the best version
•Refinement of existing optimization strategies
•Creation of new optimization strategies
•Scalability analysis
PerfDMFUnified
performance data model
EXPERTProfile
Operations to compare, integrate,
and summarize different
experiments
DynaprofProfile
TAUProfile
SvPabloProfile
CONEProfile
Eventtrace
Automatic transformation of event traces into high-level
profile
SvPabloCUBE ParaProf Vampir
Visualization & analysis
Multiple code
versions
Feedback