Embed Size (px)
Citation preview

Parallel Execution Time Profiles
Abstract Tracing Parallel Execution introduces a few interesting challenges when creating a response time profile. This paper looks at some of the main difficulties and uses both Oracle and Operating System trace utilities to attempt to build a more usable profile.
Introduction Oracle's Parallel Execution (PX) functionality (sometimes known as Parallel Query or simply parallelism), can improve the performance of long-running tasks by dividing the workload of a single task between multiple slave processes that can run concurrently and use multi-CPU servers effectively. The Oracle Data Warehousing Guide [1] contains detailed information on the configuration and use of PX and I've written about some of the practicalities in the past [2,4], but in this paper I'm going to concentrate on tracing applications that use PX and the difficulty of proving where time is being lost because of system resource bottlenecks.
The most obvious challenge when building a response time profile for a task that uses PX is that more than one process needs to be included.
One trace file for the Query Coordinator (QC) in user_dump_dest
One trace file for each PX slave in background_dump_dest
For example, for a parallel query statement that uses a Degree of Parallelism (DOP) of two and two sets of slaves, there will be a total of five trace files containing the timing information of interest.
There are two distinct approaches that we could take :-
Profile a single slave at a time.
Profile the entire job
At first sight, the latter approach seems the obvious choice, not least because it's the response time of the entire job that interests the end user. Who cares if three of four PX slaves perform well, if the fourth performs poorly and delays task completion? From the user's perspective, the response time is still poor.
Let's look at profiling the entire job.
PX Tracing Approach Tracing jobs that use PX is complicated by the fact that several processes co-operate to complete a single task. Well, the tracing itself isn't too difficult because if you enable tracing for the relevant session (or QC) then trace files will be generated automatically for the slaves too. However, now that you have multiple trace files in different directories, how do you build a single response time profile for the entire job?
Another problem is that because the PX slaves are background processes and can be reused by different SQL statements from different sessions at different times, how do we ensure that we only include information relevant to the task we're profiling? This is a variation on the well known difficulty with tracing applications that use connection pools [3].
In recognition of these difficulties, Oracle 10g introduced the trcsess utility that mines multiple trace files for the information relevant to a specific session, as identified by calling the DBMS_SESSION.SET_IDENTIFIER procedure [4]. This will generate a single consolidated file containing all of the relevant lines from the list of trace files that you supply.
You can see this approach being used in the session.sh script (see Appendix A). I've extracted the key
DRAFT Page 1 5th March 2007

lines here, with additional comments. (Note that $SESSION and $DOP are environment variables defined in the surrounding shell script.)
# Set the session identifier. Session identification lines will be # emitted in trace output exec dbms_session.set_identifier('${SESSION}_${DOP}'); # Enable Tracing exec dbms_monitor.client_id_trace_enable(client_id => '${SESSION}_${DOP}'); # CODE GOES HERE # Disable Tracing exec dbms_monitor.client_id_trace_disable(client_id => '${SESSION}_${DOP}'); # Run trcsess across all trace files in user_dump_dest and # background_dump_dest, consolidating information for our clientid # into the single consolidated trace file - ${SESSION}_${DOP}.trc trcsess output="${SESSION}_${DOP}.trc" clientid="${SESSION}_${DOP}" /oracle/admin/TEST1020/udump/*.trc /oracle/admin/TEST1020/bdump/*.trc # Run tkprof against the resulting trace file tkprof ${SESSION}_${DOP}.trc ${SESSION}_${DOP}.out sort=prsela,fchela,exeela
These steps will generate a consolidated trace file that contains all of the events relevant to the task being analysed and a simple response time profile created using tkprof. (tkprof might not be the best tool for the job – something like the Hotsos Profiler or Orasrp should be better - but it's available on all Oracle systems). 'Job done', you might say, but difficulties become apparent when you start to review this profile.
Challenges There are a number of challenges that arise when creating a consolidated response time profile for applications that use PX.
More Time
More Variation
More Wait Events
More Lost Time
More Time Consolidating the trace files seems like a great idea, but introduces a new twist that can be difficult to recognise when first encountered. An example should help.
This is a basic tkprof summary generated from the trcsess output of a parallel query using a DOP of two and two sets of slaves (indicated by the Parse, Execute and Fetch counts) that took 13.56 seconds to run according to the clock on the wall.
call count cpu elapsed
DRAFT Page 2 3rd March 2007

------- ------ -------- ---------- Parse 5 0.01 0.02 Execute 5 12.98 51.57 Fetch 2 0.01 12.81 ------- ------ -------- ---------- total 12 13.01 64.41
How can the elapsed time be so high, relative to the wall clock time? How can we have more time? There must be a problem. Well it's not really that there's more time, but that we're viewing the total time recorded for multiple processes that ran concurrently.
When tracing the activities of several concurrent processes, there is more CPU time and more wait time available. For example on a four CPU server, four PX slaves may be accumulating CPU time in their individual trace files (whilst running on the four different CPUs) during the same period of real time. To complicate the picture further, there will be other PX slaves that are in a wait state. They might be waiting for other slaves to return results or request new work or waiting in the run queue for their turn on the CPU.
When Oracle is tracing the processes, it will count all of the CPU, Wait and Elapsed time for all of the processes in their separate trace files. Once we consolidate the contents of multiple trace files, the total elapsed time available (as far as Oracle is concerned) is multiplied by the number of processes that are running and the total CPU time available is multiplied by the number of CPUs. (This is a simplification, but a useful one at this stage.)
More Variation Here is another tkprof summary for an identical SQL statement, executed on the same system a little later.
call count cpu elapsed ------- ------ -------- ---------- Parse 33 0.03 0.16 Execute 33 13.42 430.24 Fetch 2 0.02 12.28 ------- ------ -------- ---------- total 68 13.48 442.69
The elapsed time has increased to 442 seconds! (In fact, the time taken to complete the statement has only increased by a second or two, according to the wall clock I checked.) By now, you may be able to work out the reason, particularly if you take into account the values in the 'count' column. The statement used a different DOP this time - 16. This might not be such a challenge were it not for the fact that the actual DOP used can change very easily between executions for a couple of common reasons
Insufficient PX slaves are available to satisfy the requested DOP.
The actual DOP used is lower than that requested because the server is using parallel_adaptive_multi_user=true and Oracle has limited the DOP for this query.
Perhaps a profile based on a consolidated trace file doesn't appear such a good idea now? It's easier than wading through many raw trace files but reduces the level of detail. It also results in a less than intuitive response time profile if you process the results through tkprof or another profiler, unless you account for the DOP. When tracing PX tasks and consolidating the resultant trace files, you should always be aware of the actual DOP used and the number of trace files that have been consolidated. More Wait Events A task that is executed by multiple processes running concurrently will normally include synchronisation activity because the processes need to communicate with each other. For example,
DRAFT Page 3 5th March 2007

when a slave has requested data to sort, from other slaves that are reading the data, it has to wait for the data to arrive.
Event 10046 trace files for PX slaves include many of these synchronisation events, some of which are described in Metalink Note 119103 and one of my previous papers[2]. The event name is generally prefixed by 'PX', as shown in this snippet of tkprof output.
Elapsed times include waiting on following events: Event waited on Times Max. Wait Total Waited ---------------------------------------- Waited ---------- ------------ latch free 23 25.34 43.34 os thread startup 62 1.84 44.90 PX Deq: Join ACK 21 0.00 0.07 PX Deq: Parse Reply 14 0.13 0.35 PX Deq Credit: send blkd 1927 1.96 224.84 PX qref latch 4 0.00 0.00 SQL*Net message to client 9 0.00 0.00 PX Deq: Execute Reply 503 0.30 17.90 PX Deq: Execution Msg 571 0.95 52.97 PX Deq: Msg Fragment 16 0.00 0.02 PX Deq Credit: need buffer 102 1.36 10.74 PX Deq: Table Q Normal 2693 0.50 103.49 PX Deq: Table Q Sample 16 0.04 0.54 PX Deq: Table Q Get Keys 14 0.09 0.79 PX Deq: Table Q qref 3 0.00 0.00 SQL*Net message from client 9 0.00 0.01 PX Deq: Signal ACK 20 0.09 0.21 enq: PS - contention 1 0.00 0.00
Not only are there more wait events to include in any response time profile, but the majority are 'idle waits'. For example, one of the most common events in PX-related trace files, with the highest wait times, is "PX Deq: Execute Reply" (Metalink Note 270916). This event represents time spent waiting for slaves to complete their allocated work and return results, which is normal and unavoidable behaviour.
However, if some of the slaves in the other slave set are suffering from bottlenecks, this will also be reflected in an increase in wait time for this 'idle' event for the slaves that are waiting for data, so time recorded against these events could be an indication of problems elsewhere.
More Lost Time The final challenge I'll discuss here is the one that I'll concentrate on for the rest of this paper.
Because using PX multiplies the number of active processes on a server significantly, it is likely that time spent in the O/S run queue, ready but waiting to run, will be a more significant contributor to response time than if the same application was single-threaded. I've worked on several production servers where the first indication that someone was using PX (when they probably shouldn't be) was a long run queue and users reporting slow response times.
Put simply, if there are more active process threads than there are CPUs then the O/S must schedule their execution so that each gets a fair share. A natural effect of this scheduling activity is timing gaps in Oracle trace files caused by the Oracle processes being pre-empted by the O/S. If the kernel decides to stop a PX slave from executing so that another process can take over the CPU, the interrupted slave will not have the opportunity to record it's time until it is running again.
Cary Millsap and Jeff Holt give a very clear explanation of this problem in Optimizing Oracle Performance [5] in the section 'Time spent not executing' [pp. 170-173] and I enjoyed this description.
"It's as if the process has been conked on the head and then awoken, with no way to account for the time spent out of consciousness"
In fact the book discusses several reasons why gaps in timing data might appear in a trace file,
DRAFT Page 4 3rd March 2007
including un-instrumented code and quantisation error, but I'm going to focus on time stuck in the run queue.
In most tuning exercises, unaccounted-for time is a tiny fraction of the overall response time which is why it can often be disregarded. If there's a little quantisation error or a small section of un-instrumented code, it's unlikely that this will be the most significant response time factor. However, an overloaded server will lead to an increase in unaccounted-for time caused by process pre-emption and this can become the largest contributor to a response time profile.
For our purpose, the important thing to note here is that there is no way for Oracle to record this lost time. It is a normal application that has been stopped temporarily and kernel scheduling interrupts have a higher priority.
Testing Pre-emption Designing a test to induce unaccounted-for time in Oracle trace files is not difficult because the DOP can be increased until there are more slaves than the server's CPU resource can satisfy. Perhaps the main consideration is ensuring that the test is CPU-intensive and not limited by other factors, notably I/O bottlenecks.
Environment All examples were executed on the following system configuration
Oracle Version 10.2.0.2
Operating System SunOS 5.10 Generic_118855-14
CPU 1 x Intel Xeon 700MHz
Memory 3.5GB RAM Storage 4 x 32GB Seagate Cheetah SCSI Ultra 160 in software RAID-0 (2Mb
stripe) configuration and a separate SCSI-U160 on the same SCSI controller, containing the O/S and Oracle software.
(Note that although the server has four CPUs, I disabled all but one of them in an attempt to induce CPU overload, using the Solaris psradm command. A side effect of this is that you could run the same tests on a single-CPU home PC and compare results.)
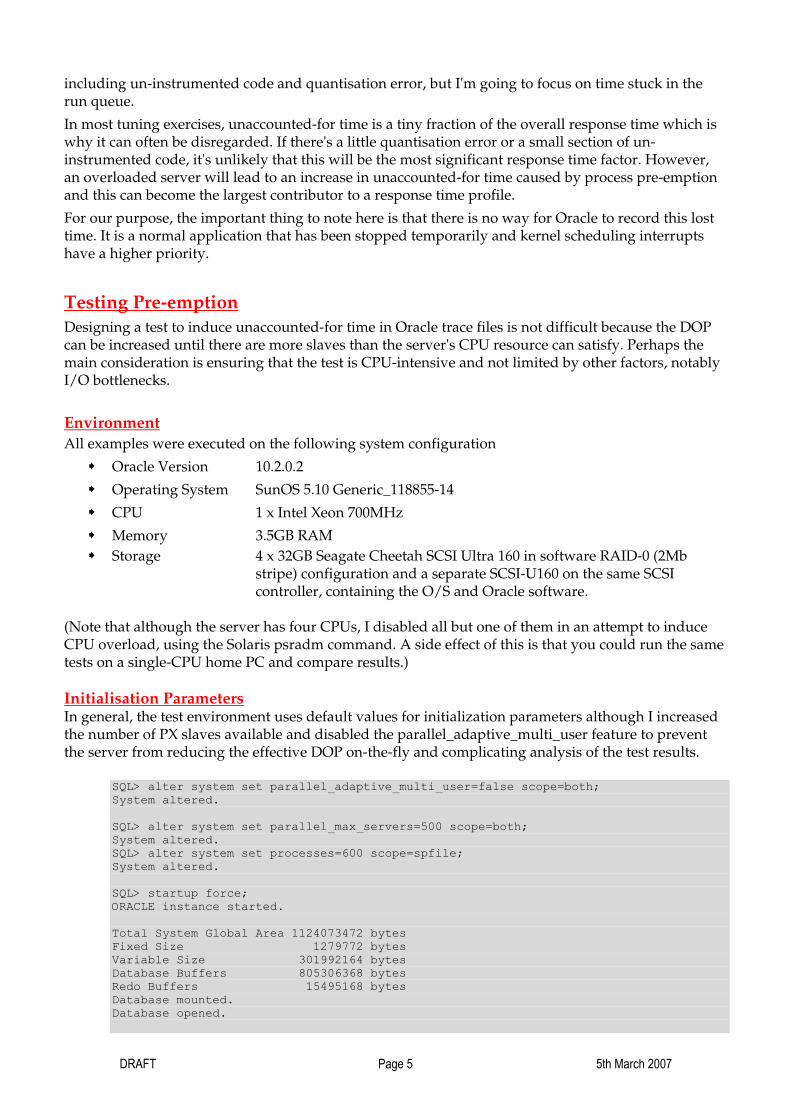
Initialisation Parameters In general, the test environment uses default values for initialization parameters although I increased the number of PX slaves available and disabled the parallel_adaptive_multi_user feature to prevent the server from reducing the effective DOP on-the-fly and complicating analysis of the test results.
SQL> alter system set parallel_adaptive_multi_user=false scope=both; System altered. SQL> alter system set parallel_max_servers=500 scope=both; System altered. SQL> alter system set processes=600 scope=spfile; System altered. SQL> startup force; ORACLE instance started. Total System Global Area 1124073472 bytes Fixed Size 1279772 bytes Variable Size 301992164 bytes Database Buffers 805306368 bytes Redo Buffers 15495168 bytes Database mounted. Database opened.
DRAFT Page 5 5th March 2007

SQL> select name, value from v$parameter where ISDEFAULT='FALSE' order by name; NAME VALUE ----------------------------- -------------------------------------------------- audit_file_dest /oracle/admin/TEST1020/adump background_dump_dest /oracle/admin/TEST1020/bdump compatible 10.2.0.2.0 control_files /export/home/oracle/oradata/TEST1020/control01.ctl core_dump_dest /oracle/admin/TEST1020/cdump db_block_size 8192 db_domain db_file_multiblock_read_count 16 db_name TEST1020 db_recovery_file_dest /oracle/flash_recovery_area db_recovery_file_dest_size 2147483648 dispatchers (PROTOCOL=TCP) (SERVICE=TEST1020XDB) job_queue_processes 10 open_cursors 300 parallel_adaptive_multi_user FALSE parallel_max_servers 500 pga_aggregate_target 374341632 processes 600 remote_login_passwordfile EXCLUSIVE sga_target 1124073472 undo_management AUTO undo_tablespace UNDOTBS1 user_dump_dest /oracle/admin/TEST1020/udump 23 rows selected. SQL> show parameters parallel NAME TYPE VALUE ------------------------------------ ----------- ------------------------------ fast_start_parallel_rollback string LOW parallel_adaptive_multi_user boolean FALSE parallel_automatic_tuning boolean FALSE parallel_execution_message_size integer 2148 parallel_instance_group string parallel_max_servers integer 500 parallel_min_percent integer 0 parallel_min_servers integer 0 parallel_server boolean FALSE parallel_server_instances integer 1 parallel_threads_per_cpu integer 2 recovery_parallelism integer 0 SQL> select NVL(pool, name), sum(bytes)/1024/1024 MB 2 from v$sgastat 3 group by NVL(pool, name); NVL(POOL,NAME) MB -------------------------- -------- java pool 16 fixed_sga 1 log_buffer 15 shared pool 240 large pool 32 buffer_cache 768
Schema Objects The test schema is created using two scripts (see Appendix A for full listings).
SETUP.SQL – Creates the test user account and tablespace.
SETUP2.SQL – Creates 10 identical simple tables to be used by the test queries. The tables consist on two columns – a surrogate primary key populated using one sequence per table and a repeating numeric column holding the values 0-9. Note that there are no integrity constraints or indexes on the tables.
DRAFT Page 6 3rd March 2007

SQL> desc test_tab1 Name Null? Type ----------------------------------------- -------- ---------------------------- PK_ID NUMBER NUM_CODE NUMBER SQL> select * from test_tab1 where rownum < 25; PK_ID NUM_CODE ---------- ---------- 1 1 2 2 3 3 4 4 5 5 6 6 7 7 8 8 9 9 10 0 11 1 12 2 13 3 14 4 15 5 16 6 17 7 18 8 19 9 20 0 21 1 22 2 23 3 24 4 24 rows selected. testuser@TEST1020> select table_name, num_rows from user_tables; TABLE_NAME NUM_ROWS ------------------------------ ---------------------- TEST_TAB2 1016600 TEST_TAB10 1009300 TEST_TAB3 1035200 TEST_TAB4 1040400 TEST_TAB5 1019900 TEST_TAB6 1034600 TEST_TAB7 1015100 TEST_TAB8 1041200 TEST_TAB9 1004900 TEST_TAB1 1024800 10 rows selected. testuser@TEST1020> select segment_name, bytes/1024/1024 MB from user_segments; SEGMENT_NAME MB -------------------------------- ---------------------- TEST_TAB2 32 TEST_TAB8 32 TEST_TAB7 32 TEST_TAB6 32 TEST_TAB5 32 TEST_TAB4 32 TEST_TAB10 32 TEST_TAB3 32 TEST_TAB9 32 TEST_TAB1 32 10 rows selected.
DRAFT Page 7 5th March 2007

These small tables (< 32MB and only 1 million rows) are not good candidates for parallel queries; are unlikely to cause significant performance problems and aren't intended to reflect real world applications. My primary intention is that they be small enough to be able to run the tests quickly and minimise the output of the diagnostic tools. I've used Optimiser hints to force the use of parallel query.
Tests The query used for testing need not be complex either. I based it on queries used in a previous paper [4] with one significant difference. To ensure that an I/O bottleneck doesn't create a problem (unlikely with such small tables), I've used the CACHE hint to cache the tables in the database buffer cache. This is 'a bit of a cheat' really, but serves my purpose. In practice, I/O waits may have been eliminated but there was a related increase in latch waits.
Here is the query.
SELECT /*+ parallel(tt1, $DOP cache(tt1) ) parallel(tt2, $DOP) cache(tt2) */ MOD(tt1.pk_id + tt2.pk_id, 113), COUNT(*)
FROM test_tab$TABLE1 tt1, test_tab$TABLE2 tt2 WHERE tt1.pk_id = tt2.pk_id GROUP BY MOD(tt1.pk_id + tt2.pk_id ,113) ORDER BY MOD(tt1.pk_id + tt2.pk_id ,113);
Note that $DOP is an environment variable containing the DOP I've specified and $TABLE1 and $TABLE2 are two of the test tables, which are joined and the results aggregated into 113 groups.
The SQL statement is run via a harness script, session.sh, which
Enables Autotrace
Enables Event tracing using DBMS_SESSION, as described earlier
Runs the query for the table requested, plus the table with the next greatest number (e.g. TEST_TAB1 and TEST_TAB2; or TEST_TAB4 and TEST_TAB5.)
Runs a couple of dictionary queries to confirm PX was used
Disables tracing
Runs trcsess to consolidate the trace files
Runs tkprof against the consolidated trace file.
The session.sh script is then called by an even simpler outer test harness, sym07.sh, that runs session.sh five times for different pairs of tables, to simulate five users running the same query against different tables. The tests took between one and two minutes to run, for a range of DOPs from 2 to 16. (Appendix B includes an example log from one session to illustrate the information that was gathered during the tests.)
After experimenting with different DOPS, I settled on 2, for a couple of reasons :-
Five concurrent sessions, even using the minimum DOP of 2, were capable of overloading this single CPU server.
o i.e. DOP (= 2) * Slave Sets (= 2) + Query Co-ordinator (= 1) = 5 processes per session. 5 processes * 5 sessions = 25 processes.
Using a smaller number of slaves makes it easier to differentiate between the actions of the slave sets when showing example output from monitoring tools. This will become clearer in later sections.
DRAFT Page 8 3rd March 2007

Measuring Pre-emption Having explained that a 10046 trace file can suggest pre-emption, but not prove it, (because there are a few possible causes of unaccounted-for time) how can we prove that this is the root cause? There are several methods of varying accuracy and complexity that you might use. Note that I will concentrate on tools that are available using Oracle 10.2 running on Solaris 10, but some of the tools are available on other platforms and the underlying principles remain the same.
Oracle Tools One method for measuring pre-emption is to assume that a large percentage of unaccounted-for time is likely to be the result. The evidence is only circumstantial but, as Oracle can't record time spent waiting but ready to run directly, this has been the only realistic option in the past when using Oracle tools exclusively. 10046 event tracing plus the use of o/s monitoring tools that I'll describe later is the approach I have used myself in the past.
Oracle 10.1 introduced a new monitoring view, however – V$_OSSTAT – which exposes statistics gathered by o/s mechanisms.
SQL> select * from v$osstat; STAT_NAME VALUE OSSTAT_ID -------------------------------- ---------- ---------- NUM_CPUS 1 0 IDLE_TIME 3308610 1 BUSY_TIME 410968 2 USER_TIME 220220 3 SYS_TIME 190748 4 IOWAIT_TIME 0 5 AVG_IDLE_TIME 1503417 7 AVG_BUSY_TIME 251606 8 AVG_USER_TIME 136168 9 AVG_SYS_TIME 115276 10 AVG_IOWAIT_TIME 0 11 OS_CPU_WAIT_TIME 12652900 13 RSRC_MGR_CPU_WAIT_TIME 0 14 LOAD .01953125 15 PHYSICAL_MEMORY_BYTES 3849900032 1008 VM_IN_BYTES 54153216 1009 VM_OUT_BYTES 0 1010 17 rows selected.
This is an essential component of the new time model used in 10g to support ASH, AWR and ADDM, but you don't have to purchase licenses for those products to benefit from the view.
Statspack Some of the statistics in V$OSSTAT look useful for identifying server load problems and the 10g Statspack report has been updated to include them. This is an excerpt from a Statspack report covering a 130 second interval when five sessions where running the test query at DOP 16.
Host CPU (CPUs: 1) ~~~~~~~~ Load Average Begin End User System Idle WIO WCPU ------- ------- ------- ------- ------- ------- -------- 0.38 25.86 82.03 17.91 0.05 0.00 #######
It's clear that the server's load average has increased dramatically during the test period and that there
DRAFT Page 9 5th March 2007

was barely any idle time. However, the final statistic is the one that I'm most interested in, even though the value is obscured by the report formatting. It's the percentage of time spent waiting for CPU.
Looking at $ORACLE_HOME/rdbms/admin/sprepins.sql, I can see that the value is calculated using - 100*(:oscpuw / :ttic)
:ttic is the number of CPU ticks available in the monitoring period so should approximately equal the number of CPUs * Elapsed Time in seconds * 100.
:oscpuw is the amount of time that processes have been in a ready state, waiting to be selected by the operating system scheduler to run. It uses the same time unit of hundredths of seconds.
To see the true value of WCPU, I modified the script to show the values of :oscpuw and :ttic immediately after the WCPU value.
:oscpuw = 379100
:ttic = 13047
WCPU percentage - 2905%
In other words, we spent more time waiting on CPU (3,791 seconds) than there was CPU available (130 seconds), which is not particularly unusual and is a solid indication of a long run queue. Systems have an infinite capacity for waiting. I can invoke more and more processes and while the overall wall clock time and CPU time available in a given period won't change, the wait time will increase.
You could argue (and I will shortly) that o/s monitoring utilities are likely to prove more useful in monitoring o/s performance, but it's very convenient to have access to this information in a Statspack, AWR or ASH report that can be correlated more closely and more easily to an application's database activity.
If you do choose to use Statspack, bear in mind that it is reporting instance-wide (or in this case, server-wide) statistics so it's most useful when you are running your own tests and know that you're the only user of the server (which was true for the tests used for this paper). At the very least, it's an indication of a long run queue and adds weight to the circumstantial evidence of a high percentage of unaccounted-for time in trace files,
ASH, AWR and ADDM
You might be in the pleasant position of running Oracle 10g with additional licenses for the various automatic performance monitoring features.
Active Session History (ASH)
Automatic Workload Repository (AWR)
Automatic Database Diagnostic Monitor (ADDM)
These can give you an excellent view of a PX job that's running right now because the relevant performance data will already have been recorded in the active session history and workload repository. The next few examples are a few screenshots based on a time period during which I ran the tests at DOP 2, followed by DOP 16.
DRAFT Page 10 3rd March 2007

The first peak in the graphs is for DOP 2 and the second for DOP 16. As you can see, Oracle has classified most of the time spent as 'Other' and the additional wait time and run queue length at DOP 16 is clear. Note also that the tests took a similar length of time to complete!
The ADDM Screen shown here has a different time-scale on the x axis, so that the period of interest is the spike at the right hand edge of the graph, again covering the tests at DOP 2 followed by DOP 16. Note also the recommendations at the bottom of the page – the SQL needs to be tuned!
DRAFT Page 11 5th March 2007

Drilling down into the data allows us to see the specific SQL statements to confirm that they are the ones we expect. Note that PX Deq Credit: send blkd is the main database wait event, with 66% of the time.
The distribution of time spent of different events is also reflected in this final example.
DRAFT Page 12 3rd March 2007

Of course you don't need to use Grid Control to view the workload history, because there are various textual report scripts available in $ORACLE_HOME/rdbms/admin.
ashrpt.sql
awrrpt.sql
addmrpt.sql
Here are a few examples of the type of information that you can glean from these reports.
ASH
Looking at a small snippet from an ASH report, you can see that, as well as the PX Deq Credit: send blkd events, there's significant time recorded against "CPU + Wait for CPU", but no differentiation between the two.
Slot Event Slot Time (Duration) Count Event Count % Event -------------------- -------- ------------------------------ -------- ------- 19:20:34 (1.4 min) 2 CPU + Wait for CPU 1 0.03 log file parallel write 1 0.03 19:24:00 (2.0 min) 1,724 CPU + Wait for CPU 1,044 29.26 PX Deq Credit: send blkd 507 14.21 latch free 116 3.25 19:26:00 (2.0 min) 1,826 CPU + Wait for CPU 1,230 34.47 PX Deq Credit: send blkd 542 15.19 os thread startup 29 0.81 19:30:00 (2.0 min) 8 null event 8 0.22 19:32:00 (2.0 min) 3 CPU + Wait for CPU 2 0.06 db file scattered read 1 0.03 19:34:00 (1.7 min) 5 CPU + Wait for CPU 5 0.14 -------------------------------------------------------------
ADDM
What does the ADDM report have to say about the test period? The main recommendation is that the test SQL statements should be tuned, which is not unreasonable. However, it also makes this statement, which puzzled me at first.
CPU was not a bottleneck for the instance.
To test the veracity of this claim I took the simple step of running the tests twice at DOP 2, once with one CPU enabled and again with 4 CPUs enabled. The timings are rounded up to the nearest second.
Number of CPUs Average Job Completion Time (seconds)
Maximum Job Completion Time (seconds)
1 100 103
4 26 27
I would suggest that CPU was a bottleneck for the instance!
Operating System Tools To reiterate, the central difficulty in Oracle's recording of process time on a busy server is that it doesn't have the opportunity to do so. Once interrupted, it may spend some time in the run queue – unaccounted-for as far as Oracle is concerned. The Operating System knows about this, though, so perhaps the O/S is the most sensible place to look for more information? Here are a few tools and
DRAFT Page 13 5th March 2007

approaches you might take. Examining the Run Queue There are a number of tools that expose aggregated information about the state of the run queue. For example, the top utility or uptime (or it's parent - w) will show you average run queue lengths for the past 1, 5 and 15 minutes, from left to right.
# uptime 12:33pm up 3:07, 5 users, load average: 6.06, 4.49, 3.92 # uptime 12:33pm up 3:07, 5 users, load average: 6.92, 4.68, 3.99 # uptime 12:33pm up 3:07, 5 users, load average: 8.07, 4.94, 4.08
vmstat can show you the number of processes waiting to run. Here you can see the effect of five sessions at DOP 2 on the first column of the output – the number of kernel threads in the run queue1.
$ vmstat 1 kthr memory page disk faults cpu 1 0 0 3601652 1970460 0 0 0 0 0 0 0 0 1 4 0 367 155 242 97 3 0 0 0 0 3601652 1970460 0 0 0 0 0 0 0 0 0 1 0 367 164 239 97 3 0 1 0 0 3601652 1970424 327 1088 0 4 4 0 0 0 0 2 0 419 5033 371 87 13 0 0 0 0 3601652 1970412 1 0 111 0 0 0 0 0 4 2 4 377 388 273 97 3 0 9 0 0 3597248 1968692 789 3797 24 0 0 0 0 0 28 0 28 448 3672 324 74 23 3 7 0 0 3586836 1958580 1162 9821 0 0 0 0 0 0 4 3 3 410 9144 755 48 52 0 7 0 0 3566528 1943488 911 10458 0 0 0 0 0 0 3 5 3 432 9265 760 53 47 0 6 0 0 3551768 1931312 810 7050 0 0 0 0 0 0 0 0 0 376 4134 314 68 32 0 12 0 0 3544120 1925504 548 6380 0 4 4 0 0 0 0 1 0 373 3682 356 67 33 0 5 0 0 3536124 1916920 457 6034 0 0 0 0 0 0 0 2 0 379 2402 336 72 28 0 7 0 0 3525164 1907292 382 5047 0 0 0 0 0 0 0 1 0 372 2348 309 76 24 0 9 0 0 3516412 1899916 305 4016 0 0 0 0 0 0 0 0 0 372 1712 286 81 19 0 12 0 0 3504664 1889740 252 4077 0 0 0 0 0 0 0 2 0 369 1273 288 83 17 0 13 0 0 3495692 1881236 7 2841 0 0 0 0 0 0 0 5 0 372 962 301 89 11 0 13 0 0 3492616 1878160 0 1521 0 0 0 0 0 0 0 1 0 360 276 256 93 7 0 13 0 0 3486456 1872000 0 2299 0 0 0 0 0 0 0 5 0 363 285 272 91 9 0 13 0 0 3471844 1857880 0 2234 0 0 0 0 0 0 2 0 2 363 250 263 92 8 0 14 0 0 3463648 1850948 2 1797 0 0 0 0 0 0 0 0 0 364 261 278 93 7 0 15 0 0 3457492 1844940 0 1421 0 0 0 0 0 0 0 2 0 375 707 403 93 7 0 15 0 0 3453388 1840824 0 760 0 0 0 0 0 0 0 0 0 358 630 396 95 5 0 16 0 0 3449412 1836836 0 1057 0 0 0 0 0 0 0 3 0 362 732 405 94 6 0
These and other tools (for example ORCA, which I used in a previous paper) show information about the length of the run queue but don't offer much information regarding the root cause. prstat and Micro-state Accounting The prstat command, introduced in Solaris 8, provides more detailed process-level statistics including Micro-state accounting, which is very useful when trying to measure the percentage of time that processes are in the run queue. From the prstat man page (My italics) :-
-m Report microstate process accounting information. In addition to all fields listed in -v mode, this mode also includes the percentage of time the process has spent processing system traps, text page faults, data page faults, waiting for user locks and waiting for CPU (latency time).
The particular command I've used is prstat -cvmj oracle, which also includes the following options. 1 Note that I am using the term 'kernel threads' here in a Solaris 10 context.
DRAFT Page 14 3rd March 2007

-c Print new reports below previous reports instead of overprinting them. -v Report verbose process usage. This output format includes the percentage of time the process has spent in user mode, in system mode, and sleeping. It also includes the number of voluntary and involuntary con- text switches, system calls and the number of signals received. -j projlist Report only processes or lwps whose project ID is in the given list. Each project ID can be specified as either a project name or a numerical project ID. See project(4).
Here are a few snapshots of prstat output whilst running the tests with a DOP of 2. The test script starts running. Note the sym07.sh process – 4109.
PID USERNAME USR SYS TRP TFL DFL LCK SLP LAT VCX ICX SCL SIG PROCESS/NLWP 4113 oracle 85 7.8 0.1 0.0 0.0 0.0 2.8 4.3 90 758 6K 0 oracle/1 4112 oracle 4.0 4.5 0.0 0.0 0.0 0.0 84 7.5 31 116 3K 0 sqlplus/1 4109 oracle 0.4 0.7 0.0 0.0 0.0 0.0 93 6.0 8 0 792 4 sym07.sh/1 1898 oracle 0.1 0.0 0.0 0.0 0.0 0.0 100 0.1 15 0 7 0 oracle/1 1894 oracle 0.1 0.0 0.0 0.0 0.0 0.0 100 0.0 2 0 19 0 oracle/1 1896 oracle 0.1 0.0 0.0 0.0 0.0 0.0 100 0.1 5 0 89 0 oracle/1 2087 oracle 0.0 0.0 0.0 0.0 0.0 0.0 100 0.0 17 2 144 0 sshd/1 1886 oracle 0.0 0.0 0.0 0.0 0.0 82 18 0.0 95 0 9 0 oracle/11 2089 oracle 0.0 0.0 0.0 0.0 0.0 0.0 99 0.7 5 2 24 0 ksh/1 1878 oracle 0.0 0.0 0.0 0.0 0.0 0.0 100 0.0 3 0 24 0 oracle/1 2131 oracle 0.0 0.0 0.0 0.0 0.0 0.0 100 0.0 1 2 18 0 sshd/1 1882 oracle 0.0 0.0 0.0 0.0 0.0 0.0 100 0.0 3 0 3 0 oracle/1 1880 oracle 0.0 0.0 0.0 0.0 0.0 0.0 100 0.0 6 0 4 0 oracle/1 4092 oracle 0.0 0.0 0.0 0.0 0.0 0.0 100 0.0 6 0 2 0 oracle/1 1888 oracle 0.0 0.0 0.0 0.0 0.0 82 18 0.0 7 0 8 0 oracle/11 Total: 35 processes, 69 lwps, load averages: 0.02, 0.02, 0.02
The queries are running now. Notice that the LAT value for ten of the processes has increased dramatically. These are the two slaves for each session that are actively reading the data. The ICX values have also increased, indicating involuntary context switching – a strong indication of pre-emption caused by overloaded CPUs. The second set of slaves has high SLP values – sleeping whilst waiting for the data to be returned by the first slave set.
PID USERNAME USR SYS TRP TFL DFL LCK SLP LAT VCX ICX SCL SIG PROCESS/NLWP 4173 oracle 11 0.4 0.0 0.0 0.0 0.0 0.0 89 7 53 40 0 oracle/1 4167 oracle 11 0.4 0.0 0.0 0.0 0.0 0.0 89 6 52 38 0 oracle/1 4163 oracle 9.9 0.4 0.0 0.0 0.0 0.0 0.0 90 5 49 36 0 oracle/1 4159 oracle 9.6 0.4 0.0 0.0 0.0 0.0 0.0 90 5 48 37 0 oracle/1 4161 oracle 9.2 0.4 0.0 0.0 0.0 0.0 0.0 90 5 40 35 0 oracle/1 4169 oracle 9.0 0.4 0.0 0.0 0.0 0.0 0.0 91 5 41 35 0 oracle/1 4171 oracle 8.9 0.4 0.0 0.0 0.0 0.0 0.0 91 5 43 37 0 oracle/1 4157 oracle 8.6 0.4 0.0 0.0 0.0 0.0 0.0 91 5 40 37 0 oracle/1 4141 oracle 8.2 0.4 0.0 0.0 0.0 0.0 49 42 111 80 305 0 oracle/1 4143 oracle 6.9 0.3 0.0 0.0 0.0 0.0 7.5 85 114 126 268 0 oracle/1 4136 oracle 0.8 0.1 0.0 0.0 0.0 0.0 99 0.0 77 2 284 0 oracle/1 4132 oracle 0.7 0.1 0.0 0.0 0.0 0.0 98 1.5 74 8 249 0 oracle/1 1898 oracle 0.2 0.1 0.0 0.0 0.0 0.0 100 0.0 15 0 34 0 oracle/1 1894 oracle 0.1 0.0 0.0 0.0 0.0 0.0 100 0.0 2 0 19 0 oracle/1 4123 oracle 0.0 0.0 0.0 0.0 0.0 0.0 100 0.0 11 1 32 0 oracle/1
As some of the sessions complete, the number of slaves with a high percentage of LAT time reduces and we can see the trcsess process for one of the sessions that has finished running the query. Notice
DRAFT Page 15 5th March 2007

also that the load average has increased steadily as the tests are running.
PID USERNAME USR SYS TRP TFL DFL LCK SLP LAT VCX ICX SCL SIG PROCESS/NLWP 4182 oracle 9.2 13 0.0 0.0 0.0 0.0 0.0 78 8 66 5K 0 java/1 4163 oracle 13 0.2 0.0 0.0 0.0 0.0 31 55 310 262 739 0 oracle/1 4161 oracle 13 0.2 0.0 0.0 0.0 0.0 46 41 311 181 810 0 oracle/1 4171 oracle 13 0.1 0.0 0.0 0.0 0.0 20 67 300 279 694 0 oracle/1 4173 oracle 12 0.2 0.0 0.0 0.0 0.0 56 32 301 165 795 0 oracle/1 4169 oracle 11 0.7 0.0 0.0 0.0 0.0 53 35 262 179 717 0 oracle/1 4167 oracle 11 0.7 0.0 0.0 0.0 0.0 34 54 273 304 625 0 oracle/1 4151 oracle 2.0 0.2 0.0 0.0 0.0 0.0 98 0.1 172 5 668 0 oracle/1 4149 oracle 1.9 0.2 0.0 0.0 0.0 0.0 91 7.1 185 28 672 0 oracle/1 4165 oracle 1.8 0.2 0.0 0.0 0.0 0.0 98 0.1 165 5 636 0 oracle/1 4155 oracle 1.7 0.2 0.0 0.0 0.0 0.0 98 0.2 203 4 739 0 oracle/1 4153 oracle 1.7 0.2 0.0 0.0 0.0 0.0 98 0.2 168 7 636 0 oracle/1 4145 oracle 1.6 0.2 0.0 0.0 0.0 0.0 98 0.2 201 7 729 0 oracle/1 4180 oracle 0.6 1.0 0.0 0.0 0.0 0.0 49 50 6 0 1K 0 trcsess/1 4179 oracle 0.6 0.5 0.0 0.0 0.0 60 0.0 39 2 4 209 0 java/4 Total: 68 processes, 108 lwps, load averages: 5.46, 1.93, 0.73
Eventually, all of the slaves are spending most of their time sleeping and waiting for something to do.
PID USERNAME USR SYS TRP TFL DFL LCK SLP LAT VCX ICX SCL SIG PROCESS/NLWP 1878 oracle 0.0 0.1 0.0 0.0 0.0 0.0 100 0.0 6 0 52 0 oracle/1 1898 oracle 0.1 0.0 0.0 0.0 0.0 0.0 100 0.0 15 0 7 0 oracle/1 1894 oracle 0.1 0.0 0.0 0.0 0.0 0.0 100 0.0 2 0 17 0 oracle/1 1896 oracle 0.1 0.0 0.0 0.0 0.0 0.0 100 0.0 6 0 89 0 oracle/1 2087 oracle 0.0 0.0 0.0 0.0 0.0 0.0 100 0.3 4 0 32 0 sshd/1 2131 oracle 0.0 0.0 0.0 0.0 0.0 0.0 100 0.0 1 2 18 0 sshd/1 2089 oracle 0.0 0.0 0.0 0.0 0.0 0.0 100 0.0 1 1 21 0 ksh/1 1886 oracle 0.0 0.0 0.0 0.0 0.0 82 18 0.0 29 0 11 0 oracle/11 4132 oracle 0.0 0.0 0.0 0.0 0.0 0.0 100 0.3 7 0 3 0 oracle/1 4141 oracle 0.0 0.0 0.0 0.0 0.0 0.0 100 0.3 9 0 3 0 oracle/1 1880 oracle 0.0 0.0 0.0 0.0 0.0 0.0 100 0.0 6 0 4 0 oracle/1 4155 oracle 0.0 0.0 0.0 0.0 0.0 0.0 100 0.0 8 0 3 0 oracle/1 4136 oracle 0.0 0.0 0.0 0.0 0.0 0.0 100 0.3 7 0 3 0 oracle/1 4145 oracle 0.0 0.0 0.0 0.0 0.0 0.0 100 0.0 8 0 3 0 oracle/1 4153 oracle 0.0 0.0 0.0 0.0 0.0 0.0 100 0.0 9 0 3 0 oracle/1 Total: 52 processes, 86 lwps, load averages: 6.99, 2.43, 0.91
Although this has been a brief introduction, prstat is clearly an extremely useful tool in identifying that time in the run queue is the underlying cause of unaccounted-for time in Oracle trace files. DTrace Using the prstat command with the –m option should be sufficient to identify that the timing gaps in Oracle trace files are probably due to processes stuck in the run queue. However, Solaris 10 offers a tool that can provide more detailed information – DTrace [6,7].
In particular, the sched provider, offers access to O/S scheduling information and has two probes which can trap information when processes are placed on to the run queue and when they are dequeued and allowed to run.
sched:::enqueue
sched:::dequeue There are a further couple of probes that can be used to monitor time spent on the CPU.
sched:::on-cpu sched:::off-cpu
Taken together, a combination of a DTrace script (written using the D language) and whatever profiler you use should be able to build a reliable resource profile that includes unaccounted-for time.
DRAFT Page 16 3rd March 2007
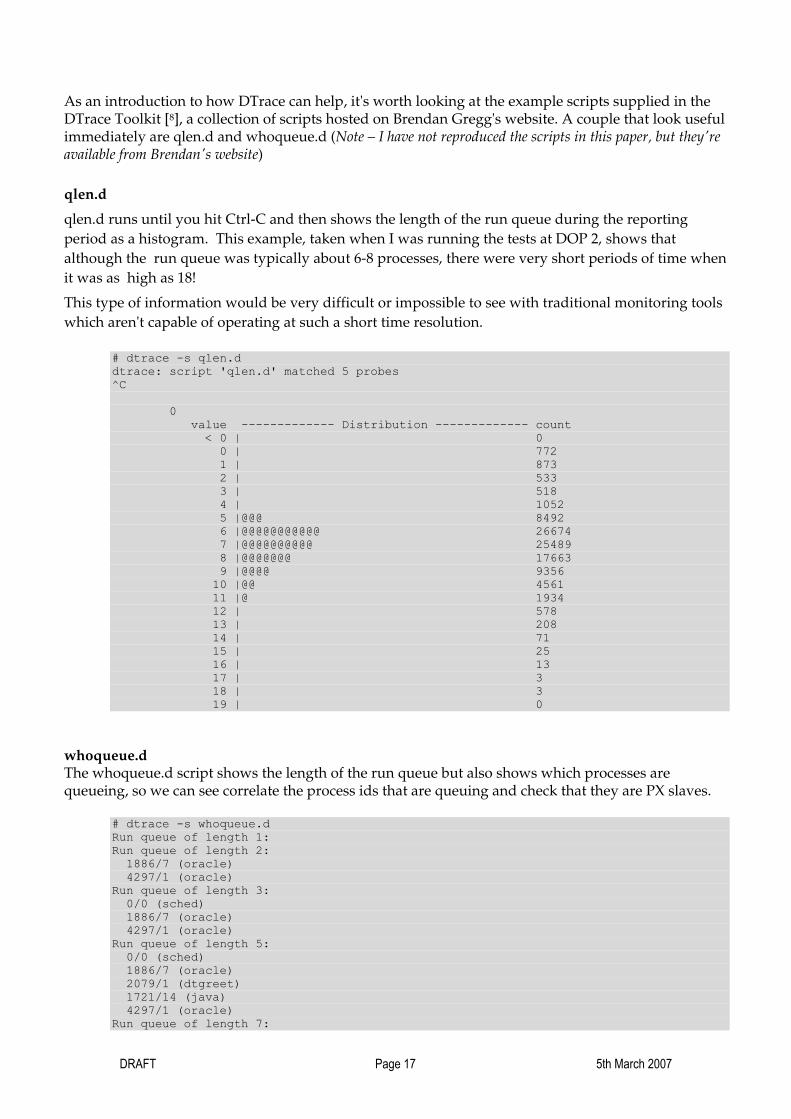
As an introduction to how DTrace can help, it's worth looking at the example scripts supplied in the DTrace Toolkit [8], a collection of scripts hosted on Brendan Gregg's website. A couple that look useful immediately are qlen.d and whoqueue.d (Note – I have not reproduced the scripts in this paper, but they're available from Brendan's website)
qlen.d
qlen.d runs until you hit Ctrl-C and then shows the length of the run queue during the reporting period as a histogram. This example, taken when I was running the tests at DOP 2, shows that although the run queue was typically about 6-8 processes, there were very short periods of time when it was as high as 18!
This type of information would be very difficult or impossible to see with traditional monitoring tools which arenʹt capable of operating at such a short time resolution.
# dtrace -s qlen.d dtrace: script 'qlen.d' matched 5 probes ^C 0 value ------------- Distribution ------------- count < 0 | 0 0 | 772 1 | 873 2 | 533 3 | 518 4 | 1052 5 |@@@ 8492 6 |@@@@@@@@@@@ 26674 7 |@@@@@@@@@@ 25489 8 |@@@@@@@ 17663 9 |@@@@ 9356 10 |@@ 4561 11 |@ 1934 12 | 578 13 | 208 14 | 71 15 | 25 16 | 13 17 | 3 18 | 3 19 | 0
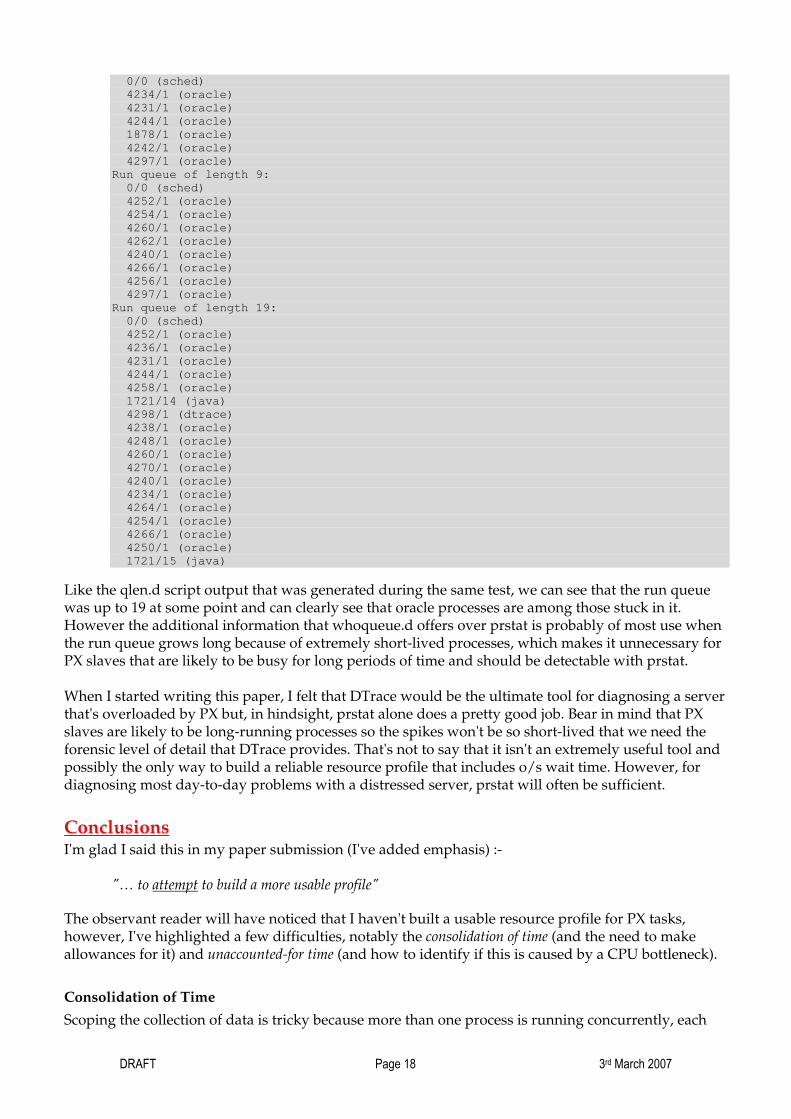
whoqueue.d The whoqueue.d script shows the length of the run queue but also shows which processes are queueing, so we can see correlate the process ids that are queuing and check that they are PX slaves.
# dtrace -s whoqueue.d Run queue of length 1: Run queue of length 2: 1886/7 (oracle) 4297/1 (oracle) Run queue of length 3: 0/0 (sched) 1886/7 (oracle) 4297/1 (oracle) Run queue of length 5: 0/0 (sched) 1886/7 (oracle) 2079/1 (dtgreet) 1721/14 (java) 4297/1 (oracle) Run queue of length 7:
DRAFT Page 17 5th March 2007
0/0 (sched) 4234/1 (oracle) 4231/1 (oracle) 4244/1 (oracle) 1878/1 (oracle) 4242/1 (oracle) 4297/1 (oracle) Run queue of length 9: 0/0 (sched) 4252/1 (oracle) 4254/1 (oracle) 4260/1 (oracle) 4262/1 (oracle) 4240/1 (oracle) 4266/1 (oracle) 4256/1 (oracle) 4297/1 (oracle) Run queue of length 19: 0/0 (sched) 4252/1 (oracle) 4236/1 (oracle) 4231/1 (oracle) 4244/1 (oracle) 4258/1 (oracle) 1721/14 (java) 4298/1 (dtrace) 4238/1 (oracle) 4248/1 (oracle) 4260/1 (oracle) 4270/1 (oracle) 4240/1 (oracle) 4234/1 (oracle) 4264/1 (oracle) 4254/1 (oracle) 4266/1 (oracle) 4250/1 (oracle) 1721/15 (java)
Like the qlen.d script output that was generated during the same test, we can see that the run queue was up to 19 at some point and can clearly see that oracle processes are among those stuck in it. However the additional information that whoqueue.d offers over prstat is probably of most use when the run queue grows long because of extremely short-lived processes, which makes it unnecessary for PX slaves that are likely to be busy for long periods of time and should be detectable with prstat. When I started writing this paper, I felt that DTrace would be the ultimate tool for diagnosing a server that's overloaded by PX but, in hindsight, prstat alone does a pretty good job. Bear in mind that PX slaves are likely to be long-running processes so the spikes won't be so short-lived that we need the forensic level of detail that DTrace provides. That's not to say that it isn't an extremely useful tool and possibly the only way to build a reliable resource profile that includes o/s wait time. However, for diagnosing most day-to-day problems with a distressed server, prstat will often be sufficient.
Conclusions I'm glad I said this in my paper submission (I've added emphasis) :-
"… to attempt to build a more usable profile" The observant reader will have noticed that I haven't built a usable resource profile for PX tasks, however, I've highlighted a few difficulties, notably the consolidation of time (and the need to make allowances for it) and unaccounted-for time (and how to identify if this is caused by a CPU bottleneck).
Consolidation of Time
Scoping the collection of data is tricky because more than one process is running concurrently, each
DRAFT Page 18 3rd March 2007

with it's own workload and each of which could experience different bottlenecks. All of the processes should be included in the profile, but then the consolidated values ought to be scaled down to make allowances for the aggregation. Another concern is that each time we aggregate data there's a danger of losing the critical detail.
Unaccounted-for Time
Oracle's tracing mechanisms can't measure the time that processes spend in the run queue, so it's inevitable that information will be missing from the trace files. We should, however, be able to use corresponding Operating System statistics to 'fill in the blanks'.
Identifying the Problem Even without a full and accurate resource profile for a PX job that's experiencing performance problems, there are a number of useful indicators that process pre-emption could be a contributor.
Unaccounted-for time. The presence of a large percentage of unaccounted-for time in a trace file is a good initial indicator that processes are being pre-empted.
Run Queue Length. If unaccounted-for time is present, it's worth investigating CPU load and the length of the run queue. It helps that PX tasks are likely to run for a while, giving you more monitoring opportunity.
prstat and Processing Micro-state accounting. If you have access to prstat –m, the LAT column shows the 'knocked-on-the-head' problem and that, along with Unaccounted-for time is probably indication enough.
DTrace sched provider. Lets you get down to just how long a slave spends in ready to run state. There's a useful script waiting to be written!
Further evidence that these techniques could prove helpful in day-to-day performance diagnosis is that there were a few times when I rebooted the server and forgot to disable three CPUs to leave one enabled. With a four CPU server, the difference was immediately obvious and any time this happened it was during the first test that I noticed, when looking at the prstat output, that the Latency percentage was much lower.
Best of all, the techniques I've described for monitoring process pre-emption and latency caused by a busy server don't just apply to PX tasks, but to any server that's experiencing CPU resource bottlenecks so are worth investigation even if your site doesn't use PX.
DRAFT Page 19 5th March 2007

Bibliography and Resources 1) Oracle Corp. Data Warehousing Guide – Oracle 10g. Oracle Corp. http://download-
east.oracle.com/docs/cd/B19306_01/server.102/b14223/usingpe.htm#i1009828
2) Suck It Dry – Tuning Parallel Execution. Burns, Doug. http://oracledoug.com/px.pdf
3) Oracle System Performance Analysis using Oracle Event 10046. Millsap, Cary and Holt, Jeffrey. http://www.nyoug.org/Presentations/SIG/DBA/hotsos_perf.PDF
4) How Many Slaves? Parallel Execution and The Magic of ʹ2ʹ. Burns, Doug. http://oracledoug.com/px_slaves.pdf
5) Millsap and Holt. Optimizing Oracle Performance. OʹReilly Associates.
6) DTrace User Guide. May, 2006. Sun Microsystems. (http://docs.sun.com/app/docs/doc/819-5488)
7) Solaris Dynamic Tracing Guide. 2005. Sun Microsystems. (http://docs.sun.com/app/docs/doc/817-6223)
8) The DTrace Toolkit. http://www.brendangregg.com/dtrace.html#DTraceToolkit
There are also a number of useful resources on Metalink, including a dedicated section containing the most useful notes that you can access by selecting 'Top Tech Docs', 'Database', 'Performance and Scalability' and then ‘Parallel Execution’ from your Metalink home page.
191103.1 – Parallel Execution Wait Events (contains links to event-specific information)
Acknowledgements Thanks to the following people for their help in preparing this paper.
Connie Green for good answers to a couple of questions I had about the Oracle 10g Statspack report. Marc Fielding, Alex Gorbachev and Christo Kutrovsky for suggestions for CPU-intensive tests. In particular, Christo suggested using the CACHE hint to eliminate i/o bottlenecks. Mike Scott for his usually sound advice on some of the Unix tools used, based on extensive experience of and passion for the subject. Madeleine, The Boys and Polly Piggy for sitting patiently whilst I pored over screens full of numbers that made no sense to them.
About the author Doug Burns is an independent contractor, currently working with The Pythian Group, who has 16 years experience working with Oracle in a range of industries and applications and has worked as a course instructor and technical editor for both Oracle UK and Learning Tree International. He is a member of The Oak Table Network (http://www.oaktable.net) and an Oracle ACE (http://www.oracle.com/technology/community/oracle_ace/ace1.html#burns). He can be contacted at [email protected] and this document and other articles are available on his website at http://oracledoug.com.
DRAFT Page 20 3rd March 2007
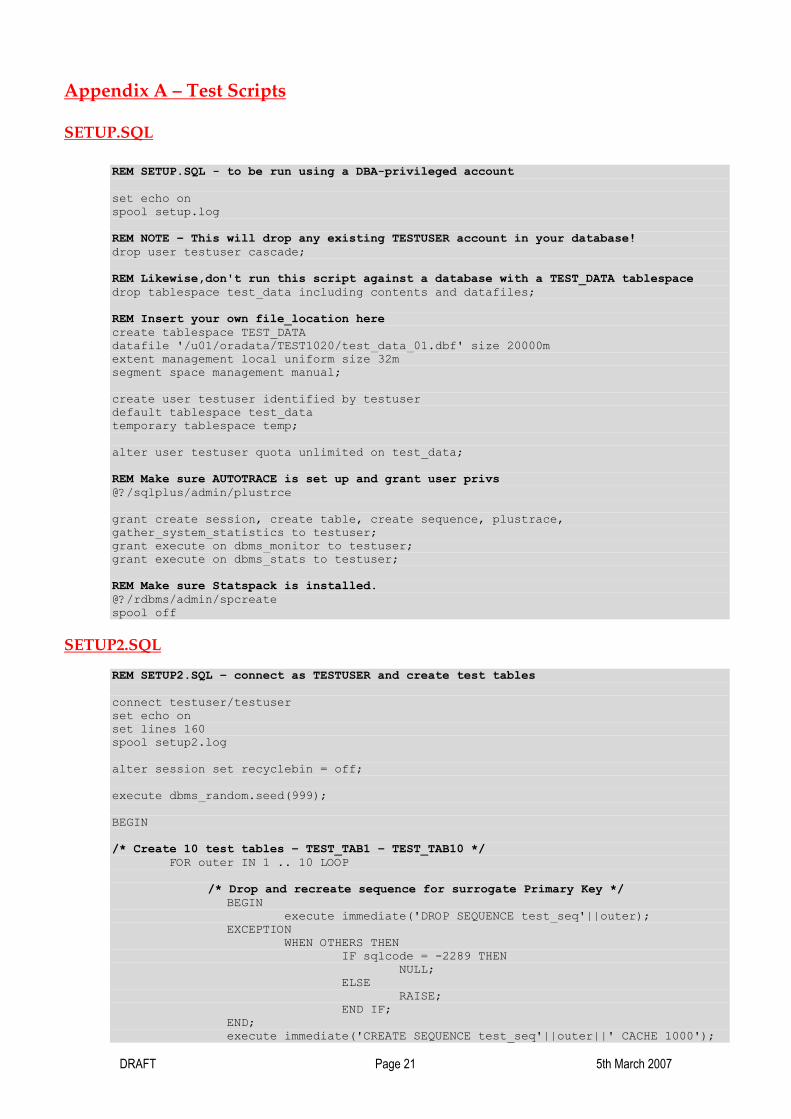
Appendix A – Test Scripts SETUP.SQL
REM SETUP.SQL - to be run using a DBA-privileged account set echo on spool setup.log REM NOTE – This will drop any existing TESTUSER account in your database! drop user testuser cascade; REM Likewise,don't run this script against a database with a TEST_DATA tablespace drop tablespace test_data including contents and datafiles; REM Insert your own file_location here create tablespace TEST_DATA datafile '/u01/oradata/TEST1020/test_data_01.dbf' size 20000m extent management local uniform size 32m segment space management manual; create user testuser identified by testuser default tablespace test_data temporary tablespace temp; alter user testuser quota unlimited on test_data; REM Make sure AUTOTRACE is set up and grant user privs @?/sqlplus/admin/plustrce grant create session, create table, create sequence, plustrace, gather_system_statistics to testuser; grant execute on dbms_monitor to testuser; grant execute on dbms_stats to testuser; REM Make sure Statspack is installed. @?/rdbms/admin/spcreate spool off
SETUP2.SQL
REM SETUP2.SQL – connect as TESTUSER and create test tables connect testuser/testuser set echo on set lines 160 spool setup2.log alter session set recyclebin = off; execute dbms_random.seed(999); BEGIN /* Create 10 test tables – TEST_TAB1 – TEST_TAB10 */ FOR outer IN 1 .. 10 LOOP /* Drop and recreate sequence for surrogate Primary Key */ BEGIN execute immediate('DROP SEQUENCE test_seq'||outer); EXCEPTION WHEN OTHERS THEN IF sqlcode = -2289 THEN NULL; ELSE RAISE; END IF; END; execute immediate('CREATE SEQUENCE test_seq'||outer||' CACHE 1000');
DRAFT Page 21 5th March 2007

BEGIN execute immediate('DROP TABLE test_tab'||outer); EXCEPTION WHEN OTHERS THEN IF sqlcode = -942 THEN NULL; ELSE RAISE; END IF; END; /* Create 1000 row table */ execute immediate('CREATE TABLE test_tab'||outer||' AS SELECT test_seq'||outer||'.NEXTVAL pk_id,'|| 'MOD(test_seq'||outer||'.nextval, 10) num_code '|| 'FROM all_objects WHERE rownum <= 1000'); /* Increase number of rows to */ FOR inner IN 1 .. 10 LOOP execute immediate('INSERT '|| ' INTO test_tab'||outer|| ' SELECT /*+ parallel(test_tab'||outer||', 2) */'|| ' test_seq'||outer||'.NEXTVAL, num_code'|| ' FROM test_tab'||outer); commit; END LOOP; /* Generate optimiser statistics on table */ dbms_stats.gather_table_stats(user, 'test_tab'||outer, cascade => false, estimate_percent => 1, method_opt => 'for all columns size 1'); END LOOP; END; / /* A couple of queries to check resulting tables look ok */ select table_name, num_rows from user_tables; select segment_name, bytes/1024/1024 MB from user_segments; spool off
sym07.sh
#!/bin/ksh # $1 = DOP # Clear out background_dump_dest and user_dump_dest rm /oracle/admin/TEST1020/bdump/*.trc rm /oracle/admin/TEST1020/udump/*.trc # Take a Statspack beginning snap sqlplus / as sysdba << EOF exec statspack.snap EOF # Run 5 parallel sessions, each joining two different tables at # requested DOP ./session.sh 1 $1 & ./session.sh 3 $1 & ./session.sh 5 $1 & ./session.sh 7 $1 & ./session.sh 9 $1 & # Wait for all sessions to finish wait # Take a Statspack ending snap sqlplus / as sysdba << EOF exec statspack.snap EOF
DRAFT Page 22 3rd March 2007

DRAFT Page 23 5th March 2007
session.sh
#!/bin/ksh # Script to execute a hash join/group by of two of the ten tables # created for the tests. The two tables being the $1 parameter passed # in from sym07.sh (e.g. test_tab3) and one greater (e.g. test_tab4) # The second parameter controls the Degree of Parallelism used. SESSION=$1 TABLE1=$1 TABLE2=`expr $1 + 1` DOP=$2 sqlplus testuser/testuser << EOF set autotrace on break on dfo_number on tq_id set echo on set pages 9999 set lines 100 spool ${SESSION}_${DOP}.log REM Set session-specific identifier ($SESSION_$DOP) and enable tracing exec dbms_session.set_identifier('${SESSION}_${DOP}'); exec dbms_monitor.client_id_trace_enable(client_id => '${SESSION}_${DOP}'); set timing on REM Note use of CACHE hint to reduce or eliminate i/o SELECT /*+ parallel(tt1, $DOP) cache(tt1) parallel(tt2, $DOP) cache(tt2) */ MOD(tt1.pk_id + tt2.pk_id, 113), COUNT(*) FROM test_tab$TABLE1 tt1, test_tab$TABLE2 tt2 WHERE tt1.pk_id = tt2.pk_id GROUP BY MOD(tt1.pk_id + tt2.pk_id ,113) ORDER BY MOD(tt1.pk_id + tt2.pk_id ,113); set timing off REM Turn off tracing and execute a couple of queries to check that PX was used SELECT * FROM v\$pq_sesstat; set autotrace off exec dbms_monitor.client_id_trace_disable(client_id => '${SESSION}_${DOP}'); SELECT dfo_number, tq_id, server_type, process, num_rows, bytes FROM v\$pq_tqstat ORDER BY dfo_number DESC, tq_id, server_type DESC , process; exit EOF # Consolidate trace files using trcsess into one output file - $SESSION_$DOP.trc trcsess output="${SESSION}_${DOP}.trc" clientid="${SESSION}_${DOP}" /oracle/admin/TEST1020/udump/*.trc /oracle/admin/TEST1020/bdump/*.trc tkprof ${SESSION}_${DOP}.trc ${SESSION}_${DOP}.out sort=prsela,fchela,exeela

Appendix B – Example Output – test For illustration, here is an example of the output of one test session, using a DOP of 2.
$ cat 7_2.log SQL> SQL> REM Set session-specific identifier (2) and enable tracing SQL> exec dbms_session.set_identifier('7_2'); PL/SQL procedure successfully completed. SQL> exec dbms_monitor.client_id_trace_enable(client_id => '7_2'); PL/SQL procedure successfully completed. SQL> set timing on SQL> SQL> REM Note use of CACHE hint to reduce or eliminate i/o SQL> SELECT /*+ parallel(tt1, 2) cache(tt1) parallel(tt2, 2) cache(tt2) */ MOD(tt1.pk_id + tt2.pk_id, 113), COUNT(*) 2 FROM test_tab7 tt1, test_tab8 tt2 3 WHERE tt1.pk_id = tt2.pk_id 4 GROUP BY MOD(tt1.pk_id + tt2.pk_id ,113) 5 ORDER BY MOD(tt1.pk_id + tt2.pk_id ,113); MOD(TT1.PK_ID+TT2.PK_ID,113) COUNT(*) ---------------------------- ---------- 0 9061 1 9062 2 9062 3 9062 4 9062 5 9062 6 9062 7 9062 8 9062 9 9062 10 9062
<SNIPPED> 109 9061 110 9062 111 9061 112 9062 113 rows selected. Elapsed: 00:00:08.27
DRAFT Page 24 3rd March 2007

Execution Plan ---------------------------------------------------------- Plan hash value: 1782708198 ------------------------------------------------------------------------------------------------------------------------------ | Id | Operation | Name | Rows | Bytes |TempSpc| Cost (%CPU)| Time | TQ |IN-OUT| PQ Distrib | ------------------------------------------------------------------------------------------------------------------------------ | 0 | SELECT STATEMENT | | 1014K| 11M| | 18166 (98)| 00:00:31 | | | | | 1 | PX COORDINATOR | | | | | | | | | | | 2 | PX SEND QC (ORDER) | :TQ10002 | 1014K| 11M| | 18166 (98)| 00:00:31 | Q1,02 | P->S | QC (ORDER) | | 3 | SORT GROUP BY | | 1014K| 11M| 38M| 18166 (98)| 00:00:31 | Q1,02 | PCWP | | | 4 | PX RECEIVE | | 1014K| 11M| | 18166 (98)| 00:00:31 | Q1,02 | PCWP | | | 5 | PX SEND RANGE | :TQ10001 | 1014K| 11M| | 18166 (98)| 00:00:31 | Q1,01 | P->P | RANGE | | 6 | SORT GROUP BY | | 1014K| 11M| 38M| 18166 (98)| 00:00:31 | Q1,01 | PCWP | | |* 7 | HASH JOIN | | 1014K| 11M| | 7234 (93)| 00:00:13 | Q1,01 | PCWP | | | 8 | PX BLOCK ITERATOR | | 1014K| 5946K| | 2177 (89)| 00:00:04 | Q1,01 | PCWC | | | 9 | TABLE ACCESS FULL | TEST_TAB8 | 1014K| 5946K| | 2177 (89)| 00:00:04 | Q1,01 | PCWP | | | 10 | PX RECEIVE | | 1014K| 5946K| | 2177 (89)| 00:00:04 | Q1,01 | PCWP | | | 11 | PX SEND BROADCAST | :TQ10000 | 1014K| 5946K| | 2177 (89)| 00:00:04 | Q1,00 | P->P | BROADCAST | | 12 | PX BLOCK ITERATOR | | 1014K| 5946K| | 2177 (89)| 00:00:04 | Q1,00 | PCWC | | | 13 | TABLE ACCESS FULL| TEST_TAB7 | 1014K| 5946K| | 2177 (89)| 00:00:04 | Q1,00 | PCWP | | ------------------------------------------------------------------------------------------------------------------------------ Predicate Information (identified by operation id): --------------------------------------------------- 7 - access("TT1"."PK_ID"="TT2"."PK_ID") Statistics ---------------------------------------------------------- 12 recursive calls 0 db block gets 3758 consistent gets 0 physical reads 0 redo size 2364 bytes sent via SQL*Net to client 462 bytes received via SQL*Net from client 9 SQL*Net roundtrips to/from client 7 sorts (memory) 0 sorts (disk) 113 rows processed SQL> SQL> set timing off SQL> SQL> REM Turn off tracing and execute a couple of queries to check that PX was used SQL> SELECT * FROM v$pq_sesstat;
DRAFT Page 25 5th March 2007

STATISTIC LAST_QUERY SESSION_TOTAL ------------------------------ ---------- ------------- Queries Parallelized 0 1 DML Parallelized 0 0 DDL Parallelized 0 0 DFO Trees 0 1 Server Threads 0 0 Allocation Height 0 0 Allocation Width 0 0 Local Msgs Sent 0 6570 Distr Msgs Sent 0 0 Local Msgs Recv'd 0 6574 Distr Msgs Recv'd 0 0 11 rows selected. Execution Plan ---------------------------------------------------------- ERROR: ORA-01039: insufficient privileges on underlying objects of the view SP2-0612: Error generating AUTOTRACE EXPLAIN report Statistics ---------------------------------------------------------- 0 recursive calls 0 db block gets 0 consistent gets 0 physical reads 0 redo size 820 bytes sent via SQL*Net to client 385 bytes received via SQL*Net from client 2 SQL*Net roundtrips to/from client 0 sorts (memory) 0 sorts (disk) 11 rows processed SQL> SQL> set autotrace off SQL> exec dbms_monitor.client_id_trace_disable(client_id => '7_2'); PL/SQL procedure successfully completed. SQL> SQL> SELECT dfo_number, tq_id, server_type, process, num_rows, bytes 2 FROM v$pq_tqstat
DRAFT Page 26 3rd March 2007

DRAFT Page 27 5th March 2007
3 ORDER BY dfo_number DESC, tq_id, server_type DESC , process; DFO_NUMBER TQ_ID SERVER_TYPE PROCESS NUM_ROWS BYTES ---------- ---------- ------------------------------ ------------------------------ ---------- ---------- 1 0 Producer P000 1040684 6278550 Producer P001 1007316 6145050 Consumer P002 1024000 6211800 Consumer P003 1024000 6211800 1 Ranger QC 182 5890 Producer P002 113 1903 Producer P003 113 1903 Consumer P000 92 1533 Consumer P001 134 2231 2 Producer P000 46 433 Producer P001 67 635 Consumer QC 113 1068 12 rows selected. SQL> SQL> exit