Embed Size (px)
Citation preview
Parallel Duplicate Detection in Adverse Drug ReactionDatabases with Spark
Chen WangCSIRO
Sydney, [email protected]
Sarvnaz KarimiCSIRO
Sydney, [email protected]
ABSTRACTThe World Health Organization (WHO) and drug regula-tors in many countries maintain databases for adverse drugreaction reports. Data duplication is a significant problemin such databases as reports often come from a variety ofsources. Most duplicate detection techniques either havelimitations on handling large amount of data or lack effec-tive means to deal with data with imbalanced label distribu-tion. In this paper, we propose a scalable duplicate detec-tion method built on top of Spark to address these problems.Our method uses the kNN (k nearest neighbors) classifier toidentify labelled report pairs that are most useful for classi-fying new report pairs. To deal with the high computationalcost of kNN, we partition the labelled data into clusters forparallel computing. We give a method to minimize the cross-cluster kNN search. Our experimental results show that theproposed method is able to produce robust duplicate detec-tion results and scalable performance.
1. INTRODUCTIONAdverse drug reactions, or ADRs, impose significant haz-
ards to public health. They are one of the leading causesof hospitalization, disabilities, and death around the world.ADRs incur significant costs to health-care systems [10, 19].Post-marketing drug safety surveillance plays an increas-ingly important role in ADR detection in comparison withpre-marketing drug clinical trails as clinical trials have limi-tations on the number of patients involved and the diversityof patient groups. Post-marketing drug safety surveillancemainly uses Spontaneous Reporting Systems (SRS) to detectsignals of potential ADRs. These signals are then further as-sessed by experts to establish a causal relationship between adrug and an ADR. The World Health Organization (WHO)and drug regulators in many countries, such as the FDAin the US and the TGA in Australia maintain databasesfor adverse drug reaction reports. ADR reports are submit-ted from a variety of sources including general practitioners,pharmacists, hospitals, and consumers etc. The ADR report
c©2016, Copyright is with the authors. Published in Proc. 19th Inter-national Conference on Extending Database Technology (EDBT), March15-18, 2016 - Bordeaux, France: ISBN 978-3-89318-070-7, on OpenPro-ceedings.org. Distribution of this paper is permitted under the terms of theCreative Commons license CC-by-nc-nd 4.0
database is the major part of the reporting system. Manydrug safety assessment methods detect potential ADR sig-nals through the comparison of the reported ADR ratio of aspecific drug and that of other drugs in the database. Dis-proportionality often indicates a potential ADR signal [6, 7].As these methods are sensitive to the number of ADR re-ports, data quality in these databases is essential to the per-formance of ADR detection. One significant problem facedby such a database is report duplication. Duplicates oftenresult from two sources. First, reports from different datasources have overlaps as the same ADR may be reportedby different organizations through different channels. Sec-ond, the follow-up reports of the same ADR are wrongly putas separate records in the databases. Duplicates may dis-tort the report ratio of an ADR and affect the performanceof these methods significantly. Nkanza and Walop [17] re-ported a 5% duplication rate in vaccine adverse event data,providing an indication of the spread of the problem.
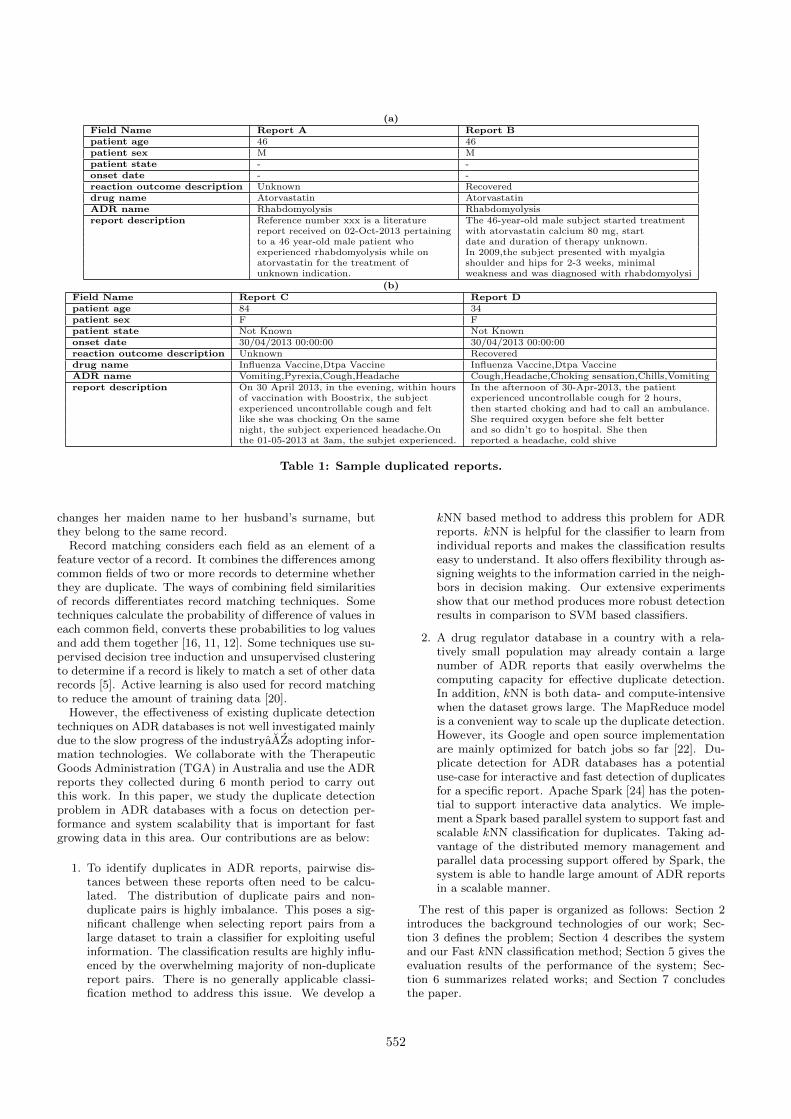
Duplicated reports in an ADR database are often not ex-actly the same in each field. Table 1 shows two examples.In the first example, report A and report B are duplicate,but they differ in the reaction outcome description field andreport description field. In the second example, report Cand report D are duplicate, but they differ in patient age,ADR name and report description field. The different valuesin the patient age field are likely to be an error introducedwhen entering a handwritten report.
A database record consists of multiple fields. Duplicatedetection techniques therefore have two levels: field match-ing and record matching. Field matching mainly concernscomparing numerical, categorical and string values in eachfield. Record matching concerns whether two or more fea-ture vectors formed by common fields belonging to differentrecords are duplicate.
There are many existing works on duplicate detection inrelational databases. Early works are referred as recordlinkage with a focus on linking together two or more sep-arately recorded pieces of information concerning an indi-vidual case [16]. Large amount of work deals with the com-parison of fields that can identify a particular record, such asname, address, and age. The values of these fields are nor-mally short strings. Many field matching techniques concernapproximate comparison of strings based on various similar-ity metrics. Commonly used string similarity metrics includeedit distance [13], Hamming distance [8], cosine distance andJaccard coefficient [3] etc. Field matching alone is not ableto detect many duplicates, e.g., two string values in the sur-name field can be totally different in the case that a woman
Industrial and Applications Paper
Series ISSN: 2367-2005 551 10.5441/002/edbt.2016.52
(a)
Field Name Report A Report Bpatient age 46 46patient sex M Mpatient state - -onset date - -reaction outcome description Unknown Recovereddrug name Atorvastatin AtorvastatinADR name Rhabdomyolysis Rhabdomyolysisreport description Reference number xxx is a literature The 46-year-old male subject started treatment
report received on 02-Oct-2013 pertaining with atorvastatin calcium 80 mg, startto a 46 year-old male patient who date and duration of therapy unknown.experienced rhabdomyolysis while on In 2009,the subject presented with myalgiaatorvastatin for the treatment of shoulder and hips for 2-3 weeks, minimalunknown indication. weakness and was diagnosed with rhabdomyolysi
(b)
Field Name Report C Report Dpatient age 84 34patient sex F Fpatient state Not Known Not Knownonset date 30/04/2013 00:00:00 30/04/2013 00:00:00reaction outcome description Unknown Recovereddrug name Influenza Vaccine,Dtpa Vaccine Influenza Vaccine,Dtpa VaccineADR name Vomiting,Pyrexia,Cough,Headache Cough,Headache,Choking sensation,Chills,Vomitingreport description On 30 April 2013, in the evening, within hours In the afternoon of 30-Apr-2013, the patient
of vaccination with Boostrix, the subject experienced uncontrollable cough for 2 hours,experienced uncontrollable cough and felt then started choking and had to call an ambulance.like she was chocking On the same She required oxygen before she felt betternight, the subject experienced headache.On and so didn’t go to hospital. She thenthe 01-05-2013 at 3am, the subjet experienced. reported a headache, cold shive
Table 1: Sample duplicated reports.
changes her maiden name to her husband’s surname, butthey belong to the same record.
Record matching considers each field as an element of afeature vector of a record. It combines the differences amongcommon fields of two or more records to determine whetherthey are duplicate. The ways of combining field similaritiesof records differentiates record matching techniques. Sometechniques calculate the probability of difference of values ineach common field, converts these probabilities to log valuesand add them together [16, 11, 12]. Some techniques use su-pervised decision tree induction and unsupervised clusteringto determine if a record is likely to match a set of other datarecords [5]. Active learning is also used for record matchingto reduce the amount of training data [20].
However, the effectiveness of existing duplicate detectiontechniques on ADR databases is not well investigated mainlydue to the slow progress of the industryaAZs adopting infor-mation technologies. We collaborate with the TherapeuticGoods Administration (TGA) in Australia and use the ADRreports they collected during 6 month period to carry outthis work. In this paper, we study the duplicate detectionproblem in ADR databases with a focus on detection per-formance and system scalability that is important for fastgrowing data in this area. Our contributions are as below:
1. To identify duplicates in ADR reports, pairwise dis-tances between these reports often need to be calcu-lated. The distribution of duplicate pairs and non-duplicate pairs is highly imbalance. This poses a sig-nificant challenge when selecting report pairs from alarge dataset to train a classifier for exploiting usefulinformation. The classification results are highly influ-enced by the overwhelming majority of non-duplicatereport pairs. There is no generally applicable classi-fication method to address this issue. We develop a
kNN based method to address this problem for ADRreports. kNN is helpful for the classifier to learn fromindividual reports and makes the classification resultseasy to understand. It also offers flexibility through as-signing weights to the information carried in the neigh-bors in decision making. Our extensive experimentsshow that our method produces more robust detectionresults in comparison to SVM based classifiers.
2. A drug regulator database in a country with a rela-tively small population may already contain a largenumber of ADR reports that easily overwhelms thecomputing capacity for effective duplicate detection.In addition, kNN is both data- and compute-intensivewhen the dataset grows large. The MapReduce modelis a convenient way to scale up the duplicate detection.However, its Google and open source implementationare mainly optimized for batch jobs so far [22]. Du-plicate detection for ADR databases has a potentialuse-case for interactive and fast detection of duplicatesfor a specific report. Apache Spark [24] has the poten-tial to support interactive data analytics. We imple-ment a Spark based parallel system to support fast andscalable kNN classification for duplicates. Taking ad-vantage of the distributed memory management andparallel data processing support offered by Spark, thesystem is able to handle large amount of ADR reportsin a scalable manner.
The rest of this paper is organized as follows: Section 2introduces the background technologies of our work; Sec-tion 3 defines the problem; Section 4 describes the systemand our Fast kNN classification method; Section 5 gives theevaluation results of the performance of the system; Sec-tion 6 summarizes related works; and Section 7 concludesthe paper.
552
2. BACKGROUND
2.1 kNN ClassificationIn a D-dimensional space D, s and t are two vectors rep-
resenting two data objects. We use d(s, t) to denote thedistance between s and t. Consider S and T are two setsof such vectors, for a vector s ∈ S, we denote its k near-est neighbors according to a given distance function in Tas knn(s, T, k). We assume that each t ∈ T is associatedwith a label Lt, Lt ∈ {−1,+1}. The labels of vectors in Sare unknown. We use knn+(s, T, k) to denote the vectorsin knn(s, T, k) with label “+1” and knn−(s, T, k) to denotevectors with label “−1”. kNN classifier assign a label to saccording to the following equation (note that the numberof vectors in knn(s, T, k) is an odd number):
Ls =
{+1,
∑t∈knn+(s,T,k) Lt +
∑t∈knn−(s,T,k) Lt > 0
−1,∑
t∈knn+(s,T,k) Lt +∑
t∈knn−(s,T,k) Lt < 0
(1)Assigning labels to each s ∈ S according to their nearestneighbors requires a kNN join operation between S and Tto identify k nearest neighbors of set S in T , denoted asS nknn T .
S nknn T = {(s, knn(s, T, k)|∀s ∈ S} (2)
2.2 SparkSpark [24] is a cluster computing framework that sup-
ports iterative and interactive data processing. It providesa level of data abstraction called resilient distributed datasets(RDDs) [23] to represent a set of immutable data objects.These data objects can be partitioned among a number ofcluster nodes. RDDs are fault-tolerant and can be recon-structed when their hosting nodes fail.
There are two types of operations that can be applied to aRDD in the Spark framework: transformations and actions.A transformation contains operations that produces a newRDD from an existing RDD while an action returns a valueafter operating on a RDD. Operations are often executed inparallel on a RDD. In addition to support map, reduce andaggregate operations on a RDD, Spark also offers operationssuch as join, union and cartesian to manipulate multipleRDDs. Different to MapReduce, RDDs where map and re-duce operate on can be persistent in memory in nodes of thecluster, which greatly improves the efficiency of iterative andinteractive applications. A duplicate detection system likethe one discussed in this paper is an iterative process thatcontains data processing of multiple stages and it fits theSpark framework well.
3. THE PROBLEMAn adverse drug reaction report database A stores reports
continuously collected by a regulator. We consider that aset of new reports, denoted by R arrive in the databasemay contain duplicates among themselves as well as withexisting reports in the database. The problem is to identifythe following set of report pairs:
Dupe(R,A) = {(r, h)|sim(r, h) < ε, ∀r ∈ R, ∀h ∈ A∪R−r}(3)
in which, sim is a scoring function that measures the similar-ity between two reports and ε is a threshold that determineswhether two reports are duplicate.
Duplicate detection within database A can been seen asa recursive process in which reports are sorted accordingto their arrival time to the database and reports with laterarrival time are checked for duplication against those withearlier arrival time.
Note that even though an ADR database may contain 5%of reports that have at least one duplicate in the database,when it comes to the number of duplicated report pairs, therate of duplicates is much lower. This is because the numberof report pairs grows quadratically with the number of re-ports and non-duplicate report pairs grows much faster thanduplicate report pairs. This results in highly imbalanced dis-tribution of duplicate and non-duplicate report pairs in thedataset derived from A.
4. THE SYSTEM
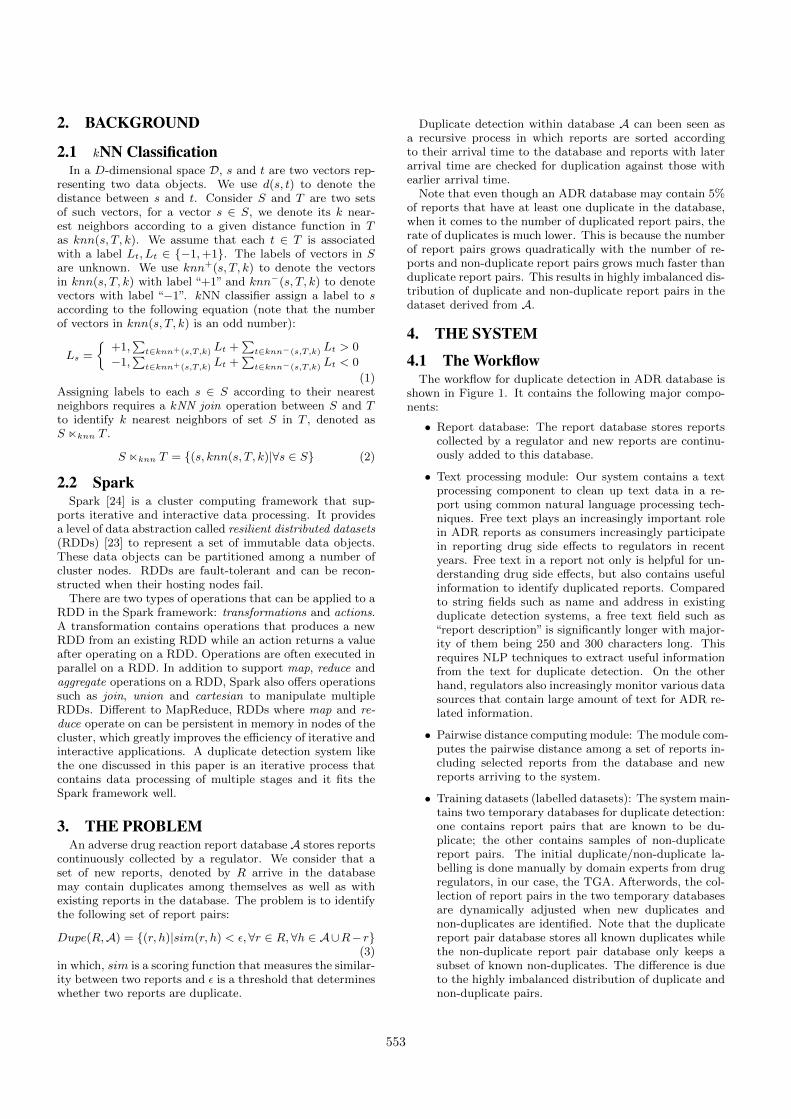
4.1 The WorkflowThe workflow for duplicate detection in ADR database is
shown in Figure 1. It contains the following major compo-nents:
• Report database: The report database stores reportscollected by a regulator and new reports are continu-ously added to this database.
• Text processing module: Our system contains a textprocessing component to clean up text data in a re-port using common natural language processing tech-niques. Free text plays an increasingly important rolein ADR reports as consumers increasingly participatein reporting drug side effects to regulators in recentyears. Free text in a report not only is helpful for un-derstanding drug side effects, but also contains usefulinformation to identify duplicated reports. Comparedto string fields such as name and address in existingduplicate detection systems, a free text field such as“report description” is significantly longer with major-ity of them being 250 and 300 characters long. Thisrequires NLP techniques to extract useful informationfrom the text for duplicate detection. On the otherhand, regulators also increasingly monitor various datasources that contain large amount of text for ADR re-lated information.
• Pairwise distance computing module: The module com-putes the pairwise distance among a set of reports in-cluding selected reports from the database and newreports arriving to the system.
• Training datasets (labelled datasets): The system main-tains two temporary databases for duplicate detection:one contains report pairs that are known to be du-plicate; the other contains samples of non-duplicatereport pairs. The initial duplicate/non-duplicate la-belling is done manually by domain experts from drugregulators, in our case, the TGA. Afterwords, the col-lection of report pairs in the two temporary databasesare dynamically adjusted when new duplicates andnon-duplicates are identified. Note that the duplicatereport pair database stores all known duplicates whilethe non-duplicate report pair database only keeps asubset of known non-duplicates. The difference is dueto the highly imbalanced distribution of duplicate andnon-duplicate pairs.
553
Processed reports
Labelled duplicates
ClassificationDuplicated report pairs
Labelled non-duplicates
New Reports
Text field
processing
Pairwise report
distances
Report Database
Unlabelled report pairs
Figure 1: The workflow of the system – the dashed line represents that the source data becomes part of thetarget data when the processing finishes.
• Classification module: The report pairs are fed intothe classification module that computes the scores foreach pair and generates a list of duplicate pairs given ascore threshold. Many classification algorithms fit intothis system framework. We use kNN classifier as thedefault one for this application area. One advantageof kNN is that the classification results are easy to ex-plain with human intuition and the basis of decisionmaking can be justified clearly. This characteristics isparticularly useful when the training dataset is highlyimbalanced and global algorithms are difficult to sep-arate them with general models.
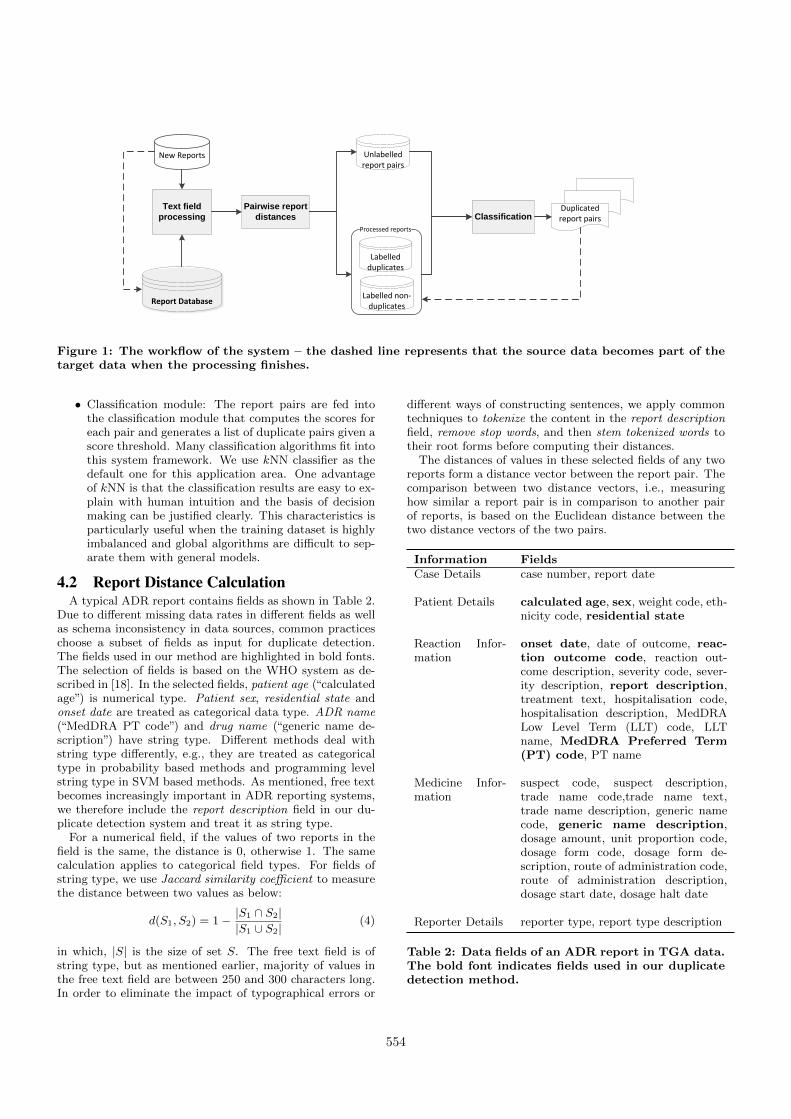
4.2 Report Distance CalculationA typical ADR report contains fields as shown in Table 2.
Due to different missing data rates in different fields as wellas schema inconsistency in data sources, common practiceschoose a subset of fields as input for duplicate detection.The fields used in our method are highlighted in bold fonts.The selection of fields is based on the WHO system as de-scribed in [18]. In the selected fields, patient age (“calculatedage”) is numerical type. Patient sex, residential state andonset date are treated as categorical data type. ADR name(“MedDRA PT code”) and drug name (“generic name de-scription”) have string type. Different methods deal withstring type differently, e.g., they are treated as categoricaltype in probability based methods and programming levelstring type in SVM based methods. As mentioned, free textbecomes increasingly important in ADR reporting systems,we therefore include the report description field in our du-plicate detection system and treat it as string type.
For a numerical field, if the values of two reports in thefield is the same, the distance is 0, otherwise 1. The samecalculation applies to categorical field types. For fields ofstring type, we use Jaccard similarity coefficient to measurethe distance between two values as below:
d(S1, S2) = 1− |S1 ∩ S2||S1 ∪ S2|
(4)
in which, |S| is the size of set S. The free text field is ofstring type, but as mentioned earlier, majority of values inthe free text field are between 250 and 300 characters long.In order to eliminate the impact of typographical errors or
different ways of constructing sentences, we apply commontechniques to tokenize the content in the report descriptionfield, remove stop words, and then stem tokenized words totheir root forms before computing their distances.
The distances of values in these selected fields of any tworeports form a distance vector between the report pair. Thecomparison between two distance vectors, i.e., measuringhow similar a report pair is in comparison to another pairof reports, is based on the Euclidean distance between thetwo distance vectors of the two pairs.
Information FieldsCase Details case number, report date
Patient Details calculated age, sex, weight code, eth-nicity code, residential state
Reaction Infor-mation
onset date, date of outcome, reac-tion outcome code, reaction out-come description, severity code, sever-ity description, report description,treatment text, hospitalisation code,hospitalisation description, MedDRALow Level Term (LLT) code, LLTname, MedDRA Preferred Term(PT) code, PT name
Medicine Infor-mation
suspect code, suspect description,trade name code,trade name text,trade name description, generic namecode, generic name description,dosage amount, unit proportion code,dosage form code, dosage form de-scription, route of administration code,route of administration description,dosage start date, dosage halt date
Reporter Details reporter type, report type description
Table 2: Data fields of an ADR report in TGA data.The bold font indicates fields used in our duplicatedetection method.
554
4.3 Fast kNN ClassificationWith the pairwise distances calculated, a kNN join is ap-
plied to labelled report pairs, denoted by T , and report pairscontaining new reports, denoted by S. The classification ofa report pair s ∈ S is based on the score computed from itsnearest neighbors in T . Due to the imbalanced distributionof positive and negative labels, the negative report pairs eas-ily overwhelm the positive ones. We therefore normalize thescore using the distance between two pairs as below.
scores =∑
t∈knn+(s,T,k)
1
sim(s, t)−
∑t∈knn−(s,T,k)
1
sim(s, t)
(5)The label of s is therefore determined by the following equa-tion, in which θ is a given threshold:
Ls =
{+1, scores ≥ θ−1, scores < θ
(6)
4.3.1 Parallelization StrategyConsider the number of report pairs in T is n and the
number of report pairs in S is m, the computing complexityof kNN classification is O(m·n) for join and O(m·k) for scorecalculation. n exhibits quadratic growth with the number ofreports. The amount of data to process easily overwhelms asingle server. To make the classification scalable, we parti-tion T and S into a set of clusters, denoted by {T1, T2, ..., Tb}and {S1, S2, ..., Sc} respectively. The cluster size in a parti-tion is adjusted to fit into the memory capacity of a comput-ing node. A naive parallelization strategy is to apply kNNjoin for each partition group {(Ti, Sj)|1 ≤ i ≤ b, 1 ≤ j ≤ c}and then merge the nearest neighbors from each partitiongroup. This approach does not reduce the overall comput-ing complexity and incurs high data transfer cost as eachpartition in S needs to compare with all partitions in T .The merge of intermediate nearest neighbors may poten-tially become another bottleneck that limits the scalability.
To address this problem, we exploit the locality of reportpairs in T in partitioning. We first partition report pairsusing k −means clustering to obtain c clusters. The centerof each cluster is calculated and stored in memory. Notethat clusters produced by k − means form a Voronoi di-agram where each report pair in a cluster is closer to thecenter of the cluster it belongs to than to any other clustercenters. We then assign each report pair s ∈ S to a clusterwhose center is the closest to s comparing to other clustercenters. It is likely that most of the k nearest neighbors ofs are within the cluster it is assigned, i.e., most of reportpairs in knn(s, T, k) can be found in knn(s, Ti, k) where Ti
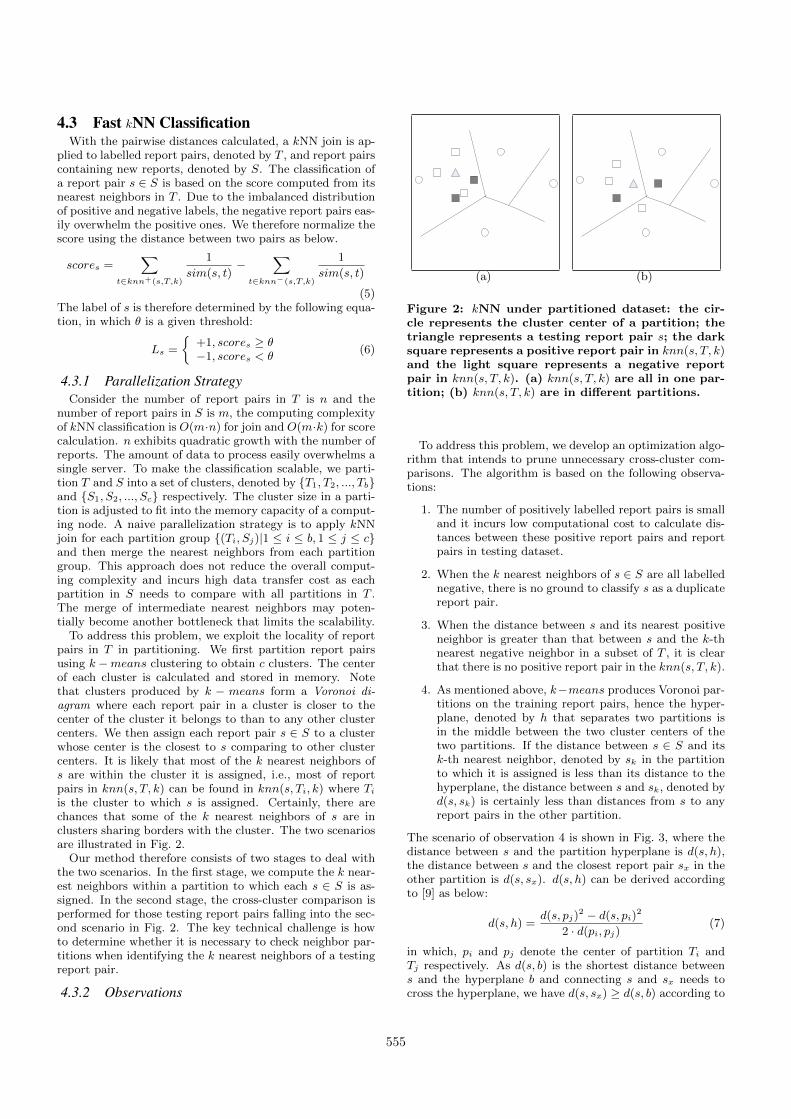
is the cluster to which s is assigned. Certainly, there arechances that some of the k nearest neighbors of s are inclusters sharing borders with the cluster. The two scenariosare illustrated in Fig. 2.
Our method therefore consists of two stages to deal withthe two scenarios. In the first stage, we compute the k near-est neighbors within a partition to which each s ∈ S is as-signed. In the second stage, the cross-cluster comparison isperformed for those testing report pairs falling into the sec-ond scenario in Fig. 2. The key technical challenge is howto determine whether it is necessary to check neighbor par-titions when identifying the k nearest neighbors of a testingreport pair.
4.3.2 Observations
(a) (b)
Figure 2: kNN under partitioned dataset: the cir-cle represents the cluster center of a partition; thetriangle represents a testing report pair s; the darksquare represents a positive report pair in knn(s, T, k)and the light square represents a negative reportpair in knn(s, T, k). (a) knn(s, T, k) are all in one par-tition; (b) knn(s, T, k) are in different partitions.
To address this problem, we develop an optimization algo-rithm that intends to prune unnecessary cross-cluster com-parisons. The algorithm is based on the following observa-tions:
1. The number of positively labelled report pairs is smalland it incurs low computational cost to calculate dis-tances between these positive report pairs and reportpairs in testing dataset.
2. When the k nearest neighbors of s ∈ S are all labellednegative, there is no ground to classify s as a duplicatereport pair.
3. When the distance between s and its nearest positiveneighbor is greater than that between s and the k-thnearest negative neighbor in a subset of T , it is clearthat there is no positive report pair in the knn(s, T, k).
4. As mentioned above, k−means produces Voronoi par-titions on the training report pairs, hence the hyper-plane, denoted by h that separates two partitions isin the middle between the two cluster centers of thetwo partitions. If the distance between s ∈ S and itsk-th nearest neighbor, denoted by sk in the partitionto which it is assigned is less than its distance to thehyperplane, the distance between s and sk, denoted byd(s, sk) is certainly less than distances from s to anyreport pairs in the other partition.
The scenario of observation 4 is shown in Fig. 3, where thedistance between s and the partition hyperplane is d(s, h),the distance between s and the closest report pair sx in theother partition is d(s, sx). d(s, h) can be derived accordingto [9] as below:
d(s, h) =d(s, pj)
2 − d(s, pi)2
2 · d(pi, pj)(7)
in which, pi and pj denote the center of partition Ti andTj respectively. As d(s, b) is the shortest distance betweens and the hyperplane b and connecting s and sx needs tocross the hyperplane, we have d(s, sx) ≥ d(s, b) according to
555
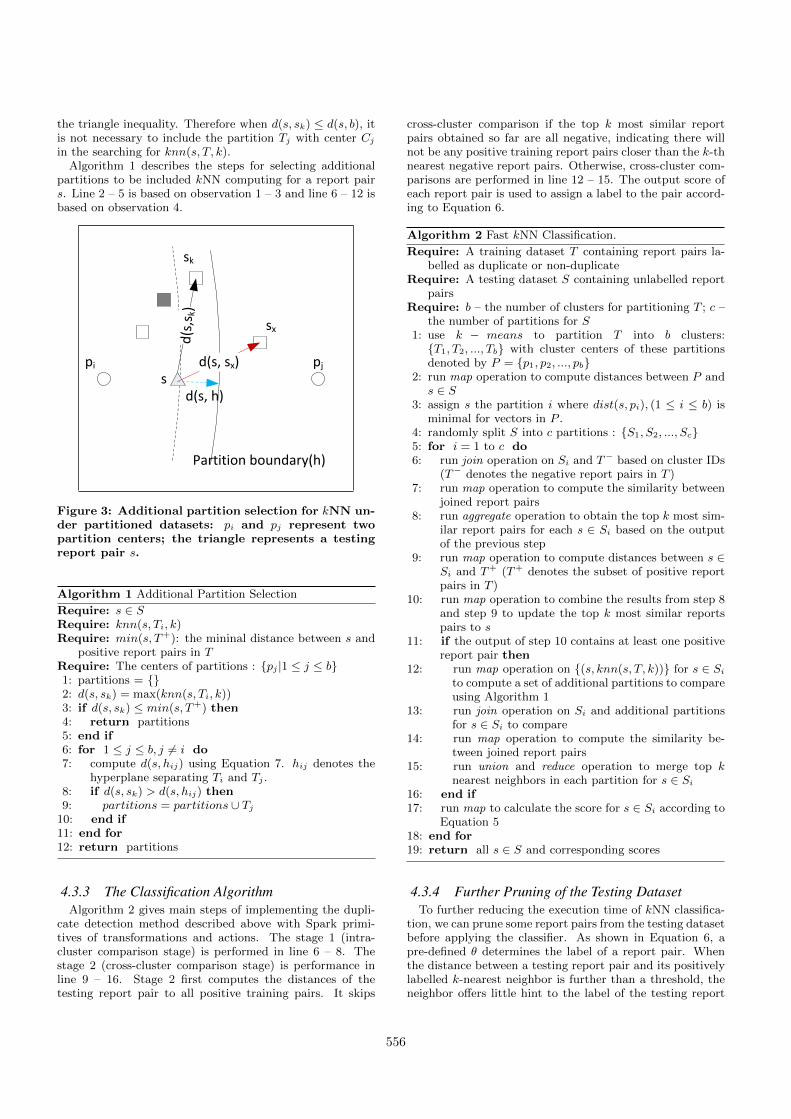
the triangle inequality. Therefore when d(s, sk) ≤ d(s, b), itis not necessary to include the partition Tj with center Cj
in the searching for knn(s, T, k).Algorithm 1 describes the steps for selecting additional
partitions to be included kNN computing for a report pairs. Line 2 – 5 is based on observation 1 – 3 and line 6 – 12 isbased on observation 4.
d(s
,sk)
d(s, sx)pi pj
s
sk
sx
Partition boundary(h)
d(s, h)
Figure 3: Additional partition selection for kNN un-der partitioned datasets: pi and pj represent twopartition centers; the triangle represents a testingreport pair s.
Algorithm 1 Additional Partition Selection
Require: s ∈ SRequire: knn(s, Ti, k)Require: min(s, T+): the mininal distance between s and
positive report pairs in TRequire: The centers of partitions : {pj |1 ≤ j ≤ b}1: partitions = {}2: d(s, sk) = max(knn(s, Ti, k))3: if d(s, sk) ≤ min(s, T+) then4: return partitions5: end if6: for 1 ≤ j ≤ b, j 6= i do7: compute d(s, hij) using Equation 7. hij denotes the
hyperplane separating Ti and Tj .8: if d(s, sk) > d(s, hij) then9: partitions = partitions ∪ Tj
10: end if11: end for12: return partitions
4.3.3 The Classification AlgorithmAlgorithm 2 gives main steps of implementing the dupli-
cate detection method described above with Spark primi-tives of transformations and actions. The stage 1 (intra-cluster comparison stage) is performed in line 6 – 8. Thestage 2 (cross-cluster comparison stage) is performance inline 9 – 16. Stage 2 first computes the distances of thetesting report pair to all positive training pairs. It skips
cross-cluster comparison if the top k most similar reportpairs obtained so far are all negative, indicating there willnot be any positive training report pairs closer than the k-thnearest negative report pairs. Otherwise, cross-cluster com-parisons are performed in line 12 – 15. The output score ofeach report pair is used to assign a label to the pair accord-ing to Equation 6.
Algorithm 2 Fast kNN Classification.
Require: A training dataset T containing report pairs la-belled as duplicate or non-duplicate
Require: A testing dataset S containing unlabelled reportpairs
Require: b – the number of clusters for partitioning T ; c –the number of partitions for S
1: use k − means to partition T into b clusters:{T1, T2, ..., Tb} with cluster centers of these partitionsdenoted by P = {p1, p2, ..., pb}
2: run map operation to compute distances between P ands ∈ S
3: assign s the partition i where dist(s, pi), (1 ≤ i ≤ b) isminimal for vectors in P .
4: randomly split S into c partitions : {S1, S2, ..., Sc}5: for i = 1 to c do6: run join operation on Si and T− based on cluster IDs
(T− denotes the negative report pairs in T )7: run map operation to compute the similarity between
joined report pairs8: run aggregate operation to obtain the top k most sim-
ilar report pairs for each s ∈ Si based on the outputof the previous step
9: run map operation to compute distances between s ∈Si and T+ (T+ denotes the subset of positive reportpairs in T )
10: run map operation to combine the results from step 8and step 9 to update the top k most similar reportspairs to s
11: if the output of step 10 contains at least one positivereport pair then
12: run map operation on {(s, knn(s, T, k))} for s ∈ Si
to compute a set of additional partitions to compareusing Algorithm 1
13: run join operation on Si and additional partitionsfor s ∈ Si to compare
14: run map operation to compute the similarity be-tween joined report pairs
15: run union and reduce operation to merge top knearest neighbors in each partition for s ∈ Si
16: end if17: run map to calculate the score for s ∈ Si according to
Equation 518: end for19: return all s ∈ S and corresponding scores
4.3.4 Further Pruning of the Testing DatasetTo further reducing the execution time of kNN classifica-
tion, we can prune some report pairs from the testing datasetbefore applying the classifier. As shown in Equation 6, apre-defined θ determines the label of a report pair. Whenthe distance between a testing report pair and its positivelylabelled k-nearest neighbor is further than a threshold, theneighbor offers little hint to the label of the testing report
556
pair because of the low similarity between the two pairs.This observation can be used to prune the testing dataset.
When the testing dataset is large and the positive trainingpairs accumulate along time, it is necessary to speedup thecomputation of distances between each report pair in thetesting dataset and each labelled positive report pair in thetraining dataset. We cluster the report pairs labelled aspositive and use the cluster centers to determine whether areport pair in the testing dataset should be included in theclassification. Assume the distance threshold between tworeport pairs is a function of θ, denoted as f(θ), The processis described as below:
Step 1. Cluster the positive report pairs into l clusters usingk-means. We denote the cluster centers as cpi(0 <i < l);
Step 2. Compute the distance of the furthest report pair toits center in each cluster. We denote these distancesas dcpi(0 < i < l);
Step 3. For each report pair t in the testing report pair set,do the following:
(a) For each 0 < i < l, calculate dist(t, cpi);
(b) if any dist(t, cpi) ≤ dcpi + f(θ), include t intothe testing set;
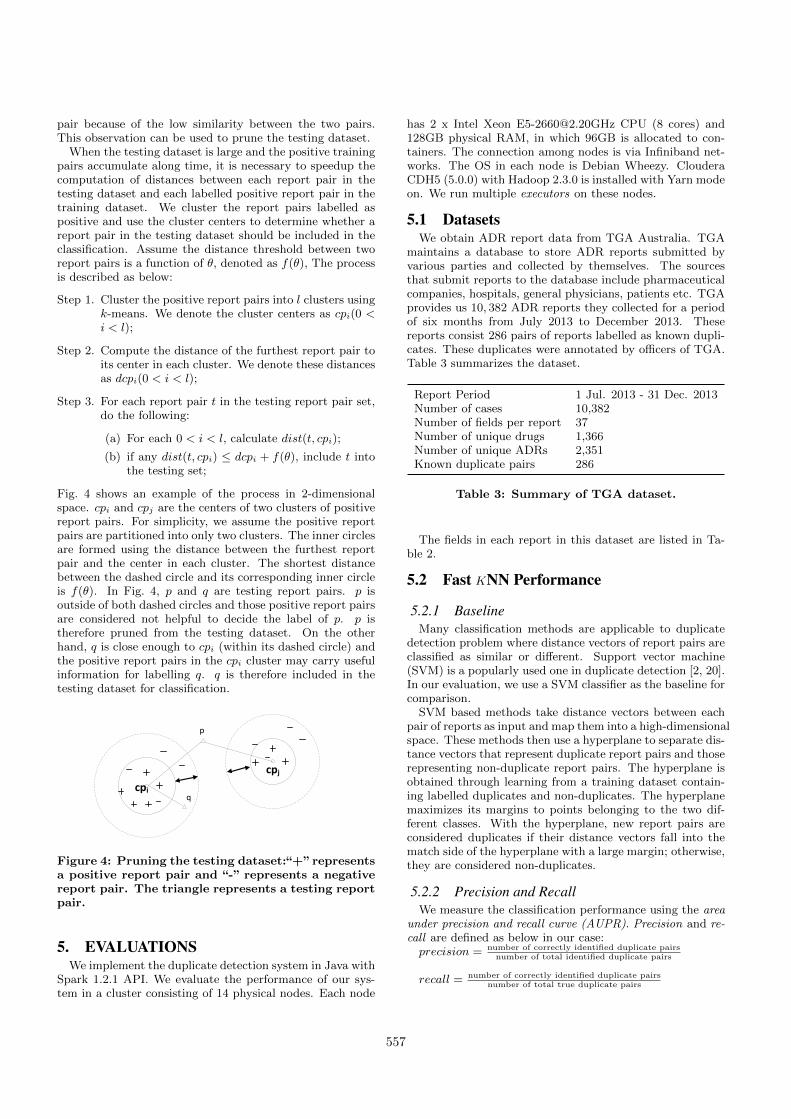
Fig. 4 shows an example of the process in 2-dimensionalspace. cpi and cpj are the centers of two clusters of positivereport pairs. For simplicity, we assume the positive reportpairs are partitioned into only two clusters. The inner circlesare formed using the distance between the furthest reportpair and the center in each cluster. The shortest distancebetween the dashed circle and its corresponding inner circleis f(θ). In Fig. 4, p and q are testing report pairs. p isoutside of both dashed circles and those positive report pairsare considered not helpful to decide the label of p. p istherefore pruned from the testing dataset. On the otherhand, q is close enough to cpi (within its dashed circle) andthe positive report pairs in the cpi cluster may carry usefulinformation for labelling q. q is therefore included in thetesting dataset for classification.
p
qcpi
cpj
Figure 4: Pruning the testing dataset:“+”representsa positive report pair and “-” represents a negativereport pair. The triangle represents a testing reportpair.
5. EVALUATIONSWe implement the duplicate detection system in Java with
Spark 1.2.1 API. We evaluate the performance of our sys-tem in a cluster consisting of 14 physical nodes. Each node
has 2 x Intel Xeon [email protected] CPU (8 cores) and128GB physical RAM, in which 96GB is allocated to con-tainers. The connection among nodes is via Infiniband net-works. The OS in each node is Debian Wheezy. ClouderaCDH5 (5.0.0) with Hadoop 2.3.0 is installed with Yarn modeon. We run multiple executors on these nodes.
5.1 DatasetsWe obtain ADR report data from TGA Australia. TGA
maintains a database to store ADR reports submitted byvarious parties and collected by themselves. The sourcesthat submit reports to the database include pharmaceuticalcompanies, hospitals, general physicians, patients etc. TGAprovides us 10, 382 ADR reports they collected for a periodof six months from July 2013 to December 2013. Thesereports consist 286 pairs of reports labelled as known dupli-cates. These duplicates were annotated by officers of TGA.Table 3 summarizes the dataset.
Report Period 1 Jul. 2013 - 31 Dec. 2013Number of cases 10,382Number of fields per report 37Number of unique drugs 1,366Number of unique ADRs 2,351Known duplicate pairs 286
Table 3: Summary of TGA dataset.
The fields in each report in this dataset are listed in Ta-ble 2.
5.2 Fast KNN Performance
5.2.1 BaselineMany classification methods are applicable to duplicate
detection problem where distance vectors of report pairs areclassified as similar or different. Support vector machine(SVM) is a popularly used one in duplicate detection [2, 20].In our evaluation, we use a SVM classifier as the baseline forcomparison.
SVM based methods take distance vectors between eachpair of reports as input and map them into a high-dimensionalspace. These methods then use a hyperplane to separate dis-tance vectors that represent duplicate report pairs and thoserepresenting non-duplicate report pairs. The hyperplane isobtained through learning from a training dataset contain-ing labelled duplicates and non-duplicates. The hyperplanemaximizes its margins to points belonging to the two dif-ferent classes. With the hyperplane, new report pairs areconsidered duplicates if their distance vectors fall into thematch side of the hyperplane with a large margin; otherwise,they are considered non-duplicates.
5.2.2 Precision and RecallWe measure the classification performance using the area
under precision and recall curve (AUPR). Precision and re-call are defined as below in our case:precision = number of correctly identified duplicate pairs
number of total identified duplicate pairs
recall = number of correctly identified duplicate pairsnumber of total true duplicate pairs
557
AUPR shows how the precision values vary with differentrecall values. AUPR is able to visualize the difference ofalgorithms compared to other metrics and suitable for highlyimbalanced datasets [4]. The goal to improve an algorithmwith the precision-recall curve metric is to move the curvetowards the upper-right corner.
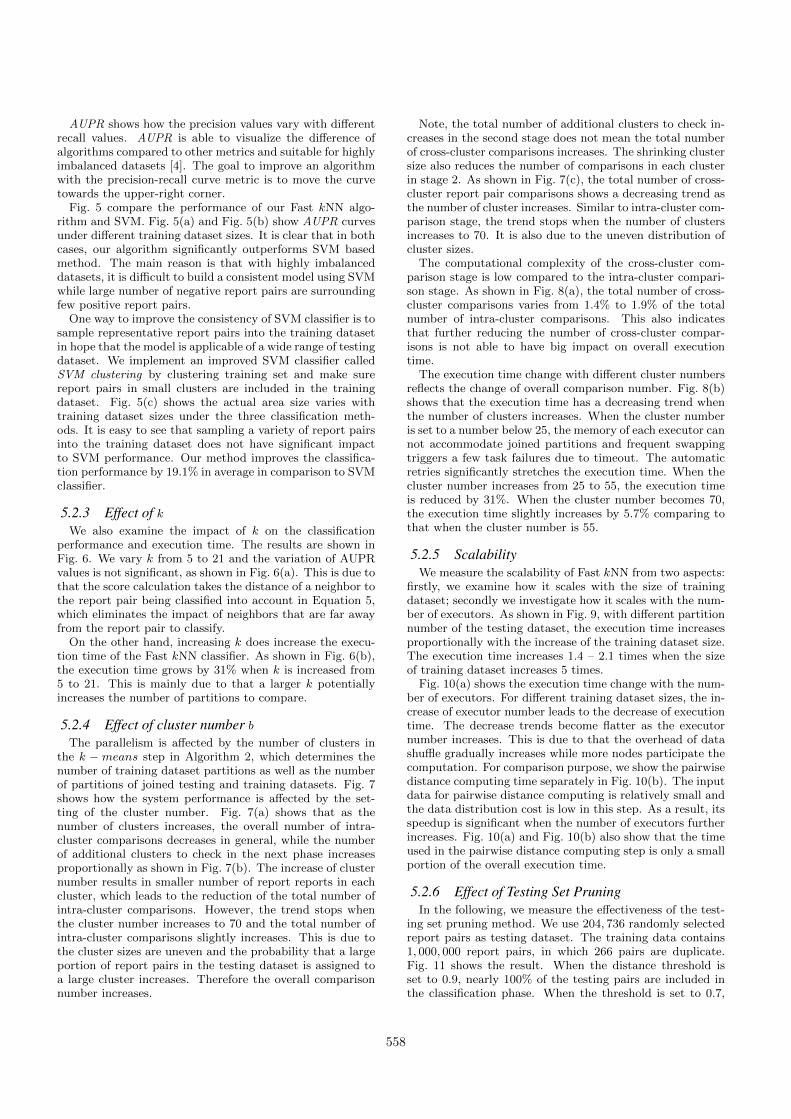
Fig. 5 compare the performance of our Fast kNN algo-rithm and SVM. Fig. 5(a) and Fig. 5(b) show AUPR curvesunder different training dataset sizes. It is clear that in bothcases, our algorithm significantly outperforms SVM basedmethod. The main reason is that with highly imbalanceddatasets, it is difficult to build a consistent model using SVMwhile large number of negative report pairs are surroundingfew positive report pairs.
One way to improve the consistency of SVM classifier is tosample representative report pairs into the training datasetin hope that the model is applicable of a wide range of testingdataset. We implement an improved SVM classifier calledSVM clustering by clustering training set and make surereport pairs in small clusters are included in the trainingdataset. Fig. 5(c) shows the actual area size varies withtraining dataset sizes under the three classification meth-ods. It is easy to see that sampling a variety of report pairsinto the training dataset does not have significant impactto SVM performance. Our method improves the classifica-tion performance by 19.1% in average in comparison to SVMclassifier.
5.2.3 Effect of kWe also examine the impact of k on the classification
performance and execution time. The results are shown inFig. 6. We vary k from 5 to 21 and the variation of AUPRvalues is not significant, as shown in Fig. 6(a). This is due tothat the score calculation takes the distance of a neighbor tothe report pair being classified into account in Equation 5,which eliminates the impact of neighbors that are far awayfrom the report pair to classify.
On the other hand, increasing k does increase the execu-tion time of the Fast kNN classifier. As shown in Fig. 6(b),the execution time grows by 31% when k is increased from5 to 21. This is mainly due to that a larger k potentiallyincreases the number of partitions to compare.
5.2.4 Effect of cluster number bThe parallelism is affected by the number of clusters in
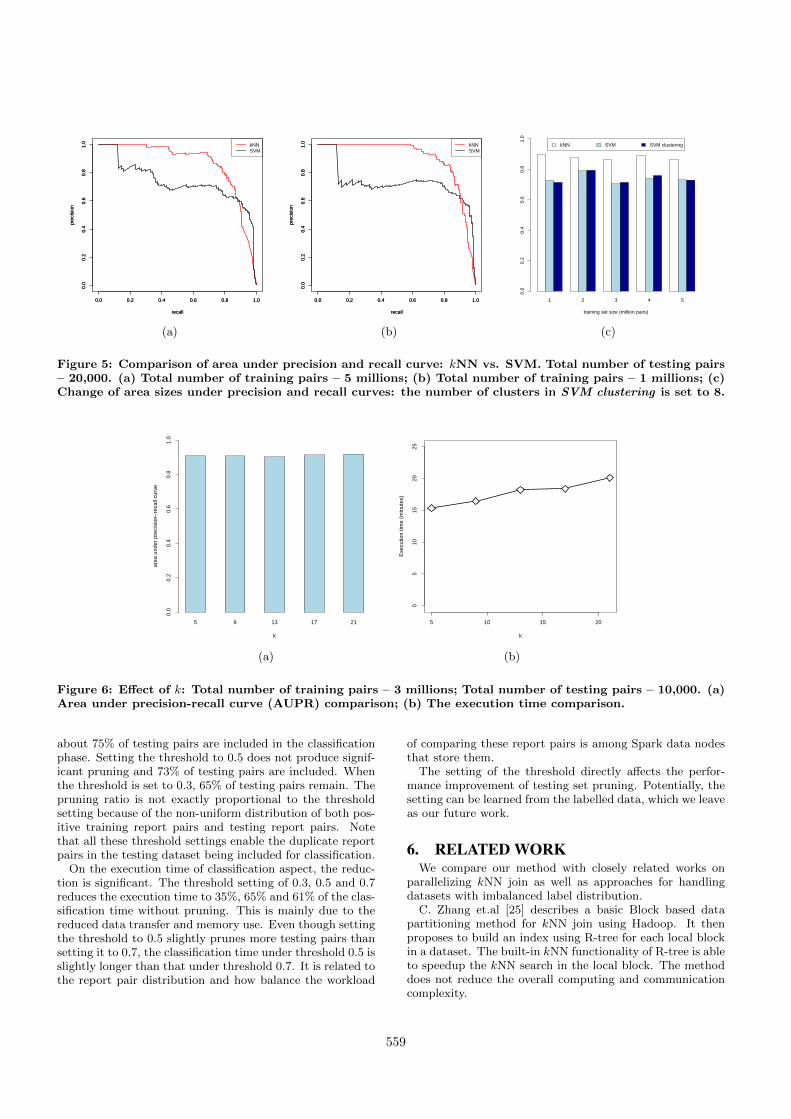
the k − means step in Algorithm 2, which determines thenumber of training dataset partitions as well as the numberof partitions of joined testing and training datasets. Fig. 7shows how the system performance is affected by the set-ting of the cluster number. Fig. 7(a) shows that as thenumber of clusters increases, the overall number of intra-cluster comparisons decreases in general, while the numberof additional clusters to check in the next phase increasesproportionally as shown in Fig. 7(b). The increase of clusternumber results in smaller number of report reports in eachcluster, which leads to the reduction of the total number ofintra-cluster comparisons. However, the trend stops whenthe cluster number increases to 70 and the total number ofintra-cluster comparisons slightly increases. This is due tothe cluster sizes are uneven and the probability that a largeportion of report pairs in the testing dataset is assigned toa large cluster increases. Therefore the overall comparisonnumber increases.
Note, the total number of additional clusters to check in-creases in the second stage does not mean the total numberof cross-cluster comparisons increases. The shrinking clustersize also reduces the number of comparisons in each clusterin stage 2. As shown in Fig. 7(c), the total number of cross-cluster report pair comparisons shows a decreasing trend asthe number of cluster increases. Similar to intra-cluster com-parison stage, the trend stops when the number of clustersincreases to 70. It is also due to the uneven distribution ofcluster sizes.
The computational complexity of the cross-cluster com-parison stage is low compared to the intra-cluster compari-son stage. As shown in Fig. 8(a), the total number of cross-cluster comparisons varies from 1.4% to 1.9% of the totalnumber of intra-cluster comparisons. This also indicatesthat further reducing the number of cross-cluster compar-isons is not able to have big impact on overall executiontime.
The execution time change with different cluster numbersreflects the change of overall comparison number. Fig. 8(b)shows that the execution time has a decreasing trend whenthe number of clusters increases. When the cluster numberis set to a number below 25, the memory of each executor cannot accommodate joined partitions and frequent swappingtriggers a few task failures due to timeout. The automaticretries significantly stretches the execution time. When thecluster number increases from 25 to 55, the execution timeis reduced by 31%. When the cluster number becomes 70,the execution time slightly increases by 5.7% comparing tothat when the cluster number is 55.
5.2.5 ScalabilityWe measure the scalability of Fast kNN from two aspects:
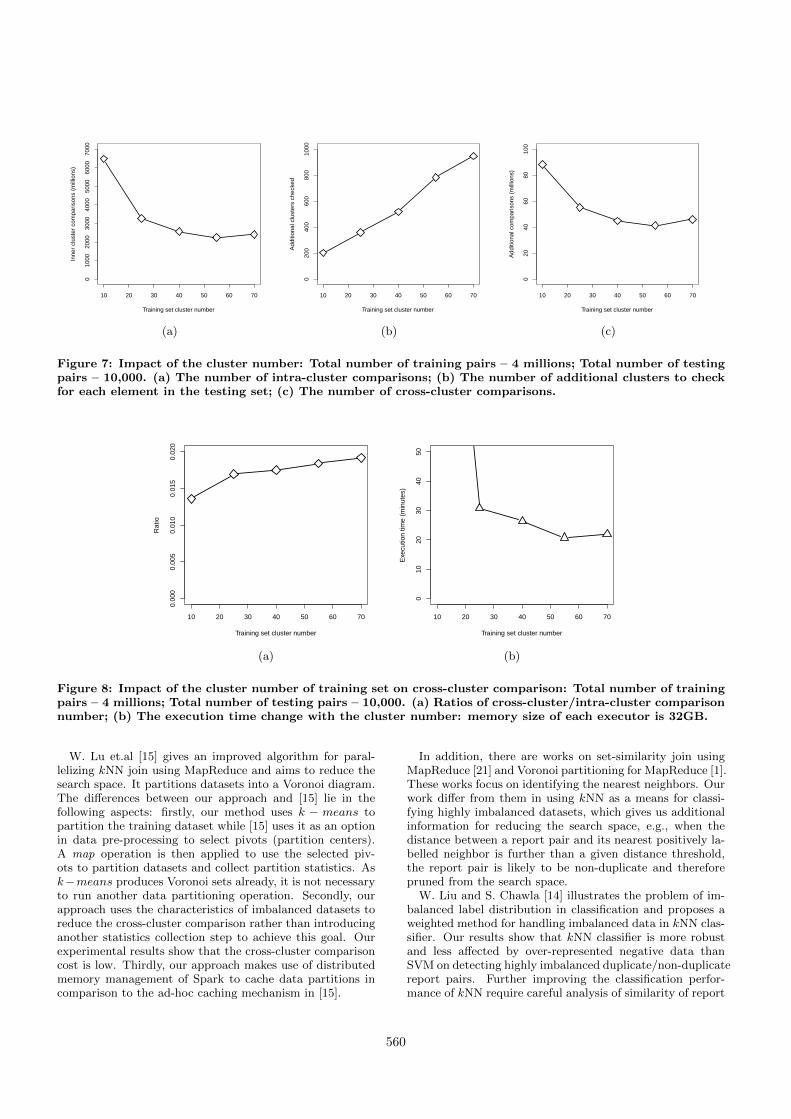
firstly, we examine how it scales with the size of trainingdataset; secondly we investigate how it scales with the num-ber of executors. As shown in Fig. 9, with different partitionnumber of the testing dataset, the execution time increasesproportionally with the increase of the training dataset size.The execution time increases 1.4 – 2.1 times when the sizeof training dataset increases 5 times.
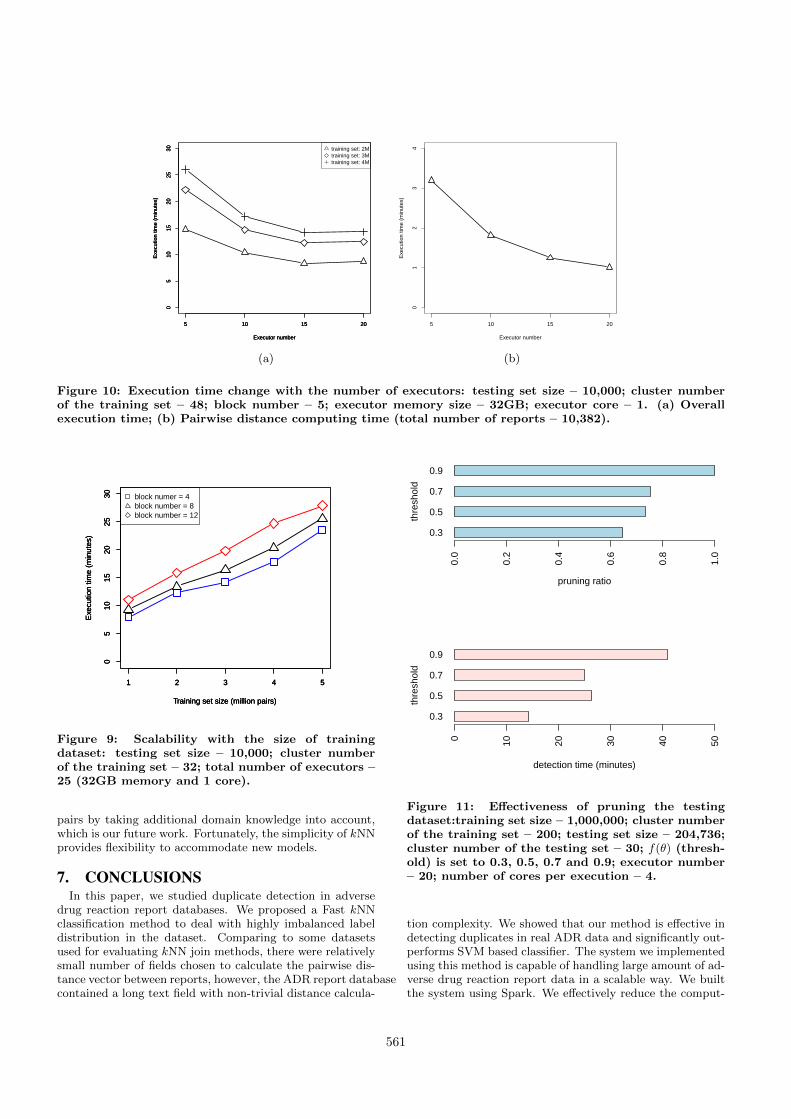
Fig. 10(a) shows the execution time change with the num-ber of executors. For different training dataset sizes, the in-crease of executor number leads to the decrease of executiontime. The decrease trends become flatter as the executornumber increases. This is due to that the overhead of datashuffle gradually increases while more nodes participate thecomputation. For comparison purpose, we show the pairwisedistance computing time separately in Fig. 10(b). The inputdata for pairwise distance computing is relatively small andthe data distribution cost is low in this step. As a result, itsspeedup is significant when the number of executors furtherincreases. Fig. 10(a) and Fig. 10(b) also show that the timeused in the pairwise distance computing step is only a smallportion of the overall execution time.
5.2.6 Effect of Testing Set PruningIn the following, we measure the effectiveness of the test-
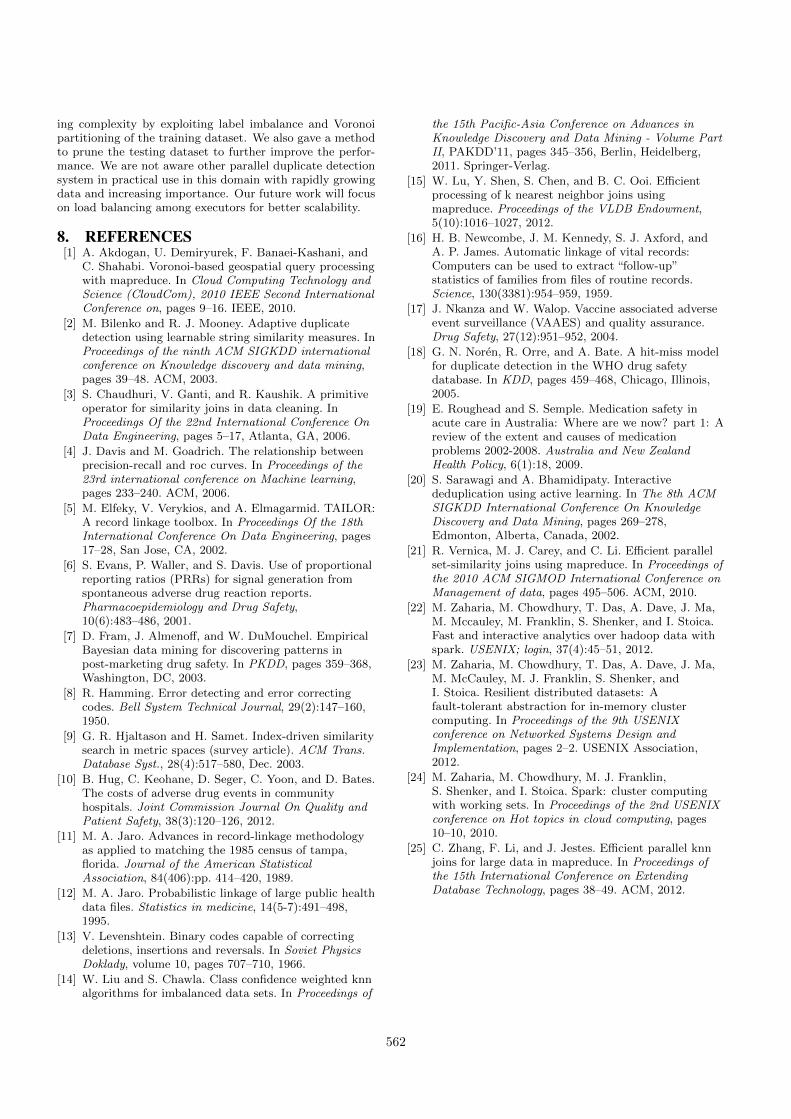
ing set pruning method. We use 204, 736 randomly selectedreport pairs as testing dataset. The training data contains1, 000, 000 report pairs, in which 266 pairs are duplicate.Fig. 11 shows the result. When the distance threshold isset to 0.9, nearly 100% of the testing pairs are included inthe classification phase. When the threshold is set to 0.7,
558
0.0 0.2 0.4 0.6 0.8 1.0
0.0
0.2
0.4
0.6
0.8
1.0
recall
prec
isio
n
0.0 0.2 0.4 0.6 0.8 1.0
0.0
0.2
0.4
0.6
0.8
1.0
recall
prec
isio
n
kNNSVM
(a)
0.0 0.2 0.4 0.6 0.8 1.00.
00.
20.
40.
60.
81.
0
recall
prec
isio
n
0.0 0.2 0.4 0.6 0.8 1.00.
00.
20.
40.
60.
81.
0
recall
prec
isio
n
kNNSVM
(b)
1 2 3 4 5
kNN SVM SVM clustering
training set size (million pairs)
0.0
0.2
0.4
0.6
0.8
1.0
(c)
Figure 5: Comparison of area under precision and recall curve: kNN vs. SVM. Total number of testing pairs– 20,000. (a) Total number of training pairs – 5 millions; (b) Total number of training pairs – 1 millions; (c)Change of area sizes under precision and recall curves: the number of clusters in SVM clustering is set to 8.
5 9 13 17 21
k
area
und
er p
reci
sion
−re
call
curv
e
0.0
0.2
0.4
0.6
0.8
1.0
(a)
5 10 15 20
05
1015
2025
k
Exe
cutio
n tim
e (m
inut
es)
(b)
Figure 6: Effect of k: Total number of training pairs – 3 millions; Total number of testing pairs – 10,000. (a)Area under precision-recall curve (AUPR) comparison; (b) The execution time comparison.
about 75% of testing pairs are included in the classificationphase. Setting the threshold to 0.5 does not produce signif-icant pruning and 73% of testing pairs are included. Whenthe threshold is set to 0.3, 65% of testing pairs remain. Thepruning ratio is not exactly proportional to the thresholdsetting because of the non-uniform distribution of both pos-itive training report pairs and testing report pairs. Notethat all these threshold settings enable the duplicate reportpairs in the testing dataset being included for classification.
On the execution time of classification aspect, the reduc-tion is significant. The threshold setting of 0.3, 0.5 and 0.7reduces the execution time to 35%, 65% and 61% of the clas-sification time without pruning. This is mainly due to thereduced data transfer and memory use. Even though settingthe threshold to 0.5 slightly prunes more testing pairs thansetting it to 0.7, the classification time under threshold 0.5 isslightly longer than that under threshold 0.7. It is related tothe report pair distribution and how balance the workload
of comparing these report pairs is among Spark data nodesthat store them.
The setting of the threshold directly affects the perfor-mance improvement of testing set pruning. Potentially, thesetting can be learned from the labelled data, which we leaveas our future work.
6. RELATED WORKWe compare our method with closely related works on
parallelizing kNN join as well as approaches for handlingdatasets with imbalanced label distribution.
C. Zhang et.al [25] describes a basic Block based datapartitioning method for kNN join using Hadoop. It thenproposes to build an index using R-tree for each local blockin a dataset. The built-in kNN functionality of R-tree is ableto speedup the kNN search in the local block. The methoddoes not reduce the overall computing and communicationcomplexity.
559
10 20 30 40 50 60 70
010
0020
0030
0040
0050
0060
0070
00
Training set cluster number
Inne
r cl
uste
r co
mpa
rison
s (m
illio
ns)
(a)
10 20 30 40 50 60 70
020
040
060
080
010
00Training set cluster number
Add
ition
al c
lust
ers
chec
ked
(b)
10 20 30 40 50 60 70
020
4060
8010
0
Training set cluster number
Add
ition
al c
ompa
rison
s (m
illio
ns)
(c)
Figure 7: Impact of the cluster number: Total number of training pairs – 4 millions; Total number of testingpairs – 10,000. (a) The number of intra-cluster comparisons; (b) The number of additional clusters to checkfor each element in the testing set; (c) The number of cross-cluster comparisons.
10 20 30 40 50 60 70
0.00
00.
005
0.01
00.
015
0.02
0
Training set cluster number
Rat
io
(a)
10 20 30 40 50 60 70
010
2030
4050
Training set cluster number
Exe
cutio
n tim
e (m
inut
es)
(b)
Figure 8: Impact of the cluster number of training set on cross-cluster comparison: Total number of trainingpairs – 4 millions; Total number of testing pairs – 10,000. (a) Ratios of cross-cluster/intra-cluster comparisonnumber; (b) The execution time change with the cluster number: memory size of each executor is 32GB.
W. Lu et.al [15] gives an improved algorithm for paral-lelizing kNN join using MapReduce and aims to reduce thesearch space. It partitions datasets into a Voronoi diagram.The differences between our approach and [15] lie in thefollowing aspects: firstly, our method uses k − means topartition the training dataset while [15] uses it as an optionin data pre-processing to select pivots (partition centers).A map operation is then applied to use the selected piv-ots to partition datasets and collect partition statistics. Ask−means produces Voronoi sets already, it is not necessaryto run another data partitioning operation. Secondly, ourapproach uses the characteristics of imbalanced datasets toreduce the cross-cluster comparison rather than introducinganother statistics collection step to achieve this goal. Ourexperimental results show that the cross-cluster comparisoncost is low. Thirdly, our approach makes use of distributedmemory management of Spark to cache data partitions incomparison to the ad-hoc caching mechanism in [15].
In addition, there are works on set-similarity join usingMapReduce [21] and Voronoi partitioning for MapReduce [1].These works focus on identifying the nearest neighbors. Ourwork differ from them in using kNN as a means for classi-fying highly imbalanced datasets, which gives us additionalinformation for reducing the search space, e.g., when thedistance between a report pair and its nearest positively la-belled neighbor is further than a given distance threshold,the report pair is likely to be non-duplicate and thereforepruned from the search space.
W. Liu and S. Chawla [14] illustrates the problem of im-balanced label distribution in classification and proposes aweighted method for handling imbalanced data in kNN clas-sifier. Our results show that kNN classifier is more robustand less affected by over-represented negative data thanSVM on detecting highly imbalanced duplicate/non-duplicatereport pairs. Further improving the classification perfor-mance of kNN require careful analysis of similarity of report
560
5 10 15 20
05
1015
2025
30
Executor number
Exe
cutio
n tim
e (m
inut
es)
5 10 15 20
05
1015
2025
30
Executor number
Exe
cutio
n tim
e (m
inut
es)
5 10 15 20
05
1015
2025
30
Executor number
Exe
cutio
n tim
e (m
inut
es)
training set: 2Mtraining set: 3Mtraining set: 4M
(a)
5 10 15 20
01
23
4
Executor number
Exe
cutio
n tim
e (m
inut
es)
(b)
Figure 10: Execution time change with the number of executors: testing set size – 10,000; cluster numberof the training set – 48; block number – 5; executor memory size – 32GB; executor core – 1. (a) Overallexecution time; (b) Pairwise distance computing time (total number of reports – 10,382).
1 2 3 4 5
05
1015
2025
30
Training set size (million pairs)
Exe
cutio
n tim
e (m
inut
es)
1 2 3 4 5
05
1015
2025
30
Training set size (million pairs)
Exe
cutio
n tim
e (m
inut
es)
1 2 3 4 5
05
1015
2025
30
Training set size (million pairs)
Exe
cutio
n tim
e (m
inut
es)
block numer = 4block number = 8block number = 12
Figure 9: Scalability with the size of trainingdataset: testing set size – 10,000; cluster numberof the training set – 32; total number of executors –25 (32GB memory and 1 core).
pairs by taking additional domain knowledge into account,which is our future work. Fortunately, the simplicity of kNNprovides flexibility to accommodate new models.
7. CONCLUSIONSIn this paper, we studied duplicate detection in adverse
drug reaction report databases. We proposed a Fast kNNclassification method to deal with highly imbalanced labeldistribution in the dataset. Comparing to some datasetsused for evaluating kNN join methods, there were relativelysmall number of fields chosen to calculate the pairwise dis-tance vector between reports, however, the ADR report databasecontained a long text field with non-trivial distance calcula-
0.3
0.5
0.7
0.9
pruning ratio
thre
shol
d
0.0
0.2
0.4
0.6
0.8
1.0
0.3
0.5
0.7
0.9
detection time (minutes)
thre
shol
d
0 10 20 30 40 50
Figure 11: Effectiveness of pruning the testingdataset:training set size – 1,000,000; cluster numberof the training set – 200; testing set size – 204,736;cluster number of the testing set – 30; f(θ) (thresh-old) is set to 0.3, 0.5, 0.7 and 0.9; executor number– 20; number of cores per execution – 4.
tion complexity. We showed that our method is effective indetecting duplicates in real ADR data and significantly out-performs SVM based classifier. The system we implementedusing this method is capable of handling large amount of ad-verse drug reaction report data in a scalable way. We builtthe system using Spark. We effectively reduce the comput-
561
ing complexity by exploiting label imbalance and Voronoipartitioning of the training dataset. We also gave a methodto prune the testing dataset to further improve the perfor-mance. We are not aware other parallel duplicate detectionsystem in practical use in this domain with rapidly growingdata and increasing importance. Our future work will focuson load balancing among executors for better scalability.
8. REFERENCES[1] A. Akdogan, U. Demiryurek, F. Banaei-Kashani, and
C. Shahabi. Voronoi-based geospatial query processingwith mapreduce. In Cloud Computing Technology andScience (CloudCom), 2010 IEEE Second InternationalConference on, pages 9–16. IEEE, 2010.
[2] M. Bilenko and R. J. Mooney. Adaptive duplicatedetection using learnable string similarity measures. InProceedings of the ninth ACM SIGKDD internationalconference on Knowledge discovery and data mining,pages 39–48. ACM, 2003.
[3] S. Chaudhuri, V. Ganti, and R. Kaushik. A primitiveoperator for similarity joins in data cleaning. InProceedings Of the 22nd International Conference OnData Engineering, pages 5–17, Atlanta, GA, 2006.
[4] J. Davis and M. Goadrich. The relationship betweenprecision-recall and roc curves. In Proceedings of the23rd international conference on Machine learning,pages 233–240. ACM, 2006.
[5] M. Elfeky, V. Verykios, and A. Elmagarmid. TAILOR:A record linkage toolbox. In Proceedings Of the 18thInternational Conference On Data Engineering, pages17–28, San Jose, CA, 2002.
[6] S. Evans, P. Waller, and S. Davis. Use of proportionalreporting ratios (PRRs) for signal generation fromspontaneous adverse drug reaction reports.Pharmacoepidemiology and Drug Safety,10(6):483–486, 2001.
[7] D. Fram, J. Almenoff, and W. DuMouchel. EmpiricalBayesian data mining for discovering patterns inpost-marketing drug safety. In PKDD, pages 359–368,Washington, DC, 2003.
[8] R. Hamming. Error detecting and error correctingcodes. Bell System Technical Journal, 29(2):147–160,1950.
[9] G. R. Hjaltason and H. Samet. Index-driven similaritysearch in metric spaces (survey article). ACM Trans.Database Syst., 28(4):517–580, Dec. 2003.
[10] B. Hug, C. Keohane, D. Seger, C. Yoon, and D. Bates.The costs of adverse drug events in communityhospitals. Joint Commission Journal On Quality andPatient Safety, 38(3):120–126, 2012.
[11] M. A. Jaro. Advances in record-linkage methodologyas applied to matching the 1985 census of tampa,florida. Journal of the American StatisticalAssociation, 84(406):pp. 414–420, 1989.
[12] M. A. Jaro. Probabilistic linkage of large public healthdata files. Statistics in medicine, 14(5-7):491–498,1995.
[13] V. Levenshtein. Binary codes capable of correctingdeletions, insertions and reversals. In Soviet PhysicsDoklady, volume 10, pages 707–710, 1966.
[14] W. Liu and S. Chawla. Class confidence weighted knnalgorithms for imbalanced data sets. In Proceedings of
the 15th Pacific-Asia Conference on Advances inKnowledge Discovery and Data Mining - Volume PartII, PAKDD’11, pages 345–356, Berlin, Heidelberg,2011. Springer-Verlag.
[15] W. Lu, Y. Shen, S. Chen, and B. C. Ooi. Efficientprocessing of k nearest neighbor joins usingmapreduce. Proceedings of the VLDB Endowment,5(10):1016–1027, 2012.
[16] H. B. Newcombe, J. M. Kennedy, S. J. Axford, andA. P. James. Automatic linkage of vital records:Computers can be used to extract “follow-up”statistics of families from files of routine records.Science, 130(3381):954–959, 1959.
[17] J. Nkanza and W. Walop. Vaccine associated adverseevent surveillance (VAAES) and quality assurance.Drug Safety, 27(12):951–952, 2004.
[18] G. N. Noren, R. Orre, and A. Bate. A hit-miss modelfor duplicate detection in the WHO drug safetydatabase. In KDD, pages 459–468, Chicago, Illinois,2005.
[19] E. Roughead and S. Semple. Medication safety inacute care in Australia: Where are we now? part 1: Areview of the extent and causes of medicationproblems 2002-2008. Australia and New ZealandHealth Policy, 6(1):18, 2009.
[20] S. Sarawagi and A. Bhamidipaty. Interactivededuplication using active learning. In The 8th ACMSIGKDD International Conference On KnowledgeDiscovery and Data Mining, pages 269–278,Edmonton, Alberta, Canada, 2002.
[21] R. Vernica, M. J. Carey, and C. Li. Efficient parallelset-similarity joins using mapreduce. In Proceedings ofthe 2010 ACM SIGMOD International Conference onManagement of data, pages 495–506. ACM, 2010.
[22] M. Zaharia, M. Chowdhury, T. Das, A. Dave, J. Ma,M. Mccauley, M. Franklin, S. Shenker, and I. Stoica.Fast and interactive analytics over hadoop data withspark. USENIX; login, 37(4):45–51, 2012.
[23] M. Zaharia, M. Chowdhury, T. Das, A. Dave, J. Ma,M. McCauley, M. J. Franklin, S. Shenker, andI. Stoica. Resilient distributed datasets: Afault-tolerant abstraction for in-memory clustercomputing. In Proceedings of the 9th USENIXconference on Networked Systems Design andImplementation, pages 2–2. USENIX Association,2012.
[24] M. Zaharia, M. Chowdhury, M. J. Franklin,S. Shenker, and I. Stoica. Spark: cluster computingwith working sets. In Proceedings of the 2nd USENIXconference on Hot topics in cloud computing, pages10–10, 2010.
[25] C. Zhang, F. Li, and J. Jestes. Efficient parallel knnjoins for large data in mapreduce. In Proceedings ofthe 15th International Conference on ExtendingDatabase Technology, pages 38–49. ACM, 2012.
562