Embed Size (px)
Citation preview

Phonetics Separatum Editor: K. Kohlcr, I e l Publ~sher: S. Kargcr AG, Bavl
Pnnted In Swtzerland
Phonetica 1988; 45: 1-29 O 1988 S. Karger AG. * '
0031-8388/88/0451-M)01 S 2
Paralinguistic Variation and Invariance in the Characteristic Frequencies of Vowels
Hartrnut Traunmiiller
Institutionen fOr Lingvistik, Stockholms Universitet, Stockholm, Sweden
Abstract. It is shown that within-speaker variations in vocal effort and phonation affect fundamental frequency (Fo) and the formant frequencies of vowels in the sense of a linear compression/expansion of the spectral separations between them, given an adequate scal- ing of pitch. Between-speaker variations in size correspond to a translation of the spectral peaks shaped by Fo and the formants if pitch is scaled tonotopically (in Bark). On the basis of these observations, invariant cues to vowel quality are suggested. It is further shown that vowels produced by adult women tend to be phonetically more explicit and, hence, more peripheral in 'vowel space' than those of men and children. It is also shown that the for- mant frequencies of vowels subjected to paralinguistic variation are related by power func- tions of frequency.
Introduction
A main line of research within experi-
i mental phonetics is concerned with the vari-
j ation of the acoustic properties of speech : sounds and with the search for generally ' valid acoustic correlates to phonetic distinc-
tions made by listeners. There are several , sources of variation in the acoustic proper-
ties of speech signals. The conditions of speech signal transmission between speaker and listener are the source of one kind of variation, which affects the acoustic proper- ties of a speech signal, but which within
wide limits does not affect its phonetic quality. Another kind of variation involves audible differences in phonetic quality, such as would be reflected in a phonetic transcription, between utterances with the same meaning. These can be called 'linguis- tic' (dialectal, sociolectal, idiolectal, phono- stylistic) variations. Another dichotomy is that between, on the one hand, variation due to context (coarticulation, syntax) or context effects on the perceived phonetic quality of segments and, on the other hand, variation due to factors other than the lin- guistic context.

In this paper we are not concerned with variations due to context, nor with linguis- tic variation, but only with the paralinguis- tic type of variations in the spectral proper- ties of vowels, such as due to differences between speakers in size, age and sex, and to their varying attitude, emotion, and au- dibility considerations. The paper is further restricted to an analysis of those acoustic properties whose variation, ceteris paribus, results in a substantial effect on perceived vowel quality, i.e., to the frequency posi- tions of the formants [Carlson and Granstrom, 19791 and to fundamental fre- quency (F,) [Traunmiiller, 198 I].
The mentioned personal factors affect the production of speech in several ways, and the resulting variation carries biologi- cally important information, being charac- teristic or 'symptomatic' of the speaker. As listeners, we are highly aware of this infor- mation. When we hear just a single vowel sound we hear immediately whether it has been produced by a man, a woman, or a child. We perceive the degree of vocal ef- fort invested by the speaker, and if he is emotionally affected, we can hear whether he is cheerful, grieved, angry, or afraid. For this, it is not necessary to have perceived the phonetic quality of the vowel. The sys- tem of human paralinguistic communica- tion, which shares essential features with the equivalent systems of several other spe- cies, appears to have priority over the facil- ity of linguistic communication specific to humans.
While the acoustic consequences of the age- and sex-related variations in the shape and overall size of the vocal tract, including the glottal structures, are quite substantial, this does not appear to hinder speech com- munication. The expression of emotions
Traunmiiller
does not restrict the expression of phonetic quality either, except in extreme cases. Vari- ations in vocal effort and in mode of phon- ation (voiced versus whispered speech) are used by speakers in order to adapt to vari- ous demands set by environmental circum- stances: We shout in order to be heard by an addressee and we whisper in order not to be heard by others. This kind of variation is also essentially involved in the expression of emotions and attitudes. We are going to analyze the acoustic and perceptual conse- quences of these kinds of variation.
Peterson and Barney [I9521 observed that the formant frequencies of vowels are reproduced with high precision by a speaker repeating the same utterance, while there is much more variation between speakers, in particular if they differ in age or sex. Their set of data includes, however, also considerable linguistic variation in phonetic quality. Also in attempts to 'nor- malize' formant frequency data on vowels a strict distinction between phonetic and non- phonetic variation was not always made [e.g. Disner, 19801. For some restricted ap- plications, e.g. in automatic speech recogni- tion, such a distinction may not be as essen- tial as it is if we aim at an understanding of human speech perception. Subsequent to Peterson and Barney's [I9521 observation most studies aiming at an understanding of vowel formant frequency variation from a viewpoint of production or perception were concerned with interspeaker variation [Ladefoged and Broadbent, 1957; Fant, 1966, 1975; Fujisaki and Kawashima, 1968; Pols et al., 1969; Nordstrom, 1977; Kent and Forner, 1979; Goldstein, 1980; Anan- thapadmanabha, 1984; Bladon et al., 1984; Traunmiiller, 1984; Syrdal, 1985; Syrdal and Gopal, 19861.

iation in Vow els 3
Phoneticians appear to have overlooked Table I. Characteristic frequencies of vowels in the intraspeaker variations in formant fre- French /CVCV/ words, spoken and shouted by 3
quencies that should be expected as a con- male and 3 female speakers, according to Rostol- land and Parant [1974].
sequence of the fact that individual speak- ers are capable of producing the same Characteristic Speaking Shouting Shouting/
vowels with quite different articulations: It frequency speaking is generally known that we open our Mean Fo 200 437 2.2 mouths more when shouting than when Median Fl 400 750 1.9 speaking softly. The articulatory, acoustic Median F2 1,500 1,600 1.1
and perceptual consequences of variations Median F3 2,250 2,300 1.0 in vocal effort have only recently been Median F4 3.750 3,100 0.8
sut -
tjected to thorough experimental investi- Reliability of data on FI to F4 in shouting is in ques- ion [Rostolland, 1982; Schulman, 19881. tion. e effects of variations in vocal effort
not been considered in treatises on theories of speech production and percep- tion such as 'action theory' [Fowler et al., 19801 and 'the motor theory of speech per- and frequent appearance of parts of sen- ception' [Libeman and Mattingly, 19851, tences being whispered. to which these effects appear to be cru- We are going to include Fo among the cially relevant. 'characteristic frequencies' of vowels, as
motivated below, but concerning their pho- netic quality, Fo is not informative unless
WithinSpeaker Variation the formant frequencies, in particular F,, also are known. Williams and Stevens
The spectral variations we find within [I9721 observed an effect on F, in addition speakers concern mainly intonation, mode to Fo: F, is higher in stressed vowels in ut- of phonation, and vocal effort. Studies con- terances produced under anger, as com- cerned with the expression of emotions pared with the same utterances produced [Williams and Stevens, 19721 focused on the without emotion. They published, however, effects of real or imitated emotions on Fo, no quantitative data on this effect. As for signal intensity, and on segment durations. attitudinal variations, I am not aware of any
ten: bee emc
Average Fo, range of Fo variation, signal in- formant frequency measurements. sity, and segment durations have all n shown to vary as a function of the Vocal Effort, F,, and Perceived Openness ~tional state of the speaker. The formant frequencies of vowels pro-
I
the con adu
4s for variations due to the attitude of duced with high vocal effort (shouted vow- speaker, there has been some research els) are difficult to measure because the cerned with 'baby talk', the speech of shouted voice is characterized by a very ~lts directed to young children. Garnica high Fo (table 1) and, hence, by large gaps 171 reported an increased mean Fo, an in- between the harmonics sampling the spec- ased Fo range (expressed in semitones), tral envelope. Published data ar .e therefore

Traunrniiller
scanty in the literature. Frekjier-Jensen [I9661 compared FI to F4 in shouted Danish vowels with those in the corresponding vowels spoken by 20 male and female speakers, but only Fl and F2 appear to have been actually measured. Rostolland and Parant [I9741 give median formant frequen- cies (F, to F,) of vowels in disyllabic words produced by 3 male and 3 female speakers (table 1). The authors consider these values as 'debatable' and give no details on the method of formant frequency measurement. These data show, however, quite dramatic increases in Fo [further details on this in Rostolland, 19821 and in Fl with an increase in vocal effort.
Schulman [I9851 measured formant fre- quencies (F, to F,) of 10 Swedish vowels spoken and shouted by 3 male speakers [un- published, except for FI and F2 of 1 speaker, used in a figure]. The differences found be- tween the two speech conditions are similar to those reported by Rostolland and Parant [I9741 but the increase in FI is not quite as large. Zhang [I9871 measured Fl and F, of [i], [a], and [u] in Chinese monosyllables ut- tered by 6 male and 6 female speakers at three levels of vocal effort (to obtain sound levels of 55, 65, and 75 dB). Both formants and F,, showed a consistent increase in fre- quency with an increase in level.
Schulman [I9881 describes mandibular and labial articulation of [ibVb] utterances by 4 Swedes, speaking and shouting. He re- ports a quite strictly linear relationship be- tween vowel-specific jaw depression in spo- ken and in shouted vowels. Jaw depression was increased by a speaker-specific factor of 1.6-3.1 in the shouted vowels as com- pared with the spoken ones. Three of the 4 subjects produced the shouted close vowels [i y tl U] with the same degree of jaw depres-
sion as the spoken open vowels [s a 01. If the tongue shape of a given vowel is un- changed in relation to the jaw, this would imply a correspondingly increased value of FI in the shouted vowels [Lindblom and Sundberg, 19711. Although no data on tongue shape in shouted vowels have been published, the acoustic data [Schulman, 19851 are compatible with the hypothesis of a grossly invariant tongue shape as seen in relation to the jaw. As known from bite- block experiments in which subjects pro- duced a vowel with the characteristic fre- quencies of a spoken [i] with the jaw being locked in a position more adequate for the production of an open vowel [Gay et al., 19771, speakers are capable of compensat- ing for a low jaw position by adopting a dif- ferent tongue shape. The acoustic data on shouted vowels do not show any compen- sation like this.
Since jaw depression is highly correlated with FI we should expect an increase in F , with an increase in vocal effort, for any vowel. This agrees with the published data, as can be seen in figure 1. Only the Danish [a] of male speakers appears to be an excep- tion. Figure 1 also shows that Fl increases more in Hertz but less in percent for open vowels than for closed vowels. This does not hold strictly for each speaker. Two of Schulman's speakers showed a close to con- stant increase in Hertz, while 1 showed a roughly constant percentage increase in FI .
While for a given speaker there is a close correlation between Fl and jaw depression, i,e., between FI and the physical degree of openness of the vocal tract, this does not provide us with a valid measure of phonetic openness: Vowels heard as identical in pho- netic quality have different degrees of jaw depression and, consequently, different F,s

Variation in Vowels
depending on the vocal effort with which they are produced. Listeners as well as lip readers appear to encounter the problem of segregating effects of vocal effort from cues to phonetic openness. We know that listen- ers find a solution without even being aware of any problem, but if FI in a vowel depends on both its phonetic openness and on vocal effort, on which basis do they per- ceive phonetic openness in vowels? This is particularly interesting since beside FI there appears to be no other major acoustic cue to phonetic openness.
Some insight into the perceptual process of segregating effects of vocal effort from phonetic vowel openness has been gained from a few perceptual experiments [Traunmiiller, 198 1, experiments 2-41 in- tended to test the generality of findings ob- tained with synthetic one-formant vowels. These experiments, which were later re- peated with closer to natural synthetic vow- els praunmiiller, 19851 demonstrated very convincingly that (a) F, is the major cue to the perceived degree of openness in vowels; (b) within wide margins, an FI increase can be offset by a concomittant Fo increase in order to keep invariant the phonetic qual- ity, in particular the perceived phonetic openness, of a vowel; (c) while this kind of manipulation is apt to keep vowel quality invariant, it does affect the perceived de- gree of vocal effort: The latter increases with increasing Fo and Fl if the upper for- mants are not touched.
According to (b), knowledge of FO is re- quired in order to decide upon the degree of openness of a phonated vowel. Conse- quently, we have to include Fo among the characteristic frequencies of vowels. An- other motive for this can be seen in the in- trinsic pitch differences between vowels, Fo
, Male (0) a ' , Female ( 0 ) o I
/ Male t S ) I I - .
0 200 4W 600 800 1000 1200 FI spoken (Hz )
Fig. 1. FI in the same vowels shouted (vertically) and produced with moderate vocal effort (horizon- tally). Mean data of vowels produced by 5 adult male and female speakers of Danish, and individual data of ten vowels produced by 3 male speakers of Swedish. Data from Frekjaer-Jensen [I9661 and Schulman [1985].
being negatively correlated with F I . At least in stressed syllables, these pitch differences are clearly above the threshold of discrimi- nation. There are a variety of proposals to explain intrinsic pitch by some kind of acoustic, aerodynamic, or physiological in- teraction between tongue and larynx [Ohala and Eukel, 1987; Rossi and Autesserre, 19811. Whatever the primary conditioning factor for these pitch differences may be, in some cases they appear to be maintained in- tentionally. The existence of intrinsic pitch differences in esophageal speech [Gandour and Weinberg, 19801 may possibly require such an explanation. The clearly increased Fo in the close vowels of Viennese German as compared with the vowels of Eastern
JIII.IIIIII 0 1 2 3 4 5 6 7 8
21 ( B a r k )
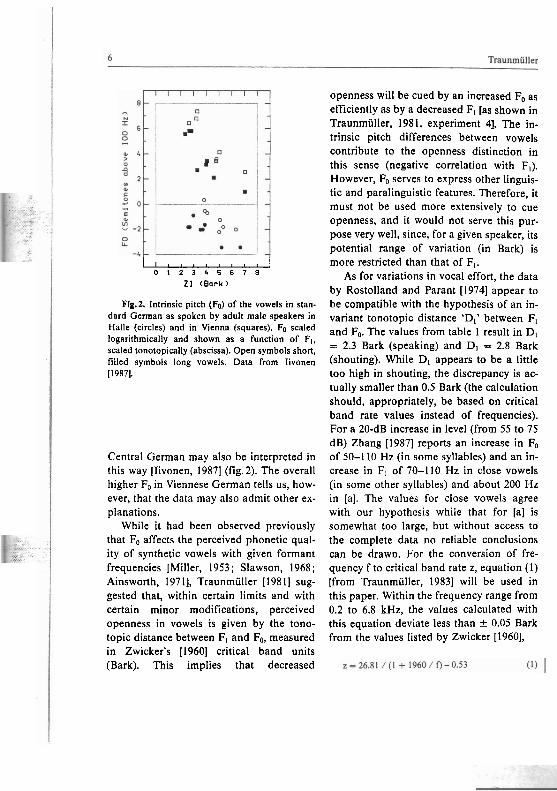
Fig.2. Intrinsic pitch (Fo) of the vowels in stan- dard German as spoken by adult male speakers in Halle (circles) and in Vienna (squares). Fo scaled logarithmically and shown as a function of FI, scaled tonotopically (abscissa). Open symbols short, filled symbols long vowels. Data from Iivonen [1987].
Central German may also be interpreted in this way [Iivonen, 19871 (fig.2). The overall higher F, in Viennese German tells us, how- ever, that the data may also admit other ex- planations.
While it had been observed previously that Fo affects the perceived phonetic qual- ity of synthetic vowels with given formant frequencies [Miller, 1953 ; Slawson, 1968; Ainsworth, 19711, Traunmiiller [I9811 sug- gested that, within certain limits and with certain minor modifications, perceived openness in vowels is given by the tono- topic distance between FI and Fo, measured in Zwicker's [I9601 critical band units (Bark). This implies that decreased
openness will be cued by an increased Fo as efficiently as by a decreased FI [as shown in Traunrniiller, 1981, experiment 41. The in- trinsic pitch differences between vowels contribute to the openness distinction in this sense (negative correlation with FI). However, Fo serves to express other linguis- tic and paralinguistic features. Therefore, it must not be used more extensively to cue openness, and it would not serve this pur- pose very well, since, for a given speaker, its potential range of variation (in Bark) is more restricted than that of FI.
As for variations in vocal effort, the data by Rostolland and Parant [I9741 appear to be compatible with the hypothesis of an in- variant tonotopic distance 'Dl' between F, and Fo. The values from table 1 result in D, = 2.3 Bark (speaking) and D, - 2.8 Bark (shouting). While Dl appears to be a little too high in shouting, the discrepancy is a o tually smaller than 0.5 Bark (the calculation should, appropriately, be based on critical band rate values instead of frequencies). For a 20-dB increase in level (from 55 to 75 dB) Zhang [I9871 reports an increase in Fo of 50-1 10 Hz (in some syllables) and an in- crease in FI of 70-1 10 Hz in close vowels (in some other syllables) and about 200 Hz in [a]. The values for close vowels agree with our hypothesis while that for [a] is somewhat too large, but without access to the complete data no reliable conclusions can be drawn. For the conversion of fre- quency f to critical band rate z, equation (I) [from Traunmiiller, 19831 will be used in this paper. Within the frequency range from 0.2 to 6.8 kHz, the values calculated with this equation deviate less than f 0.05 Bark from the values listed by Zwicker [1960],

Variation in Vowels
with f i n Hertz and z in Bark. The distance Dl in the ten shouted Swedish vowels [Schulman 19851 is smaller by 0.6 Bark, in the mean, than in the spoken versions. The spread between vowels is, however, quite large. The phonetic quality of a shouted vowel should, of course, not be expected to be exactly the same as that of the equivalent spoken one. In the shouted vowels we would rather expect some additional sto- chastic deviation from the ideal quality in- tended by the speaker.
In summary, the data show Dl in the , shouted vowels to be a little too high [Ros-
tolland and Parant, 19741, or a little too low [Schulman, 19851. Frakjar-Jensen's [I9661 measurements cannot be evaluated in this respect, because data on F,, were not in- cluded. On the whole, the meager and not very reliable data which we have on
, shouted vowels agree, in approximation, with the findings from the perceptual exper- iments and with the hypothesis of an invar- iant tonotopic distance between Fl and F,,.
, The observation of an increased Fo and FI in angry stressed vowels [Williams and Ste- vens, 19721 agrees qualitatively. The data [Frekjaer-Jensen, 1966; Schulman, 1985: Zhang, 19871 also indicate a marginally sig- nificant positive correlation between A D l
and Dl.
Vocal Effort, F2, and Perceived Vowel Qualitiy Figure 3 shows Az as a function of z for
, Fo, F,, F2, and F, in Schulman's [I9851 data. The figure shows an overall negative corre- lation between Az and z for all these charac- teristic frequencies considered without dis-
i:crimination. It can be seen that F2 is in- creased in the shouted versions, in particu-
!'lar in the back rounded vowels, in which F2
a ; c u ' : " m 8 1 ' B - 1 ' ~ 2 d t o IS 20 ' FO to F3 CQ-rate, moderate e f f o r t (Bark)
Fig.3. Critical band (CB) rates of Fa, F1, F2, and F3 of the same ten vowels shouted and produced with moderate vocal effort; individual data on each vowel produced by 3 adult male speakers of Swed- ish: Differences (vertically) plotted against values from moderate version (horizontally). Frequency data from Schulman [1985).
is low. F, appears not to be affected consis- tently by a change in vocal effort. The data of Frokjar-Jensen [I9661 show the same kind of correlation (for F, and F2), with a somewhat steeper slope. Those of Rostol- land and Parant [I9741 (only mean or me- dian values) also agree qualitatively.
The results of the above-mentioned per- ceptual experiments with synthetic vowels [Traunmiiller, 19811 are compatible with these production data, although the chosen variations in the characteristic frequencies of the synthetic vowels were not intended to model variations in vocal effort or any other particular paralinguistic features. Those results showed the tonotopic dis- tance D2 (between FI and F2) or that be-

Traunmiiller
tween Fl and the group of higher formants, to be nearly irrelevant to the perception of vowels with a large D2 (nonopen front vow- els). While the other findings agreed with the 'space-pattern theory' of Chiba and Ka- jiyama [1941], this was at variance with it. In the light of the production data on shouted vowels the phonetic irrelevance of D2 in nonopen front vowels is no longer un- expected. This distance will decrease with increasing vocal effort (in Bark, Fl increases more than F2) Therefore, it cannot consti- tute an invariant cue to any aspect of the phonetic quality of these vowels.
In a later investigation [Traunmiiller and Lacerda, 19871, the perceptual role of F2 (more accurately: F i ) and other factors for the distinction between different equally close vowels (mainly in Swedish and Turk- ish) was investigated more closely. This was done with synthetic two-formant vowels in which FI was kept closely above Fo, while both together as well as F i were varied sys- tematically. In accordance with the previ- ous finding of Dl being the cue to phonetic openness, most subjects heard close vowels, no matter how high FI was. As for the dis- tinctions within the phonetic dimension re- ferred to as oral 'depth' in Traunmiiller [I9871 and comprising the distinctions front/back and unrounded/outrounded/in- rounded, the results showed the phoneme boundaries to be described quite accurately by the equation
where I*, is a constant specific to a particu- lar phonetic boundary while Zi, and Z,' are the critical band rates (in Bark) of Fo and F,'. Equation (2) removes the effects of uni- form spectral compressions with respect to
the distance between an upper reference point at 15.3 Bark (= 2.8 kHz) artd a lower one located at 3.2 Bark above 2,. Thus, if F i was low, it was considered in relation to F, and Fo, but at F,' around 2.8 kHz the phonetic boundaries were given by F; alone. At about the same critical band rate (15.3 Bark) the regression line in figure 3 can be seen to cross the zeroline. This means that equation (2) holds also for these data, and it suggests that we might extend this kind of 'normalization' to any spectral cues to phonetic quality such as FI and the higher formants. An I, might then be calcu- lated by simply substituting ZI for Z2. in equation (2). The assumption that Dl is the major cue to openness in vowels agrees closely, but not precisely, with the general- ized equation (2). If the lower reference point is considered to be located at 3.2 Bark above 2, the agreement is exact for half- open vowels with Dl = 3.2 Bark (I, = 0). If applied to the formants above 2.8 kHz- '
equation (2) would predict slightly Ic formant frequencies in shouted v This agrees qualitatively with the Ic F, reported by Rostolland and [1974], but the reported value is too Ic probably not reliable.
raranr ~w and
Whispered Vowels Kallail and Emanuel [1984a, b] measured
the formant frequencies in whispered vow- els produced by men and by women and compared them with those measured in the , same vowels when phonated. They ob- served increased values of Fl and F2 in the .
whispered vowels. At least in part, these in- creased formant frequencies are due to the open glottis in whispering [Hanagan, 1972; ' Fujimura and Lindquist, 19711. In addition, the whispered vowels may have been articu-

I Variation in Vowels 9
lated with more vocal effort than the pho- nated vowels, in order to make them suffi- ciently audible. The investigations by Kal- lail and Emanuel [1984a,b] do not inform us about the articulations, but only about the formant frequencies in the two modes of production. These are compared in fig- ure 4, for both male and female speakers. The relation between the formant frequen- cies in whispered and phonated vowels ap-
' pears strikingly similar to that between shouted and spoken vowels, i. e., whispered vowels appear to have the same formant
:- E 0 10 15 20
F I t o F3 CB-rate, phonated (Bark)
frequencies as shouted vowels. As com- Flg.4. Critical band (CB) rates of FI , F2, and F3
pared with phonated vowels* Ihe of the same five vowels whispered and phonated by of whispered vowels are I5 adult male (squares) and 15 adult female (circles)
pressed just like those of shouted vowels. speaken of American English (group mean data): , Whispered and shouted vowels are also Differences (vertically) plotted against phonated
, somewhat similar in their deemphasis of the version (horizontally). Formant frequency data from Kallail and Emanuel [1984a, b].
lower frequency range. In both cases FI is relatively weak. While shouted and whis- pered vowels are related to moderately pho- nated vowels by similar transformations, there is no invariant relationship between any two of the three aspects of vowels:
I articulation, formant frequencies, and pho- netic quality. In order to result in similar formant frequencies, the articulation of whispered vowels must be different from that of shouted ones, while shouted vowels differ from moderately phonated ones as well in articulation as in formant frequen- cies.
The absence of a fundamental in the whispered vowels poses a problem: If the openness of phonated vowels is judged on the basis of F, in relation to Fo, this is obvi- ously excluded in whispered vowels. An
I equivalent Fo might perhaps be estimated t on the basis of other properties of the whis- 1 pered vowels or, more confidently, on the . basis of a voiced context. If openness has to
be judged on the basis of Fl alone, we may expect large perceptual context effects and between-subject variability. This agrees with the results of an experiment by Zhu- kov and Chistovich [1985], in which sub- jects had to identify noise-excited two-for- mant vowels. The experiment also showed that D,' did not serve the openness distino tion among front vowels.
Variations in Fo Nor due to Vocal EfSorl As for changes in Fo due to factors other
than vocal effort, our knowledge about their articulatory consequences reflected in the formant frequencies of vowels is quite rudimentary. Bladon [I9821 measured F, in English words spoken with changing Fo by men and women. He observed that Fl was

I not affected as long as FI remained above this would agree with the hypothesis of in-
I roughly 3.5 Fo. Otherwise, Fl increased with variant tonotopical distances between close Fo approximately in such a way as to retain spectral peaks (T). an invariant ratio FI/Fo, which implies an invariant distance between FI and Fo, ex- pressed not in Bark but in a logarithmic Between-Speaker Variation measure of frequency, such as semitones.
I
Sundberg [I9751 investigated the effects Rescaling Vocal Tracts of variations in Fo on the formant frequen- Contrary to the paralinguistic within- cies of vowels in one soprano singer. He speaker variation, the age- and sex-related found that Fl is kept constant as long as it is between-speaker variation in the character-
'. I clearly above Fo, but FI is not allowed to fall istic frequencies of vowels attracted the at- below Fa. What is observed in singing may, tention of investigators long ago. Crandall
1 however, not be typical of speech. In sing- [I9151 was probably first to actually mea-
I ing, as distinct from the linguistic use of the sure higher resonance frequencies in vowels speech organs, the phonetic quality of produced by women than in those pro- speech sounds may be allowed to be af- duced by men. fected by changes in such variables as pitch The speaker category differences in the
I and volume with which the singer is primar- characteristic frequencies of vowels are, ob- ily concerned. viously, a consequence of the size differ-
The mentioned observations and inter- ences between the speech organs of differ- pretations of the relation between Fa and Fl ent speakers. To a first order of approxima- by Sundberg [1975, S] Traunmiiller [1981, tion, the age and sex dependence of vowel T], and Bladon [1982, B], agree in some formant frequencies can be understood as a aspects and disagree in others. For close consequence of a proportional up- or
I vowels, S and T agree at any Fo. For the downscaling of all three dimensions of the lowest F,,'s S and T agree on that phonetic vocal tract. A uniform rescaling of a vocal quality is essentially independent of F,,. In tract would leave the formant frequency ra- both these cases there is a disagreement tios invariant. It has been observed, how- with B's close vowels at low Fos. For other ever, that the female/male formant fre-
I vowels T and B agree quite well, although quency ratios deviate quite consistently
1 their data evoke different explanations. For from uniformity [Fant, 19751. Such devia-
I half-open vowels at high Fos S disagrees tions lead us to the conclusion that the vo-
I sharply with B and only slightly less with T: cal tract shapes in men and women produc- S observed no increase in F I until F, was close to it - while B observed FI to increase proportionally with Fa. The discrepancy may be due to a conflict between the re- quirements of singing (S) and those of speaking (B, T). In back rounded vowels, S reported F2 to increase proportionally with Fo. Only if FI also would increase with Fo,
ing the same vowels are not proportional. Attempts to calculate the female-male for- mant frequency differences on the basis of anatomical data were not entirely success- ful [Nordstram, 1977; Goldstein, 1980; Traunmiiller, 19841. While the differences in F, and F2 could be predicted satisfactorily, there remained problems with FI.

, Variation in Vowels 1 I
The idea that perceived vowel quality es- sentially might be given by the absolute for- mant frequencies still sometimes appears to be implicit in present-day speech research. This is in contrast with the understanding that the capability to make accurate abso- lute judgements of pitch is only found ex- ceptionally, in some people said to possess 'absolute hearing', while all normal-hearing people are known to be highly proficient in judging relative pitch. The large admissible between-speaker differences in vowel for- mant frequencies, which make such a hy- pothesis appear unlikely to hold, are, how- ever, easily overlooked, since most acoustic data on speech sounds originate from adult speakers, in particular from men. The mea- surement of formant frequencies in chil- dren's vowels is just as difficult as in shouted vowels. Considering only adult speakers, it may for some purposes be a o ceptable to say that the same vowels have roughly the same absolute formant frequen-
I
l I I I I I , I I I l I I I I l 0 5 10 15
FI (Bark)
Fig.5. Tonotopically scaled FI (horizontally) and F2 (vertically) in the five Japanese vowels pro- duced by children aged 4-5 years and by adult male speakers. Vowel area circumscribed by these vowels shown by line connecting them. Mean values obtai- ned from 5 speakers in each group. Formant fre- quency data from Fujisaki et al. 119701, adapted from Traunmiiller, (19871.
1 cies. Figure 5, however, demonstrates rather r clearly that this can no longer be said if we e compare the vowels of adult men with those produced by the different groups of speak- I of kindergarten children. The vowel spaces ers can be appreciated by means of the fig- - circumscribed by the mean formants of the ures 6a-c. Each figure shows, for some par- - five Japanese vowels of the two groups of ticular groups of speakers, the deviation of - speakers not only fail to coincide but they the mean log(f) of each characteristic peak y do not even overlap. of each vowel from an arbitrary standard - The data used for figure 5 are from an value. The standard value was dcfined as - investigation [Fujisaki et al., 19701 in which the mean value from all speaker groups - the vowels from six physiologically differ- with the first-mentioned three groups given . ent groups of speakers were analyzed. double weight. Figure 6a displays the vow- - There were 5 speakers in each of the follow- els of men, women, and kindergarten chil- f ing groups: male adults, female adults, girls dren. The development in each sex can be - (12-14 years), boys after maturation of appreciated in figures 6b and 6c. Figure 6c ; voice (12-14 years), boys before maturation shows that the overall difference 1 of voice (12-14 years), and kindergarten adult men and boys just after rnatu ' children (4-5 years). The relations between the voice can be described quite t
- between ration of vell by a
the formant frequencies of the same vowels uniform scale factor (1.14): The rLa,,,...,

i : 206
u tso g
P 8 4
6
I I I I I I I Ag.6. Logarithmically scaled Fo, FI, , , ~ w . ~ . I IF" Fz, and F3 of the same five vowels of J a p
anese produced by physiologically dif- ferent groups of speakers (group mean data): Deviation from a standard value (vertically) plotted against actual value (horizontally). Standard defined in text. Regression line fitted to the formant data (excl. Fo) shown for each group. Data from Fujisaki et al. [1970]. a Adult men, adult women, and kindergarten children (age 4-5 years). b Kindergarten children, girls (age 12-14 years), and adult women. c Kindergarten children, boys before maturation of voice (age 12-14 years), boys after maturation of voice (age 12-14
~~ -
C h a r a c l e r l s t l c f r e q u e n c y ( k H z ) years), and adult men.
> Variation in Vowels 13
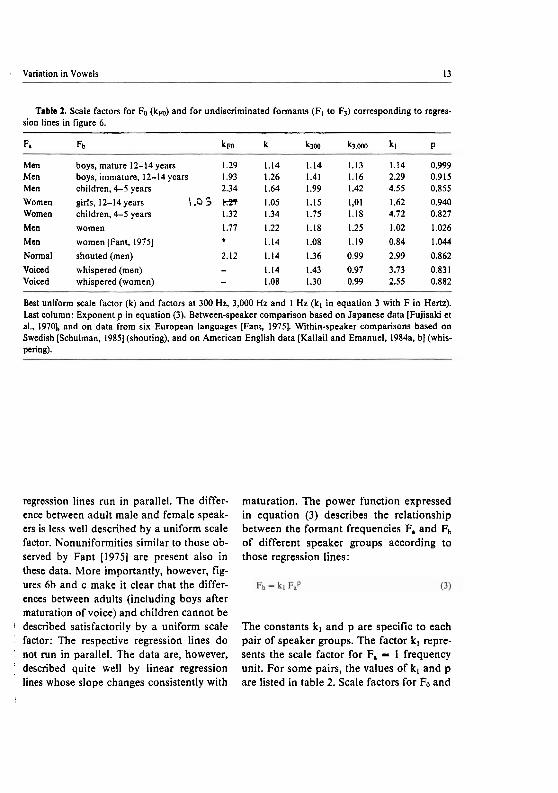
~ Table 2. Scale factors for Fo (km) and for undiscriminated formants (Fl to F3) corresponding to regres-
sion lines in figure 6.
Fa Fb ~ F O k k3oo k3.m kl p
Men boys, mature 12-14 years 1.29 1.14 1.14 1.13 1.14 0.999 Men boys, immature. 12-14 years 1.93 1.26 1.41 1.16 2.29 0.915 Men children, 4-5 years 2.34 1.64 1.99 1.42 4.55 0.855
Women girls, 12-14 years \.a; i59 1.05 1.15 1,Ol 1.62 0.940 Women children, 4-5 yean 1.32 1.34 1.75 1.18 4.72 0.827
Men women 1.77 1.22 1.18 1.25 1.02 1.026
Men women [Fant, 19751 * 1.14 1.08 1.19 0.84 1.044
Normal shouted (men) 2.12 1.14 1.36 0.99 2.99 0.862
Voiced whispered (men) - 1.14 1.43 0.97 3.73 0.831 Voiced whispered (women) - 1.08 1.30 0.99 2.55 0.882
Best uniform scale factor (k) and factors at 300 Hz, 3,000 Hz and I Hz (kl in equation 3 with F in Hertz). Last column: Exponent p in equation (3). Between-speaker comparison based on Japanese data [Fujisaki et al., 19701, and on data from six European languages [Fant, 19751. Within-speaker comparisons based on Swedish [Schulman, 19851 (shouting), and on American English data [Kallail and Emanuel, 1984a. b] (whis- pering).
regression lines run in parallel. The differ- ence between adult male and female speak- ers is less well described by a uniform scale factor. Nonuniformities similar to those ob- served by Fant [I9751 are present also in these data. More importantly, however, fig- ures 6b and c make it clear that the differ- ences between adults (including boys after maturation of voice) and children cannot be
1 described satisfactorily by a uniform scale factor: The respective regression lines do not run in parallel. The data are, however,
' described quite well by linear regression lines whose slope changes consistently with
I
maturation. The power function expressed in equation (3) describes the relationship between the formant frequencies F, and Fb of different speaker groups according to those regression lines:
The constants kl and p are specific to each pair of speaker groups. The factor k, repre- sents the scale factor for Fa = 1 frequency unit. For some pairs, the values of kl and p are listed in table 2. Scale factors for Fo and

L I 0 I I I I .1 . 2 .5 1 2 5 10
F o r m a n t f r e q u e n c y F I t o F 3 ( kHz )
a S t a n d a r d : Spoken v e r s i o n
Fig.7. Logarithmically scaled charao teristic frequencies of the same vowels
I ' I I I produced with different types of phona- 12. - r.- - - - 200 lion: Differences (vertically) plotted
against values from ordinary lab-speech 8 version (horizontally). Regression lines u g also shown (dashed for women). a Shout-
ing: PI. F2, and F3 of the same ten vow-
: '.:, els shouted and produced with moder- 0
d ate vocal effort; individual data on each
'3 L - c vowel produced by 3 adult male speakers
.2 - loo f of Swedish. Data from Schulman [1985]. . ! - - 8 b Whispering: FI, F2, and F3 of the same five vowels whispered and phonated by 15 adult male (squares) and 15 adult fe-
. I . 2 . 5 I 2 5 10 male (circles) speakers of American Eng- F o r m a n t f r e q u e n c y F l t o F 3 ( k H z )
b S t a n d a r d : P h o n a t e d v e r s i o n
optimal uniform scale factors for the for- mants are also included for comparison. In order to give an idea of the consequences of the particular combinations of kl and p within the formant frequency range, the re- sulting scale factors at Fa = 300 and 3,000 Hz are also listed.
Figure 7 shows that within-speaker vari- ation in the formant frequencies of vowels
lish mein data). Data from ~ a l l i l and Emanuel [1984a, b].
can also be described quite well with equa- tion (3). The values of k, and p for the data on shouted and whispered vowels which have been used above are also listed in table 2.
While a power function (equation 3) de- scribes the relationships between the for- mant frequencies of the same vowels pro- duced by different speakers and/or with

, Variation in Vowels
different kinds of phonation (normal, shouting, whispering) quite satisfactorily, the calculated values would not, in general, agree with the observed ones if equation (3) was also applied to F,,.
If we want to utilize a power function to 'normalize' formant frequency data on vow- els produced by a single speaker, or in or- der to recognize vowels automatically, we encounter a problem: We have no a priori knowledge of the appropriate values of k, and p. Here, these constants have been de- rived on the basis of data on several sets of vowels whose phonetic quality was as- sumed to be identical, but this procedure is not immediately applicable if the phonetic quality of the vowels is in question. We know, further, that vowel quality is substan- tially influenced by Fo. The factor k, and/or the exponent p must, therefore, be regularly dependent on F,. Equation (3) does not de- scribe this regularity.
A Perceptual, Tonoropic Approach Since equivalence in phonetic quality is
defined by the perceiver, it may be prefer- able to adopt a genuinely perceptual point of view in describing the relation between phonetic quality and characteristic frequen- cies of vowels. We should account for the fact that listeners are able to decide on the phonetic quality of a vowel sound even without prior exposure to any other vowels produced by the same speaker, and we would like to describe the phonetic quality of vowels in terms of parameters that have the same values whenever the phonetic quality of vowels is the same [Peterson, 19521. The tonotopic approach followed by Traunmaller [1981], Syrdal [1985], Syrdal and Gopal 119861, Di Benedetto [I9871 may lead to this goal. Fundamental to this ap-
proach is the tonotopic representation of speech sound spectra, e. g., along the basilar membrane. The Bark scale is preferred to equivalent rectangular bandwidth (ERB) rate [Moore and Glasberg, 19831 as a tenta- tive measure of tonotopic position. ERB is a measure of spectral selectivity. Below 500 Hz, where the two scales are not propor- tional, auditory temporal resolution ap- pears to contribute significantly to this se- lectivity.
Initially it was hypothesized that the to- notopic distances between the spectral peaks, characteristic of a given vowel, might be invariant. In gross approximation, this was found to hold between speakers. For small and medium interpeak distances (smaller than that between FI and F, in non- open front vowels) the hypothesis was con- firmed [Traunmiiller, 198 I]. In particular, Syrdal [I9851 and Syrdal and Gopal [I9861 observed critical interpeak distances of 3.5 Bark to partition the set of American Eng- lish vowels spoken by men, women, and children [data from Peterson and Barney, 19521 into subsets traditionally considered to share certain distinctive features. A simi- lar observation was made for the distinction between the vowel-like consonants [I] and [r] [Syrdal, 19821.
The tonotopic approach suggests the same vowels produced by different speak- ers, with the same type of phonation, to share an invariant pattern and it suggests a simple relation to hold between the differ- ent speakers. According to this approach, the consequences of vocal tract size differ- ences between speakers can be described very simply by a uniform tonotopic transla- tion of the spectral envelope of the auditow pattern of excitation. In spirit, thi: with the 'space pattern theory' prop
r agrees osed by

' - -- .- .---:
l 1 1 1 1 1 1 1 1 , 1 1 1 1 1 1 1 1 1 I I
0 5 10 15 20
a FO t o F3 CB- ra te ( B a r k )
I I I I I I I I I I I I I I I I I I I I I I I 0 5 10 IS 20
e FO t o F3 CB- ra t r ( B a r k )
" " " ' " ' I I
I ..p.d
, , I , l , , , , I , , , , I 0 5 10 15 20
b FO t o F3 C B r a t r ( B a r k )
Fig.8. Critical band (CB) rates of Fo, FI , FZ. and F3 of the same five vowels of Japanese produced by different groups of speakers (group mean data): De- viation from a standard value (vertically) plotted against actual value (horizontally). Standard de- fined in text. Regression line shown for each group. Frequency data from Fujisaki et al. [1970]. a Adult men, adult women, and kindergarten children (age 4-5 years). b Kindergarten children, girls (age 12-14 years), and adult women. c Kindergarten chil- dren, boys before maturation of voice (age 12-14 years), boys after maturation of voice (age 12-14 years), and adult men.
Chiba and Kajiyama [1941], but now the de- ure 6, those in figure 8 can be seen to fol ' --- scription of this pattern includes not only a course grossly in parallel with the the formant peaks but, in addition, also Fa. scissa, in agreement with the hypothesis
Figure 8 (a-c) displays the same data as an invariant tonotopic pattern. Most of those used in figure 6 (a-c), but now scaled regression lines shown in figure 8 fit FO as in Bark. Unlike the regression lines in fig- well as the formants although there are
ab- ; of the

Variation in Vowels 17
Table 3. Tonotopic translation do of FO and of undiscriminated formants (FI to F3).
Z. Zb d m do d 3 ~ d d3,mo c
Men boys, mature, 12-14 years 0.45 0.43 0.52 0.66 0.90 1.030 Men boys, immature, 12-14 years 1.44 1.50 1.42 1.3 1 1.1 1 0.976 Men children, 4-5 years 2.02 2.52 2.55 2.60 2.69 1.011
Women girls, 12-14 years 0.08 0.36 0.31 0.22 0.1 1 0.984 Women children. 4-5 years 0.82 1.66 1.58 1.44 1.27 0.976
Men women 1.20 0.94 1.02 1.16 1.39 1.029
Men women [Fant, 19751 * 0.12 0.33 0.79 1.20 1.069
Normal shouted (men) 1.72 1.56 1.26 0.62 0.02 0.902
Voiced whispered (men) - 1.78 1.42 0.62 0.07 0.882 Voiced whispered (women) - 1.40 1.13 0.40 0.01 0.912
Mean translation of Fo and translation corresponding to regression lines in figure 8 at 0 Bark (intercept in equation 4), at 300 Hz, mean uniform translation, and translation at 3,000 Hz in Bark. Last column: Slope c in equation (4). Same data as in table 2.
some minor deviations: For kindergarten children, Fo is below the regression line and for adult women it is above.
The regression lines shown in figure 8 run, however, not quite strictly in parallel with the abscissa, and equation (4) holds for their exact description, between any speaker groups a and b.
In this equation, do is the intercept at Z,=0 Bark, and c is the slope of the regression line in a plot of Zb VS. Z,. Values for do and c are listed in table 3. Equation (4) can also be used to describe the relation between normally phonated and shouted or whis- pered vowels. The corresponding values of do and c are also listed in table 3. In these cases, the slopes c are distinctly below 1.0. In between-group comparisons among Jap- anese speakers this slope does not deviate more than iz 0.03 from 1. If, however, Fo
were excluded from consideration, as is the case in Fant's [I9751 set of data, the devia- tion would be larger in some instances.
Invariant Cues
Both between- and within-speaker varia- tion can be described with any of the equa- tions (3) and (4). According to the tonotopic approach (4), there is, however, a qualita- tive difference between these two kinds of variation. The alternative approach (3) en- tails no such difference. According to the tonotopic approach, between-speaker varia- tion is described by a tonotopic translation while the kinds of within-speaker variation discussed above are described by a tono- topic compression or expansion of the audi- tory pattern of excitation. On the basis of this approach, we can see several analogies between auditory perception of phonetic quality and visual perception of shape, e.g.,
23 ( B a r k )
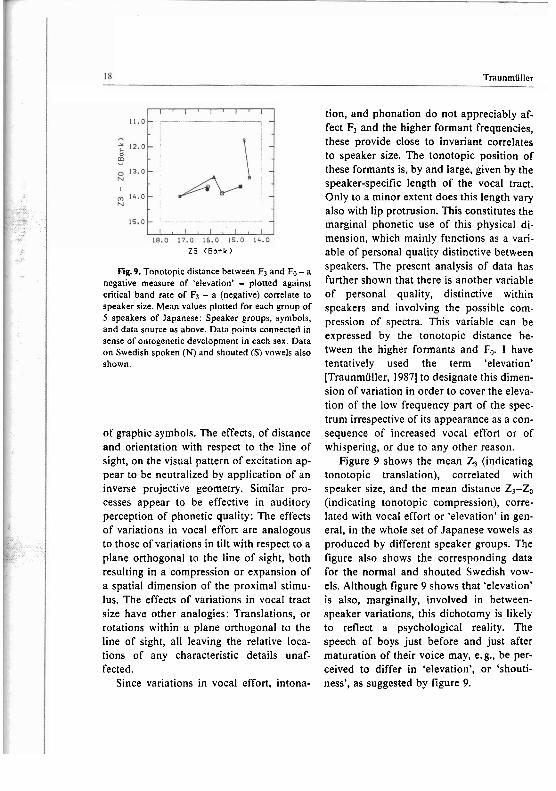
Fig.9. Tonotopic distance between F3 and Fo - a negative measure of 'elevation' - plotted against critical band rate of Fl - a (negative) correlate to speaker size. Mean values plotted for each group of 5 speakers of Japanese: Speaker groups, symbols, and data source as above. Data points connected in sense of ontogenetic development in each sex. Data on Swedish spoken (N) and shouted (S) vowels also shown.
of graphic symbols. The effects, of distance and orientation with respect to the line of sight, on the visual pattern of excitation ap- pear to be neutralized by application of an inverse projective geometry. Similar pro- cesses appear to be effective in auditory perception of phonetic quality: The effects of variations in vocal effort are analogous to those of variations in tilt with respect to a plane orthogonal to the line of sight, both resulting in a compression or expansion of a spatial dimension of the proximal stimu- lus. The effects of variations in vocal tract size have other analogies: Translations, or rotations within a plane orthogonal to the line of sight, all leaving the relative loca- tions of any characteristic details unaf- fected.
Since variations in vocal effort, intona-
Traunmiiller
tion, and phonation do not appreciably af- fect Fl and the higher formant frequencies, these provide close to invariant correlates to speaker size. The tonotopic position of these formants is, by and large, given by the speaker-specific length of the vocal tract. Only to a minor extent does this length vary also with lip protrusion. This constitutes the marginal phonetic use of this physical di- mension, which mainly functions as a vari- able of personal quality distinctive between speakers. The present analysis of data has further shown that there is another variable of personal quality, distinctive within speakers and involving the possible com- pression of spectra. This variable can be expressed by the tonotopic distance be- tween the higher formants and F,,. I have tentatively used the term 'elevation' [Traunmiiller, 19871 to designate this dimen- sion of variation in order to cover the eleva- tion of the low frequency part of the spec- trum irrespective of its appearance as a con- sequence of increased vocal effort or of whispering, or due to any other reason.
Figure 9 shows the mean Z, (indicating tonotopic translation), correlated with speaker size, and the mean distance Zl-Zo (indicating tonotopic compression), corre- lated with vocal effort or 'elevation' in gen- eral, in the whole set of Japanese vowels as produced by different speaker groups. The figure also shows the corresponding data for the normal and shouted Swedish vow- els. Although figure 9 shows that 'elevation' is also, marginally, involved in between- speaker variations, this dichotomy is likely to reflect a psychological reality. The speech of boys just before and just after maturation of their voice may, e.g., be per- ceived to differ in 'elevation', or 'shouti- ness', as suggested by figure 9.

Variation in Vowels 19
We have seen that equation (2) neutral- izes spectral compressions with respect to the distance between a reference point lo- cated at 15.3 Bark and another one at 3.2 Bark above &. If we interpret the reference point at 15.3 Bark (Zh) not as fixed in abso- lute terms, but allow it to follow the higher formants in natural vowels, we can write a more general equation, which, without fur- ther modification, also neutralizes spectral translations. Equation (5) describes the phonetic parameters involving Fi, FI, and F, proper. The two reference points may be interpreted as expected average positions of ZI and of Z,, respectively.
in the brain are assumed to be free of trans- mittal and personal, paralinguistic quality, as is the case with the I,. Subsequently, a normalization can only take place in the perception of phonetic quality if there are differences between the phonetic systems of speaker and listener. When we listen to somebody speaking a dialect which is close to our own, but which we are not very fa- miliar with, we probably use some kind of normalization or correspondence rules in order to understand.
Refinements
(9 The Particularity o/ Female Pronounciarion
With Z,, we obtain 11, a measure of vowel While we have seen that the formant fre- openness, already mentioned above. Be- quency differences between speaker groups tween the two reference points, equation (5) can be described by the powerfunction ex- agrees exactly with the assumption that pressed in equation (3) or by a tonotopic
i paralinguistic spectral modifications be lin- translation slightly modified by a tonotopic 1 ear translations and/or compressions of the compression or expansion, none of these
1 auditory spectrum, as described by equa- tion (3).
j The problem of between-speaker varia- a tion in the description of vowels has often been treated with various 'normalization'
; pardigms [Fant, 1959; Fujisaki and Naka- I ! mura, 1969; Wakita, 1977; Disner, 1980;
Suomi, 19841, which can be used to 'correct' formant frequency data to conform to a standard vocal tract. Such a normalization can be imagined to take place in human : speech perception. The solution proposed
I by the present tonotopic approach is, how- ever, conceptually different. It is more in
I line with a theory of direct perception [Gib- son, 19661 and it involves the calculation of
1 invariant psychoacoustic parameters I,. A Any phonetic 'templates' of vowels stored
transformations captures the female-male differences observed by Fant [I9751 and fur- ther analyzed by NordstrBm [1977], Anan- thapadmanabha [I9841 and Traunmiiller [I9841 completely. There remains a discrep- ancy in detail, which is of the same kind in the tonotopic approach as in the power- function approach.
The female-male difference in log(FJ and in Z, in Fant's [I9751 set of data is plot- ted against the male values in figures 10a and b, respectively. Separate regression lines are shown for each formant in addi- tion to an overall regression line. It can be seen that the female-male difference in Fl is highly correlated with Fl (fig. 10a: r=0.86; fig lob: r=0.91, significant at p < 0.01 in both alternatives). The same kind of interre-

a Male f o r m a n t f requency ( k H z )
Fig. 10. Female-male differ- ences (vertically) plotted against male values of FI , Fz, and F3 in vowels (horizontally). Data repre-
Table 4. Frequency scale factors and exponenu lation holds for F7 fr=0.96. D < 0.01). AS
A
r
d
?? 0 - d E
' 0 - 0 - a
c - 1 -
- % . . (equation 3) and critical band rate translation, inter- for F,, there is a barely significant (p < 0.1) cepts and slopes (equation 4) for calculation of fe- male formant frequency values from male data, negative (r=-0.50)' 'lope of
the regression lines for FI as well as for F2 is FI F2 R much steeper than that of the overall regres-
0 5 10 15 20 pressed in a tonotopic measure b Mule f o r m a n t C B - r a t e ( B a r k ) (Bark).
l " r ' l " " l ' r " l " ' ~ I 2 - -
-
1 - -
-
-
- l l l l l l l l l l l ~ t ~ ~ l ~ ~ l ~ I _
Uniform scale factor 1.1 16 1.140 1.168 sion line. This makes female vowels stand
Scale facfor k~ at 1 Hz out as clearly more peripheral than male
sent mean formant frequencies from a sample of six languages [Fant, 19751. The twelve vowels chosen are those represented in at least three of these languages. Sep- arate regression lines fitted to the data for each formant (whole- drawn lines). Overall regression line fitted to the three formants also shown (dashed). a Formant frequencies expressed in a loga- rithmic measure such as semi- tones. b Formant frequencies ex-
(equation 3) 0.362 0.373 vowels in any of our approaches. There is Exponent p in equation (3) 1.186 1.155 only one potential vowel, in the central re- Uniform translation in aion of the vowel s ~ a c e . for which the fe-
w . . Bark +0507 +OM5 f male-male difference is described exactly Intercept dm at 0 Bark (equation 4) -0.744 -0.936
by the overall regression lines in accor- Slope c in equation (4) 1.280 1.177 dance with equations (3) or (4). Table 4 lists
the constants descriptive of the regression Separate analysis for each formant. Listed values lines for Fl and Fz in figures IOa and b. based on formant frequencies observed in six Euro- the constants listed in tables and pean languages [Fant, 19751.
3, the transformations described by equa-

I Variation in Vowels 21
I tions (3) and (4) can be implemented with- out identification of the formants, e. g., by an
! automatic analysis and a following resynthe- sis with transformed parameters, whereby only Fo has to be rescaled separately. In this
/ case the spectra are treated holistically. This
) would be compatible with nonformant ap- i ! proaches to the description of vowel spectra, 8 ,
1 i as advocated by Bladon [1982]. Figures 10a 1 : and b show, however, that a separate treat- : ment of the formants FI and F1, using the
equations (3) or (4) with the constants listed
1 in table 4, leads to a considerably more exact
.j description of the female/male differences. ! In this case, each formant plays its distinct : role and has to be identified by number,
which is difficult to do reliably with an auto- 1 2 matic procedure. Since the separate treat- ' ment of F, and F2 allows a sufficiently exact : calculation of female formant frequencies if
i male formant frequencies are known, this
0 1 2 3 4
Fundamental PI t c h (Bark)
Fig. 11. Dispersion in FI between the mean Jap- anese vowels of six physiologically different groups of speakers, expressed as critical band rate standard deviation (vertically) plotted against Fo (horizon- tally). Symbols and source of data as above. Data points connected in sense of ontogenetic develop- ment in each sex.
! can, however, be utilized with advantage, to- gether with a description of voice source
: characteristics, to generate female speech by
; formant synthesis on the basis of a descrip- : tion of male speech. As for FI, there are some data which
Should we interpret male vowels as pale show that women's vowels are more periph- 1 versions of female vowels, or female vowels eral than men's even if they are produced 1 as exaggerated versions of male vowels, or with the same Fo [Bladon, 1982, fig. 41. At Fa
is our analysis insufficient so far? In order approximately 160 Hz, women's vowels , to answer this question, we would have to have distinctly more extreme Fls, as com-
check whether the discrepancy is condi- pared with the same intended vowels pro- tioned by some factor which is recoverable duced by men. This discrepancy is as large from the acoustic signal and not exclusively as that in Fant's [I9751 set of data. Thus, the
I linked to the speaker's sex. The perceived wide female range in F, cannot be ex- degree of openness in vowels has been plained as a function of Fa. This also shown to be a function of FI and Fo. If other emerges clearly from the Japanese data. In factors are negligible, the female-male figure 11, the speaker group-specific disper-
, discrepancy in the acoustic data is likely to sion in Z, (standard deviation between I reflect a discrepancy in phonetic quality mean values for each vowel) is plotted
unless it can be shown to be conditioned by against Zo for each speaker group. This fig- Fa, regardless of the speaker's sex. ure shows that speakers with an Fa similar

14 IS 16 17 18
T h i r d formant CB-rate (Bark)
Fig. 12. Dispersion in FI , Fz, and F3 between the mean Japanese vowels of six physiologically differ- ent groups of speakers, expressed as critical band rate standard deviation (vertically) plotted against critical band rate of F3 (horizontally). Symbols and source of data as above. Data points connected in sense of ontogenetic development in each sex.
to that of women (girls, and boys just be- fore maturation of voice) do not share the wide FI range in that group, confirming that it cannot be explained as a function of Fo, although the F, range is similarly expanded in kindergarten children.
In figure 12, the dispersions of ZI, Z2, and Z3, are plotted against the mean Z3 for each group. This figure shows a correlation between Z, and the dispersion for each for- mant, but the data on women's vowels clearly stick out from the general trend, not only in Z,. There are, thus, convincing rea- sons to believe that the phonetic quality of women's and men's renditions of the same vowel phonemes is not precisely the same.
There is a difference similar to that between more and less explicit pronunciations. Such a difference in behavior might, in principle, be due to physiological or sociological fac- tors. Since the present study suggests this sex-related difference to represent a 'uni- versal' of linguistic behavior, it appears likely to have a physiological cause. On the other hand, a more detailed analysis of the Japanese data, speaker by speaker, revealed an especially pronounced discrepancy in the case of /u/, which the data suggest to have been produced with lip rounding by 2 of the 5 adult women but by none of the other 25 speakers. These cases are suppor- tive of the argument that a sociological fac- tor is also involved.
A difference similar to that between women and men has also been shown to exist between more and less stressed vowels [Koopmans-van Beinum, 1980; Christov, 19871. In this case there may, in addition, be a difference of the kind we found between vowels produced with more and less vocal effort, e. g., in the angrily stressed vowels of Williams and Stevens [1972]. Degree of pe- ripheralness has also been shown to be a sufficient perceptual cue to stress [Rietveld and Koopmans-van Beinum, 19873.
Not considering the data for women, fig- ure 12 shows a sizable increase in the range of Z, variation with increasing age. The be- tween-vowel variation in Z3 among kinder- garten children is barely a third of that in adults. Still younger children, below 2 years of age, have a relatively small range of vari- ation in Fz [Buhr, 1980; Bickley, 19831. The ability to use variations in Fz, reflecting a front-back movement of the tongue, ap- pears to be aquired later than the ability to vary F,, reflecting jaw movement. As for variation in F,, the present analysis appears

I Variation in Vowels 23
l o g (FO) b z (FO)
rig. 13. Vowel space centroids for 30 speakers of Japanese. Three formants plotted against fundamental. Symbols and source of data as above. a Characteristic frequencies expressed in a logarithmic measure. b Characteristic frequencies expressed in a tonotopic measure. Calculated low-frequency end of spectral pat- tern (equation 6) shown by curved line.
1
i to show that speakers do not attain full con-
! trol of it before adolescence.
I l3e Anomalous Influence of Low F&
/ It has been observed previously that the simple tonotopic approach is slightly in conflict with observational data insofar as a change in Fo has almost negligible effects on the perceived openness of vowels as long as Fo < 150 Hz. This has been inter- preted as an 'end of scale effect' [Traunrniiller, 198 I]. It has been argued that an Fo decrease below 150 Hz might not af- fect the tonotopic representation of spectra because of auditory integration over roughly 3.5 Bark, first reported by Chisto- vich and Lublinskaya [1981]. This finding has subsequently been supported, put into question, and interpreted differently
. [Traunrniiller, 1981, 1982; Bladon, 1983;
Schwarz and Escudier, 19881. Syrdal and Gopal [I9861 considered the end of scale ef- fect to be negligible for their analysis of Pe- terson and Barney's 119521 data. Now it is necessary to reexamine the problem, taking also the increased peripheralness of women's vowels into account. This can sim- ply be done by considering the vowel space centroids of each speaker instead of the in- dividual vowels. To this end, the mean val- ues of each characteristic log(f) or z have been calculated for each of our speakers of Japanese, and they are plotted in figures 13a and b as a function of log(Fo) and Z,,, respectively.
Figure 13 shows that in none of our ap- proaches do the formant frequencies in- crease strictly linearly with Fo. In the pow- erfunction approach, we would not even ex- pect this, but in the tonotopic approach, the

Traunmiiller
I I I I I I I I I I I I I I I I I 0 5 10 15
F l (Bark)
Fig. 14. Tonotopically scaled FI (horizontally) and F2 (vertically) in the five Japanese vowels pro- duced by physiologically different speakers. For- mant frequency data, as above, from Fujisaki et al. [1970].
discrepancy, quite clearly visible in the case of F,, needs an explanation. In part, this discrepancy is in line with the previous ob- servation that vowel quality is not greatly affected by Fo if it is within (or below) the typical adult male Fo range. Figure 13b shows, however, also that there is a discrep- ancy in the opposite direction above the typical adult female Fo range. This part of the discrepancy is not accounted for by spectral integration as suggested previously. In the frequency range 250 < Fo < 350 Hz, Fo appears to influence phonetic quality to a larger extent than predicted by the hy- pothesis that perceived phonetic openness is given by the tonotopic distance between FI and Fo. In this respect, the Japanese data agree with the American English data of Pe- terson and Barney [Traunmiiller, 19841, and
also with the result of the perceptual experi- ment [Traunmiiller, 19811 referred to above. In this particular range of Fo, perceived phonetic openness appears to be given by F,/Fo [or log(FI)-log(Fo)], as suggested by Bladon (19821.
This phenomenon may perhaps be un- derstood as follows: If Fo is very low (below 150 Hz), the ear considers the envelope of the spectral pattern characterizing vowels to begin right at the beginning of the tono- topic scale (at 0 Bark). If Fo is very high (above 300 Hz), the ear is not capable to bridge the large spectral gap below Fo and, therefore, considers the envelope to begin at Fo. In the range of 150 Hz < Fo < 350 Hz, then, quite a drastic transition between these two interpretations will result. A simi- lar limitation to spectral envelope detec- tion, concerning the maximal spacing of partials acceptable for the auditory extrac- tion of F,, has also been observed [Traunmiiller, 198 I]. The present suggestion differs from the previous one in that the problem is now seen as one of spectral en- velope detection instead of spectral integra- tion. This explanation does not preclude the calculation of the tonotopic distance be- tween F, and Fo, suggested to be invariant between speakers, given equality in phona- tion and vocal effort.
A low-frequency endpoint, &, of the spectral envelope, in accordance with the present explanation, can be calculated with equation ( 6 ) :
The constants in equation (6) were arrived at by attempting to keep constant the spec- tral distance between &,, and the mean ZI of our speakers of Japanese. This was done by

Variation in Vowels
handcraft, i. e., better approximations may exist. The calculated &,, is shown in figure 13b.
A modification very similar in effect to the one described by equation (6) can also be introduced into the powerlaw approach:
This modification appears even to be simpler than (6). It needs, however, an ex- planation different from and incompatible with the one given above. If applied to per- ception, the power law approach presup- poses that a linear or a logarithmic, musical scale of pitch should be fundamental to vowel perception. Within such a frame, the limitation at 200 Hz might perhaps be un- derstood as the low frequency edge of a spectral window through which vowel qual- ity is analyzed in perception.
Several investigations previous to Traunmiiller [I9811 had shown only a rela- tively small effect of F, on perceived vowel quality [Slawson, 1968; Carlson et al., 19751. While the generalizations based on those experiments are in conflict with the present interpretation, the observations as such are not. In those experiments, Fo had been kept within the range below the knee in the Fm function (7), where we would not predict any large effect on perceived vowel quality. One investigation [Ainsworth, 19751 in- cluded also vowels with a distinctly higher Fo (120,240,360 Hz) and still showed only a small effect. In that investigation each stim- ulus consisted of a vowel in [h-dl context, preceded by a precursor consisting of the three vowels [i, u, a], and there were two ex- perimental variables: (a) the formant fre- quencies of the precursor vowels and (b) the Fo of the whole sequence. What is re-
Fig. 15. Phonetic. paralinguistically invariant pa- rameters l l (vowel openness, horizontally) and I2 (oral 'depth', vertically), calculated according to equations (5) and (6) in the live Japanese vowels produced by physiologically different speakers. For- mant frequency data same as in figure 14.
ported as the effect per octave rise in F, (less than 5% increase in 'perceived for- mant frequency') is actually what is ob- tained on average, if the formant frequen- cies of the precursor vowels are not changed despite such a change in F,. Under these circumstances, the quite large effect of the precursor, adequately documented in the same investigation, counteracts the ef- fect of Fo as such.
The success of the present attempt to re- move between-speaker variation from the description of vowels can be appreciated by comparing a plotting of the individual Japa- nese vowels [Fujisaki et al., 19701 in Zl vs. Z2 space (fig. 14) with a plotting of the same data in terms of the two parameters II and I,, suggested to be invariant with respect to variations in speaker size and 'elevation'

26 Traunmiiller
(fig. 15). I, reflects vowel openness, and I2 and the tonotopic distance between the higher for- backness as well as l i ~ ~rotrusion. both af- mants and Fo correlates (negatively) with vocal ef- . . fecting the 'depthv of the oral cavity. In cal- fort. All this presupposes an adequate scaling of
pitch, and some arguments in favor of a tonotopic '"lating and has been substituted approach on the basis of a critical band rate scale for Zo in equation (5). have been put forward. Starting from a different
The u m e r reference value needed in point. vocal tract rescalinn, we concluded that the . . equation (5) can be estimated either by us- formant frequencies of vowels subjected to paralin-
ing for each speaker his mean F3 - not in- guistic between- and/or within-speaker variation arc related, in satisfactory approximation, by power
herent in the particular segment - Or use functions of formant frequency. It has also been the F3 of each particular vowel. In the latter shown that the difference between vowels produced case, we discard some phonetic informa- by adult women, as compared with those produced
tion. ~f there is a similar procedure in hu- by other speakers, cannot be described exhaustively
man speech perception, it is likely to be with a holistic approach, but requires the formants to be treated separately. Vowels produced by adult
based On the above F3, carrying women tend to be phonetically more explicit and, very little phonetic information in vowels. hence. more ~ e r i ~ h e r a l in 'vowel space' than those . . Such data are, however, not at our disposal of other speakers differing in age and/or sex.
and for figure 15, F3 has been chosen as the upper reference point. The vowels can be seen to aggregate in five distinct clusters. A Acknowledgments few tokens still appear to be wrongly placed. these represent This research has been supported by a grant committed somewhere in the chain of data from HSFR the Swedish Council for Research in aquisition. the Humanities and Social Sciences.
Summary References
We have seen that there are two types of spectral transformations which within wide limits do not af- fect the phonetic quality of vowels: Translations and linear compressions /expansions of the pattern of spectral peaks. The consequences of differences in speaker size and variations in vocal effon, as well as the differences between the formant frequency patterns of voiced and whispered vowels, can be de- scribed or eliminated from a description with these two types of transformation applied to the spectra holistically, without discrimination between the several spectral peaks contributing essentially to vowel quality. We have also seen that the speech signal contains information concerning the approp- riate type of transformation to apply. In voiced speech segments, this information is carried by Fo and by the formants above F2. The higher formant frequencies correlate (negatively) with speaker size,
Ainsworth, W.A.: Perception of synthesized iso- lated vowels in h-d words as a function of fun- damental frequency. J.accoust. Soc. Am. 49: 1323-1324 (1971).
Ainsworth, W.A.: Intrinsic and extrinsic factors in vowel judgements; in Fant, Tatham, Auditory analysis and perception of speech, pp. 103- 113 (Academic Press, London 1975).
Ananthapadmanabha, T.V.: Pitch as a normaliza- tion factor in vowel perception. Acoust.Lett. 8: 1-4 (1984).
Bickley, C.: Acoustic evidence for phonological de- velopment of vowels in young children. MIT RLE Speech Group Working Papers, vo1.4, pp. l l I - 124 (1983).
Bladon, A.: Arguments against formants in the au- ditory representation of speech; in Carlson, Granstrflm, The representation of speech in the

Variation in Vowels
peripheral auditory system, pp.95-102, fig.4 (Elsevier, Amsterdam 1982).
Bladon, A.: Two-formant models of vowel percep- tion: shortcomings and enhancements. Speech Commun. 2: 305-3 13 (1983).
Bladon, R. A. W.: Henton, C. G.; Pickering, J. B.: Towards an auditory theory of speaker-sex normalization. Lang. Commun. 4: 59-69 (1984).
Buhr, R.: The emergence of vowels in an infant. ].Speech Hear.Res. 23: 73-94 (1980).
Carlson, R.; Fant, G.; Granstrdm, B.: Two-formant models, pitch and vowel perception: in Fant, Ta- tham, Auditory analysis and perception of speech, pp.55-82 (Academic Press, London 1975).
Carlson, R.; GranstrOm, B.: Model predictions of vowel dissimilarity. Q. Prog.Status Rep., Speech Transm. Lab., R. 1nst.Technol.. Stockh., No.3- 4, pp.84- 104 (1979).
Chiba, Ts.: Kajiyama, M.: The vowel: its nature and structure, pp. 174-226 (Tokyo-Kaiseikan, Tokyo 1941).
Chistovich, L.A.; Lublinskaya, V.V.: The 'centre of gravity, effect in vowel spectra and critical di- stance between the formants: psycho-acoustical study of the perception of vowel-like stimuli. Hearing Res. 1: 185-195 (1981).
Christov, Ph.: Computer aided analysis of stressed and unstressed Bulgarian vowels from 30 male and 30 female speakers. Proc. Xlth ICPhS, vol.3, pp. 121-124 (1987).
Crandall, I.B.: The sounds of speech. Bell Syst. tech.J. 4: 586-626 (1915).
Di Benedetto, M.-G.: On vowel height: acoustic and perceptual representation by the fundamen- tal and the first formant frequency. Proc.XIth ICPhS, vol.5, pp. 198-201 (1987).
Disner. S.F.: Evaluation of vowel normalization procedures. J. acoust.Soc. Am. 67: 253-261 (1980).
Fant, G.: Acoustic analysis and synthesis of speech with applications to Swedish. Eriwson Tech. 1 (1959).
Fant, G.: A note on vocal tract size factors and non- uniform F-pattern scalings. Q. Prog. Status Rep., Speech Transm. Lab., R. 1nst.Technol.. Stockh.. No.4, pp.22-30 (1966). (Also in Fant, G.: Speech sounds and features, MIT Press, Cam- bridge 1973).
Fant, G.: Non-uniform vowel normalization. Q. Prog. Status Rep., Speech Transm. Lab., R.lnst.Technol., Stockh., No.2/3, pp. 1 - 19 (1975).
Flanagan, J. L.: Speech analysis, synthesis and per- ception: 2nd ed., pp.63-65 (Springer, Berlin, 1972).
Fowler, C.A.; Rubin, P.; Remez, R. E.; Turvey, M.T.: Implications for speech production of a general theory of action; in Buttenvonh, Langu- age production, vol. I, pp.373-420 (Academic Press, London 1980).
Frekjar-Jensen, B.: Changes in formant frequencies and formant levels at high voice effort. ARIPUC No. I, Inst.Phonet., Univ.Copenhagen, pp.47- 55 (1966).
Fujimura, 0.; Lindqvist, I.: Sweep-tone measure- ments of vocal-tract characteristics, 1.acoust. Soc.Am. 49: 541-558 (1971).
Fujisaki, H.; Kawashima, T.: The roles of pitch and higher formants in the perception of vowels. IEEE Trans.Audio Electroacoust. AU-16: 73- 77 (1968).
Fujisaki, H.; Nakamura, N.: Normalization and re- cognition of vowels. Annu. Rep., Eng. Res. Inst., Tokyo Univ., vo1.28; pp.61-66 (1969).
Fujisaki, H.; Yoshimune: Nakamura: Formant fre- quencies of sustained vowels in Japanese ob- tained by analysis-by-synthesis of spectral enve- lopes (University of Tokyo, unpublished. 1970).
Gandour, I.; Weinberg, B.: On the relationship be- tween vowel height and fundamental frequency: evidence from esophageal speech. Phonetica 37: 344-354 (1980).
Garnica, 0 . : Some prosodic and paralinguistic fea- tures of speech to young children: in Snow, Fer- guson, Talking to children: language input and aquisition, pp.63-83 (Cambridge University Press, Cambridge 1977).
Gay, T.; Lindblom, 8.; Lubker, J.: Production of bite-block vowels: acoustic equivalence by selec- tive compensation. J. acoust. Soc. Am. 69: 183- 193 (1977).
Gibson, 1.1.: The senses considered as perceptual systems (Houghton-Mifflin, Boston 1966).
Goldstein, U.G.: Articulatory model for the vocal tracts of growing children; PhD thesis Massa- chusetts Institute of Technology (1980).
Iivonen, A.: Zur regionalen Variation der betonten Vokale im gehobenen Deutsch: in Kahlas-
Traunmiiller
Tarkka, Neophilologica fennica (Mkmoires de la Societe NCophilologique de Helsinki, tome XLV), pp. 87- 119 (Helsinki 1987).
Kallail, K.J.: Emanuel, F.W.: Formant-frequency differences between isolated whispered and pho- nated vowel samples produced by adult female subjects. J.Speech Hear.Res. 27; 245-251 (1984a).
Kallail, K.J.; Emanuel, F. W.: An acoustic compari- son of isolated whispered and phonated vowel samples produced by adult male subjects. J. Pho- net.12: 175- 186 (1984b).
Kent, R.D.; Forner, L.L.: Developmental study of vowel formant frequencies in an imitation task. J.acoust. Soc. Am. 65: 208-217 (1979).
Koopmans-van Beinum, F. J.: Vowel wntrast reduc- tion; diss. University of Amsterdam (1980).
Ladefoged, P.; Broadbent, D.E.: Information wn- veyed by vowels. J.acoust. Soc. Am. 29: 98- 104 (1957).
Liberman, A.M.: Maningly, I.G.: The motor theory of speech perception revised. Cognition 21: I - 36 (1985).
Lindblom B.; Sundberg, I.: Acoustical consequen- ces of lip, tongue, jaw, and larynx movement. J.acoust.Soc.Am. 50: 1166- 1179 (1971).
Miller, R.L.: Auditory tests with synthetic vowels. J.acoust.Soc. Am. 25: 114- 121 (1953).
Moore, B.C.J.; Glasberg, B. R.: Suggested formulae for calculating auditory-filter bandwidths and excitation patterns. J. acoust. Soc. Am. 74: 750- 753 (1983).
NordstrBm, P.-E.: Female and infant vocal tracts si- mulated from male area functions. J. Phonet.5: 81-92 (1977).
Ohala, J.J.; Eukel, B.W.: Explaining the intrinsic pitch of vowels: in Channon, Shockley, Fest- schrift for Ilse Lehiste, pp.207-215 (Foris, Dordrecht 1987).
Peterson, G. E.: Information bearing elements of speech. J.awust.Soc.Am. 24: 629-637 (1952).
Peterson, G.E.; Barney, H.L.: Control methods used in a study of the vowels. J.acoust. Soc.Am.24: 175-184 (1952).
Pols. LC. W.; van der Kamp, L. J.; Plomp, R.: Per- ceptual and physical space of vowel sounds. J. awust. Soc. Am.6: 458-467 (1969).
Rielveld, A. C. M.; Koopmans-van Beinum, F. J.: Vowel reduction and stress. Speech Commun. - 6: 217-229 (1987).
Rossi, M.; Autesserre, D.: Movements of the hyoid and the larynx and the intrinsic frequency of vowels. Phonetica 9: 233-249 (198 I).
Rostolland, D.: Acoustic features of shouted voice. Acustica 50: 118-125 (1982).
Rostolland, D.; Parant, X.: Physical analysis of shouted voice. Contr. 8th Int. Congr. Acoustics, London 1974.
Schulman, R: Articulatory targeting and perceptual constancy of loud speech. PERILUS No.4, Inst. Linguist., Univ. Stockh., pp.86-91 (1985).
Schulman, R.: Articulatory dynamics of loud and normal speech. J. acoust.Soc. Am. (in press, 1988).
Schwarz, J. L.: Escudier, P.: A direct demonstration of the existence of a large-scale integrated spec- tral representation in vowel perception. Speech Commun. (submitted, 1988).
Slawson, A. W.: Vowel quality and musical timbre as functions of spectrum envelope and funda- mental frequency. J.acoust.Soc.Am. 43: 87-101 (1968).
Sundberg, J.: Formant technique in a professional singer. Acustica 32: 89-96 (1975).
Suomi, K.: Whole spectmm vowel normalization. Speech Commun. 3: 199-209 (1984).
Syrdal, A.K.: Frequency analyses of syllable initial and final liquids spoken by American English talkers (abstract). J. acoust. Soc. Am. 71: S 105 (A) (1982).
Syrdal, A.K.: Aspects of a model of the auditory re- presentation of American English vowels. Speech Commun. 4: 121 - 135 (1985).
Syrdal, A.K.; Gopal, H.S.: A perceptual model of vowel recognition based on the auditory repre- sentation of American English vowels. J.acoust. Soc. Am. 79: 1086- 1100 (1986).
Traunmiiller, H.: Perceptual dimension of openness in vowels. J. acoust. Soc. Am. 69: 1465- 1475 (1981).
Traunmiiller, H.: Die spektrale Integration bei der Wahrnehmung der Klangfarbe von Vokalen. Acustica 54:237-246 (1982).
Traunmiiller, H.: On vowels: perception of spectral features, related aspects of production, and so- ciophonetic dimensions. Analytical expressions for the tonotopical sensory scale: PhD thesis University of Stockholm (1983).
Traunmiiller, H.: Articulatory and perceptual fac- tors controlling the age- and sex-conditioned va-

Variation in Vowels
riahility in formant frequencies of vowels. Speech Commun. 3: 49-61 (1984).
Traunmiiller, H.: The role of the fundamental and the higher formants in the perception of speaker size, vocal effort, and vowel openness. PERI- LUS, No.4, Inst.Linguist., Univ. Stockholm, pp.92-102 (1985).
Traunmiiller, H.: Some aspects of the sound of speech sounds; in Schouten, Psychophysics of speech perception, pp.293-305 (Nijhoff, Dord- recht 1987).
Traunmiiller, H.: Lacerda, F.: Perceptual relativity in two-formant vowels. Speech Commun.5: 143-157 (1987).
Wakita. H.: Normalization of vowels by vocal tract length and its application to vowel identifica- tion, IEEE Trans. Acoust. Speech Signal Proc. ASSP-25: 183- 192 (1977).
Williams, C. E.; Stevens, K. N.: Emotions and speech: some acoustical correlates. J.acoust. Soc.Am. 52: 1238- 1250 (1972).
Zhang, J.: The intrinsic fundamental frequency of vowels and the effect of speech modes on for- mants. Proc.XIth ICPhS, vo1.3, pp.390-393 (1987).
Zhukov, S.Ya.: Chistovich, L.A.: Perceptual para- meters of front vowels. Speech Commun.4: 267-273 (1985).
Zwicker, E.: Zur Untertcilung des herbaren Fre- quenzbereiches in Frequenzgmppen. Acustica 10: 185 (1960).
Received: May 24, 1988 Accepted: September 29, 1988
Dr. Hanmur Traunmiiller Institutionen f6r Lingvistik Stockholms Universitet S- 106 9 1 Stockholm (Sweden)