Embed Size (px)
Citation preview

Paradoxes of significance:Australian casualisation and labour productivity
Dr John BuchananDeputy Director (Research)
acirrtUniversity of Sydney
Paper prepared for ACTU, RMIT and The Age Conference ‘Work Interrupted: casual and insecure employment in Australia’, Hotel Sofitel, Melbourne, 2 August 2004.
Synopsis
It is commonly assumed that casual employment is a more ‘efficient’ or ‘productive’ way of engaging labour. The reality, however, is that significant ambiguities and paradoxes are associated with casual employment in Australia. These concern: issues of definition, demographic characteristics of ‘casual’ workers and their wages, hours, training and entitlements to superannuation and long service leave. Making sense of these paradoxes is essential for understanding the economic significance of the phenomenon. Analysis of these paradoxes reveals that casual employment can deliver short run gains for employers. This arises from their ability to deploy labour in ways which reduce the obligations they owe to it. The key issue is not so much reduced hourly wage rates as hours of work and associated rights. More comprehensive utilisation of labour associated with casualisation results in reduced unit labour costs (ie the labour cost per unit of output). This can be achieved without necessarily reducing nominal labour costs, such as hourly wage rates. There is, however, growing evidence that these short run gains compromise training and safety standards. That is, the better deployment of labour undermines its longer term development. Suggestions on how better deployment and development can be
improved simultaneously are provided by reference to the practices of the better quality group training companies and multi-employer long service leave schemes.
2
2

Introduction
In the 1990s Australia had one of the highest rates of labour productivity growth in world. It also had one of the fastest growth rates of casual employment. Are these developments connected? This question is hard to answer because of the limited quality and quantity of data on casual work in Australia. There is still no agreed definition of the term and much of the available data appears to indicate that many ‘casuals’ have characteristics commonly associated with ‘permanent’ employment. In the late 1990s, for example, researchers at the Productivity Commission asked rhetorically: ‘will the real casuals please stand up?’ (Murtough and Waite 2000: ) And a recent critique of research on casualisation commissioned by the labour hire industry argued that many ‘casuals’ have many of the rights and features of ‘permanents’. Because these workers also offer flexibility for employers the paper implied: ‘what’s the problem?’ (Curtain 2004).
It is tempting to argue that these ambiguities and paradoxes can only be overcome with more research. This is not the position of this paper. Rather, it argues that the ambiguities and paradoxes are the key to understanding the phenomenon and its economic significance. Six paradoxes in particular are examined. These concern:
1. Definitional ambiguity: While job duration has been stable, ‘casual’ forms of employment have risen.
2. Demographic Characteristics: The ‘flexibility’ of ‘casual’ employment is concentrated amongst limited categories of workers.
3. Wages: Sometimes ‘casuals’ are paid more and sometimes paid less than their ‘permanent’ equivalents.
4. Hours: ‘Casuals’ often work long, stable and predictable hours of work.
5. Entitlements: Many ‘casuals’ get OHS rights, superannuation and training entitlements similar to those enjoyed by’permanents’.
6. The distribution of risk: Shifting risks can enhance workers’ rights.
The key to understanding these paradoxes is the changing connection between workplace practices on the one hand and the legal formalities associated with them on the other. Traditionally it has been assumed that workplace arrangements determined rights and obligations of employment. For example, it was assumed that ongoing, regular hours of work lead to ‘permanency’ and the right to entitlements such as paid sickness and recreation leave. Irregular hours implied itinerant status and entitlement to a loading in lieu of the rights of permanency. It now appears that causality can the other way. A preference for certain (ie reduced) obligations is leading many employers to characterise the jobs they offer as ‘casual’ when in reality they are ongoing in nature. By calling them ‘casual’ and often paying a casual loading it is assumed by employers and workers alike that many of the obligations of ongoing employment are not applicable.
3
3

In the penultimate section we briefly outline how this process, generating as it does the paradoxes noted earlier, supports a new regime of labour productivity management in metal and engineering. Historically this has been a sector with low levels of casualisation. It highlights how short run gains in productivity are unsustainable in the longer term because they are undermining the reproduction of skills needed for future growth.
The paper concludes by considering future challenges. The unequal treatment of many casuals is merely the most obvious. Of greater significance is the process of casualisation itself. Australian casualisation does not necessarily entail cuts in wages or the universal imposition of crude forms of hour flexibility. It is, however, integral to a new approach to managing labour that boosts labour productivity by pushing many of the costs and risks of employment onto workers. Many casual workers accept their secondary labour market status as the only way to reconcile work with other commitments such as caring responsibilities or study. For growing numbers of blue collar males it is the only form of employment available. As such casualisation is best seen as a distinctively Australian way of redefining labour market rights as life courses change and as levels of under-employment rise. This outcome is not inevitable. The challenge is not to reduce standards in the name of ‘flexibility’ but rather to devise new standards for flexibility. These are needed to ensure sustainable forms of labour productivity growth are nurtured in the future. The experiences of portable long service leave arrangements in the construction industry and group training arrangements in general offer important leads into how this can be achieved.
Paradox 1: Definitional ambiguity: While job duration has been stable, ‘casual’ forms of employment continue to rise.
Any analysis of casualisation and economic performance must commence with a clarification of terms. Part of the difficulty here arises because, as Justice Moore noted in 1996,
In Australian domestic law, the expressions, ‘casual employee’ and ‘casual employment’ are expressions with no fixed meaning.1
The common understanding of the term typically involves notions of itinerant or relief work – that is short term or intermittent jobs. Aggregate data on job duration, however, indicates that jobs have, if anything, become more rather than less stable. The trends are summarised in Table 1.
1 Reed v Blue Line Cruises 1996 71 IR 403.
4
4
Table 1: Duration in current job (% distribution), Australia 1975 and 2000 compared
Current job durationLess than 1 year More than 10 years
December 1975
February 2000
23.1
23.6
20.8
24.4
Source: M Wooden, BCA papers Vol 1 No 1, 1999 and ABS Labour Mobility, Cat No 6209.0, 2000Population: All Employed Persons
As the table shows the percentage of workers who have been in their jobs for less than a year rose slightly from 23.1 to 23.6 percent between 1975 and 2000. Over the same period those remaining in their jobs for more than ten years rose from 20.8 to 24.4 percent of employed persons. The aggregate figures hide some underlying shifts. The duration for men’s jobs has been falling. That for women has been increasing. Overall, however, the stability of jobs has not changed much – on average job duration is as stable as ever.
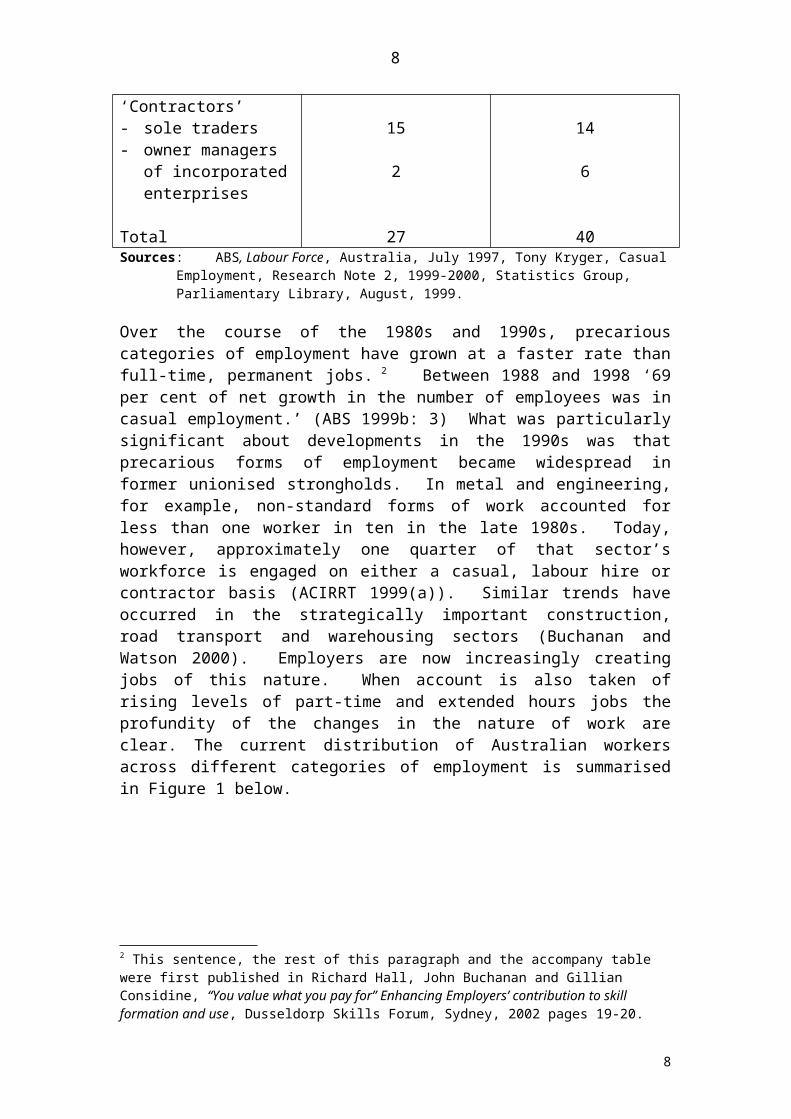
Despite this continuity levels of casual and contract work have risen dramatically. These trends are summarised in Table 2. Between the late 1970s and late 1990s the proportion of the workforceengaged on a casual or self-employed basis rose from just over a quarter (27 percent) to around two in five. Permanent part-time workers now constitute around 10 percent of the employed workforce. This means that today just over half the employed workforce are full-time, permanent employees.
Table 2: Indicative material on the rise of non-standard employment, Australia, late 1970s compared to late 1990s.
Late 1970s Late 1990s‘Casuals’
‘Contractors’- sole traders- owner managers of
incorporated enterprises
Total
10
15
2
27
20
14
6
40Sources: ABS, Labour Force, Australia, July 1997, Tony Kryger, Casual Employment, Research
Note 2, 1999-2000, Statistics Group, Parliamentary Library, August, 1999.
Over the course of the 1980s and 1990s, precarious categories of employment have grown at a faster rate than full-time, permanent jobs. 2 Between 1988 and 1998 ‘69 per cent of net growth in the number of employees was in casual employment.’ (ABS 1999b: 3) What was particularly significant about developments in the 1990s was 2 This sentence, the rest of this paragraph and the accompany table were first published in Richard Hall, John Buchanan and Gillian Considine, “You value what you pay for” Enhancing Employers’ contribution to skill formation and use, Dusseldorp Skills Forum, Sydney, 2002 pages 19-20.
5
5

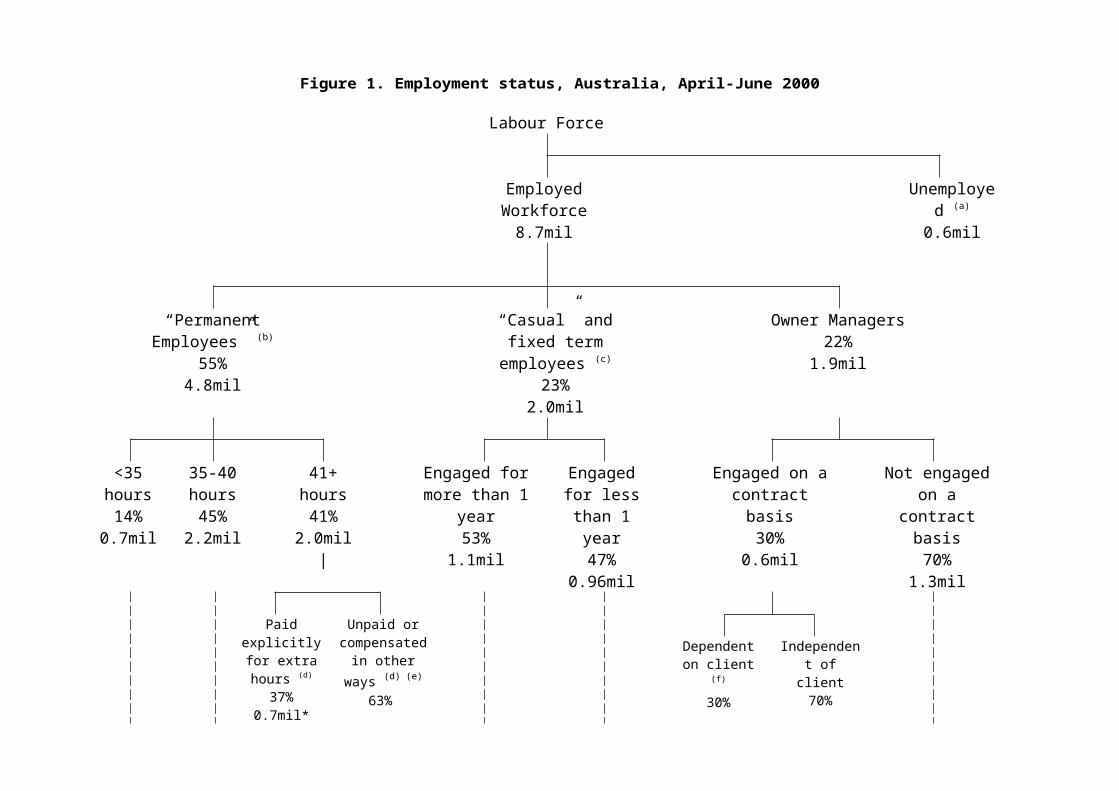
that precarious forms of employment became widespread in former unionised strongholds. In metal and engineering, for example, non-standard forms of work accounted for less than one worker in ten in the late 1980s. Today, however, approximately one quarter of that sector’s workforce is engaged on either a casual, labour hire or contractor basis (ACIRRT 1999(a)). Similar trends have occurred in the strategically important construction, road transport and warehousing sectors (Buchanan and Watson 2000). Employers are now increasingly creating jobs of this nature. When account is also taken of rising levels of part-time and extended hours jobs the profundity of the changes in the nature of work are clear. The current distribution of Australian workers across different categories of employment is summarised in Figure 1 below.
6
6
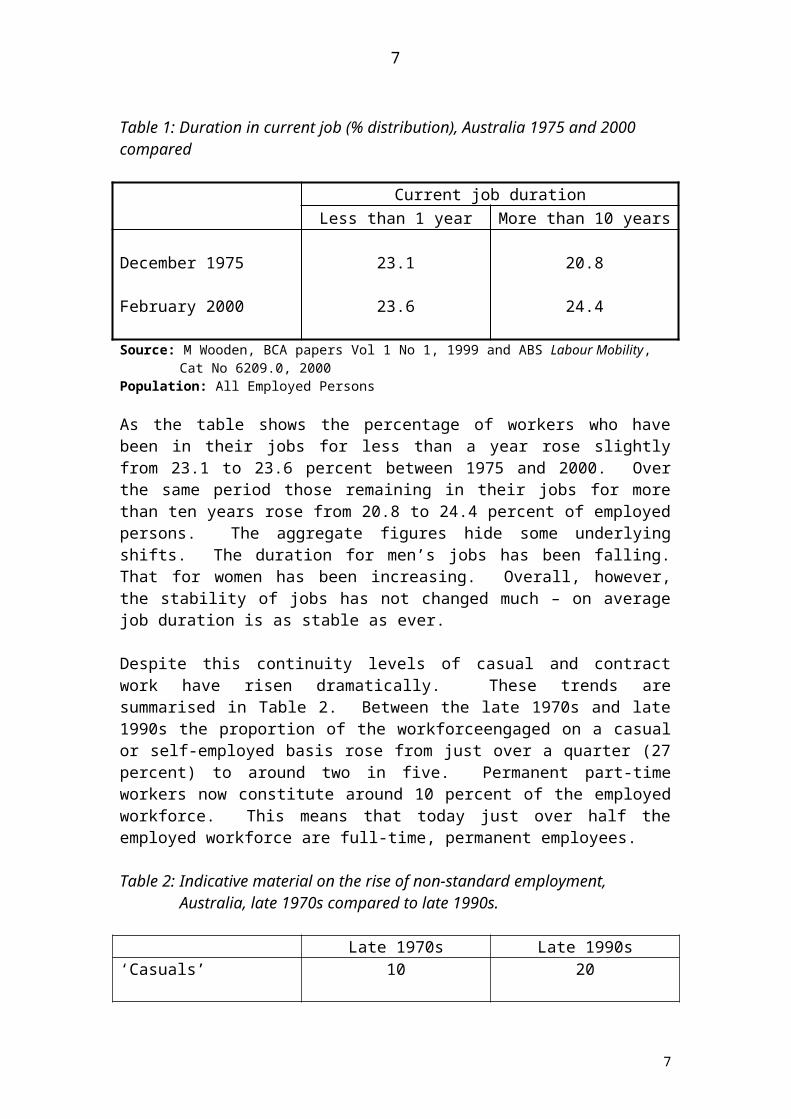
Figure 1. Employment status, Australia, April-June 2000
Labour Force
Employed Workforce
8.7mil
Unemployed (a)
0.6mil
“Permanent Employees” (b)
55%4.8mil
“Casual” and fixed term employees (c)
23%2.0mil
Owner Managers22%
1.9mil
<35 hours14%
0.7mil
35-40 hours45%
2.2mil
41+ hours41%
2.0mil|
Engaged for more than 1 year
53%1.1mil
Engaged for less than 1 year
47%0.96mil
Engaged on a contract basis
30%0.6mil
Not engaged on a contract basis
70%1.3mil
Paid explicitly for extra hours (d)
37% 0.7mil*
Unpaid or compensated in other ways (d) (e)
63%1.2mil*
Dependent on client (f)
30%0.2mil
Independent of client70%
0.4mil
8% 25% 8% 14% 12% 11% 2% 4% 15%Source: ABS Employment Arrangements and Superannuation, April to June 2000, Catalogue No. 6361.0 and ABS The Labour Force, July 2000.(a) This figure is an average of figures for April to June 2000 from the ABS Labour Force Survey. The corresponding number of employed people is 9.0 million. It is unclear why estimates of the size of the employed workforce differ between the two surveys.(b) Permanent employees are those employees with leave entitlements not working on a fixed term contract.(c) Includes employees with leave entitlements working on a fixed term contract, self-identified casuals and employees without leave entitlements who did not identify as casual.(d) This assumes that anyone who usually works more than 40 hours a week is working “extra hours”. * Paid and unpaid figures are based on proportion of all those permanent employed persons who worked extra hours in the last 4 weeks in their main job (including part-timers). (e) Compensation for extra hours includes time off, non-cash benefits and provision in work agreement, contract or salary package. Approximately 8% of employees who worked extra hours worked both paid and unpaid for these hours. (f) Dependent on client is where the contract prevented the contractor from subcontracting their own work or working for multiple clients; or the client had control over their working procedure.
The material so far has merely highlighted a prima facie anomaly. How many casuals in fact have features of ongoing employment? Recent data on this matter is summarised in Table 3.
Table 3: Job Duration, Days Worked and Variablity of Earnings of ‘Permanent’ and ‘Casual’ employees, Australia early 2000s.
Indicator
‘Permanents’ ie Employees with leave
entitlements not working on a fixed term contract
‘Casuals’ ie
Self-identified casuals
Time worked in main job: (a)
< 1 year 5 – 10 years > 10 years
Expects to leave job within 12 months (a)
Earnings vary (b)
Number of days usually work(a)
1 – 2 5+
Job has set finishing date (b)
Some say in start and finishing time (a)
16.619.529.4
7.7
13.9
2.584.1
1.5
46.7
48.48.05.6
25.9
57.5
33.932.9
7.1
42.1
Sources:(a) ABS, Employment Arrangements and Superannuation, Cat No 6361.0, Australia, April – June
2000(b) ABS, Forms of Employment, Cat No 6359.0, Australia, November 2001
Population: Employees excluding owner managers of incorporated entities.
On first reading this table appears to show that there are, indeed, profound differences between casuals and permanents of the kind commonly assumed to prevail. While only 16.6 percent of ‘permanents’ have been in their job a year or less, nearly three times the proportion of casuals (48.4 percent) have such short job duration. While less than on in ten permanents expects to leave their job within 12 months, over one in four casuals plan to do so. And while over 85 percent of permanents report no variation in earnings, over half (57.5 percent) of casuals experience such variations. And while the overwhelming majority (84.1 percent) of permanents work on five or more days of the week, less than a third of casuals do. Closer scrutiny of the data reveals, however, that a significant number of ‘casuals’ have features commonly associated with ‘permanent’ employment: over 50 percent have been in their current
8
8
job for a year or more, just under three quarters do not expect to leave within the next 12 months, over two in five have no variability in earnings. Most striking of all is that well over 90 percent of both permanents and casuals have no set date attached to their jobs ending. And in both forms of employment fewer than half have any say in their starting and finishing times at work. Clearly a sizeable proportion of self-identified casuals have the status of that classic Australian oxymoron: the permanent casual.
Is it possible reconcile these anomalies? As noted in the introduction it is important to distinguish between two distinct developments. The first is the nature of how labour is actually deployed in production or service provision (ie the tangible reality of work). The second is the nature of the rights and obligations attached to employment (ie the formalities associated with work). Traditionally it has been assumed that the nature of labour market practice defines employment related rights and obligations. Long term employment relations (LTER) were assumed to imply, for example, rights to and obligations to provide leave. Labour law surrounding ‘casual’ employment is, however, riddled with ambiguities. Casuals were often defined as ‘any worker so defined’ – the quintessential circular definition (Pocock, Buchanan and Campbell 2004). Ambiguities such as these mean causality can run in the opposition direction: employers can pick the obligations and rights regime they want and then deem the jobs they offer as having that nature. This situation has become even more complicated as courts and industrial tribunals have responded to this development. In recent years there has been a slow accretion of rights for ‘permanent casuals’, especially in the realm of unfair dismissal law. These have emerged as aggrieved casuals, often with union backing, have initiated legal proceedings seeking judicial intervention to deal with the realities and cut through the formalities of employment situations. Sometime ‘permanent casuals’ have won substantial gains, other times they have not. The end result is that while the situation for ‘permanent casuals’ does appear to be improving, it is a complex and risky process for the trail blazers. For those less willing to test new standards it is a form of employment surrounded by uncertainty.
How is analysis to be conducted in the context of such ambiguity? A two stage approach has been adopted in this paper. The first is the development of some working definitions. The second has involved being constantly aware of and reflecting on the significance of this fundamental ambiguity.
Ian Watson (1999) has noted that the terms ‘casual’, ‘contractor’ ‘agency worker’ and ‘part-timer’ are often used interchangeably. He has recently derived a framework to help clarify the definition of these terms. His classificatory framework separates out two key dimensions of employment situations: the nature of the employment relationship and the time dimension.3
3 The importance of making this distinction has been forcefully argued by George Gonos. He argues that the key to understanding the US ‘Temporary Help’ industry is not so much the ‘temporary’ nature of employment as the emergence of a new triangular employment relationship whereby host employers sidestep most labour regulations because they are not technically the ‘employer’: Gonos, ‘The Contest over “Employer” Status in the Postwar United States’ pp. 81-110.
9
9
The time dimension refers to how commonly people work over the week (ie ‘part-time’ or ‘full-time’) and year(ie full-year, seasonal or part-year only).4
Watson defines the nature of the employment relationship with reference to whether the producing company is also the employing company.5 In the stereotypical notion of the firm that informed the classical wage earner model of employment the two functions coincide. In this situation workers can be engaged as either ‘permanents’ or ‘casuals’, determined primarily by their continuity of employment (see Table 4, cells 1 - 5). Traditionally the major alternative to the employing company being the producing company has involved contractors, often working as sole traders on the basis of contracts for service. With the growth in labour hire and outsourcing functions, however, a wider array of employment situations have emerged. A diagramatic presentation of Watson’s framework is provided in Table 4.
The categories are placed in the Table so that the directness of the relationship between producing and employing companies weakens the more one moves to the right: first to labour hire situations, then to the contractor situation and then finally to the outsourced working arrangement. For our purposes, a labour hire situations involve the worker expending labour in host employers workplace even if he or she is not employed by the workplace as such (Cells 6 - 9). Such workers can be engaged as ‘casual employers’, ‘permanent employees’ or ‘contractors’. At the other extreme, in an outsourced situation, people who previously worked for the ultimate producing company now provide their contribution to final output by way of delivering a component supplied on a contract or sub-contract basis, with no direct or indirect employment relationship as such (Cells 12 - 14). Once again employees in such organisations can be engaged as either ‘permanents’ or ‘casuals’ Contractor situations sit between these two, often working directly to the ultimate producing company but not actually under their control (Cells 10 – 11). Historically, most contractors have taken the form of ‘independent’ contractors who provide their services to a range of clients. Dependent contractors are, however, on the rise. These are people who formally have contractor status but in reality only work for one firm and generally fall under their control. In Watson’s Table, such contractors are only listed as operating through labour hire arrangements or agency arrangements. Dependent contractors can, however, operate outside such arrangements. The grey cells in the Table indicate categories of work that are either rare or non-existent.
4 Once again Watson’s dimensions here have many similarities with that noted in the overseas literature on non-standard work. The differences between his categories of time and that in the literature is that whereas has focuses on the full-time/part-time/ seasonal work distinction - notions of time over the week or year, the overseas literature deals with continuity of service with - ie notions of time of the year or longer. See for example Dean Morse who refers to the standard worker as ‘the full-time, full-year worker’ in ‘Historical Perspective: The Peripheral Worker (1969)’ reprinted in Kathleen Barker and Kathleen Christensen (eds) Contingent Work: American Employment Relations in Transition, ILR Press, Ithaca, 1998 pp. 21-40.5 This ‘directness’ aspect of distinguishing between the employing and producing company has many similarities with the ‘time served’/ ‘task based’ distinction in the literature on non-standard work. Workers employed directly by the producing company are often engaged on a quite open-ended basis. Workers engaged at different degrees of separation have their relation determined on a more task basis. Hence labour hire workers are often engaged for particular projects, contractors for particular tasks and outsourced workers only for their final output - ie task defined independently of any employment dimension.
10
10
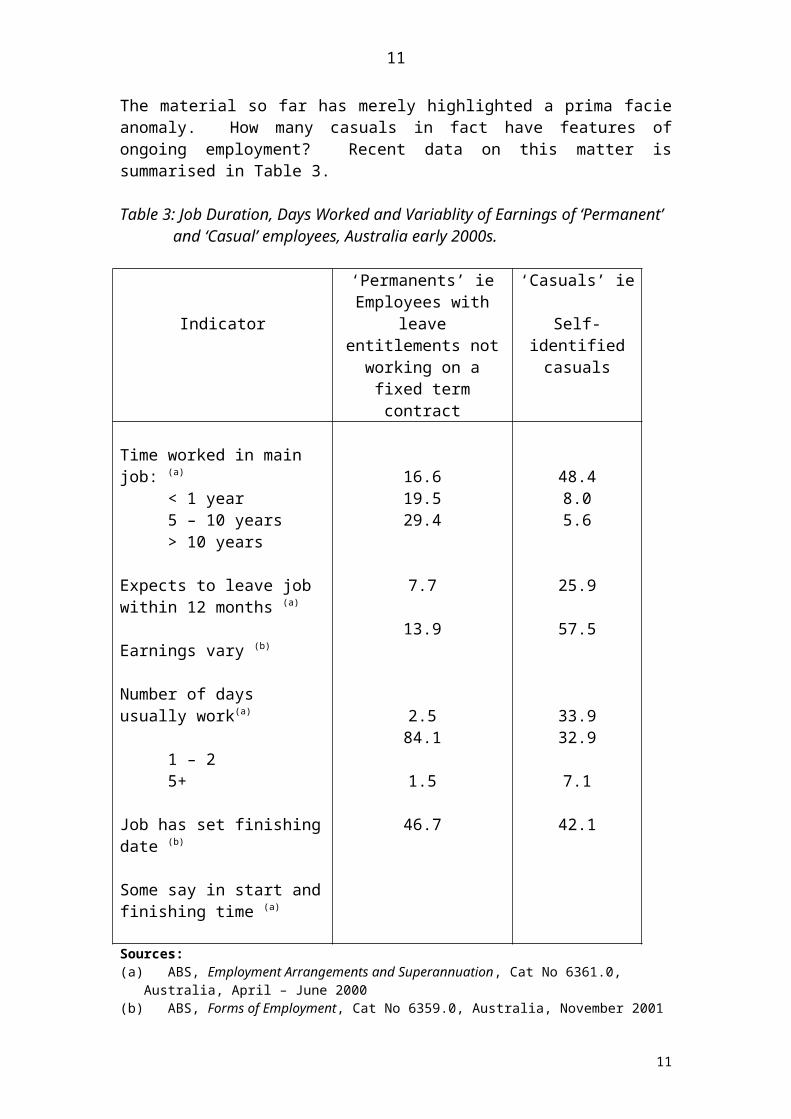
Table 4: Categories for understanding non-standard employment
Employment relationship
Producing company is employing company
Producing company is not employing company
Permanent Casual
Labour hire / employment agencies
Contractors or ‘own account
workers’
Outsourced
suppliers
Workers are employees
Workers are ‘dependent contractors’
Permanent
Casual Dependent
Independent
Dependent
Independent
Time
Full-time 1 2 6a 6b 8a 8b 10a 10b 12
Part-time 3 4 13
Seasonal/temporary/ intermittent
5 7a 7b 9a 9b 11a 11b 14
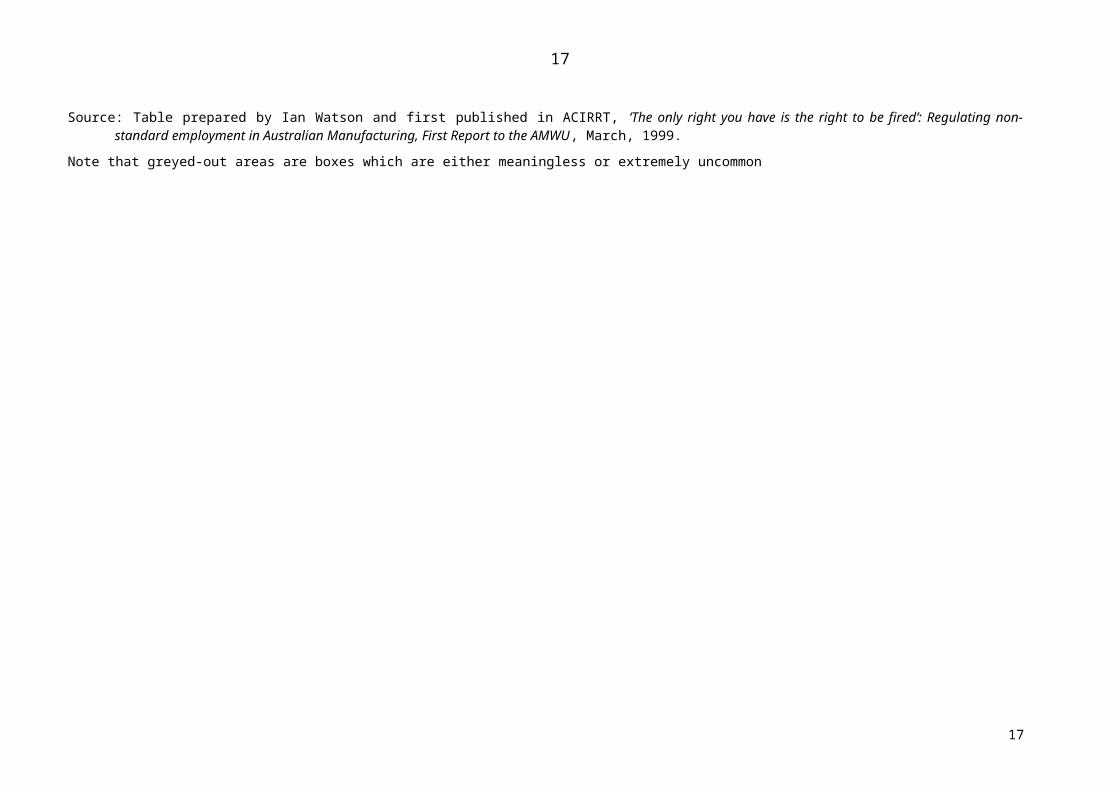
Source: Table prepared by Ian Watson and first published in ACIRRT, ‘The only right you have is the right to be fired’: Regulating non-standard employment in Australian Manufacturing, First Report to the AMWU, March, 1999.
Note that greyed-out areas are boxes which are either meaningless or extremely uncommon
11
11
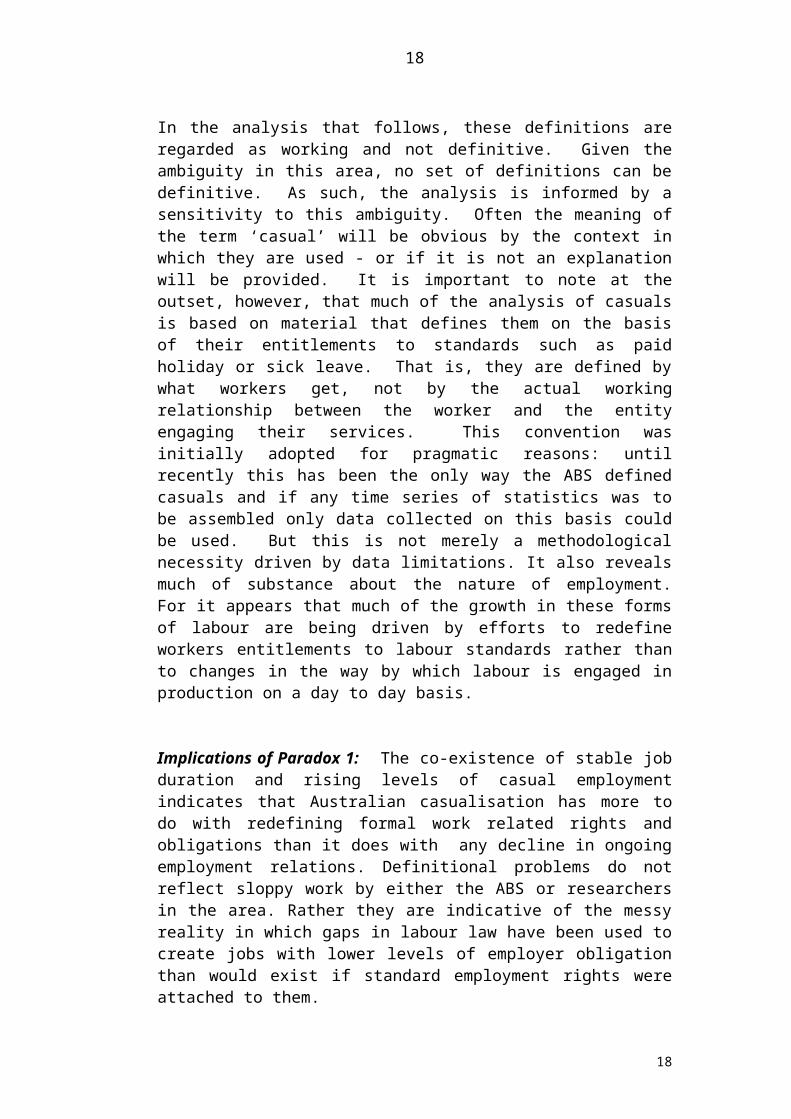
In the analysis that follows, these definitions are regarded as working and not definitive. Given the ambiguity in this area, no set of definitions can be definitive. As such, the analysis is informed by a sensitivity to this ambiguity. Often the meaning of the term ‘casual’ will be obvious by the context in which they are used - or if it is not an explanation will be provided. It is important to note at the outset, however, that much of the analysis of casuals is based on material that defines them on the basis of their entitlements to standards such as paid holiday or sick leave. That is, they are defined by what workers get, not by the actual working relationship between the worker and the entity engaging their services. This convention was initially adopted for pragmatic reasons: until recently this has been the only way the ABS defined casuals and if any time series of statistics was to be assembled only data collected on this basis could be used. But this is not merely a methodological necessity driven by data limitations. It also reveals much of substance about the nature of employment. For it appears that much of the growth in these forms of labour are being driven by efforts to redefine workers entitlements to labour standards rather than to changes in the way by which labour is engaged in production on a day to day basis.
Implications of Paradox 1: The co-existence of stable job duration and rising levels of casual employment indicates that Australian casualisation has more to do with redefining formal work related rights and obligations than it does with any decline in ongoing employment relations. Definitional problems do not reflect sloppy work by either the ABS or researchers in the area. Rather they are indicative of the messy reality in which gaps in labour law have been used to create jobs with lower levels of employer obligation than would exist if standard employment rights were attached to them.
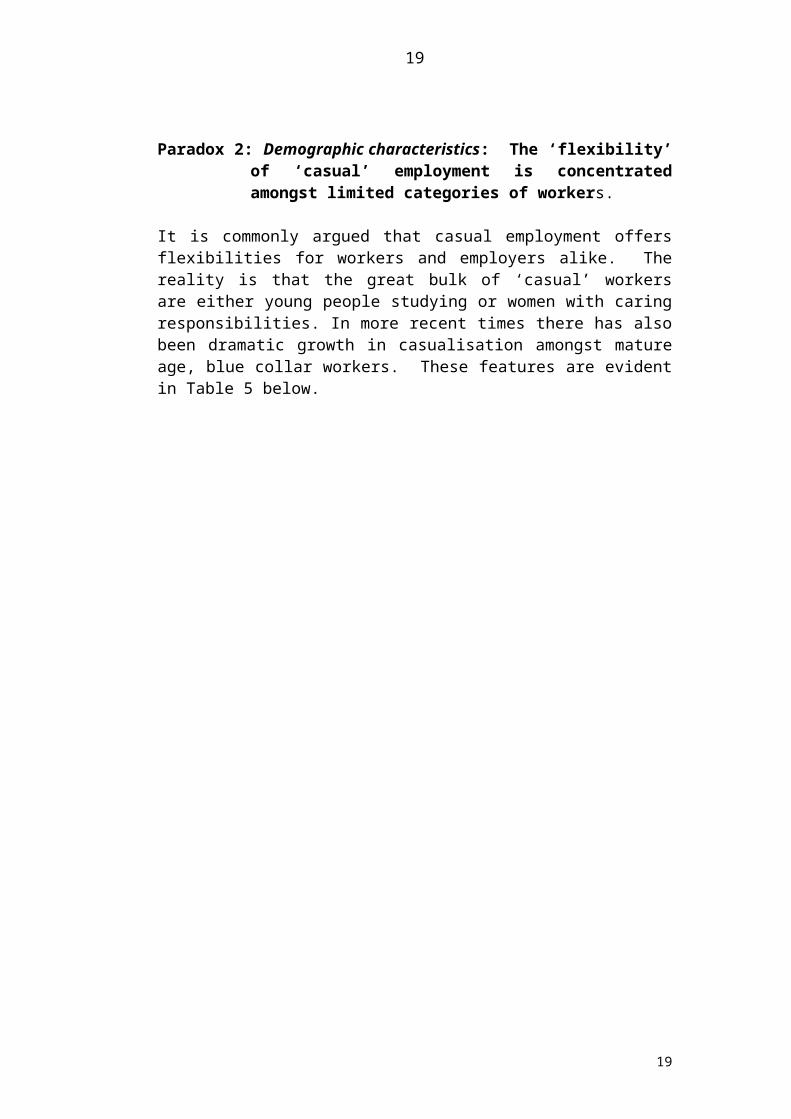
Paradox 2: Demographic characteristics: The ‘flexibility’ of ‘casual’ employment is concentrated amongst limited categories of workers.
It is commonly argued that casual employment offers flexibilities for workers and employers alike. The reality is that the great bulk of ‘casual’ workers are either young people studying or women with caring responsibilities. In more recent times there has also been dramatic growth in casualisation amongst mature age, blue collar workers. These features are evident in Table 5 below.
12
12
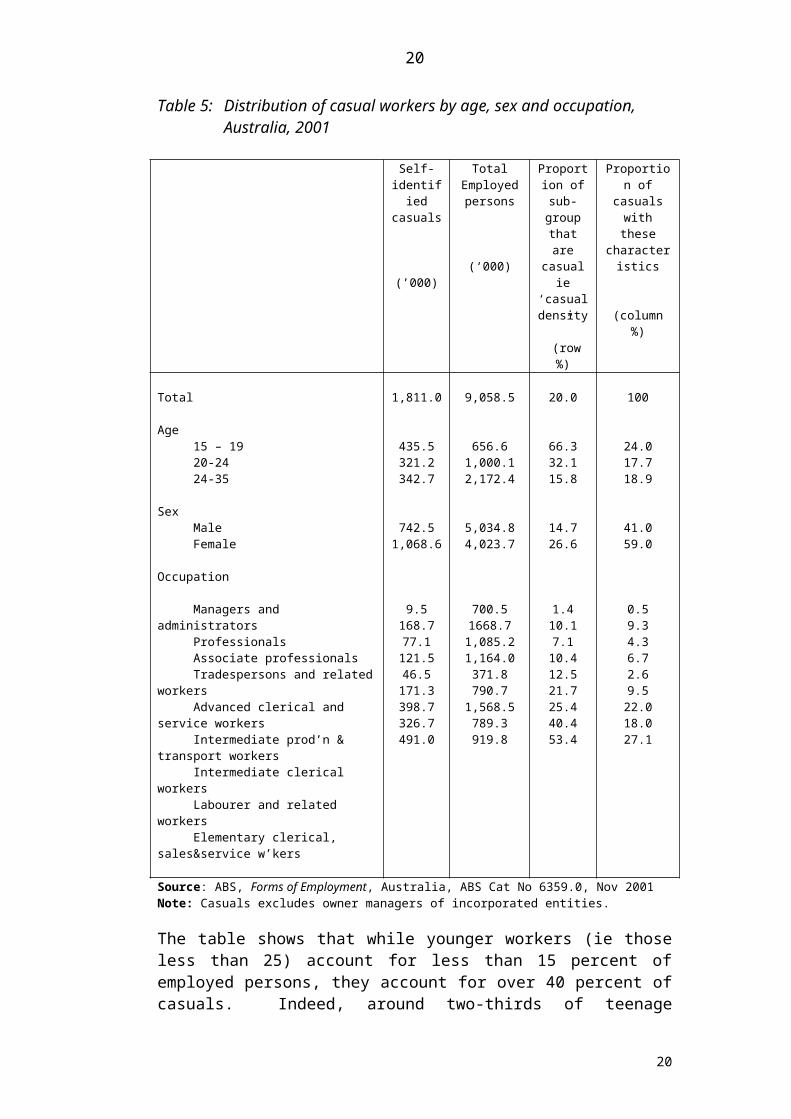
Table 5: Distribution of casual workers by age, sex and occupation, Australia, 2001
Self-identified casuals
(’000)
Total Employed
persons
(‘000)
Proportion of sub-
group that are casualie ‘casual density” (row %)
Proportion of casuals with
these characteristics
(column %)
Total
Age 15 – 19 20-24 24-35
Sex Male Female
Occupation
Managers and administrators Professionals Associate professionals Tradespersons and related workers Advanced clerical and service workers Intermediate prod’n & transport workers Intermediate clerical workers Labourer and related workers Elementary clerical, sales&service w’kers
1,811.0
435.5321.2342.7
742.51,068.6
9.5168.777.1
121.546.5
171.3398.7326.7491.0
9,058.5
656.61,000.12,172.4
5,034.84,023.7
700.51668.71,085.21,164.0371.8790.7
1,568.5789.3919.8
20.0
66.332.115.8
14.726.6
1.410.17.110.412.521.725.440.453.4
100
24.017.718.9
41.059.0
0.59.34.36.72.69.522.018.027.1
Source: ABS, Forms of Employment, Australia, ABS Cat No 6359.0, Nov 2001Note: Casuals excludes owner managers of incorporated entities.
The table shows that while younger workers (ie those less than 25) account for less than 15 percent of employed persons, they account for over 40 percent of casuals. Indeed, around two-thirds of teenage workers are casuals. Nearly three in five casuals are women. This does not mean, however, most women workers are casuals. Indeed, a little over one in four (26.6 percent) are self-identified casuals. The concentration of casual employment amongst lower skilled occupations is particularly striking. Over 60 percent of casuals are either intermediate or elementary service workers or labourers. And of the lowest skill occupations, nearly half are employed as casuals.
What are we to make of these figures? As noted in the previous section only half the workforce are now engaged as permanent employees. ‘Standard employment’ has shrunk as a result of changing employer demands, especially for employment attracting fewer obligations. It has also changed as a result of changing life courses. As is well known, in earlier decades significantly fewer women worked. Equally, fewer Australians completed more than 10 years of schooling. Year 12 retention rates doubled in the 1980s to stabilise at around 70 percent. And significantly more people now attend institutions of higher education. Previously life courses were fairly linear and fixed. Women worked until they gained caring responsibilities. People studied and then worked on leaving school. Today, life courses are not nearly so clear cut. Increasingly
13
13
women combine work and caring activities. And students combine work and study. In addition, since the commencement of the long downturn in the mid 1970s (Brenner 2002) chronic mass unemployment and under-employment have become enduring features of the Australian labour market. The figures in Table 5 indicate that casual employment has emerged as a structural legacy of major shifts in changing life courses and the level of aggregate labour demand.
Implication of Paradox 2: Casual employment is not randomly distributed across the Australian workforce. Rather it appears to closely associated with changing life courses and the onset of chronic mass unemployment and under-employment.
Paradox 3: Wages: Sometimes ‘casuals’ are paid more than their ‘permanent’ equivalents. Sometimes they are paid less.
When reflecting on the growth of employment with lower obligations owed by employers it is important to consider rates of pay. In Australia, as a matter of law, casual employees should not be cheaper to hire on an hourly basis than their permanent equivalents. As is well known, Australian casuals get a loading in lieu of the loss of entitlements to things like recreation and sick leave. This is usually in the range of 15 to 25 percent of base hourly rates of pay. What happens in practice?
In recent work commissioned by the labour hire industry Richard Curtain has reported occupational wage data for casuals and permanents. This reveals that for all occupations other than professionals, casuals earn less, not more, than permanent counterparts. These data are summarised in Table6 below.
14
14
Table 6: Average hourly earnings of employees according to employment status, Australia, 2001
Occupational Grouping
Employed on a fixed term contract
($)
Employed on a casual basis
($)
Employed on a permanent or ongoing basis
($)Managers and administrators
Professionals
Associate professionals
Tradespersons and related workers
Advanced clerical and service workers
Intermediate clerical workers
Intermediate production and transport workers
Elementary clerical sales and service workers
Labourers and related workers
Total
29.99
22.57
19.82
15.79
*
15.94
20.29
14.05
*
20.28
*
27.59
17.73
17.49
17.70
14.97
15.39
14.42
13.59
16.74
26.49
24.11
21.33
18.06
21.22
16.72
16.92
15.10
14.89
20.06
Source: HILDA Survey Wave 1, 2001 as cited in Richard Curtain, ‘A critical review of ‘Securing Quality Employment: Policy Options for Casual and Part-time Workers in Australia’ prepared for the Recruitment and Consulting Services Associations of Australia, [July] 2004.
Population: Employees, excluding owner managers of incorporated entities and full time students.
As Curtain notes his material does not control for such variables such as age, education levels and industry – key factors that account for large amounts of variations in earnings. In a recent analysis using the same data Ian Watson (2004) controlled for variables such these. His results, reported as different average hourly wage rates for permanent and casual, full and part-time employees, are summarised in Table 7.
15
15
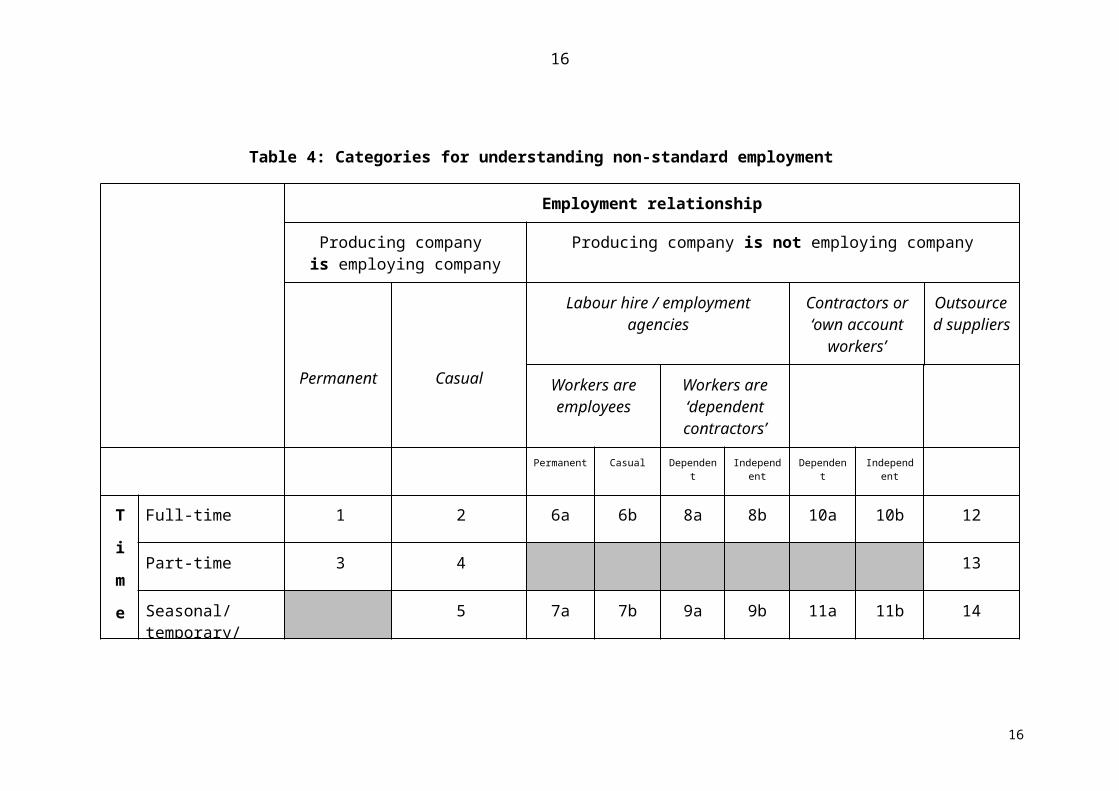
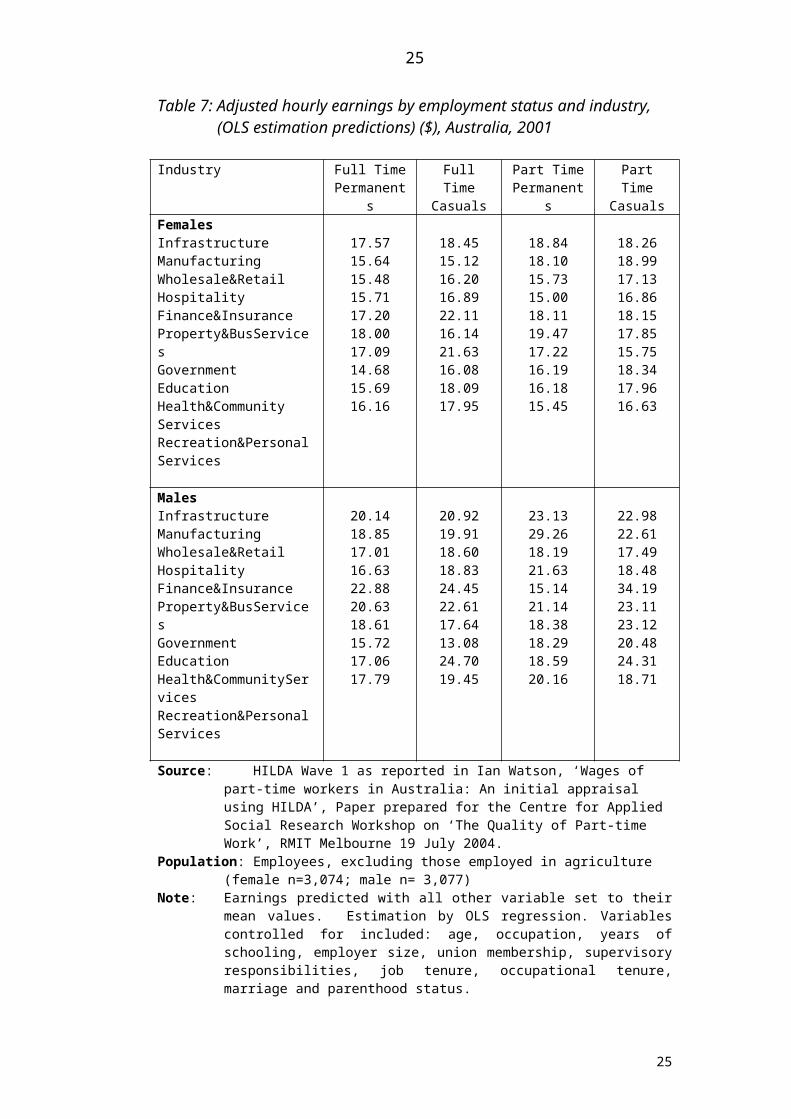
Table 7: Adjusted hourly earnings by employment status and industry,(OLS estimation predictions) ($), Australia, 2001
Industry Full Time Permanents
Full Time Casuals
Part Time Permanents
Part Time Casuals
FemalesInfrastructureManufacturingWholesale&RetailHospitalityFinance&InsuranceProperty&BusServicesGovernmentEducationHealth&Community ServicesRecreation&PersonalServices
17.5715.6415.4815.7117.2018.0017.0914.6815.6916.16
18.4515.1216.2016.8922.1116.1421.6316.0818.0917.95
18.8418.1015.7315.0018.1119.4717.2216.1916.1815.45
18.2618.9917.1316.8618.1517.8515.7518.3417.9616.63
MalesInfrastructureManufacturingWholesale&RetailHospitalityFinance&InsuranceProperty&BusServicesGovernmentEducationHealth&CommunityServicesRecreation&PersonalServices
20.1418.8517.0116.6322.8820.6318.6115.7217.0617.79
20.9219.9118.6018.8324.4522.6117.6413.0824.7019.45
23.1329.2618.1921.6315.1421.1418.3818.2918.5920.16
22.9822.6117.4918.4834.1923.1123.1220.4824.3118.71
Source: HILDA Wave 1 as reported in Ian Watson, ‘Wages of part-time workers in Australia: An initial appraisal using HILDA’, Paper prepared for the Centre for Applied Social Research Workshop on ‘The Quality of Part-time Work’, RMIT Melbourne 19 July 2004.
Population: Employees, excluding those employed in agriculture (female n=3,074; male n= 3,077)
Note: Earnings predicted with all other variable set to their mean values. Estimation by OLS regression. Variables controlled for included: age, occupation, years of schooling, employer size, union membership, supervisory responsibilities, job tenure, occupational tenure, marriage and parenthood status.
The key pattern evident in the Table is that in most industries casuals do indeed have higher hourly earnings than their full time permanent equivalents. The nature of premium varies, however, by sex, full/part-time status and industry. It is useful to compare the constrasting industries of wholesale/retail and hospitality on the one hand with education and health and community services on the other. Between them these industries account for 80 percent of casual employment. Full-time and part-time casuals in the lower skilled, private sector industries received casual premiums in the range of 5 – 10 percent for both males and females. While this is evidently better than the wages picture portrayed in Curtain’s table it is equally clear that the casual loading is not actually reflected in take-home rates of pay. This is probably due to the fact permanents either get over-awards and/or are employed in higher classifications within the same occupation. As such the casual loading is not as generous or as comprehensive a benefit as commonly assumed. The story is somewhat different in the higher skilled, public sector dominated industries of education, health and community services. With the exception of full time casual males in
16
16
education (a tiny and most likely statistically insignificant group), casuals receive a higher pay rate than their permanent equivalents. For women the premium is between 10 – 20 percent. For men it is between 30 – 40 percent. Once again the rates for women casuals appear not to fully reflect the casual loading. Only male casuals in these industries appear to be get a premium greater than the loading. And this is smallest sub-population of these groups. Most casuals - full timers and part-timers, men as well as women – get a little more than their permanent counterparts, but not as much as one would expect given the quantum of casual loadings.
Implications of Paradox 3: Cost savings associated with casuals are not primarily achieved by cuts in hourly rates of pay. Equally, however, it is clear that casual loadings are not as effective in compensating casuals as is commonly assumed.
Paradox 4: Hours. Casuals often work long, stable and predictable hours of work.
If the cost competitiveness of using casuals is not being achieved by reducing going wage rates – is it being achieved by greater hours flexibility? It is now widely recognised that working time has become less uniform in recent decades. In the past there was essentially one model informing working time standards. This covered the length of the working day (eg eight hours), length of the working week (eg 35-40 hours), lengths of the working year (eg four weeks annual leave plus public holidays) and length of working life (40 to 50 years). Working time arrangements never neatly conformed to this model, but in recent years they have become much more varied. It is important to understand the nature of recent ‘deviations’ from the ‘traditional’ model. Rather than witnessing a plethora of unique working time arrangements arising from free individuals negotiating in the privacy of their own workplaces, three distinct patterns (if not de facto standards) are now discernible. According to Buchanan et al (2001), people generally fall into one of three categories for their usual hours of work:
. quasi-standard hours (35 – 44 hours a week)
. part-time hours (less than 35 hours a week)
. extended hours (more than 44 hours a week).
They noted that the emergence of these new working time patterns appeared to be closely linked to forms of employment:
. standard hours are particularly prevalent amongst permanent wage and salary earners
. part-time hours are particularly prevalent amongst casuals
17
17
. extended hours are particularly prevalent amongst employers, the self-employed and managers, although employees make up half those working very long hours. (Buchanan et al 2001: 1)
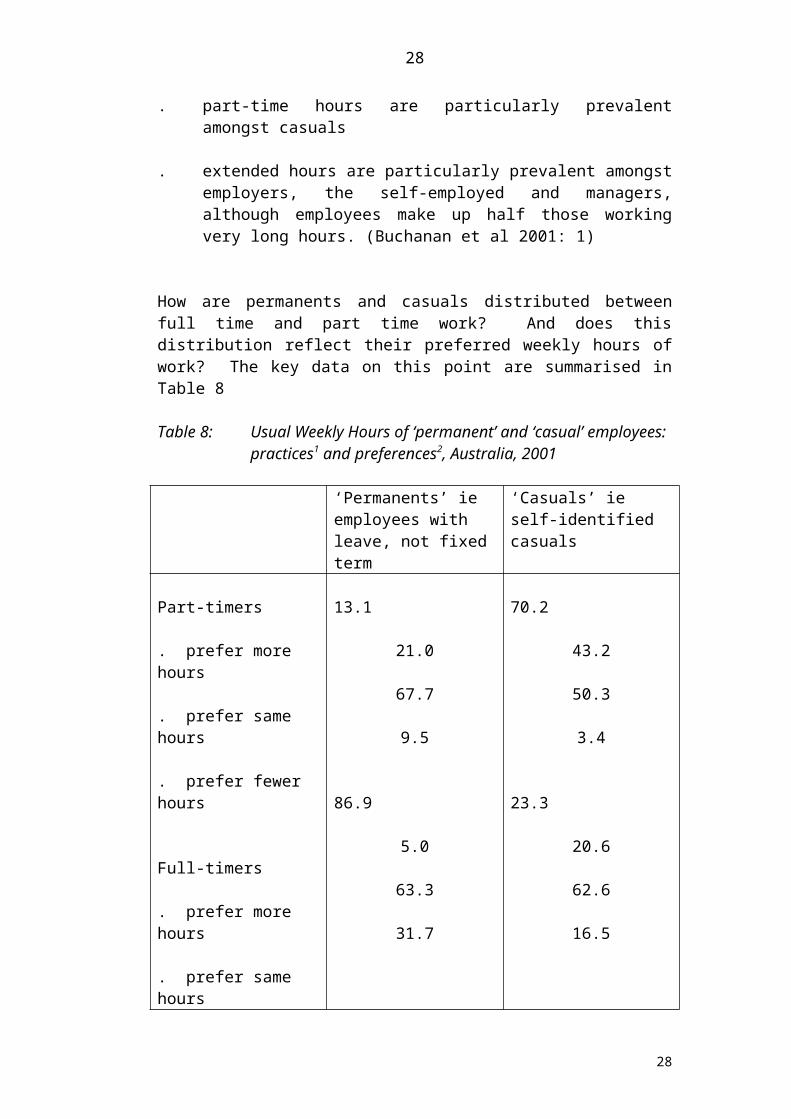
How are permanents and casuals distributed between full time and part time work? And does this distribution reflect their preferred weekly hours of work? The key data on this point are summarised in Table 8
Table 8: Usual Weekly Hours of ‘permanent’ and ‘casual’ employees: practices1 and preferences2, Australia, 2001
‘Permanents’ ie employees with leave, not fixed term
‘Casuals’ ie self-identified casuals
Part-timers
. prefer more hours
. prefer same hours
. prefer fewer hours
Full-timers
. prefer more hours
. prefer same hours
. prefer fewer hours
13.1
21.0
67.7
9.5
86.9
5.0
63.3
31.7
70.2
43.2
50.3
3.4
23.3
20.6
62.6
16.5
Source: ABS, Forms of Employment, Australia, November 2001Population: Employees excluding owner managers of incorporated entities.Notes:
1) The Forms of Employment Survey (FOES) and Survey of Employment Arrangements and Superannuation (SEAS) use slightly different categorical system. This makes only a slight difference in the proportion of full and part time workers reported in each survey.
2) Reliable preference data is notoriously difficult hard to collect. ABS has collected it in variety of ways in recent decades. (See, for example, Tracy and Lever Tracy 1991). Different approaches to collecting it were adopted in FOES 1998 and 2001 and SEAS 2000. The results of different approaches are summarised in Appendix Table 1. Despite the differences, all these recent surveys report that at least 40 percent of part-time casuals want more hours of work. Amongst full time casuals the data reported in this table is the lowest of any of the surveys. In SEAS 2000 31.8 percent and in FOES 1998 27.6 precent reported a preference for longer hours of work.
18
18
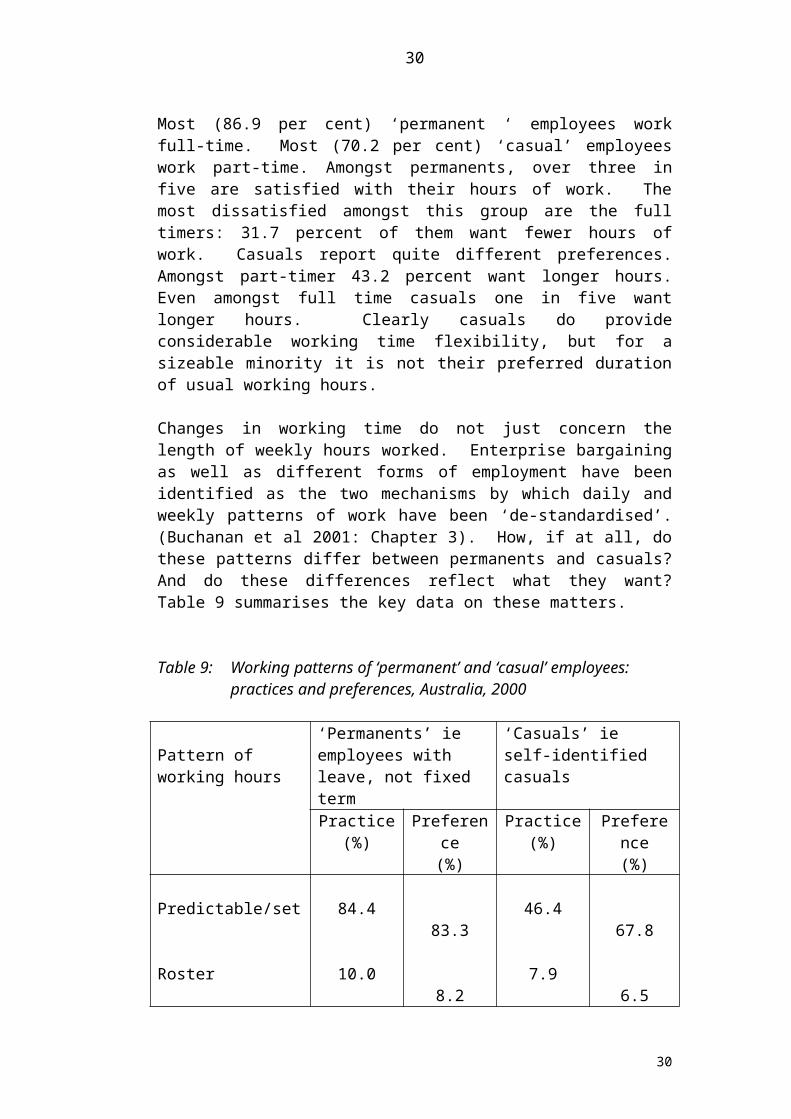
Most (86.9 per cent) ‘permanent ‘ employees work full-time. Most (70.2 per cent) ‘casual’ employees work part-time. Amongst permanents, over three in five are satisfied with their hours of work. The most dissatisfied amongst this group are the full timers: 31.7 percent of them want fewer hours of work. Casuals report quite different preferences. Amongst part-timer 43.2 percent want longer hours. Even amongst full time casuals one in five want longer hours. Clearly casuals do provide considerable working time flexibility, but for a sizeable minority it is not their preferred duration of usual working hours.
Changes in working time do not just concern the length of weekly hours worked. Enterprise bargaining as well as different forms of employment have been identified as the two mechanisms by which daily and weekly patterns of work have been ‘de-standardised’. (Buchanan et al 2001: Chapter 3). How, if at all, do these patterns differ between permanents and casuals? And do these differences reflect what they want? Table 9 summarises the key data on these matters.
Table 9: Working patterns of ‘permanent’ and ‘casual’ employees: practices and preferences, Australia, 2000
Pattern of working hours
‘Permanents’ ie employees with leave, not fixed term
‘Casuals’ ie self-identified casuals
Practice(%)
Preference(%)
Practice(%)
Preference(%)
Predictable/set
Roster
Casual/relief
Other
84.4
10.0
0.4
4.0
83.3
8.2
2.2
5.0
46.4
7.9
43.4
2.3
67.8
6.5
22.8
2.8
Source: ABS, Employment Arrangements and Superannuation, Australia, April-June 2000Population: Employees excluding owner managers of incorporated entities.
This table shows major differences in the practices between the two groups. While over four in five (84.4 percent) of permanents have predictable or set hours of work, less than half (46.4 percent) of casuals have such working patterns. The table also shows that while most permanents have the working patterns they prefer, many casuals do not. While 43.4 percent work on a casual or relief basis, only 22.8 percent prefer this working pattern. On the other hand,
19
19
while less than half (46.4 percent) work predictable or set hours, over two thirds (67.8 percent) desire such arrangements.
These data are consistent with the more comprehensive analysis of working time arrangements in Australia cited earlier. Casualisation is part of a new regime of the management of labour. It is not one of unlimited choice and flexibility that is mutually advantageous to workers and employers. Rather, it is a regime which fits many workers into the needs of production and service provision by offering only very limited choices to workers. Shorter hours are usually associated with lower pay and lower skilled work. It is primarily undertaken by those with other commitments (eg carers for children and the elderly and students) or with no other choice (eg blue collar workers seeking any kind of alternative to unemployment). (Buchanan et al 2001: especially Chapters 2 and 4).
Implications of Paradox 4: While many casuals have predictability in hours worked – many do not, but would like it. In addition, many casuals (both full timers and part-timers) want more hours of work. Prima facie it appears that employer driven working time flexibility is not synonymous with casualisation. Equally, however, it is clear that growing numbers of workers are in a weaker position to enforce their rights or fulfil their working time preferences. For many casuals, especially students, carers and blue collar workers, casual status is the price paid to get either desirable or any hours of work.
Paradox 5: Entitlements – Many casuals get OHS, superannuation and training entitlements similar to those enjoyed by permanents.
Consideration of the length and patterns of hours revealed thatemployers are increasingly able to get of work they want, when they want them. What about the entitlements that normally accrue for people performing this work? In Australia many social benefits provided by the welfare state as a right of citizenship in other countries are earned as entitlements accrued through work. It is for this reason that the Australian system of social protection has been dubbed by some as a ‘wage earners welfare state’. (Castles 1988, 1994). The typical example of this is sick leave. In a number of European countries this is provided by the state. In Australia it is provided by employers as an entitlement accrued on the basis of labour market status. Many casuals do get some of the entitlements typically associated with employment. Increasingly, however, it seems that employers can engage labour unencumbered by obligations owed to workers entitled to ‘standard’ employment conditions and benefits. This situation is summarised in Table 10.
20
20
Table 10: Incidence of key entitlements: casuals and permanents compared, Australia, 2000
‘Permanents’ ie employees with leave, not fixed term
(%)
‘Casuals’ ie self-identified casuals
(%)
Not covered by workers’ compensation
Has no superannuation or not currently contributing to super
Did not undertake any form of training
2.3
4.5
30.1
21.7
40.5
50.5
Source: ABS, Employment Arrangements and Superannuation, Australia, April – June, 2000Population: Employees excluding owner managers of incorporated entities.
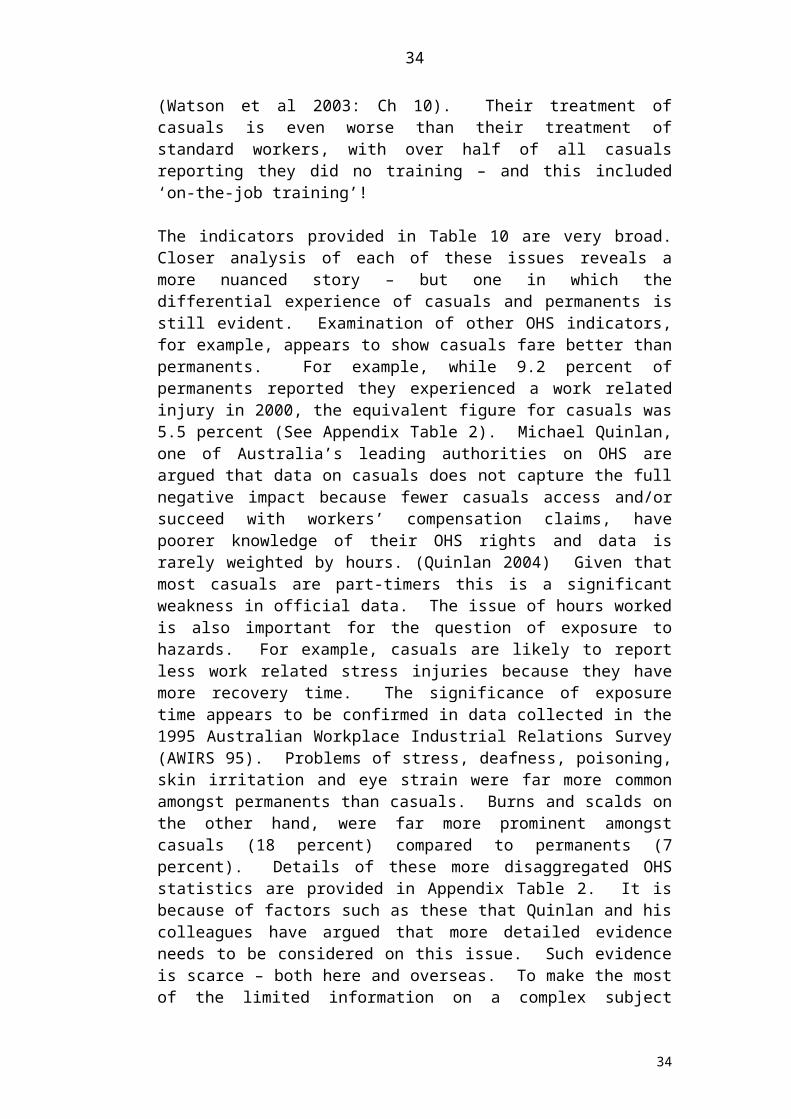
As a matter of general rights, there should be little difference between permanents and casuals in terms of workers’ compensation coverage, involvement with superannuation and training. As a matter of practice, however, there is a real difference. While less than three percent of permanents are not covered by workers’ compensation arrangements, over one in five casuals (21.7 percent) report that they were not so covered. The superannuation situation is worse. While less than on in twenty permanents did not have or were not contributing to superannuation in 2000, over two in five casuals (40.5 percent) were effectively not covered. And the situation concerning training was worse still. Australian employers have a poor reputation for training. (Watson et al 2003: Ch 10). Their treatment of casuals is even worse than their treatment of standard workers, with over half of all casuals reporting they did no training – and this included ‘on-the-job training’!
The indicators provided in Table 10 are very broad. Closer analysis of each of these issues reveals a more nuanced story – but one in which the differential experience of casuals and permanents is still evident. Examination of other OHS indicators, for example, appears to show casuals fare better than permanents. For example, while 9.2 percent of permanents reported they experienced a work related injury in 2000, the equivalent figure for casuals was 5.5 percent (See Appendix Table 2). Michael Quinlan, one of Australia’s leading authorities on OHS are argued that data on casuals does not capture the full negative impact because fewer casuals access and/or succeed with workers’ compensation claims, have poorer knowledge of their OHS rights and data is rarely weighted by hours. (Quinlan 2004) Given that most casuals are part-timers this is a significant weakness in official data. The issue of hours worked is also important for the question of exposure to hazards. For example, casuals are likely to report less work related stress injuries because they have more recovery time. The significance of exposure time appears to be confirmed in
21
21
data collected in the 1995 Australian Workplace Industrial Relations Survey (AWIRS 95). Problems of stress, deafness, poisoning, skin irritation and eye strain were far more common amongst permanents than casuals. Burns and scalds on the other hand, were far more prominent amongst casuals (18 percent) compared to permanents (7 percent). Details of these more disaggregated OHS statistics are provided in Appendix Table 2. It is because of factors such as these that Quinlan and his colleagues have argued that more detailed evidence needs to be considered on this issue. Such evidence is scarce – both here and overseas. To make the most of the limited information on a complex subject available, he, along with Phil Bohle and Claire Mayhew, have scrutinised over 200 Australian and foreign studies on the connection between precarious employment and OHS outcomes. (Quinlan et al 2001, Quinlan et al 2004). Of the 39 which examined the connection between OHS and the growth in ‘temporary, short-term, contract and leased work’, 20 found adverse associations, eight found no or positive associations and 11 were indeterminate. (Quinlan 2004 and see also Quinlan, Mayhew and Bohle 2001). While not unanimous, Quinlan and his colleagues argue that the conclusion is compelling: forms of employment like Australian casualisation are associated with worse OHS outcomes for workers.
A more detailed consideration of superannuation reveals that the fundamental disadvantage of casuals is pervasive. Ian Watson has recently examined this issue on the basis of HILDA data. As noted earlier, his analysis controlled for occupation, age, education level, job duration and industry. After controlling for all these variable he has found that casuals are still disadvantaged in terms of the level of their superannuation savings. (Watson 2004).
The nexus between low levels of training and casual employment has been overwhelming documented in a growing number of Australian studies of skill formation. No matter how training is defined – as undertaking a structured course, attending a seminar, using a self-direct learning package or just routine learning on-the-job – casual undertake less of it than permanents. (See Appendix Table 3.) It is also important to appreciate that there are qualitative well as quantitative differences in the training experiences of permanents and casuals, and as between different types of casual workers themselves. (Hall et al 2000).6 Much of this work has examined the nexus between training and non-standard work in general. Its findings are, however, relevant for casuals – because casual employment situations be were the most common form of non-standard work examined. Figure 2, drawing on this recent research, shows the links between non-standard employment and who bears the burden of providing vocational education and training (VET).
6 Note the rest of this paragraph and accompanying Figure are taken from Richard Hall, John Buchanan and Gillian Considine, ‘You value what you pay for.’ Enhancing employers’ contributions to skill formation and use, Dusseldorp Skills Forum, Sydney, June 2002
22
22
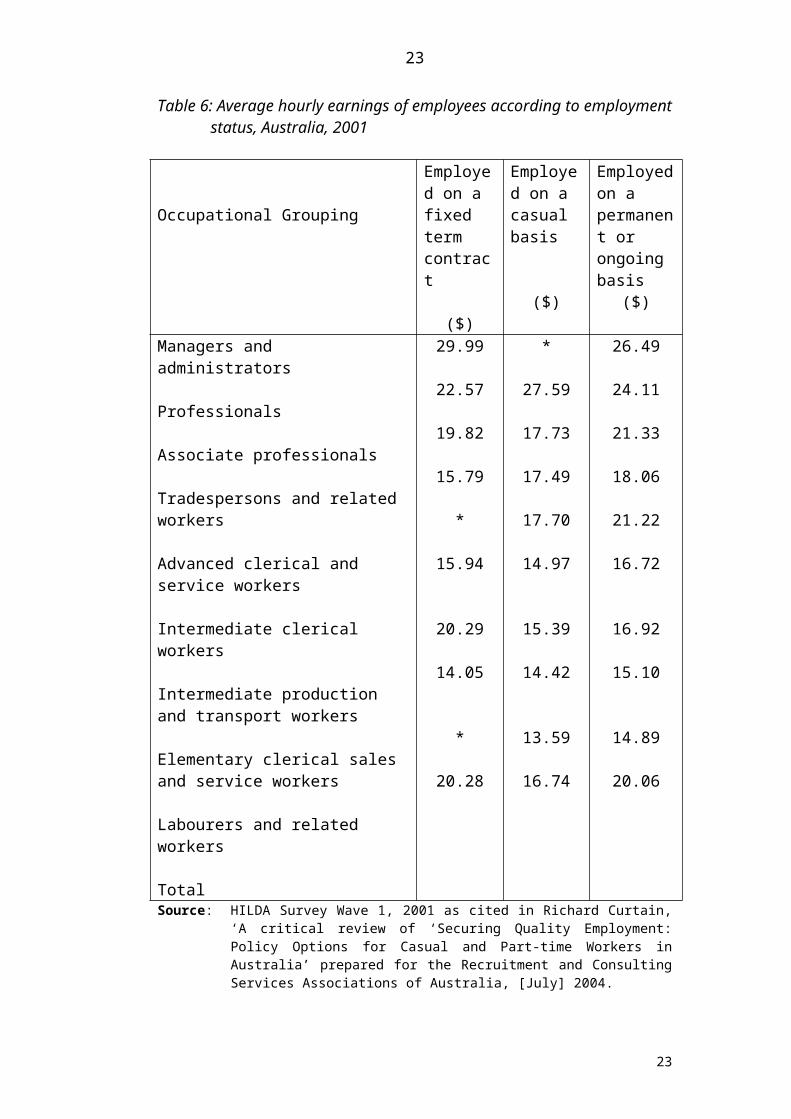
Figure 2: Understanding the links between non-standard employment
and level of vocational education and training (VET)
23
Rising levels of competition have created interest in reducing fixed labour overheads (that is, standard employment). Whether increased non-standard employment is associated with reduced levels of VET depends on the labour market situation and longevity of relations between the parties
Where labour is unskilled or is skilled but in abundant supply, all risks and costs of employment are borne by the worker (eg diving instructors, metal fitters)
=> no or limited VET
Where labour is skilled and in short supply, the potential for sharing costs and risks exists. The outcome that prevails depends on relations between the parties and institutional supports
Relations between the parties are only short-term
Relations between the parties are long-term
No institutional mechanism to spread risks of investment in VET (eg nurses)
=> no or limited VET
Institutional mechanism to spread risks (eg group training organisations)
=> more VET than would otherwise occur
Margins squeezed (eg “cost down” arrangements for cars)
=> no or limited VET
Margins fair or above average (eg IT pre2000)
=>more VET than would otherwise occur
Source: Richard Hall, Tanya Bretherton and John Buchanan, “It’s not my problem: The Growth of Non- standard Work its Impact on Vocational Education and Training in Australia, National Centre for Vocational Education and Training, Leabrook (South Australia), 2000 p.44
23
As is clear from the figure the key issues to grasp are (a) the importance of the level and abundance of skill concerned and (b) even where skilled labour is in short supply, the extent to which VET costs are shared varies depending on the longevity of relations between the parties and the existence of institutional mechanisms to facilitate it. (Hall 44 – 52) But while the dynamics summarised in Figure 2 highlight that the situation is not uniformly negative for casuals it is also important to keep in mind the most fundamental finding
When examining education and training issues associated with non-standard employment, most attention focussed on induction and ‘near fit’ training. No employers examined assisted in the acquisition of foundation skills. Where such training occurred it was all funded by either individuals or governments. (Hall et al 2000: 35).
Implication of paradox 5: As a matter of law casuals may have many of the same entitlements as permanents. Formalities should not, however, be conflated with the reality of casuals working lives. Casual status is associated with poorer levels of workers’ compensation coverage, lower levels of superannuation coverage and savingsand lowerquality and quantities of training.
Paradox 6: The redistribution of risk – shifting risks can enhance workers’ rights.
To this point our analysis has examined paradoxes which have diminished workers’ rights and entitlements. It is important to note that there have also been changes which have increased rights and opportunities for workers, especially rights for workers involved in short duration employment situations. Two examples of such institutional arrangements are provided by long service leave arrangements in the Australian construction industry and group training arrangements for the skill trades and middle range white collar jobs. These arrangements show that non-standard employment need not necessarily be sub-standard in nature.
In Australia, permanent employees who remain with their employer for 10 year or more are entitled to three months ‘long service leave’ – something akin to what Europeans call a ‘career break’. (Healey 1971) Rights to such leave are accrued against employers by all permanent employees. One reason for the rise in casual labour has been so that employers can attempt to avoid obligations such as those associated with long service leave. Access to this entitlement was always a problem for workers in the construction industry, with it high level of contractors, labour turnover and transient sites of production. Since the 1970s special arrangements have been devised to overcome this problem. (MacDonald and MacDonald 1998: 191-193) Under these arrangements all workers – irrespective of whether they are employees or contractors, permanents or casuals - accrue long service leave entitlements on the basis of
24
24
hours worked. These entitlements are paid by the head contractor or developer of a site into a trust funded managed by a tripartite ‘long service leave board’. These have statutory underpinnings and are audited by State governments. On the completion of 10 years service construction workers can take their leave, even though they may have worked for a variety of employers on the basis of a variety of employment statuses at a variety of sites. (ACIRRT b 1999: 168-169) It remains to be seen if the building and construction model will become more widespread or whether the right to long service leave steadily disappears for low and middle income earners as levels of sub-standard employment grow.
Pooling arrangements can involve more than facilitating the portability of entitlements. They can also work effectively to share the risks of employment and training more generally. Currently most corporate restructuring involves companies pushing more of the risk and uncertainty surrounding work onto workers, sub-contractors and suppliers. This is the outcome of new forms of competition. While it is important to get organisations to become individually more ‘responsible’, it is also important to find more effective ways of managing the risks associated with employment on a fairer, shared basis. Casten von Otter (1995) has demonstrated, theoretically, that ‘employment pools’ offer a way of achieving this. An example of how such pools could work in practice is provided by group training schemes in Australia. Under these arrangements, apprentices and trainees are indentured to a group training organisation, but their on-the-job training is provided by host employers who hire them for certain blocks of time. The schemes work well to ensure that organisations have access to the labour they need, when they need it. They also ensure that a larger number of employers are involved in training new labour than would otherwise be the case. The schemes are obliged to ensure the apprentices/trainees are in continuous employment for the duration of their training. As such they ensure that the risks associated with employing and training young workers are pooled across a network of employers. These arrangements currently only apply to employment with a high training component. Group training organisations employ over 30,000 (or 15 percent) of Australia’s apprentices/trainees. Of course, a version of such pooling already exists in the form of labour hire or temporary employment agencies. Such firms, however, usually push all the risks of unemployment onto the worker. The group training schemes offer a superior model of how such labour pooling arrangements could work in the future. (Buchanan and Evesson 2004) To date the success of extending the group training model to lower skilled, lower paid segments of the labour market has been limited. (acirrt 1999c) Moreover, any efforts to raise the standards under which mainstream labour hire/temporary employment agencies operate have been fiercely resisted by the labour hire industry’s employer association. It is important to note, however, that some labour hire companies are interested in offering training and continuity of employment to their workers. To date, however, such firms only employ a small percentage of the labour hire workforce.
Implication of Paradox 6: The demise of standard employment does not necessarily mean growing levels of sub-standard employment are inevitable. The challenge for the future is not pit to standards against
25
25
flexibility. Rather the challenge is devise standards for flexibility. Such arrangements, usually designed around the fairer sharing of risk, are necessary to ensure sustainable bases for labour productivity growth are nurtured in the future.
Productivity Implications: Better Deployment not Development of Labour
What do the findings about the ‘casualisation paradoxes’ mean for labour productivity? As Table 11 shows, Australia’s labour productivity performance in the 1990s was one of the best in the world.
Table 11: Average Annual Growth in Labour Productivity, Select OECD Countries, 1980s and 1990s
Country 1979 - 1989 1989 – 1995 1995 - 2000
Australia
United States
Canada
New Zealand
Norway
United Kingdom
Japan
Germany
1.1
1.2
1.0
1.9
1.0
1.8
2.8
1.8
1.7
1.2
1.3
0.0
2.8
1.8
1.2
2.3
2.5
2.2
1.7
1.3
1.3
1.2
1.2
1.1Source: Mishel et al (2002)Note: These data refer to labour productivity growth in the business sector. Data for
1979 – 95 is West Germany, 1995 – 2000 includes East and West Germany.
26
26
Like Australia’s economic performance in general this achievement has been attributed to increased ‘flexibility’ across all realms of social and economic life. But what does that actually mean? Important work by AIG/INDECS economists scrutinised a large number of overseas and Australian studies, and re-examined the Australian data for the 1990s, to ascertain if Australia’s productivity performance was similar to that of the United States. It looked, in particular, at whether productivity growth was underpinned by deepening investment and by positive spin-offs from information, communication and telecommunication (ICT) technology. Its conclusions were clear. There was little evidence for this kind of productivity performance. Rather:
The evidence fits better a story of the domestic productivity spark coming from using existing and reconstructing capital more efficiently. It fits as to timing and in the remarkable capital productivity data. Helped by the 1980s developments, the 1990s provided a high water market for ‘microeconomic reform’. That is the obvious explanation. (AIG/INDECS, 2000: 10)
The main problem with this kind of productivity performance was its limited potential: it was ‘essentially one-off’ in nature, and the same improvements ‘cannot be made twice’ (AIG/INDECS, 2000: 10).
The problem of sustaining high labour productivity growth rates is especially pronounced. It now appears that much of the improvement in labour productivity is attributable to the better deployment as opposed to the better development of labour. Casualisation has been integral to this process. The dynamics involved have been documented in a number of recent studies of the changing skill requirements of manufacturing and service industries in Victoria and NSW today (Buchanan et al 2002, 2003 and 2004). Limitations of space dictate that only details concerning manufacturing are summarised. Our most recent research indicates that very similar dynamics are at work in service industries as diverse as retail, hospitality, IT, health and community services (Buchanan et al 2003, Buchanan and Considine 2002).
Australian manufacturing has been extensively restructured over the last three decades. While smaller, it is now widely recognised as being far more competitive. Reforms in the way labour is managed have been integral to the restructuring process. Indeed, initiatives in the metal and engineering sector set the pace for restructuring labour in the 1980s. A traditionally adversarial industrial relations culture based on demarcations and disputes gave way to a wide range of initiatives directed at upgrading the role of labour in production. Central to these were:
(a) the creation of career paths to replace strictly demarcated, often deadend jobs
27
27
(b) the promotion of competency based lifelong learning to replace front end training
(c) promotion of more consultative approaches to work organisation based on teams as an alternative to hierarchical modes of work organisation
What happened? Eradication of demarcations has allowed better use of labour at existing skill levels, but no systematic upgrading of the skills profile of jobs. While apprenticeship levels have dropped, these have only been partially offset by other forms of training (primarily in things like teamwork, TQM and lean production). And work organisation has – at best – resulted in ‘managed teams’ and not increased workplace democracy. The most striking development has been the rise in levels of non-standard employment, especially casual and labour hire workers. While union and employer representatives were negotiating restructured job classifications, skill formation reform and best practice approaches to work organisation, workplace level managers were making greater use of casual, contractor and labour hire workers. Indeed, between 1986 and 1997 these forms of employment grew from about 15 to 25 per cent of manufacturing employment – and there is growing evidence that the only way to enter employment in the industry today is through labour-hire agencies. The current dynamic underway has been nicely characterised by a group of AMWU delegates in the following terms:
[Managers] equate ‘reform’ with arbitrarily cutting levels of full time, permanent employees so there are not enough people to do the work required. When demand rises additional workers are engaged as casuals, contractors or through labour hire firms. Management control has been greatly enhanced in recent years with the introduction of ever more sophisticated information and monitoring systems. These are often used to closely monitor the performance of individual workers and counsel them when time allocations for tasks are not met (ACIRRT 1998: 24).
The end result of the reform process has been a far more comprehensive deployment of labour at existing levels of skill and limited upgrading and reliance on higher levels of skills. In other words, there has been more intensive use of labour in the production process in a climate of chronic understaffing (Buchanan 2000).
The irony of recent history is that growing numbers of manufacturing employers now complain of skill shortages. Recent research into the Victorian precision engineering, automotive, food, biotech, chemicals and plastic sectors found that while employers articulated needs for workers with higher order cognitive and behavioural skills, and reported skill shortages in particular trades – the greatest challenge they face was their systematic incapacity to meet new and emerging skill needs. Excess productive capacity, intense competition and pressures on margins were leading, on the one hand, to reduced intakes of apprentices and reliance on an aging workforce for skills, and, on the other hand, to new forms of business
28
28

organisation and non-standard labour. There are four dimensions to the problem7.
Firstly, labour intensification and a preoccupation with ensuring labour was fully deployed on-the-job undermined the capacity of workplaces to conduct skills development. The stock of skills required for growth and longer-term survival were diminishing in a fashion akin to ‘farmers eating their seeds’. For example, while it takes seven years to train an aircraft engineer, the average age of a Licensed Aircraft Mechanical Engineer in Australia is now greater than 55 years.
Secondly, systemic approaches to on and off-the-job training were breaking down. For example, under pressure from head office to defend shareholder value, one site engaged in food processing which had been an industry leader in broad-based training now trained only in competencies directly relevant to the job. This was just typical of many examples in sectors as diverse as biotechnology, engineering, chemicals and plastics.
Thirdly, declining skill formation capacity was linked to new forms of business organisation and rising usage of non-standard employment. Labour hoarding in the 1960s and 1970s, a device to enable firms to respond quickly to market upturns, had been replaced by lean workforces, supplemented by casuals, contractors and labour hire workers as required.
Fourthly, whereas larger firms previously had regularly taken responsibility for nurturing appropriate levels of skilled labour for particular local and occupational labour markets, larger firms and workplaces now tightly controlled the levels of labour required for production, and this control led directly to a large drop in apprenticeship numbers (Buchanan et al 2002 and 2004).
In summary, the approach to managing labour that emerged during the 1990s was one that drew upon the skill legacies of an earlier regime for developing labour. The new regime is only sustainable as long as the legacies of that prior regime remain. As they slowly disappear current approaches to managing labour will be exposed as unviable if we wish to retain a manufacturing sector based on intermediate and higher order skills. With apologies to TS Elliot: is this the way skilled labour in Australian manufacturing ends - not with a bang but a whimper? More significantly, given that similar dynamics are underway in the services sector, what does this mean about the characteristics of jobs Australian employers will create in the future? The crisis of middle and higher range jobs in the health and education sectors are already well known. Feast and famine conditions in IT make jobs in this critical sector increasingly unattractive. Clearly better ways have to be found to reconcile the competing demands of developing and deploying labour. Allowing levels of casual employment to continue to drift up is no solution to challenges such as these. Australia is not without pointers on what an alternative policy response could look like. As the examples considered in paradox 6
7 The following summary is taken from John Buchanan, Ian Watson and Chris Briggs, ‘Skill and the Renewal of Labour: The Classical Wage-Earner Model and Left Productivism in Australia’ in Chris Warhurst, Irena Gruglis and Ewart Keep (eds), The Skills that Matter, Palgrave, MacMillan, Houndmill (UK), 2004: 197 – 198.
29
29
highlighted, non-standard work need not necessarily be sub-standard work. As was noted in that section the challenge is not to pit ‘standards’ against ‘flexibility’ but rather to devise standards for flexibility.
Conclusion: Casualisation, not just casuals, is the problem
This paper commenced by noting that the topic of casual employment is riddled with ambiguity and paradoxes. These problems will not be overcome with ‘more research’. Rather making sense of them is the key to understanding the significance, especially for labour productivity, of casualisation in Australia today.
The key findings of the paper can be summarised as follows. Definitional ambiguity reflects changes in the form rather the substance of long term employment relations in the workplace. The demographic characteristics of most casuals indicates this form of employment has more to do with limited choices available to young people, women and low skill workers than any flourishing of choices for people at work. Cost savings associated with casuals are not achieved by cutting their hourly wage rates. Rather it appears to arise from casuals weakened ability to obtain standard rights traditionally associated with ongoing employment and an inability to fulfil their own working time preferences as they meet the needs of production or service provision. The demise of standard employment need not necessarily undermine standards in the labour market. Indeed, new standards and arrangements, designed around the fairer sharing of risk, are necessary to ensure sustainable bases for labour productivity growth are nurtured in the future.
These findings indicate that the key challenge is not simply to rectify problems experienced by individual casual workers. Rather, they highlight that the problem is the processes of casualisation itself. As the analysis of changing labour requirements in manufacturing showed, the significance of Australian casualisation is that it is integral to labour management strategies that achieve the better deployment, not development, of labour. Such an approach to labour productivity improvement cannot continue forever. Any long run growth in labour productivity can only be sustained if the capacity for labour to undertake a broader range of activities is increased. This challenge cannot be solved off-site. Highly skilled, innovative individuals cannot be created by the education system alone. It has long been recognised that ‘learning by doing’ is essential for the development of well rounded skills. (See, for example, Arrow 1961, Elam 1993, Cartier 1994). Indeed, for many people not suited to classroom based learning situations it is often a superior setting within which to learn. In addition, it has also been recognised that long term employment relations are of benefit to employers as well as workers. The continuity of association provides the basis for innovation as well as continuity of production and service provision. (Rubery and Wilkinson 1994).
30
30

Many employers intuitively understand the benefits of on-the-job training and long term employment relations. Today, however, they operate in circumstances which limits their ability to provide proper training and encourages them to minimise the obligations associated with (but not the incidence of) long term attachments in the workplace. Amongst larger firms in particular the pressures to maximise shareholder value in the short-run and to survive in a world of excess capacity are immense. (Brenner 2002, Froud, Williams and 2002). In responding to the current situation it is simply not possible – nor is it necessarily desirable – to promote ‘permanent jobs’ of the kind that once prevailed as recently as 30 years ago. Equally, it is unhelpful to celebrate or passively accept the recent growth in ‘casual’ employment as an inevitable part of working life in today’s ‘globalised’ and ‘competitive’ world. If current trends continue, we are likely to witness the further erosion of safety and training standards – as well as growing numbers of working arrangements that do not reflect workers’preferences. While this may be sustainable in the short run – in the longer term it implies a profound drop in working life standards for many people. Inequality does not just concern wages and income – it goes to the whole experience of life and the character of jobs created. As life courses continue to change and as chronically high levels of unemployment and under-employment persist – casualisation could become entrenched as a key feature of Australian society. The economy will, of course, continue to function, but on a different basis. Whereas previously it delivered jobs of an underlying decent standard, this is increasingly not the case. And as we noted this not only affects issues of fairness - in the long term it has efficiency implications. Skill shortages are already emerging. Declining safety standards and pressures on systems of workers’ compensation also appear set to increase. And the profound gaps in the superannuation system are only just beginning to be appreciated.
Australia has experienced serious labour market challenges in the past. From the crises of the 1890s and 1930s innovative approaches to labour regulation and demand management emerged. The possible elements of a better future based on the fairer sharing of risks are provided by the examples of group training and construction LSL arrangements. In the current situation, the greatest barrier to social and economic renewal are not rigidities in the labour or other markets. Rather it is the intellectual rigidities concerning the inevitability of current developments and the purported superiority of market solutions. These are retarding our capacity to respond creatively to the challenges of working life today. Breaking out of these rigidities is essential if effective solutions to the deepening problem of casualisation in Australia are to be overcome.
31
31

Appendix 1: A summary of recent ABS data on preferences concerning usual weekly hours of work
Preferences concerning weekly hours by part-time and full-time status
Form of employment
Employees with leave not fixed term
Self-identified casuals
FOES 1998
SEAS2000
FOES2001
FOES 1998
SEAS2000
FOES2001
Part-time. prefer more. prefer same. per less - for less pay - for same pay
Full-time. prefer more. prefer same. per less - for less pay - for same pay
24.362.87.6
8.861.824.4
24.167.2
5.21.6
15.067.6
8.57.7
21.067.79.5
5.063.331.7
45.247.24.3
27.657.313.2
41.554.7
2.41.3
31.859.1
5.43.4
43.250.33.4
20.662.616.5
Sources: ABS, Forms of Employment, Australia, Cat No 6359.0, August 1998ABS, Employment Arrangements and Superannuation, Australia, Cat No 6361.0, April – June 2000ABS, Forms of Employment, Australia, Cat No 6359.0, November 2001
Notes: The question on preferences was asked differently in the FOES and SEAS. The former asked about preferences and made no reference as to whether a reduction in pay would be linked to reduced hours. For more details see FOES 2001 at page 30. The SEAS linked the question on preferred shorter hours to a corresponding cut in pay. ‘The option “fewer hours for the same pay” was not offered, but there was provision for interviewers to record this response if a respondent insisted. (6% of employees excluding owner managers of incorporated enterprises responded in this way.)’ For more details see SEAS 2000 page page 61.
32
32

Appendix 2: Occupational Health and Safety - Key indicators
‘Permanents’ ie employees with leave, not fixed term
(%)
‘Casuals’ ie self-identified casuals
(%)SEAS. Work related injury in the
last 12 months in main job
9.2 5.5
AWIRS. Incidence of injury or illness (excluding colds and flu) in last 12 months
. Burns and Scolds
. Stress
. Other: deafness, poisoning, skin irritation
. Eye strain
Time off work with injury
. mean days
. none (%)
. >1 day off (%)
. received workers compensation(%)
18
7
27
17
7
7.651
15.535
13
18
17
11
2
6.364
17.722
Sources:ABS, Employment Arrangements and Superannuation, Australia, Cat No 6361.0, April – June 2000
Alison Morehead et al, Changes at work: the 1995 Australian Workplace Industrial Relations Survey, Longman, Sydney, 1997.
Population:. SEAS: Employees excluding owner managers of incorporated enterprises. AWIRS: Labour force survey basis for defining casuals: ie entitlement to
sickness and holiday pay.
33
33
Appendix 3: Type of Training undertaken by form of employment status, Australia, April – June 2000
Source: ABS, Employment Arrangements and Superannuation, April to June 2000, Catalogue No. 6361.0
Population: This table covers workers engaged in contracts of service – ie. Employees. It excludes owner managers of incorporated organisations.
Note: Total may be less than the sum of components as people may have undertaken more than one type of training
Whether received training in the last 12 months in main job
Employees“Permanents”Employees with leave entitlements not working on a fixed-term contract
%
“Fixed term contract”Employees with leave entitlements working on a fixed-term contract
%
“Casuals” All employees
%
Self-identified casuals
%
Employees without leave entitlements who did not identify as casual
%Undertook one or more of these types of training(a)
Undertook a structured training course
Attended a seminar, workshop or conference for training purposes
Undertook on-the-job training
Used self-learning package
Did not undertake any of these types of training
69.9
31.3
43.0
36.9
11.7
30.1
81.8
40.5
55.4
44.1
13.1
18.2
49.5
11.5
14.2
35.4
3.5
50.5
50.7
12.6
22.8
30.0
7.3
49.3
65.2
26.6
36.3
36.7
9.8
34.8
Total 100.0 100.0 100.0 100.0 100.0Number (‘000)(% of all employees )
4 801.5(70.2)
286(4.2)
1 596.4(23.3)
159.9(2.3)
6 843.7(100.0)
34
34

References
ABS, Employment Arrangements and Superannuation, Australia, Cat No 6361.0, April – June 2000
ABS, Forms of Employment, Australia, Cat No 6359.0, August 1998ABS, Forms of Employment, Australia, Cat No 6359.0, November 2001 ABS, Labour Force Survey, Cat No 6203, Australia, especially issues: January 1997
(trends in self employment), July 1997 (Owner Managers of Incorporated Enterprises) and July 1999 (casual employment).
acirrt (1998) Work/Time/Life: An issues paper for the Australian union movement, prepared by the Australian Centre for Industrial Relations Research and Training with assistance of researchers at RMIT University for the Work/Time/Life conference in Melbourne 19-20 November
acirrt (1999a) ‘The only right you have is the right to be fired’ A Report for the AMWU (not published), March
acirrt (1999b), Australia at work: Just managing?, Prentice Hall, Sydneyacirrt (1999c) Beyond the fragments. The experiences of a community based
labour hire firm in achieving flexibility with fairness for low paid casual workers, Dusseldorp Skills Forum, November available at www.dsf.org.au
Arrow, Kenneth J (1962) ‘The economic implications of learning by doing’, Review of Economic Studies, Vol xxix (3) No 80 : 155 – 173
Bohle, Philip, Quinlan, Michael and Mayhew, Claire (2002) ‘The Health and Safety Effect of Job Insecurity: An Evaluation of the Evidence’ Economic and Labour Relations Review,….: 35 – 60
Brenner, Robert (2002) The Boom and the Bubble. The US in the World Economy, Verso, London
Buchanan, J. and Considine, G. (2002), Stop telling us to cope! NSW nurses explain why they are leaving the profession, NSW Nurses Association, (available as a working paper at www.acirrt.com)
Buchanan, J., Briggs, C. and Evesson, J. (2002) Renewing the Capacity for Skill Formation: the Challenge for Victorian Manufacturing, A Report for the VLESC/MICC: Melbourne (available at www.det.vic.gov.au/otte).
Buchanan, J., Schofield, K., Briggs, C., Considine, G., Hager, P., Hawke, G., Kitay, J., Meagher, G., Macintyre, J., Mounier, A. and Ryan, S. (2001) Beyond flexibility: skills and work in the future, Sydney: NSW Board of Vocational Education and Training (BVET) and published at www.bvet.nsw.gov.au.
Buchanan, John (2000) Beyond Flexibility? The Restructuring of Labour Management in the Australian Metal Industry since the mid 1980s, Ph D Dissertation, University of Sydney
Buchanan, John and Chris Briggs (2004) ‘Not with a bang but a whimper?’ Skills and the future of NSW Manufacturing and Engineering, NSW TAFE Commission, Sydney, February
Buchanan, John and Hall, Richard (2003) Beyond VET: The Changing Skill Needs of the Victorian Services Industries Volume 1: Summary Report, Office of Training and Tertiary Education, Victoria
35
35

Buchanan, John and Justine Evesson, (2004) Creating Markets or decent jobs? Group training and the future of work, Australian National Training Authority/National Centre for Vocational Education and Training, Adelaide.
Buchanan, John and Watson, Ian (2000) ‘Casuals and the growing threat to retirement incomes’, ASX Perspective, 2nd Quarter: 52 – 56
Buchanan, John, van Wanrooy, Brigid, Considine, Gillian and Bretherton, Tanya (2001), Working Time Arrangements in Australia: A Statistical Overview for the Victorian Government, Industrial Relations Victoria, Melbourne
Cartier, Kate (1994) ‘The transaction costs and benefits of the incomplete contract of employment’, Cambridge Journal of Economics, No 18 : 181 – 196
Castles, F G. Australian Public Policy and Economic Vulnerability: A Comparative and Historical Perspective, Allen and Unwin, Sydney, 1988.
Castles, F. G. ‘ ‘The Wage Earners’ Welfare State Revisited: Refurbishing the Established Model of Australian Social Protection’, Australian Journal of Social Issues, vol. 29, no 2, 1994 pp. 120–45.
Curtain, Richard (2004) ‘A critical review of ‘Securing Quality Employment: Policy Options for Casual and Part-time Workers in Australia’ paper prepared for the Recriutment and Consulting Services Association
Elam, Mark (1993) ‘Markets, morals and powers of innovation’, Economy and Society, Vol 22 No 1 February : 1-41
Froud, Julie, Johal, Sukdev and Williams, Karel (2002) ‘Heaven and Hell: The Macrodynamics and Micro Experience of Inequality’, Journal of Industrial Relations, Vol 44 No 1: 62 – 87
Gonos, George (1997) ‘The Contest over “Employer” Status in the Postwar United States: The Case of Temporary Help Firms’, Law and Society Review, vol. 31, no. 1,
Hall, R., Buchanan, J. and Considine, G. (2002) ‘”You Value What You Pay For” - Enhancing Employers Contribution to Skill Formation and Use’, A Discussion Paper for the Dusseldorp Skills Foundation, Sydney
Hall, Richard, John Buchanan and Gillian Considine, “You value what you pay for” Enhancing Employers’ contribution to skill formation and use, Dusseldorp Skills Forum, Sydney, 2002
Hall, Richard, Tanya Bretherton, John Buchanan, ‘Its not my problem’: Non-standard work and Vocational Education and Training in Australia, Australian National Training Authority/ National Centre for Vocational Education Research, Adelaide, 2000
Healey, Bede (1971) Federal Arbitration in Australia. An Historial Outline, Georgian House, Melbourne
Kryger, Tony (1999) ‘Casual Employment’, Research Note 2, 1999 – 20000, Statistics Group, Parliamentary Library, August
MacDonald, Tom and Audry MacDonald (1998), Intimate Union. Sharing a revolutionary life, Pluto Press, Sydney
36
36
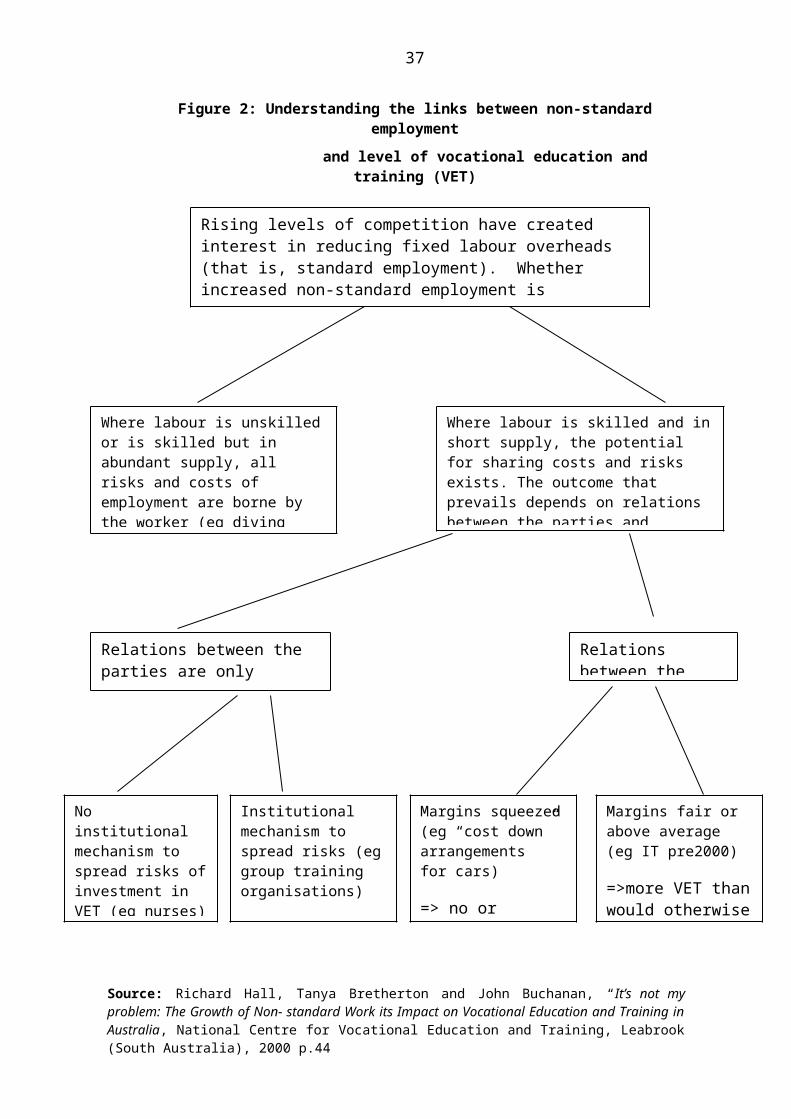
Michel, Lawrence, Jared Bernstein and Heather Boushey (2003) The State of Working America 2002-03, Cornell University Press, Ithaca
Morse, Dean (1969) ‘Historical Perspective: The Peripheral Worker (1969)’ reprinted in Kathleen Barker and Kathleen Christensen (eds) Contingent Work: American Employment Relations in Transition, ILR Press, Ithaca, 1998 pp. 21-40.
Murtough, Greg and Waite, Matthew (2000) The Growth of Non-Traditional Employment: Are Jobs Becoming More Precarious?, Staff Research Paper, Productivity Commission, Ausinfo, Canberra
Quinlan, Michael (2004) ‘Implications of the growth in Precarious Employment/Contingent Work for Occupational Health and Safety: An International Review’, Paper presented at the 18th World Conference on Health Promotion and Health Education, Melbourne Exhibition Centre, 26 – 30 April (and allied tables summarising the most recent relevant literatue)
Quinlan, Michael (2004) ‘Report prepared for the NSW Employment Security Test Case in relation to two Australian Bureau of Statistics (ABS) Survey Reports filed by Employers First’, Sydney
Quinlan, Michael, Mayhew, Claire and Bohle, Philip (2001) ‘The Global Expansion of Precarious Employment, Work Disorganisation, and Consequences for Occupational Health: A Review of Recent Research’, International Journal of Health Services, Vol 31 No 2 : 335 – 414
Rubery, Jill (1994) ‘Internal and External Labour Markets: Towards and Integrated Analysis’ in Jill Rubery and Frank Wilkinson (eds), Employer Strategy and the Labour Market, Oxford University Press, Oxford
Tracy, Noel, and Lever-Tracy, Constance (1991) ‘The Longer Working Week in Australia’, Labour and Industry, Vol 4 No 1 March: 71 – 94
von Otter, Casten 1995, ‘Employment Pools: A Common Resource Approach to the Labour Market’, Economic and Industrial Democracy, Vol 16 No 2 pp 301-313
Watson, Ian (2004) ‘Wages of part-time workers in Australia: An initial appraisal using HILDA’, Paper prepared for the Centre for Applied Social Research Workshop on ‘The Quality of Part-time Work’, RMIT Melbourne 19 July
Watson, Ian, John Buchanan, Iain Campbell and Chris Briggs, Fragmented Futures: New Challenges in Working Life, Federation Press, Sydney, 2003
Wooden, Mark (1999) ‘Job Insecurity and Job Instability: Getting the Facts Straight’, Business Council of Australia Papers, Vol 1 No 1: 14 – 18
37
37