Embed Size (px)
Citation preview

Copyright © 2016 NTT DATA Corporation
NTT DATA Corporation, Public Sector 1Masao Furuta
Paradigm shift for Industrie4.0 by Software~Realization of sophisticated analysis functions through Fog computing

2Copyright © 2013NTT DATA WAVE CorporationCopyright © 2016 NTT DATA Corporation
Agenda
1. Introduction
2. Need for sophistication of mechanical processing
3. Difference in Japan’s and Germany’s efforts, and NTT DATA
Corporation’s ideas
4. Concept of fog computing
5. Use cases
6. Our company’s IoT platform and system concept
7. Example of advanced data analysis
8. Use case of system

3Copyright © 2013 NTT DATA WAVE CorporationCopyright © 2016 NTT DATA Corporation
New York, USA
California, USA
Washington, USA
Location
1
2
3
4
IBM
Hewlett-Packard
Microsoft
Accenture
5
6
7
8
Dell, Inc
Cisco Systems, Inc.
Oracle Corporation
EMC
Company Name
9
10
11
12
Intel
NTT DATA
Thomson Reuters
Fujitsu
13
14
15
CapGemini
CSC
SAP SE
Dublin, Ireland
Texas, USA
California, USA
California, USA
Massachusetts, USA
California, USA
Tokyo, Japan
Massachusetts, USA
Tokyo, Japan
Paris, France
Virginia, USA
Walldorf, Germany
Source:
IDC Financial Insights Fin Tech Rankings Top25
Enterprise (Published: 16 September 2015)
■ Business Areas:
- System integration
- Networking system services
- Other business activities related
to the above
1.1 About NTT DATA Corporation (1/2)

4Copyright © 2013 NTT DATA WAVE CorporationCopyright © 2016 NTT DATA Corporation
Bases: 79 cities
Employees: approx. 15,000
EMEA
Bases: 27 cities
Employees: approx. 11,500
APAC
Bases: 57 cities
Employees: approx. 13,000
AmericasBases: 13 cities
Employees: approx. 3,500
China
Approx. 76,000 persons deployed in 42 countries and regions around the world.
1.1 About NTT DATA Corporation (2/2)
NTT DATA Deutschland GmbHZentrale München Zamdorfer Straße 120
81677 München, Germany

5Copyright © 2013 NTT DATA WAVE CorporationCopyright © 2016 NTT DATA Corporation
Airport area 空港エリア
Airport traffic
control center Air traffic flow management
Location
information
Terminal radar
information
processing
system
Flight information management
Area control centerArea control center
Flight route radar information processing
system
Control desk
Domestic flight routes areas
Flight route radar information processing
system
Control desk
Terminal
radar
information
processing
system
Marine control data
display system
Position report
Marine areasDomestic flight routes areas
A system for providing control support information such as information on flight schedules, flight routes and advanced control instructions, the positioning of aircrafts from the ground and from satellites, and weather, etc., to air traffic controllers.
Airport area
Provided by our company
1.2 Recent Overview of Business Activities
Air traffic control system

6Copyright © 2013 NTT DATA WAVE CorporationCopyright © 2016 NTT DATA Corporation
Digitization and long-term preservation business of valuable documents at the Vatican Library ・Entrusted with the digitization of historic documents by the Vatican Library
Botticelli’s illustration found in Dante’s
“Divine Comedy”Dante’s “Divine Comedy” drawn by the famous painter
Sandro Botticelli (masterpiece “The Birth of Venus”) for
the head of a noble Medici family in the 15th century.
Digital archiving business in the Vatican Library1.2 Recent Overview of Business Activities

7Copyright © 2013NTT DATA WAVE CorporationCopyright © 2016 NTT DATA Corporation
2. Need for sophistication of mechanical processing
(1) Immediate judgement of work results in each process
⇒We want to find defects in each process and remove them on-the-spot
⇒Finding defects through the final inspection process is inefficient
Process
1Process
2
Process
3Inspection
It is inefficient to find defects through the final inspection process
●Current
●After improvement
Process
1Process
2
Process
3Inspection
CHECK CHECK CHECK
Realized
through IoT
Slip through Slip through Slip through
Defective
product
Defective
product
Defective
product
Slip through Slip through Slip through
Defects Defects Defects

8Copyright © 2013NTT DATA WAVE CorporationCopyright © 2016 NTT DATA Corporation
2. Need for sophistication of mechanical processing
(2) Realizing zero down time by detecting signs
⇒Great losses occur when breakdowns happen. (Toyota loses 3M JPY if operations stop for 1 minute)
⇒If replacement parts have long delivery dates, there is a concern that additional losses will occur.
Break
down
DOWN TIMEReplacement
●Corrective maintenance
Sign detectionReplacement
●Preventive maintenance
!
Loss
occurs
Prevention Realization of Zero Down Time

9Copyright © 2013NTT DATA WAVE CorporationCopyright © 2016 NTT DATA Corporation
3. Difference in Japan’s and Germany’s efforts, and NTT DATA Corporation’s ideas
Devices
Controller(control)
MES(on-site mgmt.)
ERP(business mgmt.)
Germany’s efforts
Top
down-
type (importance
placed on
strategy)Standard
Standard
Standard
Devices
Controller(control)
MES(on-site mgmt.)
ERP(business mgmt.)
Japan’s efforts
Improve
& devise
Improve
& devise
Improve
& devise
Bottom
up-
style (importance
placed on
operations)
Straight data
integration
Optimization by
processOur company’s
ideas
I4.0
KAIZEN
To combine I4.0
with Japan’s
analysis technology

10Copyright © 2013NTT DATA WAVE CorporationCopyright © 2016 NTT DATA Corporation
4. Concept of fog computing
Advanced processing can be realized in real-time by controlling devices through
cooperation between on-site computers (Fog) and computers (Cloud) on the center side.
Sensor network Fog Cloud
Analysis and
judgement based on
rules
Data with volume
Diversified data
Highly frequent data Decisionon analysis
andthreshold value
Cooperation
Data and status of
machines and sensors
Threshold value, and
setting changes
Can immediately make analyses and judgements
since they are close to machines
Can make exact analyses in large
quantities since the computer’s
power resource is large

11Copyright © 2013NTT DATA WAVE CorporationCopyright © 2016 NTT DATA Corporation
Sensor network(1) Decision
on normal &
abnormal
threshold
values
5. Use cases
(2) Decision
on
abnormality
Raw data
Feedback on threshold values
[Preparation phase]
[Operating phase]
Raw data
Abnormality?
Surveillance
through
monitoring data
No
YES
Failure prediction of production equipment are:(1) Analyzed in the cloud where threshold values are decided(2) Abnormalities are determined in the fog using threshold values(3) Machine operations are stopped when an abnormality is detected
Large amount
of data
Large amount
of data
Large amount
of data
Transmission of related data before
and after occurrence of abnormality
Fog Cloud
(3) Actions such as process
cancellation, etc. (immediate)

12Copyright © 2013 NTT DATA WAVE CorporationCopyright © 2016 NTT DATA Corporation
PLC
Device
PLC
Device
PLC
Device
Control LAN(PROFINET etc)
6. Our company’s IoT platform and system concept
Fog node
OPC
serverSCADA MES
Software for
KAIZEN
OPC-UA MQTT
Low frequency data for use in
system monitoring is handled on the
OPC side.
I4.0KAIZEN
IoT Platform
(ANYSENSE)
Software for
KAIZEN
IoT Platform
(ANYSENSE)
Data for monitoring (I4.0) and data for KAIZEN (analysis-use) are separated in the fog node.
Highly frequent data is analyzed through fog/cloud cooperation, and on-site processes become more sophisticated.
Highly frequent data for use in analyses is handled in the
fog/cloud.

13Copyright © 2013 NTT DATA WAVE CorporationCopyright © 2016 NTT DATA Corporation
7. Example of advanced data analysis
Example of applying abnormal sound detection for diesel engines・Use sensors to collect sounds from diesel engines
・Use machine learning to automatically determine the range of normal sounds from collected data
・Detects abnormal sounds that cannot be detected under normal circumstances
→
分析
*The picture is an illustrated image
Degree of
abnormality
determination
Strength of noise
It’s possible to classify normal and abnormal sounds even when the
strength of noise is the same

14Copyright © 2013 NTT DATA WAVE CorporationCopyright © 2016 NTT DATA Corporation
7. Example of advanced data analysis
Example of applying failure prediction for production equipment・Apply machine learning to the normal correlation pattern of multiple sensor data
・Display a list of candidate factors deemed as abnormalities
⇒Possible to quickly identify factors using the factor candidate list
⇒Possible to take countermeasures before production equipment breakdowns occur
!
Possible to detect signs
from correlate multiple senor data*The picture is an illustrated image

15Copyright © 2013 NTT DATA WAVE CorporationCopyright © 2016 NTT DATA Corporation
7. Example of advanced data analysis
Upper limit
Lower limit
Water level
Pump OFF
Pump ON
Alarm
Example of application in overseas (Israel) water purification plant・Collect data operating conditions and the status of operations
・Apply machine learning to the normal correlation pattern of operations and operating conditions
・Detect hacking attempts from outside of the system, operational errors, equipment failures, etc.
Alarm automatically goes off when the
operating conditions of pumps and water level
changes differ from normal patterns
16Copyright © 2013 NTT DATA WAVE CorporationCopyright © 2016 NTT DATA Corporation
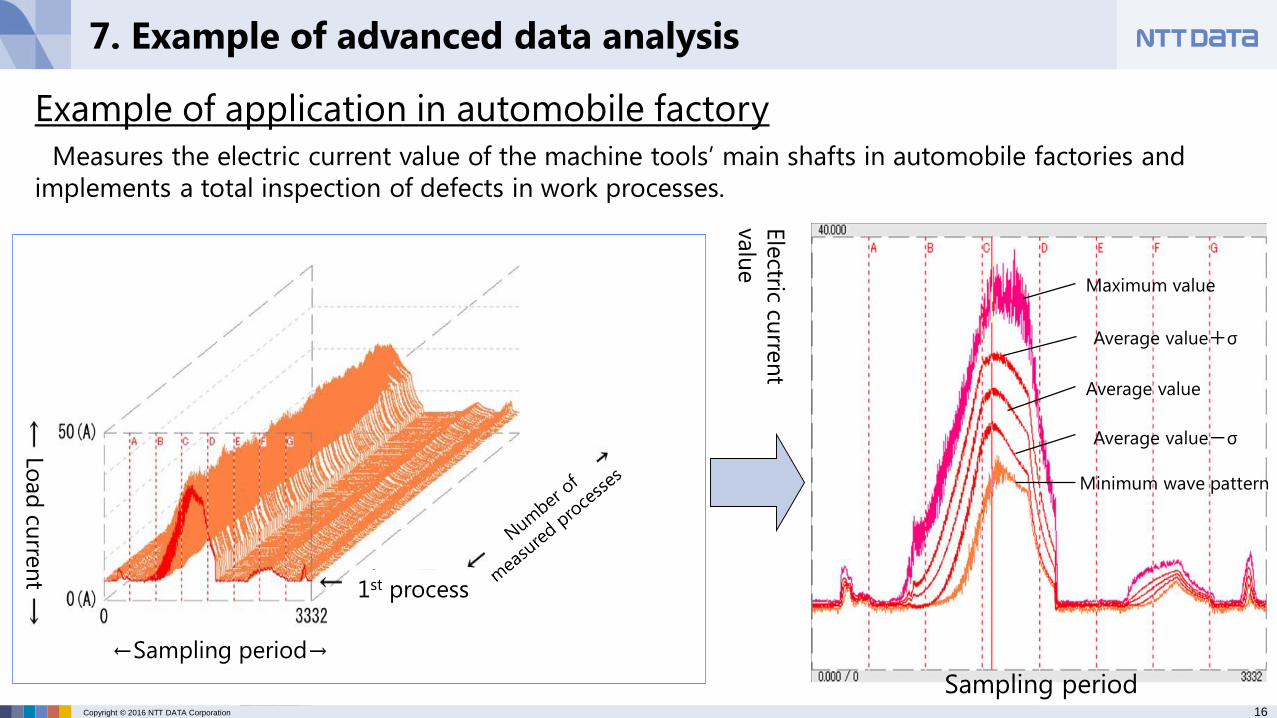
Maximum value
Ele
ctric curre
nt
valu
e
Sampling period
7. Example of advanced data analysis
Example of application in automobile factory
Measures the electric current value of the machine tools’ main shafts in automobile factories and
implements a total inspection of defects in work processes.
←Sampling period→
Load
curre
nt
1st process
Average value-σ
Minimum wave pattern
Average value
Average value+σ

17Copyright © 2013 NTT DATA WAVE CorporationCopyright © 2016 NTT DATA Corporation
Limit
curves
(2) Abnormalities were recorded
just before the drill bit broke
(3) 2 out of 4 bits
were broken
Example of application in automobile factory
(sign detection through the electric current value of 4-axis drilling machines)
・Detects behavior that exceeds limit (line(2)) before tools are damaged ((3))
・Can prevent down time caused by damage if parts are replaced after limit values are exceeded
7. Example of advanced data analysis
(1) Within the limit curves
during normal times

18Copyright © 2013 NTT DATA WAVE CorporationCopyright © 2016 NTT DATA Corporation
Real-life application of three whetstones on the same machine
1. Maximum, average, and minimum waveforms
2. Standard deviation σ + average, average, and average – σ waveforms
Whetstone A Whetstone B
(half-price of A)
Example of application in automobile factory
(performance comparison of whetstones in the polishing process)・Verify the performance of whetstones through electric current values during the polishing process
・Greatly reduce costs by switching products to lower-cost and high quality product C.
7. Example of advanced data analysis
Whetstone C
(half-price of A)
Current performance conditions No change from current
performanceBetter performance than
current performance

19Copyright © 2013 NTT DATA WAVE CorporationCopyright © 2016 NTT DATA Corporation
In the production equipment aftermarket field, the system coordinates with the cloud and fog to detect beforehand when parts need to be replaced, and allows for parts and workers to be arranged.
Parts supply
Distribution warehouseManagement center
8. Use case of system (example 1)
Analysis
system
Raw data
Threshold value
Fog
Parts replacement timing
replacement
operations
Analysis center
Production equipment

20Copyright © 2013 NTT DATA WAVE CorporationCopyright © 2016 NTT DATA Corporation
8. Use case of system (example 2)
Analysis
system
Integrated IoT DB
in factoryRaw
data
Standard value
Monitoring
data
Failure prediction
information
Quality
assessment
Quality
assessment
Quality
assessment
Failure
prediction
ERPQuality assessmentstandard calculation
PROFINET etc
Calculate quality assessment standards and uses that data for quality assessment.
In addition, the system also notifies MES of failure prediction information and enables the review, etc.
of production plans.
MES
Standard value Standard value

Copyright © 2016 NTT DATA CorporationThe names of companies, products, or services listed in this document are trademarks or registered trademarks of each relevant company.
Please direct inquiries to: ANYSENSESALES