Embed Size (px)
Citation preview
Particulate absorption of solar radiation:anthropogenic aerosols vs. dust
The MIT Faculty has made this article openly available. Please share how this access benefits you. Your story matters.
Citation Wang, C., G. R. Jeong, and N. Mahowald. "Particulate absorptionof solar radiation: anthropogenic aerosols vs. dust." AtmosphericChemistry and Physics Discussions, 9, 3935–3945, 2009.
As Published http://www.atmos-chem-phys.net/9/3935/2009/acp-9-3935-2009.pdf
Publisher Copernicus Publications on behalf of the European GeophysicalSociety
Version Final published version
Citable link http://hdl.handle.net/1721.1/66112
Terms of Use Creative Commons Attribution 3.0
Detailed Terms http://creativecommons.org/licenses/by/3.0
Atmos. Chem. Phys. Discuss., 9, 6571–6595, 2009www.atmos-chem-phys-discuss.net/9/6571/2009/© Author(s) 2009. This work is distributed underthe Creative Commons Attribution 3.0 License.
AtmosphericChemistry
and PhysicsDiscussions
This discussion paper is/has been under review for the journal Atmospheric Chemistryand Physics (ACP). Please refer to the corresponding final paper in ACP if available.
Particulate absorption of solar radiation:anthropogenic aerosols vs. dust
C. Wang1, G.-R. Jeong1, and N. Mahowald2
1Massachusetts Institute of Technology, Cambridge, MA 02139, USA2Cornell University, Ithaca, NY 14853, USA
Received: 9 February 2009 – Accepted: 18 February 2009 – Published: 10 March 2009
Correspondence to: C. Wang ([email protected])
Published by Copernicus Publications on behalf of the European Geosciences Union.
6571
Abstract
Particulate solar absorption is a critical factor in determining the value and even signof the direct radiative forcing of aerosols. The heating to the atmosphere and coolingto the Earth’s surface caused by this absorption are hypothesized to have significantclimate impacts. We find that anthropogenic aerosols play an important role around5
the globe in total particulate absorption of solar radiation. The global-average anthro-pogenic fraction in total aerosol absorbing optical depth exceeds 65% in all seasons.Combining the potentially highest dust absorption with the lowest anthropogenic ab-sorption within our model range, this fraction would still exceed 47% in most seasonsexcept for boreal spring (36%) when dust abundance reaches its peak. Nevertheless,10
dust aerosol is still a critical absorbing constituent over places including North Africa,the entire tropical Atlantic, and during boreal spring in most part of Eurasian continent.The equality in absorbing solar radiation of dust and anthropogenic aerosols appearsto be particularly important over Indian subcontinent and nearby regions as well asNorth Africa.15
1 Introduction
Light-absorbing aerosols heat the atmosphere while cooling the Earth’s surface. Theycontribute a positive component to the total direct radiative forcing (DRF) of all aerosolsat the top of the atmosphere (TOA). The forcing feature along with its dynamic andthermodynamic effects of absorbing aerosols is thus different than that of scattering20
aerosols such as sulfate. Benefited from increasing surface measurements and satel-lite retrievals in recent years, the estimation of total aerosol extinction of solar radiationthrough both scattering and absorption, measured by aerosol optical depth (AOD; Se-infeld and Pandis, 1998), has been greatly improved. However, without a good estima-tion of the absorbing fraction of this extinction, the quantity and even the sign in some25
cases of aerosol DRF, a critical factor in climate research (e.g., Andreae et al., 2005),
6572
will be still difficult to define.Mineral dust and carbonaceous particles (especially the dark ones, or back carbon,
BC) are two major particulate absorbing constituents. Tegen et al. (1997) estimatedthat dust contributes about 21–48% and black carbon contributes about 3–5% to theglobal total aerosol AOD. The absorbing strength (e.g., absorbing extinction per unit5
mass of aerosols) of dust is much lowered than that of BC. However, the high atmo-spheric abundance of dust in particular over specific regions could still cause a consid-erable absorption of sunlight. The warming to the atmosphere caused by particulateabsorption could affect local cloud formation and precipitation (e.g., Ackermann et al.,2000; Koren et al., 2004, 2008). Persistent existence of such a local warming could10
further influence atmospheric circulations in large scales, leading to a climate impactbeyond the region where the actual warming occurs. It has been suggested that thesolar absorption by BC could significantly alter the distribution of precipitation over thetropical Intertropical Convergence Zone (ITCZ), ranging from Pacific, Atlantic, to IndianOceans as well as Indian summer monsoon regions (e.g., Chung and Ramanathan,15
2003; Wang, 2004, 2007; Robert and Jones, 2004; Chung and Seinfeld, 2005; Lauand Kim, 2006; Ramanathan et al., 2007; Meehl et al., 2008). Previous studies havealso hypothesized that the heating to the atmosphere by dust could affect atmosphericcirculation and precipitation in particular over Sahel and tropical Atlantic Ocean (e.g.,Prospero and Lamb, 2003; Dunion et al., 2004; Lau et al., 2006; Yoshioka et al., 2007).20
Modeling studies have indicated that the climate sensitivity to radiative forcing of ab-sorbing aerosols is different than that of relatively well-mixed greenhouse gases (e.g.,Wang, 2004; Robert and Jones, 2004; Feichter et al., 2004; Chung and Seinfeld, 2005;Hansen et al., 2005; Lau et al., 2008). Despite the rapidly growing number of studies inrecent years on the climatic effects of absorbing aerosols, the interesting issue of the25
relative importance of dust and anthropogenic aerosols in the total particulate absorp-tion of solar radiation has rarely been addressed.
In this paper, we report a study based on the aerosol-climate models that analyzesthe solar absorptions of carbonaceous aerosols, with or without mixing with sulfate,
6573
and dust particles in different seasons. We then examine the relative importance ofeach of these two types of aerosols in the total particulate solar absorption over theglobe.
2 Methods
We use aerosol absorbing optical depth (AAOD thereafter) to represent the solar ab-5
sorption potential of aerosols. For a given atmospheric layer with a path of ∆z, it canbe derived as:
AAOD(λ) =
z+∆z/2∫z−∆z/2
Dmaxp∫0
Eabs(λ,Dp,m)nm(Dp, z)dDpdz (1)
Here λ is wavelength, Eabs is the mass absorption extinction coefficient, nm is aerosolmass distribution function, and Dp is aerosol size (Seinfeld and Pandis, 1998). It can10
be derived for a given layer or the entire atmospheric column. Note that traditionallythe term of “thickness” is used for the former case and “depth” for the latter case. Herewe use “depth” throughout the text for convenience. When Eabs is replaced with massextinction coefficient Eext, Eq. (1) derives AOD. To save the length of the paper, theAOD and AAOD values of the 550 nm waveband, a typical band to represent the vis-15
ible range in literature, are presented unless otherwise indicated. It can be seen thatAAOD is a quantity describing the total aerosol extinction through absorption, depend-ing solely on the properties of aerosols. Therefore, it can be used to convenientlycompare the absorbing capacities of different aerosols.
In this study, we have used climatological AOD and AAOD distributions derived from20
multi-year average using the models driven by prescribed sea surface temperature(SST) and emissions without interannual variation. The AOD and AAOD of anthro-pogenic aerosols used in this study is derived based on the results of an aerosol-climate model (Kim et al., 2008) developed from the Community Atmospheric Model
6574
version 3 (CAM3), a component of the Community Climate System Model (CCSM) ofNational Center of Atmospheric Research (NCAR) (Collins et al., 2006). The model in-cludes seven anthropogenic aerosol types (modes), separated by size, chemical com-position, and mixing state; namely 3 external sulfate (nucleation, Aitken, and accumu-lation), one each of external BC and organic carbon (OC), one internal mixture with BC5
as the core and sulfate as the shell (MBS), and one internal mixture of OC and sulfate(MOS). Each of these modes has a prognostic size distribution. The model calculatesaerosol microphysical, chemical, and radiative processes based on the size, chemicalcomposition, and also mixing state of these particles. The model results have beencompared with satellite, surface, and aircraft measurements. A good agreement be-10
tween modeled and observed data is seen in most of these comparisons except forevents influenced by episodic pollutants (Kim et al., 2008). The AOD and AAOD ofanthropogenic aerosols at each model grid are calculated by combining contributionsfrom all the aerosol modes. Among these modes, sulfate modes dominate the AODwhile external BC and MBS mixture dominate the AAOD. External OC and MOS mix-15
ture contribute a smaller fraction in AAOD. The calculation is done based on 3-yearmeans of modeled results. The new addition to the work of Kim et al. (2008) is theadoption of a monthly-varied biofuel emission of BC and OC. The BC biofuel inventoryis from the monthly BC biomass burning data of the Global Emission Inventory Activity(GEIA) (http://www.geiacenter.org). The OC biofuel emission was derived by scaling20
the biofuel BC emission by a factor of 6 (Bond et al., 2004). The annual BC and OCemissions are 6.1 Tg/yr and 36.9 Tg/yr for the biofuel emissions, and 8.6 Tg/yr and20.8 Tg/yr for the fossil fuel emission, respectively.
The AOD and AAOD of mineral aerosols (dust aerosols) are derived based on themodel climatology from the Model of Atmospheric Transport and Chemistry (MATCH)25
driven by the National Center for Environmental Prediction/National Center for Atmo-spheric Research (NCEP/NCAR) reanalysis data (Mahowald et al., 1997; Kistler et al.,2001) with the Dust Entrainment and Deposition Model (Zender et al., 2003), as de-scribed in more detail in Luo et al. (2003). The model explicitly predicts dust properties
6575
in four size bins. The model results have been extensively compared to the observa-tions from daily to annual time scale (Luo et al., 2003; Mahowald et al., 2003; Hand etal., 2004; Luo et al., 2004; Mahowald et al., 2008). These comparisons suggest thatthe model does a good job in capturing the annual mean and seasonal cycle of dustacross a wide range of locations, but that the fine fraction is overestimated (e.g., Hand5
et al., 2004). We revised the size distribution following new data here, because of theimportance of the dust aerosol size on optical properties to make the data more con-sistent with available observations (e.g., Reid et al., 2003; Grini et al., 2004; Hand etal., 2004; Mahowald et al., 2004, 2006a). We use here the same size distributions asin Mahowald et al. (2006a) for the 4 size bins, which were a result of a correction based10
on the new data done without rerunning the simulation, assuming the transport of dustto be linear. The indices of refraction have been derived from Patterson (1981) forthe visible wavelengths, Sokolik et al. (1993) for the near infrared, and Volz (1973) forthe infrared. The imaginary part of indices of refraction in the visible wavelength werescaled to match the new estimates of Sinyuk et al. (2003) and Dubovik et al. (2002) for15
the region from 0.33 to 0.67 µm. These estimates are based on satellite and surface-based field observations and may still be susceptible to biases due to measurementerrors and contaminations.
In calculating the total AOD data, we have also used climatological output (10-year mean) of CAM3 sea salt model for the current climate (Mahowald et al., 2006b).20
The model includes 4 size bins (0.2–1.0, 1.0–3.0, 3.0–10.0, 10.0–20.0 mm diameter).A source parameterization developed by Gong et al. (1997) with a correction for hu-midity biases following Andreas (1998) was adopted. The mass going into each sizebin is wind speed and relative humidity independent, and is 2%, 21%, 49% and 28%of the total source, for size bins 1–4, respectively. The loss mechanisms for sea-salt25
aerosols include gravitational settling, turbulent dry deposition and wet deposition andare parameterized within the model, including the effects of hygroscopic growth ongravitational settling rates (Seinfeld and Pandis, 1998; Rasch et al., 2001). Opticaldepths are calculated using a humidity dependence in the optical parameters (Hess et
6576
al., 1998; Collins et al., 2002). The output was originally gridded at T42 resolution (2.8by 2.8 degree horizontally) and remapped into CAM3 grids before AOD was calculated.Due to limited contribution of sea salt to the total AAOD, we did not include it in suchcalculations.
The calculated total AOD and AAOD combining both anthropogenic and dust5
aerosols have been compared with measurements made in 74 stations of the AerosolRobotic Network (AERONET; http://aeronet.gsfc.nasa.gov/; Holben et al., 1998)across the globe, overlapped with AOD derived from the Moderate Resolution ImagingSpectroradiometer (MODIS; http://modis.gsfc.nasa.gov/; Remer et al., 2005) satellitedata in a 5-year period over 2000–2004. The criterion of selecting these stations from10
total AERONET inventory is that each of them has at least 9 months of continuedmeasurements during 1999–2003. In addition, we have used the AOD and AAODdata of carabonceous, sulfate, mineral dust, and sea salt from the Goddard Chem-istry Aerosol Radiation and Transport (GOCART; Chin et al., 2000), based on 5-yearmeans over the period of 2000–2004. GOCART model is an atmospheric transport15
model of multi-component of aerosols based on a single moment (mass only) scheme.Its results have been extensively compared with surface and satellite data (e.g., Chinet al., 2002). Clear correlation and reasonably good agreement between our resultsand AERONET, MODIS data as well as GOCART results are found (Fig. 1).
3 Results20
When combining contributions from dust and anthropogenic aerosols, the highestAAOD values in all seasons appear over North Africa, spatially extending into tropicalAtlantic Oceans. Other high centers throughout all seasons are over Arabian Sea toIndian subcontinent and the east coast of China. Seasonal high centers of AAOD withvalue equal to or higher than 10−2 include Amazonia (in June to August or JJA), South25
Africa (JJA and September to November or SON), Australia (SON), and North Amer-ica (JJA) (Fig. 2). In addition, there are also several belts with relatively high AAOD
6577
spreading from land to open waters particularly in the tropics and subtropical regions.Note that even in these high AAOD centers throughout all year long, the actual AAODvalues there still vary significantly with seasons.
Some of the above-indicated high centers of AAOD are known to be associated withdust sources. However, these regions are often under the influence of anthropogenic5
aerosols as well. In order to examine the relative importance of dust and anthropogenicaerosols in solar absorption, we have derived the distributions of fractional contributionof anthropogenic AAOD in the total AAOD during various seasons (Fig. 3, the upperpanels). The area-weighted global and seasonal mean value of this fraction is 0.72(DJF), 0.65 (MAM), 0.80 (JJA), and 0.75 (SON), respectively, with an annual mean of10
0.73. This suggests that the anthropogenic aerosols dominate the AAOD in most ofthe regions. In comparison, dust contribution to AOD is much more significant. Whencombining dust and anthropogenic AOD, the anthropogenic fraction is much smallerover the dust-influenced areas, and the coverage of these low anthropogenic fractionregions is also larger comparing to the case of AAOD (Fig. 3, the lower panels). How-15
ever, outside the dust-influenced regions, anthropogenic fraction in AOD has nearlythe same dominance as in AAOD. In addition, over the remote oceans, anthropogenicfraction is also high due to sulfate aerosols largely from DMS oxidation. When weigh-ing in the sea salt aerosols, the global mean anthropogenic, dust, and sea salt fractionin total AOD calculated based on area-means of our models is 0.4, 0.12, and 0.48,20
respectively, while 0.59, 0.18, and 0.23 of GOCART model (we calculated the valuesusing area-mean method based on the original data), respectively. The correspondingvalues listed in Tegen et al. (1997) are 0.57, 0.35, and 0.08. All three results showthe similar substantial contribution from anthropogenic aerosols to the total AOD whilediffering most significantly in non-absorbing sea salt contribution. Nevertheless, we25
hence demonstrate that the anthropogenic aerosols make the largest global contribu-tion to both total AOD and AAOD.
We do realize that, however, uncertainties exist in modeled aerosol abundance aswell as optical properties. To provide a potential range of modeling results for above
6578
estimations of anthropogenic fraction in AAOD, besides the baseline results we havealso calculated a low estimation by combining the lowest anthropogenic AAOD withthe highest dust AAOD, and a high estimation by combining the highest anthropogenicAAOD with the lowest dust AAOD, all based on possible configurations in our models.It has been indicated in Kim et al. (2008) that lowering carbonaceous emissions is5
the most effective way to reduce the anthropogenic AAOD. In addition, for the sameemissions it could lead to a slightly higher AAOD by adopting a single moment (massonly) aerosol model using prescribed geometric size and assuming all aerosol con-stituents are external mixtures. Thus, we derive our low anthropogenic AAOD distribu-tion by using the model run driven by a lower anthropogenic carbonaceous emission10
(Bond et al., 2004; 8 Tg for BC and 33.8 Tg for OC in annual emissions, or a 44% anda 38% reduction from our baseline run, respectively; see Kim et al., 2008). The highanthropogenic AAOD distribution is derived using the current baseline run result butcalculating AAOD using a single-moment and external mixing procedure (Kim et al.,2008). For dust aerosols, we have used various scenarios corresponding to different15
size distributions and mineralogical compositions in particular the amount of hematitebased on Jeong and Sokolik (2007) to derived the upper and lower bounds of opticalproperties regarding solar absorption for each dust bin. These two sets approximatea bulk single scattering albedo value (combing all 4 bins) of 0.68 and 0.94 (comparedto 0.89 in the baseline calculation), representing, respectively the maximum and mini-20
mum estimation of dust solar absorption. These two sets of parameters are then usedto derive the high and low dust AAOD distributions. The high and low estimations ofglobal-mean anthropogenic fraction in the total AAOD along with the baseline resultsare listed in Table 1. The low estimations are generally equal to or higher than 0.47except for boreal spring (0.36), implying that anthropogenic aerosols account nearly25
half of the combined AAOD in most of the time.Despite this dominance of anthropogenic aerosols in global-mean particulate solar
absorption, dust still plays a critical role in several regions including North Africa, At-lantic Ocean between tropics and 30◦ N, Arabian Sea, South America below 40◦ S,
6579
Australia, and Arctic region. In particular in our low estimation the dust contribution tototal AAOD is higher than 80% over these regions (Fig. 4). The annual mean distri-bution show that anthropogenic fraction outside of the major dust-influenced regionsare about the same in all three cases, significantly higher than 0.8 (Fig. 4). During theboreal spring, the contribution of dust in solar absorption over most of the Eurasia in5
our baseline estimation is comparable to (actually higher in the low estimation) that ofanthropogenic aerosols. Nevertheless it becomes less important in the rest seasons.Note that the absolute value of total AAOD over Eurasia does not change significantlyfrom boreal spring to fall (Fig. 2). It is the increase of anthropogenic AAOD occurringin the boreal summer and fall that fills in the deficit left by decreasing dust AAOD. In-10
terestingly, anthropogenic fraction of total AAOD over the Polar Regions change frombelow 0.4 in low estimation, to about 0.5 in the base estimation, and then to above 0.6in our high estimation (Fig. 4), reflecting a relatively high abundance of dust than blackcarbon in these places.
We also find that dust contributes more substantially to the total AAOD in the low-15
ermost troposphere than in the rest of the atmosphere (Fig. 5). In opposite, anthro-pogenic aerosols dominate AAOD in the upper troposphere. In the middle free tropo-sphere, the contribution of dust to total AAOD in our baseline results merely exceeds50% over any place even the dust source regions. Interestingly, our baseline estima-tion shows that anthropogenic aerosols dominate the aerosol solar absorption over20
east coast of China throughout all seasons, even including the boreal spring when dustabundance peaks there.
Wang (2007) suggests that the BC absorption in east most Pacific and western Pa-cific tropics might exert a forcing to the lower atmosphere, affect the strength of Walkercirculation, and thus cause a redistribution of convective precipitation over the entire25
Pacific, a mechanism much similar to that of ENSO events. Our results demonstratethat over the above-mentioned two regions, anthropogenic aerosol contributes con-stantly over 90% in total particulate solar absorption (Figs. 3 and 4), supporting thebase of the hypothetic role of BC in causing redistribution of precipitation in Pacific
6580
ITCZ.The roles of absorbing anthropogenic aerosols on Indian summer monsoon circula-
tion have been recently hypothesized (e.g., Ramanathan et al., 2005; Lau et al., 2006;Kim et al., 2006; Wang, 2007; Meehl et al., 2007; Lau et al., 2008). It has been alsosuggested that Sahel dust could influence circulation and precipitation in tropical At-5
lantic ITCZ and West Africa monsoon region (e.g., Prospero and Lamb, 2003; Dunionet al., 2004; Yoshioka et al., 2007). We find that the fractional contribution of anthro-pogenic aerosols to the total AAOD varies in seasons over Indian subcontinent andsurrounding regions. Dust (mainly from Mideast deserts) and anthropogenic aerosoleach plays a different role in different seasons over this region. From boreal fall to10
winter, anthropogenic aerosols dominate the particulate absorption over both ArabianSea and the subcontinent (Fig. 3). Dust mainly occupies lowermost troposphere awayfrom the subcontinent while absorbing anthropogenic aerosol stays over the land andwell extends vertically into the free troposphere (Fig. 6). However, during the pre-monsoon and monsoon season (MAM and JJA), high dust AAOD zone penetrates into15
the land area and makes a contribution quantitatively comparable to that of anthro-pogenic aerosols in the total AAOD (Fig. 6). Note that in the boreal spring, distributionsof dust and anthropogenic AAOD appear to overlap each other over the Indian subcon-tinent. Their combined absorption concentrates from surface to about 600 hPa. Due toprecipitation scavenging, the abundance of absorbing anthropogenic aerosols during20
the summer monsoon season is reduced in the above-mentioned atmospheric layerover the land. The high centers of anthropogenic AAOD is elevated along the slopeof the Tibetan Plateau. Dust AAOD in this season still distributes close to the surface,however, with evidently lower value. Our result along with other similar ones (e.g., Kimet al., 2006; Lau et al., 2008) all suggest that the solar absorption by dust aerosols25
can not be neglected when studying the influence of particulate absorption on Indiansummer monsoon circulation.
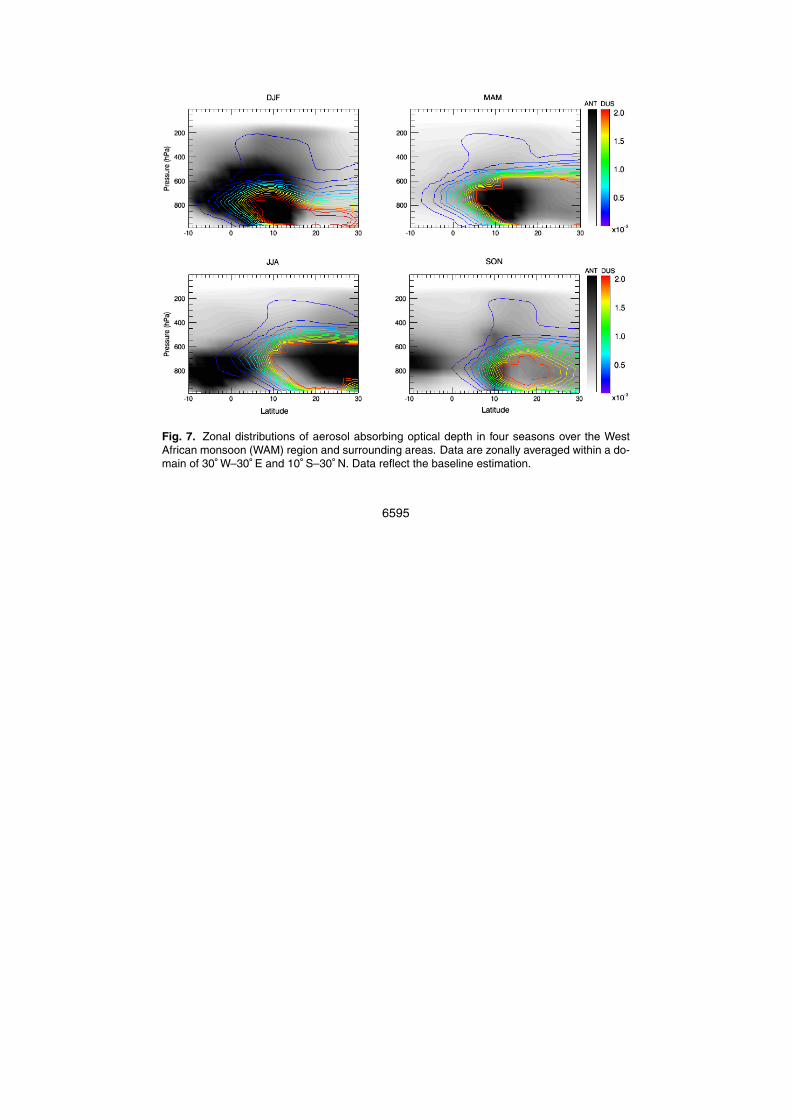
Over the North Africa and West Africa monsoon regions, clear seasonality in com-ponent AAOD distributions has been found (Fig. 7). Specifically through the months
6581
of JJA, anthropogenic AAOD distribution has two high centers due to biomass burningfrom different sources. Interestingly, the high center of anthropogenic AAOD alwaysoverlap with that of dust AAOD except for the months of SON, indicating that anthro-pogenic aerosol can be a critical component in causing particulate absorption eveninside the dust plumes. This also suggests a mixing between anthropogenic and dust5
aerosols to be possible within these plumes.
4 Conclusions
We find that anthropogenic aerosols play an important role around the globe in totalparticulate absorption of solar radiation. The global average anthropogenic fraction intotal aerosol absorbing optical depth exceeds 65% throughout all seasons in our base-10
line and high estimation and accounts more than 47% except during the boreal springin our low estimation. The contribution of anthropogenic aerosol in particulate solarabsorption can been found even inside heavy dust plumes out of Africa. However, dustaerosols are still a critical absorbing constituent in several places including North Africa,the entire tropical Atlantic, and during boreal spring in most part of Eurasian continent.15
The equality in solar absorption of dust and anthropogenic aerosols appears to be par-ticularly critical over Indian Subcontinent and nearby regions as well as North Africa,where the summer monsoon circulation and precipitation are hypothesized to be in-fluenced by atmospheric warming and surface cooling caused by absorbing aerosols.Absorbing aerosols exert a positive direct forcing at the top of atmosphere, in opposite20
to the general cooling effect of scattering aerosols over the warming caused by green-house gases. A good estimation of the quantity and even the sign of aerosol directradiative forcing can be only established with a better understanding of the strength ofparticulate solar absorption, arguably the most uncertain property of aerosols.
Future studies will further address the issues related to the complicated mixing be-25
tween dust and anthropogenic aerosol constituents and the climatic effects caused bythe absorption of dust and anthropogenic aerosols as well as their mixtures. Mea-
6582
surements of aerosol solar absorption ranging from in-situ to satellite with reasonablevertical resolution would greatly advance the efforts.
Acknowledgement. We thank D. Kim for assisting in model setup and processing of outputdata, J. V. Martins and L. Remer for providing MODIS AOD data, and M. Chin for providingGOCART modeling data. We also appreciate the AERONET principal investigators and teams,5
the GEIA-ACCENT principal investigators and teams for making their data available to thisstudy. The NSF (ATM-0329759), the NASA (NNX07AI49G), and the MIT Joint Program on theScience and Policy of Global Change supported this research.
References
Ackerman, A. S., Toon, O. B., Stevens, D. E., Heymsfield, A. J., Ramanathan, V., and Wel-10
ton, E. J.: Reduction of tropical cloudiness by soot, Science, 208, 1042–1047, 2000.Andreas, E.: A new sea spray generation function for wind speeds up to 32 m/s, J. Phys.
Oceanogr., 28, 2175–2184, 1998.Andreae, M. O., Jones, C. D., and Cox, P. M.: Strong present-day aerosol cooling implies a hot
future, Nature, 435, 1187–1190, doi:10.1038/nature03671, 2005.15
Bond, T. C., Streets, D. G., Yarber, K. F., Nelson, S. M., Woo, J.-H., and Klimont, Z.:A technology-based global inventory of black and organic carbon emissions from combus-tion, J. Geophys. Res., 109, D14203, doi:10.1029/2003JD003697, 2004.
Chin, M., Rood, R. B., Lin, S.-J., Muller, J. F., and Thomspon, A. M.: Atmosphericsulfur cyclein the global model GOCART: Model description and global properties, J. Geophys. Res.,20
105, 24671–24687, 2000.Chin, M., Ginoux, P., Kinne, S., Torres, O., Holben, B. N., Duncan, B. N., Martin, R. V., Logan,
J. A., Higurashi, A., and Nakajima, T.: Tropospheric aerosol optical thickness from the GO-CART model and comparisons with satellite and Sun photometer measurements, J. Atmos.Sci., 59, 461–483, 2002.25
Chung, S. H. and Seinfeld, J. H.: Climate response of direct radiative forcing of anthropogenicblack carbon, J. Geophys. Res., 110, D11102, doi:10.1029/2004JD005441, 2005.
Collins, W., Rasch, P., Eaton, B., Fillmore, D., Kiehl, J., Beck, C., and Zender, C.: Simulation ofaerosol distributions and radiative forcing for INDOEX: Regional climate impacts, J. Geophys.Res., 107, 8028, doi:10.1029/2000JD000032, 2002.30
6583
Collins, W. D., Blackmon, M., Bonan, G. B., et al.: The Community Climate System ModelVersion 3 (CCSM3), J. Climate, 19, 2122–2143, 2006.
Dubovik, O., Holben, B. N., Eck, T. F., Smirnov, A., Kaufman, Y. J., King, M. D., Tanre, D., andSlutsker, I.: Variability of absorption and optical properties of key aerosol types observed inworldwide locations, J. Atmos. Sci., 59, 590–608, 2002.5
Dunion, J. P. and Velden, C. S.: The impact of the Saharan air layer on Atlantic tropical cycloneactivity, Bull. Am. Meteorol. Soc., 85, 353–365, 2004.
Feichter, J., Roeckner, E., Lohmann, U., and Liepert, B.: Nonlinear aspects of the climateresponse to greenhouse gas and aerosol forcing, J. Climate, 17, 2384–2398, 2004.
Gong, S. L., Barrie, L. A., and Blanchet, J.-P.: Modeling sea-salt aerosols in the atmosphere:10
1. Model development, J. Geophys. Res., 102, 3805–3818, 1997.Grini, A. and Zender, C.: Roles of saltation, sandblasting, and wind speed variability on mineral
dust aerosol size distribution during the Puerto Rican Dust Experiment (PRIDE), J. Geophys.Res., 109, D07202, doi:10.1029/2003JD004233, 2004.
Hand, J., Mahowald, N., Chen, Y., Siefert, R. L., Luo, C., Subramaniam, A., and Fung, I.: Esti-15
mates of soluble iron from observations and a global mineral aerosol model: Biogeochemicalimplications, J. Geophys. Res., 109, D17205, doi:10.1029/2004JD004574, 2004.
Hansen, J., Sato, M., Ruedy, R., et al.: Efficacy of climate forcings, J. Geophys. Res., 110,D18104, doi:10.1029/2005JD005776, 2005.
Hess, M., Kopke, P., and Schult, I.: Optical properties of aerosols and clouds: The software20
package OPAC, Bull. Am. Meteorol. Soc., 79, 831–844, 1998.Holben B. N., Eck, T. F., Slutsker, I., Tanre, D., Buis, J. P., Setzer, A., Vermote, E., Reagan, J. A.,
Kaufman, Y., Nakajima, T., Lavenu, F., Jankowiak, I., and Smirnov, A.: AERONET – A feder-ated instrument network and data archive for aerosol characterization, Remote Sens. Envi-ron., 66, 1–16, 1998.25
Jeong, G.-R. and Sokolik, I. N.: Effect of mineral dust aerosols on the photolysisrates in the clean and polluted marine environments, J. Geophys. Res., 112, D21308,doi:10.1029/2007JD008442, 2007.
Kim, D., Wang, C., Ekman, A. M. L., Barth, M. C., and Rasch, P.: Distribution and direct radiativeforcing of carbonaceous and sulfate aerosols in an interactive size-resolving aerosol-climate30
model, J. Geophys. Res., 113, D16309, doi:10.1029/2007JD009756, 2008.Kim, M.-K., Lau, W. K. M., Chin, M., Kim, K.-M., Sud, Y. C., and Walker, G. K.: Atmospheric
teleconnection over Eurasia induced by aerosol radiative forcing during boreal spring, J.
6584
Climate, 19, 4700–4718, 2006.Kistler, R., Kalnay, E., Collins, W., et al.: The NCEP-NCAR 50-Year Reanalysis: Monthly Means
CD-ROM and Documentation, Bull. Am. Meteorol. Soc., 82, 247–267, 2001.Koren I., Martins, J. V., Remer, L. A., and Afargan, H.: Smoke invigoration versus inhibition of
clouds over the Amazon, Science, 321, 946–949, 2008.5
Koren, I., Kaufman, Y. J., Remer, L. A., and Martins, J. V.: Measurement of the effect of Amazonsmoke on inhibition of cloud formation, Science, 303, 1342–1345, 2004.
Lau, K.-M., Ramanathan, V., Wu, G.-X., et al.: The joint aerosol-monsoon experiment, a newchallenge for monsoon climate research, Bull. Am. Meteorol. Soc., 89, 369–383, 2008.
Lau, K.-M. and Kim, K.-M.: Observational relationships between aerosol and Asian mon-10
soon rainfall, and circulation, Geophys. Res. Lett., 33, L21810, doi:10.1029/2006GL027546,2006.
Luo, C., Mahowald, N. M., and del Corral, J.: Sensitivity study of meteorological parameterson mineral aerosol mobilization, transport, and distribution, J. Geophys. Res., 108, 4447,doi:10.1029/2003JD003483, 2003.15
Luo, C., Mahowald, N., and Jones, C.: Temporal variability of dust mobilization and concentra-tion in source regions, J. Geophys. Res., 109, D20202, doi:10.1029/2004JD004861, 2004.
Luo, C., Mahowald, N., and del Corral, J.: Sensitivity study of meteorological parameterson mineral aerosol mobilization, transport and distribution, J. Geophys. Res., 108, 4447,doi:10.1029/2003JD0003483, 2003.20
Mahowald, N., Engelstaedter, S., Luo, C., et al., Atmospheric iron deposition: Globaldistribution, variability and human perturbations, Ann. Rev. Mar. Sci., 1, 245–278,doi:10.1146/annurev/marine.010908.163727, 2009.
Mahowald, N., Luo, C., del Corral, J., and Zender, C. S.: Interannual variability in atmosphericmineral aerosols from a 22-year model simulation and observational data, J. Geophys. Res.,25
108, 4352, doi:10.1029/2002JD002821, 2003.Mahowald, N., Muhs, D., Levis, S., Yoshioka, M., Zender, C. S., and Rasch, P. J.:
Change in atmospheric mineral aerosols in response to climate: last glacial period, pre-industrial, modern and doubled-carbon dioxide climates, J. Geophys. Res., 111, D10202,doi:10.1029/2005JD006653, 2006a.30
Mahowald, N., Lamarque, J.-F., Tie, X. X., and Wolff, E.: Sea-salt aerosol response to climatechange: Last Glacial Maximum, preindustrial, and doubled carbon dioxide climates, J. Geo-phys. Res., 111, D05303, doi:10.1029/2005JD006459, 2006b.
6585
Mahowald, N., Rasch, P., Eaton, B., Whittlestone, S., and Prinn, R.: Transport of 222radon tothe remote troposphere using the Model of Atmospheric Transport and Chemistry and as-similated winds from ECMWF and the National Center for Environmental Prediction/NCAR,J. Geophys. Res., 102, 28139–28151, 1997.
Meehl, G. A., Arblaster, J. M., and Collins, W. D.: Effects of black carbon aerosols on the Indian5
monsoon, J. Climate, 21, 2869–2882, 2008.Patterson, E. M.: Optical properties of the crustal aerosol: Relation to chemical and physical
characteristics, J. Geophys. Res., 86, 3236–3246, 1981.Prospero, J. M. and Lamb, P. J.: African droughts and dust transport to the Caribbean: Climate
change implications, Science, 302, 1024–1027, 2003.10
Ramanathan, V., Chung, C., Kim, D., Bettge, T., Buja, L., Kiehl, J. T., Washington, W. M., Fu,Q., Sikka, D. R., and Wild, M.: Atmospheric brown clouds: Impact on South Asian climateand hydrologic cycle, Proc. Natl. Acad. Sci. USA, 102, 5326–5333, 2005.
Ramanathan, V., Ramana, M. V., Roberts, G., Kim, D., Corrigan, C., Chung, C., and Winker, D.:Warming trends in Asia amplified by brown cloud solar absorption, Nature, 448, 575–579,15
2007.Rasch, P. J., Collins, W., and Eaton, B. E.: Understanding the Indian Ocean Experiment (IN-
DOEX) aerosol distributions with an aerosol assimilation, J. Geophys. Res., 106, 7337–7355,2001.
Reid, E., Reid, J., Meier, M. M., Dunlap, M. R., Cliff, S. S., Broumas, A., Perry, K., and Mar-20
ing, H.: Characterization of African dust transported to Puerto Rico by individual particle andsize segregated bulk analysis, J. Geophys. Res., 108, 8591, doi:10.1029/200dJD002935,2003.
Remer, L. A., Kaufman, Y. J., Mattoo, S., Martins, J. V., Ichoku, C., Levy, R. C., Kleidman, R.G., Tanr, D., Chu, D. A., Li, R.-R., Eck, T. F., Vermote, E., and Holben, B. N.: The MODIS25
Aerosol Algorithm, Products and Validation, J. Atmos. Sci., 62, 947–973, 2005.Roberts, D. L. and Jones, A.: Climate sensitivity to black carbon aerosol from fossil fuel com-
bustion, J. Geophys. Res., 109, D16202, doi:10.1029/2004JD004676, 2004.Seinfeld, J. H., and Pandis, S. N.: Atmospheric Chemistry and Physics, From Air Pollution to
Climate Change, J. Wiley & Sons, New York, 1998.30
Sinyuk, A., Torres, O., and Dubovik, O.: Combined use of satellite and surface observations toinfer the imaginary part of refractive index of Saharan dust, Geophys. Res. Lett., 30, 1081,doi:10.1029/2002GL016189, 2003.
6586
Sokolik, I. N., Andronova, A., and Johnson, T. C.: Complex refractive index of atmospheric dustaerosols, Atmos. Environ., 27A, 2495–2502, 1993.
Tegen, I., Hollrig, P., Chin, M., Fung, I., Jacob, D., and Penner, J.: Contribution of differentaerosol species to the global aerosol extinction optical thickness: Estimates from modelresults, J. Geophys. Res., 102, 23895–23915, 1997.5
Volz, F. E.: Infrared optical constants of ammonium sulfate, Sahara dust, volcanic pumice, andflyash, Appl. Opt., 12, 564–568, 1973.
Wang, C.: Impact of direct radiative forcing of black carbon aerosols on tropical convectiveprecipitation, Geophys. Res. Lett., 34, L05709, doi:10.1029/2006GL028416, 2007.
Wang, C.: A modeling study on the climate impacts of black carbon aerosols, J. Geophys. Res.,10
109, D03106, doi:10.1029/2003JD004084, 2004.Yoshioka, M., Mahowald, N., Conley, A. J., Collins, W. D., Fillmore, D. W., Zender, C. S., and
Coleman, D. B.: Impact of desert dust radiative forcing on Sahel precipitation: Relative im-portance of dust compared to sea surface temperature variations, vegetation changes, andgreenhouse gas warming, J. Climate, 20, 1445–1467, 2007.15
Zender, C., Bian, H., and Newman, D.: Mineral Dust Entrainment and Deposition(DEAD) model: Description and 1990s dust climatology, J. Geophys. Res., 108, 4416,doi:10.1029/2002JD002775, 2003.
6587
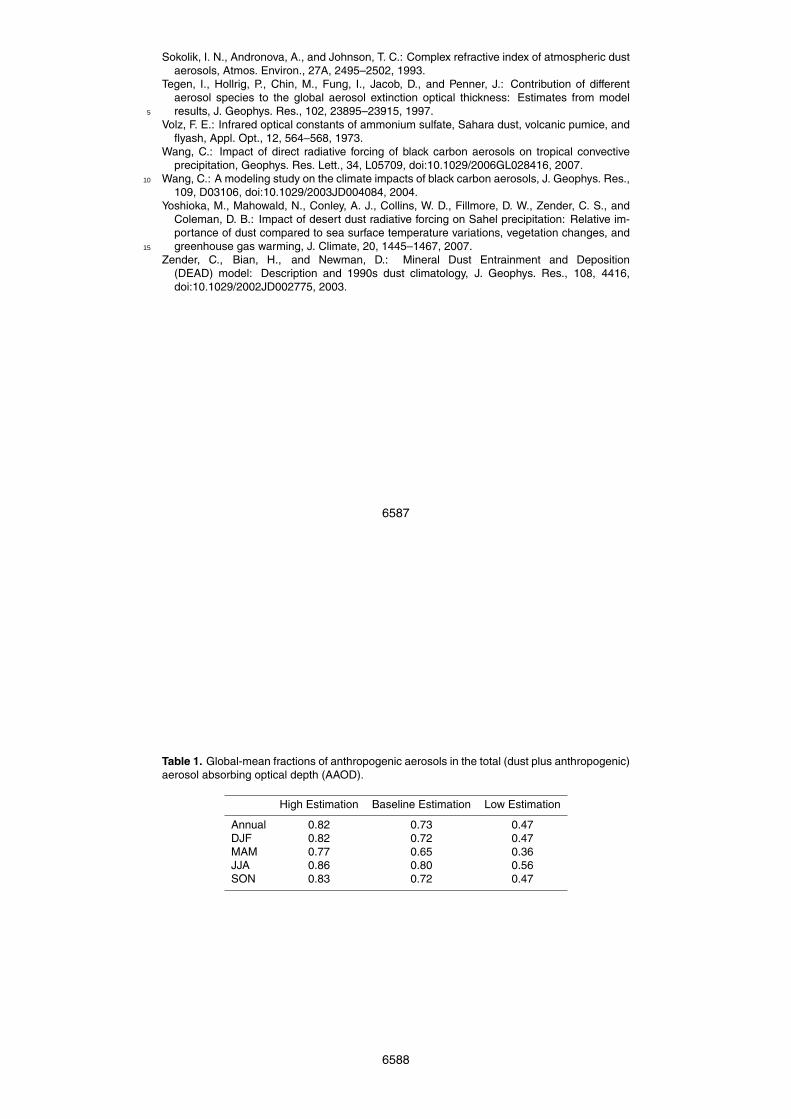
Table 1. Global-mean fractions of anthropogenic aerosols in the total (dust plus anthropogenic)aerosol absorbing optical depth (AAOD).
High Estimation Baseline Estimation Low Estimation
Annual 0.82 0.73 0.47DJF 0.82 0.72 0.47MAM 0.77 0.65 0.36JJA 0.86 0.80 0.56SON 0.83 0.72 0.47
6588
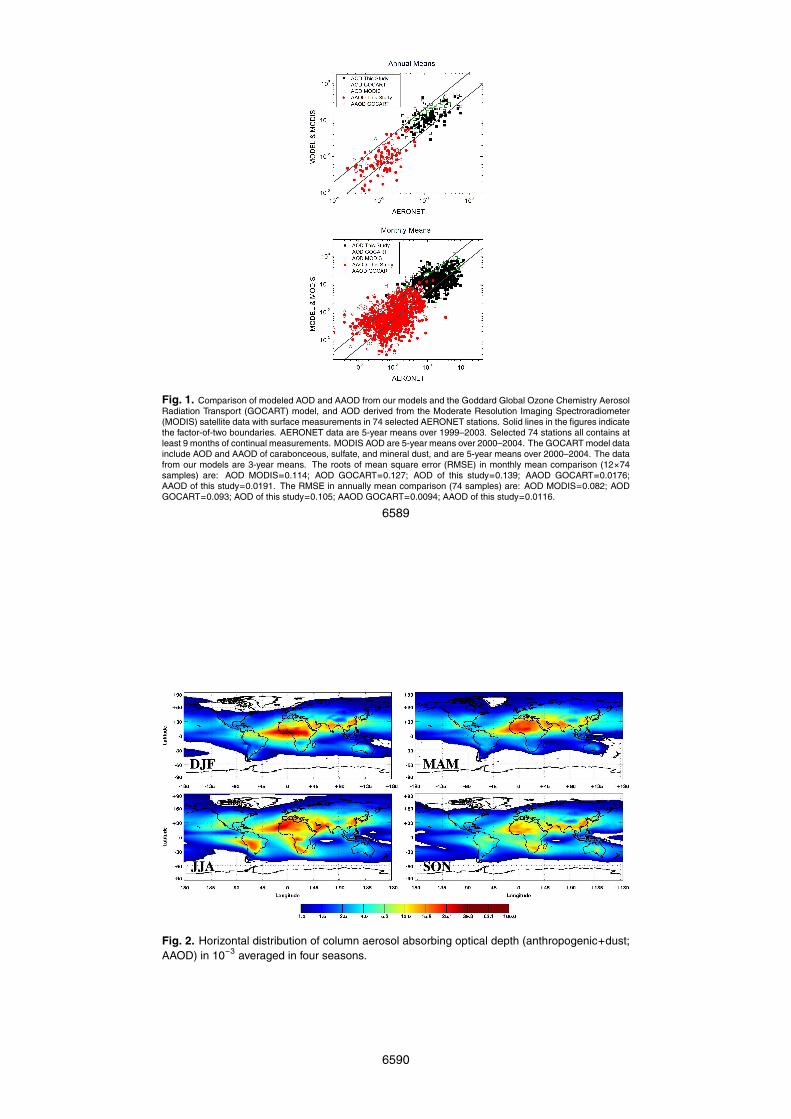
Fig. 1. Comparison of modeled AOD and AAOD from our models and the Goddard Global Ozone Chemistry AerosolRadiation Transport (GOCART) model, and AOD derived from the Moderate Resolution Imaging Spectroradiometer(MODIS) satellite data with surface measurements in 74 selected AERONET stations. Solid lines in the figures indicatethe factor-of-two boundaries. AERONET data are 5-year means over 1999–2003. Selected 74 stations all contains atleast 9 months of continual measurements. MODIS AOD are 5-year means over 2000–2004. The GOCART model datainclude AOD and AAOD of carabonceous, sulfate, and mineral dust, and are 5-year means over 2000–2004. The datafrom our models are 3-year means. The roots of mean square error (RMSE) in monthly mean comparison (12×74samples) are: AOD MODIS=0.114; AOD GOCART=0.127; AOD of this study=0.139; AAOD GOCART=0.0176;AAOD of this study=0.0191. The RMSE in annually mean comparison (74 samples) are: AOD MODIS=0.082; AODGOCART=0.093; AOD of this study=0.105; AAOD GOCART=0.0094; AAOD of this study=0.0116.
6589
Fig. 2. Horizontal distribution of column aerosol absorbing optical depth (anthropogenic+dust;AAOD) in 10−3 averaged in four seasons.
6590
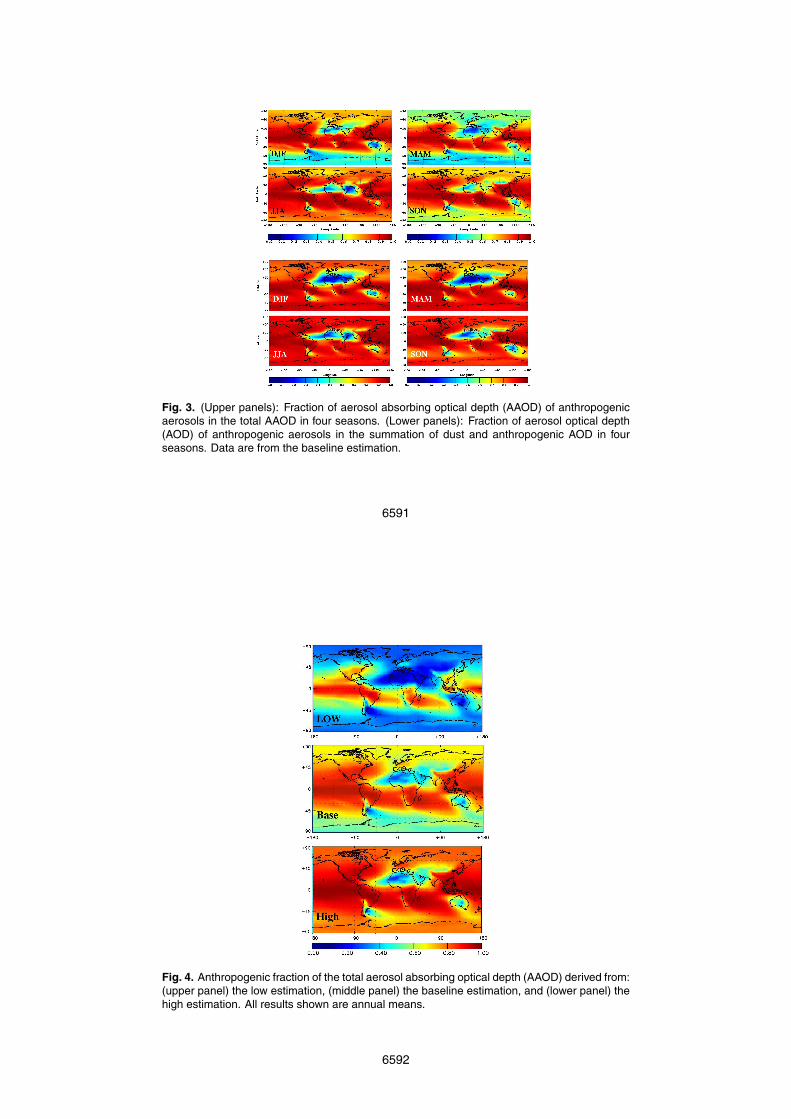
Fig. 3. (Upper panels): Fraction of aerosol absorbing optical depth (AAOD) of anthropogenicaerosols in the total AAOD in four seasons. (Lower panels): Fraction of aerosol optical depth(AOD) of anthropogenic aerosols in the summation of dust and anthropogenic AOD in fourseasons. Data are from the baseline estimation.
6591
Fig. 4. Anthropogenic fraction of the total aerosol absorbing optical depth (AAOD) derived from:(upper panel) the low estimation, (middle panel) the baseline estimation, and (lower panel) thehigh estimation. All results shown are annual means.
6592
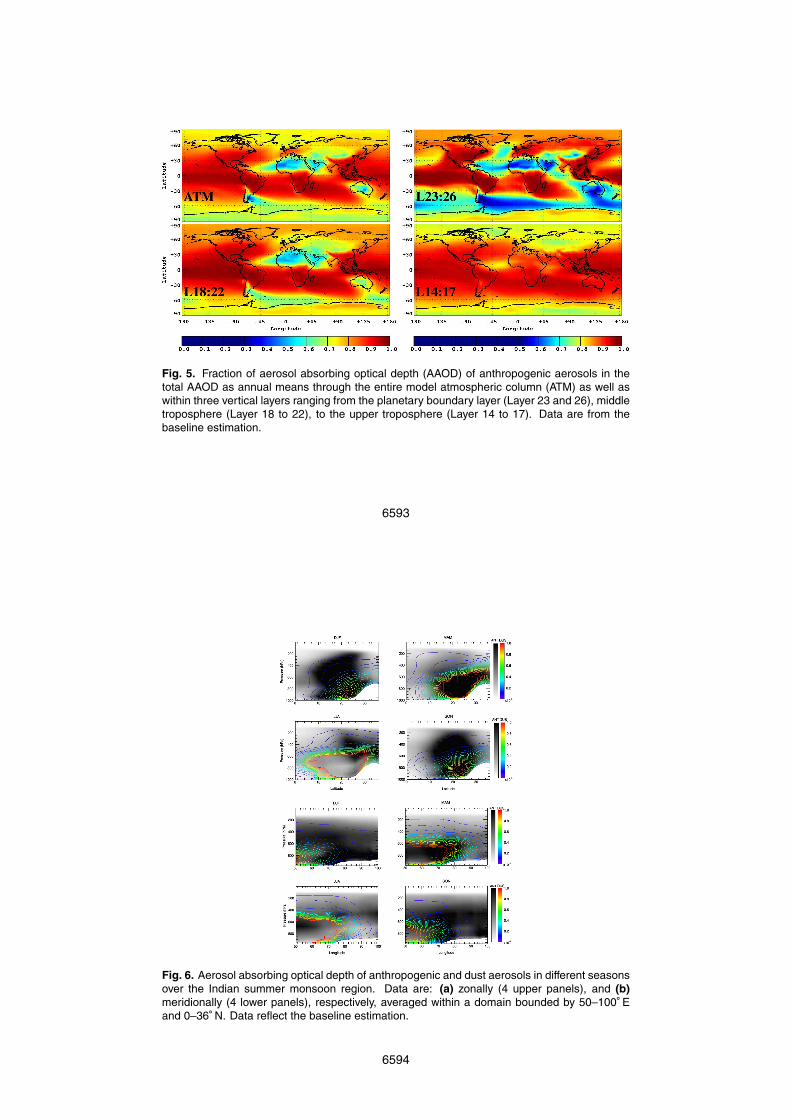
Fig. 5. Fraction of aerosol absorbing optical depth (AAOD) of anthropogenic aerosols in thetotal AAOD as annual means through the entire model atmospheric column (ATM) as well aswithin three vertical layers ranging from the planetary boundary layer (Layer 23 and 26), middletroposphere (Layer 18 to 22), to the upper troposphere (Layer 14 to 17). Data are from thebaseline estimation.
6593
20
Figure6.AerosolabsorbingopticaldepthofanthropogenicanddustaerosolsthroughdifferentseasonsoverIndiansummermonsoonregion(50‐100E,0‐36N).
Fig. 6. Aerosol absorbing optical depth of anthropogenic and dust aerosols in different seasonsover the Indian summer monsoon region. Data are: (a) zonally (4 upper panels), and (b)meridionally (4 lower panels), respectively, averaged within a domain bounded by 50–100◦ Eand 0–36◦ N. Data reflect the baseline estimation.
6594
21
Figure7.ZonaldistributionsofaerosolabsorbingopticaldepthinfourseasonsovertheWestAfricanmonsoon(WAM)regionandsurroundingareas(30W‐30E,10S‐30N).
Fig. 7. Zonal distributions of aerosol absorbing optical depth in four seasons over the WestAfrican monsoon (WAM) region and surrounding areas. Data are zonally averaged within a do-main of 30◦ W–30◦ E and 10◦ S–30◦ N. Data reflect the baseline estimation.
6595