Embed Size (px)
Citation preview

http://econ.geo.uu.nl/peeg/peeg.html
Papers in Evolutionary Economic Geography
# 09.21 The importance of R&D subsidies and technological infrastructure for regional
innovation performance - A conditional efficiency approach
Tom Broekel and Charlotte Schlump

The importance of R&D subsidies and technological
infrastructure for regional innovation performance -
A conditional efficiency approach*
Tom Broekel # and Charlotte Schlump §
# Section of Economic Geography, Faculty of Geosciences, Utrecht University, The
Netherlands
§ Department of Economic Geography, University of Marburg, Germany
November 27, 2009
Abstract
The importance of R&D subsidies for innovation activities is highlighted by numerous
firm-level studies. These approaches miss however the systematic regional character of
innovation activities and potential firm-spanning effects of this policy measure. The literature
on regional innovation performance has widely neglected R&D subsidies so far.
This paper analyzes the importance of R&D subsidies as well as the relevance of a
publicly funded technological infrastructure for the innovation efficiency of German regions.
Using conditional nonparametric frontier techniques we find positive effects of R&D
subsidies and somewhat smaller ones for the technological infrastructure, which however vary
between industries.
Keywords: innovation policy, regional innovation efficiency, technological infrastructure,
stepwise conditional frontier analysis
JEL: O18, O38, R58, R12
!!!!!!!!!!!!!!!!!!!!!!!!!!!!!!!!!!!!!!!!!!!!!!!!!!!!!!!!!!!!!* The authors would like to thank Marco Capasso for his comments and Mika Kortelainen for helping with the implementation of the conditional order-m analysis.

"!!
1 Introduction During the early nineties a regional focus has been added to national innovation
policy. The Regional Innovation System approach by Cooke (1992) and Cooke et al. (1997)
particularly emphasizes the importance of regional policies for firms’ innovation activities.
These ideas have been taken up by national and regional authorities resulting in an ever-
increasing number of measures supporting the formation of local clusters, regional identities,
and regional networks. At about the same time, budget constraints and concerns about the
effectiveness of these measures raised the interest in their evaluation.
In this paper we focus on two different types of innovation policies and their
evaluation: public subsidies for private R&D projects and the provision of a publicly funded
regional technological infrastructure.
The two measures have been studied very differently so far. Most studies that analyze
R&D subsidies concentrate their effects at the firm level (see, e.g., Brouwer et al., 1993;
Busom, 1999; Czarnitzki et al., 2007). This literature however does not take into account the
regional character of innovation processes and potential firm-spanning (regional) effects of
the evaluated policy programs.
In contrast, there is a long tradition of investigating the importance of a publicly
funded technological infrastructure on innovation activities from a regional perspective (see,
e.g., Jaffe, 1989; Anselin et al., 1997; Fritsch and Slavtchev, 2007a). Despite the firm-level
studies revealing the importance of R&D subsidies, this has however widely ignored this
crucial policy measure, which is though linked to the technological infrastructure.
The aim of the paper is to analyze the effects of public R&D subsidies and the
provision of a technological infrastructure on the innovation efficiency of German labor
market regions for four different industries. In addition, the regional distributions of the two
policy measures are explored and factors are identified that shape this distribution.
We follow Broekel and Meder (2008) in using conditional nonparametric frontier
analyses for the empirical evaluations. We make however use of recent advancements in this
methodology by De Witte and Kortelainen (2009), which yield more robust results. With this
tool at hand we also put forward a simple “stepwise” procedure that is employed to specify
regional innovation efficiency.
Our study confirms the firm-level results of Ebersberger and Lehtoranta (2008). For
most industries we find that regions with subsidized firms outperform regions that do not
benefit from public R&D subsidies. The results moreover suggest that even if crowding out
effects exist, the overall impact of R&D subsidizing remains positive.

#!!
With the exception of the electrics and electronics industry, the technological
infrastructure is found to be of lower relevance than R&D subsidies. Though it is most
effective if firms in a region receive R&D subsidies.
The paper is organized as follows. In Section 2 theoretical considerations are made on
the effects of policy initiatives on innovation activities. The empirical approach used to
investigate the impact of the two policy measures on regional innovation efficiency is subject
to Section 3. Section 4 provides the description of the employed database. The results are
presented and discussed in Section 5. Section 6 concludes.
2 Theory
2.1 Two policy instruments It is consensus that innovations are crucial for long-term growth and wealth, which
gives policy a reason to stimulate innovation activities. The literature offers a wide range of
ideas how policy can achieve this: Military programs are a classical example for the indirect
stimulation of the demand for new technologies (see, e.g., James, 2009). The financing of
basic science, financial incentives via taxes or subsidies, the supply of skilled human capital,
etc. are other common instruments of innovation policy.
In the following we will focus on two types of policy measures aiming at the
stimulation of firms’ innovation activities. The first is subsidizing of firms’ R&D projects.
The provision of a supportive technological infrastructure is the second measure. Both are
typical and important policy initiatives in Germany (Fier, 2002).
There are two main motivations for R&D subsidies. Firstly, they can be used to
stimulate private research in fields that are politically desirable. In Germany this applies to
new technologies and so-called key technologies that are foremost supported (Fier, 2002).
Secondly, policy aims at increasing investments in R&D because the latter is perceived to be
below a social optimum. Too low R&D investments can be a result of uncertainty and risk
involved in research. For instance, the effects and costs of long-running innovation projects
are difficult to measure ex-ante preventing solid investments plans (Cantwell, 1999).
Frequently, single firms also lack the resources to conduct large research projects on their
own (Fritsch et al., 2005). These situations can be overcome by collaborating. However, free
riding can reduce the benefits of collaborative agreements (see Heijs, 2003). In such cases
public subsidies may give firms the necessary pecuniary incentives to join their R&D efforts
and accomplish large-scale research projects together. In this respect, R&D subsidies have an
immediate resource effect by enlarging total R&D investments. At the same time they can
$!!
stimulate inter-organizational cooperation because most policy initiatives make R&D
subsidies conditional on firms and other organizations forming teams, which guarantee
extensive knowledge sharing. With this design policy aims at stimulating collective learning
processes that increase overall innovation performance (see, e.g., Camagni, 1991).
Conditional R&D subsidies also foster firms’ access, absorption, and utilization of external
knowledge, which is often held by public organizations like universities and research
institutes. This links R&D subsidies to the second policy measure: the publicly financed
technological infrastructure.
In contrast to R&D subsidies the provision of a publicly funded technological
infrastructure is an indirect way of supporting firms. While firm internal R&D is the most
important determinant of innovative outputs “it also develops the firm’s ability to identify,
assimilate, and exploit knowledge from the environment...” (Cohen and Levinthal, 1989, p.
21). Significant parts of the external knowledge are held by a regional technological
infrastructure (see, e.g., Feldman and Florida, 1994; Bathelt et al., 2004). Research institutes
and universities are the core of this infrastructure, which supplies knowledge, human and
financial capital, as well as a wide range of services. Together, these organizations represent
approximately one third of Germany’s over-all R&D capacities (ISI, 2000). Nicolay and
Wimmers (2000) moreover find that 82 percent of innovative firms had contact to such
institutes. They also represent the central nodes of formal and informal regional networks
(Soete et al., 2002). In order to make use of this technological infrastructure firms need to
establish links and interactions with actors part of this infrastructure. For example, these links
can be employees’ social networks, formal and informal cooperation, master theses,
internships, contract research, and labor mobility.
2.2 Evaluation of policy initiatives A rich literature analyzes the effects of R&D subsidies. Most of the studies are
conducted at the firm level and investigate the effects of subsidies on firms’ R&D efforts (see,
e.g., Busom, 1999, Goerg and Strobl, 2007), employment growth (see, e.g., Brouwer et al.
1993, Koski, 2008), and collaboration and patenting activities (see, e.g., Czarnitzki and
Hussinger, 2004, Czarnitzki et al. 2007).1 These studies focus on effects of R&D subsidies on
the input or output side of innovation activities. The effects are generally found to be positive.
In contrast, Ebersberger and Lehtoranta (2008) investigate the effects of R&D subsidies on
!!!!!!!!!!!!!!!!!!!!!!!!!!!!!!!!!!!!!!!!!!!!!!!!!!!!!!!!!!!!!1 There are also some studies that explore the impact of R&D subsidies at the national level. See for a review David et al. (2000).

%!!
the innovation efficiency, i.e. the relation of innovation output to innovation input. In their
study on Finnish firms they show that R&D subsidies tend to increase innovation efficiency.
A major concern in these studies is if public subsidies “crowd out” private R&D
investments. Crowding out means that firms substitute their own R&D spending with public
money. Hence, total innovative output remains stable because the increase in public R&D
investments is compensated by a reduction of private R&D spending (see Peters, 2000). The
empirical picture is still mixed with more recent studies assigning a small relevance to
crowding out (see, e.g., Czarnitzki et al. 2007).
The importance of the firm-external technological infrastructure has also been
extensively investigated. At the firm level Cockburn and Henderson (1998), Beise and Stahl
(1999), Zucker et al. (2002), and Cassiman et al. (2007) show that links to science institutions
increase firms’ R&D efforts and their economic performance.
Being firm-level studies these approaches do not take into account the regional
character of innovation processes and potential firm-spanning effects of the two policy
measures. The first corresponds to a widely accepted view in the field of Economic
Geography (Morgan, 2004). The literatures on regional innovation systems (see, e.g., Cooke,
1992; Cooke et al., 1997) and innovative milieus (Camagni, 1991) emphasize the importance
of collective learning processes and inter-organizational knowledge sharing for innovation
activities at the regional level. Accordingly, firms are embedded into regionally defined
systems of innovation. In this respect firm level studies are likely to miss the effects of one
firms’ behavior on the activities of other regional firms.
Similar applies to the policy measures, which impact individual firms and at the time its
relationships with other organizations. We pointed out above that most R&D subsidies are
granted conditional on that firms team up with other organizations and subscribe to intense
knowledge sharing. Their interactions with the technological infrastructure also contribute to
inter-organizational learning and the diffusion of knowledge among regional actors in
particular if this is backed by policy initiatives “securing the appropriate external conditions
in which such externalized learning and innovation can occur” (Cooke, 1997, p. 485).
Jaffe (1989) was among the first providing quantitative empirical evidence that (with
differences between industries) a positive association exists between corporate R&D activities
and public research at the regional level. Many studies replicate Jaffe’s analysis and find
similar results (see, e.g., Feldman, 1994, Feldman and Florida, 1994). Other approaches find
that firms to be located close to universities if university-firm linkages are important to them
(Audretsch and Stephan, 1996). For Germany, Fritsch and Slavtchev (2007a, 2007b) show
&!!
that the presence of universities as well as research institutes is positively associated to an
above average regional innovation performance.
To the best of the authors’ knowledge no study exists investigating the impact of R&D
subsidies on firms’ innovation activities at the regional level. R&D subsidies are however a
very popular and common policy measures, which is why they take center stage in this paper.
Because of this measure’s close link to the publicly financed infrastructure both policy tools
are simultaneously studied.
With the exception of Fritsch and Slavtchev (2007b) most studies in this field
investigate policy’s effects on regional innovation inputs (e.g. R&D employment) or the
regional innovative output (e.g. absolute number of patents). Such approaches require
however longitudinal data because the relationship between policy measures and these
variables are not unidirectional. While policy takes effect on innovative output the latter also
influences policy. With only cross-sectional data at hand, we cannot take this into account and
might run into serious endogeneity problems.
We therefore follow the idea of Fritsch and Slavtchev (2007b) as well as Ebersberger
and Lehtoranta (2008) by focusing on the innovation efficiency, i.e. we investigated the two
policy measures’ effects (R&D subsidies and technological infrastructure) on the regional
innovative efficiency. In this approach endogeneity is of less relevance because firms and
policy cannot easily observe regional innovation efficiency and hence, they cannot
accordingly adapt their behavior. 2
We acknowledge that the strong emphasize on the regional dimension of innovation
processes and the use of regional data is not unproblematic (see on this Maskell, 2001)
because the region in which a firm is located is not the only determinant of its innovation
performance. Knowledge networks span regional boundaries (see, e.g., Graf, 2007) and access
to region-external knowledge is crucial as well (Bathelt et al., 2004). Research institutions are
also not restricted to collaborate with firms located in their surrounding region. Nor do groups
of firms that jointly apply for R&D subsidies have to consist only of actors from one region.
In light of this the empirical results have to be interpreted with care. If no statistical
relationships are observed between policy measures and regional innovation efficiency, it
does not necessarily mean that the first are not important. It might just indicate that either the
measures or the innovation processes are not regional in nature.
With respect to the regional dimension of innovation activities we refer to the
!!!!!!!!!!!!!!!!!!!!!!!!!!!!!!!!!!!!!!!!!!!!!!!!!!!!!!!!!!!!!2 See for the determinants of funding at the firm-level Blanes and Busom (2004).

'!!
previously cited literature. The assumption of a regional dimension of the two policy
measures will be tested with a series of analyses. In these we investigate if the two measures
show regional patterns, which can be explained by a number of regional characteristics.
!"# $%&'(&)%*+,+-.)/,'0.1&*2.+*'
Regions particularly differ with respect to their industrial structure, which has been
identified to be a crucial factor explaining differences in regional innovation performance
(see, e.g., Jaffe, 1989). We therefore separately conduct our analyses for four industries. The
considered industries are chemicals (CHEM), manufacturing of transport equipment
(TRANS), manufacturing of electrical and electronic devices (ELEC), and a mixed branch
coving manufacturing of precision instruments, measurement devices, optics, and medical
apparatus (INSTR).
Applying Pavitt’s (1984) taxonomy ELEC and CHEM are regarded as science-based
industries implying a high relevance of connections to public science institutions. We expect
the technological infrastructure to be particularly crucial for these industries. R&D subsidies
should be less crucial but may become effective through their cost-saving and collaboration-
fostering nature.
TRANS is considered to be a scale intensive industry. Here the most important
sources of technological know-how are suppliers and consulting engineers, which suggest that
the innovation activity of TRANS are positively affected by the agglomeration of firms and
industries. The technological infrastructure should be of lower relevance. R&D subsidies
however are expected to be important to the extent that they foster collaboration with
suppliers. Similar applies to INST in which specialized suppliers drive the innovation
performance according to Pavitt. These are more crucial for firms’ innovation processes than
publically funded research institutes or universities. R&D subsidies can be effective when
stimulating inter-firm cooperation with and among specialized suppliers.
3 Method
3.1 Constructing of infrastructure index
The regional technological infrastructure is a complex construct of I = e1, e2, … en
elements e and n > 1. Each element describes the quantity / quality of a certain part of the
infrastructure. For example, one element captures the employees in public research institutes
and another the number of university graduates in a region.
In order to test this infrastructure in an econometric analysis (e.g. regression) one can
(!!
simultaneously take into account all these elements as independent variables. This raises some
problems. When a considerable number of elements are simultaneously analyzed many
observations are required. This is however seldom the case when regions are the observations.
In addition, certain elements play very similar roles and tend to be correlated in geographic
space. For instance, research institutes as well as universities fuel the labor market with highly
skilled employees. They also generate state-of-the-art knowledge that spills over to firms. For
various reasons they are also geographically collocated. For the econometric analysis this
implies that one variable captures parts of the explanatory power of the other causing some
variables to remain insignificant although they may matters (or inducing multicollinearity
problems). In this study we are moreover not interested in the relative importance of the
infrastructure’s elements but in its general contribution. Last but not least, the chosen methods
is not applicable to simultaneously test the relevance of many variables.
For these reason we collapse the multi-dimensional technological infrastructure vector I
into a single index. It is the goal to derive a cardinal index representing regions’ endowments
with this infrastructure. Borrowing from the distance function literature, the difference
between two regions’ endowments can be described by the Euclidean distance between the
two infrastructure vectors
!
! x and
!
! y . An intuitive index can then be defined as the Euclidean
distance of each region’s infrastructure vector to the minimum (or maximum) vector found
amongst the regions. The larger (smaller) this index, the better (worse) a region’s
technological infrastructure.
Using the Euclidian distance implies that all elements are weighted equally, which is
however problematic given the definition of the technological infrastructure. For example,
public research institutes are often purposefully founded near to universities or technical
colleagues. The amounts of external funding universities receive are also related to the
number of engineering graduates. In addition, some elements have very similar effects for
firms’ innovation activities (see above). In other words, the infrastructure’s elements are not
independent of each other and many of them tend to show similar spatial distributions. In
order not to discriminate regions with low values in some elements, we use the Mahalanobis
distance for estimating the difference between infrastructure vectors and .
S represents the (spatial) covariance matrix of and . The information on the spatial
relationship between the elements, as captured by their covariance matrix, is used for the
weighting. Elements that are spatially correlated are weighted less than spatially uncorrelated
elements. Additional desirable features of this distance measure are that it is scale and

)!!
translation invariant, i.e. the considered variables do not need to be transformed to a common
scale.
In order to avoid a regional size bias all quantities are divided with the number of
regional employees. The final index Ir is defined by the Mahalanobis distance between each
region’s infrastructure vector and that of the region with the smallest vector (lowest
endowment). The latter is defined as the region with the smallest Mahalanobis distance to a
zero value vector.
3.2 Conditional order-m analysis
The (regional) knowledge production function (KPF) approach is the most common
way to test the influence of regional characteristics on regional innovation performance
(Griliches, 1979, Jaffe, 1989). In this framework, variables representing knowledge inputs
(regional factors) are set into a pre-defined functional relationship with the knowledge outputs
(e.g. patents). Regression techniques are used to make statistical inference about the relevance
of the regional factors for “explaining” the knowledge output.
Recently, it has been argued that applying non-parametric production frontier
techniques is more appropriate in this context (Bonaccorsi and Daraio, 2005; Broekel, 2008).
These “mathematical” frontier approaches are very common in productivity literature and
represent an alternative way of analyzing the relationship between (regional) input factors and
(knowledge) output. In essence, frontier functions are fitted by linear programming techniques
that envelop the data. These functions represent the maximum output given a specific input
level. In contrast, traditional regression approaches (e.g. OLS) represent the average or
“expected” output. Another difference regards the perspective taken in the two approaches.
While frontier approaches traditionally look at each unit’s deviations from the frontier
(efficiency), regression approaches seek for factors that minimize the observed deviation from
the average trend. Or in other words, frontier approaches have primarily been concerned with
the precise estimation of a unit’s deviation from certain benchmarks. The results of such an
analyses are efficiency scores for all units. Regression approaches rather seek to explain
variance among a population of observations. Accordingly, typical results are the significance
levels of variables’ coefficients indicating if a variable can “explain” some of the observed
variance.
Although we want to estimate regional innovation efficiency, our final aim is to test if
the two policy measures can explain a significant part of its variance. Hence, our research
questions rather correspond to the latter approach. For this reason we rely on recently
*+!!
developed conditional frontier approaches (Daraio and Simar, 2005), which make use of
frontier techniques but focus on the association between units’ (in-)efficiencies and certain
“external” factors.
Using conditional frontier approaches yield a number of advantages over traditional
parametric regression approaches. They are discussed extensively in Bonaccorsi and Daraio,
(2005) and Broekel (2008). The most important ones are the following. Linear programming
techniques do not require the specification of parametric models, which significantly reduces
the danger of model misspecification. The frontier functions are also allowed to vary between
regions. Hence, they accounts for the uniqueness of some regional innovation systems. Lastly,
the estimations are done by comparing regions to best practice and not by a comparison with
average practice. This makes the results more interesting for policy.
For the efficiency estimation we use the order-m frontier approach by Cazals et al.
(2002). It represents a robust nonparametric frontier approach because it allows for stochastic
noise in the data, which is essential when investigating innovation activities (See Appendix A
for details). The most important drawback of traditional deterministic nonparametric frontier
approaches (e.g., Data Envelopment Analysis) has been overcome with this development (see
Daraio and Simar, 2007).
The result of the order-m frontier analysis is a measure of relative efficiency of each
region. In the context of this paper it indicates by how much the innovative output of a region
has to increase in order for that region to become best practice (efficient) given its level of
input factors.3 Or in other words, it represents the (Euclidean) vertical distance between a
region’s innovative output and the frontier, i.e. the maximal output that can be expected given
its input factor level.4
Conditional frontier analyses have been put forward as a way to investigate external
factors’ influences on this efficiency measure (Daraio and Simar, 2005a, 2007). Broekel
(2008) and Broekel and Meder (2008) show that these approaches are also useful for
analyzing regional innovation efficiency. We follow these authors but make use of the
generalized kernel and bandwidth selection procedure by De Witte and Kortelainen (2009).
This procedure allows for a more accurate analyses and the consideration of dichotomous and
ordered discrete variables as external factors. It can moreover be used for statistical inference !!!!!!!!!!!!!!!!!!!!!!!!!!!!!!!!!!!!!!!!!!!!!!!!!!!!!!!!!!!!!3 Please note that we use „input factors“ instead of „inputs“ to point out that no deterministic relation exist between “outputs“ and “inputs“ as it is the case in production theory. 4 This corresponds to an output-oriented analysis. One may also ask by how much the input factors have to be reduced for a region to become best-practice given a certain output level (input-orientation). We argue that the output-orientation is more appropriate because our aim is to identify obstacles that hinder regions in achieving “maximal” innovation output (see Broekel and Brenner, 2007).
**!!
and the estimation of significance levels.
Two efficiency measures are estimated in this type of analysis: a conditional and an
unconditional. The unconditional measure has been described above and simply compares the
relation between a region’s innovative output to the best practice (frontier) found among all
regions with equal or less input factor levels. The same applies for the conditional
performance measure. In this case however, the comparison is done under consideration of
(conditional on) one or more external factors. More precise, in the conditional case the
evaluation of a region is biased towards a comparison with regions having similar values of
the external factors (see for more details Appendix A as well as Daraio and Simar (2007)).
The central variable of the conditional frontier framework is Qz, the ration between the
conditional and the unconditional performance measure. This ratio is set into relation with the
external factors. Inference about this relation can be made using two-dimensional scatter
plots. In addition, nonparametric regressions highlight existing trends in the data clouds. An
increasing regression curve indicates a positive influence, while a decreasing one hints at a
negative impact. The significance of the relations is estimated as suggested by De Witte and
Kortelainen (2009) using 1000 bootstrap replications.
#"# $%&'0&3.*.(.+*'+3'4&-.+*/,'.**+5/(.+*'6&43+41/*)&'
When talking about regional efficiency researcher commonly analyze the efficiency or
productivity of regional R&D employees (see, e.g., Fritsch, 2003, Fritsch and Slavtchev,
2007b, Broekel, 2008). This productivity is amongst others influenced by various regional
factors (see for an extensive discussion Brenner and Broekel, 2009). Some of them are under
the control of public authorities and some are not. In order to isolate the effects of policy
measures we need to control for factors not under control of policy.
Straightforwardly, these factors enter the input factor set in addition to regional R&D
employment, i.e. they are related to the regional innovative output in the estimation of the
efficiency measures.5 The two policy measures, R&D subsidies (SUBS) and infrastructure
index (INFRA) are defined as “external factors” whose impacts on the innovation efficiency
are to be analyzed.
In traditional regression approaches inputs and external factors enter the analysis in an
identical way as independent variables. The estimation determines if they are significant or
not. The chosen approach is different in that it does not distinguish between significant and
insignificant input factors. All factors defined as input factors shape the measure of regional !!!!!!!!!!!!!!!!!!!!!!!!!!!!!!!!!!!!!!!!!!!!!!!!!!!!!!!!!!!!!5 This corresponds to the regional innovation efficiency approach put forward by Brenner and Broekel (2009).

*"!!
innovation efficiency. We therefore have to ex-ante identify insignificant input factors, which
would bias the estimation. Their exclusion also reduces the number of empirical dimensions
(considered variables), which increases the robustness of the analysis by reducing the danger
of sparsity biases.6
In order to achieve this we put forward a kind of “stepwise” approach using the
conditional frontier analysis to check the significance of the input factors. In a first step, we
define our baseline model to be the innovation efficiency of R&D employees. In this we
acknowledge industry specific R&D employment to be a necessary input factor because they
represent the “innovation generators” (Brenner and Broekel, 2009). In a next step, we leave
aside the policy measures and test the influence of potential additional input factors on this
measure, i.e. variables not controlled by policy become external factors in the conditional
frontier analysis. They are iteratively added and removed until we find the largest number of
simultaneously significant variables. The sequence of removing follows the degree of
insignificance with the most insignificant variable being removed first. Lastly, it is checked if
the remaining significant variables are monotonously and positively related to the innovation
efficiency, which is a necessary requirement for a variable to become an input factor (see, e.g,
Coelli et al. 1998).7
4 Data
4.1 Data on patent applications and R&D
The 270 German labor market regions defined by the German Institute for Labor and
Employment (Institut für Arbeit und Beschäftigung, IAB) are used as units of analysis.8 These
regions reflect the spatial dimension of labor mobility in Germany. About half of all job
changes of highly educated person take place within labor market regions (Haas, 2000). Most
of the university graduates also find their first job within the labor market region their
university is located in (Mohr, 2002). Moreover, they are also likely to correspond to spatial
constraints in firms’ search for cooperation and knowledge exchange partners (Broekel and
Binder, 2007). Hence, a significant portion of firm-spanning innovation processes as well as
!!!!!!!!!!!!!!!!!!!!!!!!!!!!!!!!!!!!!!!!!!!!!!!!!!!!!!!!!!!!!6 The sparsity bias refers to a situation in which many regions lack a sufficient number of comparison regions, which induces a higher proportion of efficient regions. This situation is caused by the fact that regions with a minimum in an input factor are automatically deemed efficient. The number of such regions tends to increase with the number of considered input factors (see, e.g., Pedraja-Chaparro et al., 1999) 7 If this is not the case the variable needs to be transformed to meet this requirement. 8 We use the up-to-date definition of labor market regions in contrast to the older definition used in Greif and Schmiedl (2002) and Greif et al. (2006).!
*#!!
the geographically bounded effects of the technological infrastructure are likely to be captured
by this level of spatial disaggregation.
As it is common in innovation research, the output of innovation activities is
approximated by patent applications. The data on patent applications for the years 1999-2003
are published by the Deutsches Patent- und Markenamt (German Patent Office) in Greif and
Schmiedl (2002) and Greif et al. (2006). The data are classified according to 31 technological
fields (TF). The applications by public research institutes, e.g., universities and research
societies (e.g. Max Planck Society) as well as those of private inventors are not included
because our data on R&D employment covers only industrial R&D. Data on R&D
employment are obtained from the German labor market statistics. Employees are organized
according to the international NACE classification.9
The data is matched using the concordance between the two different classifications
(NACE and TF) by Broekel (2007). It adapts the concordance by Schmoch et al. (2003) to the
data used here. As already mentioned we concentrate on the four industries chemistry
(CHEM), manufacturers of transport equipment (TRANS), electrics & electronics (ELEC),
and a mixed branch covering manufacturing of instruments, and medical & optical equipment
(INSTR). The final R&D and patent variables are the summed values of the according
technological fields and industries presented in Table 1 in the Appendix. For these industries
patenting represents a considerably important property rights protection mechanism (Arundel
and Kabla, 1998). This ensures that our innovation output measure captures most, or at least a
significant share of, innovations in this industry. We follow Fritsch and Slavtechev (2009b)
and assume a time lag of two years between the R&D efforts and the patent applications.
4.2 Regional factor endowment
Many regional factors are not under control of policy but influence firms’ innovation
activities (see for an overview Broekel and Brenner, 2009). For this study we consider the
factors most commonly put forward in the literature to influence innovation activities at the
regional level.
Agglomeration and urbanization economies are frequently shown to enhance firms’
innovativeness (Greunz, 2004). The advantages of urbanization are among others rich local
labor markets and a well-developed non-technological infrastructure. In a common fashion,
urbanization advantages are approximated by population density (POP_DEN).
!!!!!!!!!!!!!!!!!!!!!!!!!!!!!!!!!!!!!!!!!!!!!!!!!!!!!!!!!!!!!9 Nomenclature Generale des Activites Economiques dans I`Union Europeenne (NACE).

*$!!
Also the availability of highly qualified human capital plays a significant role for firms.
Given a surplus in demand, some R&D projects cannot be started or will take more time than
expected if highly qualified human capital is not accessible. Following Weibert (1999) we
approximate this by the share of employees with high qualifications (EMP_HIGH). These two
variables are taken from the German statistical office.
Industrial agglomeration is also argued to stimulate knowledge spillovers and exchange,
which in turn fosters innovation performance (Feldman and Audretsch, 1999, van der Panne
and van Beers, 2006). The variable SPEC accounts for the specialization of a region with
respect to a particular industry. It is estimated as the production specialization index (PS)
proposed by Feldman and Audretsch (1999) of the industry. Following Laursen (1998) it is
made symmetric by:
The effect of these regional factors are argued be regionally bounded. However, knowledge
spillovers from other regions’ R&D facilities are sensitive to, but not ‘bounded’ by,
geographic distance (Anselin et al., 1997). We therefore need to consider these inter-regional
relationships. The most intuitive way this can be accomplished is to construct a variable
SPATIALi approximating a region’s “potential” to benefit from inter-regional spillover. For
the construction of this spatially lagged variable we use regions’ population centroids’
geographic coordinates and the distance decay rule of Funke and Niebuhr (2005) showing as:
.
dij is the distances between region i and j. Kj represents the potential of knowledge spillover
of region j, which is approximated with its patent output in t-1.
According to the “stepwise” procedure the four variables are iteratively tested with
respect to their impact on the regional innovation efficiency of R&D employees. In a first
step, we find most of them to be positive significant when they are separately tested. It can
however already be seen from their correlation structure that they share very similar variance
(see Table 2 in the Appendix). This explains that when completing the procedure only one
factor per industry remains significant. Only this factor enters the input factor set in addition
to industrial R&D employment. For CHEM and TRANS this is population density
(POP_DEN) and for ELEC and INSTR it is the share of highly educated employees
(EMP_HIGH). Accordingly, our analyses have five empirical dimensions (variables): one
innovative output, two input factors, and two external factors. Of course, it is not meaningful
*%!!
to evaluate regions in which no (potential) innovation generators are present. We therefore
restrict the analysis to regions showing positive R&D employment in the industry under
consideration. This is true for at least 220 regions out of 270 regions in all industries. This
ensures a very good ratio between empirical dimensions (5) and the number of observations
(>220).
4.3 The publicly funded infrastructure
Universities and technological colleagues are amongst the most important elements of
the technological infrastructure, which we approximate by a number of variables. The first
variables are the number of graduates of engineering and natural sciences & math from
universities as well as technological colleagues. Their numbers are used to account for the
presence and size of universities and technological colleagues in a region. The graduates’
mobility patterns are considered explicitly because after obtaining their degrees a certain
share of them leaves the region in which they studied and move to other regions (Mohr,
2002). Receiving regions benefit from the knowledge and human capital created in regions
with universities. This is neglected in most existing studies in which graduates are assigned
only to regions with universities. Such overrates the technological infrastructure in these
regions and underestimates it in case of receiving regions. Faggian and McCann (2006) show
that graduates mobility captures most of the non-cooperation related spillovers between
research institutes and firms.
We follow the procedure proposed by Broekel and Brenner (2007) and distribute the
numbers of graduates across the regions such that a region’s probability to obtain another
regions’ graduates depends positively on its population and negatively on the geographic
distance between the regions. In addition, a certain share of the graduates is modeled to stay
in the university region. The parameters of a hyperbolic function used for estimating the
probabilities are fitted by a maximum likelihood calculation, using geographic coordinates
and population counts for the German five digit postal code areas as well as empirical
findings from Legler et al. (2001) on the mobility of graduates. This means that with
increasing geographic distance the likelihood of graduates to move decreases hyperbolically.
Two variables are created on this basis: the spatially distributed numbers of engineering
graduates and the spatially distributed numbers of natural science & math graduates.
We additionally include variables that account for research activities of universities.
These are the number of engineering and natural science & math faculties in a region, the
amount of received third-party funds, and the organizations’ basic funds. Because inter-
*&!!
regional effects of universities are already accounted for by the graduates’ mobility, these
variables are modeled having purely regional effects.
Another factor that policy can influence is the endowment and the activities of public
funded research institutes. We consider the ‘big four’ institutions in Germany: the Helmholtz
Association, the Max Planck Society, the Fraunhofer Society and the Leibnitz Association.
The Max Planck Society and the Fraunhofer Society are mainly concentrated in the southwest
of Germany and are often located next to universities (ISI, 2000). While the latter focuses on
applied research, the first is dedicated towards basic research (Beise and Stahl, 1999). In
addition, the Helmholtz Association consists of fourteen large-scale institutes all over
Germany. The institutes of the Leibnitz Association have been part of programs to help
regions lacking in infrastructure, especially regions in the former GDR (ISI, 2000).
Four variables are constructed each representing the personnel working in technological
or natural science institutes of these organizations in the year 2001. The total employment of
research organizations is considered as additional variable. Similar to the case of universities,
we assume that the effect of the public research institutes decreases hyperbolically with
growing distance. Their employment numbers are distributed with the same procedure used
for the graduates. The distribution procedure’s relevant parameters are calculated on the basis
of the findings of Beise and Stahl (1999).10 These variables are very constant over time which
is why we don’t consider time lags. All variables approximating the technological
infrastructure are divided by the regional employment in order to avoid a size bias. On the
basis of these eleven variables the infrastructure index INFRA is constructed as described in
Section 3.1.
4.4 R&D subsidies
The data on subsidized R&D projects are obtained from the German ministry of
education and research (Bundesministerium für Bildung und Forschung, BMBF), which is the
main actor initializing innovation policy in Germany (Hassink, 2002). It publishes the
spending for its various programs as well as parts of the funding coming from the ministries
of environment and economy (see, BMBF, n.d.). From this database we collected data of
projects active between January 2001 and December 2002, which applies to 3,100 R&D
projects. The majority of them starts before 01.01.2001 (57%) and ends after 31.12.2002
(75%). About 26% of them involve more than one actor implying that about a quarter of all
!!!!!!!!!!!!!!!!!!!!!!!!!!!!!!!!!!!!!!!!!!!!!!!!!!!!!!!!!!!!!10 See Broekel and Brenner (2007) for further details.
*'!!
granted R&D subsidies regard collaborative projects.11 These projects are primarily joint
research projects (“Verbundprojekte”). Actors that participate in these projects subscribe to
very extensive knowledge sharing regarding the content of the project (see BMBF, 2008).
This backs our initial hypothesis of R&D subsidies having significant effects spanning
individual firms’ boundaries by fostering knowledge sharing and collaborative learning
effects.
The projects have been assigned to 2-digit NACE codes. For this the LexisNexis
database has been employed (LexisNexis, n.d.). The firms were subsequently assigned to the
according labor market region. On this basis for each industry a single variable was
constructed representing the amount of this industry’s regional subsidies per R&D employee
in the year 2001/2002. We don’t exactly know at what time the subsidies of 2001/2002
become effective and we can only speculate about potential time lags. We therefore analyze
the relationships between the R&D subsidies in 2001/2002 and regional innovation efficiency
in the years from 1999 to 2003. More precise, for each industry we run five separate analyses
with the same R&D subsidies variable but yearly changing values of input factors, innovative
outputs, and technological infrastructure. Our initial assumption is that R&D subsidies are
relatively stable over time at the regional level, which implies that their values of 2001/2002
are good approximations for the other years.
5 Results
5.1 The spatial distribution of R&D subsidies Table 3 and Table 4 in the Appendix show the subsidies per R&D employee for the four
industries considered in this paper. The tables reveal that the regions with the largest subsidies
per R&D employee are a mix of large urbanization (Erlangen, Essen, and Munich), as well as
more rural areas (Aalen, Kleve, and Rostock).
A more comprehensive picture of the regional distribution of R&D subsidies is obtained
when regressing the subsidies variables on a number of regional characteristics. All R&D
subsidies variables show few positive values. From 270 regions only 79 (CHEM), 49
(TRANS), 81 (ELEC), and 84 (INSTR) regions received R&D funding. We therefore use
zero-inflated negative binominal regression.12 The regression results are presented in Table 6,
Table 7, Table 8, and Table 9 in the Appendix. Not surprisingly the R&D employees variable
!!!!!!!!!!!!!!!!!!!!!!!!!!!!!!!!!!!!!!!!!!!!!!!!!!!!!!!!!!!!!11 Estimations by the authors. 12 Subsidies per employee can be interpreted as count data because the smallest unit is Euro cents.
*(!!
are highly significant in all regressions’ binominal parts, i.e. it takes positive R&D efforts in
order to receive subsidies.
The amount of subsidies is primarily related to EMP_HIGH in case of CHEM and
TRANS. This indicates that regions successful in acquiring funding in these industries are
also characterized by the presence of other high-tech industries. An explanation can be the
importance of joined projects with partners from other high-tech industries.
For ELEC and INSTR, the degree of specialization SPEC turns out to be significant
implying that specialized regions are more successful in acquiring funding. Possibly, firms in
these regions find it easier to team up with other close by actors, which is rewarded by policy.
This remains however speculative at the moment and deserves future research.
The positive coefficients of POP_DEN and INFRA in case of ELEC fit to the findings
of Pavitt (1984) that this industry tends to collaborate intensively with science institutions.
Geographic proximity to these institutions is beneficial in this respect. These tend to be
located in urbanized regions. Again, we cannot clarify where these benefits exactly come
from and only speculate that they might be related to biases in the choice of collaboration
partners (Broekel and Binder, 2007), lower transaction costs, or a particular granting policy.
To our surprise only in the case of ELEC we observe a significant positive relationship
between R&D subsidies and the technological infrastructure, which is also confirmed by a
bivariate Wilcoxon rank sum test. It indicates a significant difference in the technological
infrastructure between regions that receive subsidies and those that do not. While we expected
the co-location of universities and research institutes to positively influence the likelihood of
firms gaining funding this is only confirmed for one industry. A possible explanation for this
might be found in the non-industry-specific nature of our technological infrastructure index.
Because the index is identical for all industries, it may reflect only the infrastructure needs of
ELEC and not those of the other industries. The data at hand however does not allow
disaggregating it in an industry-specific manner, which is certainly an interesting issue.
In summary, we find plausible results for R&D subsidies suggesting that this variable
can be meaningfully analyzed from a regional perspective. It also becomes clear that this
variable is related to regional factors that policy cannot influence and which we have to
control for in the later analyses.
5.2 The spatial distribution of the technological infrastructure Table 5 in the Appendix lists the top ten regions with respect to the technological
infrastructure index. Most of them can be regarded as the “usual suspects” indicating that our
*)!!
index is not off the mark. The top two and the fifth position (Düren, Staßfurt, and
Germersheim) however are somewhat surprising at the first glimpse. However, one has to
keep in mind that the infrastructure index is constructed by controlling for the number of
employed persons in a region. It is therefore easier for sparsely populated regions to gain high
values. What explains however the top-position of Düren is that this region includes the city
of Jülich with the huge research facility of the Helmholtz Association (Forschungszentrum
Jülich). A similar reason explains the good position of Staßfurt, which is a result of its
comparatively close location to university cities (Magdeburg, Bernburg, Halle) which is why
it benefits strongly from graduates that potentially move into this region. In addition, the
Leibniz Association runs an institute for plant genetics and crop plant research in a small town
close to Staßfurt (Gatersleben). The region Germersheim primarily profits from its location
between the university locations and research top-spots Mannheim, Heidelberg, and
Karlsruhe.
In order to analyze the association between the infrastructure index and regional
characteristics we use a spatial regression approach. We have to take into account spatial
dependencies because the infrastructure index includes the spatially distributed graduates.
This makes the observations dependent on each other.13 The index is also restricted to the
interval [0,1] requiring a probit transformation.
Table 10 in the Appendix shows the regression results. The constructed infrastructure
index does not show any particular relationship with the R&D employees of the four
industries. Only the R&D employees of the chemical industry seem to be located outside
regions well endowed with the publicly funded infrastructure (the coefficient is just barely
insignificant), though.
Not surprisingly we find that our index is related to the share of highly educated persons
in a region (EMP_HIGH), i.e. the quality of a region’s human capital.14 This indicates that
high-tech industries are concentrated in regions with universities and public research
institutes. The results do not change significantly when separately estimated for each industry.
One interesting result is however that in case of CHEM the amount of R&D subsidies is
correlated to the presence of a well-developed technological infrastructure. Hence, this
industry’s R&D employees tend to be located outside regions with a well-developed
infrastructure, the subsidies however go to firms that are located in the latter regions. While
this is certainly an interesting finding it may in parts be explained by a too heterogeneous !!!!!!!!!!!!!!!!!!!!!!!!!!!!!!!!!!!!!!!!!!!!!!!!!!!!!!!!!!!!!13 The previously described mobility patterns of graduates are used as basis for the specification of the spatial weights matrix. 14 Note that our R&D employee numbers do not include university staff.
"+!!
definition of CHEM, which is a mix of very different sub-industries (i.e. pharmacy vs.
petroleum refining). With the data at hand we cannot disaggregate the industry any further
and have to leave this puzzle to future research.
In summary, our index seems to capture the endowment of regions with respect to a
publicly funded infrastructure very well. It shows very little correlation with non-policy
related regional characteristics making it an appropriate variable for the following analyses.
5.3 R&D subsidies and innovation performance
We pointed out before that SUBS is a zero-inflated variable, which makes it a problem for the
conditional nonparametric frontier analysis. The large numbers of zero values are not valid in
the kernel bandwidth selection procedure used for the conditional nonparametric frontier
analysis by De Witte and Kortelainen (2009).
We therefore conduct the conditional nonparametric frontier analyses in three different
set-ups. We treat R&D subsidies as continuous variable in the first. For this we add a random
variable to SUBS, which is drawn from a uniform distribution with a minimum of 0 and a
maximum of 0.05. In the second analysis R&D subsidies are defined being ordinal scaled, and
in the third we treat them to be dichotomous. In the latter the variable takes a value of 1 if
SUBS is larger zero and zero otherwise. The infrastructure index is continuous in all analyses.
The estimations of the first two set-ups turn out to be somewhat problematic which is why we
don’t report them here.15 We observed in particular strong changes in the significance levels
between the years, i.e. in one year the variables are extremely significant (p<0.01) and in the
next strongly insignificant (p=1). Given that our R&D subsidies variable accounts only for the
year 2001/2002 it suggests that the amounts of subsidies show strong year-to-year variation
violating our assumption of more or less temporally constant subsidies levels (see Section
4.4).
The results of the third set-up are fairly robust in contrast, which suggests that at least
the group of regions benefiting from subsidies remains the same over the years by and large.
On this basis we interpret the results of the third set-up (dichotomous R&D subsidies) in the
following.16
When SUBS is defined to be dichotomous, the conditional frontier analyses reveal that
R&D subsidies are significantly (significance level of 0.1) associated to regional innovation
efficiency in the cases of CHEM (1999, 2000, 2002, 2003), TRANS (1999), ELEC (2003),
!!!!!!!!!!!!!!!!!!!!!!!!!!!!!!!!!!!!!!!!!!!!!!!!!!!!!!!!!!!!!15 The results can be obtained upon request from the authors. 16 Please note that we additionally run the analyses including all factors excluded during the stepwise procedure. The results do not change significantly.

"*!!
and INSTR (2000, 2002, 2003). The direction of this influence is positive because the means
of the (significant) ratios of conditional and unconditional efficiencies (Qz) are higher for
subsidized regions than for those that are not subsidized. Table 11 in the Appendix
summarizes the mean differences and gives the significance levels for all industries and all
analyzed years.
The positive relationship between SUBS and innovation efficiency confirms previous
firm-level findings by Ebersberger and Lehtoranta (2008) for CHEM and INSTR. For the
other industries the results are not consistent enough with respect to that we do not observe
any particular time-lag structures. Please note once more that we believe that SUBS is
influencing regional innovation efficiency. Causality may however be reversed because
highly innovative firms (regions) find it easier to acquire R&D funds (see, e.g., Busom,
1999). We argue however that this does not necessarily hold for innovation efficient firms and
regions because the efficiency measure is much more difficult to observe.
Blanes and Busom (2004) show that the likelihood for a firm to apply for funding
increases with firm size. It implies that we can expect a closer relationship between
innovation efficiency and SUBS for industries, in which large firms drive the innovation
activities (CHEM, TRANS). In case of CHEM our results seem to support this while they do
not correspond to this pattern in case of TRANS.
We cannot discriminate if the positive effects of R&D subsidies come from a) directly
enlarging R&D resources or b) increasing the access to external knowledge because of their
collaborative nature. With respect to a) it is heavily discussed in the literature if R&D
subsidies “crowd out” private R&D investments (see, e.g., Goerg and Strobl, 2007). In the
context of this paper crowding out implies that R&D subsidies substitutes firm internal
resources causing the observed positive relationship between innovation efficiency and
SUBS. We cannot test such an effect directly because we lack longitudinal data on SUBS. We
can however compare the innovation efficiency after controlling for the effects of R&D
subsidies (and INFRA). If crowding out is directly related to R&D subsidies than we are able
to control for this effect by considering subsidies’ effects. Straightforwardly, we compare the
conditional performance scores of subsidized regions with those of regions that were not
subsidized. Table 12 in the Appendix shows the corresponding median differences and the
significance levels of the Wilcoxon rank sum test.17
It turns out that all median differences are positive and most of them are also
significant indicating that regions that did not receive subsidies have a higher conditional
!!!!!!!!!!!!!!!!!!!!!!!!!!!!!!!!!!!!!!!!!!!!!!!!!!!!!!!!!!!!!17 The efficiency scores are not normally distributed according to Kolmogorov-Smirnov test.

""!!
performance score than benefiting regions.18 With respect to potential crowding out effects
this means that even if crowding out takes place (something we cannot rule out) regions that
are subsidized out-perform not supported regions. Hence, subsidized regions in average show
higher innovation efficiencies than regions not receiving subsidies. This holds even when
controlling for the technological infrastructure as well.
If subsidies are responsible for this effect (which our analysis suggests) this means that
crowding-out effects are unfortunate but it still pays-off to subsidies R&D projects. Or in
other words, R&D subsidies have a positive net-effect on innovation performance. Note once
more, that this result holds only at the regional level and SUBS being a dummy.
7"8 $&)%*+,+-.)/,'.*34/2(49)(94&'/*0'.**+5/(.+*'6&43+41/*)&'
Our analyses indicate that the technological infrastructure is not related to the regional
innovation efficiency in case of CHEM and TRANS. A strong association is however found
for ELEC (1999, 2000, 2001, 2002, 2003) and a somewhat weaker relationship for INSTR. In
case of the latter the variable is only significant in the last two years (2002, 2003).
The observed relationship is found to be positive even though the effects seem to be
rather weak. The nonparametric regressions in Figure 1 in the Appendix also suggest a mainly
monotone relationship. Only for the largest values of INFRA a decreasing trend is observable.
The latter is supported by few observations making an interpretation very wake that is why we
primarily focus on the increasing trend in the following.
For two industries (ELEC, INSTR) we confirm the non-industry specific results of
Fritsch and Slavtchev (2007b) of a close relationship between technological infrastructure and
regional innovation efficiency. For two industries (CHEM, TRANS) this is not the case. In
this respect our analyses once more show the importance of conducting sector specific studies
when analyzing regional innovation performance (see, e.g., Jaffe, 1989; Brenner and Greif,
2006).
The low importance of INFRA is particularly surprising for the science-based chemical
industry (CHEM) which is why we expected a close relationship between innovation
efficiency and INFRA. A potential explanation might be the too high sectoral aggregation of
the industry, which includes in-organic chemicals (e.g., manufacturing of ceramic and
cement). For these the publicly funded technological infrastructure is likely of smaller
relevance. In contrast, the results of the other science-based industry (ELEC) confirm our
expectations of a positive and robust relationship between innovation efficiency and the !!!!!!!!!!!!!!!!!!!!!!!!!!!!!!!!!!!!!!!!!!!!!!!!!!!!!!!!!!!!!18 Note that high performance scores indicate large in-efficiency.

"#!!
presence of a publicly funded regional technological infrastructure. There are only three
instances in which INFRA and SUBS are both significant: in case of ELEC in the year 2003
and for INSTR in the years 2002 and 2003. This dual influence is disentangled in Figure 2 in
the Appendix. All figures show similar patterns. The effect of INFRA is much stronger in
subsidized regions (solid line) than in not subsidized regions (dashed line). This underlines
the tight relationship between the two variables in this industry, which is in line with our
previous results (Section 5.1). For INSTR we observe a comparable relationship between the
two policy measures, although the previous analyses did not suggest related spatial
distributions of the two policy measures (see Section 5.1).
It is surprising to find SUBS being more important than INFRA for most industries.
From an econometric point of view this comes unexpected as SUBS is stronger correlated to
the other input factors (R&D employees, population density, etc.), which is why some of its
explanatory power is already taken into account. A reason can be that SUBS is more
accurately defined because it is an industry-specific variable while INFRA is not.
We argue however that the reason can be found in INFRA being a “potential” variable.
It represents only the potentially existing positive effects of the technological infrastructure. It
does not say anything about if the technological infrastructure is actually exploited by firms in
a region. In contrast, SUBS represents a “flow” variable approximating resources that were
actually used by firms for R&D activities. Hence, the observed results can also be induced by
this difference in the variables’ constructions. This sets the agenda for future research in
which the technological infrastructure needs to be defined closer to the “flow” concept.
6 Conclusion
Given the importance of innovation for economic growth, national and regional
authorities try to stimulate innovation activities with a wide range of programs and initiatives.
The paper concentrates on two of the most important policy measures namely the provision of
a publicly funded technological infrastructure and R&D subsidies.
So far the evaluation of R&D subsidies’ effectiveness has been focused on the firm
level leaving aside the systemic character of innovation processes and the multi-actor nature
of many policy programs (see, e.g. Cooke et al., 1997). The literature on regional innovation
performance on the other hand widely ignores this important policy tool, which is though
closely linked to the effects of a regional technological infrastructure. The latter has in
contrast been studied extensively (see, e.g., Jaffe, 1989).
"$!!
Taking a regional innovation system perspective the paper analyzed the effects of R&D
subsidies and those of a publicly funded technological infrastructure on regional innovation
efficiency. We utilized data on 270 German labor market regions, which was disaggregated
for four industries. Following Broekel (2008) conditional efficiency analysis were employed
for the empirical estimations. This allows overcoming a number of shortcomings of traditional
regression analysis in this context. We benefited from recent advancements in this
methodology by De Witte and Kortelainen (2009) yielding more robust results. We showed at
the same time that their methodology allows using conditional frontier analyses similar to
“stepwise” regression approaches.
The findings suggest that R&D subsidies are an appropriate way of stimulating regional
innovation efficiency in most industries. With the exception of the electrics and electronics
industry the technological infrastructure was found to be of comparatively lower importance.
Crowding out effects may exist but seem to be of minor relevance. When controlling for the
effects of subsidies and those of the technological infrastructure, subsidized regions still
outperform not subsidized regions. This holds even when controlling for the effects of R&D
subsidies. In general, our results are very much in line with the firm level findings of
Ebersberger and Lehtoranta (2008).
The present study has a number of shortcomings, which set the agenda for future
research. So far, our analysis is cross-sectional. R&D subsidies and the technological
infrastructure are likely to take effect on long-term development (David et al. 2000).
Moreover, the data has been aggregated at the regional level. This acknowledges that
innovations are multi-actor processes spanning firm boundaries and it corresponds to the
regional innovation system approach. It puts however a strong emphasis on the regional
dimension of innovation processes and the effects of policy measures. In how far the latter is
accurate is subject to future research.

"%!!
References
Anselin, L., Varga, A., and Acs, Z. (1997). Local Geographic Spillovers between University Research and High Technology Innovations. Journal of Urban Economics, 42(3):422–448. Audretsch, D. B., and Stephan, P. (1996). Company-scientist Locational Links: The Case of Biotechnology. American Economic Review, 86(3):641-652. Arundel, A. and Kabla, I. (1998). What Percentage of Innovations are Patented? Empirical Estimates for European Firms. Research Policy, 27(2):127–141. Bathelt, H., Malmberg, A. and Maskell, P. (2004). Clusters and Knowledge: Local Buzz, Global Pipelines and the Process of Knowledge Creation. Progress in Human Geography, 28 (1) :31-56. Beise, M. and Stahl, H. (1999). Public Research and Industrial Innovations in Germany. Research Policy, 28(4):397–422. Blanes, J. and Busom, I. (2004). Who participates in R&D Subsidy Programs? The Case of Spanish Manufacturing Firms. Research Policy, 33(10): 1459-1476. BMBF (Bundesministerium für Bildung und Forschung) (n.d.). Förderkatalog. http://www.foerderkatalog.de. BMBF (Bundesministerium für Bildung und Forschung (2008). Merkblatt für Antragsteller/Zuwendungsempfänger zur Zusammenarbeit der Partner von Verbundprojekten. http://www.kp.dlr.de/profi/easy/bmbf/pdf/0110.pdf. Bonaccorsi, A. and Daraio, C. (2005). Econometric Approaches to the Analysis of Productivity of R&D Systems. Moed, H., Glänzel, W and Schmoch, U. (Eds). Handbook of Quantitative Science and Technology Research - The Use of Publication and Patent Statistics in Studies of S&T Systems: 51–74. Kluwer Academic Publishers, New York/Boston / Dordrecht / London. Brenner, T. and Greif, S. (2006). The Dependence of Innovativeness on the Local Firm Population an Empirical Study of German Patents. Industry and Innovation, 13(1). Brenner, T. and Broekel, T. (2009).! Methodological Issues in Measuring Innovation Performance of Spatial Units. Papers in Evolutionary Economic Geography (PEEG), 0904. Broekel, T. (2007). A Concordance between Industries and Technologies - Matching the Technological Fields of the Patentatlas to the German Industry Classification. Jenaer Economic Research Papers, #2007-013. Broekel, T. (2008). From Average to the Frontier: A Nonparametric Frontier Approach to the Analysis of Externalities and Regional Innovation Performance. Papers in Evolutionary Economic Geography, 08.04. Broekel, T. and Binder, M. (2007). The Regional Dimension of Knowledge Transfers - A Behavioral Approach. Industry and Innovation, 14(2):151–175.
"&!!
Broekel, T. and Brenner, T. (2007). Measuring Regional Innovativeness - A Methodological Discussion and an Application to One German Industry. DIME Working Paper, 2007-13. Broekel, T. and Brenner, T (2009). Regional Factors and Innovativeness - An Empirical Analysis of Four German Industries. Papers in Evolutionary Economic Geography, #09.17. Broekel, T. and Meder, A. (2008). The Bright and the Dark Side of Cooperation for Regional Innovation Performance. DRUID Working Papers, 08-12. Brouwer, E., Kleinknecht, A. and Reijnen, J. (1993). Employment Growth and Innovation at the Firm-Level – An Empirical Study. Journal of Evolutionary Economics, 3(2): 153-159. Busom, I. (1999). An Empirical Evaluation of the Effects of R&D Subsidies. Burch Center Working Paper No. B99/05. Camagni, R. (1991). Local Milieu, Uncertainty and Innovation Networks: Towards a New Dynamic Theory of Economic Space. Camagni, R. (Eds). Innovation Networks: Spatial Perspectives. Belhaven Stress, London and New York. Cantwell, J. (1999). Innovation as the Principal Source of Growth in the Global Economy. Archibugi, D. and Howells, J. (Eds). Innovation Policy in a Global Economy. Cambridge: University Press: 225-241. Cassiman, B., Veugelers, R., and Zuniga, P. (2007). Science Linkages and Innovation Performance: An Analysis on CIS-3 Firms in Belgium. IESE Working Paper, No. 671. Cazals, C., Florens, J.-P., and Simar, L. (2002). Nonparametric Frontier Estimation: A Robust Approach. Journal of Econometrics, 106(1):1–25. Charnes, A., Cooper, W. and Rhodes, E. (1978). Measuring the Efficiency of Decision Making Units. European Journal of Operational Research, 2(4):429-444. Czarnitzki, D. & Hussinger, K. (2004). The Link Between R&D Subsidies, R&D Spending and Technological Performance. ZEW Discussion Papers 04-56. Czarnitzki, D., Ebersberger, B., and Fier, A. (2007). The Relationship between R&D collaboration, Subsidies and R&D Performance: Empirical Evidence from Finland and Germany. Journal of Applied Econometrics, 22(7): 1347-1366. Cockburn, I. and Henderson R. (1998). Absorptive Capacity, Coauthoring Behavior, and the Organization of Research in Drug Discovery. Journal of Industrial Economics, 46(2):157-182. Coelli, T., Prasada Rao, D. S., and Battese, G. (1998). An Introduction to Efficiency and Productivity Analysis. Kluwer Academic Publishers, New York/Boston / Dordrecht / London. Cohen, W. and Levinthal, D. (1989). Innovation and Learning: The two Faces of R&D. Economic Journal, 99(397):569–596. Cooke, P. (1992). Regional Innovation Systems: Competitive Regulation in the New Europe. GeoForum, 23:356– 382.

"'!!
Cooke, P, Uranga, M. G. and Etxebarria, G. (1997). Regional Innovation Systems: Institutional and Organisational Dimensions. Research Policy, 26(4-5):475–491. Daraio, C. and Simar, L. (2005a). Conditional Nonparametric Frontier Models for Convex and Non Convex Technologies: A Unifying Approach. LEM Working Paper Series, 12. Daraio, C. and Simar, L. (2005b). Introducing Environmental Variables in Nonparametric Frontier Models: A Probabilistic Approach. Journal of Productivity Analysis, 24(1):93–121. Eins der beiden wird zitiert Daraio, C. and Simar, L. (2007). Advanced Robust and Nonparametric Methods in Efficiency Analysis - Methodology and Applications. Kluwer Academic Publishers, New York/Boston / Dordrecht / London. David, P. A., Hall, B. H. and Toole, A. A. (2000). Is Public R&D a Complement or Substitute for Private R&D? A Review of the Econometric Evidence, Research Policy 29 (4-5): 497–529. De Witte, K. and Kortelainen, M. (2009). Blaming the Exogenous environment? Conditional efficiency Estimation with Continuous and Discrete Exogenous Variables. MPRA Paper, 14034. Ebersberger, B. and Lehtoranta, O. (2008). Effects of Public R&D Funding. VTT Working Papers, 100. Faggian, A. and McCann, P. (2006).!Human capital Flows and Regional Knowledge Assets: A Simultaneous Equation Approach. Oxford Economic Papers, 58(3):475-500. Feldman M. P. 1994. The Geography of Innovation. Kluwer Academic Publishers, New York/Boston / Dordrecht / London. Feldman, M. P. and Audretsch, D. B. (1999). Innovation in Cities: Science-based Diversity, Specialization and Localized Competition. European Economic Review, 43(2):409–429. Feldman, M. P. and Florida, R. (1994). The Geographic Sources of Innovation: Technological Infrastructure and Product Innovation in the United States. Annals of the Association of American Geographers, 84(2): 210-229. Fier, A. (2002). Staatliche Förderung industrieller Forschung in Deutschland. Eine empirische Wirkungsanalyse der direkten Projektförderung des Bundes. Nomos Verlagsgesellschaft, Baden-Baden. Fritsch, M. (2003). How and Why Does the Efficiency of Regional Innovation Systems Differ. In Bröcker, J., Dohse, D., and Soltwedel, R., (Eds.). Innovation Clusters and Interregional Competition. Springer, Berlin. Fritsch, M. and Slavtchev, V. (2007a). Universities and Innovation in Space. Industry and Innovation, 14(2):201–218. Fritsch, M. and Slavtchev, V. (2007b). What Determines the Efficiency of Regional Innovation Systems? Jenaer Economic Research Papers, 6.
"(!!
Fritsch, M., Wein, T. and Ewers, H. (2005). Marktversagen und Wirtschaftspolitik. Vahlen, München. Funke, M. and Niebuhr, A. (2005). Regional Geographic R&D Spillovers and Economic Growth: Evidence from West Germany. Regional Studies, 39(1):143–153. Goerg and Strobel (2007). The Effect of R&D Subsidies on Private R&D. Economica, 79(294): 215-234. Graf, H. (2007). Gatekeepers in Regional Networks of Innovation. Jenaer Economic Research Papers, 54. Greif, S. and Schmiedl, D. (2002). Patentatlas 2002. Dynamik und Strukturen der Erfindungstätigkeit. Deutsches Patent- und Markenamt, München. Greif, S., Schmiedl, D. and Niedermeyer, G. (2006). Patentatlas 2006. Regionaldaten der Erfindungstätigkeit. Deutsches Patent- und Markenamt, München. Greunz, L. (2004). Industrial Structure and Innovation - Evidence from European Regions. Journal of Evolutionary Economics, 14(5):563–592. Grilliches, Z. (1979). Issues in assessing the Contribution of R&D to Productivity Growth. Bell Journal of Economics 10 (1): 92-116. Haas, A. (2000). Regionale Mobilit¨at gestiegen. IAB Kurzbericht, 4/200:1–7. Hassink, R. (2002). Regional Innovation Support Systems: Recent Trends in Germany and East Asia. European Planning Studies, 10 (2):153-164. Koski, H. (2008). Public R&D Subsidies and Employment Growth – Microeconomic Evidence from Finnish Firms. Keskusteluaiheita – Discussion Paper, No. 1143. Heijs, J. (2003). Freerider Behavior and the Public Finance of R&D Activities in Enterprises: The Case of the Spanish Low Interest Credits for R&D. Research Policy, 32(3): 445-461. ISI (Fraunhofer Institut für Systemtechnik und Innovationsforschung)(2000). Regionale Verteilung der Innovations- und Technologiepotentialen in Deutschland und Europa. Endbericht an das BMBF. Fraunhofer Institut für Systemtechnik und Innovationsforschung, Karlsruhe. Jaffe, A. (1989). Real Effects of Academic Research. American Economic Review, 79(5):957–970. James, A. (2009). Reevaluating the Role of Military Research in Innovation Systems: Introduction to the Symposium. The Journal of Technology Transfer, 34(5):449-454. Laursen, K. (1998). Revealed Comparative Advantage and the Alternatives as Measures of International Specialisation. DRUID Working Papers, 98-30. Legler, H., Licht, G. and Egeln, J. (2001). Zur Technologischen Leistungsfähigkeit
")!!
Deutschlands -Zusammenfassender Endbericht 2000. Gutachten im Auftrag des Bundesministeriums für Bildung und Forschung. LexisNexis (n.d.). Firmendatenbanken. Maskell, P. (2001). The Firm in Economic Geography. Economic Geography, 77(4):329–344. Mohr, H. (2002). Räumliche Mobilität von Hochschulabsolventen. Bellmann, L. and Velling, J.(Eds). Arbeitsmärkte für Hochqualifizierte: 249–281.Institut für Arbeitsmarkt- und Berufsforschung(IAB), Nürnberg. Morgan, K. (2004). The exaggerated Death of Geography: Localized Learning, Innovation and uneven Development. Journal of Economic Geography, 4:3-21. Nicolay, R. and Wimmers, S. (2000). Kundenzufriedenheit der Unternehmen mit Forschungseinrichtungen. Deutscher Industrie- und Handelstag (DIHT), Berlin, Bonn. Pavitt, K. (1984). Sectoral Patterns of Technical Change: Towards a Taxonomy and a Theory. Research Policy, 13 (6):343-373. Pedraja-Chaparro, F., Salinas-Jimenez, J. and Smith, P. (1999). On the Quality of the Data Envelopment Analysis Model. The Journal of the Operational Research Society, 50(6):636–644. Peters, H. (2000). Wirtschaftspolitik. 3. Auflage. Oldenbourg, München. RWI (Rheinisch-Westfälisches Institut für Wirtschaftsforschung) (2005). Beschäftigungswirkung von Forschung und Innovation. Forschungsvorhaben im Auftrag des Bundesministeriums für Wirtschaft und Arbeit. Endbericht. Kurzfassung. Schmoch, U., Laville, F., Patel, P. and Frietsch, R. (2003). Linking Technology Areas to Industrial Sectors. Forschungsbericht, Fraunhofer ISI. Soete, B., Wurzel, U. and Drewllo, H. (2002). Innovationsnetzwerke in Ostdeutschland: Ein noch zu wenig genutztes Potential zur regionalen Humankapitalbildung. DIW-Wochenbericht, 16/02. Spielkamp, A. and Vopel, K. (1998). Mapping Innovative Clusters in National Innovation Systems. ZEW Discussion Papers, 98-45. van der Panne, G. and van Beers, C. (2006). On the Marshall-Jacobs Controversy: It Takes Two to Tango. Industrial and Corporate Change Advance Access. Industrial and Corporate Change, 15(5):877-890. Weibert, W. (1999). Regionale Determinanten der Innovation. Nomos Verlagsgesellschaft, Baden-Baden. Zucker, L., Darby, M. and Armstrong J. (2002). Commercializing Knowledge: University Science, Knowledge Capture, and Firm Performance in Biotechnology. Management Science. 48(1):138-153.
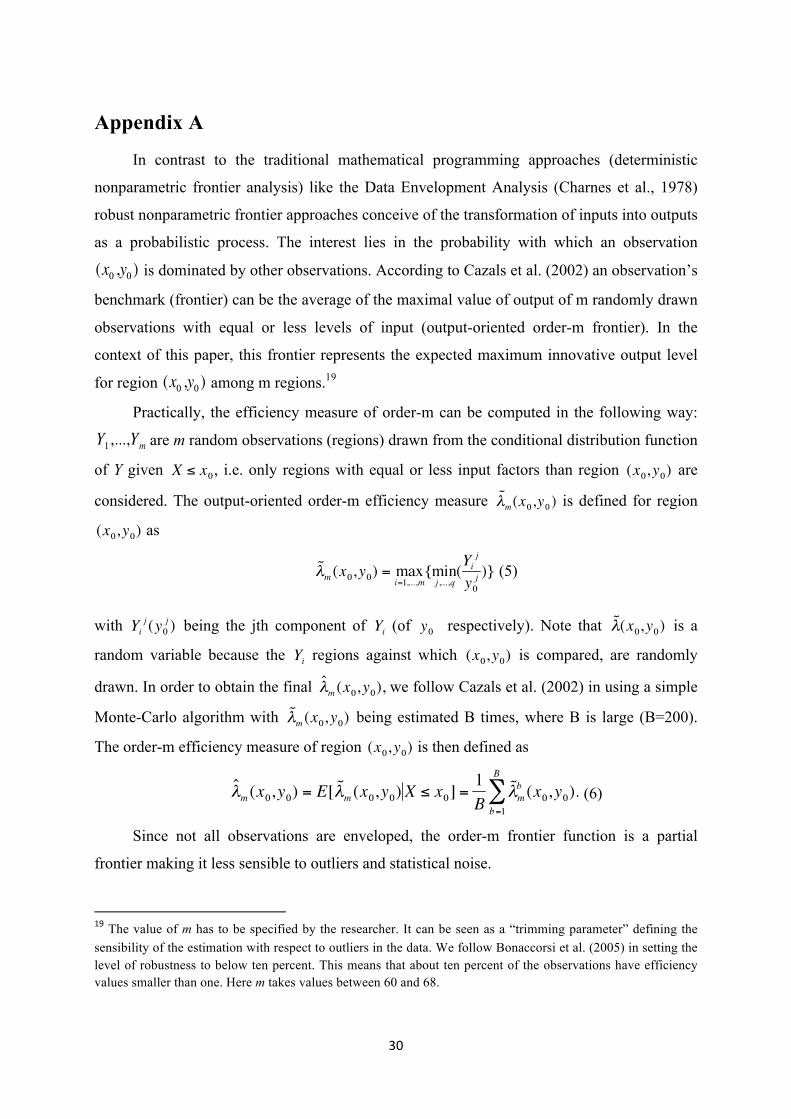
#+!!
Appendix A
In contrast to the traditional mathematical programming approaches (deterministic
nonparametric frontier analysis) like the Data Envelopment Analysis (Charnes et al., 1978)
robust nonparametric frontier approaches conceive of the transformation of inputs into outputs
as a probabilistic process. The interest lies in the probability with which an observation
is dominated by other observations. According to Cazals et al. (2002) an observation’s
benchmark (frontier) can be the average of the maximal value of output of m randomly drawn
observations with equal or less levels of input (output-oriented order-m frontier). In the
context of this paper, this frontier represents the expected maximum innovative output level
for region among m regions.19
Practically, the efficiency measure of order-m can be computed in the following way:
are m random observations (regions) drawn from the conditional distribution function
of Y given , i.e. only regions with equal or less input factors than region are
considered. The output-oriented order-m efficiency measure is defined for region
as
(5)
with being the jth component of (of respectively). Note that is a
random variable because the regions against which is compared, are randomly
drawn. In order to obtain the final we follow Cazals et al. (2002) in using a simple
Monte-Carlo algorithm with being estimated B times, where B is large (B=200).
The order-m efficiency measure of region is then defined as
(6)
Since not all observations are enveloped, the order-m frontier function is a partial
frontier making it less sensible to outliers and statistical noise.
!!!!!!!!!!!!!!!!!!!!!!!!!!!!!!!!!!!!!!!!!!!!!!!!!!!!!!!!!!!!!*)!The value of m has to be specified by the researcher. It can be seen as a “trimming parameter” defining the sensibility of the estimation with respect to outliers in the data. We follow Bonaccorsi et al. (2005) in setting the level of robustness to below ten percent. This means that about ten percent of the observations have efficiency values smaller than one. Here m takes values between 60 and 68.!

#*!!
In order to analyze external factors that may determine the order-m efficiency measure
, Daraio and Simar (2007) propose to estimate a second, a conditional order-m
efficiency measure. In this case regions are not compared to m randomly drawn regions. The
drawing is instead conditional on one or more external factors z. The probably that a region is
drawn depends negatively on the difference between its value of external factors and that of
the region under consideration. The probability can be estimated using the generalized
multivariate kernel function specified in De Witte and Kortelainen (2009). The appropriate
bandwidth is chosen according to their data-driven bandwidth selection procedure.
The output-oriented conditional order-m efficiency measure is defined for
region as
. (8)
Similar to the unconditional
!
ˆ " m(x0,y0 ),
!
ˆ " cm(x0,y0 ) can be estimated with the above
Monto-Carlo algorithm or by solving an integral (see De Witte and Kortelainen, 2009). With
the two efficiency measures at hand Qz can be estimated as the ratio between conditional and
unconditional measure.
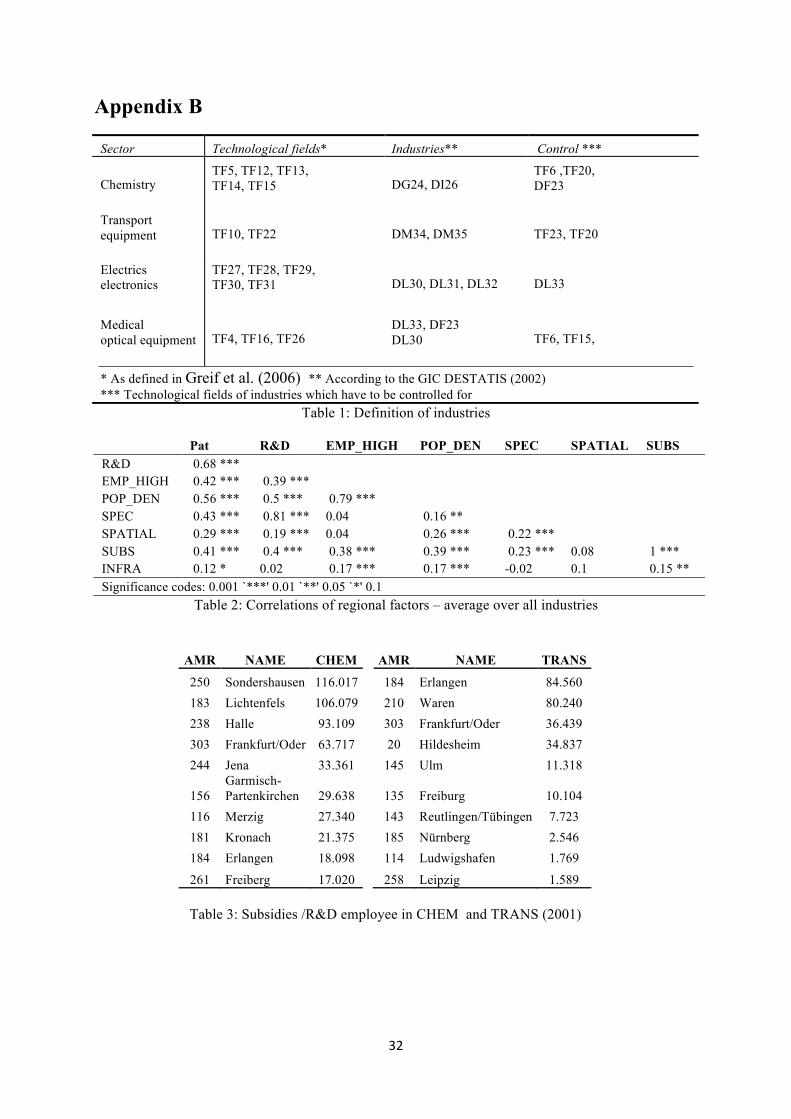
#"!!
Appendix B
Sector Technological fields* Industries** Control ***
Chemistry TF5, TF12, TF13, TF14, TF15 DG24, DI26
TF6 ,TF20, DF23
Transport equipment TF10, TF22 DM34, DM35 TF23, TF20
Electrics electronics
TF27, TF28, TF29, TF30, TF31 DL30, DL31, DL32 DL33
Medical optical equipment TF4, TF16, TF26
DL33, DF23 DL30 TF6, TF15,
* As defined in Greif et al. (2006) ** According to the GIC DESTATIS (2002) *** Technological fields of industries which have to be controlled for
Table 1: Definition of industries
Table 2: Correlations of regional factors – average over all industries
AMR NAME CHEM ! AMR NAME TRANS
250 Sondershausen 116.017 ! 184 Erlangen 84.560 183 Lichtenfels 106.079 ! 210 Waren 80.240 238 Halle 93.109 ! 303 Frankfurt/Oder 36.439 303 Frankfurt/Oder 63.717 ! 20 Hildesheim 34.837 244 Jena 33.361 ! 145 Ulm 11.318
156 Garmisch-Partenkirchen 29.638 ! 135 Freiburg 10.104
116 Merzig 27.340 ! 143 Reutlingen/Tübingen 7.723 181 Kronach 21.375 ! 185 Nürnberg 2.546 184 Erlangen 18.098 ! 114 Ludwigshafen 1.769
261 Freiberg 17.020 ! 258 Leipzig 1.589
Table 3: Subsidies /R&D employee in CHEM and TRANS (2001)
Pat R&D EMP_HIGH POP_DEN SPEC SPATIAL SUBS R&D 0.68 *** EMP_HIGH 0.42 *** 0.39 *** POP_DEN 0.56 *** 0.5 *** 0.79 *** SPEC 0.43 *** 0.81 *** 0.04 0.16 ** SPATIAL 0.29 *** 0.19 *** 0.04 0.26 *** 0.22 *** SUBS 0.41 *** 0.4 *** 0.38 *** 0.39 *** 0.23 *** 0.08 1 *** INFRA 0.12 * 0.02 0.17 *** 0.17 *** -0.02 0.1 0.15 ** Significance codes: 0.001 `***' 0.01 `**' 0.05 `*' 0.1
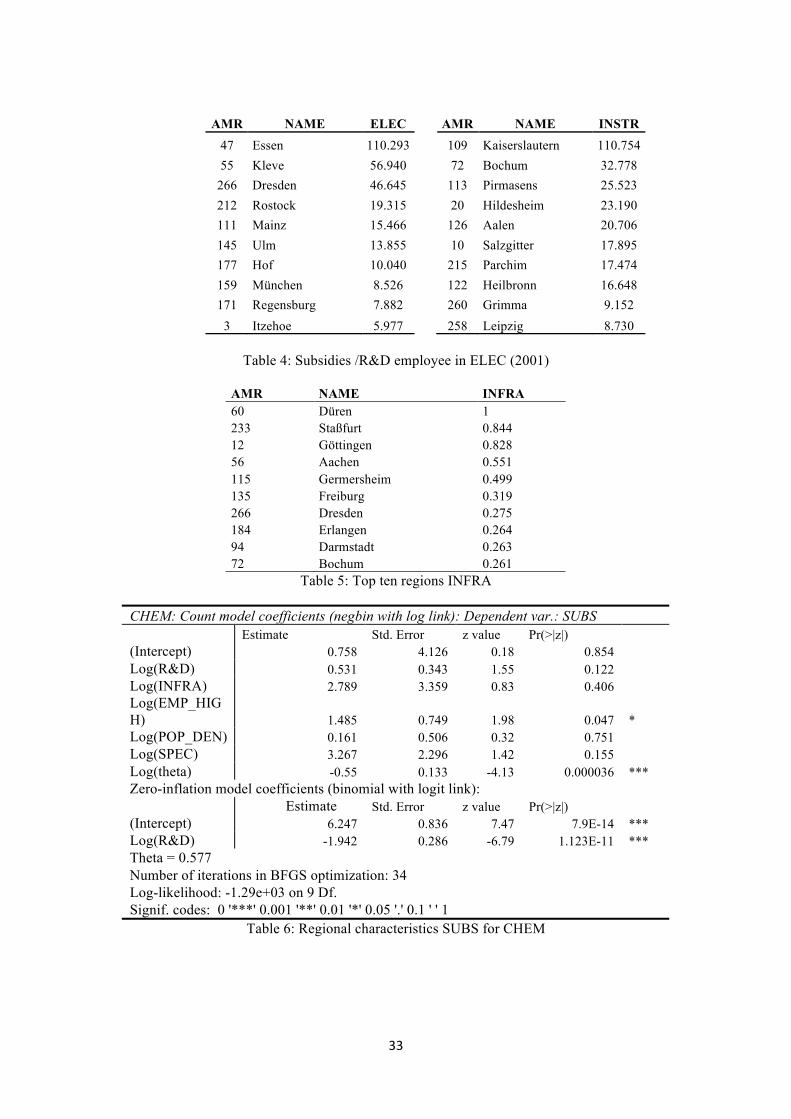
##!!
AMR NAME ELEC ! AMR NAME INSTR
47 Essen 110.293 ! 109 Kaiserslautern 110.754 55 Kleve 56.940 ! 72 Bochum 32.778
266 Dresden 46.645 ! 113 Pirmasens 25.523 212 Rostock 19.315 ! 20 Hildesheim 23.190 111 Mainz 15.466 ! 126 Aalen 20.706 145 Ulm 13.855 ! 10 Salzgitter 17.895 177 Hof 10.040 ! 215 Parchim 17.474 159 München 8.526 ! 122 Heilbronn 16.648 171 Regensburg 7.882 ! 260 Grimma 9.152
3 Itzehoe 5.977 ! 258 Leipzig 8.730
Table 4: Subsidies /R&D employee in ELEC (2001)
AMR NAME INFRA 60 Düren 1 233 Staßfurt 0.844 12 Göttingen 0.828 56 Aachen 0.551 115 Germersheim 0.499 135 Freiburg 0.319 266 Dresden 0.275 184 Erlangen 0.264 94 Darmstadt 0.263 72 Bochum 0.261
Table 5: Top ten regions INFRA
CHEM: Count model coefficients (negbin with log link): Dependent var.: SUBS Estimate Std. Error z value Pr(>|z|) (Intercept) 0.758 4.126 0.18 0.854 Log(R&D) 0.531 0.343 1.55 0.122 Log(INFRA) 2.789 3.359 0.83 0.406 Log(EMP_HIGH) 1.485 0.749 1.98 0.047 * Log(POP_DEN) 0.161 0.506 0.32 0.751 Log(SPEC) 3.267 2.296 1.42 0.155 Log(theta) -0.55 0.133 -4.13 0.000036 *** Zero-inflation model coefficients (binomial with logit link): Estimate Std. Error z value Pr(>|z|) (Intercept) 6.247 0.836 7.47 7.9E-14 *** Log(R&D) -1.942 0.286 -6.79 1.123E-11 *** Theta = 0.577 Number of iterations in BFGS optimization: 34 Log-likelihood: -1.29e+03 on 9 Df. Signif. codes: 0 '***' 0.001 '**' 0.01 '*' 0.05 '.' 0.1 ' ' 1
Table 6: Regional characteristics SUBS for CHEM

#$!!
TRANS: Count model coefficients (negbin with log link): Estimate Std. Error z value Pr(>|z|) (Intercept) 0.589 9.530 0.062 0.950 Log(R&D) 0.611 0.528 1.156 0.247 Log(INFRA) 8.343 7.599 1.098 0.272 Log(EMP_HIGH) 2.753 1.357 2.028 0.042 * Log(POP_DEN) -0.979 0.908 -1.078 0.280 Log(SPEC) -0.306 3.068 -0.1 0.920 Log(theta) -0.528 0.169 -3.114 0.001 ** Zero-inflation model coefficients (binomial with logit link): Estimate Std. Error z value Pr(>|z|) (Intercept) 7.002 0.956 7.325 0.000 *** Log(R&D) -1.721 0.267 -6.439 0.000 *** Theta = 0.5893 Number of iterations in BFGS optimization: 21 Log-likelihood: -805.2 on 9 Df. Signif. codes: 0 '***' 0.001 '**' 0.01 '*' 0.05 '.' 0.1 ' ' 1
Table 7: Regional characteristics SUBS for TRANS
ELEC: Count model coefficients (negbin with log link): Dependent var.: SUBS Estimate Std. Error z value Pr(>|z|) (Intercept) -18.553 5.894 -3.150 0.002 ** Log(R&D) 0.055 0.493 0.110 0.911 Log(INFRA) 10.083 6.129 1.650 0.100 . Log(EMP_HIGH) -0.271 1.046 -0.260 0.796 Log(POP_DEN) 2.562 0.513 5.000 0.000 *** Log(SPEC) 9.935 3.775 2.630 0.009 ** Log(theta) -0.635 0.132 -4.830 0.000 *** Zero-inflation model coefficients (binomial with logit link): Estimate Std. Error z value Pr(>|z|) (Intercept) 5.988 0.860 6.960 0.000 *** Log(R&D) -1.537 0.241 -6.380 0.000 *** Theta = 0.53 Number of iterations in BFGS optimization: 36 Log-likelihood: -1.37e+03 on 9 Df. Signif. codes: 0 '***' 0.001 '**' 0.01 '*' 0.05 '.' 0.1 ' ' 1
Table 8: Regional characteristics of SUBS in ELEC

#%!!
INSTR: Count model coefficients (negbin with log link): Estimate Std. Error z value Pr(>|z|) (Intercept) -3.764 5.641 -0.667 0.505 Log(R&D) 0.125 0.454 0.275 0.784 Log(INFRA) 4.978 4.462 1.116 0.265 Log(EMP_HIGH) -0.824 0.871 -0.947 0.344 Log(POP_DEN) 1.004 0.663 1.514 0.130 Log(SPEC) 7.238 3.810 1.900 0.057 . Log(theta) -0.496 0.131 -3.786 0.000 *** Zero-inflation model coefficients (binomial with logit link): Estimate Std. Error z value Pr(>|z|) (Intercept) 6.151 0.794 7.743 0.000 *** Log(R&D) -1.827 0.252 -7.242 0.000 *** Theta = 0.6089 Number of iterations in BFGS optimization: 37 Log-likelihood: -1314 on 9 Df. Signif. codes: 0 '***' 0.001 '**' 0.01 '*' 0.05 '.' 0.1 ' ' 1
Table 9: Regional characteristics SUBS for INSTR
Dependent var.: INFRA Estimate Std. Error z value Pr(>|z|) (Intercept) -3.761 0.167 -22.501 < 2.2e-16 CHEM R&D -0.000 0.000 -1.622 0.105 TRANS R&D -0.000 0.000 -0.237 0.813 ELEC R&D 0.000 0.000 1.127 0.260 INSTR R&D -0.000 0.000 -1.021 0.307 EMP_HIGH 0.039 0.014 2.765 0.006 POP_DEN 0.000 0.000 -1.322 0.186 Lambda: 84.75 LR test value: 0.66434 p-value: 0.41503 Log likelihood: -487.906 ML residual variance (sigma squared): 2.1697, (sigma: 1.473) Number of observations: 270 Number of parameters estimated: 9 AIC: 993.81
Table 10: Regional characteristics INFRA
1999 2000 2001 2002 2003 SUBS* INFRA# SUBS INFRA SUBS INFRA SUBS INFRA SUBS INFRA
0.426 0.581 0.188 0.187 0.321 CHEM (0.068) (0.744) (0.100) (1.000) (0.316) (0.265) (0.057) (0.338) (0.059) (0.250) 0.512 0.187 0.289 -0.188 0.428 TRANS
(0.079) (0.934) (0.521) (0.410) (0.563) (0.638) (0.303) (0.432) (0.174) (0.312) 0.084 + 0.095 + 0.015 + 0.144 + 0.217 + ELEC
(0.248) (0.007) (0.154) (0.001) (0.129) (0.000) (0.433) (0.001) (0.055) (0.052) 0.149 0.264 0.157 0.341 + 0.355 + INSTR
(0.272) (0.740) (0.002) (0.180) (0.128) (0.190) (0.000) (0.036) (0.000) (0.066) * Median difference between Qz. P-values are based on conditional order-m analysis and given in parentheses. # (+) indicates positive and (-) a negative relationship
Table 11: Relationship between policy and innovation performance

#&!!
1999 2000 2001 2002 2003 SUBS* SUBS SUBS SUBS SUBS
1.311 0.562 1.0388 0.614 0.140 CHEM (0.003) (0.048) (0.001) (0.025) (0.138) 2.143 1.364 1.134 0.814 0.646 TRANS
(0.001) (0.001) (0.005) (0.028) (0.074) 0.703 1.116 0.557 0.625 0.484 ELEC
(0.007) (0.001) (0.118) (0.016) (0.059) 1.345 0.613 0.734 0.874 0.318 INSTR
(0.000) (0.011) (0.007) (0.005) (0.188) * Median differences between conditional efficiency scores for not subsidized and subsidized regions. P-values of Wilcoxon rank sum test in parentheses. Bold numbers mark cases in which SUBS is significantly related to innovation efficiency, see Table 11.
Table 12: Median differences conditional innovation performance
,-./01!*2!3445678-54!199-:-14:;!74<!=5>-:;!?17@/01@!ABAC

#'!!
,-./01!"2!3445678-54!199-:-14:;!74<!=5>-:;!?17@/01@!3DEFG