Embed Size (px)
Citation preview
Paper No.CAP22
NIGIS * CORCON 2018 * 30 September- 3 October * Jaipur, IndiaAll the rights belong to the author(s). The material presented and the views expressed are solely those of the author(s).
NIGIS does not own the copyright of any information presented in this paper and is not responsible for any action arising out of this publication.
CP Interference Challenges & Control - A Case Study
Shakeel Isak Girkar
ADNOC Onshore, Abu Dhabi, United Arab Emirates
Renjith Vijayan Mangattu and Mario Jr Javier Zantua
ADNOC Onshore, Abu Dhabi, United Arab Emirates
ABSTRACT
One of the leading Middle East Oil Operator has total 60 Pipelines and 3000 Wellcasings. All buried structures are externally protected against soil-side corrosion withCoating and CP.
Corrosion and subsequent failure, particularly on pipelines/well casings is one of the mainfactors upsetting any upstream/downstream production facilities. Maintaining adequatelevel of CP system is always a challenge for corrosion engineers due to complex corrosionphenomena. Failure of these pipelines/well casings during production stage due tocorrosion can be catastrophic with following consequences:
· Loss of life (fatality)· Safety and Environment (Fire, Toxic gases and Oil Spill)· Resource and downtime cost impact· Damage to asset/company reputation.
As per current industrial practice, the buried structures are designed to be protectedexternally by coating wherever possible along with ICCP system. However, the CPeffectiveness often becomes challenging due to the CP interference caused by Groundbeds and other structures since adequate separating distance cannot be maintainedpractically due to the field congestion.
This paper focuses on case study of a Ground bed in the vicinity of a crude buried pipeline,CP interference during CP effectiveness evaluation, Interference tests, possible corrosionand damage mechanism and also strategy for remedial measures like Shielding to nullifythe Interference effect along with recommendations.
Keywords:Corrosion, Interference, Damage Mechanism, Coating, Cathodic Protection (CP), Shielding,Ground bed, Pipeline, Well Casings.
NIGIS * CORCON 2018 * 30 September- 3 October * Jaipur, IndiaAll the rights belong to the author(s). The material presented and the views expressed are solely those of the author(s).
NIGIS does not own the copyright of any information presented in this paper and is not responsible for any action arising out of this publication.
1 INTRODUCTION
The operating company is involved in exploration and production of crude oil in Gulfregion with many oil fields/assets in the country. One of the company assets consists ofone Central Degassing Station (CDS) and five Remote Degassing Stations (RDS). CDS isdirectly connected to oil wells with a network of oil flow lines and RDSs through transferlines. Likewise, RDSs are also connected with oil produced wells with surface laid flow lines.In the subject asset, the company has around 900 production/injection wells which areprotected with impressed current cathodic protection system and conventional deep wellground beds.
The transfer lines are electrically isolated from plant structures/manifold, electricaland instrument earthing system by providing monolithic isolating joints at both upstreamand downstream of each transfer pipelines. The IJs are not only meant for electricalisolation but also limit applied cathodic protection current within the intended undergroundpipeline portion. However, it is not practically possible to provide 100% electrical isolationdue to the presence of conductive fluids within the crude oil being transported through thepipelines. Practice of providing jumper to avoid internal stray current interference was notconsidered in the past for these IJs, which has become the necessity with increase in watercut along with the maturity of the fields.
Surface laid bare oil flow lines have monolithic isolating joint at well side. Since theflow lines contain conductive fluid, Company decided to bond the same with well headcathodic protection system and in the process allowing maximum 0.5A leakage current toflow lines to avoid internal jumping of stray current across IJs.
The term “interference” is understood in the pipeline industry as electricalinterference and is defined as “any detectable electrical disturbance on a structure causedby a stray current where a ‘stray current’ is defined as a current in an unintended path”.This broad definition suggests that the structure, although often a pipeline, could be anymetallic network such as electrical power grids and communication systems. Furthermore,although the interfering current is often a direct current (DC) from a cathodic protection(CP)impressed current source, the current can also originate from any electrical systemthat uses the earth either intentionally or inadvertently as a current path. Thus alternatingcurrent (AC) can also be included in the definition.
Drilling of new wells and implementation of CP system becomes often challengingto the corrosion professionals due to crowding of various protected structures in samevicinity. This case study explains two different interference scenarios faced by the companydue to drilling of new oil wells, namely Well A and Well B, and adopted mitigation methodsalong with discussion of results.
NIGIS * CORCON 2018 * 30 September- 3 October * Jaipur, IndiaAll the rights belong to the author(s). The material presented and the views expressed are solely those of the author(s).
NIGIS does not own the copyright of any information presented in this paper and is not responsible for any action arising out of this publication.
2 SYSTEM DESCRIPTION
2.1 Case A
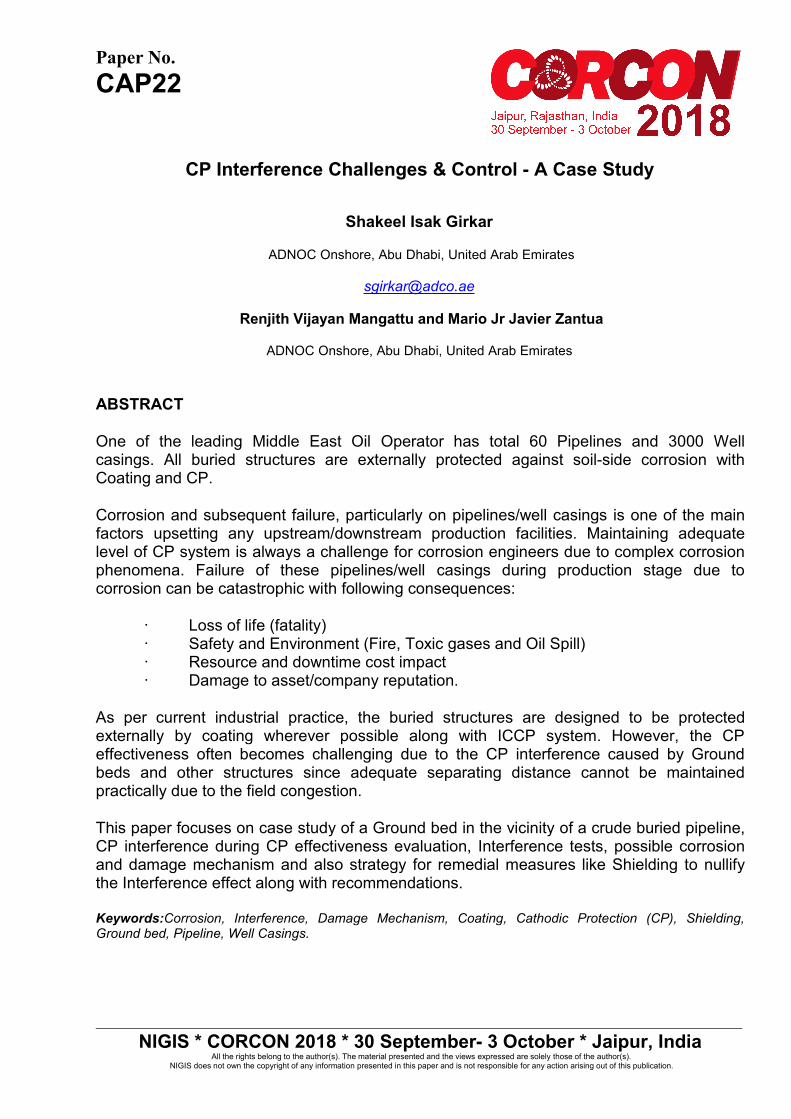
Oil producer well ‘A’ (8500 feet depth) was drilled near (approx.. 150 mtr away) toexisting 16” Gas line as per company’s development plan. However, the CP system groundbed is installed only 40mtr away from the gas line due to heavy metallic congestion in theopposite side. Actual site condition is illustrated in Figure (1)
Figure 1: Well ‘A’ and its CP system Configuration in the vicinity of the buried Gas line2.2 Case B
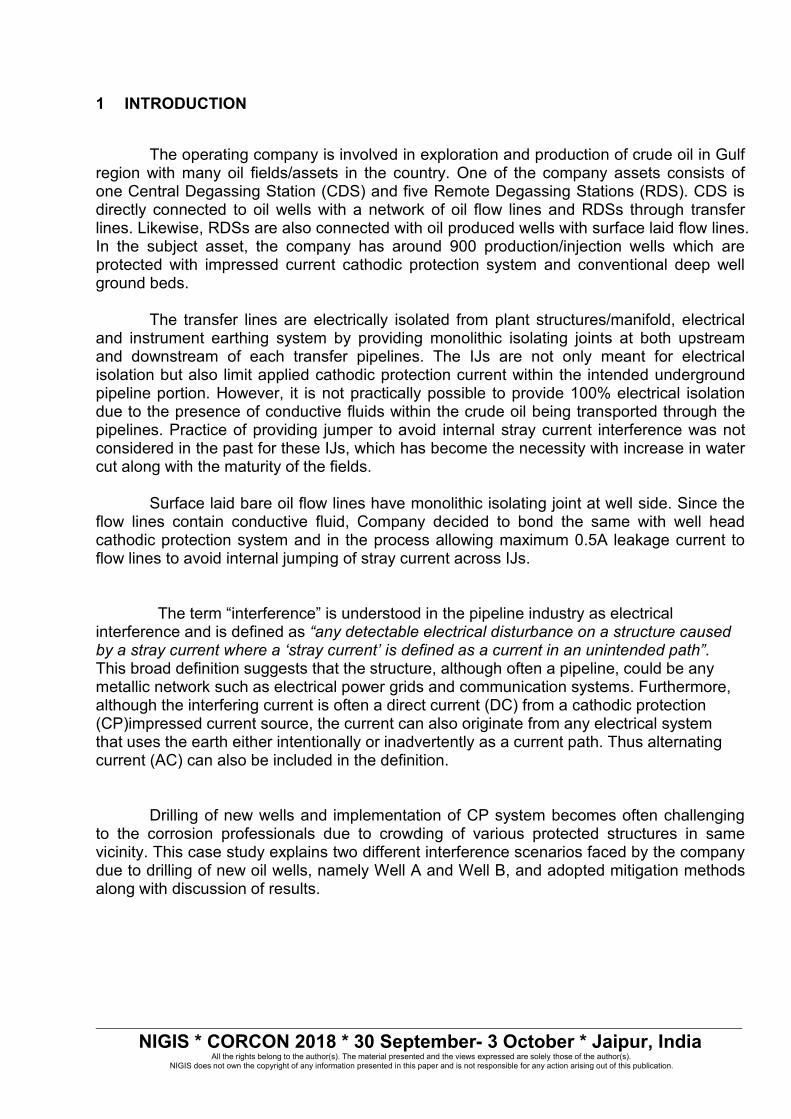
Well ‘B’ (6500 feet depth) was drilled near (approx. 60 mtr away) to existing 10”Gas line as per company’s development plan. However, the CP system ground bed isinstalled only 35 mtr away from the gas line due to heavy metallic congestion in theopposite side. Actual site condition is reproduced here in Figure (2)
Figure 2: Well ‘B’ and its CP system Configuration in the vicinity of buried Gas lineCompany has anticipated DC interference in both cases and decided to have detail
investigation and implementation of possible best mitigation techniques to alleviate theeffects.
NIGIS * CORCON 2018 * 30 September- 3 October * Jaipur, IndiaAll the rights belong to the author(s). The material presented and the views expressed are solely those of the author(s).
NIGIS does not own the copyright of any information presented in this paper and is not responsible for any action arising out of this publication.
3. THE PROBLEM AND ITS CONSEQUENCES
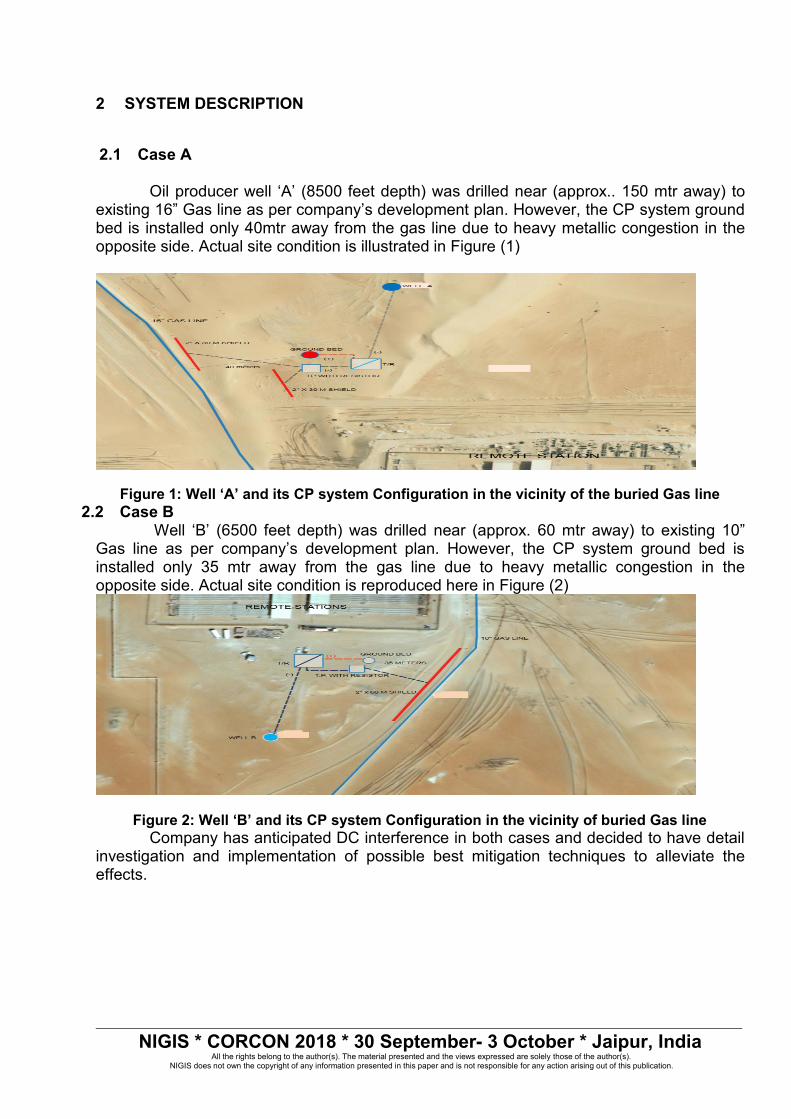
Figure 2-1 illustrates the typical stray current situation on an underground metallic structurethat is not electrically connected to the source of stray current. The stray current patternconsists of a pick-up of stray current from the earth at one or more locations and thesubsequent discharge of stray current to the earth at one or more locations.
Figure 2-1: Typical Stray Current Interference on a Metallic Underground Structure
The principal charge carriers in the earth are ions. They are electrons in themetallic structure. For these reasons, electrochemical reactions must transfer thecharge between the structure and earth at both the pick-up and discharge locations.
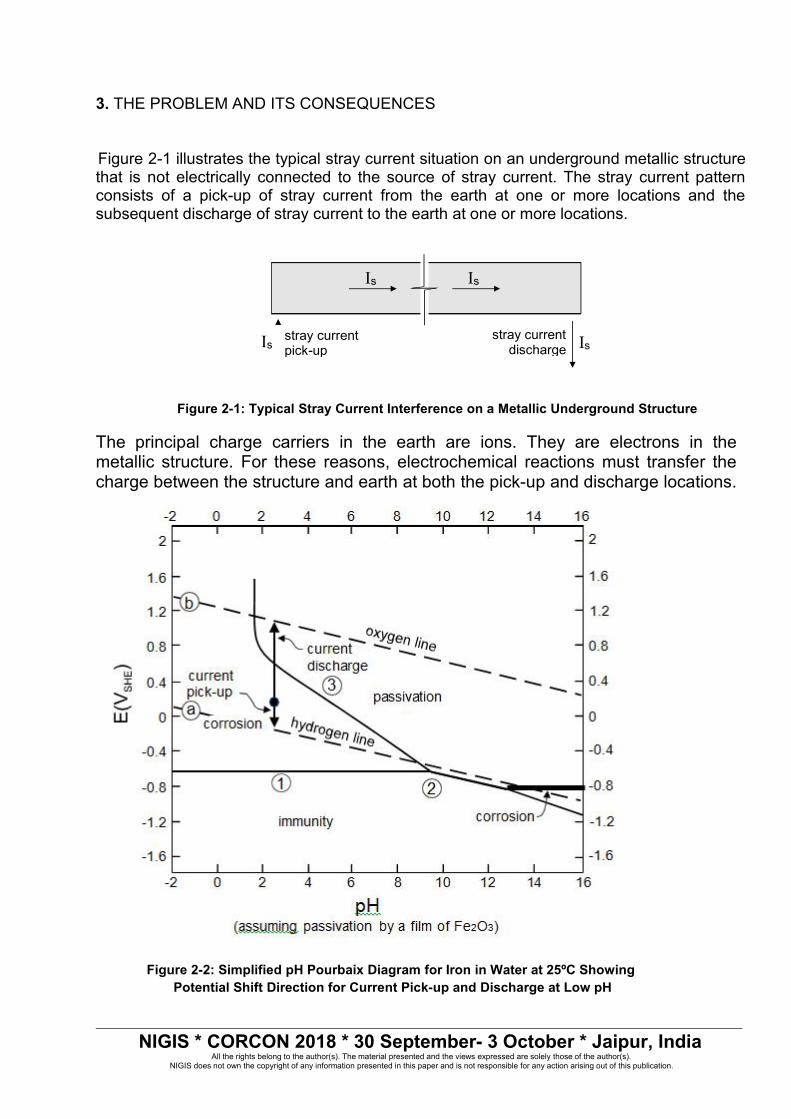
Figure 2-2: Simplified pH Pourbaix Diagram for Iron in Water at 25ºC ShowingPotential Shift Direction for Current Pick-up and Discharge at Low pH
Is Is
Is stray currentpick-up
stray currentdischarge Is
NIGIS * CORCON 2018 * 30 September- 3 October * Jaipur, IndiaAll the rights belong to the author(s). The material presented and the views expressed are solely those of the author(s).
NIGIS does not own the copyright of any information presented in this paper and is not responsible for any action arising out of this publication.
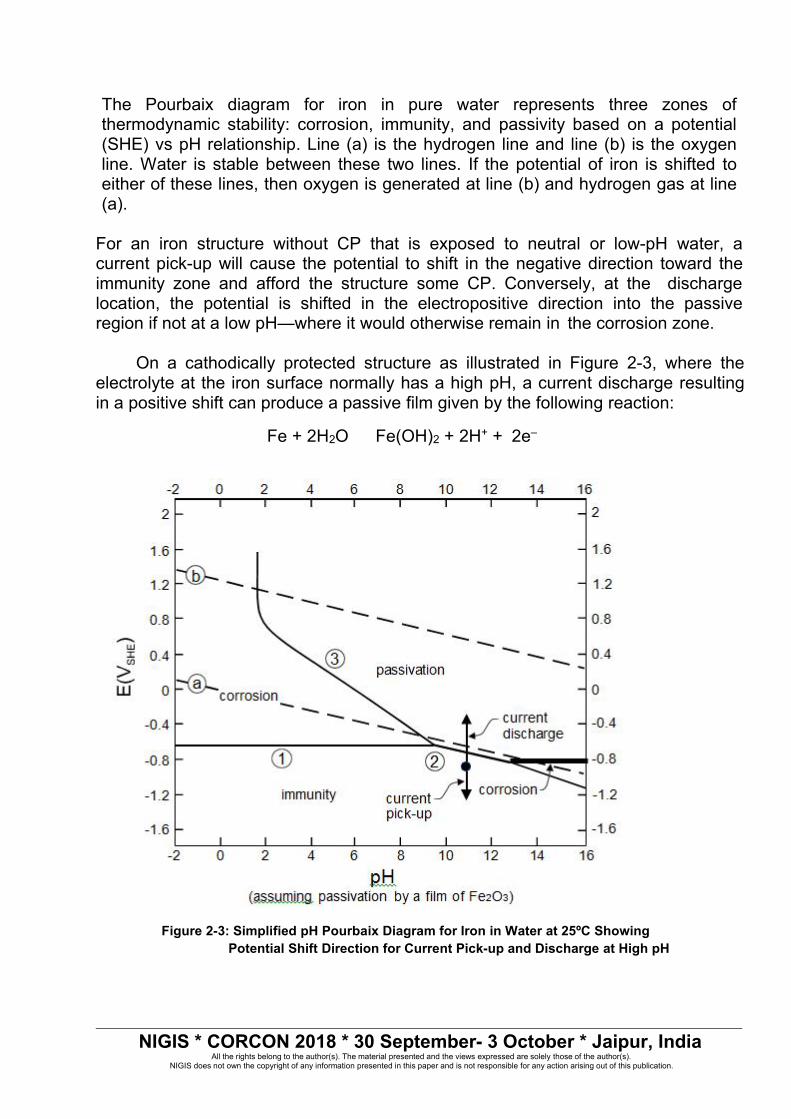
The Pourbaix diagram for iron in pure water represents three zones ofthermodynamic stability: corrosion, immunity, and passivity based on a potential(SHE) vs pH relationship. Line (a) is the hydrogen line and line (b) is the oxygenline. Water is stable between these two lines. If the potential of iron is shifted toeither of these lines, then oxygen is generated at line (b) and hydrogen gas at line(a).
For an iron structure without CP that is exposed to neutral or low-pH water, acurrent pick-up will cause the potential to shift in the negative direction toward theimmunity zone and afford the structure some CP. Conversely, at the dischargelocation, the potential is shifted in the electropositive direction into the passiveregion if not at a low pH—where it would otherwise remain in the corrosion zone.
On a cathodically protected structure as illustrated in Figure 2-3, where theelectrolyte at the iron surface normally has a high pH, a current discharge resultingin a positive shift can produce a passive film given by the following reaction:
Fe + 2H2O Fe(OH)2 + 2H+ + 2e–
Figure 2-3: Simplified pH Pourbaix Diagram for Iron in Water at 25ºC ShowingPotential Shift Direction for Current Pick-up and Discharge at High pH
NIGIS * CORCON 2018 * 30 September- 3 October * Jaipur, IndiaAll the rights belong to the author(s). The material presented and the views expressed are solely those of the author(s).
NIGIS does not own the copyright of any information presented in this paper and is not responsible for any action arising out of this publication.
The ferrous hydroxide formed is relatively stable at high pH. Because this reactionalso produces hydrogen ions, the pH will decrease with time.
It is apparent that the effect of a stray current pick-up and a stray currentdischarge from an iron structure from a thermodynamic perspective can causecorrosion, passivation, or immunity, depending upon the direction of current and thepH of the aqueous electrolyte at the charge transfer location.
3.1 AT THE CURRENT DISCHARGE LOCATION
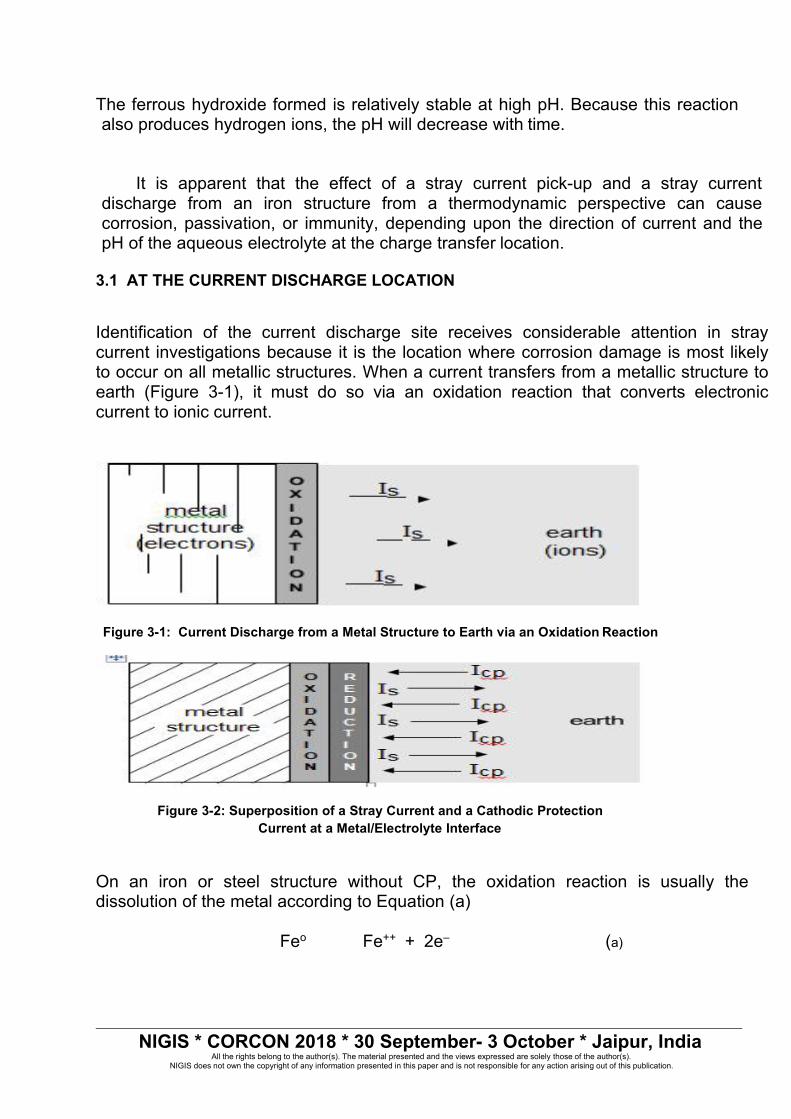
Identification of the current discharge site receives considerable attention in straycurrent investigations because it is the location where corrosion damage is most likelyto occur on all metallic structures. When a current transfers from a metallic structure toearth (Figure 3-1), it must do so via an oxidation reaction that converts electroniccurrent to ionic current.
Figure 3-1: Current Discharge from a Metal Structure to Earth via an Oxidation Reaction
Figure 3-2: Superposition of a Stray Current and a Cathodic ProtectionCurrent at a Metal/Electrolyte Interface
On an iron or steel structure without CP, the oxidation reaction is usually thedissolution of the metal according to Equation (a)
Feo Fe++ + 2e– (a)
NIGIS * CORCON 2018 * 30 September- 3 October * Jaipur, IndiaAll the rights belong to the author(s). The material presented and the views expressed are solely those of the author(s).
NIGIS does not own the copyright of any information presented in this paper and is not responsible for any action arising out of this publication.
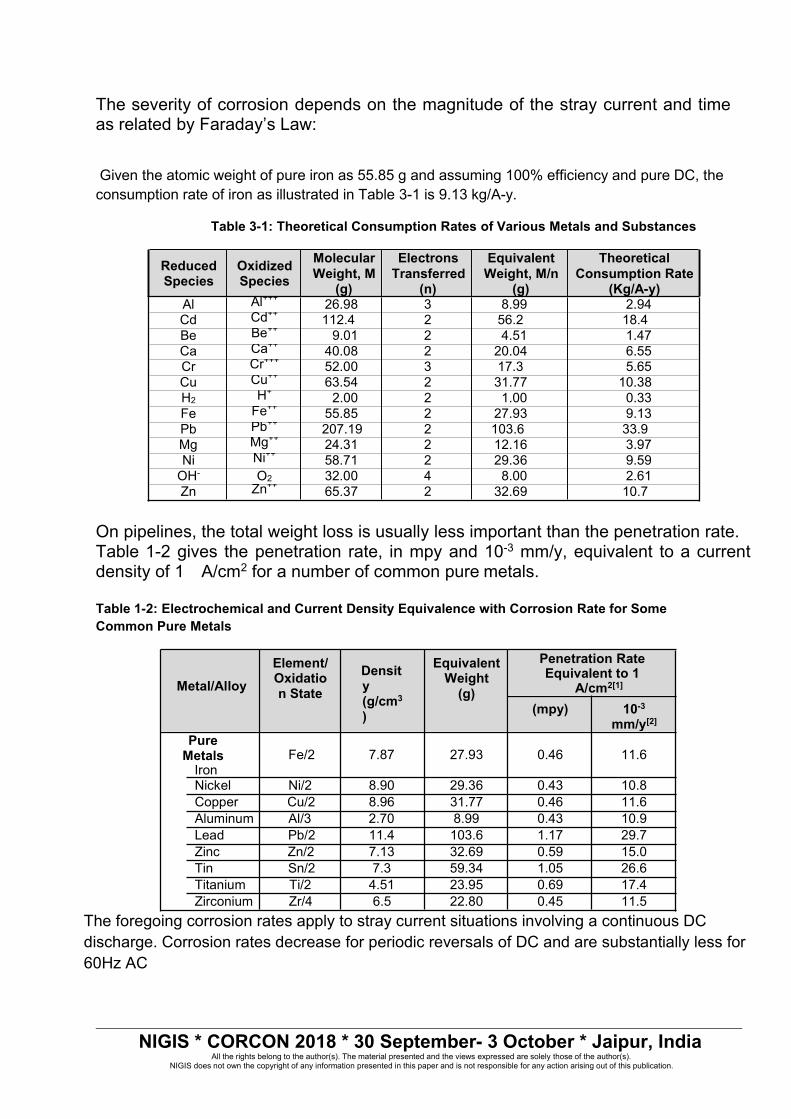
The severity of corrosion depends on the magnitude of the stray current and timeas related by Faraday’s Law:
Given the atomic weight of pure iron as 55.85 g and assuming 100% efficiency and pure DC, theconsumption rate of iron as illustrated in Table 3-1 is 9.13 kg/A-y.
Table 3-1: Theoretical Consumption Rates of Various Metals and Substances
ReducedSpecies
OxidizedSpecies
MolecularWeight, M
(g)
ElectronsTransferred
(n)
EquivalentWeight, M/n
(g)
TheoreticalConsumption Rate
(Kg/A-y)Al Al+++ 26.98 3 8.99 2.94Cd Cd++ 112.4 2 56.2 18.4Be Be++ 9.01 2 4.51 1.47Ca Ca++ 40.08 2 20.04 6.55Cr Cr+++ 52.00 3 17.3 5.65Cu Cu++ 63.54 2 31.77 10.38H2 H+ 2.00 2 1.00 0.33Fe Fe++ 55.85 2 27.93 9.13Pb Pb++ 207.19 2 103.6 33.9Mg Mg++ 24.31 2 12.16 3.97Ni Ni++ 58.71 2 29.36 9.59OH- O2 32.00 4 8.00 2.61Zn Zn++ 65.37 2 32.69 10.7
On pipelines, the total weight loss is usually less important than the penetration rate.Table 1-2 gives the penetration rate, in mpy and 10-3 mm/y, equivalent to a currentdensity of 1 A/cm2 for a number of common pure metals.
Table 1-2: Electrochemical and Current Density Equivalence with Corrosion Rate for SomeCommon Pure Metals
Metal/AlloyElement/Oxidation State
Density(g/cm3
)
EquivalentWeight(g)
Penetration RateEquivalent to 1
A/cm2[1]
(mpy) 10-3mm/y[2]
PureMetalsIron
Fe/2 7.87 27.93 0.46 11.6
Nickel Ni/2 8.90 29.36 0.43 10.8Copper Cu/2 8.96 31.77 0.46 11.6Aluminum Al/3 2.70 8.99 0.43 10.9Lead Pb/2 11.4 103.6 1.17 29.7Zinc Zn/2 7.13 32.69 0.59 15.0Tin Sn/2 7.3 59.34 1.05 26.6Titanium Ti/2 4.51 23.95 0.69 17.4Zirconium Zr/4 6.5 22.80 0.45 11.5
The foregoing corrosion rates apply to stray current situations involving a continuous DCdischarge. Corrosion rates decrease for periodic reversals of DC and are substantially less for60Hz AC
NIGIS * CORCON 2018 * 30 September- 3 October * Jaipur, IndiaAll the rights belong to the author(s). The material presented and the views expressed are solely those of the author(s).
NIGIS does not own the copyright of any information presented in this paper and is not responsible for any action arising out of this publication.
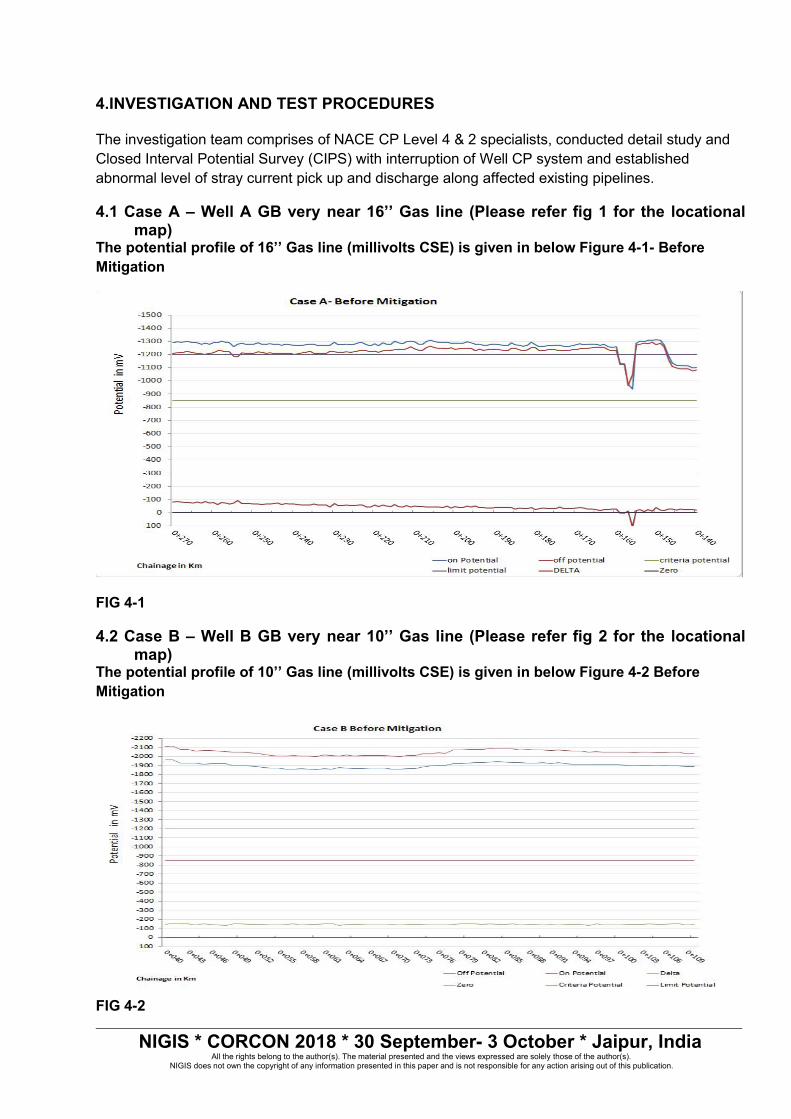
4.INVESTIGATION AND TEST PROCEDURES
The investigation team comprises of NACE CP Level 4 & 2 specialists, conducted detail study andClosed Interval Potential Survey (CIPS) with interruption of Well CP system and establishedabnormal level of stray current pick up and discharge along affected existing pipelines.
4.1 Case A – Well A GB very near 16’’ Gas line (Please refer fig 1 for the locationalmap)
The potential profile of 16’’ Gas line (millivolts CSE) is given in below Figure 4-1- BeforeMitigation
FIG 4-1
4.2 Case B – Well B GB very near 10’’ Gas line (Please refer fig 2 for the locationalmap)
The potential profile of 10’’ Gas line (millivolts CSE) is given in below Figure 4-2 BeforeMitigation
FIG 4-2
NIGIS * CORCON 2018 * 30 September- 3 October * Jaipur, IndiaAll the rights belong to the author(s). The material presented and the views expressed are solely those of the author(s).
NIGIS does not own the copyright of any information presented in this paper and is not responsible for any action arising out of this publication.
As part of mitigation of DC anode ground bed interference within remote area,company decided to go for installation/use of ‘Electrical Shield’ as per ref 4, 5 &6. The useof 2” bare pipelines were used to provide ‘Electrical Shielding’ in both cases. Even barecables can be used for shields. The reason ‘Electrical Shields’ of bare pipe/cable may beuseful is that they prevent the pick-up of the Stray current by the interfered structure thusprotecting them in Anodic gradient influencing zone of the interfering structure.
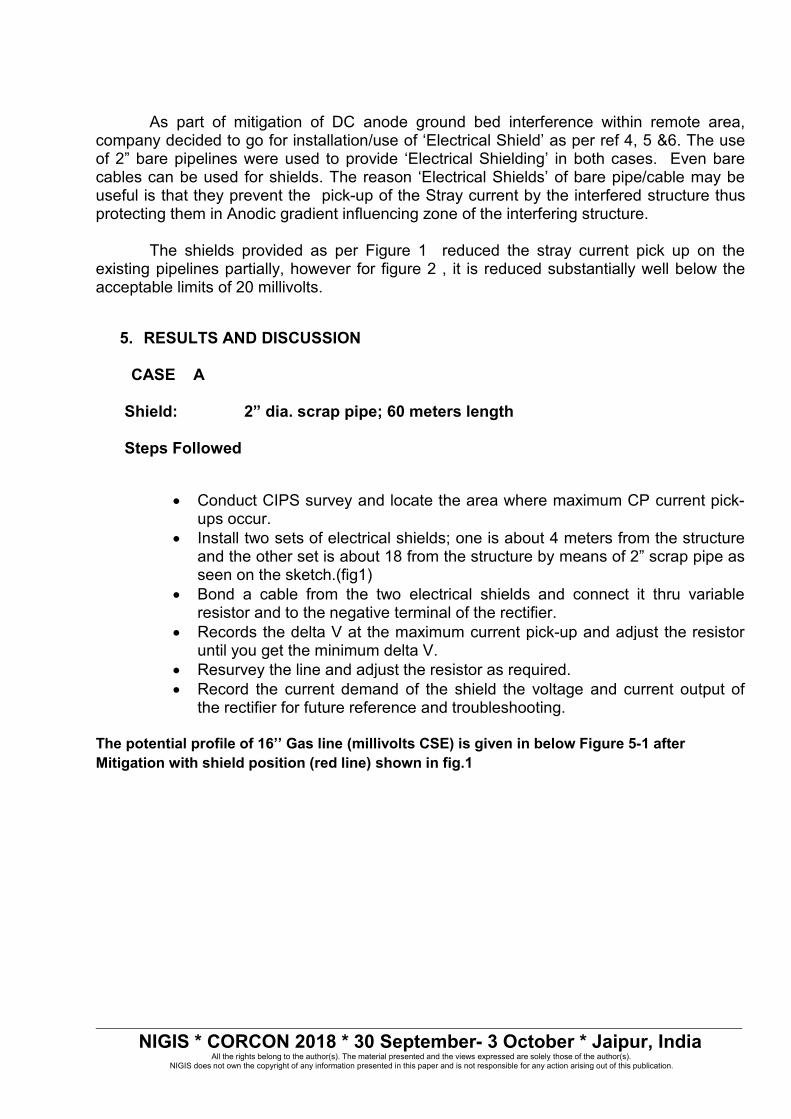
The shields provided as per Figure 1 reduced the stray current pick up on theexisting pipelines partially, however for figure 2 , it is reduced substantially well below theacceptable limits of 20 millivolts.
5. RESULTS AND DISCUSSION
CASE A
Shield: 2” dia. scrap pipe; 60 meters length
Steps Followed
Conduct CIPS survey and locate the area where maximum CP current pick-ups occur.
Install two sets of electrical shields; one is about 4 meters from the structureand the other set is about 18 from the structure by means of 2” scrap pipe asseen on the sketch.(fig1)
Bond a cable from the two electrical shields and connect it thru variableresistor and to the negative terminal of the rectifier.
Records the delta V at the maximum current pick-up and adjust the resistoruntil you get the minimum delta V.
Resurvey the line and adjust the resistor as required. Record the current demand of the shield the voltage and current output of
the rectifier for future reference and troubleshooting.
The potential profile of 16’’ Gas line (millivolts CSE) is given in below Figure 5-1 afterMitigation with shield position (red line) shown in fig.1
NIGIS * CORCON 2018 * 30 September- 3 October * Jaipur, IndiaAll the rights belong to the author(s). The material presented and the views expressed are solely those of the author(s).
NIGIS does not own the copyright of any information presented in this paper and is not responsible for any action arising out of this publication.
FIG 5-1
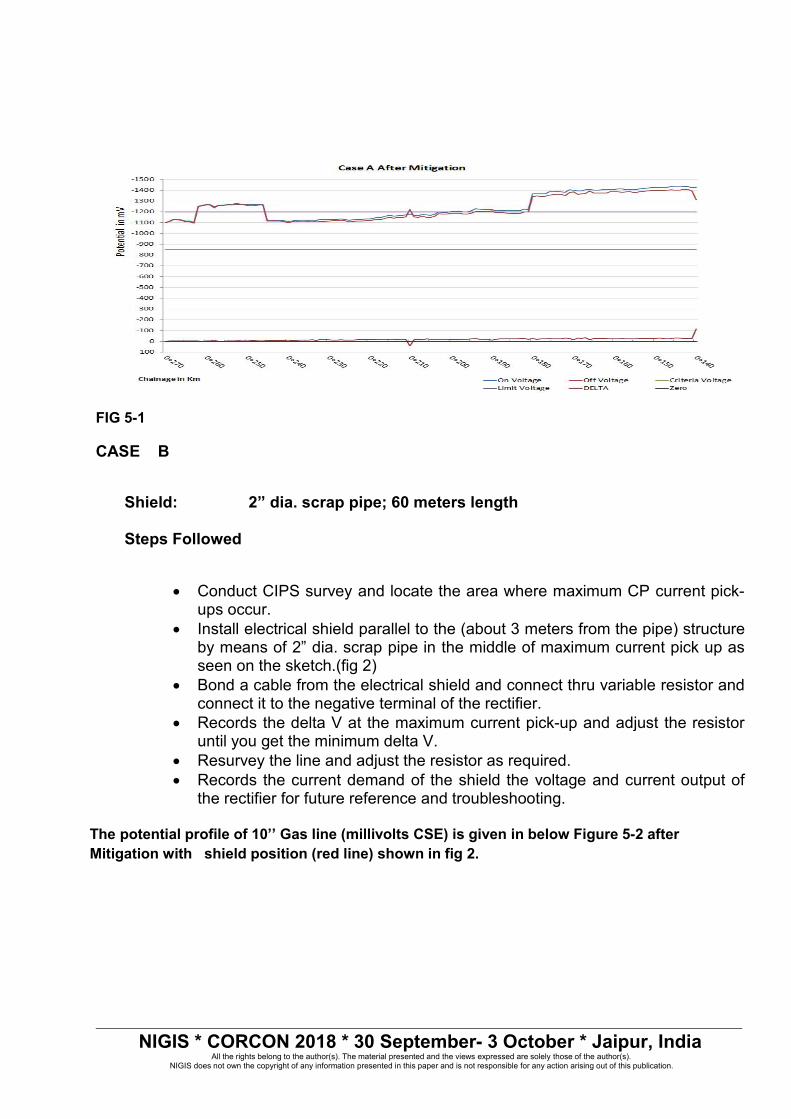
CASE B
Shield: 2” dia. scrap pipe; 60 meters length
Steps Followed
Conduct CIPS survey and locate the area where maximum CP current pick-ups occur.
Install electrical shield parallel to the (about 3 meters from the pipe) structureby means of 2” dia. scrap pipe in the middle of maximum current pick up asseen on the sketch.(fig 2)
Bond a cable from the electrical shield and connect thru variable resistor andconnect it to the negative terminal of the rectifier.
Records the delta V at the maximum current pick-up and adjust the resistoruntil you get the minimum delta V.
Resurvey the line and adjust the resistor as required. Records the current demand of the shield the voltage and current output of
the rectifier for future reference and troubleshooting.
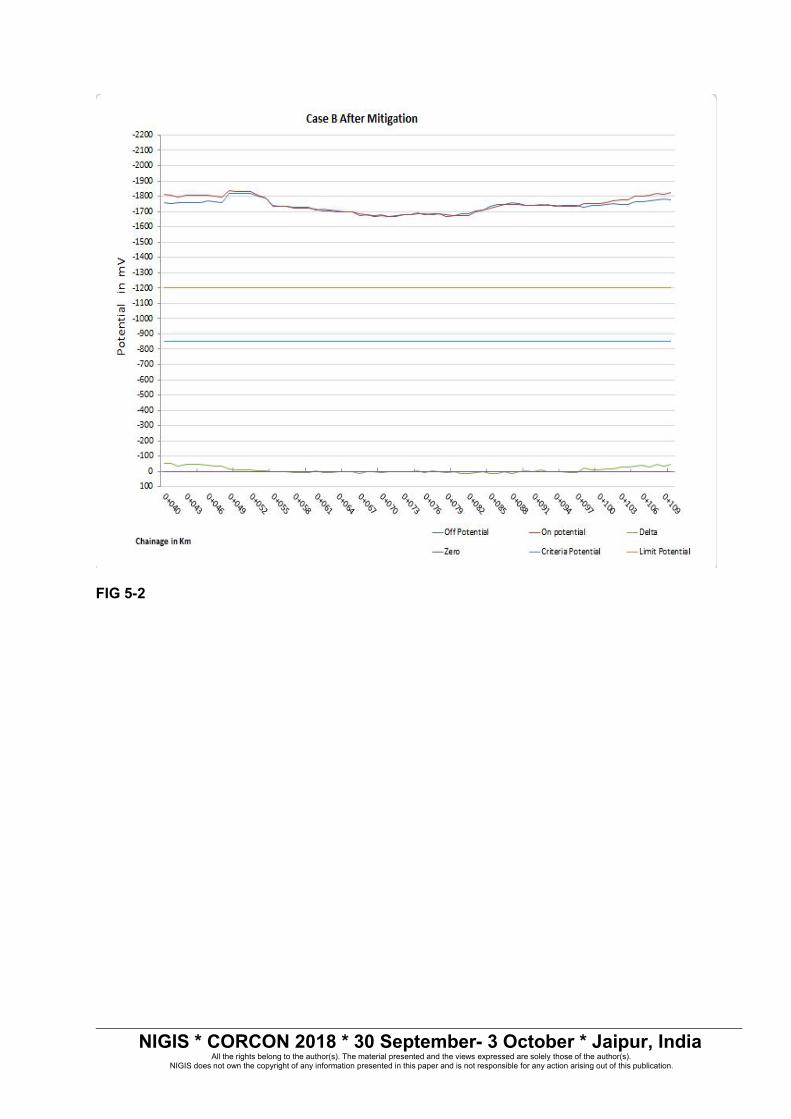
The potential profile of 10’’ Gas line (millivolts CSE) is given in below Figure 5-2 afterMitigation with shield position (red line) shown in fig 2.
NIGIS * CORCON 2018 * 30 September- 3 October * Jaipur, IndiaAll the rights belong to the author(s). The material presented and the views expressed are solely those of the author(s).
NIGIS does not own the copyright of any information presented in this paper and is not responsible for any action arising out of this publication.
FIG 5-2
NIGIS * CORCON 2018 * 30 September- 3 October * Jaipur, IndiaAll the rights belong to the author(s). The material presented and the views expressed are solely those of the author(s).
NIGIS does not own the copyright of any information presented in this paper and is not responsible for any action arising out of this publication.
6. CONCLUSIONSCase A:The interference is partly mitigated (more than 50mV of Delta V was noted) andshield current demand is 10 mA. (Graphs showing before and after mitigation)The nearer the Shield to the interfered structure the more effective it is asindicated by interference mitigation results.
Case B:The interference is satisfactorily (1 m V of Delta V was noted) mitigated andshield current demand is 3.8 mA (Graphs showing before and after mitigation)Current protection level of Interfering structure – compromised only 3.8mA
Quality and performance of shielding
Case A-partially effective
Case B-Fully effectiveHence to conclude the Shielding is a cost-effective technique for mitigating AnodicInterference as demonstrated practically in the referred paper and stronglyrecommended by authors.Future plans:Monitoring Frequency-QuarterlyCIPS / DCVG-Every three years unless anomalies recorded during routine survey
7. REFERENCES
[1] NACESP0286-2007- Electrical Isolation ofCathodicallyProtected Pipelines.[2] DEP 30.10.73.10- GEN- CathodicProtection[3] DEP 30.10.73.31- GEN- Design of Cathodic Protection Systems for OnshoreBuried Pipelines.[4] A. W. Peabody, Control of Pipeline Corrosion, NACE, 1967[5] NACE CP3 Manual[6] NACE INTERFERENCE Manual