Embed Size (px)
Citation preview

8/3/2019 Paper With Answer
http://slidepdf.com/reader/full/paper-with-answer 1/31
SULIT 4531/2
© 2010 Hak Cipta Jabatan Pelajaran Negeri Selangor [Lihat halaman sebelah]
SULIT
Section A
Bahagian A
[60 marks][60 markah]
Answer all questions in this section. Jawab semua soalan dalam bahagian ini.
1 Diagram 1 shows circular water waves produced by a vibrating dipper in a ripple tank with thefrequency of 10 Hertz and propagates towards a barrier. Rajah 1 menunjukkan gelombang air membulat air yang dihasilkan oleh pencelup yang bergetar dalam
sebuah tangki riak yang berfrekuensi 10 Hertz dan merambat ke arah satu penghadang.
Diagram 1 Rajah 1
(a) Complete the sentence below by ticking (√ ) the correct box.
Lengkapkan ayat di bawah dengan menandakan ( √ ) dalam kotak yang betul.
Water wave is aGelombang air adalah
transverse wave / gelombang melintang
longitudinal wave / gelombang membujur
[1 mark]
(b) State the wave phenomenon that occurred. Nyatakan fenomena gelombang yang berlaku.
......................................................................................................................................................................
[1 mark]
(c) State the change in the amplitude and frequency of the water wave after it hit the barrier.
Nyatakan perubahan amplitud dan frekuensi gelombang air selepas ia melanggar penghadang. Amplitude / amplitud :
……………………………………………………………………………………………………………..
Frequency / frekuensi:
…………………………………………………………………………………………………..
[2 marks]
Wave fronts Muka gelombang
Barrier penghadang
3

8/3/2019 Paper With Answer
http://slidepdf.com/reader/full/paper-with-answer 2/31
SULIT 4531/2
© 2010 Hak Cipta Jabatan Pelajaran Negeri Selangor [Lihat halaman sebelah]
SULIT
2 Diagram 2 shows a mass of 0.8 kg T-shirt is hung on a clothes line. Rajah 2 menunjukkan sehelai baju-T yang berjisim 0.8 kg digantung pada tali penyidai.
Diagram 2 Rajah 2
(a) What is the base unit of the force? Apakah unit asas bagi daya?
......................................................................................................................................................................
[1 mark]
(b) Mark and label in diagram 2.Tanda dan labelkan dalam rajah 2.
(i) the tension force of the string, T, acts on the clothes line when the T-shirt is hung.daya ketegangan tali, T , yang bertindak ke atas tali penyidai apabila baju-T itu digantung.
(ii) the weight of the T-shirt, W.berat baju-T, W.
[2 marks]
(c) Using the concept of forces in equilibrium, calculate the tension force, T. Menggunakan konsep keseimbangan daya, kirakan daya ketegangan, T.
……………………………………………………………………………………………………………..
[2 marks]
Clothes lineTali penyidai
20o 20
o
4

8/3/2019 Paper With Answer
http://slidepdf.com/reader/full/paper-with-answer 3/31
SULIT 4531/2
© 2010 Hak Cipta Jabatan Pelajaran Negeri Selangor [Lihat halaman sebelah]
SULIT
3 Diagram 3 shows a type of nuclear reaction where the number of neutrons produced is X. Rajah 3 menunjukkan sejenis tindakbalas nuklear dimana bilangan neutron yang terhasil ialah X.
Diagram 3 Rajah 3
(a) Name the type of nuclear reaction. Namakan jenis tindakbalas nuklear ini.
…………………………………………………………………………………………………………….
[1 mark]
(b) State the value of X. Nyatakan nilai X.
…………………………………………………………………………………………………………….
[1 mark]
(c) Total atomic mass before reaction is 3.985 x 10⁻²⁵
kg and total atomic mass after reaction is3.982 x 10
-25kg.
Jumlah jisim atom sebelum tindakbalas ialah 3.985 x 10⁻²⁵
kg dan jumlah jisim atom selepas
tindakbalas ialah 3.982 x 10⁻²⁵
kg.
Calculate, Hitungkan,
(i) the mass defect.cacat jisim.
[2 marks](ii) the amount of energy released.
jumlah tenaga yang terbebas.
[2 marks]
+ X
5

8/3/2019 Paper With Answer
http://slidepdf.com/reader/full/paper-with-answer 4/31
SULIT 4531/2
© 2010 Hak Cipta Jabatan Pelajaran Negeri Selangor [Lihat halaman sebelah]
SULIT
4 Diagram 4 shows a temperature-time graph for the heating of 50g substance. The initial state of thesubstance is solid. Rajah 4 menunjukkan satu graf suhu-masa bagi pemanasan 50 g satu bahan. Keadaan permulaan bahan itu
adalah pepejal.
Diagram 4 Rajah 4
(a) (i) What is the meaning of temperature? Apakah yang dimaksudkan dengan suhu?
…………………………………………………………………………………………………………….
[1 mark]
(ii) What is the melting point of the substance? Apakah takat lebur bahan itu?
……………………………………………………………………………………………………………… [1 mark]
(b) What is the physical state of the substance at QR? Apakah keadaan fizikal bahan pada QR?
......................................................................................................................................................................
[1 mark]
20
40
60
80
100
120
P
Q R
0 20 40 60 80 100 120 Time/second
Masa/saat
6
Time/second
Masa/saat
Temperature/ oC
Suhu/ oC

8/3/2019 Paper With Answer
http://slidepdf.com/reader/full/paper-with-answer 5/31
SULIT 4531/2
© 2010 Hak Cipta Jabatan Pelajaran Negeri Selangor [Lihat halaman sebelah]
SULIT
(c) Determine the time taken for the substance to change from solid state to liquid state. Hitungkan masa yang diambil untuk bahan berubah daripada keadaan pepejal kepada keadaan cecair.
…………………………………………………………………………………………………..[1 mark]
(d) Calculate the heat energy required to raise the temperature of the substance from 30oC to 80
oC.
Given the specific heat capacity of the substance as 1720 J kg
-1
o
C
-1
. Hitungkan tenaga haba yang diperlukan untuk meningkatkan suhu bahan itu dari 30oC ke 80
oC. Diberi
muatan haba tentu bahan sebagai 1720 J kg-1
oC
-1
)
[3 marks]
5 Diagram 5.1 and Diagram 5.2 show two identical thistle funnels are covered with rubber sheets,immersed in measuring cylinders filled with liquid P which density is 0.8 g cm
-3. A manometer is
connected to the thistle funnel using rubber tube. The depth, h1 and h2 are measured from thesurface of the liquid P to the rubber sheet. Rajah 5.1 dan 5.2 menunjukkan corong tisel yang ditutup rapi dengan kepingan getah dan direndamkan ke
dalam silinderpenyukat yang mengandungi cecair P yang ketumpatannya adalah 0.8 g cm-3
. Sebuah
manometer disambungkan kepada corong tisel dengan tiub getah. Kedalaman h1 dan h2
diukur dari
permukaan cecair P ke kepingan getah.
Diagram 5.1 Rajah 5.1
Diagram 5.2 Rajah 5.2
(a) State the function of manometer? Nyatakan kegunaan manometer?
......................................................................................................................................................................
[1 mark]
7
Thistle funnel
Corong tisel
h1
Water
air
Rubber tube
Tiub getah
8 cm
Manometer
Rubber
getah
Liquid PCecair P
h2
Waterair
6 cm

8/3/2019 Paper With Answer
http://slidepdf.com/reader/full/paper-with-answer 6/31
SULIT 4531/2
© 2010 Hak Cipta Jabatan Pelajaran Negeri Selangor [Lihat halaman sebelah]
SULIT
(b) Observe Diagram 5.1 and Diagram 5.2.Perhatikan Rajah 5.1 dan Rajah 5.2.
(i) Compare h1 and h2. Bandingkan h1 dan h2
.
……………………………………………………………………………………………………[1 mark]
(ii) Compare the different in height of the water level in the manometer. Bandingkan perbezaan ketinggian paras air di dalam manometer.
……………………………………………………………………………………………………[2 marks]
(iii) Name the physical quantity that represents the difference in height of the water in manometer. Namakan kuantiti fizik yang mewakili perbezaan ketinggian air dalam manometer.
……………………………………………………………………………………………………………..
[1 mark]
(iv) Relate the answers in 5 (b) (i) and 5 (b) (ii). Hubungkaitkan jawapan dalam 5 (a) (i) dan 5 (a) (ii).
…………………………………………………………………………………………………………….. [1 mark]
(v) Relate the depth of the liquid and the physical quantity in 5(b) (iii). Hubungkait kedalaman cecair dengan kuantiti dalam5(b)(iii).
…………………………………………………………………………………………………………… [1 mark]
(c) Liquid P with density 0.8 g cm-3 in Diagram 5.2 is then replaced by liquid Q with density 1.0gcm
-3. Predict what will happen to the difference in height of the water in manometer and give
your reason.Cecair P berketumpatan 0.8 g cm
- 3dalam Rajah 5.2 kemudian digantikan dengan cecair Q yang
berketumpatan 1.0 gcm-3
. Ramalkan apa yang akan berlaku kepada perbezaan ketinggian air dalam
manometer dan berikan sebab anda.
……………………………………………………………………………………………………
……………………………………………………………………………………………………
……………………………………………………………………………………………………
[2 marks]
8

8/3/2019 Paper With Answer
http://slidepdf.com/reader/full/paper-with-answer 7/31
SULIT 4531/2
© 2010 Hak Cipta Jabatan Pelajaran Negeri Selangor [Lihat halaman sebelah]
SULIT
6 Diagram 6.1 and Diagram 6.2 show identical copper rods placed on bare copper wire between the
poles of magnets. Copper rod is at the initial position when the switch is off. When the switch ineach circuit is on, the ammeter pointer deflects and the copper rod moves to the final position as
shown in Diagram 6.1 and Diagram 6.2. Rajah 6.1 dan Rajah 6.2 menunjukkan rod kuprum diletakkan di atas dawai kuprum tidak bertebat di antara
kutub-kutub magnet. Rod kuprum berada di kedudukan awal apabila suis dimatikan. Bila suis dalam setiap
litar dihidupkan, penunjuk ammeter terpesong dan rod kuprum bergerak ke kedudukan akhir seperti yangditunjukkan dalam Rajah 6.1 dan Rajah 6.2.
Diagram 6.1 Rajah 6.1
Diagram 6.2 Rajah 6.2
(a) Using Diagram 6.1 and Diagram 6.2 Menggunakan Rajah 6.1 dan Rajah 6.2
Ammeter
Ammeter
Ammeter
Ammeter
Switch
S
North pole magnet
Kutub utara magnet
Iron yoke
Dening besi
South pole
magnetKutub selatan
magnet
Bare copper wire
Landasan kuprum tak bertebat
Switch
Switch
Final position
Kedudukan akhir
Initial position
Kedudukan awal
Copper rod
Rod kuprum
Switch
Suis
7
Switch
S
North pole magnet
Kutub utara magnet
Iron yoke
Dening besi
Bare copper wire Landasan kuprum tak bertebat
Switch
Switch
Final position
Kedudukan akhir
Initial position
Kedudukan awal
Copper rod
Rod kuprum
Switch
Suis
South pole
magnetKutub selatan
magnet
9

8/3/2019 Paper With Answer
http://slidepdf.com/reader/full/paper-with-answer 8/31
SULIT 4531/2
© 2010 Hak Cipta Jabatan Pelajaran Negeri Selangor [Lihat halaman sebelah]
SULIT
(i) compare the number of batteries used.bandingkan bilangan bateri yang digunakan.
......................................................................................................................................................................
[1 mark]
(ii) compare the degree of deflection of the ammeter pointer.
bandingkan sudut pesongan peunujuk ammeter.
……………………………………………………………………………………………………
[1 mark]
(iii) compare the amount of current flow in each circuit.bandingkan jumlah arus yang mengalir dalam setiap litar .
……………………………………………………………………………………………………
[1 marks]
(iv) compare the final positions of the copper rods.
bandingkan kedudukan akhir rod-rod kuprum itu.
……………………………………………………………………………………………………………..
[1 mark]
(b) State a physics quantity that causes the rods to move. Nyatakan satu kuantiti fizik yang menyebabkan rod-rod itu bergerak.
…………………………………………………………………………………………………………….. [1 mark]
(c) Relate the amount of current flow and the magnitude of the physics quantity that you stated in6(b). Hubungkait jumlah arus yang mengalir dan magnitud kuantiti fizik yang dinyatakan dalam 6 (b).
……………………………………………………………………………………………………[1 mark]
(d) Name the rule use to determine the direction of the movement of the copper rod. Namakan peraturan yang digunakan untuk menentukan arah gerakan rod kuprum itu.
……………………………………………………………………………………………………
[1 mark]
(e) State one other factor that affects the magnitude of the physics quantity you stated in 6 (b). Nyatakan satu faktor lain yang mempengaruhi magnitud kuantiti fizik yang dinyatakan dalam 6(b).
……………………………………………………………………………………………………
[1 mark]
10

8/3/2019 Paper With Answer
http://slidepdf.com/reader/full/paper-with-answer 9/31
SULIT 4531/2
© 2010 Hak Cipta Jabatan Pelajaran Negeri Selangor [Lihat halaman sebelah]
SULIT
7 Diagram 7.1 shows a circuit consist of two 1.5 V batteries and two identical resistors, R . Theammeter reading is 1.5 A. Rajah 7.1 menunjukkan satu litar yang terdiri daripada dua bateri 1.5V dan dua perintang. Bacaan
ammeter ialah 1.5A.
Diagram 7.1 Rajah 7.1
(a) Complete the sentence below by ticking (√ ) the correct box. Lengkapkan ayat di bawah dengan menandakan (√ ) dalam kotak yang betul.
The resistor in Diagram 7.1 is connected inPerintang dalam Rajah 7.1 disambung secara
series circuit / litar sesiri.
parallel circuit / litar selari.
[1 mark]
(b) What will happen to the ammeter reading when a copper wire is connected between P and Q.
Give the reason. Apakah yang akan berlaku pada bacaan ammeter apabila dawai kuprum disambungkan pada P dan Q.
Berikan sebabnya.
……………………………………………………………………………………………………
……………………………………………………………………………………………………………..
[2 marks]
(c) Diagram 7.2 shows a circuit consist of a bulb rated 3V, 6W with potential difference, 3V.When the switch is on, current 2A will flow and the bulb will light up in normal brightness.
Rajah 7.2 menunjukkan satu litar yang terdiri daripada sebiji mentol berkadar 3V, 6W dengan beza
keupayaan 3V. Apabila suis dihidupkan, arus 2A akan mengalir dan mentol akan menyala dengan
kecerahan normal.
Diagram 7.2 Rajah 7.2
A
P Q
Switch
SuisA
3 V
Bulb 3V, 6W
Mentol
11

8/3/2019 Paper With Answer
http://slidepdf.com/reader/full/paper-with-answer 10/31
SULIT 4531/2
© 2010 Hak Cipta Jabatan Pelajaran Negeri Selangor [Lihat halaman sebelah]
SULIT
Diagram 7.3 shows a circuit consist of two bulbs rated 3V, 6W each with the potentialdifference, 3V. Rajah 7.3 menunjukkan litar yang terdiri daripada dua mentol yang setiapnya berkadaran 3V, 6W
dengan beza keupayaan 3V.
Diagram 7.3 Rajah 7.3
(i) Based on the Diagram 7.2, calculate the resistance of the bulb.
Berdasarkan Rajah 7.3, hitungkan rintangan mentol.
[1 mark]
(ii) Based on the Diagram 7.3, calculate the current flow. Berdasarkan Rajah 7.3, hitungkan arus yang mengalir.
[3 marks]
(iii) Based on Diagram 7.2 and Diagram 7.3, compare the brightness of the bulbs. Berdasarkan Rajah 7.2 dan Rajah 7.3 bandingkan kecerahan mentol-mentol itu.
……………………………………………………………………………………………………[1 marks]
A
3V
12
Bulb 3V, 6W Mentol
Bulb 3V, 6W
Mentol
Switch
Suis

8/3/2019 Paper With Answer
http://slidepdf.com/reader/full/paper-with-answer 11/31
SULIT 4531/2
© 2010 Hak Cipta Jabatan Pelajaran Negeri Selangor [Lihat halaman sebelah]
SULIT
(iv) You are given two identical batteries, 1.5 V each and two identical bulbs rated 3V 6 W each.Based on your knowledge in 7(c)(ii) and 7(c)(iii), draw a complete electrical circuit diagram
where both the bulbs will light up with normal brightness. Anda dibekalkan dua bateri serupa yang setiap satunya 1.5V dan dua mentol serupa yang setiap
satunya berkadar 3V 6W. Berdasarkan pengetahuan anda di 7(c)(ii) dan 7(c)(iii), lukis satu litar
elektrik yang lengkap yang mana kedua-dua mentol akan menyala dengan kecerahan yang normal.
[2 marks]
8 Diagram 8.1 shows an automatic switch circuit that will light up a street lamp during the nighttime. Rajah 8.1 menunjukkan litar suis automatic yang menyalakan lampu jalan pada waktu malam.
Diagram 8.1 Rajah 8.1
(a) Name the type of transistor T? Namakan jenis transistor T?
…………………………………………………………………………………………………………….[1 mark]
(b) State the function of resistance R2? Nyatakan fungsi perintang R2
?
……………………………………………………………………………………………………[1 mark]
13
Lamp 240 V, 100W Lampu240V
~
R2
R1
TLDRPPC
6V

8/3/2019 Paper With Answer
http://slidepdf.com/reader/full/paper-with-answer 12/31
SULIT 4531/2
© 2010 Hak Cipta Jabatan Pelajaran Negeri Selangor [Lihat halaman sebelah]
SULIT
(c) State what will happen to the resistance of the light-dependent resistor (LDR) when the lightintensity is low? Nyatakan apakah yang berlaku kepada rintangan perintang peka cahaya (PPC) bila keamatan cahaya
adalah rendah?
...................................................................................................................................................................
[1 mark] (d) State what will happen to the street lamp when the positions of R1 and LDR are switched.
Explain why. Nyatakan apa akan berlaku kepada lampu jalan apabila R1
dan PPC ditukar kedudukan? Terangkan
mengapa.
……………………………………………………………………………………………………
…………………………………………………………………………………………………………….
…………………………………………………………………………………………………………….
…………………………………………………………………………………………………………….
[3 marks]
(e) Diagram 8.2 shows a transistor circuit. Rajah 8.2 menunjukkan sebuah litar transistor.
Diagram 8.2
Rajah 8.2
You are given three resistors R3 with resistance 50 Ω, 100 Ω and 200 Ω each. Calculate t hevoltage across the base-emitter, VBE for each of the resistor.
Anda diberi tiga perintang R3 yang setiapnya berintangan 50Ω, 100 Ω dan 200 Ω. Hitungkan beza
keupayaan merentasi tapak-pengeluar, V BE
bagi setiap perintang itu.
(i) VBE for 50 Ω V BE untuk 50 Ω
R2
R3
R1 = 1000Ω
TVBE
14
6V

8/3/2019 Paper With Answer
http://slidepdf.com/reader/full/paper-with-answer 13/31
SULIT 4531/2
© 2010 Hak Cipta Jabatan Pelajaran Negeri Selangor [Lihat halaman sebelah]
SULIT
(ii) VBE for 100 Ω V BE untuk 100 Ω
(iii) VBE for 200 Ω V BE untuk 200 Ω
[4 marks]
(f) The bulb will light up if the VBE is greater than 0.7 V. Based on your answers in 8 (e), choosethe most suitable resistor to be used as resistor R 3. Give a reason for your answer.
Mentol akan menyala jika V BE adalah lebih besar dari 0.7V. Berdasarkan jawapan anda dalam 8 (e ), pilih perintang yang paling sesuai untuk digunakan sebagai perintang R3 . Berikan satu sebab bagi
jawapan anda.
……………………………………………………………………………………………………
……………………………………………………………………………………………………
[2 marks]
15
8/3/2019 Paper With Answer
http://slidepdf.com/reader/full/paper-with-answer 14/31
SULIT 4531/2
© 2010 Hak Cipta Jabatan Pelajaran Negeri Selangor [Lihat halaman sebelah]
SULIT
Section B
Bahagian B
[20 marks][20 markah]
Answer any one question from this section. Jawab mana-mana satu soalan daripada bahagian ini.
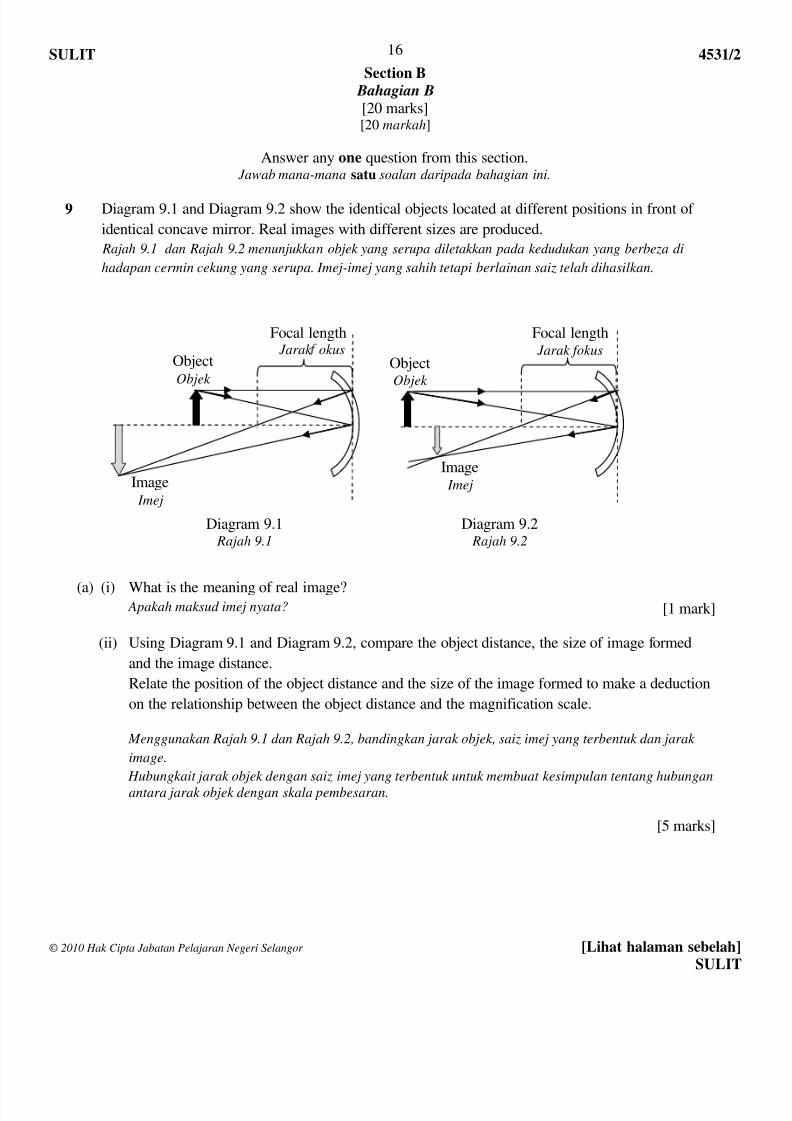
9 Diagram 9.1 and Diagram 9.2 show the identical objects located at different positions in front of
identical concave mirror. Real images with different sizes are produced.
Rajah 9.1 dan Rajah 9.2 menunjukkan objek yang serupa diletakkan pada kedudukan yang berbeza di
hadapan cermin cekung yang serupa. Imej-imej yang sahih tetapi berlainan saiz telah dihasilkan.
Diagram 9.1 Rajah 9.1
Diagram 9.2 Rajah 9.2
(a) (i) What is the meaning of real image? Apakah maksud imej nyata? [1 mark]
(ii) Using Diagram 9.1 and Diagram 9.2, compare the object distance, the size of image formed
and the image distance.
Relate the position of the object distance and the size of the image formed to make a deduction
on the relationship between the object distance and the magnification scale.
Menggunakan Rajah 9.1 dan Rajah 9.2, bandingkan jarak objek, saiz imej yang terbentuk dan jarak
image.
Hubungkait jarak objek dengan saiz imej yang terbentuk untuk membuat kesimpulan tentang hubungan
antara jarak objek dengan skala pembesaran.
[5 marks]
Focal length Jarak okus
Image Imej
ObjectObjek
Focal length Jarak fokus
Image Imej
ObjectObjek
16

8/3/2019 Paper With Answer
http://slidepdf.com/reader/full/paper-with-answer 15/31
SULIT 4531/2
© 2010 Hak Cipta Jabatan Pelajaran Negeri Selangor [Lihat halaman sebelah]
SULIT
(b) Diagram 9.3 shows a photograph of a concave mirror producing upright and magnified image.
Rajah 9.3 menunjukkan gambar foto sebuah cermin cekung yang menghasilkan imej yang tegak dan
dibesarkan.
Diagram 9.3 Rajah 9.3
Draw a ray diagram to show the formation of the image formed as shown in Diagram 9.3. Lukiskan satu gambarajah sinar yang menunjukkan pembentukan imej seperti yang ditunjukkan pada Rajah 9.3.
[4 marks]
(c) Diagram 9.4 shows a ray diagram of a slide projector. Rajah 9.4 menunjukkan gambarajah sinar sebuah projektor slaid.
Diagram 9.4 Rajah 9.4
The slide projector is needed in your school hall. You are required to modify the slide
projector so that it can produce clearer image and can be seen by 800 students. Suggest and
explain based on the following aspect:
Projektor slaid ini diperlukan untuk penggunaan dalam dewan sekolah. Anda diperlukan untuk
mengubahsuaikan projektor itu untuk menghasilkan imej yang lebih jelas dan boleh dilihat oleh 800
orang pelajar. Cadang dan terangkan berdasarkan aspek-aspek berikut:
(i) The power of the bulb used.
Kuasa lampu mentol yang digunakan.
CondenserKondenser
Concave mirrorCermin cekung
Light sourceSumber caha a
SlideSlaid
Projector lensKanta projektor
ScreenSkrin
17

8/3/2019 Paper With Answer
http://slidepdf.com/reader/full/paper-with-answer 16/31
SULIT 4531/2
© 2010 Hak Cipta Jabatan Pelajaran Negeri Selangor [Lihat halaman sebelah]
SULIT
(ii) The position of the bulb from the concave mirror.
Kedudukan bagi mentol dari cermin cekung.
(iii) The curvature of the concave mirror.
Kelengkungan cermin cekung.
(iv) The position of the slide from the projector lens.
Kedudukan slaid dari kanta projektor.
(v) Position of the screen from the projector.
Kedudukan bagi skrin dari projektor.
[10 marks]
18

8/3/2019 Paper With Answer
http://slidepdf.com/reader/full/paper-with-answer 17/31
SULIT 4531/2
© 2010 Hak Cipta Jabatan Pelajaran Negeri Selangor [Lihat halaman sebelah]
SULIT
10 Diagram 10.1 and Diagram 10.2 show how induced current are produced in solenoids.
Rajah 10.1 dan Rajah 10.2 menunjukkan bagaimana arus aruhan dihasilkan dalam solenoid.
Diagram 10.1 Rajah 10.1
Diagram 10.2 Rajah 10.2
(a) What is meant by induced current? Apakah yang dimaksudkan dengan arus aruhan?
[1 mark]
(b) Using Diagram 10.1 and 10.2, compare
Menggunakan Rajah 10.1 dan 10.2 , bandingkan
(i) The number of turns of the solenoid.
Bilangan lilitan solenoid .
bar magnetmagnet bar
solenoidsolenoid
GalvanometerGalvanometer
Direction of motion of the bar magnet Arah gerakan magnet bar
bar magnetmagnet bar
solenoidsolenoid
GalvanometerGalvanometer
Direction of motion of the bar magnet Arah gerakan magnet bar
19
0
0

8/3/2019 Paper With Answer
http://slidepdf.com/reader/full/paper-with-answer 18/31
SULIT 4531/2
© 2010 Hak Cipta Jabatan Pelajaran Negeri Selangor [Lihat halaman sebelah]
SULIT
(ii) The deflection of the galvanometer pointer.
Pesongan jarum galvanometer.
(iii) The rate of cutting of the magnetic flux.
Kadar pemotongan fluks magnet.
(iv) The magnitude of induced current produced.
Magnitud arus aruhan yang dihasilkan. [4 marks]
(c) Using Diagram 10.1 and 10.2
Menggunakan Rajah 10.1 dan 10.2.
(i) Relate the number of turns of the solenoid and the rate of cutting of the magnetic flux.
Hubungkait bilangan lilitan solenoid dan kadar pemotongan fluks magnet.
(ii) Relate the rate of cutting of magnetic flux and the magnitude of the induced current
produced and hence.
Hubungkait kadar pemotongan fluks magnet dan magnitud arus aruhan yang dihasilkan danseterusnya.
(d) Name the physics law involved.
Namakan hukum fizik yang terlibat. [3 marks]
(e) Diagram 10.3 shows a simple step-up transformer.
Rajah 10.3 menunjukkan sebuah transformer injak naik yang ringkas.
(i) Explain why step-up transformers are used in the transmission of electricity?
Terangkan mengapa transformer injak naik digunakan dalam penghantaran elektrik?
[2 marks](ii) You are required to modify the transformer in Diagram 10.3 so that it can use as an
efficient laptop adapter with output of 18.5 V of direct current. Your suggestions and
explanation should be based on the following aspects:
Anda dikehendaki mengubahsuai transformer pada Rajah 10.3 supaya ia boleh digunakan
sebagai adapter komputer riba yang berkecekapan tinggi dengan mengeluarkan ouput arus
terus 18.5 V. Cadangan dan penjelasan anda haruslah berdasarkan aspek-aspek berikut:
Diagram 10.3 Rajah 10.3
Outputoutput Input
input
primary coilgegelung primer
Secondary coilgegelung sekunder
Iron coreTeras besi
20

8/3/2019 Paper With Answer
http://slidepdf.com/reader/full/paper-with-answer 19/31
SULIT 4531/2
© 2010 Hak Cipta Jabatan Pelajaran Negeri Selangor [Lihat halaman sebelah]
SULIT
- Type of the core used.
Jenis teras yang digunakan.
- materials and diameter of the wire used.
Bahan dan diameter dawai yang digunakan.
- Ratio of the number of turns in the primary coil to the secondary coil.
Nisbah bilangan lilitan gegelung primer kepada gegelung sekunder
- The arrangement of the primary coil and the secondary coil.
Susunan gegelung primer dan gegelung sekunder.
- The numbers of diodes used.
Susunan dan bilangan diod yang digunakan.
[10 marks]
21

8/3/2019 Paper With Answer
http://slidepdf.com/reader/full/paper-with-answer 20/31
SULIT 4531/2
© 2010 Hak Cipta Jabatan Pelajaran Negeri Selangor [Lihat halaman sebelah]
SULIT
Section C
Bahagian C
[20 marks][20 markah]
Answer any one question from this section. Jawab mana-mana satu soalan daripada bahagian ini.
11 Diagram 11.1 shows a submarine floating in sea water due to the effect of buoyant force.
Rajah 11.1 menunjukkan sebuah kapal selam yang sedang terapung dalam air laut disebabkan oleh
kesan daya tujah.
Diagram 11.1 Rajah 11.1
(a) What is the meaning of buoyant force?
Apakah maksud daya tujah? [1 mark]
(b) Explain how a submarine is able to submerge into deep sea water.
Terangkan bagaimana sebuah kapal selam dapat menyelam ke air laut yang dalam. [4 marks]
(c) You are asked to investigate the characteristics of four submarines shown in Table 11.1.
Explain the suitability of each characteristic of the submarines and determine the submarine
which can travel faster, stay longer in deeper sea water and able to carry more crew.
Give reasons for your choice.
Anda dikehendaki mengkaji ciri-ciri bagi empat buah kapal selam seperti yang ditunjukkan dalam
Jadual 11.1.
Terangkan kesesuaian setiap ciri kapal selam itu dan tentukan kapal selam yang dapat bergerak lebih laju, berada lebih lama dalam air laut yang lebih dalam dan yang mampu membawa lebih
ramai anak kapal.
Berikan alasan bagi pilihan anda.
Valvesinjap
Airudara
Interior (where crew works) Bahagian dalam (di mana anak
kapal bekerja)
Sea water Air laut
22

8/3/2019 Paper With Answer
http://slidepdf.com/reader/full/paper-with-answer 21/31
SULIT 4531/2
© 2010 Hak Cipta Jabatan Pelajaran Negeri Selangor [Lihat halaman sebelah]
SULIT
The volumeof ballasttank
Isipadu
tangki balast
The number of airtanks cylindercarried
Bilangan silinder
tangki udara yang
dibawa
Maximum waterpressure that can betolerated
Tekanan air maksima
yang boleh diterima
The shape of submarine
Bentuk kapal selam
W 3 000 liter 15 cylinders 4.5 Atm
X 2 500 liter 30 cylinders 6.0 Atm
Y 350 liter 3 cylinders 6.1 Atm
Z 400 liter 1 cylinder 2.5 Atm
Table 11.1 Jadual 11.1
[10 marks]
(d) Diagram 11.2 shows oil drum floats stationary in water. The density of water
is 1000 kg m-3
.
Rajah 11.2 menunjukkan sebuah tong minyak yang terapung pegun dalam air.Ketumpatan air ialah 1000 kg m
-3
.
Diagram 11.2 Rajah 11.2
Surface area= 0.2 m2
Luas permukaan = 0.2 m2
waterair
Oil drumtong minyak
0.8 m
23

8/3/2019 Paper With Answer
http://slidepdf.com/reader/full/paper-with-answer 22/31
SULIT 4531/2
© 2010 Hak Cipta Jabatan Pelajaran Negeri Selangor [Lihat halaman sebelah]
SULIT
Calculate
Hitungkan
(i) The volume of the oil drum immersed in water.
Isipadu tong minyak yang terendam dalam air.
[2 marks]
(ii) The buoyant force acting on the oil drum.
Daya tujah yang bertindak pada tong minyak itu
[2 marks]
(iii) The mass of the oil drum.
Jisim tong minyak itu.
[1 mark]
24

8/3/2019 Paper With Answer
http://slidepdf.com/reader/full/paper-with-answer 23/31
SULIT 4531/2
© 2010 Hak Cipta Jabatan Pelajaran Negeri Selangor [Lihat halaman sebelah]
SULIT
12 Radioisotopes can be used as tracers to detect leaks from pipes underground. Diagram 12.1
shows a leak that occurred in an underground water pipe.
Radioisotop boleh digunakan sebagai penyurih untuk mengesan kebocoran paip-paip di bawah tanah.
Rajah 12.1 menunjukkan kebocoran yang berlaku pada paip air di bawah tanah.
(a) What is meant by radioisotopes?
Apakah yang dimaksudkan dengan radioisotope? [1 mark]
(b) With the aid of diagram, explain how radioisotopes can be used to detect the
location of the leakage as shown in Diagram 12.1.
Terangkan bagaimana radioisotope boleh digunakan untuk mengesan lokasi
kebocoran seperti yang ditunjukkan pada Rajah 12.1. [3 marks]
(c) Table 12.1 shows the characteristics of five radioisotopes.
Jadual 12.1 menunjukkan ciri-ciri lima radioisotope.
Radioisotope Radioisotop
Characteristics of radioisotopesCiri-ciri radioisotop
Type of ray Jenis sinaran
Half-lifeSeparuh hayat
State of matterKeadaan jirim
P Beta28 years28 tahun
SolidPepejal
Q Gamma5 years5 tahun
SolidPepejal
R Gamma8 days8 hari
LiquidCecair
S Beta5 days5 hari
GasGas
T Gamma6 hours6 jam
LiquidCecair
Table 12.1 Jadual 12.1
Location of leakage Lokasi kebocoran
Water pipePaip air
Diagram 12.1 Rajah 12.1
Groundtanah
25

8/3/2019 Paper With Answer
http://slidepdf.com/reader/full/paper-with-answer 24/31
SULIT 4531/2
© 2010 Hak Cipta Jabatan Pelajaran Negeri Selangor [Lihat halaman sebelah]
SULIT
Explain the suitability of each characteristic of the radioisotope and determine the most
suitable radioisotope to be used in detecting the leak from pipes underground.
Give reasons for your choice
Terangkan kesesuaian setiap ciri radioisotope dan tentukan radioisotope yang paling sesuai
digunkan untuk mengesan kebocoran paip air di bawah tanah.
Beri sebab untuk pilihan anda.
[8 marks]
(d) Diagram 12.2 shows the decay chain of Radon-222.
Rajah 12.2 menunjukkan rantaian reputan bagi Radon-222.
(i) What is the number of neutrons in Rn-222?
Berapakah bilang neutron bagi Rn-222?[1 mark]
(ii) Write an equation to show the decay of Rn-222 to Po-218.
Tuliskan satu persamaan untuk menunjukkan reputan Rn-222 kepada Po-218.
[2 marks]
(iii) Determine the number of alpha particles and beta particles produced in the
decay.
Tentukan bilangan zarah alfa dan zarah beta yang dihasilkan dalam reputan
tersebut. [2 marks]
(e) A lab assistant measures the number of particles emitted per minute from two different
radioactive sources K and L. The measurements are repeated each hour for four hours andthe results are shown in Table 12.2.
Seorang pembantu makmal telah mengukur bilangan zarah yang dipancarkan dalam masa per minit
daripada dua sumber radioaktif K dan L yang berbeza. Pengukuran ini diulang setiap satu jam bagi
masa selama empat jam dan keputusan adalah ditunjukkan pada Jadual 12.2.
81 82 83 84 85 86 87
206
210
214
218
222
Proton number Nombor proton
Nucleon number Nombor nukleon
Rn
Po
Pb Bi Po
Pb
Diagram 12.2 Rajah 12.2
26

8/3/2019 Paper With Answer
http://slidepdf.com/reader/full/paper-with-answer 25/31
SULIT 4531/2
© 2010 Hak Cipta Jabatan Pelajaran Negeri Selangor [Lihat halaman sebelah]
SULIT
Time/hour Masa/jam
Number of particles emitted per minute Bilangan zarah dipancarkan per minit
Source KSumber K
Source LSumber L
0 160 1600
1 113 800
2 80 4003 57 200
4 40 100
Table 12.2 Jadual 12.2
(i) Name the source that has the shortest half-life?
Namakan sumber yang mempunyai separuh hayat yang terpendek?[1 mark]
(ii) The experiment continues until the time is 6 hours.
Calculate the number of particles emitted per minute from source K.
Eksperimen ini dilanjutkan sehingga masa 6 jam. Hitungkan bilangan zarah per minit yang dipancarkan daripada sumber K. [2 marks]
27

8/3/2019 Paper With Answer
http://slidepdf.com/reader/full/paper-with-answer 26/31
Physics Paper 2
Trial Examination JPS 2010
Marking Scheme
Question
NumberMarking Scheme Marks
1. (a)
(b)(c)
Transverse wave
ReflectionAmplitude - reduce
Frequency- unchanged
1
11
1
Total 4
2. (a)
(b)(i)(ii)
(c)
Kg m s
-2
Note: also accept if onlyone T is labelled
1. 2 T sin 200
2. T = 8/ 2 sin 20
= 8 N0
= 11.7 N (answer with correct unit)
1
1
1
1
1
Total 5
3 (a)(b)
(c)i
(c)ii
Nuclear fission2
3.985 x 10⁻²⁵
- 3.982 x 10
0.003 x 10
-25
-25
kg.
0.003 x 10⁻²⁵ kg.( 3 x 10⁸)
2.7 X 10
2 -11
1
J
1
11
1
1
Total 6
20o 20
T T
W

8/3/2019 Paper With Answer
http://slidepdf.com/reader/full/paper-with-answer 27/31
4 (a)i
ii
(b)
(c)
(d)
Temperature is degree of hotness or coldness
800
C
Solid +Liquid
60 second
1st
2: 0.05 kg
nd
3: 0.05 x 1720 x (80-30)
rd
: 4300 J (with correct unit)
1
1
1
1
111
Total 7
5. (a)
(b) (i)
(ii)
(iii)
(iv)
(v)
(c)
To measure the pressure.
h1 is higher than h
2
difference in height of the water in the manometer in Diagram 5.1is higher than Diagram 5.2
Pressure
The greater the depth of thistle funnel, the greater the difference in
height of the water in manometer / when h increases, thedifference in height of the water in manometer also increase.
As depth of liquid increases, the pressure also increases.
1. The difference in height of the water in manometer will
increase
2. When the density increases, the pressure also increases.
1
1
1
1
1
1
1
1Total 8
6. (a) (i)
(ii)
(iii)
(iv)
(b)
(c)
(d)
(e)
Diagram 6.2 is more than Diagram 6.1
The degree of deflection of the ammeter pointer in Diagram 6.2 is
greater
Current flow in diagram 6.2 is greater
The final position of the copper rod in Diagram 6.2 is further fromthe original position.
Force / magnetic force
The amount of current flow increase, the force increases
Fleming’s left-hand rules / Right-hand Slap Rule
Magnetic field strength
1
1
1
1
1
1
1
1
Total 8

8/3/2019 Paper With Answer
http://slidepdf.com/reader/full/paper-with-answer 28/31
7. (a) (i)
(b)
(c)(i)
(ii)
(iii)
(iv)
Series
1. Ammeter reading increase.
2. Effective resistance is smaller
V2
= 9R 6
= 1.5 Ω // atau guna V=IR
1. Total resistance = 3 Ω 2. Current flow =
3 Ω 3V
3. I = 1A
Brightness of bulbs in Diagram 7.2 is greater than Diagram 7.3
1. Bulbs are connected in parallel.
2. Circuit is complete, function able, batteries are labelled as3V or draw two batteries in series
1
1
1
1
11
1
1
1
1
Total 10
8. (a)
(b) (c) (d)
(e) (i)
(ii)
(ii)
n-p-n
to limit the base current
Increases
1. street lamp does not light up2. voltage across VBE
3. base current decrease, transistor is off
decreases
501050
x 6 = 0.2857 V
100
1100
x 6 = 0.5454 V
200
1200
x 6 = 1.000 V
* show method for either one of it.
1
1
1
11
1
1
1
1
1
Bulb 3V, 6W
Bulb 3V, 6W
8/3/2019 Paper With Answer
http://slidepdf.com/reader/full/paper-with-answer 29/31
(f) 200 Ω VBE
is greater than 0.7 V and transistor can function.11
Total 12
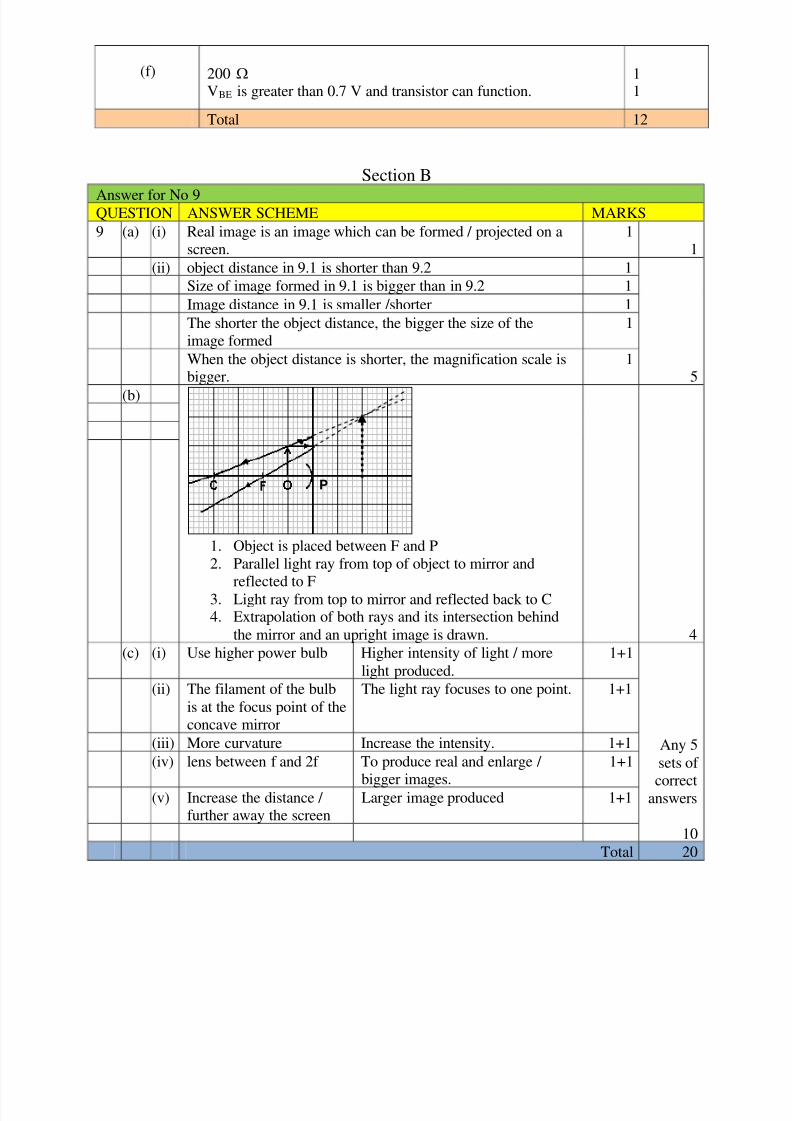
Section B
Answer for No 9QUESTION ANSWER SCHEME MARKS
9 (a) (i) Real image is an image which can be formed / projected on ascreen.
11
(ii) object distance in 9.1 is shorter than 9.2 1
5
Size of image formed in 9.1 is bigger than in 9.2 1
Image distance in 9.1 is smaller /shorter 1
The shorter the object distance, the bigger the size of theimage formed
1
When the object distance is shorter, the magnification scale isbigger.
1
(b)
1. Object is placed between F and P
2. Parallel light ray from top of object to mirror and
reflected to F3. Light ray from top to mirror and reflected back to C4. Extrapolation of both rays and its intersection behind
the mirror and an upright image is drawn. 4
(c) (i) Use higher power bulb Higher intensity of light / more
light produced.
1+1
Any 5
sets of
correctanswers
10
(ii) The filament of the bulb
is at the focus point of theconcave mirror
The light ray focuses to one point. 1+1
(iii) More curvature Increase the intensity. 1+1
(iv) lens between f and 2f To produce real and enlarge /
bigger images.
1+1
(v) Increase the distance / further away the screen
Larger image produced 1+1
Total 20
P

8/3/2019 Paper With Answer
http://slidepdf.com/reader/full/paper-with-answer 30/31
Answer for No 10
QUESTION ANSWER SCHEME MARKS
10 (a) (i) Current produced when the magnetic flux is cut by a conductor. 1 1
(b) (i) No. of turns of the solenoid in Diagram 10.2 is greater. 1
4
(ii) the deflection of the galvanometer pointer in Diagram 10.2 isbigger / larger. 1
(iii) the rate of cutting of the magnetic flux in Diagram 10.2 is greater. 1
(iv) Magnitude of induced current in Diagram10.2 is greater. 1
(c) (i) No of turns increases, rate of cutting of magnetic flux increases. 1
2(ii) Rate of cutting increases, magnitude of induced current increases. 1
(d) Faraday’s Law 1 1
(e) (i) The greater the transmission voltage, the smaller the current in the
power lines.
1
2
Power loss during transmission due to resistance will be smaller. /
P=I2
1
R
(ii) 1. laminated soft iron core 2. to reduce the effect of eddycurrent
2
10
3. thick copper wire 4. reduce heat loss due to
resistance
2
5. the ratio of turns in primarycoil to the number of turns in
secondary coil is < 1
6. to reduce output voltage to18.5 V
2
7. Wind the secondary coil on
top of the primary coil
8. to reduce the leakage of
magnetic flux
2
9. 2/4 diodes 10. to produce full-wave
rectification
2
Total 20
Section C
Answer for No 11
QUESTION ANSWER SCHEME MARKS
11 (a) Upwards force cause by weight of fluid displaced by an object
when the object is immerse in the fluid.
1
1
(b) Valve release air from ballast tank. 1
4
Sea water flooded ballast tank 1
The weight of water displaced is smaller. 1Buoyant force < Weight of the submarine 1
(c) Choices Reasons
10
The volume of ballast tank is
higher
To produce bigger buoyant
force / easy to rise up / cancarry greater weight inside
1+1
More number of air tankscylinder carried
Can stay longer time under thewater / Can rise and submerge
many times / more air supply
1+1
8/3/2019 Paper With Answer
http://slidepdf.com/reader/full/paper-with-answer 31/31
for respiration of crews
Can withstand highermaximum water pressure
Safe when the submarinesubmerge very deep in the sea /
The body will not break due tohigh water pressure
1+1
The suitable shape of submarine is aerodynamic
Less water resistance in themotion / can move faster
1+1
Submarine X 1+1
(d) (i) V = 0.2 x 0.8 1
5
= 0.16 m 13
(ii) B = Vρg = 0.16 x 1000 x 10 1
= 1600N 1
(iii) mass = 1600 ÷ 10 = 160 kg 1
Total 20
Answer for No 12QUESTION ANSWER SCHEME MARKS
12 (a) Unstable isotopes which decay and emit radioactive particles / ray 1 1
(b) Radioisotope is injected into the pipe 1
3
G-M tube as detector is used to find the leakage 1
Reading on detector increases when near a leakage 1
(c) 1. type of ray is gamma 2. high penetration power can
penetrate through the pipes
2
8
3. short half life 4. Decay faster and detection can
be done faster
2
5. in liquid state 6. Easy to flow/ dissolve 2
I choose radioisotope T because the type ray is gamma, has short
half life and it is in liquid state.
2
(d) (i) 136 1
5
(ii)
1. correct elements in equation
2. All nuclide notations are correct
2
(iii)
1. 3 alpha
2. 2 beta
2
(e) (i) Source L 1
3
(ii)
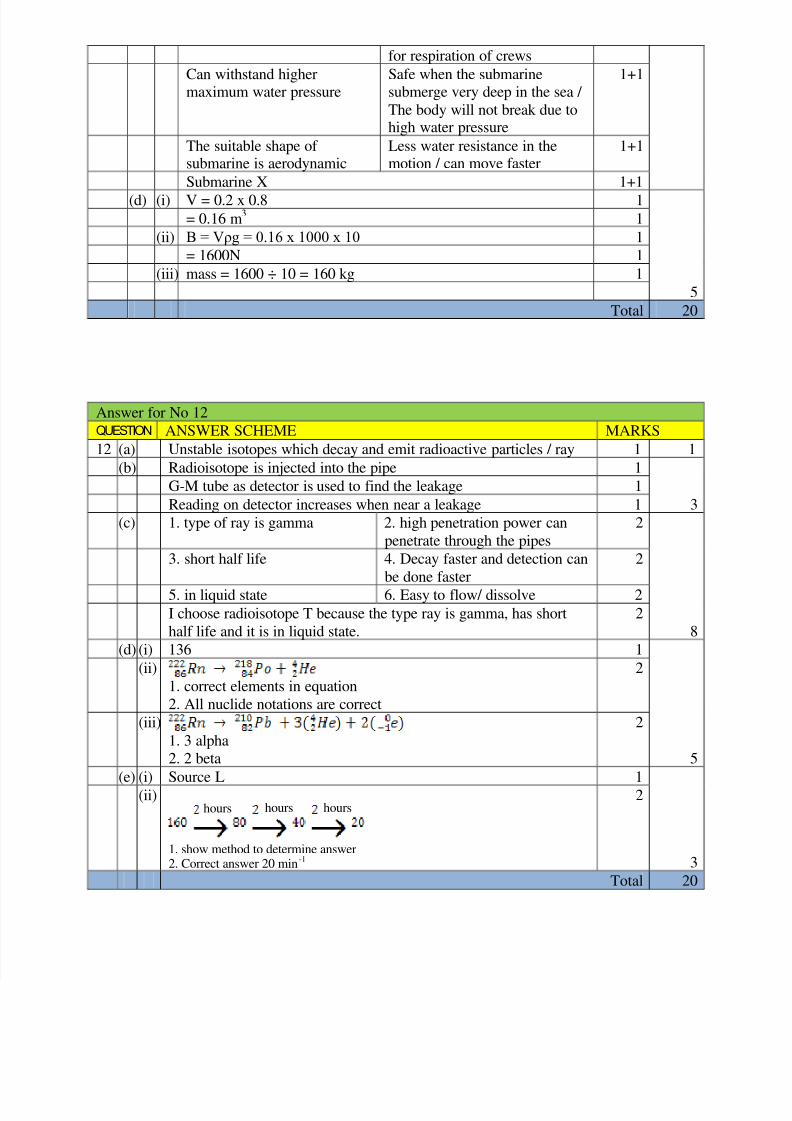
1. show method to determine answer2. Correct answer 20 min
2
-1
Total 20
hours hours hours