Embed Size (px)
Citation preview
1
Paper 099-29
SAS Data Quality – A Technology Overview Eric Hunley, SAS, Cary, NC
ABSTRACT So, you have finally accepted the fact that there is room for improvement in the quality of your data, or maybe mandated compliances are forcing you to take a closer look at it. Now what are you going to do about it? Do you have a plan in place that will lead you down this trail of uncharted territory? What about the technology that will get you to where you what to be? Learn how the SAS® Data Quality Solution (SAS and DataFlux Technologies) can help you map out your data quality journey and provide the vehicle to get you there in order to re-gain or increase the confidence in the information that drives your business decisions. See first hand how to: Gain a better understanding of where issues with your data exist Build business rules that drive the cleansing process Cleanse and Augment your data Integrate it within your data management infrastructure Report and Analyze the progress you have made
INTRODUCTION Organizations around the world expect to see a return on all of their corporate investments; data integration efforts, business intelligence and enterprise applications/solutions are no exception. Industry thought leaders and analysts indicate that the information produced by these applications/solutions is only as good as the data that feeds them. You put garbage in, you are going to get garbage out. Many of these expensive corporate projects have failed to deliver the expected returns because of the poor quality of data maintained, obtained and distributed throughout the organization. As a result, companies of all sizes in all industries throughout the world are forming data quality projects and initiatives in an effort to deliver increased returns on their corporate investments and to gain a competitive advantage. In some cases, a data quality project is the initiative that determines whether a company is profitable or not, succeeds or fails. SAS Data Quality provides organizations that ability to turn insight on where potential problems with data exist into action by addressing the problems and restoring confidence in the accuracy and consistency of corporate information. Although this paper focuses on the technology used to help understand where inconsistencies with data exists and the process to go about fixing them. It is imperative to understand that Data Quality is NOT just an Information Technology (IT) problem, but it is one that has impact throughout the organization and directly to the bottom line of the business. This is evident by comments made by Larry English, a thought leader in the area of data quality, stating that “cost analysis shows that between 15% to greater than 20% of companies operating revenue is spent on doing things to get around or fix data quality issues.”
SAS DATA QUALITY – TURNING INSIGHT INTO ACTION Overview First, let’s start by giving a definition of data quality? Webster defines quality as a degree of excellence. Add data with that and it could be thought of as the degree of excellence in which data is represented. A more simple description from a business perspective is that data quality means that an organization’s data is accurate, consistent, valid, unique, complete and timely. As mentioned above, data quality is not just an IT issue, but one that has tremendous business importance. Data is thought of as one of an organizations greatest assets, but in order to achieve its full potential requires integrating data from a wide variety of different formats and structures. Potential data sources include legacy systems, enterprise applications, databases, third party data providers and the web. All of these data sources are made up of different representations of names, addresses, phone numbers, e-mail addresses, product codes, part numbers, raw material names and other data values. Taking the time and effort to pull all this data together without a thought out data quality process will not only turn out to be costly, but may have an affect on the success or failure on the entire project. Ted Friedman, a Principal Analyst at Gartner indicates that "High-quality data is the lifeblood that fuels Business Intelligence, Enterprise Applications and Regulatory/Compliance governance. Without a focus on quality in the data integration process feeding these initiatives, organizations risk failure.”
SUGI 29 Data Warehousing, Management and Quality
2
The most challenging aspect of data quality is to recognize and determine the severity of inconsistencies and inaccuracies of the data, confront the problem directly and obtain resolution. Having a data quality assessment tool to easily give “Insight” into areas where potential data problem exist is crucial. Bad data can originates from almost anywhere; errors in data entry, erroneous data received from the web, faulty data purchased or acquired from an outside source or simply combining good data with bad. Inaccuracies in a single data column can significantly impact the cost of doing business and the quality of business decisions. In a 2002 survey conducted by The Data Warehousing Institute, almost half (44%) of the respondents said the quality of the data within their companies was “worse than everyone thinks” (TDWI Report Series, Data Quality and the Bottom Line: Achieving Business Success through a Commitment to High Quality Data, by Wayne Eckerson, January 2002). This same report chronicles examples of costs and missed opportunities due to inaccurate or incomplete data: - A telecommunications firm lost $8 million a month because data entry errors incorrectly coded accounts,
preventing bills from being sent out. - An insurance company lost hundreds of thousands of dollars annually in mailing costs (postage, returns,
collateral and staff to process returns) due to duplicate customer and prospect records. - A global chemical company discovered it was losing millions of dollars in volume discounts in procuring supplies
because it could not correctly identify and reconcile suppliers on a global basis. Data Quality Methodology Many organizations are starting to realize that the quality of their data can have a direct impact on losses in revenue, increases in spending or the ability to meet requirements set by corporate governance and compliance like Sarbanes-Oxley or Basel II. Traditionally, there has been no easy path or a single tool that can take the knowledge gained from a data assessment exercise to one that actually does something about it. SAS Data Quality has the unique advantage of taking the results of these exercises, “insight”, and turning it into “action” by cleaning up the existing problems as well as proactively addressing quality of the data at the source. As a key component of the SAS Intelligence Value Chain (refer to the following white paper: http://www.sas.com/start/ivc_wp.pdf), SAS integrates all data quality and ETL (Extraction, Transformation and Loading) processes and functions across the entire data quality methodology (profiling, cleansing, integrating, augmenting and monitoring), minimizing the risk of failure, cost and number of resources to build and manage data. The SAS solution is an integrated solution for the entire enterprise that can turn “Insight into Action.”
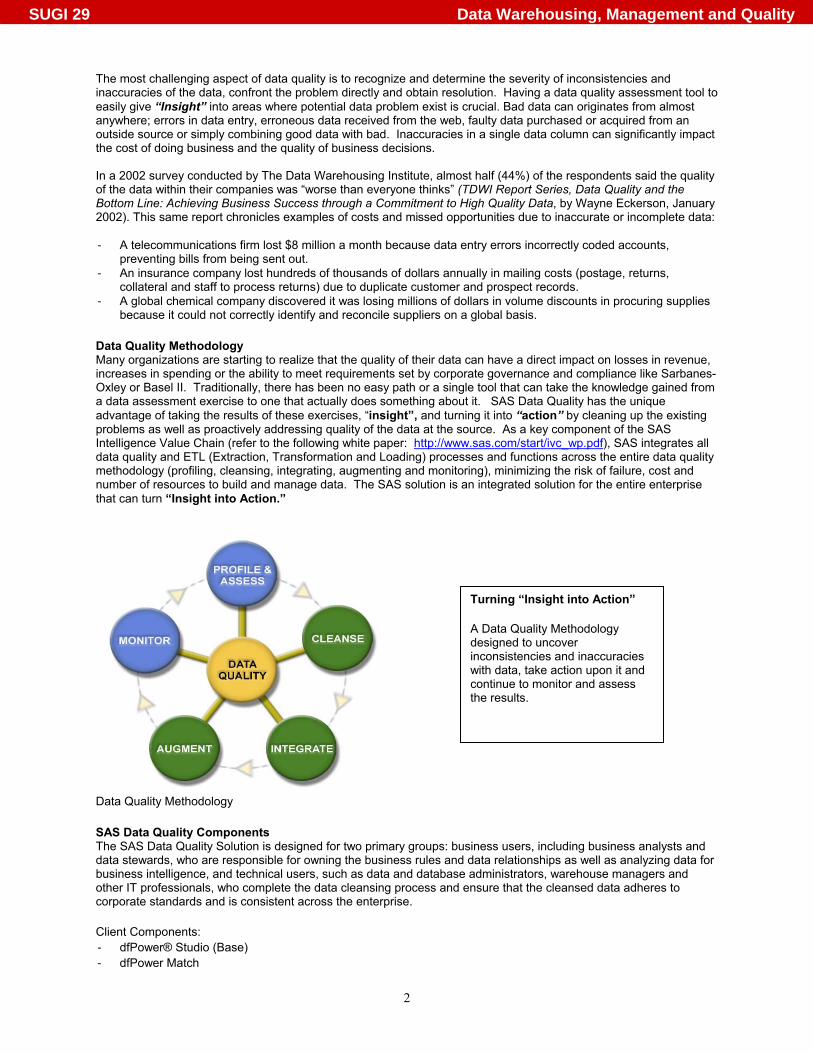
Data Quality Methodology SAS Data Quality Components The SAS Data Quality Solution is designed for two primary groups: business users, including business analysts and data stewards, who are responsible for owning the business rules and data relationships as well as analyzing data for business intelligence, and technical users, such as data and database administrators, warehouse managers and other IT professionals, who complete the data cleansing process and ensure that the cleansed data adheres to corporate standards and is consistent across the enterprise. Client Components: - dfPower® Studio (Base) - dfPower Match
Turning “Insight into Action” A Data Quality Methodology designed to uncover inconsistencies and inaccuracies with data, take action upon it and continue to monitor and assess the results.
SUGI 29 Data Warehousing, Management and Quality
3
- dfPower Profile - dfPower Customize Server Components - Base SAS (required product) - SAS® Data Quality Server Shared Components: - Quality Knowledge Base (QKB) - Customized algorithms - Defined business rules Additional Components: - SAS® ETL Studio Transformations - dfPower Verify (CASS, SERP, Geocode, PhonePlus) - dfIntelliServer – Real-time Data Quality - BlueFusion SDK – 3rd party application integration - Various country/language specific locales
PROFILING AND ASSESSMENT To set the stage on data profiling, think about the following situation. You are about to take a family vacation to Disney World. You think you have planned all aspects of the trip down to the minute in travel time and the penny in expenses. You wake the kids up at 5:00 in the morning pack them in the car and off you go … thinking you are going to beat all the traffic and will be watching the electric light parade before days end. What you didn’t think about was the Department of Transportation had the same plans that week. They were scheduling a time period between 4:00am and 6:00am to shut down a major section of the Highway. By the time you got there, traffic was already backed up for 20 miles and expected delays were more than 4 hours. Let’s just say that the vacation got off to a bad start, the kids were already arguing, there was no way you were going to make your destination that day and you were going to have to layout the cash for extra meals and a room or two in the only hotel in town … which was more than you spent for the plush room on your last business trip. In short, you lost a day of your vacation, blew your budget by 20% and now there is no hope of talking your wife into that Tivo you were going to splurge on yourself when you returned from your trip. By now, you might be asking, what is the correlation between this travel story and data profiling. Well, it is simple. Attempting to start any project or trip, without a complete understanding of the potential problems that lie ahead increases the risk of being over budget and not on time. In many cases, this may result in the failure of the entire project. Think of Data Profiling as the AAA for your business intelligence and data management projects. There are many different techniques and processes for data profiling. For purposes of this paper we will group them together into three major categories: - Pattern Analysis – Expected patterns, pattern distribution, pattern frequency and drill down analysis - Column Analysis – Cardinality, null values, ranges, minimum/maximum values, frequency distribution and various
statistics. - Domain Analysis – Expected or accepted data values and ranges. Pattern Analysis Pattern analysis is a data profiling technique that is used to determine if the data values in a field or fields match the expected format or structure. Making a quick and easy visual inspection of the data within a table or across data sources will determine if the appropriate format or standard is being adhered to. An example of where pattern analysis will produce immediate value is in situations where data inconsistencies will yield incorrect results in reporting and analysis. Such data values may be social security numbers, phone numbers or country/state/county names. Pattern analysis is not limited to determining simply if a field consists of characters and/or numerics, but can also determine character casing, special characters, field lengths and other format specific details about the data. As an example, consider a pattern report for all the various representations of 50 US States. Values maybe spelled out completely, partial abbreviations, complete abbreviations and various casing combinations. All may be valid representations of a given state, but may not match the desired format or the standard that has been defined throughout your organization. The expected representation may be 2 character abbreviations in all upper case with no spaces or periods. Actual data patterns may look something like this:
SUGI 29 Data Warehousing, Management and Quality
4
- AA - aa - Aa - A.A. - A.AAAAAAAA - AAAAA AAAAAAAA - A9
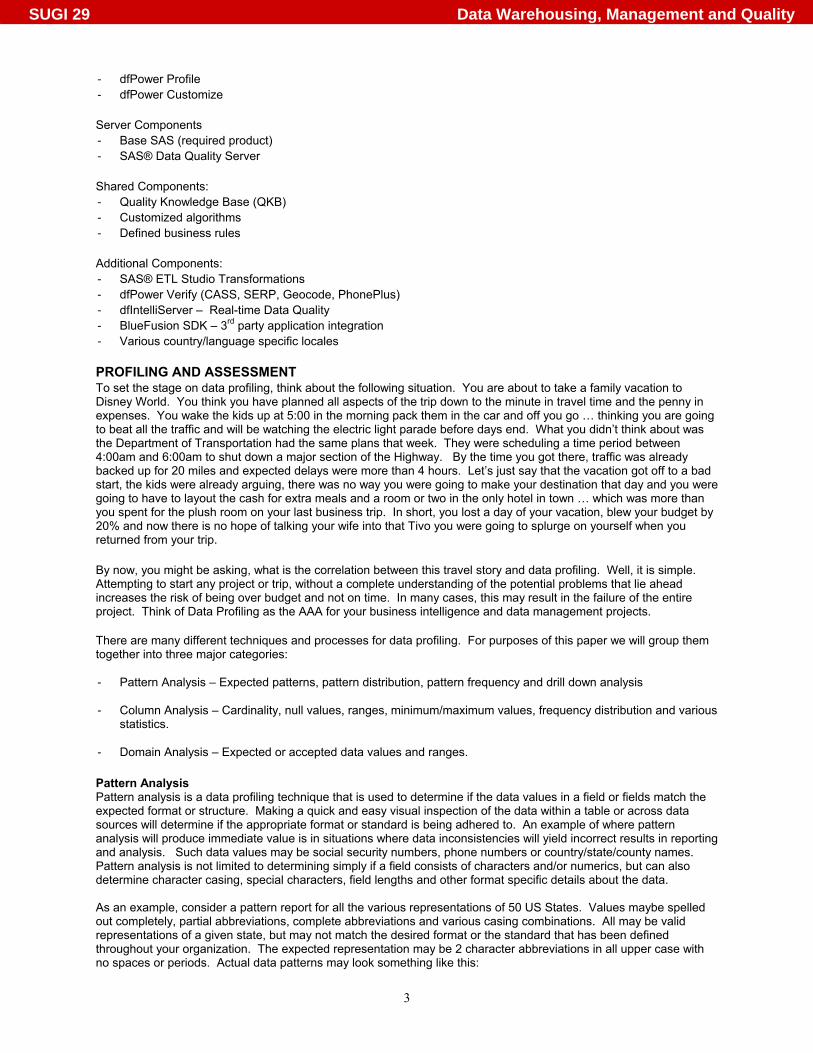
In these examples, the “A” represents any upper case character (letter), the “a” represents any lower case character and “9” represents any number. Remember from above that our expected format is 2 character abbreviations with no spaces, no periods and all upper case. In the sample pattern report below it is easy to see that there is more than the expected pattern of the State field in our data table. The report also indicates the ability to drill down on the complete record of the selected pattern. Pattern Drill-down Report – dfPower Profile
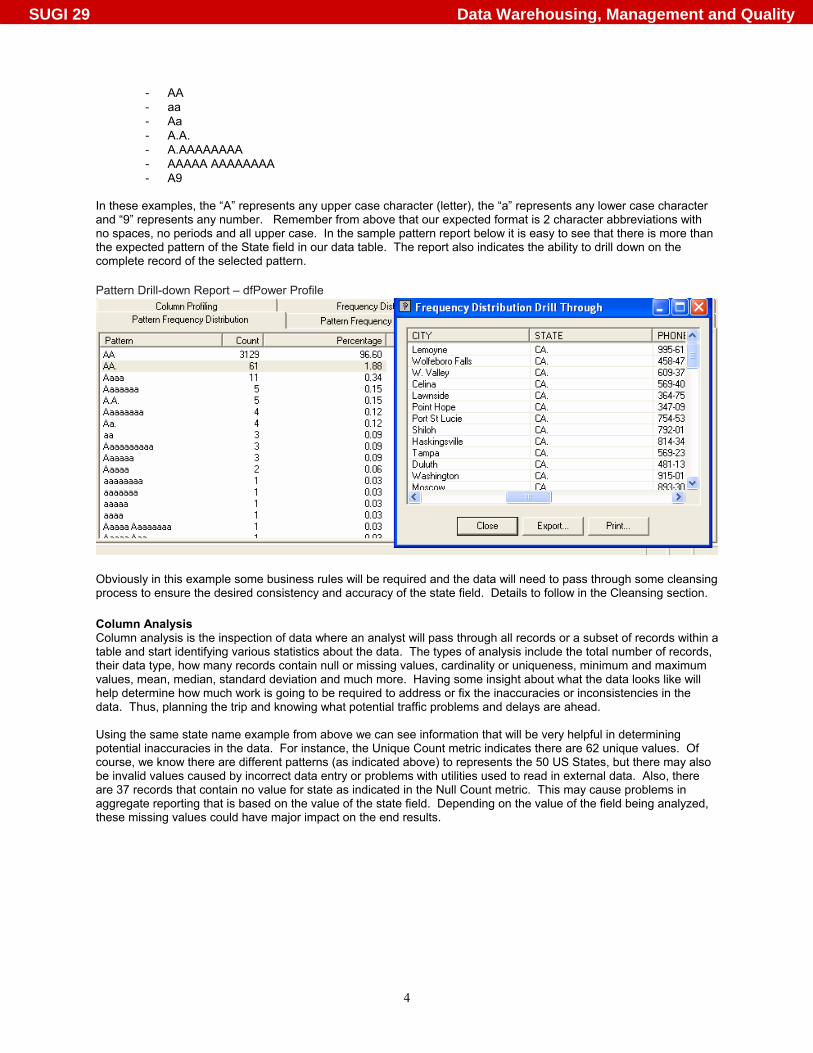
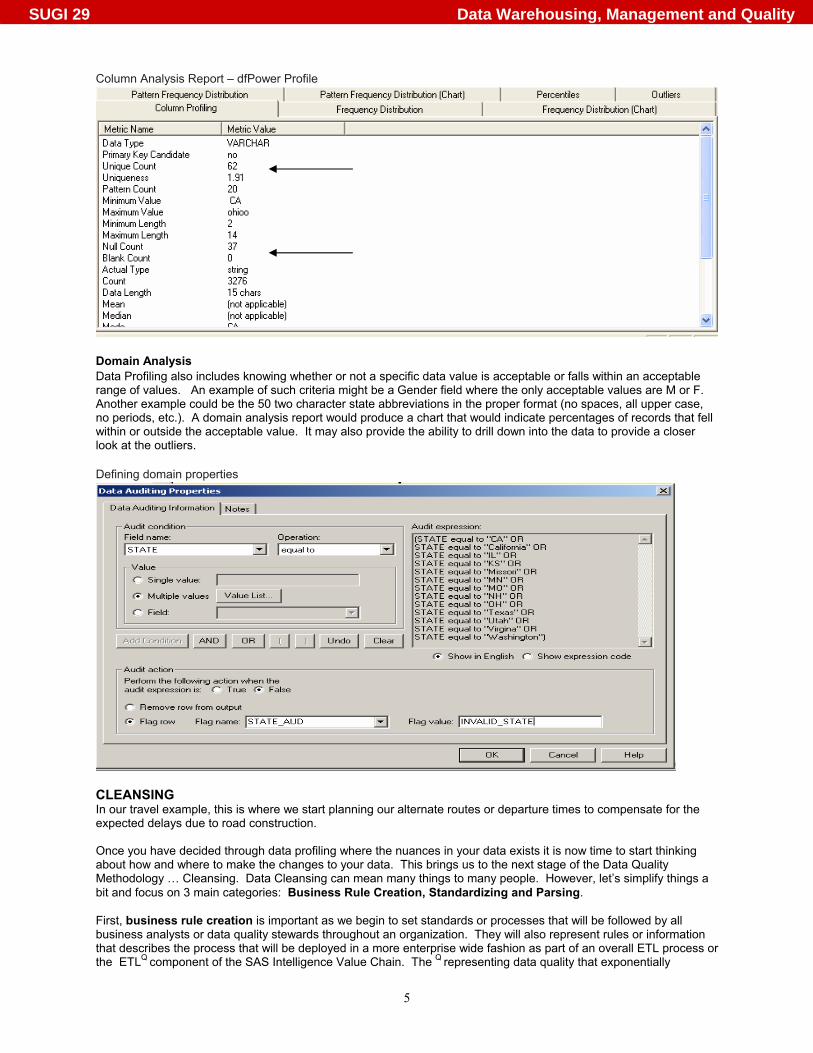
Obviously in this example some business rules will be required and the data will need to pass through some cleansing process to ensure the desired consistency and accuracy of the state field. Details to follow in the Cleansing section. Column Analysis Column analysis is the inspection of data where an analyst will pass through all records or a subset of records within a table and start identifying various statistics about the data. The types of analysis include the total number of records, their data type, how many records contain null or missing values, cardinality or uniqueness, minimum and maximum values, mean, median, standard deviation and much more. Having some insight about what the data looks like will help determine how much work is going to be required to address or fix the inaccuracies or inconsistencies in the data. Thus, planning the trip and knowing what potential traffic problems and delays are ahead. Using the same state name example from above we can see information that will be very helpful in determining potential inaccuracies in the data. For instance, the Unique Count metric indicates there are 62 unique values. Of course, we know there are different patterns (as indicated above) to represents the 50 US States, but there may also be invalid values caused by incorrect data entry or problems with utilities used to read in external data. Also, there are 37 records that contain no value for state as indicated in the Null Count metric. This may cause problems in aggregate reporting that is based on the value of the state field. Depending on the value of the field being analyzed, these missing values could have major impact on the end results.
SUGI 29 Data Warehousing, Management and Quality
5
Column Analysis Report – dfPower Profile
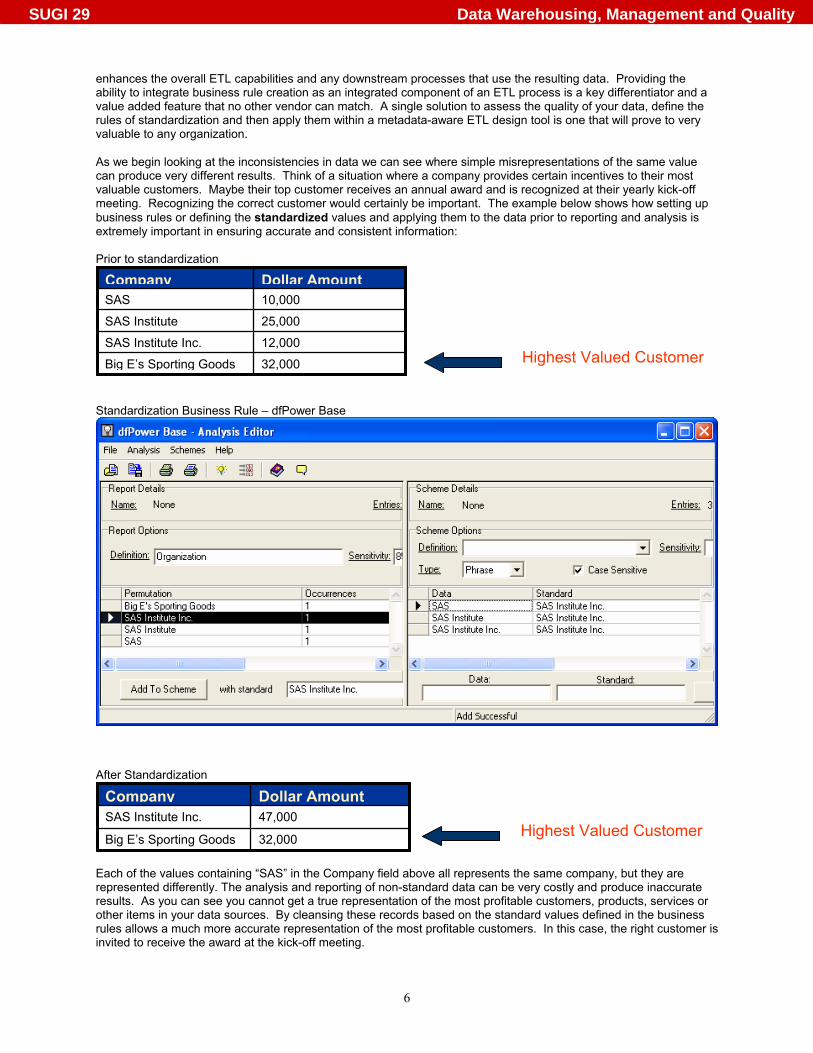
Domain Analysis Data Profiling also includes knowing whether or not a specific data value is acceptable or falls within an acceptable range of values. An example of such criteria might be a Gender field where the only acceptable values are M or F. Another example could be the 50 two character state abbreviations in the proper format (no spaces, all upper case, no periods, etc.). A domain analysis report would produce a chart that would indicate percentages of records that fell within or outside the acceptable value. It may also provide the ability to drill down into the data to provide a closer look at the outliers. Defining domain properties
CLEANSING In our travel example, this is where we start planning our alternate routes or departure times to compensate for the expected delays due to road construction. Once you have decided through data profiling where the nuances in your data exists it is now time to start thinking about how and where to make the changes to your data. This brings us to the next stage of the Data Quality Methodology … Cleansing. Data Cleansing can mean many things to many people. However, let’s simplify things a bit and focus on 3 main categories: Business Rule Creation, Standardizing and Parsing. First, business rule creation is important as we begin to set standards or processes that will be followed by all business analysts or data quality stewards throughout an organization. They will also represent rules or information that describes the process that will be deployed in a more enterprise wide fashion as part of an overall ETL process or the ETLQ component of the SAS Intelligence Value Chain. The Q representing data quality that exponentially
SUGI 29 Data Warehousing, Management and Quality
6
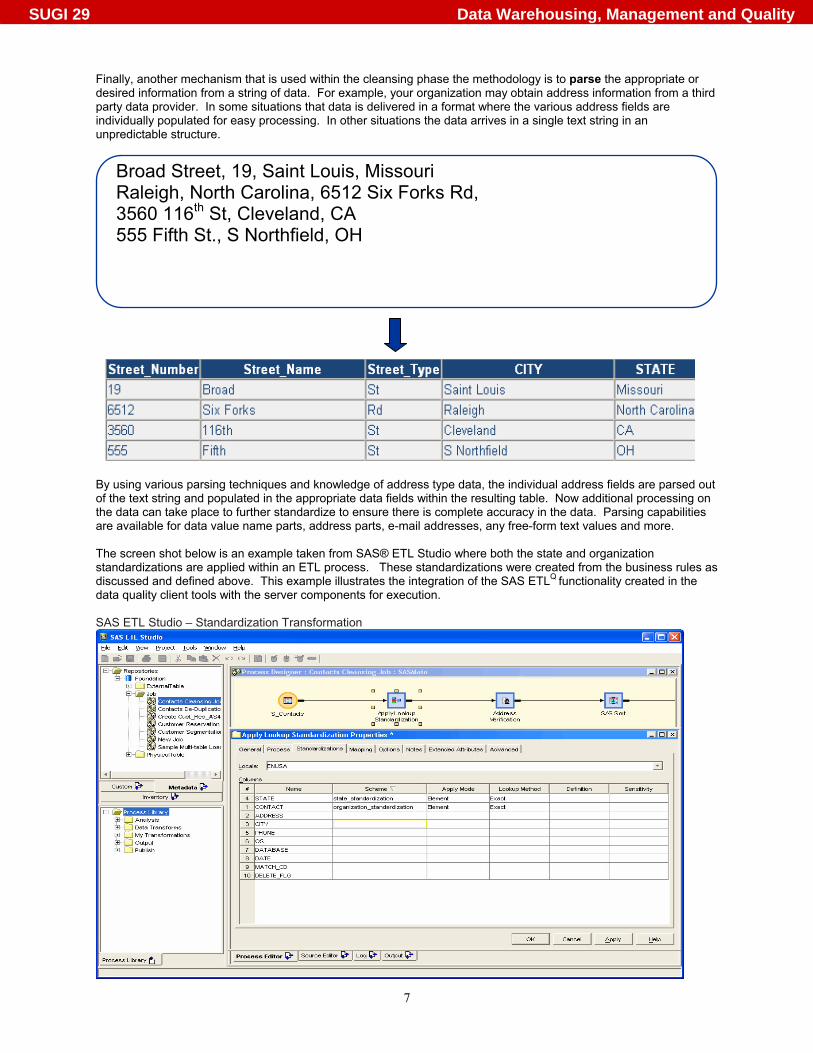
enhances the overall ETL capabilities and any downstream processes that use the resulting data. Providing the ability to integrate business rule creation as an integrated component of an ETL process is a key differentiator and a value added feature that no other vendor can match. A single solution to assess the quality of your data, define the rules of standardization and then apply them within a metadata-aware ETL design tool is one that will prove to very valuable to any organization. As we begin looking at the inconsistencies in data we can see where simple misrepresentations of the same value can produce very different results. Think of a situation where a company provides certain incentives to their most valuable customers. Maybe their top customer receives an annual award and is recognized at their yearly kick-off meeting. Recognizing the correct customer would certainly be important. The example below shows how setting up business rules or defining the standardized values and applying them to the data prior to reporting and analysis is extremely important in ensuring accurate and consistent information: Prior to standardization
Standardization Business Rule – dfPower Base
After Standardization
Each of the values containing “SAS” in the Company field above all represents the same company, but they are represented differently. The analysis and reporting of non-standard data can be very costly and produce inaccurate results. As you can see you cannot get a true representation of the most profitable customers, products, services or other items in your data sources. By cleansing these records based on the standard values defined in the business rules allows a much more accurate representation of the most profitable customers. In this case, the right customer is invited to receive the award at the kick-off meeting.
Dollar AmountCompany
12,000 SAS Institute Inc.
32,000 Big E’s Sporting Goods
25,000 SAS Institute
10,000 SAS
Highest Valued Customer
Dollar AmountCompany
32,000 Big E’s Sporting Goods
47,000 SAS Institute Inc. Highest Valued Customer
SUGI 29 Data Warehousing, Management and Quality
7
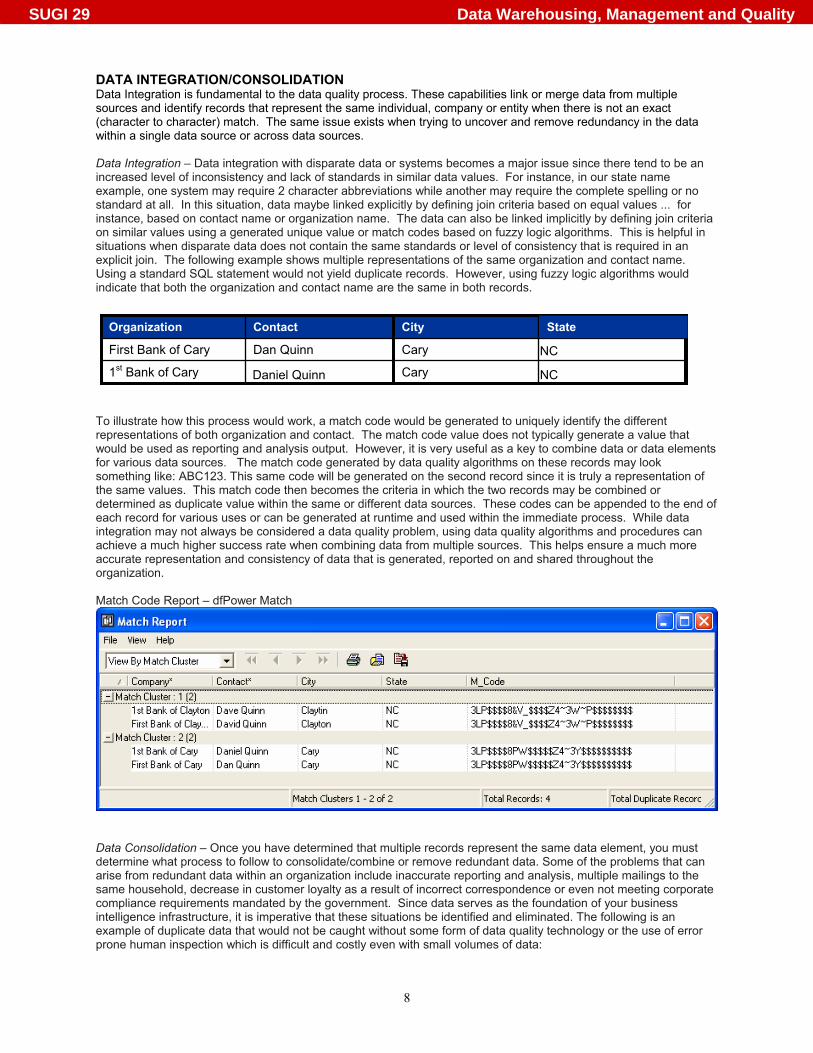
Finally, another mechanism that is used within the cleansing phase the methodology is to parse the appropriate or desired information from a string of data. For example, your organization may obtain address information from a third party data provider. In some situations that data is delivered in a format where the various address fields are individually populated for easy processing. In other situations the data arrives in a single text string in an unpredictable structure.
By using various parsing techniques and knowledge of address type data, the individual address fields are parsed out of the text string and populated in the appropriate data fields within the resulting table. Now additional processing on the data can take place to further standardize to ensure there is complete accuracy in the data. Parsing capabilities are available for data value name parts, address parts, e-mail addresses, any free-form text values and more. The screen shot below is an example taken from SAS® ETL Studio where both the state and organization standardizations are applied within an ETL process. These standardizations were created from the business rules as discussed and defined above. This example illustrates the integration of the SAS ETLQ functionality created in the data quality client tools with the server components for execution. SAS ETL Studio – Standardization Transformation
Broad Street, 19, Saint Louis, Missouri Raleigh, North Carolina, 6512 Six Forks Rd, 3560 116th St, Cleveland, CA 555 Fifth St., S Northfield, OH
SUGI 29 Data Warehousing, Management and Quality
8
DATA INTEGRATION/CONSOLIDATION Data Integration is fundamental to the data quality process. These capabilities link or merge data from multiple sources and identify records that represent the same individual, company or entity when there is not an exact (character to character) match. The same issue exists when trying to uncover and remove redundancy in the data within a single data source or across data sources. Data Integration – Data integration with disparate data or systems becomes a major issue since there tend to be an increased level of inconsistency and lack of standards in similar data values. For instance, in our state name example, one system may require 2 character abbreviations while another may require the complete spelling or no standard at all. In this situation, data maybe linked explicitly by defining join criteria based on equal values ... for instance, based on contact name or organization name. The data can also be linked implicitly by defining join criteria on similar values using a generated unique value or match codes based on fuzzy logic algorithms. This is helpful in situations when disparate data does not contain the same standards or level of consistency that is required in an explicit join. The following example shows multiple representations of the same organization and contact name. Using a standard SQL statement would not yield duplicate records. However, using fuzzy logic algorithms would indicate that both the organization and contact name are the same in both records. To illustrate how this process would work, a match code would be generated to uniquely identify the different representations of both organization and contact. The match code value does not typically generate a value that would be used as reporting and analysis output. However, it is very useful as a key to combine data or data elements for various data sources. The match code generated by data quality algorithms on these records may look something like: ABC123. This same code will be generated on the second record since it is truly a representation of the same values. This match code then becomes the criteria in which the two records may be combined or determined as duplicate value within the same or different data sources. These codes can be appended to the end of each record for various uses or can be generated at runtime and used within the immediate process. While data integration may not always be considered a data quality problem, using data quality algorithms and procedures can achieve a much higher success rate when combining data from multiple sources. This helps ensure a much more accurate representation and consistency of data that is generated, reported on and shared throughout the organization. Match Code Report – dfPower Match
Data Consolidation – Once you have determined that multiple records represent the same data element, you must determine what process to follow to consolidate/combine or remove redundant data. Some of the problems that can arise from redundant data within an organization include inaccurate reporting and analysis, multiple mailings to the same household, decrease in customer loyalty as a result of incorrect correspondence or even not meeting corporate compliance requirements mandated by the government. Since data serves as the foundation of your business intelligence infrastructure, it is imperative that these situations be identified and eliminated. The following is an example of duplicate data that would not be caught without some form of data quality technology or the use of error prone human inspection which is difficult and costly even with small volumes of data:
Contact Organization
1st Bank of Cary
Dan Quinn First Bank of Cary
City
Daniel Quinn Cary NC
Cary
State NC
SUGI 29 Data Warehousing, Management and Quality
9
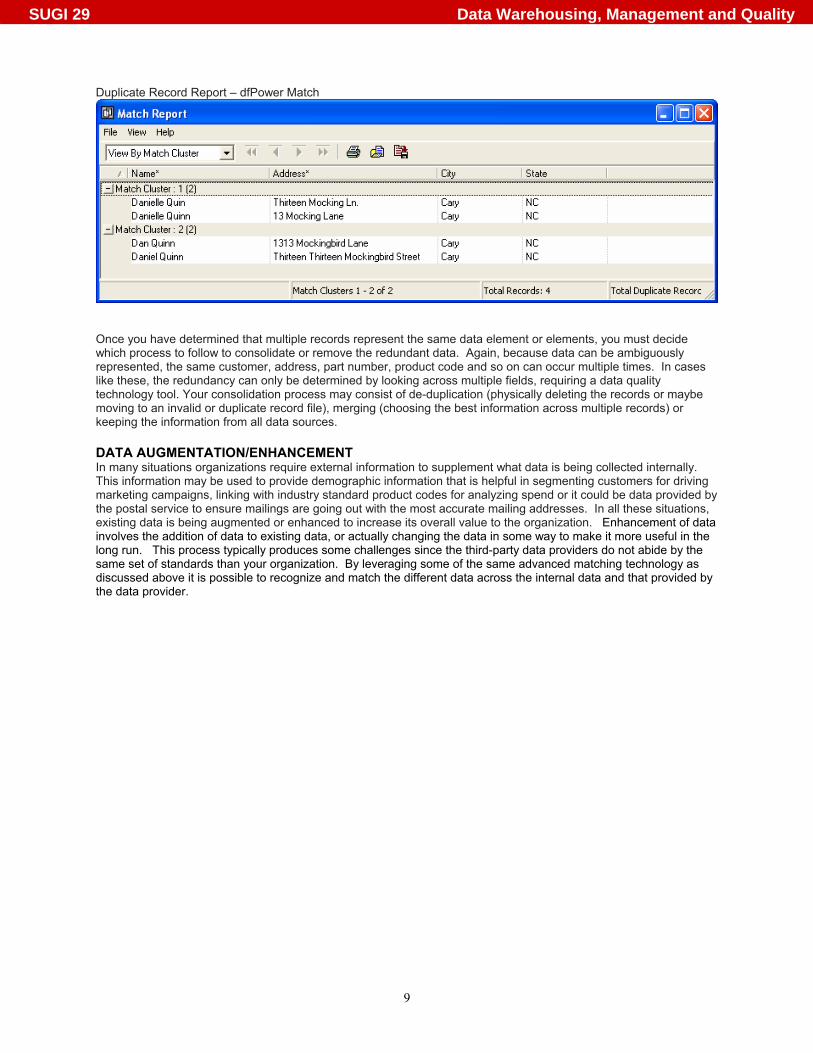
Duplicate Record Report – dfPower Match
Once you have determined that multiple records represent the same data element or elements, you must decide which process to follow to consolidate or remove the redundant data. Again, because data can be ambiguously represented, the same customer, address, part number, product code and so on can occur multiple times. In cases like these, the redundancy can only be determined by looking across multiple fields, requiring a data quality technology tool. Your consolidation process may consist of de-duplication (physically deleting the records or maybe moving to an invalid or duplicate record file), merging (choosing the best information across multiple records) or keeping the information from all data sources.
DATA AUGMENTATION/ENHANCEMENT In many situations organizations require external information to supplement what data is being collected internally. This information may be used to provide demographic information that is helpful in segmenting customers for driving marketing campaigns, linking with industry standard product codes for analyzing spend or it could be data provided by the postal service to ensure mailings are going out with the most accurate mailing addresses. In all these situations, existing data is being augmented or enhanced to increase its overall value to the organization. Enhancement of data involves the addition of data to existing data, or actually changing the data in some way to make it more useful in the long run. This process typically produces some challenges since the third-party data providers do not abide by the same set of standards than your organization. By leveraging some of the same advanced matching technology as discussed above it is possible to recognize and match the different data across the internal data and that provided by the data provider.
SUGI 29 Data Warehousing, Management and Quality
10
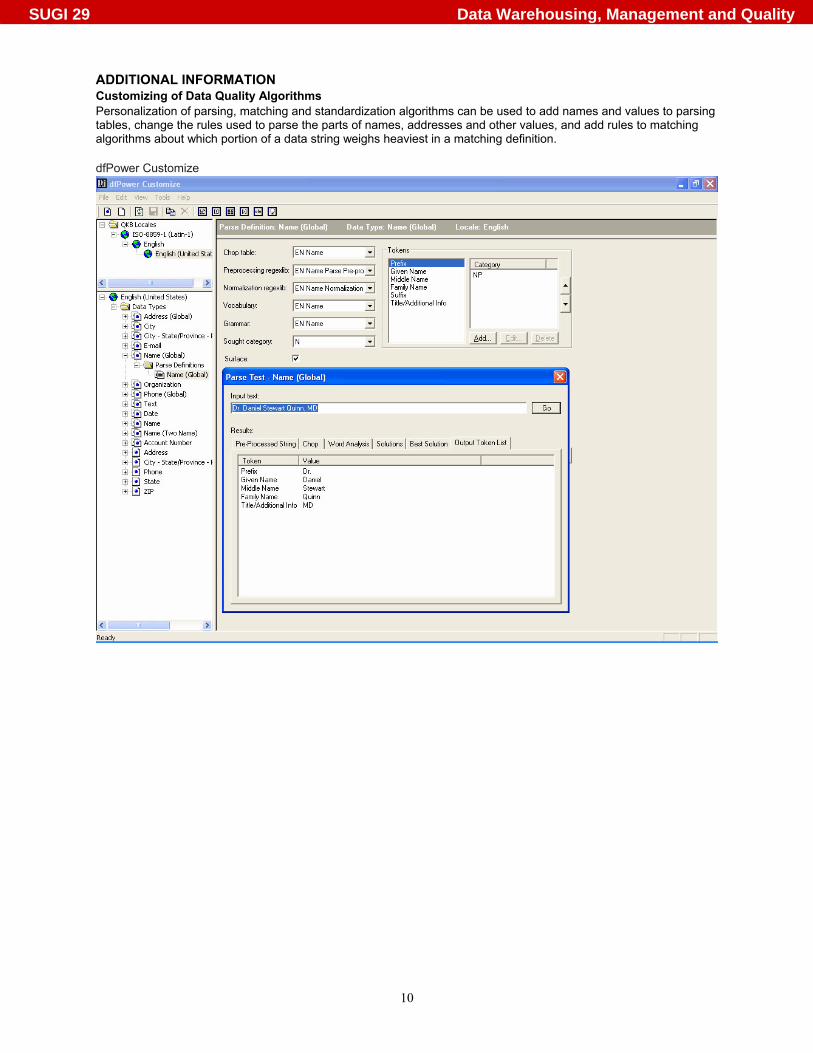
ADDITIONAL INFORMATION Customizing of Data Quality Algorithms Personalization of parsing, matching and standardization algorithms can be used to add names and values to parsing tables, change the rules used to parse the parts of names, addresses and other values, and add rules to matching algorithms about which portion of a data string weighs heaviest in a matching definition. dfPower Customize
SUGI 29 Data Warehousing, Management and Quality
11
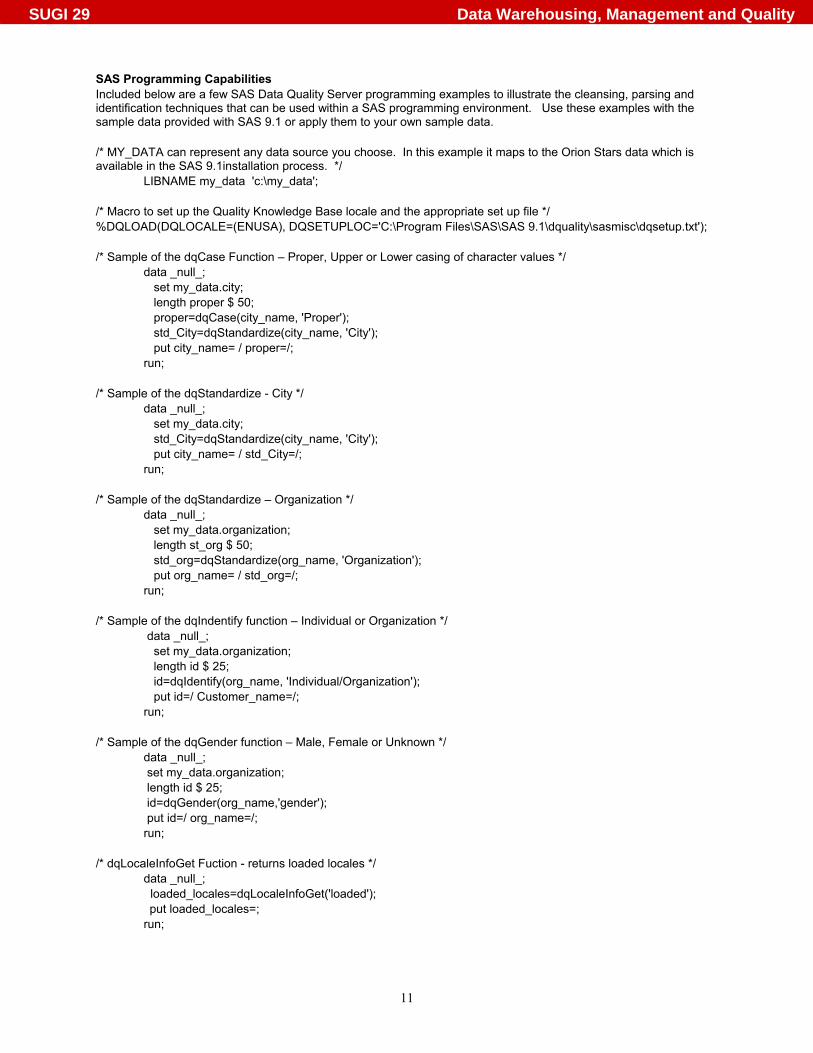
SAS Programming Capabilities Included below are a few SAS Data Quality Server programming examples to illustrate the cleansing, parsing and identification techniques that can be used within a SAS programming environment. Use these examples with the sample data provided with SAS 9.1 or apply them to your own sample data. /* MY_DATA can represent any data source you choose. In this example it maps to the Orion Stars data which is available in the SAS 9.1installation process. */
LIBNAME my_data 'c:\my_data'; /* Macro to set up the Quality Knowledge Base locale and the appropriate set up file */ %DQLOAD(DQLOCALE=(ENUSA), DQSETUPLOC='C:\Program Files\SAS\SAS 9.1\dquality\sasmisc\dqsetup.txt');
/* Sample of the dqCase Function – Proper, Upper or Lower casing of character values */
data _null_; set my_data.city; length proper $ 50; proper=dqCase(city_name, 'Proper'); std_City=dqStandardize(city_name, 'City'); put city_name= / proper=/; run;
/* Sample of the dqStandardize - City */ data _null_; set my_data.city; std_City=dqStandardize(city_name, 'City'); put city_name= / std_City=/; run;
/* Sample of the dqStandardize – Organization */ data _null_; set my_data.organization; length st_org $ 50; std_org=dqStandardize(org_name, 'Organization'); put org_name= / std_org=/; run;
/* Sample of the dqIndentify function – Individual or Organization */ data _null_; set my_data.organization; length id $ 25; id=dqIdentify(org_name, 'Individual/Organization'); put id=/ Customer_name=/; run;
/* Sample of the dqGender function – Male, Female or Unknown */ data _null_; set my_data.organization; length id $ 25; id=dqGender(org_name,'gender'); put id=/ org_name=/; run;
/* dqLocaleInfoGet Fuction - returns loaded locales */ data _null_; loaded_locales=dqLocaleInfoGet('loaded'); put loaded_locales=;
run;
SUGI 29 Data Warehousing, Management and Quality
12
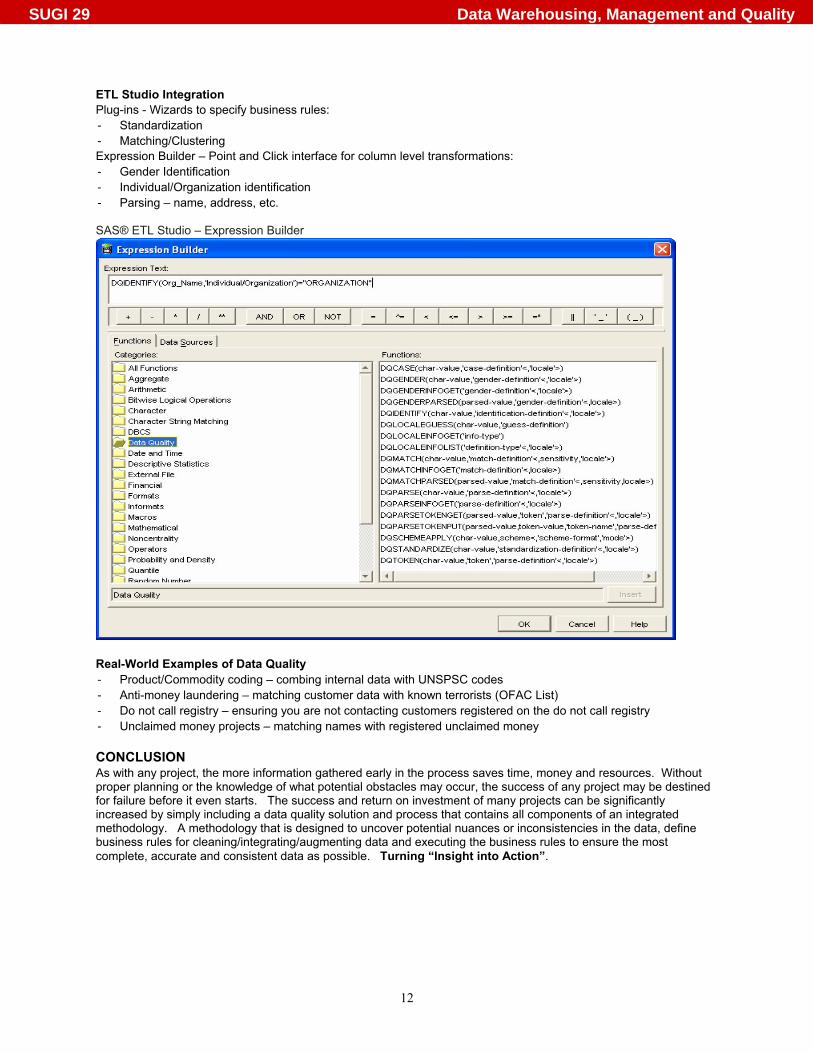
ETL Studio Integration Plug-ins - Wizards to specify business rules: - Standardization - Matching/Clustering Expression Builder – Point and Click interface for column level transformations: - Gender Identification - Individual/Organization identification - Parsing – name, address, etc. SAS® ETL Studio – Expression Builder
Real-World Examples of Data Quality - Product/Commodity coding – combing internal data with UNSPSC codes - Anti-money laundering – matching customer data with known terrorists (OFAC List) - Do not call registry – ensuring you are not contacting customers registered on the do not call registry - Unclaimed money projects – matching names with registered unclaimed money
CONCLUSION As with any project, the more information gathered early in the process saves time, money and resources. Without proper planning or the knowledge of what potential obstacles may occur, the success of any project may be destined for failure before it even starts. The success and return on investment of many projects can be significantly increased by simply including a data quality solution and process that contains all components of an integrated methodology. A methodology that is designed to uncover potential nuances or inconsistencies in the data, define business rules for cleaning/integrating/augmenting data and executing the business rules to ensure the most complete, accurate and consistent data as possible. Turning “Insight into Action”.
SUGI 29 Data Warehousing, Management and Quality
13
REFERENCES SAS® ETLQ – Revolutionizing the data integration platform , SAS Institute Inc. Better Decisions Through Better Data Quality Management, DataFlux TDWI Report Series, Data Quality and the Bottom Line: Achieving Business Success through a Commitment to High Quality Data, by Wayne Eckerson, January 2002 BetterManagement.com Seminar, Bad Data is Bad Business, Ted Friedman, Principal Analyst at Gartner
CONTACT INFORMATION Eric J. Hunley SAS Institute Inc. SAS Campus Drive Cary, NC 27513 919/677-8000 [email protected] www.sas.com
SAS and all other SAS Institute Inc. product or service names are registered trademarks or trademarks of SAS Institute Inc. in the USA and other countries. ® indicates USA registration. Other brand and product names are trademarks of their respective companies.
SUGI 29 Data Warehousing, Management and Quality