Embed Size (px)
Citation preview

IOP Conference Series Materials Science and Engineering
PAPER bull OPEN ACCESS
Numerical investigation of a thick plate restrictionorifice on the pressure drop performanceTo cite this article K H Yau et al 2017 IOP Conf Ser Mater Sci Eng 243 012028
View the article online for updates and enhancements
Recent citationsInvestigation of flow through the two-stageorificeJunxia Gao and Fenghe Wu
-
This content was downloaded from IP address 6521228167 on 03102021 at 1333
1
Content from this work may be used under the terms of the Creative Commons Attribution 30 licence Any further distributionof this work must maintain attribution to the author(s) and the title of the work journal citation and DOI
Published under licence by IOP Publishing Ltd
1234567890
CFDRI2017 IOP Publishing
IOP Conf Series Materials Science and Engineering 243 (2017) 012028 doi1010881757-899X2431012028
Numerical investigation of a thick plate restriction orifice on
the pressure drop performance
K H Yau1 E C Kua2 and S Balvinder3 1 Dunham-Bush Industries Sdn Bhd 43000 Kajang Malaysia 2 School of Engineering Monash University Malaysia 47500 Selangor Malaysia 3 Faculty of Engineering and the Built Environment SEGI University 47810
Selangor Malaysia
Email yaukhdunham-bushcom
Abstract This paper presents a numerical study on the thick plate restriction orifice on the
pressure drop performance due to various orifice ratio The restriction orifice was
investigated using commercial software package namely ANSYS The restriction orifice was
modelled using built-in modeler and simulated using Fluent module The orifice ratio was
varied in the range of 05 to 075 Various flow velocities were applied from 50 to 420 ms
The fluid flow in the constriction was hydrocarbon in vapour phase The preliminary results of
discharge coefficients were compared with literature and theoretical values between a sharp-
edged and thick plate orifice to show a consistent trend The results yielded that as the
Reynolds number Re increases the pressure drop performance increases exponentially This is
more prominent at high Re of 875times106 where the pressure drop increases by 63 from the
baseline of Re number 108times106 based on orifice ratio of 075 For a hydrocarbon with low
rheological properties and high Re number the orifice ratio is best at higher range of 075
which show a pressure drop of 018 MPa
1 Introduction
A restriction orifice is commonly used as the fundamental of orifice meters for many decades and
until recently the restriction orifice is utilized as pressure-reducing device to reduce the acoustic
induced-vibration in a piping system Typically the piping system in a high pressure letdown scenario
of a typical process industry is usually installed with a pressure control valve for gas or vapour flow
The downstream flow after the pressure control valve has very high pressure which causes vibration in
the pipe and subsequently induce an undesirable high frequency noise In addition to noise generation
the vibration eventually causes dynamic failure in the pipe over a short period of time
Some of the restriction orifices [1-7] are (a) sharp-edged (b) square-edged (thick plate) (c)
quadrant-edged and (d) conical-edged orifice as shown in figure 1 respectively The shape of the
orifice affects the flow behaviour at the constriction and subsequently affects the local pressure drop
and velocity at the exit of the orifice which creates a vena contracta shown in figure 1 The orifice
ratio is defined as the diameter of the orifice d to the inner diameter of the pipe D also shown in
figure 1
2
1234567890
CFDRI2017 IOP Publishing
IOP Conf Series Materials Science and Engineering 243 (2017) 012028 doi1010881757-899X2431012028
Figure 1 Restriction orifice for (a) sharp-edged (b) square-edged (c) quadrant-edged and (d)
conical-edged [457]
There are two measurements of the pressure drop performance [7] for a restriction orifice which is
defined at three pressure locations conveniently labelled as P1 P2 and P3 as shown in figure 2 These
locations P1 P2 and P3 are called upstream pressure throat pressure and final recovery pressure
respectively The pressure drop between P1 and P2 is called the orifice pressure drop ∆119875119900119903119894119891 On the
other hand the pressure drop between P1 and P3 is called the permanent pressure drop ∆119875119901119890119903119898
The hydraulic performance of the orifice is defined by the discharge coefficient CD which is shown
in equation (1) is based on [7] The discharge coefficient is dependent on the volume flowrate orifice
ratio orifice area and the pressure drop [45]
Discharge coefficient CD
119862119863 =119876119907radic1minus1205734
119860119874120576radic2∆119875119900119903119894119891120588 (1)
where 119862D is the discharge coefficient (-) 119876119907 is the volumetric flowrate (m3s) 120576 is the expansibility
factor (1 for incompressible fluid) (-) ∆119875119900119903119894119891 is the pressure drop across orifice (P1 ndash P2) (Pa) 120588 is the
fluid density (kgm3) 120573 is the orifice diameter to inner pipe diameter (-) and Ao is the cross-sectional
area of the orifice (m2)
(a)
(b)
Vena contracta
Flow
Flow
D d 120573 = 119889 119863
Min 30
Max 01d
(c)
Flow
(d)
Flow Radius
3
1234567890
CFDRI2017 IOP Publishing
IOP Conf Series Materials Science and Engineering 243 (2017) 012028 doi1010881757-899X2431012028
Figure 2 Orifice pressure drop (P1 ndash P2) and permanent pressure drop (P1 ndash P3) [7]
In these papers from Kumar [3] and Huang [7] they studied the effect of various orifice design on
the pressure drop performance based on discharge coefficient CD and compared the results to a
standard flat orifice using air as single-phase gas fluid In Kumarrsquos study [3] they investigated
numerically the effect of slotted orifice on the discharge coefficient CD by using air as two-phase
flow liquid-vapor medium They varied the aspect ratios of slotted orifices from 15 to 30 and fixed
at orifice ratio of 04 They found that for a slotted orifice a low orifice ratio is more sensitive to
liquid presence in the stream and hence is preferable for wet gas metering
On the other hand Huang [7] studied experimentally on a perforated orifice which shown a higher
discharge coefficient CD of 225 to 256 than a standard orifice using water as single phase liquid
medium Their perforated orifice had at least 6 orifices in a diameter as compared to a single orifice
They varied different orifice ratios for perforated orifices from 0338 to 0668 and also varied mass
flow rates from 0 to 4000 kghr
In another paper by Buker [8] they studied the Reynolds number dependence on a sharp-edged
orifice and compared with two different designs of orifice with attached protrusion on the bottom and
top as shown in figure 3 They found that the Reynolds number for a sharp-edge orifice have
insignificant effect on the discharge coefficient CD at lower range of orifice ratio from 01 to 03 An
inflection point on the discharge coefficient CD can be observed when the orifice ratios are increased
from 05 to 065 for different Reynolds number
There is one paper by Geng [9] also studied the slotted orifice plate and a standard flat orifice using
numerical and experimental method for a gas flow The standard flat orifice was simulated under one
single orifice ratio for different mass flow rates The slotted orifice shown a higher drag coefficient by
about 5 as compared to a standard flat orifice The results were compared experimentally to show a
relative error within 10 for a slotted orifice
A review on recent papers on orifice plates shows that most of the researchers are keen on irregular
shapes such as slotted [10] and concentric shape [11] where both papers used tomography method and
numerical method to observe the flow in the orifice qualitatively respectively The tomography
method [10] was performed on a two-phase flow in the slotted orifice to show an optimum
homogeneous flow at xD of 15 and 25 The numerical results of concentric shape [11] was compared
with theoretical discharge coefficients and found that the relative errors agreed within 105 Flow
separation was observed at the bottom part of the upstream and downstream of concentric plate and
not present for an eccentric orifice plate
P1
P2
Orifice
pressure drop ΔPorif
(P1 ndash P2)
Permanent
pressure drop ΔPperm
(P1 ndash P3)
P3
Flow in
4
1234567890
CFDRI2017 IOP Publishing
IOP Conf Series Materials Science and Engineering 243 (2017) 012028 doi1010881757-899X2431012028
Figure 3 Different shape of orifice used in the study by Buker et al [8]
All of the papers reviewed [3-11] show that the standard flat orifice used were at limited range and
variations which were reported at a single parameters of geometrical design constriction ratio flow
rate and fluid ie water or gas Other information pertaining to the standard orifice data is very scarce
and difficult to obtain due to confidentiality and proprietary from the manufacturer Millers [6]
coefficient of discharge CD are widely used in the theoretical calculations for orifice meters flow
nozzles and Venturi meters Thus in this paper the aim is to study the effect of various Reynolds
number Re and orifice ratio on the pressure drop performance and drag coefficients of a thick plate
restriction orifice
2 Methodology
The numerical software package by Fluent ANSYS (Version 17) was utilized to solve the fluid
complex equations of continuity momentum and energy as shown in equation (2) (3) and (4)
respectively A square-edged restriction orifice was modelled in 3-dimensional in a cylindrical pipe In
the setup of the model some assumptions made were (a) steady-state flow (b) isothermal condition
across the flow boundary (c) no-slip boundary condition (d) no penetration from the pipe wall region
to the gas flow margin (e) no wall roughness and (f) incompressible flow
Continuity equation
120597120588
120597119905+ nabla ∙ (120588 ) = 0 (2)
Momentum equation
120597
120597119905(120588 ) + nabla ∙ (120588119906119906 ) = minusnabla119901 + nabla120591 (3)
Energy equation
120597
120597119905(120588 ) + nabla ∙ ( (120588119864 + 119875)) = 0 (4)
where is the density u is the velocity P is the pressure is the viscous stress tensor E is the energy
All cases were simulated in turbulence flow regime (Re gt 1times105) using standard k- model based
on the recommendation by Kumar et al [3] The equations for k and are as follows
120597
120597119905(120588119896) +
120597
120597119905(120588119896119906119894) =
120597
120597119909119895[(120583 +
120583119905
120590119896)
120597119896
120597119909119895] + 119866119896 minus 120588120576 (5)
120597
120597119905(120588120576) +
120597
120597119905(120588120576119906119894) =
120597
120597119909119895[(120583 +
120583119905
120590120576)
120597120576
120597119909119895] + 1198621120576
120576
119896119866119896 minus 1198622120576120588
1205762
119896 (6)
where Gk is the generation of turbulence kinetic energy due to mean velocity gradients and C1 C2 k
are the standard k- model constants and t is the turbulent viscosity (1205881198621205831198962
120576)
Two different designs
of orifice
Standard orifice
with sharp-edged
5
1234567890
CFDRI2017 IOP Publishing
IOP Conf Series Materials Science and Engineering 243 (2017) 012028 doi1010881757-899X2431012028
The geometrical dimensions for restriction orifice followed from design standard BS1042 and
manufacturer technical sheet from Fisher (6011 US) as shown in figure 4 The entrance and exit
length from the orifice was based on the recommendation from Kumar [3] which was 5D before and
10D after the orifice to ensure the flow was fully developed The diameter of the pipe D was at 03 m
Hence the length of the pipe was 15 m and 30 m for entrance length and exit length respectively
The fluid used throughout the investigation was a hydrocarbon in gas phase in a process line where
the properties of the process gas are summarized in table 1 The variable parameters for simulation are
summarized in table 2 The velocities and orifice ratio selected were arbitrarily and within the
recommended range as proposed by an industry
The mass flow rate Qv can be calculated using standard orifice meter shown in equation (7) based
on the re-arrangement of equation (1) The calculated theoretical flow rate as a function of Reynolds
number Re is based on pipe diameter D given in equation (8)
119876119907 =119862119863∙119860119874∙120576radic2∆119875119900119903119894119891120588
radic1minus1205734 (7)
119877119890119863 =120588119907119863
120583 (8)
where is the fluid density (kgm3) v is the fluid velocity (ms) D is the pipe diameter (m) and is
the fluid dynamic viscosity (Pas)
Pressure drop ∆119875 of an internal flow due fluid viscous effect can be calculated in equation (9)
based on the Darcy friction factor
∆119875 = 119891119871
119863
120588v2
2 (9)
where f is the Darcy friction factor (-) L is the pipe length (m) D is the pipe diameter (m) and v22 is
the dynamic pressure (Pa)
Figure 4 3-D model of orifice with boundary conditions
Table 1 Fluid properties of the hydrocarbon gas
Properties Value
Density (kgm3) 907 times 10-1
Viscosity (cP) 130 times 10-2
Molecular Weight (gmol) 213
Table 2 Variable parameters for simulation
Parameter Value
Velocity v (ms) 50 100 200 300 420
Orifice ratio (-) 05 07 075
Inlet fluid
flow
Outlet fluid
flow D
5D 10D
d
00284 m
Wall
boundary
P1 P2
6
1234567890
CFDRI2017 IOP Publishing
IOP Conf Series Materials Science and Engineering 243 (2017) 012028 doi1010881757-899X2431012028
The downstream velocity v2 can be calculated using theoretical formula based on the orifice ratio
as shown in equation (10)
v2 = radic2∆119875119901119890119903119898
120588(1minus1205734) (10)
where Pperm is the permanent pressure drop (P1 ndash P3) (Pa) is the fluid density (kgm3) and is the
orifice ratio (-)
21 Mesh Generation
The model was generated with unstructured tetrahedral mesh for simple boundaries For complex
regions such as the constriction area in the restriction orifice were generated with structured
hexahedral with at least mesh size of 0001 mm as shown in the cross-section in figure 5
Figure 5 Mesh generation of restriction orifice
22 Convergence Criterion
The convergence criterion of the simulation was based on the residual value of calculated variables
such as mass velocity components turbulent kinetic energy k and turbulent kinetic energy
dissipation rate The simulation was considered as converged when all other variables residual
achieved a value of less than 10-4 when the plots reached a minimum plateau
3 Grid Independence Study
The number of mesh generated was from 056 times 106 to 110 times 106 and the acceptable mesh size was
chosen at 096 times 106 based on the trend that plateau after that mesh size The result of the grid
independence study is plotted in figure 6 Based on this selected mesh size all other models due to
different orifice ratios were mesh generated within this range
Figure 6 Grid independence study on the restriction orifice
500
520
540
560
580
600
04 05 06 07 08 09 1 11 12
Pre
ssu
re d
rop
P(k
Pa)
No of mesh generated (106)
Cross-section of the orifice
7
1234567890
CFDRI2017 IOP Publishing
IOP Conf Series Materials Science and Engineering 243 (2017) 012028 doi1010881757-899X2431012028
4 Results and Discussions
The results from the numerical study such as drag coefficient CD pressure distribution P orifice
pressure drop Porif velocity contour and pressure contour for different orifice ratio are discussed
As a direct comparison with similar setup and conditions are difficult as aforementioned in the
literature review the closest possible range of conditions fluid and geometry are compared with
Kumar [3] Miller [6] and Buker [9] The drag coefficients CD are shown in figure 7 8 and 9 A
theoretical comparison is also demonstrated using internal flow equation of volume flowrate from the
pressure drop performance is shown in figure 9 The plots of pressure distribution against axial
distance x from the pipe entrance to the exit where total length is 45 m are plotted in figure 10
Shown in figure 7 the shape of the orifice affects the discharge coefficient by about 64 as
compared between a sharp-edged and a thick plate orifice The thick plate orifice has lower discharge
coefficient than the sharp-edged orifice Similarly both have an increasing trend when the orifice ratio
increase However based on the theoretical results by Buker [9] the discharge coefficient CD for a
sharp-edged orifice reaches to a peak at orifice ratio of 063 and CD reduces beyond that orifice
ratio An extrapolation of the theoretical results by Buker [9] shows that an intersection at orifice ratio
of 071 between thick plate and sharp-edged orifice
The results of discharge coefficients CD for different Reynolds number Re are plotted in Figure 8
where a comparison with Buker [9] for orifice ratio of 05 for sharp-edged orifice Buker [9] results
were of higher margin than the current study due to the shape of the orifice A thick plate orifice has
lower discharge coefficients due to larger drag area than the sharp-edge orifice and also due to the
rheological properties of the hydrocarbon fluid where density and viscosity is lower than air by about
263 and 273 respectively The flow performance of downstream velocities were calculated based
on the permanent pressure drop Pperm from simulation using equation (9) and compared with
theoretical equation (10) which shown a deviation of 663 to 202 in figure 9 This is expected due
to the absence of discharge coefficient CD in the theoretical flow equation and a similar error margin
of 105 was also demonstrated in paper [11]
Based on figure 10 the pressure distributions show a similar trend with Kumar [3] where a direct
comparison is not possible due to the different fluid and velocities being used The model was
extended to orifice ratio of 070 and 075 for velocities of 50 to 420 ms to observe the trend The
pressure distribution can be observed that as the velocity increases the pressure decreases by about
460 at the highest velocity of 420 ms for orifice ratio of 05 This is expected as the orifice is so
narrow that the passage will incur a high pressure drop On the other hand the orifice ratio of 070 and
075 yields about 87 and 48 in pressure reduction respectively
Figure 7 Discharge coefficients CD for different orifice ratio
000
010
020
030
040
050
060
070
045 05 055 06 065 07 075 08
Dis
char
ge c
oef
fici
ent
CD
Orifice ratio
Buker et al [9]
This study
Extrapolation
Thick plate orifice (hydrocarbon)
Sharp-edged orifice (air)
64
8
1234567890
CFDRI2017 IOP Publishing
IOP Conf Series Materials Science and Engineering 243 (2017) 012028 doi1010881757-899X2431012028
Figure 8 Discharge coefficient CD versus
Reynolds number Re for different orifice ratio
Figure 9 A comparison of flow performance
between simulation and theoretical values
(a) (b)
(c)
Figure 10 Pressure profiles along the distance x for different orifice ratios of (a) 05 (b) 07
and (c) 075
0
01
02
03
04
05
06
07
000E+00 200E+06 400E+06
Dis
char
ge c
oef
fici
ent
CD
Reynolds number Re (106)
Buker et al [9] - 05
05
07
075
Buker [9] - (05)
(05)
(07)
(075)This study (thick plate orifice)
Sharp-edged orifice
0
202
111
663
0
5
10
15
20
25
05 07 075
Per
cen
tage
dev
iati
on
bet
wee
n
theo
reti
cal a
nd
sim
ula
ted
d
ow
nst
ream
vel
oci
ty
Orifice ratio
-050
000
050
100
150
200
250
0 1 2 3 4 5
Pre
ssu
re
P(M
Pa)
Axial distance x (m)
50 ms
100 ms
200 ms
300 ms
420 ms
0
01
02
03
04
05
06
07
08
0 1 2 3 4 5
Pre
ssu
re
P(M
Pa)
Axial distance x (m)
50 ms
100 ms
200 ms
300 ms
420 ms
0
01
02
03
04
05
06
07
0 1 2 3 4 5
Pre
ssu
re
P(M
Pa)
Axial distance x (m)
50 ms
100 ms
200 ms
300 ms
420 ms
9
1234567890
CFDRI2017 IOP Publishing
IOP Conf Series Materials Science and Engineering 243 (2017) 012028 doi1010881757-899X2431012028
The permanent pressure drop Pperm (P1 ndash P3) for different orifice ratios and different Reynolds
number Re are plotted in figure 11 As the orifice ratio increases the pressure drop also increases
exponentially from Re of 104times106 to 875times106 as shown in the trend lines All trend lines are plotted
with best fit R2 of 099 on average The increment in pressure drop is about 63 at orifice ratio of
075 from the same range of Reynolds number A tremendous amount of penalty in pressure drop is
observed when the orifice ratio reduces from 075 to 050 which yields to about 837 at the highest
Re of 875times106
The velocity and pressure contour for different orifice ratios is shown in figure 12 and figure 13
respectively As orifice ratio of 070 is an intermediate result between ratio of 05 and 075 only two
sets of results are shown here for orifice ratio of 050 and 075
Based on figure 12 (a) the velocity contour at orifice ratio of 050 shows that the velocity vectors
are widely scattered along axial distance demonstrating a trend of non-uniformity On the other hand
orifice ratio of 075 shows velocity vector of more uniform distribution shown in figure 12 (b) This is
similar to the pressure distribution shown in figure 13 (a) and (b) where orifice ratio of 075 is more
uniform than 050 This can be seen in the darker blue regimes between orifice ratio of 075 and 050
for Reynolds number from 104times106 to 875times106 It is desirable to have uniform pressure distribution
in a piping system than a non-uniform distribution for different Reynolds number
Figure 11 Pressure drop ΔPperm vs Reynolds number Re for different orifice ratios
000
020
040
060
080
100
120
140
160
180
200
0 1 2 3 4 5 6 7 8 9
Pre
ssu
re d
rop
P
(MP
a)
Reynolds number Re (106)
05
07
075
10
1234567890
CFDRI2017 IOP Publishing
IOP Conf Series Materials Science and Engineering 243 (2017) 012028 doi1010881757-899X2431012028
Figure 12 Velocity contour for orifice ratio of (a) 050 and (b) 075
=
=
875
625
417
208
104
875
625
417
208
104
Flow
direction Axial distance x
Re (106)
(a)
(b)
11
1234567890
CFDRI2017 IOP Publishing
IOP Conf Series Materials Science and Engineering 243 (2017) 012028 doi1010881757-899X2431012028
Figure 13 Pressure contour for orifice ratio of (a) 050 and (b) 075
5 Conclusions
In this study the velocity and pressure distribution due to different orifice ratios from 050 070 and
075 are compiled and analyzed for its pressure drop performance Based on both contours velocity
and pressure some conclusions are made
a Restriction orifice with flat protrusion has lower discharge coefficients that sharp-edged
protrusion
b Thick plate orifice of 050 provides a tremendous penalty in pressure drop that yields to about
837
c Thick plate orifice of 075 sufficiently provides a pressure drop of 63 at the highest
Reynolds number
d Velocity and pressure contours shows that the thick plate orifice of 075 provides uniform
distribution than orifice ratio of 050
6 Recommendation and Future Studies
For future studies it is recommended that (a) an experimental study to verify the thick plate shape (b)
a numerical study of a thick plate in a piping system consisting of various components and (c) a
numerical study on the thick plate in comparison with various orifice shapes on the pressure drop
performance
= 050
= 075
Axial distance x
875
625
417
208
104
875
625
417
208
104
Flow direction
Re
6
(a
)
(b
)
12
1234567890
CFDRI2017 IOP Publishing
IOP Conf Series Materials Science and Engineering 243 (2017) 012028 doi1010881757-899X2431012028
Acknowledgement
The authors would like to appreciate Dunham-Bush Industries Sdn Bhd and Engineering Monash
University Malaysia for supporting this study
References
[1] Shrouf R D 2003 Pressure and flow characteristics of restrictive Flow orifice devices (United
Sates Sandia National Laboratories Report SAND2003-1874)
[2] Geng Y F Zheng J W and Shi T M 2006 Study on the metering characteristics of a slotted
orifice for wet gas flow Flow Meas Instrum 17 123-8
[3] Kumar P and Wong M B 2011 A CFD study of low pressure wet gas metering using slotted
orifice meters Flow Meas Instrum 22 33-42
[4] Munson B R Young D F Okiishi T H and Wade W 2009 Fundamentals of Fluid
Mechanics (New York John Wiley)
[5] Perry R H and Green D W 2008 Perryrsquos Chemical Engineersrsquo Handbook (New York McGraw-
Hill)
[6] Miller R 1996 Flow Measurement Engineering Handbook (New York McGraw-Hill)
[7] Coulson J M and Richardson J F 1996 Chemical Engineering Vol 1 (London Butterworth-
Heinemann)
[8] Huang S Ma T Wang D and Lin Z 2013 Study on discharge coefficient of perforated orifices
as a new kind of flow meter Exp Therm Fluid Sci 46 74-83
[9] Buker O Lau P Tawackolian K 2013 Reynolds number dependence of an orifice plate Flow
Meas Instrum 30 123-132
[10] Annamalai G Pirouzpanah S Gidgopuram S R and Morrison G L 2016 Characterization of
flow homogeneity downstream of a slotted orifice plate in a two-phase flow using electrical
resistance tomography Flow Meas Instrum 50 209-215
[11] Zahariea D 2016 Numerical analysis of eccentric orifice plate using ANSYS Fluent software
20th Innovative Manufacturing Engineering and Energy Conf 161 012041
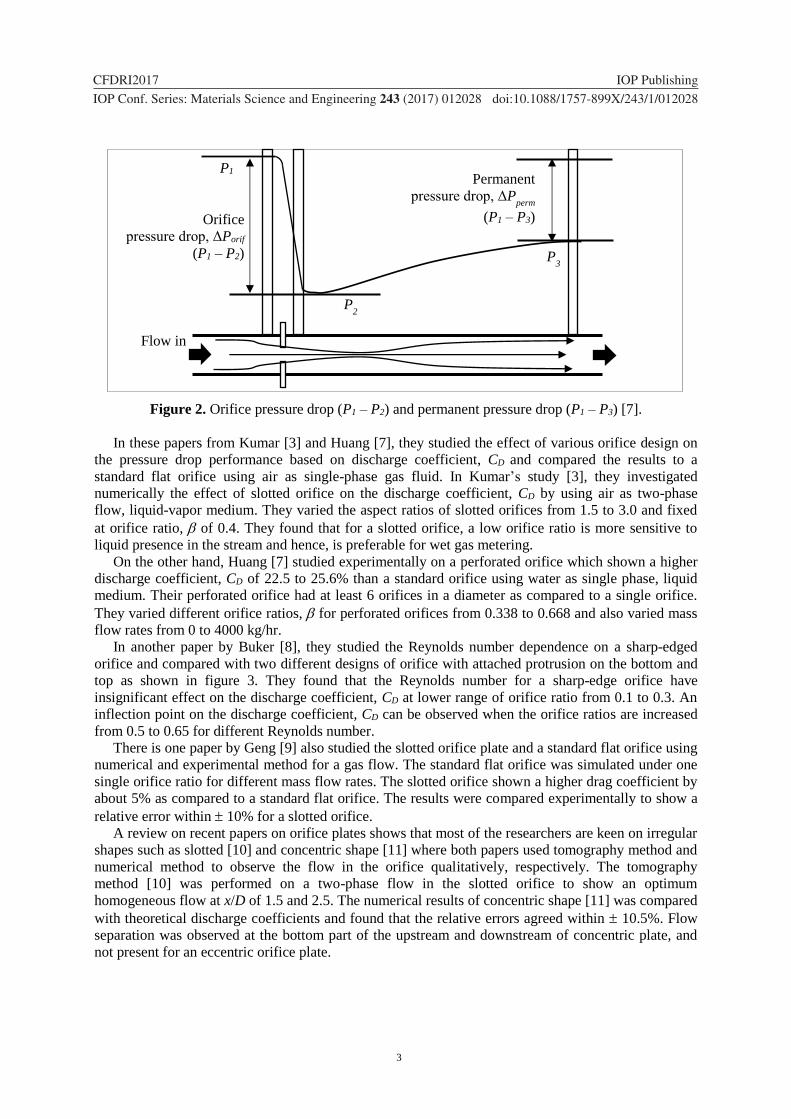
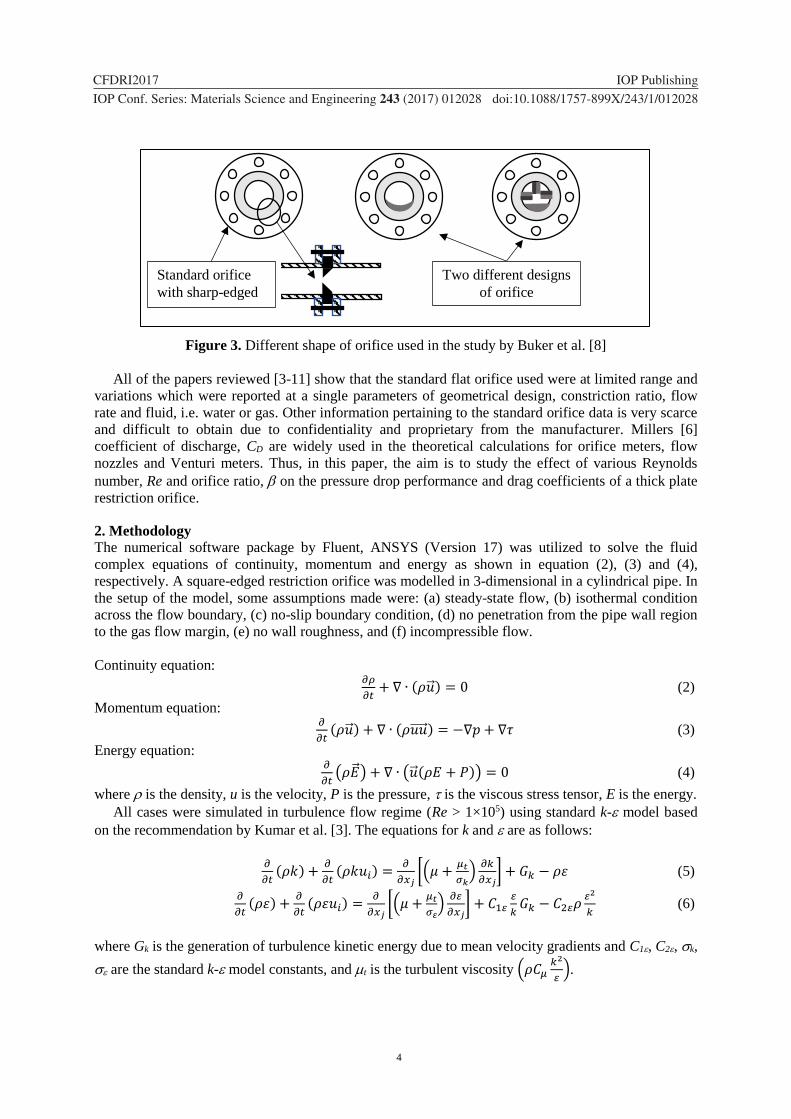

5
1234567890
CFDRI2017 IOP Publishing
IOP Conf Series Materials Science and Engineering 243 (2017) 012028 doi1010881757-899X2431012028
The geometrical dimensions for restriction orifice followed from design standard BS1042 and
manufacturer technical sheet from Fisher (6011 US) as shown in figure 4 The entrance and exit
length from the orifice was based on the recommendation from Kumar [3] which was 5D before and
10D after the orifice to ensure the flow was fully developed The diameter of the pipe D was at 03 m
Hence the length of the pipe was 15 m and 30 m for entrance length and exit length respectively
The fluid used throughout the investigation was a hydrocarbon in gas phase in a process line where
the properties of the process gas are summarized in table 1 The variable parameters for simulation are
summarized in table 2 The velocities and orifice ratio selected were arbitrarily and within the
recommended range as proposed by an industry
The mass flow rate Qv can be calculated using standard orifice meter shown in equation (7) based
on the re-arrangement of equation (1) The calculated theoretical flow rate as a function of Reynolds
number Re is based on pipe diameter D given in equation (8)
119876119907 =119862119863∙119860119874∙120576radic2∆119875119900119903119894119891120588
radic1minus1205734 (7)
119877119890119863 =120588119907119863
120583 (8)
where is the fluid density (kgm3) v is the fluid velocity (ms) D is the pipe diameter (m) and is
the fluid dynamic viscosity (Pas)
Pressure drop ∆119875 of an internal flow due fluid viscous effect can be calculated in equation (9)
based on the Darcy friction factor
∆119875 = 119891119871
119863
120588v2
2 (9)
where f is the Darcy friction factor (-) L is the pipe length (m) D is the pipe diameter (m) and v22 is
the dynamic pressure (Pa)
Figure 4 3-D model of orifice with boundary conditions
Table 1 Fluid properties of the hydrocarbon gas
Properties Value
Density (kgm3) 907 times 10-1
Viscosity (cP) 130 times 10-2
Molecular Weight (gmol) 213
Table 2 Variable parameters for simulation
Parameter Value
Velocity v (ms) 50 100 200 300 420
Orifice ratio (-) 05 07 075
Inlet fluid
flow
Outlet fluid
flow D
5D 10D
d
00284 m
Wall
boundary
P1 P2
6
1234567890
CFDRI2017 IOP Publishing
IOP Conf Series Materials Science and Engineering 243 (2017) 012028 doi1010881757-899X2431012028
The downstream velocity v2 can be calculated using theoretical formula based on the orifice ratio
as shown in equation (10)
v2 = radic2∆119875119901119890119903119898
120588(1minus1205734) (10)
where Pperm is the permanent pressure drop (P1 ndash P3) (Pa) is the fluid density (kgm3) and is the
orifice ratio (-)
21 Mesh Generation
The model was generated with unstructured tetrahedral mesh for simple boundaries For complex
regions such as the constriction area in the restriction orifice were generated with structured
hexahedral with at least mesh size of 0001 mm as shown in the cross-section in figure 5
Figure 5 Mesh generation of restriction orifice
22 Convergence Criterion
The convergence criterion of the simulation was based on the residual value of calculated variables
such as mass velocity components turbulent kinetic energy k and turbulent kinetic energy
dissipation rate The simulation was considered as converged when all other variables residual
achieved a value of less than 10-4 when the plots reached a minimum plateau
3 Grid Independence Study
The number of mesh generated was from 056 times 106 to 110 times 106 and the acceptable mesh size was
chosen at 096 times 106 based on the trend that plateau after that mesh size The result of the grid
independence study is plotted in figure 6 Based on this selected mesh size all other models due to
different orifice ratios were mesh generated within this range
Figure 6 Grid independence study on the restriction orifice
500
520
540
560
580
600
04 05 06 07 08 09 1 11 12
Pre
ssu
re d
rop
P(k
Pa)
No of mesh generated (106)
Cross-section of the orifice
7
1234567890
CFDRI2017 IOP Publishing
IOP Conf Series Materials Science and Engineering 243 (2017) 012028 doi1010881757-899X2431012028
4 Results and Discussions
The results from the numerical study such as drag coefficient CD pressure distribution P orifice
pressure drop Porif velocity contour and pressure contour for different orifice ratio are discussed
As a direct comparison with similar setup and conditions are difficult as aforementioned in the
literature review the closest possible range of conditions fluid and geometry are compared with
Kumar [3] Miller [6] and Buker [9] The drag coefficients CD are shown in figure 7 8 and 9 A
theoretical comparison is also demonstrated using internal flow equation of volume flowrate from the
pressure drop performance is shown in figure 9 The plots of pressure distribution against axial
distance x from the pipe entrance to the exit where total length is 45 m are plotted in figure 10
Shown in figure 7 the shape of the orifice affects the discharge coefficient by about 64 as
compared between a sharp-edged and a thick plate orifice The thick plate orifice has lower discharge
coefficient than the sharp-edged orifice Similarly both have an increasing trend when the orifice ratio
increase However based on the theoretical results by Buker [9] the discharge coefficient CD for a
sharp-edged orifice reaches to a peak at orifice ratio of 063 and CD reduces beyond that orifice
ratio An extrapolation of the theoretical results by Buker [9] shows that an intersection at orifice ratio
of 071 between thick plate and sharp-edged orifice
The results of discharge coefficients CD for different Reynolds number Re are plotted in Figure 8
where a comparison with Buker [9] for orifice ratio of 05 for sharp-edged orifice Buker [9] results
were of higher margin than the current study due to the shape of the orifice A thick plate orifice has
lower discharge coefficients due to larger drag area than the sharp-edge orifice and also due to the
rheological properties of the hydrocarbon fluid where density and viscosity is lower than air by about
263 and 273 respectively The flow performance of downstream velocities were calculated based
on the permanent pressure drop Pperm from simulation using equation (9) and compared with
theoretical equation (10) which shown a deviation of 663 to 202 in figure 9 This is expected due
to the absence of discharge coefficient CD in the theoretical flow equation and a similar error margin
of 105 was also demonstrated in paper [11]
Based on figure 10 the pressure distributions show a similar trend with Kumar [3] where a direct
comparison is not possible due to the different fluid and velocities being used The model was
extended to orifice ratio of 070 and 075 for velocities of 50 to 420 ms to observe the trend The
pressure distribution can be observed that as the velocity increases the pressure decreases by about
460 at the highest velocity of 420 ms for orifice ratio of 05 This is expected as the orifice is so
narrow that the passage will incur a high pressure drop On the other hand the orifice ratio of 070 and
075 yields about 87 and 48 in pressure reduction respectively
Figure 7 Discharge coefficients CD for different orifice ratio
000
010
020
030
040
050
060
070
045 05 055 06 065 07 075 08
Dis
char
ge c
oef
fici
ent
CD
Orifice ratio
Buker et al [9]
This study
Extrapolation
Thick plate orifice (hydrocarbon)
Sharp-edged orifice (air)
64
8
1234567890
CFDRI2017 IOP Publishing
IOP Conf Series Materials Science and Engineering 243 (2017) 012028 doi1010881757-899X2431012028
Figure 8 Discharge coefficient CD versus
Reynolds number Re for different orifice ratio
Figure 9 A comparison of flow performance
between simulation and theoretical values
(a) (b)
(c)
Figure 10 Pressure profiles along the distance x for different orifice ratios of (a) 05 (b) 07
and (c) 075
0
01
02
03
04
05
06
07
000E+00 200E+06 400E+06
Dis
char
ge c
oef
fici
ent
CD
Reynolds number Re (106)
Buker et al [9] - 05
05
07
075
Buker [9] - (05)
(05)
(07)
(075)This study (thick plate orifice)
Sharp-edged orifice
0
202
111
663
0
5
10
15
20
25
05 07 075
Per
cen
tage
dev
iati
on
bet
wee
n
theo
reti
cal a
nd
sim
ula
ted
d
ow
nst
ream
vel
oci
ty
Orifice ratio
-050
000
050
100
150
200
250
0 1 2 3 4 5
Pre
ssu
re
P(M
Pa)
Axial distance x (m)
50 ms
100 ms
200 ms
300 ms
420 ms
0
01
02
03
04
05
06
07
08
0 1 2 3 4 5
Pre
ssu
re
P(M
Pa)
Axial distance x (m)
50 ms
100 ms
200 ms
300 ms
420 ms
0
01
02
03
04
05
06
07
0 1 2 3 4 5
Pre
ssu
re
P(M
Pa)
Axial distance x (m)
50 ms
100 ms
200 ms
300 ms
420 ms
9
1234567890
CFDRI2017 IOP Publishing
IOP Conf Series Materials Science and Engineering 243 (2017) 012028 doi1010881757-899X2431012028
The permanent pressure drop Pperm (P1 ndash P3) for different orifice ratios and different Reynolds
number Re are plotted in figure 11 As the orifice ratio increases the pressure drop also increases
exponentially from Re of 104times106 to 875times106 as shown in the trend lines All trend lines are plotted
with best fit R2 of 099 on average The increment in pressure drop is about 63 at orifice ratio of
075 from the same range of Reynolds number A tremendous amount of penalty in pressure drop is
observed when the orifice ratio reduces from 075 to 050 which yields to about 837 at the highest
Re of 875times106
The velocity and pressure contour for different orifice ratios is shown in figure 12 and figure 13
respectively As orifice ratio of 070 is an intermediate result between ratio of 05 and 075 only two
sets of results are shown here for orifice ratio of 050 and 075
Based on figure 12 (a) the velocity contour at orifice ratio of 050 shows that the velocity vectors
are widely scattered along axial distance demonstrating a trend of non-uniformity On the other hand
orifice ratio of 075 shows velocity vector of more uniform distribution shown in figure 12 (b) This is
similar to the pressure distribution shown in figure 13 (a) and (b) where orifice ratio of 075 is more
uniform than 050 This can be seen in the darker blue regimes between orifice ratio of 075 and 050
for Reynolds number from 104times106 to 875times106 It is desirable to have uniform pressure distribution
in a piping system than a non-uniform distribution for different Reynolds number
Figure 11 Pressure drop ΔPperm vs Reynolds number Re for different orifice ratios
000
020
040
060
080
100
120
140
160
180
200
0 1 2 3 4 5 6 7 8 9
Pre
ssu
re d
rop
P
(MP
a)
Reynolds number Re (106)
05
07
075
10
1234567890
CFDRI2017 IOP Publishing
IOP Conf Series Materials Science and Engineering 243 (2017) 012028 doi1010881757-899X2431012028
Figure 12 Velocity contour for orifice ratio of (a) 050 and (b) 075
=
=
875
625
417
208
104
875
625
417
208
104
Flow
direction Axial distance x
Re (106)
(a)
(b)
11
1234567890
CFDRI2017 IOP Publishing
IOP Conf Series Materials Science and Engineering 243 (2017) 012028 doi1010881757-899X2431012028
Figure 13 Pressure contour for orifice ratio of (a) 050 and (b) 075
5 Conclusions
In this study the velocity and pressure distribution due to different orifice ratios from 050 070 and
075 are compiled and analyzed for its pressure drop performance Based on both contours velocity
and pressure some conclusions are made
a Restriction orifice with flat protrusion has lower discharge coefficients that sharp-edged
protrusion
b Thick plate orifice of 050 provides a tremendous penalty in pressure drop that yields to about
837
c Thick plate orifice of 075 sufficiently provides a pressure drop of 63 at the highest
Reynolds number
d Velocity and pressure contours shows that the thick plate orifice of 075 provides uniform
distribution than orifice ratio of 050
6 Recommendation and Future Studies
For future studies it is recommended that (a) an experimental study to verify the thick plate shape (b)
a numerical study of a thick plate in a piping system consisting of various components and (c) a
numerical study on the thick plate in comparison with various orifice shapes on the pressure drop
performance
= 050
= 075
Axial distance x
875
625
417
208
104
875
625
417
208
104
Flow direction
Re
6
(a
)
(b
)
12
1234567890
CFDRI2017 IOP Publishing
IOP Conf Series Materials Science and Engineering 243 (2017) 012028 doi1010881757-899X2431012028
Acknowledgement
The authors would like to appreciate Dunham-Bush Industries Sdn Bhd and Engineering Monash
University Malaysia for supporting this study
References
[1] Shrouf R D 2003 Pressure and flow characteristics of restrictive Flow orifice devices (United
Sates Sandia National Laboratories Report SAND2003-1874)
[2] Geng Y F Zheng J W and Shi T M 2006 Study on the metering characteristics of a slotted
orifice for wet gas flow Flow Meas Instrum 17 123-8
[3] Kumar P and Wong M B 2011 A CFD study of low pressure wet gas metering using slotted
orifice meters Flow Meas Instrum 22 33-42
[4] Munson B R Young D F Okiishi T H and Wade W 2009 Fundamentals of Fluid
Mechanics (New York John Wiley)
[5] Perry R H and Green D W 2008 Perryrsquos Chemical Engineersrsquo Handbook (New York McGraw-
Hill)
[6] Miller R 1996 Flow Measurement Engineering Handbook (New York McGraw-Hill)
[7] Coulson J M and Richardson J F 1996 Chemical Engineering Vol 1 (London Butterworth-
Heinemann)
[8] Huang S Ma T Wang D and Lin Z 2013 Study on discharge coefficient of perforated orifices
as a new kind of flow meter Exp Therm Fluid Sci 46 74-83
[9] Buker O Lau P Tawackolian K 2013 Reynolds number dependence of an orifice plate Flow
Meas Instrum 30 123-132
[10] Annamalai G Pirouzpanah S Gidgopuram S R and Morrison G L 2016 Characterization of
flow homogeneity downstream of a slotted orifice plate in a two-phase flow using electrical
resistance tomography Flow Meas Instrum 50 209-215
[11] Zahariea D 2016 Numerical analysis of eccentric orifice plate using ANSYS Fluent software
20th Innovative Manufacturing Engineering and Energy Conf 161 012041

6
1234567890
CFDRI2017 IOP Publishing
IOP Conf Series Materials Science and Engineering 243 (2017) 012028 doi1010881757-899X2431012028
The downstream velocity v2 can be calculated using theoretical formula based on the orifice ratio
as shown in equation (10)
v2 = radic2∆119875119901119890119903119898
120588(1minus1205734) (10)
where Pperm is the permanent pressure drop (P1 ndash P3) (Pa) is the fluid density (kgm3) and is the
orifice ratio (-)
21 Mesh Generation
The model was generated with unstructured tetrahedral mesh for simple boundaries For complex
regions such as the constriction area in the restriction orifice were generated with structured
hexahedral with at least mesh size of 0001 mm as shown in the cross-section in figure 5
Figure 5 Mesh generation of restriction orifice
22 Convergence Criterion
The convergence criterion of the simulation was based on the residual value of calculated variables
such as mass velocity components turbulent kinetic energy k and turbulent kinetic energy
dissipation rate The simulation was considered as converged when all other variables residual
achieved a value of less than 10-4 when the plots reached a minimum plateau
3 Grid Independence Study
The number of mesh generated was from 056 times 106 to 110 times 106 and the acceptable mesh size was
chosen at 096 times 106 based on the trend that plateau after that mesh size The result of the grid
independence study is plotted in figure 6 Based on this selected mesh size all other models due to
different orifice ratios were mesh generated within this range
Figure 6 Grid independence study on the restriction orifice
500
520
540
560
580
600
04 05 06 07 08 09 1 11 12
Pre
ssu
re d
rop
P(k
Pa)
No of mesh generated (106)
Cross-section of the orifice
7
1234567890
CFDRI2017 IOP Publishing
IOP Conf Series Materials Science and Engineering 243 (2017) 012028 doi1010881757-899X2431012028
4 Results and Discussions
The results from the numerical study such as drag coefficient CD pressure distribution P orifice
pressure drop Porif velocity contour and pressure contour for different orifice ratio are discussed
As a direct comparison with similar setup and conditions are difficult as aforementioned in the
literature review the closest possible range of conditions fluid and geometry are compared with
Kumar [3] Miller [6] and Buker [9] The drag coefficients CD are shown in figure 7 8 and 9 A
theoretical comparison is also demonstrated using internal flow equation of volume flowrate from the
pressure drop performance is shown in figure 9 The plots of pressure distribution against axial
distance x from the pipe entrance to the exit where total length is 45 m are plotted in figure 10
Shown in figure 7 the shape of the orifice affects the discharge coefficient by about 64 as
compared between a sharp-edged and a thick plate orifice The thick plate orifice has lower discharge
coefficient than the sharp-edged orifice Similarly both have an increasing trend when the orifice ratio
increase However based on the theoretical results by Buker [9] the discharge coefficient CD for a
sharp-edged orifice reaches to a peak at orifice ratio of 063 and CD reduces beyond that orifice
ratio An extrapolation of the theoretical results by Buker [9] shows that an intersection at orifice ratio
of 071 between thick plate and sharp-edged orifice
The results of discharge coefficients CD for different Reynolds number Re are plotted in Figure 8
where a comparison with Buker [9] for orifice ratio of 05 for sharp-edged orifice Buker [9] results
were of higher margin than the current study due to the shape of the orifice A thick plate orifice has
lower discharge coefficients due to larger drag area than the sharp-edge orifice and also due to the
rheological properties of the hydrocarbon fluid where density and viscosity is lower than air by about
263 and 273 respectively The flow performance of downstream velocities were calculated based
on the permanent pressure drop Pperm from simulation using equation (9) and compared with
theoretical equation (10) which shown a deviation of 663 to 202 in figure 9 This is expected due
to the absence of discharge coefficient CD in the theoretical flow equation and a similar error margin
of 105 was also demonstrated in paper [11]
Based on figure 10 the pressure distributions show a similar trend with Kumar [3] where a direct
comparison is not possible due to the different fluid and velocities being used The model was
extended to orifice ratio of 070 and 075 for velocities of 50 to 420 ms to observe the trend The
pressure distribution can be observed that as the velocity increases the pressure decreases by about
460 at the highest velocity of 420 ms for orifice ratio of 05 This is expected as the orifice is so
narrow that the passage will incur a high pressure drop On the other hand the orifice ratio of 070 and
075 yields about 87 and 48 in pressure reduction respectively
Figure 7 Discharge coefficients CD for different orifice ratio
000
010
020
030
040
050
060
070
045 05 055 06 065 07 075 08
Dis
char
ge c
oef
fici
ent
CD
Orifice ratio
Buker et al [9]
This study
Extrapolation
Thick plate orifice (hydrocarbon)
Sharp-edged orifice (air)
64
8
1234567890
CFDRI2017 IOP Publishing
IOP Conf Series Materials Science and Engineering 243 (2017) 012028 doi1010881757-899X2431012028
Figure 8 Discharge coefficient CD versus
Reynolds number Re for different orifice ratio
Figure 9 A comparison of flow performance
between simulation and theoretical values
(a) (b)
(c)
Figure 10 Pressure profiles along the distance x for different orifice ratios of (a) 05 (b) 07
and (c) 075
0
01
02
03
04
05
06
07
000E+00 200E+06 400E+06
Dis
char
ge c
oef
fici
ent
CD
Reynolds number Re (106)
Buker et al [9] - 05
05
07
075
Buker [9] - (05)
(05)
(07)
(075)This study (thick plate orifice)
Sharp-edged orifice
0
202
111
663
0
5
10
15
20
25
05 07 075
Per
cen
tage
dev
iati
on
bet
wee
n
theo
reti
cal a
nd
sim
ula
ted
d
ow
nst
ream
vel
oci
ty
Orifice ratio
-050
000
050
100
150
200
250
0 1 2 3 4 5
Pre
ssu
re
P(M
Pa)
Axial distance x (m)
50 ms
100 ms
200 ms
300 ms
420 ms
0
01
02
03
04
05
06
07
08
0 1 2 3 4 5
Pre
ssu
re
P(M
Pa)
Axial distance x (m)
50 ms
100 ms
200 ms
300 ms
420 ms
0
01
02
03
04
05
06
07
0 1 2 3 4 5
Pre
ssu
re
P(M
Pa)
Axial distance x (m)
50 ms
100 ms
200 ms
300 ms
420 ms
9
1234567890
CFDRI2017 IOP Publishing
IOP Conf Series Materials Science and Engineering 243 (2017) 012028 doi1010881757-899X2431012028
The permanent pressure drop Pperm (P1 ndash P3) for different orifice ratios and different Reynolds
number Re are plotted in figure 11 As the orifice ratio increases the pressure drop also increases
exponentially from Re of 104times106 to 875times106 as shown in the trend lines All trend lines are plotted
with best fit R2 of 099 on average The increment in pressure drop is about 63 at orifice ratio of
075 from the same range of Reynolds number A tremendous amount of penalty in pressure drop is
observed when the orifice ratio reduces from 075 to 050 which yields to about 837 at the highest
Re of 875times106
The velocity and pressure contour for different orifice ratios is shown in figure 12 and figure 13
respectively As orifice ratio of 070 is an intermediate result between ratio of 05 and 075 only two
sets of results are shown here for orifice ratio of 050 and 075
Based on figure 12 (a) the velocity contour at orifice ratio of 050 shows that the velocity vectors
are widely scattered along axial distance demonstrating a trend of non-uniformity On the other hand
orifice ratio of 075 shows velocity vector of more uniform distribution shown in figure 12 (b) This is
similar to the pressure distribution shown in figure 13 (a) and (b) where orifice ratio of 075 is more
uniform than 050 This can be seen in the darker blue regimes between orifice ratio of 075 and 050
for Reynolds number from 104times106 to 875times106 It is desirable to have uniform pressure distribution
in a piping system than a non-uniform distribution for different Reynolds number
Figure 11 Pressure drop ΔPperm vs Reynolds number Re for different orifice ratios
000
020
040
060
080
100
120
140
160
180
200
0 1 2 3 4 5 6 7 8 9
Pre
ssu
re d
rop
P
(MP
a)
Reynolds number Re (106)
05
07
075
10
1234567890
CFDRI2017 IOP Publishing
IOP Conf Series Materials Science and Engineering 243 (2017) 012028 doi1010881757-899X2431012028
Figure 12 Velocity contour for orifice ratio of (a) 050 and (b) 075
=
=
875
625
417
208
104
875
625
417
208
104
Flow
direction Axial distance x
Re (106)
(a)
(b)
11
1234567890
CFDRI2017 IOP Publishing
IOP Conf Series Materials Science and Engineering 243 (2017) 012028 doi1010881757-899X2431012028
Figure 13 Pressure contour for orifice ratio of (a) 050 and (b) 075
5 Conclusions
In this study the velocity and pressure distribution due to different orifice ratios from 050 070 and
075 are compiled and analyzed for its pressure drop performance Based on both contours velocity
and pressure some conclusions are made
a Restriction orifice with flat protrusion has lower discharge coefficients that sharp-edged
protrusion
b Thick plate orifice of 050 provides a tremendous penalty in pressure drop that yields to about
837
c Thick plate orifice of 075 sufficiently provides a pressure drop of 63 at the highest
Reynolds number
d Velocity and pressure contours shows that the thick plate orifice of 075 provides uniform
distribution than orifice ratio of 050
6 Recommendation and Future Studies
For future studies it is recommended that (a) an experimental study to verify the thick plate shape (b)
a numerical study of a thick plate in a piping system consisting of various components and (c) a
numerical study on the thick plate in comparison with various orifice shapes on the pressure drop
performance
= 050
= 075
Axial distance x
875
625
417
208
104
875
625
417
208
104
Flow direction
Re
6
(a
)
(b
)
12
1234567890
CFDRI2017 IOP Publishing
IOP Conf Series Materials Science and Engineering 243 (2017) 012028 doi1010881757-899X2431012028
Acknowledgement
The authors would like to appreciate Dunham-Bush Industries Sdn Bhd and Engineering Monash
University Malaysia for supporting this study
References
[1] Shrouf R D 2003 Pressure and flow characteristics of restrictive Flow orifice devices (United
Sates Sandia National Laboratories Report SAND2003-1874)
[2] Geng Y F Zheng J W and Shi T M 2006 Study on the metering characteristics of a slotted
orifice for wet gas flow Flow Meas Instrum 17 123-8
[3] Kumar P and Wong M B 2011 A CFD study of low pressure wet gas metering using slotted
orifice meters Flow Meas Instrum 22 33-42
[4] Munson B R Young D F Okiishi T H and Wade W 2009 Fundamentals of Fluid
Mechanics (New York John Wiley)
[5] Perry R H and Green D W 2008 Perryrsquos Chemical Engineersrsquo Handbook (New York McGraw-
Hill)
[6] Miller R 1996 Flow Measurement Engineering Handbook (New York McGraw-Hill)
[7] Coulson J M and Richardson J F 1996 Chemical Engineering Vol 1 (London Butterworth-
Heinemann)
[8] Huang S Ma T Wang D and Lin Z 2013 Study on discharge coefficient of perforated orifices
as a new kind of flow meter Exp Therm Fluid Sci 46 74-83
[9] Buker O Lau P Tawackolian K 2013 Reynolds number dependence of an orifice plate Flow
Meas Instrum 30 123-132
[10] Annamalai G Pirouzpanah S Gidgopuram S R and Morrison G L 2016 Characterization of
flow homogeneity downstream of a slotted orifice plate in a two-phase flow using electrical
resistance tomography Flow Meas Instrum 50 209-215
[11] Zahariea D 2016 Numerical analysis of eccentric orifice plate using ANSYS Fluent software
20th Innovative Manufacturing Engineering and Energy Conf 161 012041
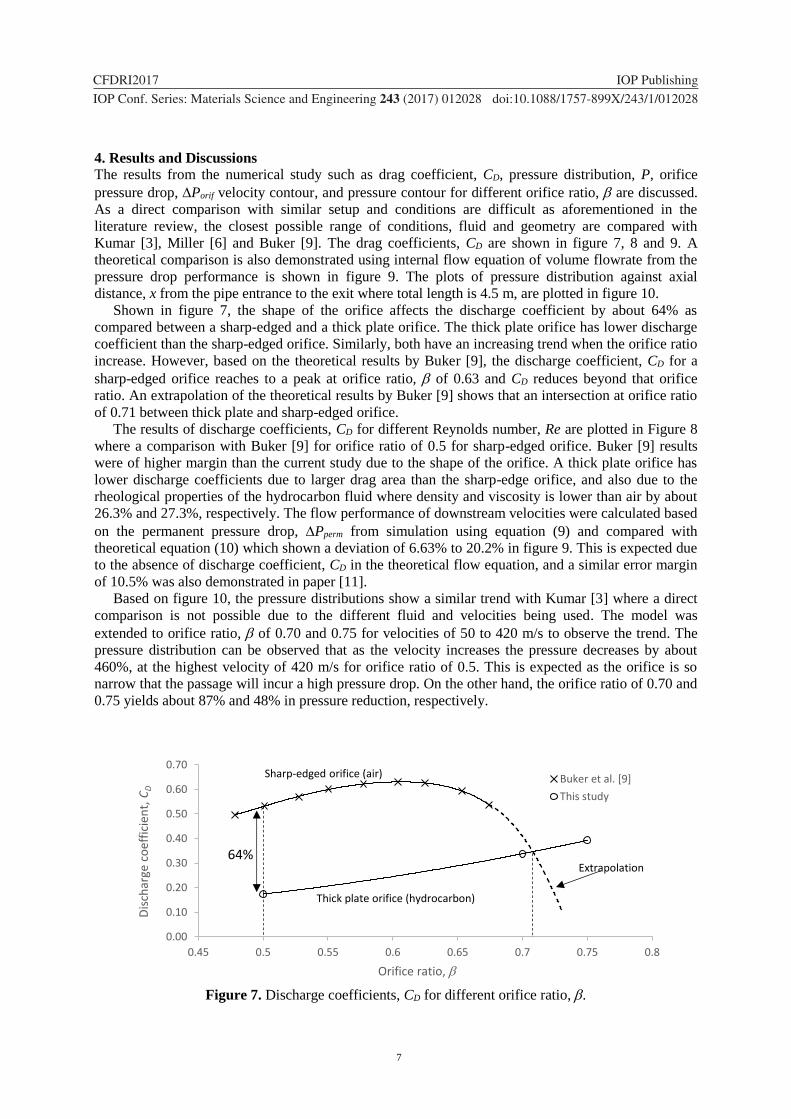
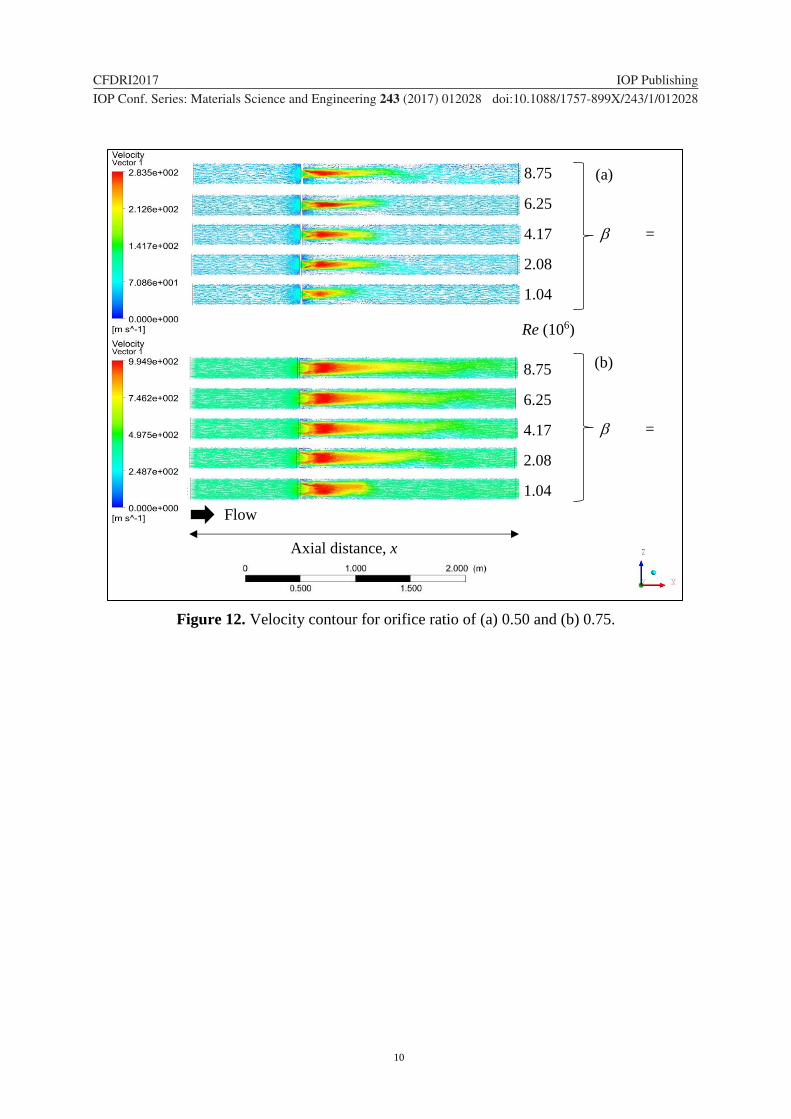