Embed Size (px)
Citation preview

Laboratory and field tests of corrosion inhibitors for an offshore application
Sofie Skierve3*. Geir Gundersen Fuhrb*, Geir Haldogard0*
a Statoil ASA, Arkitekt Ebb ells vei 10, Rotvoll, N-7005 Trondheim, Norway,tel. +4790593364, fax. +4773584629, E-mail: [email protected] Statoil ASA, Forusbeen 35, N-4035 Stavanger, Norway,tel. +4791153022, fax. +4751990050, E-mail: [email protected] Statoil ASA, Arkitekt Ebb ells vei 10, Rotvoll, N-7005 Trondheim, Norway,tel. +4790976965 fax. +4773584629, E-mail: [email protected]
Abstract
Statoil started a R&D-project in 2002 where the goal was to implement environmental friendly corrosion control at a Statoil operated oil producing field. In this project the following tasks have been addressed:
• Reduction of the chemical consumption• Documentation of the discharge level of the corrosion inhibitor• Documentation of the environmental impact• Development of new environmentally friendly acceptable corrosion inhibitors• Laboratory and field testing of new corrosion inhibitors
This paper describes laboratory and field tests of corrosion inhibitors for this project. The field tests were carried out on an offshore oil producing installation in the North Sea.Five corrosion inhibitor suppliers with totally eleven products were taking part in this test. All the products were tested in the laboratory. The four most promising products from the laboratory tests were tested in the field during a fourteen days offshore test. Only one of the tested products gave satisfactory results from the corrosion field test.Corrosion measurements were performed both with a Zero Resistance Ammetry (ZRA) probe installed directly into a flow line and with two side streams units. One side stream unit was connected upstream the test separator and the other unit was connected downstream the test separator.The results from the ZRA probe and the side stream units have proven to be directly comparable. Testing of corrosion inhibitors by using laboratory testing, ZRA probes and side stream units as an integrated methodology has given Statoil a reliable way of testing and selecting corrosion inhibitors.
Introduction
Corrosion inhibitors are used in flowlines and pipelines made of carbon steel. There are many different types and several suppliers of corrosion inhibitors. There has been a strong focus in reducing the environmental impact of produced water discharge over several years. An environmental risk assessment at one Statoil operated field has shown that the discharge of corrosion inhibitor contributes significantly to the potential environmental impact (EIF -

value) for this specific field. Based on this, Statoil started a R&D-project in 2002 with the goal to implement environmental friendly corrosion control at this oil producing field.Before any field implementation the corrosion inhibitors had to be tested to make sure that they gave good corrosion protection in the given environment.Corrosion inhibitors have usually been tested in the laboratory to determine their performance and efficiency in the given environment. For this work standard glass cells, flow loops and autoclaves are normally used. Not all relevant parameters can be simulated in laboratory tests, and the final test of an inhibitor should be in the actual system if possible.
For the R&D project totally eleven products from five suppliers were submitted for testing. The environmental impact of the products was evaluated before the corrosion tests were carried out.In order to implement a new product, the environmental impact should be reduced compared to the existing product and the level of corrosion protection should be maintained.Both laboratory and offshore field tests were carried out.
Laboratory tests
All eleven products were tested in glass cells. Table 1 gives the test conditions and a sketch of the tests cells is shown in figure 1.
Table 1. Test conditions glass cells
Test conditions CommentsTemperature 50 °CGas CO2 (quality. 5.0) Continuously bubblingMaterial st52 Carbon steel for flow linesMeasurement method AC-impedance
(3-electrode)Weight loss measurementswere also used in reference tests.
Exposure time Pre corrosion: 24 hoursTotal exposure time: 3-4 days
Inhibitorconcentration
40 ppm

CQ2
Cell with formation water
Magnetic stirrer with heating element
Figure 1. Sketch of test cell used for inhibitor testing
Test procedure glass cells:Gas (CO2) was continuously bubbled through the cell with formation water for approximately 20 hours and through the corrosion cell with the test specimens made of St52 carbon steel, for minimum 2 hours. The formation water was transferred to the corrosion cell and heated to 50°C. The test specimens were pre corroded for 24 hours before 40 ppm corrosion inhibitor was injected. 3-electrode AC-impedance was used to measure the corrosion rate during the experiments.
Test procedure glass loopEight corrosion inhibitors were further tested in the glass loop shown in figure 2. Flow rate was 3m/s, temperature 28°C and CO2 was continuously bubbled through the electrolyte. Oxygen level in the electrolyte was measured several times during the tests. 2-electrode AC- impedance was used to measure corrosion rate during the experiments. 40 ppm corrosion inhibitor was injected after 24 hours pre corrosion of the test specimens.
rest section
D2sensor
"low meter
rest specimens )t52 Carbon steel
Figure 2. Glass loop used for corrosion inhibitor testing.
Field tests
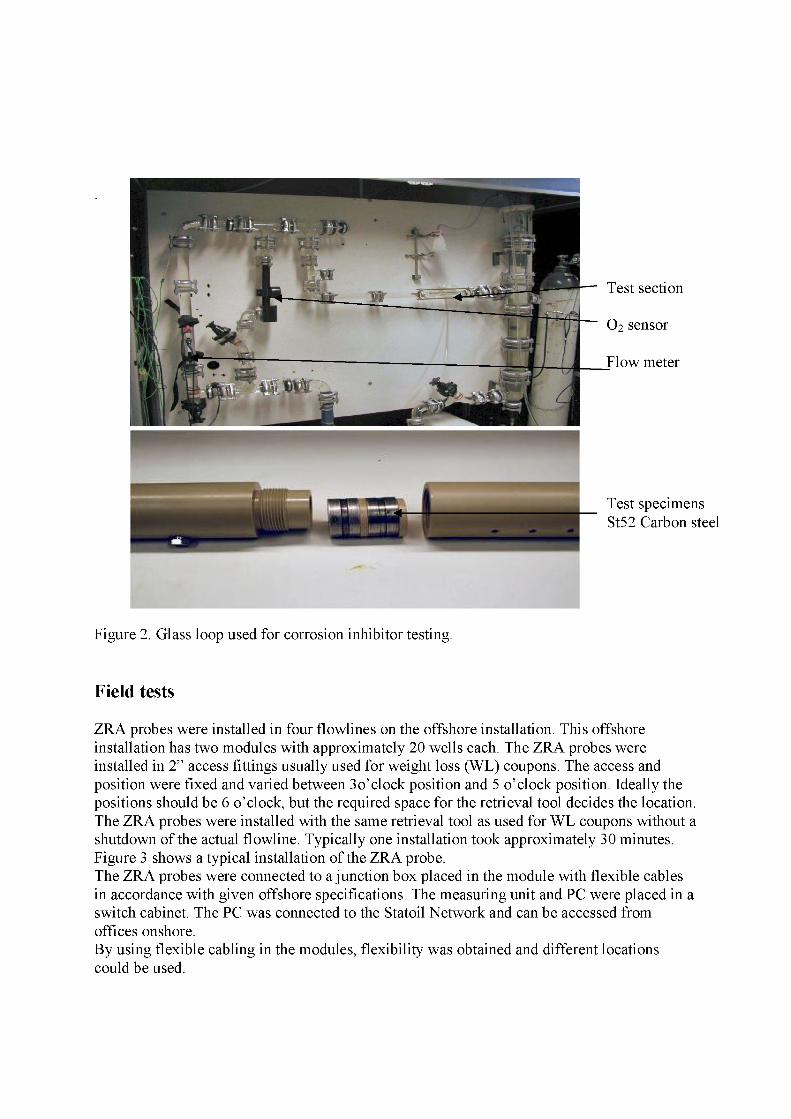
ZRA probes were installed in four flowlines on the offshore installation. This offshore installation has two modules with approximately 20 wells each. The ZRA probes were installed in 2” access fittings usually used for weight loss (WL) coupons. The access and position were fixed and varied between 3 o’clock position and 5 o’clock position. Ideally the positions should be 6 o’clock, but the required space for the retrieval tool decides the location. The ZRA probes were installed with the same retrieval tool as used for WL coupons without a shutdown of the actual flowline. Typically one installation took approximately 30 minutes. Figure 3 shows a typical installation of the ZRA probe.The ZRA probes were connected to a junction box placed in the module with flexible cables in accordance with given offshore specifications. The measuring unit and PC were placed in a switch cabinet. The PC was connected to the Statoil Network and can be accessed from offices onshore.By using flexible cabling in the modules, flexibility was obtained and different locations could be used.
Amphenolconnection
Figure 3. Typical ZRA probe installation
The ZRA probes are made of five elements simulating a weld. The probe has been made from a weld on a replaced spool, thus giving an actual weld identical to the other welds in the flowlines. Each ZRA probe is approximately 38 cm long. The exact location of the probe element in flowline depends on the length of the access fitting that varies. The preferred location is flush to the pipe wall, but the in most locations the probe was in the centre of the flowline.
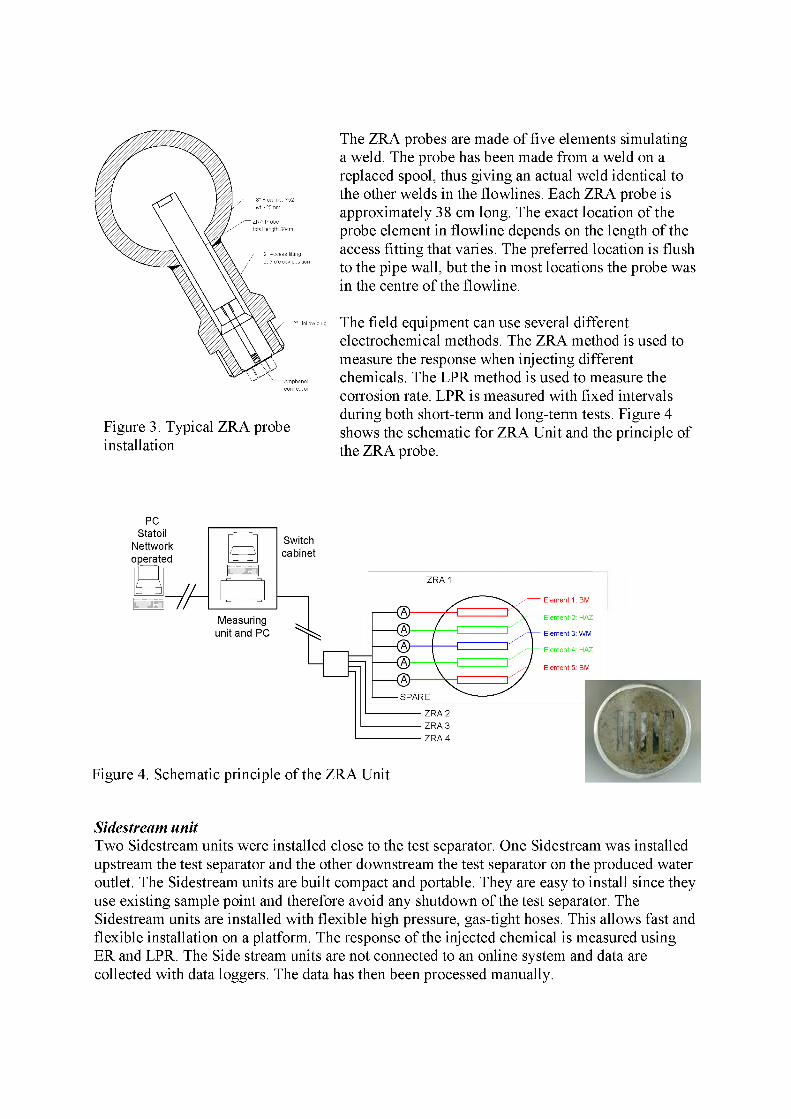
The field equipment can use several different electrochemical methods. The ZRA method is used to measure the response when injecting different chemicals. The LPR method is used to measure the corrosion rate. LPR is measured with fixed intervals during both short-term and long-term tests. Figure 4 shows the schematic for ZRA Unit and the principle of the ZRA probe.
PC
Figure 4. Schematic principle of the ZRA Unit
Sidestream unitTwo Sidestream units were installed close to the test separator. One Sidestream was installed upstream the test separator and the other downstream the test separator on the produced water outlet. The Sidestream units are built compact and portable. They are easy to install since they use existing sample point and therefore avoid any shutdown of the test separator. The Sidestream units are installed with flexible high pressure, gas-tight hoses. This allows fast and flexible installation on a platform. The response of the injected chemical is measured using ER and LPR. The Side stream units are not connected to an online system and data are collected with data loggers. The data has then been processed manually.

The Sidestream units are only installed for short-term testing, as they require supervision from qualified personnel and availability of the test separator. Figure 5 shows the setup of the Sidestream units in the field.
TEST SEPARATOR
Sand trapSamplepoint
Prod used waterSample point To hydrocyclone
Sidestream No. 1
Sidestream No. 2
1 Outle(>
■tixh ° ° To produced water degassing drum
i Gas>To test gas metering station
To test oil metering pump
OH>
Bio-studs
Mixer Outlet
Flowmeter
Samplepoint
Produced water _ from testseparator
Control valve
Outlet
Figure 5. Schematic setup of the Sidestream units
Corrosion inhibitor injection unit:
A pump skid was installed for injection of corrosion inhibitor. This pump skid consists of an air driven pump with capacity 0-20 1/h and a manifold for 3 or 4 wells. The pump skid is installed at the location of the control valves for each well, thus using the existing control valve and injection system on the platform. The pump skid uses 200 1 barrel as a reservoir,
this allow several different chemicals to be tested in short period of time since it is easy to change.Figure 6 shows the schematic layout for the pump skid.
Figure 6. Schematic setup for the pump skid
A separate corrosion inhibitor pump unit was used to avoid problems with other production chemicals in use on the installation, and also to have an easy and controllable inhibitor injection during the tests.

Test procedure field tests
Figure 7 shows the field test system setup. Five corrosion inhibitors were tested in the field. One of these products was the corrosion inhibitor already used at this field. This product was used as a reference.
Measuring unit and PC
PCStateil Nettwork
Z| operatedPump unit
WELLHEADS
Corrosion inhibitor cabinet
TEST MANIFOLD To test gas metering station
ZRA Probe
To test oil metering pumpTo hydrocyclone
Sidestream No. 1
WELL HEAD
Sidestream No. 2
To produced water degassing drum
Sand trap 'Samplepoint
ProdusedwaterSamplepoint
TEST SEPARATOR
Figure 7. Field test system setup.
Table 2 gives a summary for the field test
Establishment of base line40 ppm (based on total liquid volume) corrosion inhibitor 60 ppm (based on total liquid volume) corrosion inhibitor
4.5 hours 8 hours 10 hours

Table 2. Summary of the field test.
Date Time Activity Injection rate Comments04.04.05 21:00 - 00:00 Base line 1 005.04.05 00:00 - 14:45 Injection
referenceinhibitor
20 ppm(concentratedproduct)
Existing injection cabinet used. Unstable injection rates.
21:00 - 00:00 Injection of water
Cleaning of the system
06.04.05 00:00 - 09:00 Injection of water
Cleaning of the system. ZRA probe and ER probe were cleaned
09:00 - 13:30 Base line 213:30 - 21:30 Injection
inhibitor 340 ppm
21:30 - 00:00 60 ppm07.04.05 00:00 - 07:30 60 ppm
07:30 - 23:00 Injection of water
Cleaning of the system. ZRA probe and ER probe were cleaned. Well had to be shut down due to problems when the ZRA probe was removed
23:00 - 00:00 Base line 308.04.05 00:00 - 07:00 Base line 3
07:00 - 15:45 Injection inhibitor 11
40 ppm
15:45 - 19:45 Injection inhibitor 11
60 ppm
19:45 - 20:30 Injection of water
Cleaning of the system. ZRA probe and ER probe were cleaned
20:30 - 00:00 Base line 409.04.05 00:00 - 01:00 Base line 4
01:00 - 09:00 Injection inhibitor 10
40 ppm
09:00 - 17:00 Injection inhibitor 10
60 ppm
17:00 - 19:00 Injection of water
Cleaning of the system. ZRA probe and ER probe were cleaned
19:00 - 22:00 Base line 5 Corrosion measurements show that the system is not properly cleaned.
22:00 - 00:00 Injection of water
10.04.05 00:00 - 08:15 Injection of water
08:15 - 13:00 Base line 5

13:00 - 00:00 Injection of corrosion inhibitor 6
40 ppm Not possible to inject 60 ppm due to high viscosity of the chemical
11.04.05 00:00 - 02:30 Injection of corrosion inhibitor 6
40 ppm
02:30 - 08:30 Injection of water
Cleaning of the system. ZRA probe and ER probe were cleaned
08:30 - 15:30 Base line 615:30 - 21:00 Injection of
referenceinhibitor
20 ppm(concentratedproduct)
22:30 - 22:45 Injection ofreferenceinhibitor
20 ppm(concentratedproduct)
Injection cabinet at the installation used.
22:45 - 00:00 Injection ofreferenceinhibitor
30 ppm(concentratedproduct)
Injection cabinet at the installation used.
12.04.05 Injection ofreferenceinhibitor
30 ppm(concentratedproduct)
Injection cabinet at the installation used.
13.04.05 Injection ofreferenceinhibitor
30 ppm(concentratedproduct)
Injection cabinet at the installation used.
Water samples to measure the residual chemical oil in water, water in oil and samples of each chemical were taken through the test. These analyses were performed at the laboratory at Statoil Research Centre in Trondheim after the field test.

Results
Laboratory testsTable 3 gives the results from the glass cell tests and table 4 gives the results from the glass loop tests.
Table 3. Results from the glass cell tests
Test number Corrosioninhibitornumber
Corrosion rate before inhibitor injection
(mm/year)
Corrosion rate after inhibitor injection
(mm/year)
InhibitorEfficiency
(%)
Observations
1 1 2,3 0,046 982 2 2,0 0,07 973 3 1,5 0,024 984 4 2,2 0,013 995 5 1,6 0,041 976 6 1,2 0,008 99
7 7 1,5 0,044 97
Foamingobserved
wheninhibitor was
injected
8 8 2,0 0,021 99
A lot of foam was observed
wheninhibitor was
injected
9 9 1,1 0,011 99
Precipitation of white scaling
observed10 10 1,6 0,12 9311 11 2,2 0,042 9812 Reference
test3,6 - -

Table 4. Results from glass loop tests.
Test number Corrosioninhibitornumber
Corrosion rate before inhibitor
injection (mm/year)
Corrosion rate after inhibitor
injection (mm/year)
Inhibitor Efficiency (%)
1 1 0,9 0,025 972 3 0,3 0,036 88*3 5 1,1 0,052 954 6 1,6 0,031 985 7 0,8 0,019 986 9 1,2 0,021 987 10 0,7 0,03 968 11 0,8 0,012 99
* Corrosion rate before inhibition was very low. The calculated inhibitor efficiency will therefore be considered as very uncertain.
Based on the results from the environmental assessment and the laboratory testing inhibitor 3, 6, 10 and 11 were selected for further field testing.
Field tests
Table 5 gives the calculated efficiency from the field test.
Table 5. Results from the field test.Corrosion inhibitor
numberDosage Efficiency (%)
ZRAEfficiency (%) Side
stream unit upstream
testseparator
Efficiency (%) Side
stream unit downstream
testseparator
Reference inhibitor (concentrated
product)
20ppm/30ppm 89/98 83/83 92/92
3 40ppm/60ppm 88/88 50/50 75/506 40ppm 82 Not
measuredNot
measured10 40ppm/60ppm 82/79 10/78 35/8011 40ppm/60ppm 78/78 0/0 0/0
There are no results from side stream units for corrosion inhibitor 6 due to measuring problems.
Figure 8, 9, 10, 11 and 12 shows ZRA measurements during the tests.

Time (hours)
----------ZRA1 ZRA 2 ZRA 3 ZRA 4 ZRA 5
Figure 8. ZRA measurements reference corrosion inhibitor.20 ppm corrosion inhibitor after 6 hours exposure and 30 ppm after 12 hours exposure.
E 0,005
= -0,005 - —J||° \
-0,015
Time (hours)
Figure 9. ZRA measurements corrosion inhibitor 3.40 ppm corrosion inhibitor after 4.5 hours exposure and 60 ppm after 12.5 hours exposure.

•rv*vs»Tv*»;
-0,005
-0,015
Time (hours)
[~ ZRA 1 — ZRA 2 ...........'ZRA 3 ZRA 4^— ~ ZRA 5 |
Figure 10. ZRA measurements corrosion inhibitor 6.40 ppm corrosion inhibitor after 4.5 hours exposure.
11
*VVlAAAzvvyJ Ii
y\
\
A
0 2 4 6 8 10 12 14 16 18 20 22 24 26
Time (hours)
|— —ZRA1 ZRA2 — ~ZRA3 ZRA 4 ............ 'ZRA 5 |
Figure 11. ZRA measurements corrosion inhibitor 10.40 ppm corrosion inhibitor after 4.5 hours exposure and 60 ppm after 12.5 hours exposure.

0,02
0,015
0,01
E 0,005
I0
-0,005
-0,01
-0,015
-0,020 2 4 6 8 10 12 14 16 18 20 22 24 26
Time (hours)
|— "ZRA1 2 ~ ZRA 3 ZRA 4 ■■■—■ZRA F~|
Figure 12. ZRA measurements corrosion inhibitor 11.40 ppm corrosion inhibitor after 1 hour exposure and 60 ppm after 8 hours exposure
Discussion
The field test showed that by increasing the dosage from 20 to 30 ppm corrosion rate decrease and better corrosion protection is obtained for the reference inhibitor. Only one corrosion inhibitor gave satisfactorily results in the field test. Corrosion inhibitor number 3 gave approximately the same results as the reference inhibitor. The measurements were stable and this product is considered to be as good as the reference product under the tested conditions and injection rates. However an increased dosage gave no reduction in the corrosion rate. Corrosion inhibitor number 6 was very viscous and it was not possible to inject 60 ppm. The corrosion measurements showed also less corrosion protection than the reference inhibitor. There are no measurements from side stream units on this product due to difficulties with the equipment after the test with inhibitor number 10. Corrosion inhibitor number 10 showed very slow response on the corrosion measurements and the inhibitor efficiency was less than the reference product for the ZRA probe but showed good results in side stream units at 60 ppm dosage. The inhibitor efficiency of corrosion inhibitor number 11 is less than the reference product. The measurements in the side streams showed no effect of this product.
All the corrosion inhibitors tested in the field test gave satisfactory results in the laboratory tests, but only one product gave satisfactorily results in the field test. This shows the importance to do final testing in the actual system if it is possible.The side stream unit has given the same ranking of corrosion inhibitors as the ZRA probes and has proven as an important second measuring unit. The disadvantage with these units is the limited time available since it is dependent on a separator to operate in our test upset.

Conclusion
Performance of corrosion inhibitors varies from laboratory tests to offshore field testing. Inhibitors showing promising results in laboratory tests have not given satisfactorily results in the field. This shows the importance to do final testing in the actual system if it is possible.
The results from the ZRA probe and the side stream units have proven to be directly comparable.
Testing of corrosion inhibitors by using laboratory testing, ZRA probes and side stream units as an integrated methodology have given Statoil a reliable way of testing and selection of corrosion inhibitors.
The results from the R&D project enable Statoil to start implementation of an environmental friendly solution within 2006 at this specific field.