Embed Size (px)
Citation preview
COVER SHEET
Paper Number: 1661
Title: Mechanical Properties of Graphene Nanoplatelet/Carbon Fiber/Epoxy
Hybrid Composites: Multiscale Modeling and Experiments
Authors: Cameron M. Hadden
Danielle R. Klimek-McDonald
Evan J. Pineda
Julie A. King
Alex M. Reichanadter
Ibrahim Miskioglu
S. Gowtham
Gregory M. Odegard
https://ntrs.nasa.gov/search.jsp?R=20150022166 2018-08-21T05:34:14+00:00Z
ABSTRACT
Because of the relatively high specific mechanical properties of carbon
fiber/epoxy composite materials, they are often used as structural components in
aerospace applications. Graphene nanoplatelets (GNPs) can be added to the epoxy
matrix to improve the overall mechanical properties of the composite. The resulting
GNP/carbon fiber/epoxy hybrid composites have been studied using multiscale
modeling to determine the influence of GNP volume fraction, epoxy crosslink density,
and GNP dispersion on the mechanical performance. The hierarchical multiscale
modeling approach developed herein includes Molecular Dynamics (MD) and
micromechanical modeling, and it is validated with experimental testing of the same
hybrid composite material system. The results indicate that the multiscale modeling
approach is accurate and provides physical insight into the composite mechanical
behavior. Also, the results quantify the substantial impact of GNP volume fraction and
dispersion on the transverse mechanical properties of the hybrid composite, while the
effect on the axial properties is shown to be insignificant.
INTRODUCTION
Carbon/epoxy composites are a prime component of many modern aircraft
structures because of their exceptional mechanical properties relative to their bulk
mass density. The bulk-level mechanical properties of these composites depend
directly on the mechanical properties and interaction between the constituent
materials. Traditionally, the constituents have been carbon fibers and epoxy matrix.
However, the inclusion of graphene nano-platelets (GNPs) in epoxy has been shown
to improve mechanical and electrical properties with respect to the un-reinforced
epoxy [1-4], thus showing promise for use of GNP-reinforced epoxy as the matrix
phase in a fiber composite. The resulting GNP/carbon fiber/epoxy hybrid composite
could potentially show improvements in mechanical properties with respect to
traditional carbon fiber/epoxy composites.
C.M. Hadden, D.R. Klimek-McDonald, A.M. Reichanadter, I. Miskioglu, S. Gowtham, G.M. Odegard, Michigan Technological University, 1400 Townsend Drive, Houghton, MI 49931 E.J. Pineda, NASA Glenn Research Center, 21000 Brookpark Road, Cleveland, OH 44135
It has been demonstrated [1, 3, 4] that the effect of GNPs on GNP/polymer
composite mechanical properties is governed by the amount of GNPs added to the
polymer and the dispersion of the GNPs within the polymer. It has been also shown
through experimentally-validated molecular modeling [5] that the GNP/epoxy
interface contains an interphase region that is on the same size order as GNP sheets
and can be sensitive to epoxy crosslink density. The interphase region is composed of
epoxy molecules that have a mass density that is significantly different than that of the
bulk. However, it is uncertain how the molecular structure of the interphase region and
molecular-scale dispersion of GNPs affects the bulk-level elastic properties of
GNP/carbon fiber/epoxy hybrid composites. Molecular modeling must be used to
provide a sufficient amount of physical insight into the effect of the interphase
molecular structure and the dispersion of the GNPs on bulk-level performance of the
hybrid composite because of the difficulty in experimentally characterizing these
factors.
The objective of this study is to use an experimentally validated multiscale
modeling technique to determine the molecular structure of the GNP/epoxy interface
and understand the influence of the interface, GNP dispersion, and GNP volume
fraction on the bulk-level elastic properties of a GNP/carbon fiber/epoxy hybrid
composite. The multiscale modeling approach consists of molecular dynamics (MD)
and micromechanics modeling. The multi-scale model is validated by direct
comparison to mechanical properties of the hybrid composite determined by
mechanical testing of fabricated specimens. The results indicate that the multiscale
model accurately predicts the bulk-level mechanical properties based on molecular-
level structure, and GNP dispersion has a tremendous effect on the hybrid composite
response.
MULTISCALE MODELING
MD was used to predict the molecular structure and elastic properties of a
representative volume element (RVE) containing GNP and the GNP/epoxy interphase
region. The corresponding homogenized elastic properties, including the influence of
the interphase region, were used in subsequent, uncoupled, micromechanical analyses
to predict the mechanical response of the GNP/epoxy composite as well as the
GNP/carbon fiber/epoxy hybrid composite. The details of the multiscale modeling are
given in this section. The modeled epoxy system consisted of the EPON 862 monomer
and the EPIKURE Curing Agent W.
MD modeling
MD techniques have been used in several instances to model pure thermoset
EPON 862/DETDA epoxy systems [6-9]. MD modeling has also been performed on
thermoset polymers containing carbon nanotubes [10-17], nanoparticles [18-20], and
in the presence of a surface [5, 21-24]. The interfacial region between epoxy and
carbon reinforcement (either carbon fiber or GNP) has been investigated in many of
the aforementioned references. These MD studies, coupled with recent backing from
experimental imagery [5], have revealed the existence of an interfacial region near the
carbon reinforcement surface in which the local epoxy molecular structure,
specifically the mass density, differs from that of the bulk. For the GNP-reinforced
EPON 862/DETDA system, previous research has shown this interfacial region to be
approximately 10 Å thick from the graphite surface [5]. Although these studies have
given valuable information regarding the physical nature of the interfacial region,
there has been little effort to implement this information into a bulk-scale model for
GNP/epoxy composites.
The MD model of the GNP/epoxy interface was constructed using a multi-step
approach. First, a model of the pure uncrosslinked epoxy system was established.
Second, a series of GNP sheets was added to the model of the pure epoxy system to
establish the GNP/epoxy interface model for different numbers of GNP sheets.
Finally, the GNP/epoxy MD models were crosslinked to various levels. Each of these
steps is described below. After the systems were constructed, they were exposed to
applied deformations to predict their mechanical response. The LAMMPS (Large
Scale Atomic/Molecular Massively Parallel Simulator) software package [25] was
used for all of the Molecular Minimization (MM) and MD simulations described
herein.
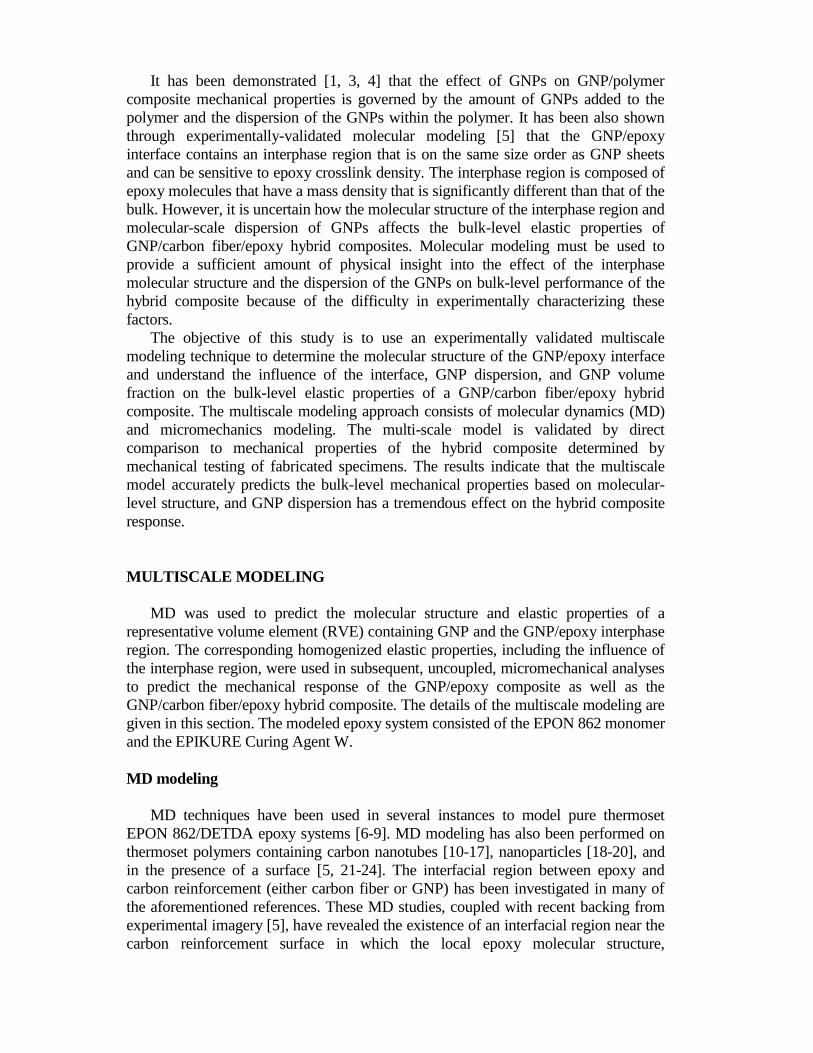
The initial uncrosslinked polymer molecular structure was established using a
procedure similar to that of Bandyopadhyay et al. [6], consisting of the EPON 862
monomer and the DETDA hardener shown in Figure 1. A stoichiometric mixture of 2
molecules of EPON 862 and 1 molecule of DETDA was placed in a MD simulation
box with periodic boundary conditions. The initial atomic coordinates file was written
in the native LAMMPS format and the OPLS (Optimized Potential for Liquid
Simulations) United Atom force field developed by Jorgensen and co-workers [26, 27]
was used for defining the bond, angle, and dihedral parameters. The equilibrium
spacing parameter of the Lennard-Jones potential was taken to be the arithmetic mean
of the individual parameters of the respective atom types, while the well-depth
parameter was taken to be the geometric mean of the values for the respective atom
types. The van der Waals interactions were modeled with an interaction cut-off radius
of 10Å.
Figure 1. Molecular structures of EPON 862 and DETDA. Green atoms indicate united atoms.
This particular force field allows for modeling of CH3, CH2, CH, and alkyl groups
as single united atoms with their corresponding masses. The described polymer model
utilized united atom structures for all applicable groups, except for the C and H atoms
in the phenyl rings for both monomer and hardener molecules along with one CH3
group directly connected to the phenyl ring of the DETDA molecule. Thus, the use of
united atoms reduced the modeled 2:1 structure from 117 atoms to 83 atoms. The
location of each united atom is shown in Figure 1, with 31 total atoms in the molecule
of EPON 862 and 21 in the molecule of DETDA.
EPON862 DETDA
The 2:1 molecular model was subjected to four MM minimizations and three 100
ps MD simulations. MM simulations utilized the conjugate gradient stopping criterion,
and MD simulations were performed using the NVT (constant volume and
temperature) ensemble at 300K. This process minimized internal forces and thus
reduced internal residual stresses that were created from the initial construction of
bonds, bond angles, and bond dihedrals.
After the structure stabilized to a relatively low energy value, the initial 2:1
stoichiometric structure was replicated, and the replicated models were randomly
rotated and then translated along the three Cartesian axes and combined into a much
larger structure with an EPON 862:DETDA ratio of 250:125, containing 10,375 total
united atoms. Therefore, the resulting system consisted of 250 randomly oriented
clusters of the small 2:1 ratio cluster stacked loosely together in a manner much like
that of a simple cubic crystal structure.
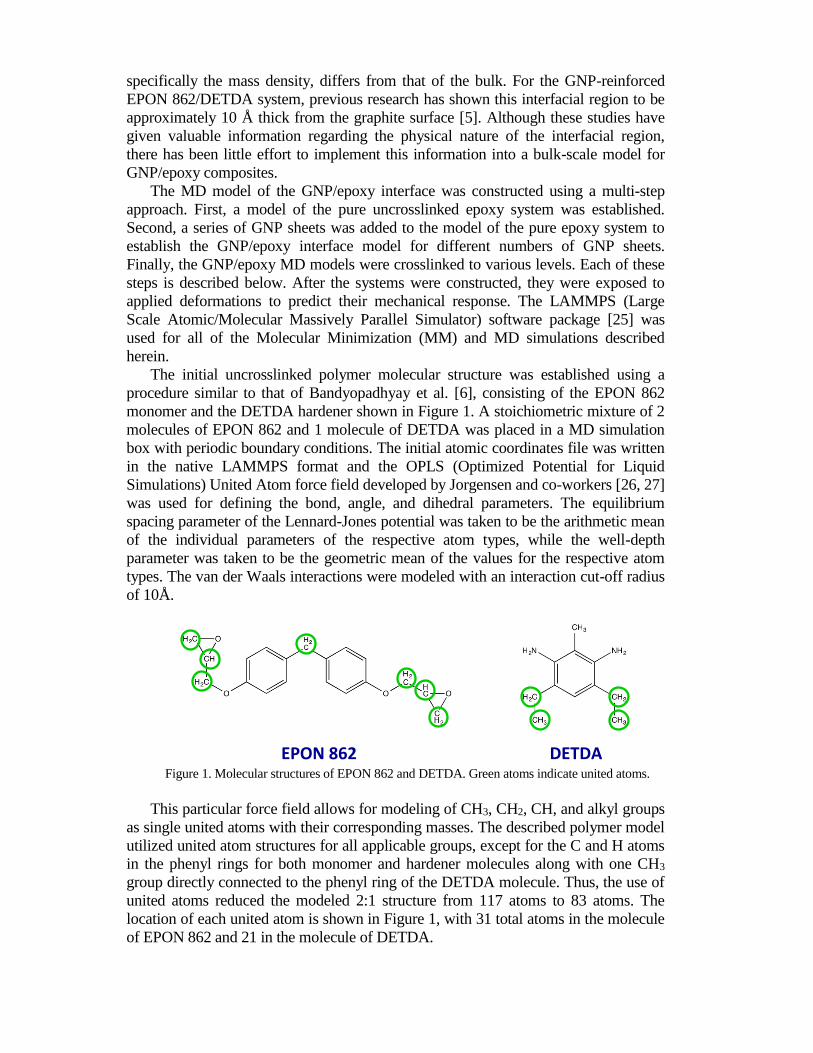
This larger polymer model was mirrored about a graphene structure positioned in
the x-y plane central to the z-axis (Figure 2). As a result, each system contained a
500:250 ratio of EPON 862:DETDA totaling 20,750 polymer atoms. The centralized
graphene structures varied in thickness from 1 atomic layer to 4 layers thick, each
layer containing 4200 carbon atoms. The largest system, comprised of a 4-layer
graphene sheet, contained 37,550 total atoms and the initial box size was
101×104×210 Å. All models employed 3D periodic boundary conditions. The initial
box size produced a polymer density approximately equal to half of a fully cured solid
EPON 862 epoxy (~0.5 g/cc in all four systems).
Figure 2. Molecular structures for single graphene sheet.
In order to achieve the desired polymer density of 1.17 g/cc, the four separate
models were subjected to twelve cycles of deformation along the z-axis (Fig
ure 2). Each cycle included a MM followed by a 100ps MD NVT simulation in
which the z coordinate was reduced in equal amounts from both the positive and
negative z-coordinate boundaries using the LAMMPS fix/deform tool. A Nose/Hoover
thermostat and barostat was implemented for temperature and pressure control,
respectively [28]. The amount of deformation decreased with each cycle as the models
became closer to the desired density. This was done to avoid large energy increases to
the system by packing the molecules together too quickly. This entire densification
Polymerρ ≈ 1.17 g/cc
250:125Epon/DETDA
250:125Epon/DETDA
z(periodic)
x(periodic) y(periodic)
1.2nssimula on me
12stepdensifica on
12stepdensifica on
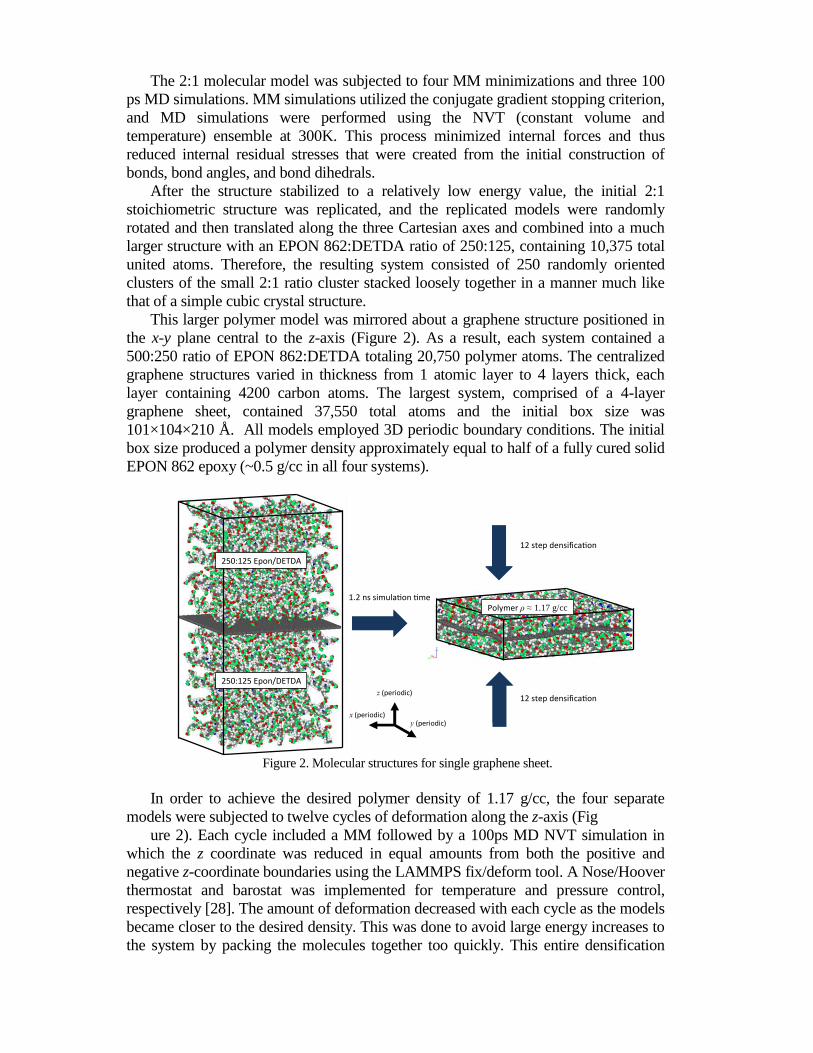
process was performed over a total of 1.2 ns for each of the four systems. The final z-
coordinate boundary enabled for polymer atoms to extend ~13 Å from the graphene
surface, to ensure that the interfacial region was fully captured and to show a minimal
influence from the bulk polymer characteristics during deformation. The fully
equilibrated, non-crosslinked, structures for all four systems are shown in Figure 3.
Figure 3. Equilibrated models for varying number of graphene layers.
The equilibrated models were crosslinked using the same procedure described
previously [5]. A total of 16 molecular systems were established, each having a unique
crosslink density (65, 70, 75, and 80%) and number of graphene layers (1 – 4). The
crosslink density was defined as the ratio of the total number of crosslinks that were
formed to the maximum number of crosslinks that could be formed. It is important to
note that for industrial grade epoxies, a broad range of crosslink densities of 60-95% is
typically observed in experiments [29-33]. Therefore, the simulated crosslink densities
were chosen to span part of this range. It was observed that crosslinking above 80%
resulted in molecular structures with unnaturally high internal stresses. After
crosslinking to the desired density, each structure was allowed to equilibrate using a
series of three MM minimizations and two MD NVT simulations of 2 ns each. A 1ns
NPT (constant pressure and temperature) simulation followed to minimize internal
stresses.
The 16 molecular models were subjected to MD-simulated uniaxial mechanical
deformations to predict their elastic mechanical responses. The models were deformed
with uniaxial 5% strains in tension and compression along the x-, y-, and z-axes over a
period of 1 ns. Poisson contractions were allowed in the transverse directions for the
direct calculation of Young’s modulus and Poisson’s ratio. Additionally, shear
deformations of 5% were performed separately along the x-y, y-z, and x-z planes over
the period of 1 ns for each model. The values of Young’s modulus in the three
orthogonal directions (Ex, Ey, Ez), the shear modulus in the x-y plane (Gxy), and the
Poisson’s ratios for all 16 systems are given in Table 1. The shear modulus values in
the y-z and x-z planes are not included in Table 1 because they were nearly zero-
valued based on the dominance of the van der Waals bonds between the graphene
sheets and polymer and the periodic boundary conditions. As expected, the values of
y(periodic)
z(periodic)
x(periodic)
1GNPlayer 2GNPlayers
3GNPlayers 4GNPlayers
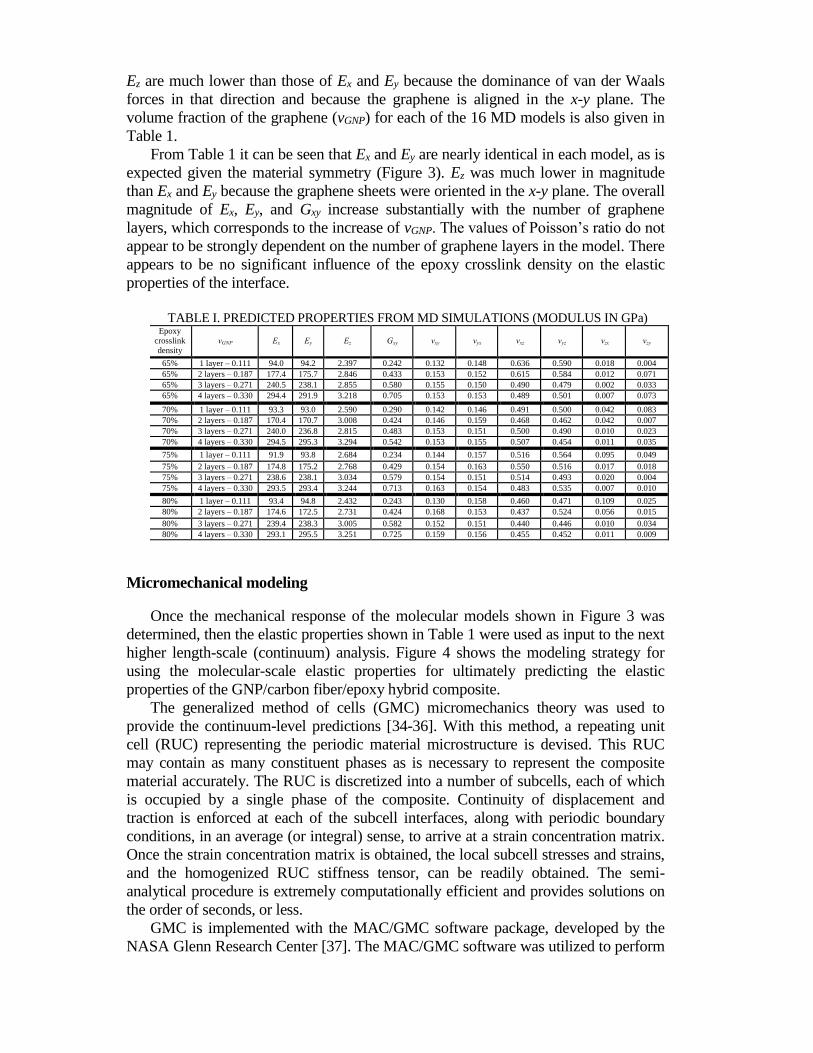
Ez are much lower than those of Ex and Ey because the dominance of van der Waals
forces in that direction and because the graphene is aligned in the x-y plane. The
volume fraction of the graphene (vGNP) for each of the 16 MD models is also given in
Table 1.
From Table 1 it can be seen that Ex and Ey are nearly identical in each model, as is
expected given the material symmetry (Figure 3). Ez was much lower in magnitude
than Ex and Ey because the graphene sheets were oriented in the x-y plane. The overall
magnitude of Ex, Ey, and Gxy increase substantially with the number of graphene
layers, which corresponds to the increase of vGNP. The values of Poisson’s ratio do not
appear to be strongly dependent on the number of graphene layers in the model. There
appears to be no significant influence of the epoxy crosslink density on the elastic
properties of the interface.
TABLE I. PREDICTED PROPERTIES FROM MD SIMULATIONS (MODULUS IN GPa)
Micromechanical modeling
Once the mechanical response of the molecular models shown in Figure 3 was
determined, then the elastic properties shown in Table 1 were used as input to the next
higher length-scale (continuum) analysis. Figure 4 shows the modeling strategy for
using the molecular-scale elastic properties for ultimately predicting the elastic
properties of the GNP/carbon fiber/epoxy hybrid composite.
The generalized method of cells (GMC) micromechanics theory was used to
provide the continuum-level predictions [34-36]. With this method, a repeating unit
cell (RUC) representing the periodic material microstructure is devised. This RUC
may contain as many constituent phases as is necessary to represent the composite
material accurately. The RUC is discretized into a number of subcells, each of which
is occupied by a single phase of the composite. Continuity of displacement and
traction is enforced at each of the subcell interfaces, along with periodic boundary
conditions, in an average (or integral) sense, to arrive at a strain concentration matrix.
Once the strain concentration matrix is obtained, the local subcell stresses and strains,
and the homogenized RUC stiffness tensor, can be readily obtained. The semi-
analytical procedure is extremely computationally efficient and provides solutions on
the order of seconds, or less.
GMC is implemented with the MAC/GMC software package, developed by the
NASA Glenn Research Center [37]. The MAC/GMC software was utilized to perform
Epoxy crosslink density
vGNP Ex Ey Ez Gxy vxy vyx vxz vyz vzx vzy
65% 1 layer – 0.111 94.0 94.2 2.397 0.242 0.132 0.148 0.636 0.590 0.018 0.004
65% 2 layers – 0.187 177.4 175.7 2.846 0.433 0.153 0.152 0.615 0.584 0.012 0.071
65% 3 layers – 0.271 240.5 238.1 2.855 0.580 0.155 0.150 0.490 0.479 0.002 0.033
65% 4 layers – 0.330 294.4 291.9 3.218 0.705 0.153 0.153 0.489 0.501 0.007 0.073
70% 1 layer – 0.111 93.3 93.0 2.590 0.290 0.142 0.146 0.491 0.500 0.042 0.083
70% 2 layers – 0.187 170.4 170.7 3.008 0.424 0.146 0.159 0.468 0.462 0.042 0.007
70% 3 layers – 0.271 240.0 236.8 2.815 0.483 0.153 0.151 0.500 0.490 0.010 0.023
70% 4 layers – 0.330 294.5 295.3 3.294 0.542 0.153 0.155 0.507 0.454 0.011 0.035
75% 1 layer – 0.111 91.9 93.8 2.684 0.234 0.144 0.157 0.516 0.564 0.095 0.049
75% 2 layers – 0.187 174.8 175.2 2.768 0.429 0.154 0.163 0.550 0.516 0.017 0.018
75% 3 layers – 0.271 238.6 238.1 3.034 0.579 0.154 0.151 0.514 0.493 0.020 0.004
75% 4 layers – 0.330 293.5 293.4 3.244 0.713 0.163 0.154 0.483 0.535 0.007 0.010
80% 1 layer – 0.111 93.4 94.8 2.432 0.243 0.130 0.158 0.460 0.471 0.109 0.025
80% 2 layers – 0.187 174.6 172.5 2.731 0.424 0.168 0.153 0.437 0.524 0.056 0.015
80% 3 layers – 0.271 239.4 238.3 3.005 0.582 0.152 0.151 0.440 0.446 0.010 0.034
80% 4 layers – 0.330 293.1 295.5 3.251 0.725 0.159 0.156 0.455 0.452 0.011 0.009
two levels of micromechanical analysis. First, the effective properties of MD unit cells
(Figure 3) were determined. These effective properties were then used in a GMC
RUC, which contained additional subcells of pure epoxy to arrive at the desired GNP
volume fractions. The homogenized properties of the GNP/epoxy RUC were
integrated over all possible orientations in 3-D space to simulate a random distribution
of the GNPs in the epoxy matrix. Second, the corresponding properties of the
randomly distributed GNP/epoxy composites were used in a subsequent MAC/GMC
analysis to simulate a GNP/carbon fiber/epoxy hybrid composite. The details of these
analyses are described in the following subsections.
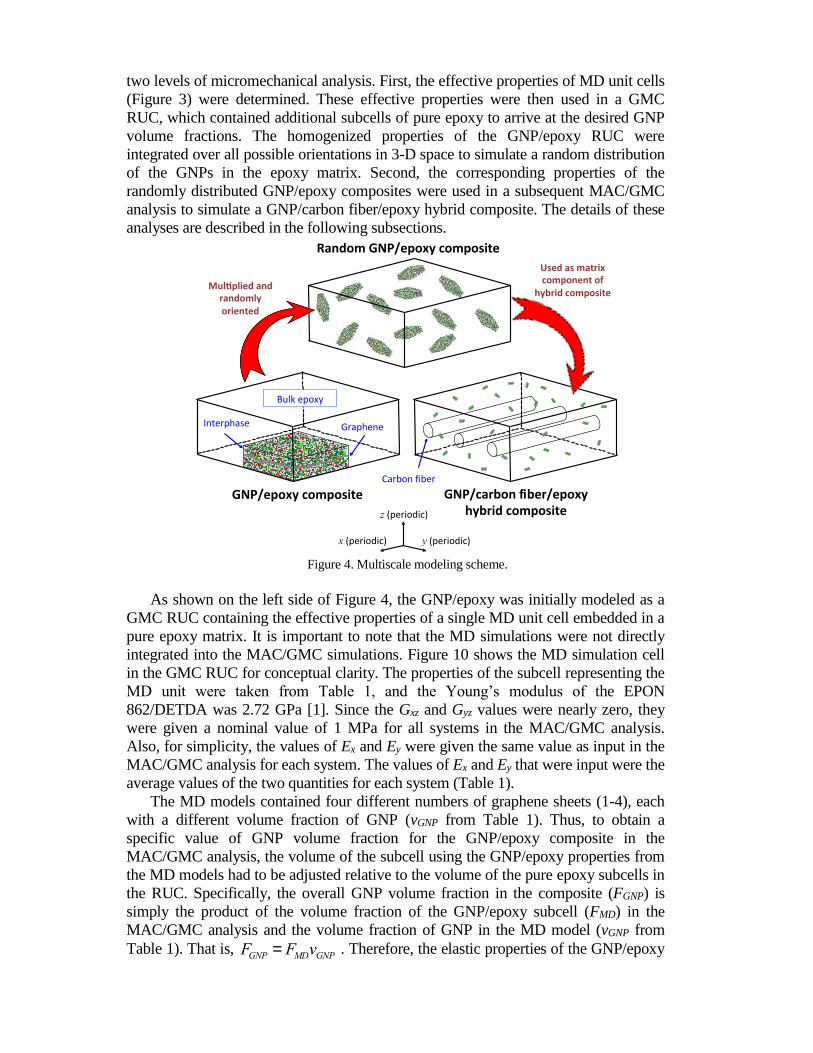
Figure 4. Multiscale modeling scheme.
As shown on the left side of Figure 4, the GNP/epoxy was initially modeled as a
GMC RUC containing the effective properties of a single MD unit cell embedded in a
pure epoxy matrix. It is important to note that the MD simulations were not directly
integrated into the MAC/GMC simulations. Figure 10 shows the MD simulation cell
in the GMC RUC for conceptual clarity. The properties of the subcell representing the
MD unit were taken from Table 1, and the Young’s modulus of the EPON
862/DETDA was 2.72 GPa [1]. Since the Gxz and Gyz values were nearly zero, they
were given a nominal value of 1 MPa for all systems in the MAC/GMC analysis.
Also, for simplicity, the values of Ex and Ey were given the same value as input in the
MAC/GMC analysis for each system. The values of Ex and Ey that were input were the
average values of the two quantities for each system (Table 1).
The MD models contained four different numbers of graphene sheets (1-4), each
with a different volume fraction of GNP (vGNP from Table 1). Thus, to obtain a
specific value of GNP volume fraction for the GNP/epoxy composite in the
MAC/GMC analysis, the volume of the subcell using the GNP/epoxy properties from
the MD models had to be adjusted relative to the volume of the pure epoxy subcells in
the RUC. Specifically, the overall GNP volume fraction in the composite (FGNP) is
simply the product of the volume fraction of the GNP/epoxy subcell (FMD) in the
MAC/GMC analysis and the volume fraction of GNP in the MD model (vGNP from
Table 1). That is, FGNP = FMDvGNP . Therefore, the elastic properties of the GNP/epoxy
GNP/carbonfiber/epoxyhybridcomposite
GNP/epoxycomposite
RandomGNP/epoxycomposite
Mul pliedandrandomlyoriented
Usedasmatrixcomponentof
hybridcomposite
y(periodic)
z(periodic)
x(periodic)
Interphase Graphene
Carbonfiber
Bulkepoxy
composite could be easily determined for any volume fraction of GNP without
requiring new MD simulations. This approach allowed for an efficient process to
predict the influence of GNP volume fraction on overall elastic properties, as detailed
below.
GNP/epoxy composites typically are processed with a random distribution of
GNPs within the surrounding epoxy (Figure 4, center). To obtain the effective
properties of a GNP/epoxy composite containing a random distribution of GNPs, the
homogenized properties of the RUC (Figure 4, left) were integrated over all possible
orientations in 3D space [38]. The corresponding elastic properties were thus isotropic
and dependent on the GNP volume fraction and number of adjacent graphene layers
together. Thus, perfect dispersion was simulated for the case of a single graphene
layer, with incrementally worsening of dispersion conditions with increasing numbers
of simulated layers (2 layers, 3 layers, and 4 layers). The elastic properties predicted
from these simulations were used as input into the next level of MAC/GMC analysis
containing the nano-enhanced epoxy matrix and carbon fibers.
The MAC/GMC software was used to predict the elastic properties of the
GNP/carbon fiber/epoxy hybrid composite shown on the right side of Figure 4. The
fiber architecture was chosen as a 26×26 circular array. Input parameters for the
carbon fibers were chosen to accurately represent the fibers used in the experiments
described below, and are given in Table 2.
TABLE II. MECHANICAL PROPERTIES FOR AS4 CARBON FIBERS
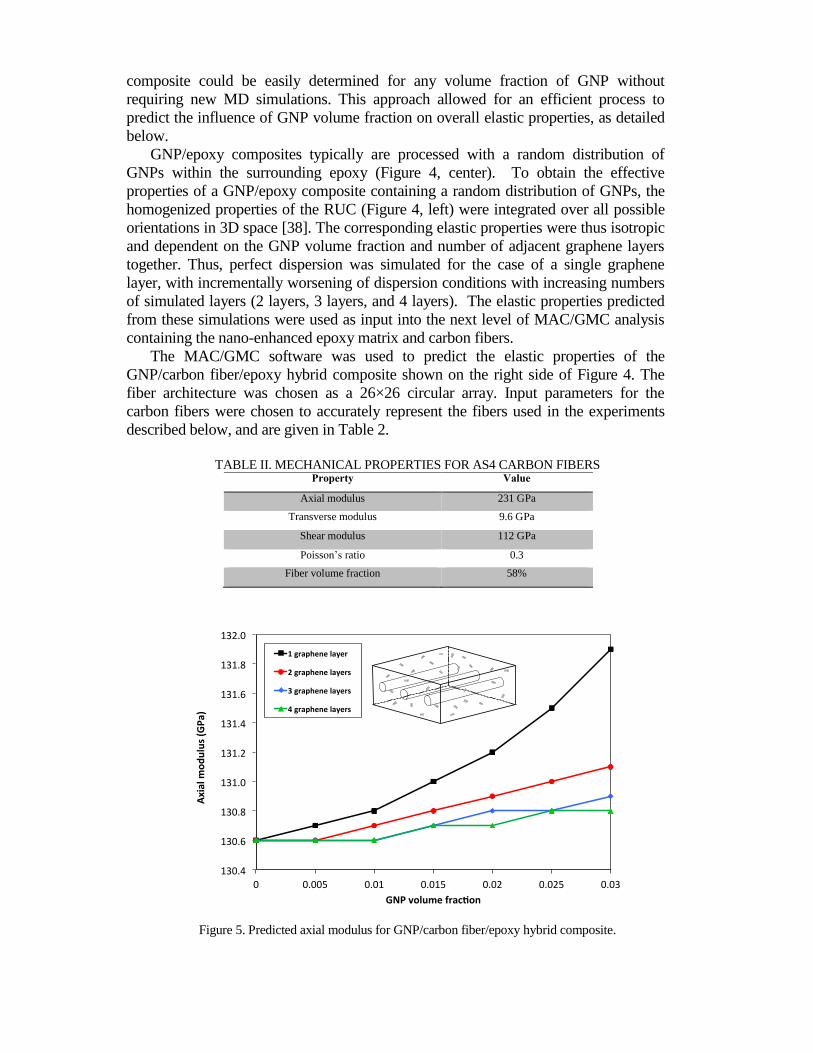
Figure 5. Predicted axial modulus for GNP/carbon fiber/epoxy hybrid composite.
Property Value
Axial modulus 231 GPa
Transverse modulus 9.6 GPa
Shear modulus 112 GPa
Poisson’s ratio 0.3
Fiber volume fraction 58%
130.4
130.6
130.8
131.0
131.2
131.4
131.6
131.8
132.0
0 0.005 0.01 0.015 0.02 0.025 0.03
Axialm
odulus(GPa)
GNPvolumefrac on
1graphenelayer
2graphenelayers
3graphenelayers
4graphenelayers
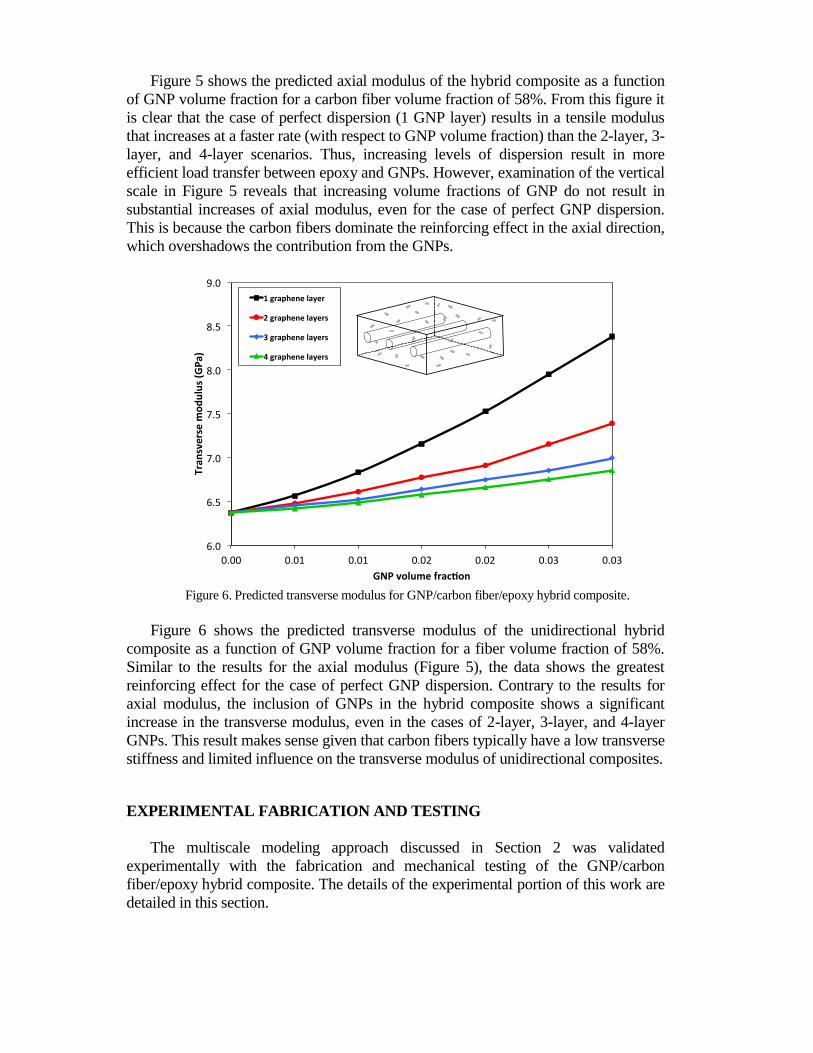
Figure 5 shows the predicted axial modulus of the hybrid composite as a function
of GNP volume fraction for a carbon fiber volume fraction of 58%. From this figure it
is clear that the case of perfect dispersion (1 GNP layer) results in a tensile modulus
that increases at a faster rate (with respect to GNP volume fraction) than the 2-layer, 3-
layer, and 4-layer scenarios. Thus, increasing levels of dispersion result in more
efficient load transfer between epoxy and GNPs. However, examination of the vertical
scale in Figure 5 reveals that increasing volume fractions of GNP do not result in
substantial increases of axial modulus, even for the case of perfect GNP dispersion.
This is because the carbon fibers dominate the reinforcing effect in the axial direction,
which overshadows the contribution from the GNPs.
Figure 6. Predicted transverse modulus for GNP/carbon fiber/epoxy hybrid composite.
Figure 6 shows the predicted transverse modulus of the unidirectional hybrid
composite as a function of GNP volume fraction for a fiber volume fraction of 58%.
Similar to the results for the axial modulus (Figure 5), the data shows the greatest
reinforcing effect for the case of perfect GNP dispersion. Contrary to the results for
axial modulus, the inclusion of GNPs in the hybrid composite shows a significant
increase in the transverse modulus, even in the cases of 2-layer, 3-layer, and 4-layer
GNPs. This result makes sense given that carbon fibers typically have a low transverse
stiffness and limited influence on the transverse modulus of unidirectional composites.
EXPERIMENTAL FABRICATION AND TESTING
The multiscale modeling approach discussed in Section 2 was validated
experimentally with the fabrication and mechanical testing of the GNP/carbon
fiber/epoxy hybrid composite. The details of the experimental portion of this work are
detailed in this section.
6.0
6.5
7.0
7.5
8.0
8.5
9.0
0.00 0.01 0.01 0.02 0.02 0.03 0.03
Tran
sversem
odulus(GPa)
GNPvolumefrac on
1graphenelayer
2graphenelayers
3graphenelayers
4graphenelayers
Materials
The epoxy material system used in this study is the same as that modeled (EPON
862/DETDA). The viscosity of EPON 862 and EPIKURE Curing Agent W at 25oC is
~35 P and ~200 cP, respectively. EPON 862 is a low viscosity, liquid epoxy resin
manufactured from epichlorohydrin and Bisphenol-F [39]. The GNP system was
xGnP®-C-300, available from XG Sciences. It has a 2 μm average platelet diameter
and a thickness of 2 nm. The continuous carbon fiber used in this study was HexTow®
AS4-GP/3K (1.00%)(5000).
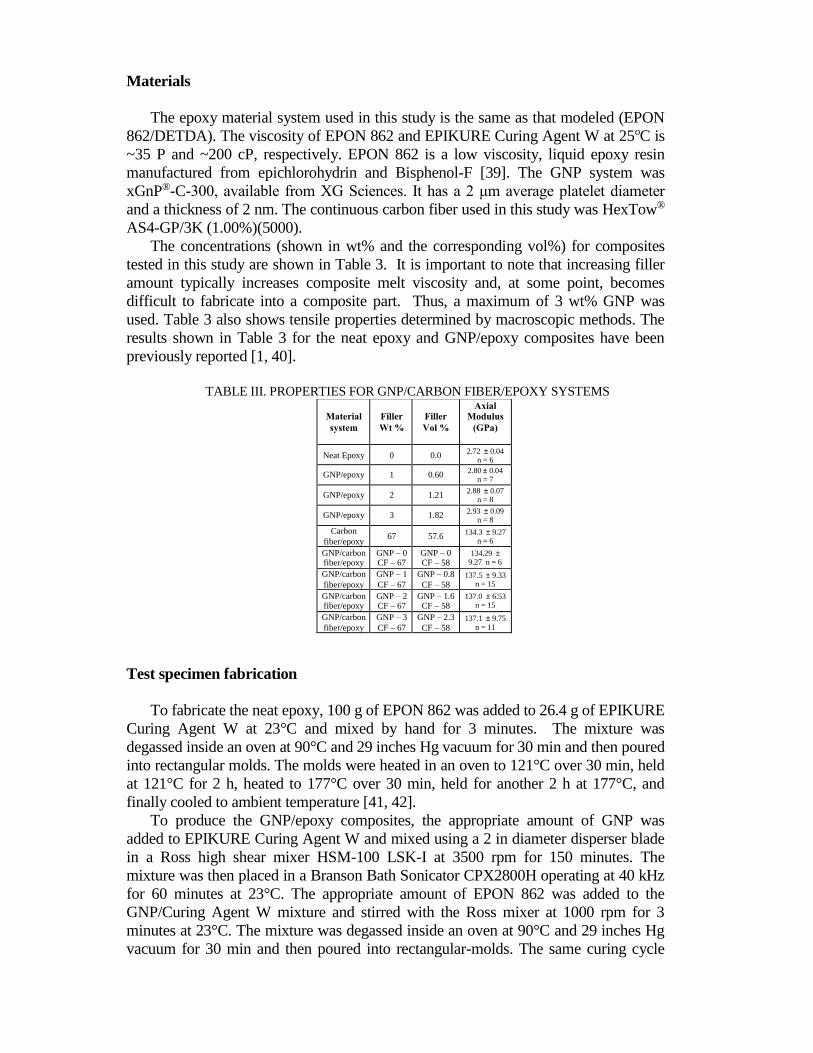
The concentrations (shown in wt% and the corresponding vol%) for composites
tested in this study are shown in Table 3. It is important to note that increasing filler
amount typically increases composite melt viscosity and, at some point, becomes
difficult to fabricate into a composite part. Thus, a maximum of 3 wt% GNP was
used. Table 3 also shows tensile properties determined by macroscopic methods. The
results shown in Table 3 for the neat epoxy and GNP/epoxy composites have been
previously reported [1, 40].
TABLE III. PROPERTIES FOR GNP/CARBON FIBER/EPOXY SYSTEMS
Test specimen fabrication
To fabricate the neat epoxy, 100 g of EPON 862 was added to 26.4 g of EPIKURE
Curing Agent W at 23°C and mixed by hand for 3 minutes. The mixture was
degassed inside an oven at 90°C and 29 inches Hg vacuum for 30 min and then poured
into rectangular molds. The molds were heated in an oven to 121°C over 30 min, held
at 121°C for 2 h, heated to 177°C over 30 min, held for another 2 h at 177°C, and
finally cooled to ambient temperature [41, 42].
To produce the GNP/epoxy composites, the appropriate amount of GNP was
added to EPIKURE Curing Agent W and mixed using a 2 in diameter disperser blade
in a Ross high shear mixer HSM-100 LSK-I at 3500 rpm for 150 minutes. The
mixture was then placed in a Branson Bath Sonicator CPX2800H operating at 40 kHz
for 60 minutes at 23°C. The appropriate amount of EPON 862 was added to the
GNP/Curing Agent W mixture and stirred with the Ross mixer at 1000 rpm for 3
minutes at 23°C. The mixture was degassed inside an oven at 90°C and 29 inches Hg
vacuum for 30 min and then poured into rectangular-molds. The same curing cycle
Material
system
Filler
Wt %
Filler
Vol %
Axial Modulus
(GPa)
Neat Epoxy 0 0.0 2.72 ± 0.04
n = 6
GNP/epoxy 1 0.60 2.80 ± 0.04
n = 7
GNP/epoxy 2 1.21 2.88 ± 0.07
n = 8
GNP/epoxy 3 1.82 2.93 ± 0.09
n = 8
Carbon
fiber/epoxy 67 57.6
134.3 ± 9.27 n = 6
GNP/carbon fiber/epoxy
GNP – 0 CF – 67
GNP – 0 CF – 58
134.29 ± 9.27 n = 6
GNP/carbon
fiber/epoxy
GNP – 1
CF – 67
GNP – 0.8
CF – 58 137.5 ± 9.33
n = 15
GNP/carbon fiber/epoxy
GNP – 2 CF – 67
GNP – 1.6 CF – 58
137.0 ± 6.53 n = 15
GNP/carbon
fiber/epoxy
GNP – 3
CF – 67
GNP – 2.3
CF – 58 137.1 ± 9.75
n = 11
was used as described for the neat epoxy. For the neat epoxy and the GNP/epoxy
systems, the fabricated samples were rectangular bars (165 mm long by 19 mm wide
by 3.3 mm thick).
To fabricate the continuous unidirectional carbon fiber/epoxy composites, 100 g of
EPON 862 was added to 26.4 g of EPIKURE Curing Agent W at 23 °C and mixed by
hand for 3 minutes. The appropriate amount of epoxy was added to the carbon fiber
tow via a winding process to produce a unidirectional composite containing 67 wt%
carbon fiber and 33 wt% epoxy. The uncured epoxy/carbon fiber was cut into sheets
(248 mm by 248 mm) and placed in a picture frame mold (254 mm by 254 in). To
fabricate the unidirectional composite plate, five plies were placed with the carbon
fiber in the 0° direction. A Wabash Compression Molding Machine Vantage Series
Model V75H-18-CLX was used. Initially, the composite plate was heated to 121 °C
and held at a constant pressure of 30 psi for 2 hours. The press was then ramped up to
177 °C and held at a constant pressure of 1000 psi for 2 hours. Cooling water was used
to cool the press until the platen temperature was 30°C, then the composite plate (1.7
mm thick) was removed.
To fabricate the GNP/carbon fiber/epoxy hybrid composites, the appropriate
amount of GNP was added to 26.4 g EPIKURE Curing Agent W and mixed using a 2
in diameter disperser blade in a Ross high shear mixer HSM-100 LSK-I at 3500 rpm
for 150 minutes. The mixture was placed in a Branson Sonicator CPX2800H
operating at 40 kHz for 60 minutes at 23°C. The appropriate amount of epoxy (100 g
EPON 862 added to 26.4 g of EPIKURE Curing Agent W) was added to the
GNP/Curing Agent W mixture and stirred with the Ross mixer at 1000 rpm for 3
minutes at 23°C. The appropriate amount of GNP/epoxy were added to the carbon
fiber tow using a winding process to produce a unidirectional carbon fiber composite
containing the following compositions:
• 1 wt% GNP/67 wt% carbon fiber/32 wt% epoxy
• 2 wt% GNP/67 wt% carbon fiber/31 wt% epoxy
• 3 wt% GNP/67 wt% carbon fiber/30 wt% epoxy
The uncured GNP/carbon fiber/epoxy composite was cut into sheets and cured as
described for the neat epoxy.
Tensile testing
For the neat epoxy and GNP/epoxy composites, a Tensilkut Engineering router
was used. The tensile properties (at ambient conditions, 16.5 cm long, 3.3 mm thick
ASTM Type I sample geometry) were determined using ASTM D638 at a crosshead
rate of 1 mm/min for reinforced plastics. An Instru-Met Sintech screw driven
mechanical testing machine was used. The tensile modulus was calculated from the
initial linear portion of the stress-strain curve. For each formulation, at least 6 samples
were tested. Prior to testing, the samples were conditioned at 23°C and 50% relative
humidity for 2 days.
For the carbon fiber/epoxy and GNP/carbon fiber/epoxy composites, tensile bars
were cut to 12.7 mm wide and a length of 203 mm. Tabbing material
(fiberglass/epoxy) was attached to the ends of each sample. The tensile properties
were determined using ASTM D3039 at a crosshead rate of 2 mm/min for fiber
reinforced plastics. The same mechanical testing machine and conditioning was used
as described in the previous paragraph.
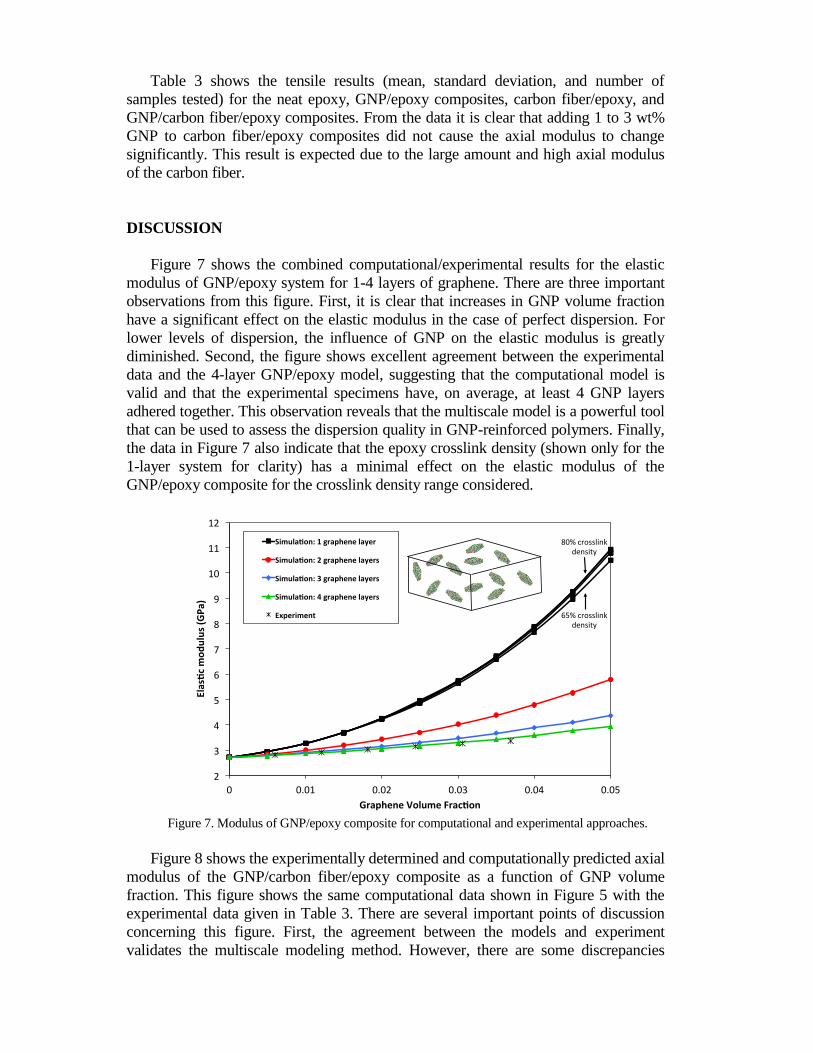
Table 3 shows the tensile results (mean, standard deviation, and number of
samples tested) for the neat epoxy, GNP/epoxy composites, carbon fiber/epoxy, and
GNP/carbon fiber/epoxy composites. From the data it is clear that adding 1 to 3 wt%
GNP to carbon fiber/epoxy composites did not cause the axial modulus to change
significantly. This result is expected due to the large amount and high axial modulus
of the carbon fiber.
DISCUSSION
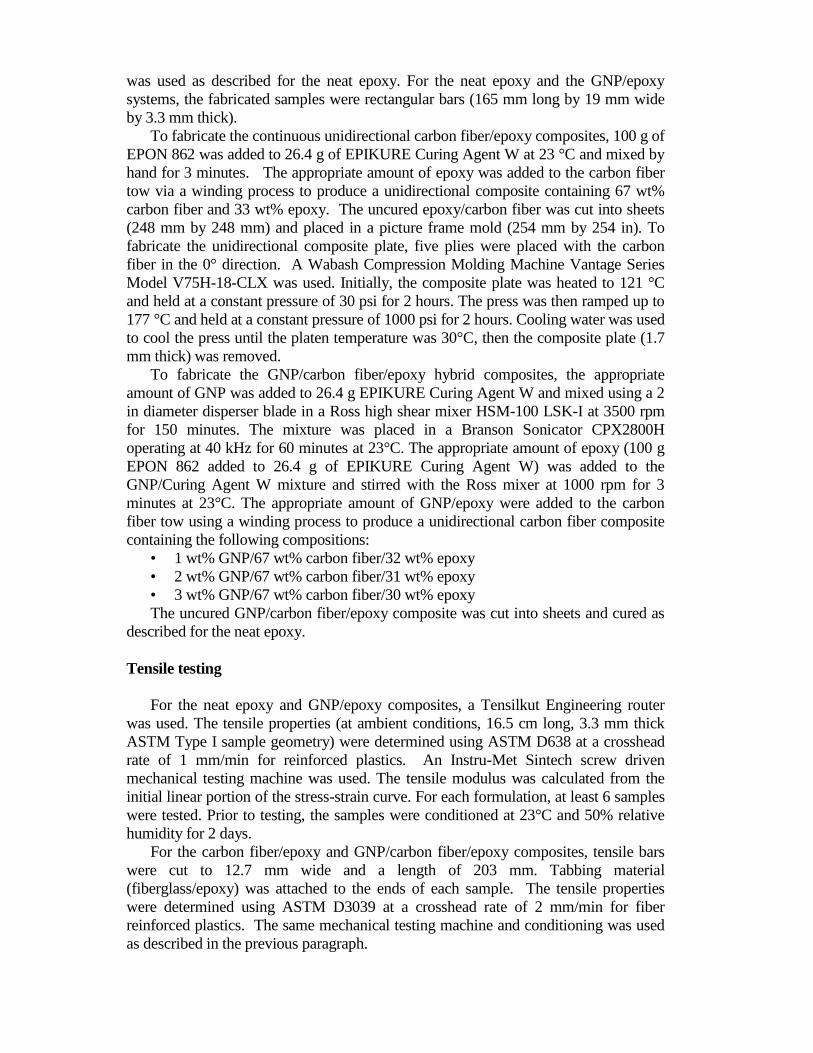
Figure 7 shows the combined computational/experimental results for the elastic
modulus of GNP/epoxy system for 1-4 layers of graphene. There are three important
observations from this figure. First, it is clear that increases in GNP volume fraction
have a significant effect on the elastic modulus in the case of perfect dispersion. For
lower levels of dispersion, the influence of GNP on the elastic modulus is greatly
diminished. Second, the figure shows excellent agreement between the experimental
data and the 4-layer GNP/epoxy model, suggesting that the computational model is
valid and that the experimental specimens have, on average, at least 4 GNP layers
adhered together. This observation reveals that the multiscale model is a powerful tool
that can be used to assess the dispersion quality in GNP-reinforced polymers. Finally,
the data in Figure 7 also indicate that the epoxy crosslink density (shown only for the
1-layer system for clarity) has a minimal effect on the elastic modulus of the
GNP/epoxy composite for the crosslink density range considered.
Figure 7. Modulus of GNP/epoxy composite for computational and experimental approaches.
Figure 8 shows the experimentally determined and computationally predicted axial
modulus of the GNP/carbon fiber/epoxy composite as a function of GNP volume
fraction. This figure shows the same computational data shown in Figure 5 with the
experimental data given in Table 3. There are several important points of discussion
concerning this figure. First, the agreement between the models and experiment
validates the multiscale modeling method. However, there are some discrepancies
2
3
4
5
6
7
8
9
10
11
12
0 0.01 0.02 0.03 0.04 0.05
Elas
cmodulus(GPa)
GrapheneVolumeFrac on
Simula on:1graphenelayer
Simula on:2graphenelayers
Simula on:3graphenelayers
Simula on:4graphenelayers
Experiment
80%crosslinkdensity
65%crosslinkdensity
between the predictions and the experimental data for the carbon fiber/GNP/epoxy
systems. This could indicate some error in the properties used for the carbon fiber in
the models, or variation in the volume fraction of the carbon fiber. Second, the
predicted increase in axial modulus is insignificant relative to the experimental scatter
associated with the experiments (error bars for the experimental data points indicates
standard deviation from replicate tests). Third, the data indicate that the influence of
GNPs on the hybrid composite axial modulus is minimal, regardless of the GNP
volume fraction. Since the carbon fiber dominates the stiffness in the axial direction, it
is not practical to use nano-enhanced epoxy to improve the axial stiffness. However,
doping the epoxy matrix of a carbon fiber/epoxy system with GNP can provide
significant transverse and shear reinforcement and improve the performance of the
structure in the event that it encounters unexpected loads. Moreover, the use of GNP
may allow for the minimization of the transverse and shear reinforcing plies in the
structural design, reducing the overall weight of the structure. Finally, the epoxy
crosslink density (for the crosslink density range considered herein) has a negligible
influence on the axial modulus.
Figure 8. Axial modulus of GNP/carbon fiber/epoxy composite.
CONCLUSIONS
In this study a hierarchical multiscale modeling method has been developed and
experimentally validated to predict the elastic properties of GNP/epoxy composites
and GNP/carbon fiber/epoxy hybrid composites. The multiscale modeling method
incorporates MD simulation on the molecular level and micromechanical simulation
on the microscopic level. Fabrication and testing of specimens of the modeled
materials were used to validate the model and to provide insight into the capabilities of
the modeling method.
There are four major conclusions from this research. First, the developed
multiscale modeling method is accurate and can provide physical insight into the
mechanical behavior of GNP-reinforced composites. This includes the potential to use
120
130
140
150
160
170
180
190
0 0.01 0.02 0.03
Axialm
odulus(GPa)
GNPvolumefrac on
Simula on:1graphenelayer
Simula on:2graphenelayers
Simula on:3graphenelayers
Simula on:4graphenelayers
Experiment
the method to quantify GNP dispersion via correlation of simulation and test data.
Second, the GNP volume fraction in the hybrid composite can have a strong influence
the composite transverse tensile and shear properties. Third, GNP dispersion quality
has a strong effect on the transverse tensile and shear properties of the composite.
Fourth, GNP volume fraction and dispersion has a minimal influence on the hybrid
composite axial properties where the carbon fiber is the primary reinforcement agent.
Therefore, GNP-doping in carbon fiber/epoxy composites is most valuable in cases
where composite parts are designed to transmit significant loads in the direction
transverse to the fiber alignment or protect the structure against unforeseen loading
scenarios.
ACKNOWLEDGEMENTS
This research was funded by NASA under the Aeronautical Sciences Program
(Grant NNX11A072A), the Air Force Office of Scientific Research under the Low
Density Materials Program (Grant FA9550-13-1-0030), the Michigan Space Grant
Consortium (Grant 2993583), the NSF I/UCRC on Novel High Voltage/Temperature
Materials and Structures (Grant IIP-1362040), and the Michigan Technological
University Summer Undergraduate Research Fellowship Program. The authors thank
XG Sciences for donating graphene nanoplatelets and Hexcel for donating AS4 carbon
fiber for this work. SUPERIOR, a high-performance computing cluster at Michigan
Technological University, was used in obtaining results presented in this publication.
REFERENCES
1. King, J. A., Klimek D. R., Miskioglu I., Odegard G. M. Mechanical properties of graphene
nanoplatelet/epoxy composites. Journal of Applied Polymer Science. 2013;128(6):4217-4223.
2. Kuilla, T., Bhadra S., Yao D. H., Kim N. H., Bose S., Lee J. H. Recent advances in graphene
based polymer composites. Progress in Polymer Science. 2010;35(11):1350-1375.
3. Rafiee, M. A., Rafiee J., Wang Z., Song H. H., Yu Z. Z., Koratkar N. Enhanced Mechanical
Properties of Nanocomposites at Low Graphene Content. Acs Nano. 2009;3(12):3884-3890.
4. Tang, L. C., Wan Y. J., Yan D., Pei Y. B., Zhao L., Li Y. B., et al. The effect of graphene
dispersion on the mechanical properties of graphene/epoxy composites. Carbon. 2013;60:16-
27.
5. Hadden, C. M., Jensen B. D., Bandyopadhyay A., Odegard G. M., Koo A., Liang R. Molecular
modeling of EPON-862/graphite composites: Interfacial characteristics for multiple crosslink
densities. Composites Science and Technology. 2013;76:92-99.
6. Bandyopadhyay, A., Valavala P. K., Clancy T. C., Wise K. E., Odegard G. M. Molecular
modeling of crosslinked epoxy polymers: The effect of crosslink density on thermomechanical
properties. Polymer. 2011;52(11):2445-2452.
7. Fan, H. B., Yuen M. M. F. Material properties of the cross-linked epoxy resin compound
predicted by molecular dynamics simulation. Polymer. 2007;48(7):2174-2178.
8. Li, C. Y., Strachan A. Molecular dynamics predictions of thermal and mechanical properties of
thermoset polymer EPON862/DETDA. Polymer. 2011;52(13):2920-2928.
9. Varshney, V., Patnaik S., Roy A., Farmer B. A Molecular Dynamics Study of Epoxy Based
Networks: Cross-linking Procedure and Prediction of Molecular and Material Properties.
Macromolecules. 2008;41(18):6837-6842.
10. Clancy, T. C., Gates T. S. Modeling of interfacial modification effects on thermal conductivity
of carbon nanotube composites. Polymer. 2006;47(16):5990-5996.
11. Frankland, S. J. V., Caglar A., Brenner D. W., Griebel M. Molecular Simulation of the
Influence of Chemical Cross-Links on the Shear Strength of Carbon Nanotube-Polymer
Interfaces. Journal of Physical Chemistry B. 2002;106(12):3046-3048.
12. Frankland, S. J. V., Harik V. M., Odegard G. M., Brenner D. W., Gates T. S. The stress-strain
behavior of polymer-nanotube composites from molecular dynamics simulation. Composites
Science and Technology. 2003;63(11):1655-1661.
13. Gou, J. H., Minaie B., Wang B., Liang Z. Y., Zhang C. Computational and experimental study
of interfacial bonding of single-walled nanotube reinforced composites. Computational
Materials Science. 2004;31(3-4):225-236.
14. Ionita, M. Multiscale molecular modeling of SWCNTs/epoxy resin composites mechanical
behaviour. Composites Part B-Engineering. 2012;43(8):3491-3496.
15. Nouranian, S., Jang C., Lacy T. E., Gwaltney S. R., Toghiani H., Pittman C. U. Molecular
dynamics simulations of vinyl ester resin monomer interactions with a pristine vapor-grown
carbon nanofiber and their implications for composite interphase formation. Carbon.
2011;49(10):3219-3232.
16. Odegard, G. M., Gates T. S., Wise K. E., Park C., Siochi E. J. Constitutive modeling of
nanotube-reinforced polymer composites. Composites Science and Technology.
2003;63(11):1671-1687.
17. Zhu, R., Pan E., Roy A. K. Molecular dynamics study of the stress-strain behavior of carbon-
nanotube reinforced Epon 862 composites. Materials Science and Engineering a-Structural
Materials Properties Microstructure and Processing. 2007;447(1-2):51-57.
18. Jang, C., Lacy T. E., Gwaltney S. R., Toghiani H., Pittman C. U. Interfacial shear strength of
cured vinyl ester resin-graphite nanoplatelet from molecular dynamics simulations. Polymer.
2013;54(13):3282-3289.
19. Odegard, G. M., Clancy T. C., Gates T. S. Modeling of the mechanical properties of
nanoparticle/polymer composites. Polymer. 2005;46(2):553-562.
20. Yu, S., Yang S., Cho M. Multi-scale modeling of cross-linked epoxy nanocomposites.
Polymer. 2009;50(3):945-952.
21. Gao, J. S., Shiu S. C., Tsai J. L. Mechanical properties of polymer near graphite sheet. Journal
of Composite Materials. 2013;47(4):449-458.
22. Li, C. Y., Browning A. R., Christensen S., Strachan A. Atomistic simulations on multilayer
graphene reinforced epoxy composites. Composites Part a-Applied Science and
Manufacturing. 2012;43(8):1293-1300.
23. Mansfield, K. F., Theodorou D. N. Atomistic Simulation of a Glassy Polymer Graphite
Interface. Macromolecules. 1991;24(15):4295-4309.
24. Stevens, M. J. Interfacial fracture between highly cross-linked polymer networks and a solid
surface: Effect of interfacial bond density. Macromolecules. 2001;34(8):2710-2718.
25. Plimpton, S. Fast Parallel Algorithms for Short-Range Molecular-Dynamics Journal of
Computational Physics. 1995;117(1):1-19.
26. Jorgensen, W. L., Maxwell D. S., Tirado-Rives J. Development and Testing of the OPLS All-
Atom Force Field on Conformational Energetics and Properties of Organic Liquids. Journal of
the American Chemical Society. 1996;117:11225-11236.
27. Watkins, E. K., Jorgensen W. L. Perfluoroalkanes: Conformational analysis and liquid-state
properties from ab initio and Monte Carlo calculations. Journal of Physical Chemistry A.
2001;105(16):4118-4125.
28. Hoover, W. G. Canonical Dynamics - Equilibrium Phase-Space Distributions. Physical Review
A. 1985;31(3):1695-1697.
29. Dannenberg, H. Determination of Functional Groups in Epoxy Resins by Near-Infrared
Spectroscopy. SPE Transactions. 1963;3(1):78-88.
30. George, G. A., Coleclarke P., Stjohn N., Friend G. Real-Time Monitoring of the Cure Reaction
of a Tgddm/Dds Epoxy-Resin Using Fiber Optic Ft-Ir. Journal of Applied Polymer Science.
1991;42(3):643-657.
31. Musto, P., Martuscelli E., Ragosta G., Russo P. The curing process and moisture transport in a
tetrafunctional epoxy resin as investigated by FT-NIR spectroscopy. High Performance
Polymers. 2000;12(1):155-168.
32. Varley, R. J., Heath G. R., Hawthorne D. G., Hodgkin J. H., Simon G. P. Toughening of a
Trifunctional Epoxy System .1. Near-Infrared Spectroscopy Study of Homopolymer Cure.
Polymer. 1995;36(7):1347-1355.
33. Wang, Q., Storm B. K., Houmoller L. P. Study of the isothermal curing of an epoxy prepreg by
near-infrared spectroscopy. Journal of Applied Polymer Science. 2003;87(14):2295-2305.
34. Aboudi, J., Arnold S. M., Bednarcyk B. A. Micromechanics of Composite Materials: A
Generalized Multiscale Analysis Approach: Elsevier, Inc.; 2013.
35. Bednarcyk, B. A., Aboudi J., Arnold S. M. The effect of general statistical fiber misalignment
on predicted damage initiation in composites. Composites Part B-Engineering. 2014;66:97-
108.
36. Paley, M., Aboudi J. Micromechanical Analysis of Composites by the Generalized Cells
Model. Mechanics of Materials. 1992;14(2):127-139.
37. Bednarcyk, B. A., Arnold S. M. MAC/GMC user's manual - keywords manual. NASA/TM
2002-212077/Vol 2. 2002.
38. Christensen, R. M., Waals F. M. Effective Stiffness of Randomly Oiriented Fiber Composites.
Journal of Composite Materials. 1972;6:518-535.
39. Tack, J. L., Ford D. M. Thermodynamic and mechanical properties of epoxy resin DGEBF
crosslinked with DETDA by molecular dynamics. Journal of Molecular Graphics &
Modelling. 2008;26(8):1269-1275.
40. King, J. A., Klimek D. R., Miskioglu I., Odegard G. M. Mechanical Properties of Grahene
Nanoplatelet/Epoxy Composites. Journal of Composite Materials. 2014;In press.
41. Chen, C. G., Curliss D. Processing and morphological development of montmorillonite epoxy
nanocomposites. Nanotechnology. 2003;14(6):643-648.
42. Zhou, Y. X., Pervin F., Lewis L., Jeelani S. Fabrication and characterization of carbon/epoxy
composites mixed with multi-walled carbon nanotubes. Materials Science and Engineering a-
Structural Materials Properties Microstructure and Processing. 2008;475(1-2):157-165.