Embed Size (px)
Citation preview

Paper No. 72
RESPONSE STYLES REVISITED:RACIAL/ETHNIC AND GENDER DIFFERENCES
IN EXTREME RESPONDING
Jerald G. BachmanPatrick M. O’MalleyPeter Freedman-Doan


Response Styles Revisited: Racial/Ethnic and Gender Differences in Extreme Responding
Monitoring the Future Occasional Paper No. 72
Jerald G. Bachman Patrick M. O’Malley Peter Freedman-Doan
Institute for Social Research University of Michigan
Ann Arbor, MI 2010

The data used in this study were collected under Grant Number R01DA01411 from the National Institute on Drug Abuse. The content is solely the responsibility of the authors. Recommended Citation:
Bachman, J. G., O’Malley, P. M., & Freedman-Doan, P. (2010). Response styles revisited: Racial/ethnic and gender differences in extreme responding (Monitoring the Future Occasional Paper No. 72). Ann Arbor, MI: Institute for Social Research. Available: http://www.monitoringthefuture.org/
Occasional Paper No. 72
ii

TABLE OF CONTENTS
Introduction ......................................................................................................................................1
Methods............................................................................................................................................1
Samples and Survey Procedures ................................................................................................1
Questionnaire Content ...............................................................................................................2
Results ..............................................................................................................................................2
Examples of Racial/Ethnic Differences in Response Distributions ...........................................3
Descriptive Analysis of Extreme Responding by Twelfth-Grade Students ...............................3
Multivariate Prediction of Response Style Indexes ...................................................................4
Comparison of Eighth-, Tenth-, and Twelfth-Grade Respondents ............................................5
Discussion ........................................................................................................................................6
Acknowledgments..........................................................................................................................10
References ......................................................................................................................................11
iii
Response Styles Revisited

INTRODUCTION Social scientists have been concerned with response sets for at least six decades (e.g., Berg & Collier, 1953; Cronbach, 1946, 1950). About a half century ago, Couch and Keniston (1960) wrote about “Yeasayers and Naysayers” and “response sets.” About a quarter century ago, Bachman and O’Malley reported on differences between black and white students in response styles in general (1984b), and how those differences related to self-esteem scores in particular (1984a). Many others have examined and discussed subgroup differences in response styles, particularly as related to survey and personality test items (Arce-Ferrer, 2006; Clarke, 2001; Fischer, 2004; Harzing, 2006; Hui & Triandis, 1989; Johnson, Kulesa, Cho, & Shavitt, 2005. One focus of response style research has been the extreme response style—the tendency to use extreme ends of response scales. In earlier analyses based primarily on high school seniors surveyed by the Monitoring the Future (MTF) research project in 1980–1982, Bachman and O’Malley examined a large number of response distributions and consistently found that “…blacks are more likely than whites to use the extreme response categories on Likert-type scales, particularly those employing an agree–disagree format” (1984b, p. 498). In the present paper, we extend the earlier MTF findings in four ways: First, and most important, we enlarge the racial/ethnic comparisons to include Hispanics and Asian Americans, along with African Americans and Whites. Second, we report findings separately for males and females, in order to reveal any gender differences as well as any gender interactions with race/ethnicity. Third, we include more recent data and much larger samples, combining 15 years of school surveys extending from 1991 through 2005. Finally, we expand the age coverage by including 8th- and 10th-grade students as well as 12th graders, although these additional analyses are limited to a small set of available items.
METHODS
The MTF project is an ongoing study of secondary school students that has been described extensively elsewhere (Bachman, Johnston, O’Malley, & Schulenberg, 2006; Johnston, O’Malley, Bachman, & Schulenberg, 2008); we provide a brief summary here. Samples and Survey Procedures Independent three-stage national probability samples of 8th-, 10th-, and 12th-grade students are surveyed each year in 120–160 public and private schools, selected to provide representative cross-sections of students throughout the coterminous United States. In the spring of each year, questionnaires are administered by professional interviewers from the University of Michigan during school hours, usually in regularly scheduled class periods. The questionnaires are designed for optical scanning, and can be completed by most respondents within 45 minutes. Usable questionnaires are obtained from about 84% of 12th graders and 88% of 8th and 10th graders. Nonparticipation is due primarily to absenteeism, with less than 2% refusing. Surveys from 1991–2005 are included in the present analyses, and differences by year are noted in multivariate analyses. All findings reported here are based on respondents who had no missing data on any of the items used in the analyses; that restriction reduced the samples by approximately 17% among 12th graders, 22% among 10th graders, and 35% among 8th graders.
1
Occasional Paper No. 72

Multiple questionnaire forms are used in all three grades, each form administered to a random portion of each sample. Numbers of cases shown in the tables are weighted to take account of sampling design; weights are normalized so that the actual number of questionnaires (raw observations) is approximately equal to the weighted number. Weighted total number of cases for the extensive analyses of 12th graders reported here is approximately 146,000. For additional analyses comparing three grades using a limited set of items, weighted numbers equal or exceed 93,481 for 8th graders, 94,534 for 10th graders, and 33,522 for 12th graders. Confidence intervals and tests of significance take account of design effects due to the stratified samples clustered in schools. Questionnaire Content All questionnaires contain items covering (a) substance use; (b) demographic information including gender, race/ethnicity, parental education, region, and urban density; and (c) educational information including self-reported grade point average and college plans. Many additional topics are included, differing from one questionnaire form to another. (Full questionnaire contents for the 12th-grade surveys, along with frequency distributions, are available in Bachman, Johnston, and O’Malley, 2008, and earlier volumes in the same series.) All of the items analyzed here use the following Likert-type response scale: Disagree (1), Mostly disagree (2), Neither (3), Mostly agree (4), Agree (5). The 12th-grade questionnaire forms include a large number of suitable agree–disagree items; we used 73 items, located in five of the six questionnaire forms, in our primary analyses for 12th graders. (Our selection of agree–disagree items for these analyses excluded 12 items described in the next paragraph, as well as some items covering topics likely to prompt distinctly different responses across gender and/or racial/ethnic subgroups. Full listings of the items are available from the authors.) Comparisons of 8th, 10th, and 12th graders are based on a set of 12 items, eight items comprising the MTF self-esteem scale (a balanced set, with four items reverse scored; six of the items adapted from the Rosenberg self-esteem scale), and four items adapted from Newcomb, Huba, and Bentler (1986) intended to tap depression (also balanced, with two items reverse scored). These 12 items cover only a very limited sampling of content, and they involve fairly high interitem correlations—a potential problem, as pointed out by Greenleaf (1992). Unfortunately, these were the only suitable agree–disagree items available in the 8th- and 10th-grade questionnaires. Accordingly, we focus primarily on the full 73 items in the 12th-grade samples, and treat the comparisons across the three grades as limited, but independent, replications across age (modal ages 14, 16, and 18).
RESULTS
We begin by showing frequency distributions for two items, selected as illustrations of the main findings. We next undertake a detailed examination of extreme responding using the 12th-grade data combined across questionnaire forms, presenting race/ethnicity/gender differences descriptively and then showing effects of multivariate controls for background and other relevant factors. We also review the five separate forms to illustrate important differences due to item
2
Response Styles Revisited

content, as well as consistencies in race/ethnicity patterns of extreme responding. Finally, we present summary findings for all three grades based on the 12 items common to all.
Examples of Racial/Ethnic Differences in Response Distributions Table 1 displays two items adapted from the Rosenberg (1965) self-esteem scale; the first item is positive, whereas the second is negative (and thus would be reverse scored when computing self-esteem). The table presents frequency distributions for the total sample and for males and females separately in each of the four racial/ethnic subgroups. The first item in Table 1 shows that the overwhelming majority of 12th graders either Agree (36%) or Mostly agree (42%) with the statement, “I take a positive attitude toward myself.” But the sharp differences between White and African-American students, shown in earlier research, are again clearly evident; African-American students are far more likely than Whites to choose “Agree” rather than “Mostly agree.” Hispanics are somewhat more likely than Whites to choose “Agree,” whereas Asian Americans and Whites show nearly identical distributions at all three grades. So the findings from this single item would seem to suggest that, compared with White students, unqualified “yea-saying” (or very high self-esteem) is much more prevalent among African Americans and somewhat more prevalent among Hispanics. The second item in Table 1 shows that almost two thirds of 12th graders either Disagree (40%), or Mostly disagree (23%), with the statement “Sometimes I think I am no good at all.” Again, there are racial/ethnic differences: African Americans are distinctly more likely than Whites to state unqualified disagreement with this item, whereas Asian Americans are less likely than Whites to do so. The two items in Table 1 also show some gender differences; in most groups, females show less extreme responding than males, suggesting lower self-esteem among adolescent girls. African Americans, however, showed no appreciable gender differences on these items. We return to gender differences in greater detail later. Descriptive Analysis of Extreme Responding by Twelfth-Grade Students We noted earlier that a fairly wide array of agree–disagree items is available for the 12th-grade samples. In five out of the six questionnaire forms, there were 10 or more agree–disagree items (ranging up to 23, and totaling 73 across the five forms). We define extreme responding as the proportion of extreme scale responses. (“Agree” and “Disagree” responses were coded 1; the middle three response categories were coded 0.) Index scores were calculated for 12th graders in each of the five questionnaire forms, excluding respondents with any missing data on the selected items (a full listing of items is available from the authors). Figure 1 displays mean Extreme Response index scores, along with 95% confidence intervals.1 This broad “sampling” of agree–disagree items for 12th-grade students shows the following
1The form-to-form differences in mean levels of extreme responding increase the variance slightly when the five forms are combined, compared with the variances within each form. This has the effect of enlarging the confidence intervals compared to what would be found if the computations were done with extreme response scores adjusted for the differences by form. However, because any such adjustment would be relatively minor, and because the confidence intervals based on our large samples are generally quite small, we judged it acceptable to use the slightly larger (and thus slightly more “conservative”) confidence intervals based on a simple combining of scores across the forms.
3
Occasional Paper No. 72

differences linked to race/ethnicity: African Americans are most likely to be extreme responders, choosing the extreme response nearly half of the time; Hispanics are next most likely, with about 43% extreme responses; and Whites and Asian Americans are virtually identical, averaging about 39% extreme responses. Additionally, extreme response rates are about 2% higher among African-American females versus African-American males; among the other race/ethnicity groups no gender difference exceeds 0.6% across this full set of 73 items. Our large sample sizes result in small confidence intervals, so these race/ethnicity distinctions are statistically trustworthy. The overlaps across groups are at least as impressive as the differences; this can be seen in Figure 2, which compares extreme response style frequency distributions for the four race/ethnicity subgroups (with genders combined for clarity). Whites and Asian Americans have virtually identical distributions, the distribution for Hispanics is modestly higher, and that for African Americans is higher still. Multivariate Prediction of Response Style Indexes The next analyses explored whether the race/ethnicity and gender differences would be affected by controls for students’ grade point averages (GPAs), college plans, and parental education, as well as certain background factors. We employed multiple classification analysis (MCA), a form of multiple regression analysis that can use categorical predictors along with predictors treated as interval scales (Andrews, Morgan, Sonquist, & Klem, 1973). Table 2 presents weighted Ns and unadjusted means for each predictor category, along with MCA results predicting extreme responding for all 12th-grade samples across all five questionnaire forms combined. The first MCA, in Column 1, shows prediction using only the “control” variables: GPA, college plans, and parental education (as interval scales), as well as region, urban density, year of survey, and questionnaire form (as categorical variables). Column 2 adds race/ethnicity and gender as separate (additive) predictors, whereas Column 3 uses the 10-category (interactive) race/ethnicity/gender as a predictor. In earlier analyses, Bachman and O’Malley concluded “…we find no dimensions which would permit us to ‘explain away’ the differences between blacks and whites” (1984b, p. 504). The same inability to “explain away” the differences holds true for the present analyses, and now extends to all four race/ethnicity subgroups; Table 2 shows that race/ethnicity/gender differences are not substantially affected by the inclusion of other variables as predictors.2 Specifically, with no controls, about 2% of the variance in extreme responding lies between race/ethnicity/gender groups (eta = .145, eta-squared = .021); in the presence of all the control variables, the additional contribution to variance is about 1.5% (R-squared increases from 7.0% to 8.5%). The MCA results also indicate that gender differences contribute virtually nothing to explaining variance in extreme responding across the full range of items reflected in Table 2. With race/ethnicity treated as a five-category measure and combined additively with gender (see Column 2), there was no loss in total R-squared value (compared with Column 3) and the beta
2Note also that the MCAs summarized in Table 2 include “Other race/ethnicity” categories (separate for males and females), in order to use the full samples for the regression analyses. We have not focused on the “Other race/ethnicity” categories in our reporting because they contain a diverse variety of subgroups too small to treat separately.
Response Styles Revisited
4
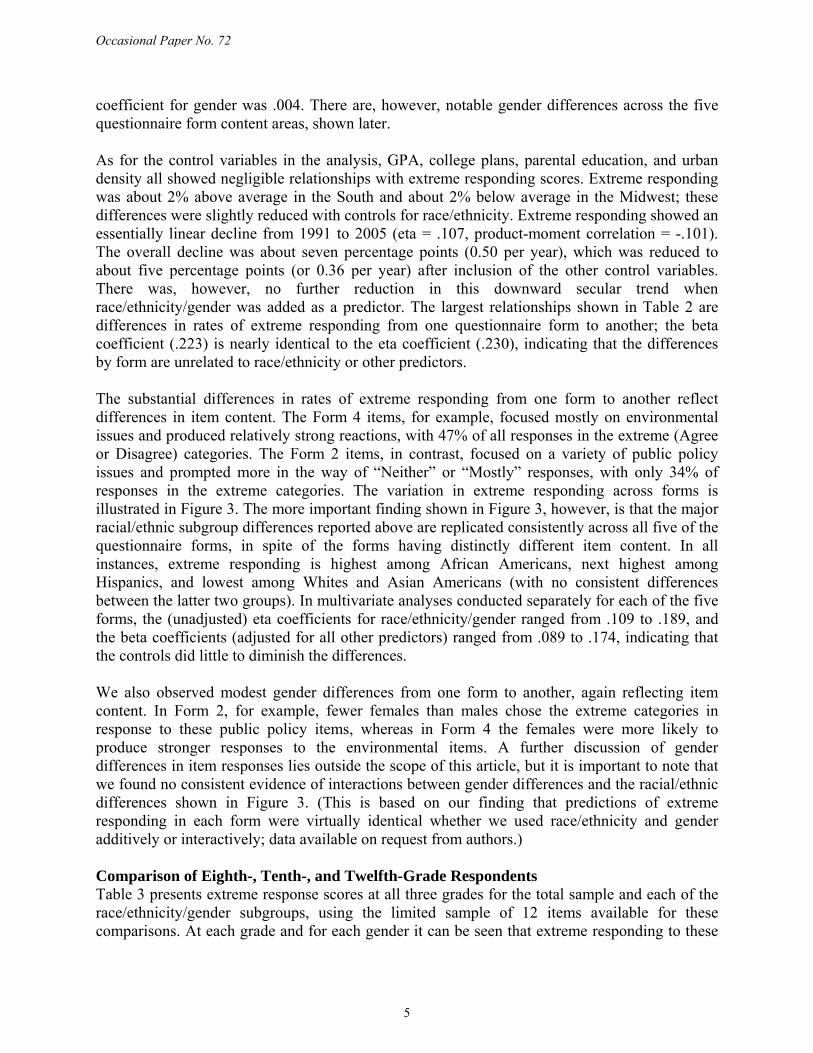
coefficient for gender was .004. There are, however, notable gender differences across the five questionnaire form content areas, shown later. As for the control variables in the analysis, GPA, college plans, parental education, and urban density all showed negligible relationships with extreme responding scores. Extreme responding was about 2% above average in the South and about 2% below average in the Midwest; these differences were slightly reduced with controls for race/ethnicity. Extreme responding showed an essentially linear decline from 1991 to 2005 (eta = .107, product-moment correlation = -.101). The overall decline was about seven percentage points (0.50 per year), which was reduced to about five percentage points (or 0.36 per year) after inclusion of the other control variables. There was, however, no further reduction in this downward secular trend when race/ethnicity/gender was added as a predictor. The largest relationships shown in Table 2 are differences in rates of extreme responding from one questionnaire form to another; the beta coefficient (.223) is nearly identical to the eta coefficient (.230), indicating that the differences by form are unrelated to race/ethnicity or other predictors. The substantial differences in rates of extreme responding from one form to another reflect differences in item content. The Form 4 items, for example, focused mostly on environmental issues and produced relatively strong reactions, with 47% of all responses in the extreme (Agree or Disagree) categories. The Form 2 items, in contrast, focused on a variety of public policy issues and prompted more in the way of “Neither” or “Mostly” responses, with only 34% of responses in the extreme categories. The variation in extreme responding across forms is illustrated in Figure 3. The more important finding shown in Figure 3, however, is that the major racial/ethnic subgroup differences reported above are replicated consistently across all five of the questionnaire forms, in spite of the forms having distinctly different item content. In all instances, extreme responding is highest among African Americans, next highest among Hispanics, and lowest among Whites and Asian Americans (with no consistent differences between the latter two groups). In multivariate analyses conducted separately for each of the five forms, the (unadjusted) eta coefficients for race/ethnicity/gender ranged from .109 to .189, and the beta coefficients (adjusted for all other predictors) ranged from .089 to .174, indicating that the controls did little to diminish the differences.
We also observed modest gender differences from one form to another, again reflecting item content. In Form 2, for example, fewer females than males chose the extreme categories in response to these public policy items, whereas in Form 4 the females were more likely to produce stronger responses to the environmental items. A further discussion of gender differences in item responses lies outside the scope of this article, but it is important to note that we found no consistent evidence of interactions between gender differences and the racial/ethnic differences shown in Figure 3. (This is based on our finding that predictions of extreme responding in each form were virtually identical whether we used race/ethnicity and gender additively or interactively; data available on request from authors.)
Comparison of Eighth-, Tenth-, and Twelfth-Grade Respondents Table 3 presents extreme response scores at all three grades for the total sample and each of the race/ethnicity/gender subgroups, using the limited sample of 12 items available for these comparisons. At each grade and for each gender it can be seen that extreme responding to these
5
Occasional Paper No. 72

items is highest among African Americans and next highest among Hispanics, just as we found in the much more extensive analyses of 12th graders reported above. There is also a consistent tendency for Asian Americans to score lower than Whites in extreme responding (differences of four to seven percentage points). Except for the latter difference, this limited comparison across three grades based on just 12 items closely replicates our analysis of 12th graders based on a much larger sampling of 73 items. Table 3 also shows that males are moderately more likely than females to use the extreme responses on the 12 items used for this comparison; the differences are roughly 6% in 8th and 10th grades, but only about half of that in 12th grade. This pattern of slightly higher extreme responding is quite consistent within three of the racial/ethnic subgroups; the exception is that, among African-American students, the differences are less than half as large in the earlier grades, with essentially no difference in 12th grade. As is shown in a separate report (Bachman et al., forthcoming [self-esteem paper]), there are gender differences in adolescent self-esteem scores that appear to be responsible for the modest gender differences in extreme response scores shown in Table 3. Table 3 also reveals age-related changes in extreme responding. For the total samples, extreme responding declines from 60% on these items in 8th grade (modal age 14), to 54% in 10th grade (modal age 16), and to 50% in 12th grade (modal age 18). As can be seen in the table, these age-related declines in extreme responding appear consistently in each of the race/ethnicity/gender subgroups.
DISCUSSION
Earlier examinations of response styles by Bachman and O’Malley (1984a, 1984b) were based on MTF samples of 12th-grade students in 1980–1982. The present large nationwide samples of adolescents in the United States, extending across 15 years (1991–2005), permitted us to go much further than simply replicating the earlier comparisons of White and African-American high school seniors. Most important, we extended the subgroup coverage to include Hispanics and Asian Americans. We also examined males and females separately within each age and racial/ethnic subgroup. Finally, the inclusion of 8th and 10th graders broadened the age range, and provided a sampling of adolescents before most dropping out of high school occurs. Our findings suggest a number of conclusions, highlighted in the discussion that follows. First, however, let us note some limitations of the present research and consider to what extent they may constrain our ability to draw firm conclusions. The Monitoring the Future samples used here are drawn so as to be representative of students in 8th, 10th and 12th grades throughout the coterminous United States. The samples do not, of course, include those who have dropped out of school, although proportions of dropouts are very small for the younger ages surveyed here. These school-based surveys, like most, also tend to underrepresent students who are frequently absent. If we were attempting to provide any sort of “absolute” estimates of extreme response tendencies, these sample issues might justify efforts at adjustment; however, our comparisons across race/ethnicity/gender subgroups are all quite relative. Indeed, as illustrated at several points in this paper, the levels of extreme responding also depend to a considerable extent on the particular sample(s) of items being considered.
6
Response Styles Revisited

The matter of item sampling represents another limitation that must be kept in mind. Fortunately, the 12th-grade samples include a large number of agree–disagree items spread across five questionnaire forms. We therefore focused our primary analyses and reporting on the 12th graders. We were able to observe that the comparisons across racial/ethnic categories were closely similar for the five questionnaire forms with their quite different samplings of item content. The survey data for 8th and 10th graders, on the other hand, included only a small number of agree–disagree items; consequently, our comparisons across all three grades (8th, 10th, and 12th) had to be limited to 12 items, 8 intended to measure self-esteem and 4 intended to measure depression. Estimates of subgroup differences in extreme response tendencies based on these items may be confounded with subgroup differences in the personality dimensions being measured. Although balanced between positively and negatively worded items, the content of these items is such that adolescents high in self-esteem and otherwise comfortable with themselves would be likely to use the extreme responses. High self-esteem adolescents would, for example, tend to be unqualified in their agreement with the item asking whether they take a positive attitude toward themselves. Because the intergroup differences found using this limited sample of 12 items (see Table 3) are consistent with the 12th-grade findings (in Table 2), we judge that the conclusions presented here are not seriously biased by the specific samplings of items. The above limitations notwithstanding, our findings support the following broad conclusion: African-American adolescents are highest in extreme responding, Hispanics are intermediate, and Whites and Asian Americans are lowest. All of these findings concerning extreme responding are virtually unchanged by controls for GPA, college plans, parental education, year of survey, region, and urban density. The consistency across different sets of questionnaire items available for 12th graders is reassuring; nevertheless, our second broad conclusion is that item content does matter in the assessment of response styles. As reported in the Results section, scores for 12th graders varied somewhat from one questionnaire form to another, driven by differences in questionnaire content. Although our lack of “content-free” items did not prevent the above assessment of overall racial/ethnic differences in extreme responding, it seems clear that different sets of items can produce somewhat different findings—particularly if the numbers of items are limited and the content is susceptible to subgroup differences in self-presentation or self-assessment. The major differences by race/ethnicity and gender summarized above replicate fairly closely across independent samples from three grades, representing U.S. adolescents ranging from modal ages 14, 16 and 18. This consistency across age groups, in spite of the limited range of items and content for this portion of the analysis, adds to our confidence in the generality of these findings. As for any differences between 8th, 10th, and 12th graders, extreme responding appears to decline slightly with age, reflecting primarily a decreased willingness to show unqualified agreement (based on additional analyses not shown here but available from the authors). Nevertheless, our third broad conclusion is: We are more impressed by the similarities (replication) across the three grades rather than any age-related differences.
7
Occasional Paper No. 72

Overall, how large and important are the racial/ethnic subgroup differences in response styles reported here? First it must be said that the overlaps among subgroups are far larger than any differences between them. Figure 1 is scaled to show a total range of one standard deviation (SD) (one-half SD on either side of the grand mean), and it can readily be seen that even the largest differences between subgroups are less than one-half SD. The overlaps between groups are most clearly evident in Figure 2, which shows frequency distributions on extreme responding for the four racial/ethnic subgroups (genders combined). Moreover, the multiple regression analyses indicate that only about two percent of the variance in extreme responding lies between the race/ethnicity/gender subgroups. All of that notwithstanding, the differences on some items are not trivial, especially if reported as percentages endorsing an extreme response category. For example, one could look at the first item in Table 1 and report that 60% of African-American high school seniors (genders combined) give an unqualified “Agree” response to the statement “I take a positive attitude toward myself,” in contrast to only 31% of their White and Asian-American classmates—a 2-to-1 difference. But one could also report that 88% versus 76% Agree or Mostly agree with that statement—still a significant difference, but not so dramatic. On balance, we conclude that racial/ethnic and gender subgroups among adolescents in the contemporary United States are more similar than different in their questionnaire response styles. That said, we must also stress that most of the differences we have observed are highly reliable, and some are large enough to suggest a continuing caution against the “raw” reporting of subgroup percentage differences in the extreme categories of Likert-type questionnaire items. At the risk of stating the obvious, we should keep in mind that the findings reported here are based on adolescents in a single nation (the United States), involve a single language (English), and make use of Likert-type response scales in school-based questionnaire administrations. The potential for differences in response styles, and the challenges in studying them, appear much greater in crossnational research (e.g., Clarke, 2001; Harzing, 2006; Johnson et al., 2005; van Herk, Poortinga, & Verhallen, 2004; Watkins & Cheung, 1995). Nevertheless, it is of interest that a number of crossnational findings show some consistency with the findings reported here. As examples, van Herk et al. (2004) found acquiescence and extreme responding more prevalent in Mediterranean countries than in northwestern Europe; and Harzing (2006) found extreme responding rates to be relatively high among Mexicans, low among northern Europeans, and very low among Chinese and Japanese. The possible explanations for group differences in extreme response style have been numerous. Some researchers have mentioned crosscultural or subcultural differences (e.g., Bachman & O’Malley, 1984b; Hui & Triandis, 1989; Marin, Gamba, & Marin, 1992). Harzig (2006) reviews a wide range of possible explanations that distinguish between countries in terms of levels of individualism versus collectivism, uncertainty avoidance, and extroversion, and then concludes with the observation that “…response bias can be a serious threat to valid comparisons across countries” (p. 261). In an area of research that includes so many different hypotheses and findings, that is one conclusion with which practically all researchers might agree. What, then, should researchers conducting opinion surveys or personality assessment conclude about the “threat” to their findings posed by subgroup differences in the use of the extreme response categories? On one hand, it appears that the similarities among subgroups—at least with respect to adolescents in the contemporary United States—outweigh the differences (see
8
Response Styles Revisited
Figure 2). On the other hand, the differences remain real, highly reliable, and large enough in some instances to produce distinctly different conclusions about subgroup differences depending on whether, for example, one looks only at “Agree” (or “Strongly agree”) responses rather than the full range of responses indicating agreement (see Table 1 and accompanying discussion). Although an ideal solution might involve a separate measure of extreme response style having items that are uncorrelated and with equal extreme response proportions (Greenleaf, 1992), practical constraints on measurement space usually preclude this option. So, for most researchers most of the time, the following suggestions may be useful: 1) When comparing subgroups on single-item measures of attitudes or opinions, it is important to consider the whole distribution of responses rather than focusing simply on an extreme, or even just the mean. 2) For multi-item scales it may be useful to explore alternative scoring methods.3 3) Finally, and most broadly, “…those who report on racial differences—and those who make use of such reports—should do so with a great deal of caution” (Bachman & O’Malley, 1984b, p. 508).
3One alternative scoring method is to collapse extreme categories. Bachman and O’Malley (1984) examined such an approach many years ago and found that it greatly reduced African American–White differences in self-esteem scores. A more recent analysis (Bachman, O’Malley, Freedman-Doan, Trzesniewski, & Donnellan, in press) provides a further illustration with self-esteem scores, contrasting the same race/ethnicity and gender subgroups as in the present Occasional Paper.
Occasional Paper No. 72
9

ACKNOWLEDGMENTS
The authors appreciate the comments and wise counsel of our colleague Eleanor Singer. The authors also thank Kathryn Johnson for her careful editing and additional help with manuscript preparation.
10
Response Styles Revisited
REFERENCES
Andrews, F. M., Morgan, J. N., Sonquist, J. A., & Klem, L. (1973). Multiple classification analysis: A report on a computer program for multiple regression using categorical predictors (2nd ed.). Ann Arbor, MI: The University of Michigan.
Arce-Ferrer, A. J. (2006). An investigation into the factors influencing extreme-response style: Improving meaning of translated and culturally adapted rating scales. Educational and Psychological Measurement, 66, 374–392.
Bachman, J. G., Johnston, L. D., & O’Malley, P. M. (2008). Monitoring the Future: Questionnaire responses from the nation’s high school seniors, 2006. Ann Arbor, MI: Institute for Social Research.
Bachman, J. G., Johnston, L. D., O’Malley, P. M., & Schulenberg, J. E. (2006). The Monitoring the Future project after thirty-two years: Design and procedures (Occasional Paper No. 64). Ann Arbor, MI: Institute for Social Research.
Bachman, J. G., & O’Malley, P. M. (1984a). Black-white differences in self-esteem: Are they affected by response styles? American Journal of Sociology, 90, 624–639.
Bachman, J. G., & O’Malley, P. M. (1984b). Yea-saying, nay-saying, and going to extremes: Black-white differences in response styles. Public Opinion Quarterly, 48, 491–509.
Bachman, J. G., O’Malley, P. M., Freedman-Doan, P., Trzesniewski, K. H., & Donnellan, M. B. (in press). Adolescent self-esteem: Differences by race/ethnicity, gender, and age. Self & Identity.
Berg, I. A., & Collier, J. S. (1953). Personality and group differences in extreme response sets. Educational and Psychological Measurement, 13, 164–169.
Clarke III, I. (2001). Extreme response style in cross-cultural research. International Marketing Review, 18(No. 3), 301–324.
Couch, A. S., & Keniston, K. (1960). Yeasayers and naysayers: Agreeing response set as a personality variable. Journal of Abnormal and Social Psychology, 60, 151–174.
Cronbach, L. J. (1946). Response sets and test validity. Educational and Psychological Measurement, 6, 475–494.
Cronbach, L. J. (1950). Further evidence on response sets and test design. Educational and Psychological Measurement, 10, 3–31.
Fischer, R. (2004). Standardization to account for cross-cultural response bias. A classification of score adjustment procedures and review of research in JCCP. Journal of Cross-Cultural Psychology, 35, 263–282.
Greenleaf, E. A. (1992). Measuring extreme response style. Public Opinion Quarterly, 56, 328–351.
Harzing, A.-W. (2006). Response styles in cross-national survey research: A 26-country study. International Journal of Cross Cultural Management, 6(2), 243–266.
Hui, C., & Triandis, H. (1989). Effects of culture and response format on extreme response style. Journal of Cross-Cultural Psychology, 20, 296–309.
11
Occasional Paper No. 72

Johnson, T., Kulesa, P., Cho, Y. I., & Shavitt, S. (2005). The relation between culture and response styles: Evidence from 19 countries. Journal of Cross-Cultural Psychology, 36, 264–277.
Johnston, L. D., O’Malley, P. M., Bachman, J. G., & Schulenberg, J. E. (2008). Monitoring the Future national survey results on drug use, 1975–2007. Volume I: Secondary school students (NIH Publication No. 08-6418A). Bethesda, MD: National Institute on Drug Abuse.
Marin, G., Gamba, R. J., & Marin, B. V. (1992). Extreme response style and acquiescence among Hispanics. Journal of Cross-Cultural Psychology, 23(4), 498–509.
Newcomb, M. D., Huba, G. J., & Bentler, P. M. (1986). Life change events among adolescents—An empirical consideration of some methodological issues. Journal of Nervous and Mental Disease, 174(5), 280–289.
Rosenberg, M. (1965). Society and the adolescent self-image. Princeton: Princeton University Press.
van Herk, H., Poortinga, Y. H., & Verhallen, T. M. (2004). Response styles in rating scales: Evidence of method bias in data from six EU countries. Journal of Cross-Cultural Psychology, 35, 346–360.
Watkins, D., & Cheung, S. (1995). Culture, gender, and response bias: An analysis of responses to the self-description questionnaire. Journal of Cross-Cultural Psychology, 26, 490–504.
12
Response Styles Revisited

Table 1 Examples of Racial/Ethnic Differences in Response Distributions on Agree–Disagree Scales: 12th Graders by Gender and Race/Ethnicity, 1991–2005
M and F Males Females Males Females Males Females Males Females Males FemalesI take a positive attitude toward myself
Weighted N 114,325 53,165 58,168 5,295 7,133 4,813 5,630 37,722 39,800 1,982 1,965Disagree 3.6 3.3 3.7 4.4 2.3 3.6 3.7 2.8 3.8 3.0 4.4Mostly disagree 7.0 5.4 8.4 3.3 4.0 5.0 7.2 5.6 9.4 6.5 9.9Neither 11.0 11.0 10.9 6.2 5.0 10.7 10.5 11.2 11.8 15.9 14.3Mostly agree 42.4 40.3 44.5 26.0 29.3 37.8 41.4 43.0 48.1 41.4 42.9Agree 36.2 40.1 32.5 60.0 59.4 42.9 37.2 37.4 26.9 33.2 28.5
Total 100.0 100.0 100.0 100.0 100.0 100.0 100.0 100.0 100.0 100.0 100.0
Sometimes I think that I am no good at allWeighted N 112,748 52,283 57,542 5,148 7,000 4,710 5,512 37,214 39,503 1,948 1,941
Disagree 40.2 43.6 37.2 53.4 55.3 45.1 40.0 43.1 34.4 32.3 25.4Mostly disagree 23.2 23.0 23.4 16.8 15.1 21.2 19.8 24.4 25.6 22.9 22.6Neither 16.0 16.4 15.5 13.7 10.6 16.2 14.8 16.4 16.2 20.7 18.5Mostly agree 13.2 10.7 15.4 8.6 10.9 10.7 16.0 10.6 15.9 15.4 20.1Agree 7.5 6.3 8.5 7.5 8.1 6.9 9.4 5.6 8.0 8.7 13.4
Total 100.0 100.0 100.0 100.0 100.0 100.0 100.0 100.0 100.0 100.0 100.0
Total Sample African Americans Hispanics White Asian Americans
13
Occasional Paper No. 72

Table 2Multiple Classification Analysis Predicting Mean Extreme Responding Index Scores12th Graders, 1991–2005
Grand Mean .408
UnadjustedWeighted Ns Means
Column 1 Column 2 Column 3Factors Race Afr. Amer. 15,551 .493 .485
Hispanic 12,815 .434 .435White 102,798 .390 .391
Asian Amer. 4,959 .387 .394Other race 6,185 .430 .433
Gender Male 67,527 .407 .408Female 74,781 .407 .406
Race x gender Af.-Amer. male 6,437 .481 .473Af.-Amer. female 9,114 .501 .493
Hispanic male 5,880 .431 .430Hispanic female 6,936 .436 .439
White male 49,707 .393 .394White female 53,091 .387 .388
Asian-Amer. male 2,421 .386 .391Asian-Amer. female 2,538 .389 .396
Other male 3,083 .433 .435Other female 3,102 .427 .431
Region Northeast 25,847 .402 .403 .408 .408Midwest 39,076 .385 .387 .391 .391
South 50,222 .430 .430 .421 .421West 27,163 .400 .400 .401 .401
Urbanicity Rural/Farm 5,155 .397 .401 .410 .410Rural/Non-Farm 10,397 .418 .412 .418 .418
Non-SMSA 22,855 .407 .406 .409 .409Other SMSA 67,196 .405 .405 .405 .405Large SMSA 36,706 .408 .413 .405 .405
Year of administration 1991 10,773 .437 .432 .434 .4341992 11,226 .437 .432 .432 .4321993 11,317 .438 .433 .434 .4341994 10,848 .422 .419 .420 .4201995 10,781 .417 .415 .415 .4151996 9,935 .413 .411 .408 .4081997 10,500 .421 .417 .415 .4151998 10,410 .408 .406 .404 .4041999 9,489 .405 .403 .402 .4022000 8,644 .396 .394 .391 .3912001 6,972 .381 .393 .390 .3902002 7,036 .371 .382 .381 .3812003 8,064 .371 .382 .381 .3812004 8,144 .364 .375 .375 .3752005 8,169 .368 .381 .379 .379
Questionnaire Form 1 29,628 .361 .363 .362 .3622 29,993 .337 .340 .339 .3393 31,749 .467 .468 .468 .4684 20,847 .473 .464 .463 .4635 30,092 .413 .416 .415 .415
Covariates Pearson r beta beta beta12th-grade GPA -.043 -.004 -.001 -.001
College plans -.018 .002 .002 .002Parents’ education index -.060 -.001 -.001 -.001
Factor Summary eta beta beta betaCoefficients marked in bold are Race .144 .133significant at the .01 level. Gender .001 .004
Race X gender .145 .128
Region .079 .076 .052 .051Urbanicity .017 .015 .016 .013
Year .107 .082 .085 .083Form .230 .222 .223 .223
R 2 .070 .085 .085
Means Adjusted Using MCA
14
Response Styles Revisited

Table 3 Mean Extreme Responding Index Based on 12 Items by Grade and Race/Ethnicity8th, 10th, and 12th Graders, 1991–2005
Males Females Males Females Males Females Males Females Males FemalesMean SD Mean Mean Mean Mean Mean Mean Mean Mean Mean Mean
8th Grade Extreme Response Index .599 .341 .627 .573 .723 .704 .630 .568 .616 .554 .571 .494
Weighted N 93,481 44,256 49,225 4,890 6,217 4,355 4,697 28,931 32,178 1,743 1,782
10th GradeExtreme Response Index .541 .348 .568 .516 .707 .676 .594 .539 .547 .490 .498 .440
Weighted N 94,534 45,159 49,375 4,534 5,754 4,312 4,916 32,097 34,482 1,495 1,554
12th Grade Extreme Response Index .499 .345 .514 .485 .634 .646 .524 .491 .502 .461 .433 .407
Weighted N 33,522 15,886 17,636 1,510 2,053 1,435 1,601 10,962 11,854 608 539
Asian AmericansM and F
Total Sample African Americans Hispanics White
15
Occasional Paper No. 72

Figure 1Mean extreme response index scores (with 95% confidence intervals shown) by race/ethnicity and
gender: 12th graders, 1991–2005
0.501
0.525
Figure 1Mean extreme response index scores (with 95% confidence intervals shown) by race/ethnicity and
gender: 12th graders, 1991–2005
Plus1/2SD
0.481
0.501
0.4310.436
0.466
0.525
Figure 1Mean extreme response index scores (with 95% confidence intervals shown) by race/ethnicity and
gender: 12th graders, 1991–2005
Plus1/2SD
0.481
0.501
0.4310.436
0.3930.387 0.386 0.389
0.408
0.466
0.525
Figure 1Mean extreme response index scores (with 95% confidence intervals shown) by race/ethnicity and
gender: 12th graders, 1991–2005
Plus1/2SD
Grand Mean
0.481
0.501
0.4310.436
0.3930.387 0.386 0.389
0.349
0.408
0.466
0.525
Figure 1Mean extreme response index scores (with 95% confidence intervals shown) by race/ethnicity and
gender: 12th graders, 1991–2005
Plus1/2SD
Grand Mean
0.481
0.501
0.4310.436
0.3930.387 0.386 0.389
0.291
0.349
0.408
0.466
0.525
Figure 1Mean extreme response index scores (with 95% confidence intervals shown) by race/ethnicity and
gender: 12th graders, 1991–2005
Plus1/2SD
Minus1/2SD
Grand Mean
0.481
0.501
0.4310.436
0.3930.387 0.386 0.389
0.291
0.349
0.408
0.466
0.525
Figure 1Mean extreme response index scores (with 95% confidence intervals shown) by race/ethnicity and
gender: 12th graders, 1991–2005
Confidence interval (upper bound) Mean Confidence interval (lower bound)
Plus1/2SD
Minus1/2SD
Grand Mean
16
Response Styles Revisited

3
Figure 2Extreme response index scores by race/ethnicity (indexes from 5 forms combined):
12th graders, 1991–2005
30
35
20
25
15
20
Perc
ent
5
10
0.00 - .19 .20 - .39 .40 - .59 .60 - .79 .80 - 1.00
Extreme Response Index Scores
Af. Amer. Hispanic White Asian Amer.
17
Occasional Paper No. 72

.600
Figure 3Extreme responding by racial/ethnic group and form number: 12th graders, 1991–2005
.450
.500
.550
.600
me
Res
pond
ers
Figure 3Extreme responding by racial/ethnic group and form number: 12th graders, 1991–2005
.300
.350
.400
.450
.500
.550
.600
Prop
ortio
n Ex
trem
e R
espo
nder
sFigure 3
Extreme responding by racial/ethnic group and form number: 12th graders, 1991–2005
.250
.300
.350
.400
.450
.500
.550
.600
Form 1 Form 2 Form 3 Form 4 Form 5
Prop
ortio
n Ex
trem
e R
espo
nder
sFigure 3
Extreme responding by racial/ethnic group and form number: 12th graders, 1991–2005
Af. Amer. Hispanic White Asian Amer.
.250
.300
.350
.400
.450
.500
.550
.600
Form 1 Form 2 Form 3 Form 4 Form 5
Prop
ortio
n Ex
trem
e R
espo
nder
sFigure 3
Extreme responding by racial/ethnic group and form number: 12th graders, 1991–2005
Af. Amer. Hispanic White Asian Amer.
Form 1 Form 2 Form 3 Form 4 Form 5
eta .174 .139 .109 .129 .189
beta* .160 .122 .089 .115 .174
r 2 .046 .056 .037 .039 .058
*Controlling for gender, urbanicity, region, year of administration, parents’ education level, 12th-grade GPA, and college plans.Calculations included “Other Race” category
.250
.300
.350
.400
.450
.500
.550
.600
Form 1 Form 2 Form 3 Form 4 Form 5
Prop
ortio
n Ex
trem
e R
espo
nder
sFigure 3
Extreme responding by racial/ethnic group and form number: 12th graders, 1991–2005
Af. Amer. Hispanic White Asian Amer.
Form 1 Form 2 Form 3 Form 4 Form 5
eta .174 .139 .109 .129 .189
beta* .160 .122 .089 .115 .174
r 2 .046 .056 .037 .039 .058
Calculations included “Other Race” category.
18
Response Styles Revisited