Embed Size (px)
Citation preview
Paper No. 00-0980
CD-ROM Papers
Duplication for publication or sale is strictly prohibitedwithout prior written permission
of the Transportation Research Board.
Title: Acceleration Characteristics of StartingVehicles
Author: Gary Long, University of Florida
Transportation Research Board79th Annual MeetingJanuary 9-13, 2000
Washington, DC
Acceleration Characteristics of Starting Vehicles
Gary Long, Ph.D., P.E.
Department of Civil EngineeringUniversity of Florida
P.O. Box 116580Gainesville, FL 32611-6580
E-mail: [email protected]: 352/392-7575Fax: 352/392-3224
Transportation Research Board79th Annual MeetingJanuary 9-13, 2000Washington, DC

Long iii
Acceleration Characteristics of Starting Vehicles
ABSTRACT
Acceleration characteristics of starting vehicles are needed for many transportation
analysis and design purposes involving driveways, turning bays, intersecting streets, traffic
signals, railroad crossings, simulation software, etc. Constant acceleration is sometimes assumed
or AASHTO Green Book values based on piecewise-constant accelerations are sometimes
adopted. Yet, continuing research has shown linearly-decreasing acceleration rates better
represent both maximum vehicle acceleration capabilities as well as actual motorist behavior. It
is not acceleration that is usually constant during speed changes, but the rate of change in
acceleration.
The evolution of AASHTO acceleration values for design is traced, and the literature is
reviewed for pertinent field observations. Linearly-decreasing acceleration (and some
deceleration) model parameters are calibrated for various sets of observational and design data.
Despite published results from thousands of field measurements, the values selected for design
were found to be based mostly on vehicle performance capabilities with conjecture about how
much of these capabilities are normally used by drivers. Design accelerations were found to
deviate substantially from observed accelerations. At the start of motion, observed accelerations
were about 15% faster for passenger cars and 45% faster for SU trucks than design accelerations.
As speed increased, observed accelerations dropped 3 to 4 times faster than design accelerations
for these vehicles. Observed accelerations for WB-15 trucks began 40% to 75% slower than
design accelerations, and were considerably slower than the values in the Green Book for trucks
at railroad crossings.
Long iv
Voids in the available information base are identified. Linearly-decreasing design
acceleration rates for motorists operating different classes of vehicles in different design
situations are recommended, and revisions for Green Book parameters and charts are suggested.
The recommended acceleration model greatly simplifies acceleration parameters, but implies
using different acceleration relationships for different design speeds instead of one for all.
Keywords: starting acceleration, design acceleration, motorist acceleration, deceleration
Long 1
Acceleration Characteristics of Starting Vehicles
Acceleration characteristics of vehicles starting from rest are needed for many
transportation analysis and design purposes involving driveways, turning bays, intersecting
streets, traffic signals, railroad crossings, simulation software, etc. Constant acceleration is often
assumed or piecewise-constant values derived from the AASHTO Green Book (1) are frequently
adopted. This paper examines whether the acceleration of vehicles starting from rest is constant,
or nearly constant, for various classes of vehicles, and suggests improvements for modeling
vehicular acceleration.
Several issues are involved. Vehicle acceleration depends upon the type of vehicle,
insofar as its size and weight and the engine power available to propel it. This determines the
maximum acceleration of which a vehicle is capable. Maximum acceleration is useful only when
utilized. Heavy trucks that are fully loaded sometimes accelerate at the maximum rate permitted
by their diesel engines. Most passenger car motorists, however, routinely utilize only a portion
of the maximum acceleration of which their vehicles are capable. The acceleration rates actually
applied by motorists are usually more important in design than vehicle maxima. For some
situations, average acceleration rates may be applicable. Often, ‘worst-case’ or lesser rates are
pertinent in order to accommodate more than just the half of motorists who exercise average or
above-average rates of acceleration.
ACCELERATION RATES FOR DESIGN
The most widely-accepted source for design information about the acceleration
characteristics of vehicles starting from rest in the U.S. is surely the AASHTO Green Book.
Acceleration information is presented in several places in the 1994 Green Book (i.e., Figure II-
Long 2
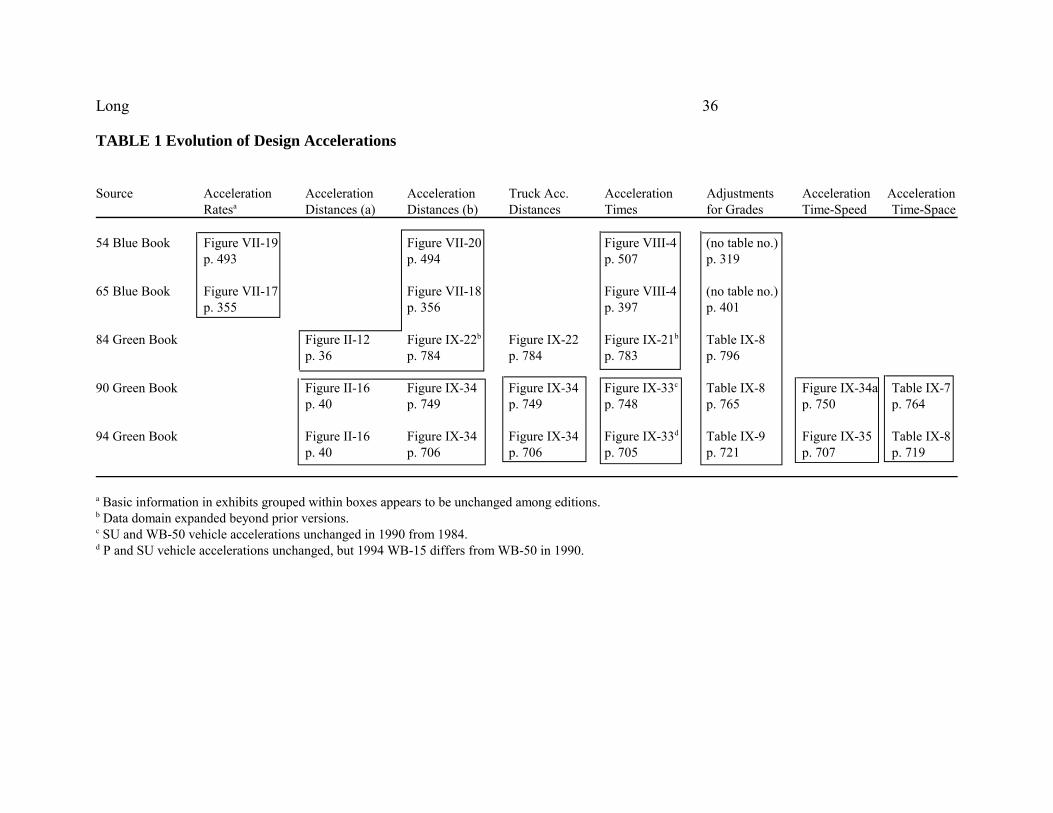
16, Figure IX-33, Figure IX-34, Figure IX-35, Table IX-8, and Table IX-9, as illustrated in Table
1 of this paper), but none of the presentations actually specify acceleration rates or underlying
acceleration models or assumptions. The Green Book states that values for acceleration rates for
passenger cars starting from rest are shown in Table IX-8, but really only speed, distance and
time are actually specified, not accelerations. It is hinted that the data in Table IX-8 are derived
from Figure IX-33, but only the first two of the nine lines of data in Table IX-8 fall within the
domain of Figure IX-33, and the rounding of speed and distance in Table IX-8 create some minor
disparities. However, the speeds and distances in Table IX-8 appear to match the data in Figure
II-16 very closely, which are reported as being based on the same data for passenger cars as used
in Figure IX-33. These inconsistencies can be bewildering for some design uses.
Some of the Green Book information is confusing. The top portion of Figure IX-34
appears to be a redundant re-plot of the same information in Figure II-16. The reference sources
for these figures appear be the same report, although the report is cited quite differently in the
reference lists at the ends of the two chapters. The data in the plots seem to present conflicts.
The 30 km/hr initial speed curve in Figure II-16 does not intersect the curve for initial speed of 0
km/hr, but the two curves merge at 300 m in Figure IX-34. The 30 km/hr line in Figure IX-33
seems to be mis-plotted at long acceleration distances which actually take less time than shown.
The reference source for truck data in Figure IX-34 seems faulty.
The Green Book provides a starting point, but the information is inadequate for many
design purposes. It is unclear whether some of the figures and tables represent average
accelerations or accelerations for design which will accommodate more than just half of all
motorists. It is unclear if the data pertain only to full-size passenger cars (P vehicles) or if low-
Long 3
power compact cars and other passenger cars are also represented. Several figures and tables
pertain only to passenger cars, yet loaded trucks may be the critical vehicles for design. Higher
than normal accelerations are adopted for unsignalized at-grade intersections based on the
concept that motorists may accelerate faster when maneuvering at these intersections, but the
same acceleration rates may not be applicable for clearing a queue that backs up onto a railroad
track where queue clearance is constrained by leading motorists who may have no particular
incentive for faster than normal acceleration. Yet, below-average accelerations are not addressed
for design. More detailed information is needed to be disclosed in the Green Book regarding
acceleration rates and the underlying models and assumptions. Although surprising, much of the
acceleration information reflected in the Green Book seems related to data from more than a half-
century ago rather than recent observations.
VEHICLE ACCELERATION CAPABILITIES
Maximum vehicle acceleration rates have long been recognized as decreasing with
increasing speed. Most motorists have observed that when accelerating from rest, such as at a
traffic signal, it is possible to accelerate faster, possibly to the extent of spinning the drive
wheels, than it is when accelerating from a high rate of speed, such as when passing a slower
vehicle on a two-lane roadway, where pushing the accelerator to the floor sometimes does not
deliver the boost desired. This is clear evidence that it is unreasonable to simply assume that
acceleration rates are constant over all vehicle speeds.
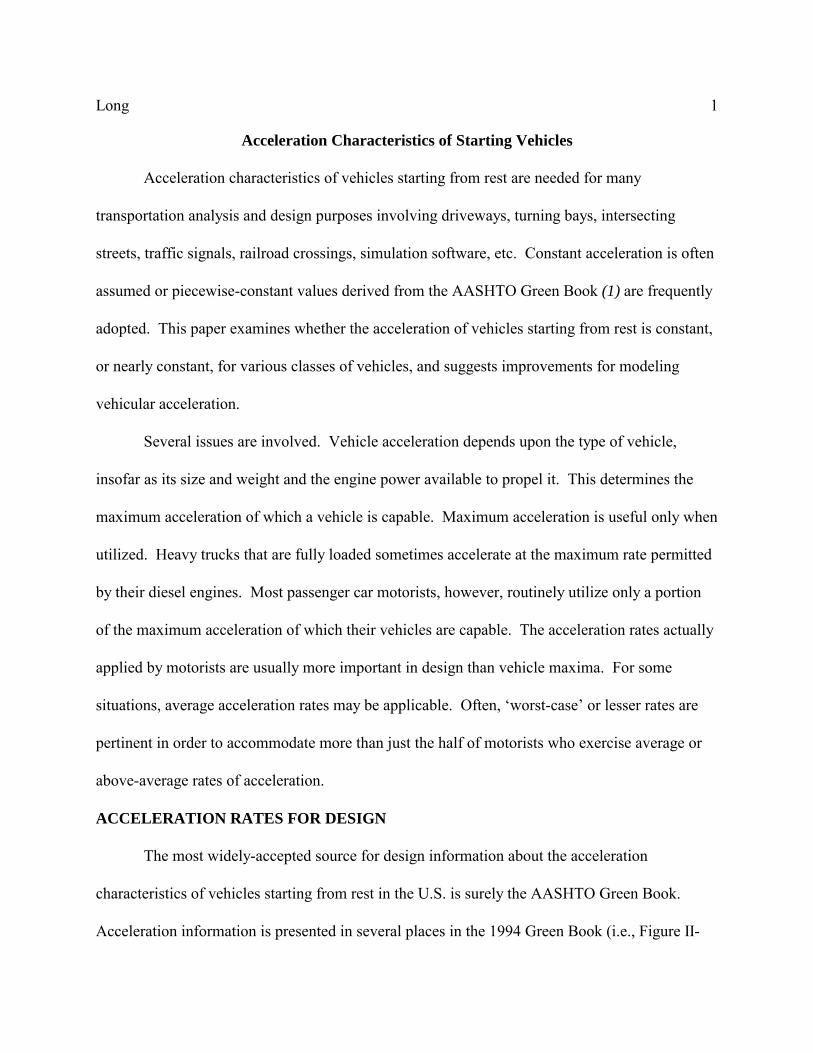
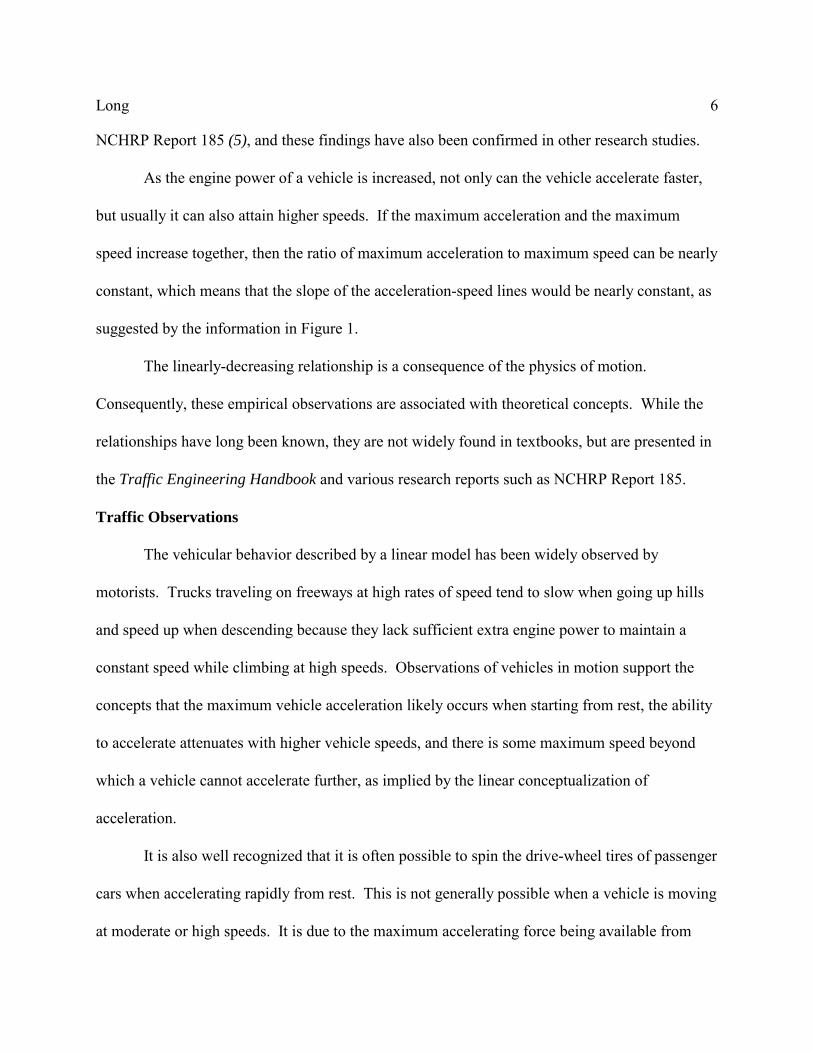
Loutzenheiser (2) reported in 1937 that the Bureau of Public Roads found little
acceleration information available, especially for speeds above 48.3 kph (30 mph), so they
conducted a series of tests on six “modern” 1935 to 1937 6- and 8-cylinder passenger cars, all

Long 4
equipped with 3-speed manual transmissions. The acceleration results from repeated trials at full
acceleration with all six vehicles and different drivers were averaged together in successive 8.05
kph (5 mph) speed increments. The maximum acceleration was 1.74 mps2 (5.72 fps2) at speeds
of 0-8.05 kph (0-5 mph), and the rates dropped linearly to 0.45 mps2 (1.47 fps2) at speeds of
104.7-112.7 kph (65-70 mph). The findings are displayed graphically in Figure 1, where the
strong linearly-decreasing relationship of acceleration related to speed is quite evident.
At about the same time as the tests by the Bureau of Public Roads, the Oregon State
Highway Department conducted similar tests. As reported by Beakey (3), the vehicles selected in
the Oregon tests of maximum vehicle accelerations involved one 1931 and five 1935 to 1937
passenger cars. Although the results were reported for each vehicle separately for 16.1 kph (10
mph) speed increments, Oregon researchers measured only full-throttle accelerations in second
gear, and separate full-throttle accelerations in high gear, rather than continuous accelerations
from stop. The optimum speed for shifting from second gear to high gear to maximize overall
vehicle acceleration was about 48.3-64.4 kph (30-40 mph) for all vehicles. From the speed data
in high gear, Beakey found the maximum accelerations followed “an approximate straight-line
decrease to zero at maximum speed” for each vehicle. Accelerations of three of the 1935-37 cars
were very close at each speed to the 6-vehicle average reported by Loutzenheiser. Accelerations
of the 1931 car were about 0.4 mps2 (1.3 fps2) below the 6-vehicle average at each speed,
probably due to a less powerful engine from the 5-year earlier era of development and
manufacturing. It had a top speed of only about 98 kph (61 mph), where all other vehicles
exceeded 113 kph (70 mph). One 1937 car had accelerations about 0.4 mps2 (1.3 fps2) above the
6-vehicle average at each speed. Engine and chassis sizes were not disclosed so it is not known
Long 5
if it might have had more cylinders or a lighter chassis than the others. The average of the
accelerations of these five vehicles would be about the same as the 6-vehicle average reported by
Loutzenheiser. One car departed from the trend. The accelerations of a 1935 Chevrolet, while
nearly linear, were higher at speeds near 64 kph (40 mph) and lower at 113 kph (70 mph) than
the 6-vehicle average, possibly due to a lower gear ratio in high gear than the other vehicles.
While this evidence from over 60 years ago indicated a strong linearly-decreasing
relationship between maximum accelerations and vehicle speeds, for both individual vehicles and
averages, vehicles have certainly evolved during the interim. Engines are more powerful and
compact, vehicles are smaller and lighter in weight thereby reducing weight-to-horsepower
ratios, and automatic transmissions have mostly replaced 3-speed manual transmissions in
automobiles. Thus, information on recent vehicles is of interest.
The Traffic Engineering Handbook (4) provides information on typical maximum
acceleration rates on level surfaces related to speed ranges for recent passenger cars and tractor-
semitrailer trucks. These are also plotted in Figure 1. As can be seen, recent automobiles do
indeed display higher acceleration capabilities than those of 60 years ago, but the rate of
reduction in acceleration capability with increasing speed is still almost the same as before.
While the performance of heavily-laden tractor-semitrailer trucks is considerably less than
automobiles, the reduction in acceleration capability with increasing speeds is less, likely due to
having many more incremental gears to use for acceleration. The linearly-decreasing
accelerations with increasing speed are clearly evident in each class of vehicles, but the strong
compliance is due to the accelerations being estimated from a model rather than empirical tests.
However, the underlying model was based on experimental test results from research reported in
Long 6
NCHRP Report 185 (5), and these findings have also been confirmed in other research studies.
As the engine power of a vehicle is increased, not only can the vehicle accelerate faster,
but usually it can also attain higher speeds. If the maximum acceleration and the maximum
speed increase together, then the ratio of maximum acceleration to maximum speed can be nearly
constant, which means that the slope of the acceleration-speed lines would be nearly constant, as
suggested by the information in Figure 1.
The linearly-decreasing relationship is a consequence of the physics of motion.
Consequently, these empirical observations are associated with theoretical concepts. While the
relationships have long been known, they are not widely found in textbooks, but are presented in
the Traffic Engineering Handbook and various research reports such as NCHRP Report 185.
Traffic Observations
The vehicular behavior described by a linear model has been widely observed by
motorists. Trucks traveling on freeways at high rates of speed tend to slow when going up hills
and speed up when descending because they lack sufficient extra engine power to maintain a
constant speed while climbing at high speeds. Observations of vehicles in motion support the
concepts that the maximum vehicle acceleration likely occurs when starting from rest, the ability
to accelerate attenuates with higher vehicle speeds, and there is some maximum speed beyond
which a vehicle cannot accelerate further, as implied by the linear conceptualization of
acceleration.
It is also well recognized that it is often possible to spin the drive-wheel tires of passenger
cars when accelerating rapidly from rest. This is not generally possible when a vehicle is moving
at moderate or high speeds. It is due to the maximum accelerating force being available from
Long 7
rest, and that force can exceed the tractive force provided by friction between the tires of the
drive wheels and the pavement. When the drive-wheels spin, the tractive force delivered to the
wheels is not applied entirely to the propulsion of the vehicle, so the maximum vehicle
acceleration rate can be limited by friction, from rest up to some speed, and then limited by
engine power beyond it.
While the acceleration model could be extended easily to include acceleration limitations
imposed by friction, there is no need for this. Most heavy trucks lack sufficient power to spin
their wheels under normal loaded conditions, and passenger cars rarely exercise wheel-spinning
acceleration. Consequently, a sufficient model for the maximum acceleration of both passenger
cars and trucks is given by a = α - βv. The parameter α represents the maximum acceleration,
which occurs when the vehicle speed is zero, just as it starts. The parameter β represents the
slope of the line or the rate of decrease in acceleration as speed, v, increases. To account for
grades, G, the model can be expanded to a = α - βv ± Gg, where g represents the acceleration of
gravity.
Equations for Linearly-Decreasing Acceleration
The linearly-decreasing acceleration model can be rewritten as a differential equation and
integrated to derive the following relationships (treating a grade as being constant), as partially
shown in pertinent textbooks (6):
�v/�t = α - βv ± Gg (1)
v = (α ± Gg) / β - ((α ± Gg) / β - v0) e-βt (2)
d = ((α ± Gg) / β) t - ((α ± Gg) / β - v0)(1 - e-βt) / β (3)
t = (β d + v - v0) / (α ± Gg) (from equations 2 and 3) (4)
Long 8
vmax = (α ± Gg) / β @ a = 0 (since a = α - βv ± Gg) (5)
v = vmax - (vmax - v0) e-βt (where β = (α ± Gg) / vmax) (6)
d = vmax t - (vmax - v0)(1 - e-βt) / β (7)
t = d / vmax + (v - v0) / (α ± Gg) (8)
The equations presented above arising from the linearly-decreasing acceleration model
are not quite as simple or as easy to apply as their counterparts based on constant acceleration
rates, but they are processed readily by a computer.
Maximum Vehicle Acceleration Parameter Values
The parameter values for α and β were determined for each class of vehicle in Figure 1 as
presented in the vehicle performance section of Table 2. The values for β are rather similar for
each vehicle type, and the values for α increase with decreasing weight-to-horsepower ratios.
MOTORIST ACCELERATION PREFERENCES
Since motorists rarely exercise the maximum acceleration capabilities of their vehicles,
except in emergencies, the maximum acceleration characteristics are not useful in design except
as bounding values. When considering the accelerations chosen by motorists, the linearly-
decreasing relationship with increasing speed no longer has a strong theoretical foundation.
Motorists usually apply a high level of power initially to overcome inertia while at rest to begin
to move, and then they tend to reduce acceleration gradually so that they make a smooth
transition to zero acceleration when they reach the speed limit or their desired speed of travel, for
continuing at a constant speed. This could be achieved in a variety of nonlinear patterns.
However, observations of travel behavior indicate that the linearly-decreasing model of
acceleration usually describes motorist behavior effectively.
Long 9
Early Observations
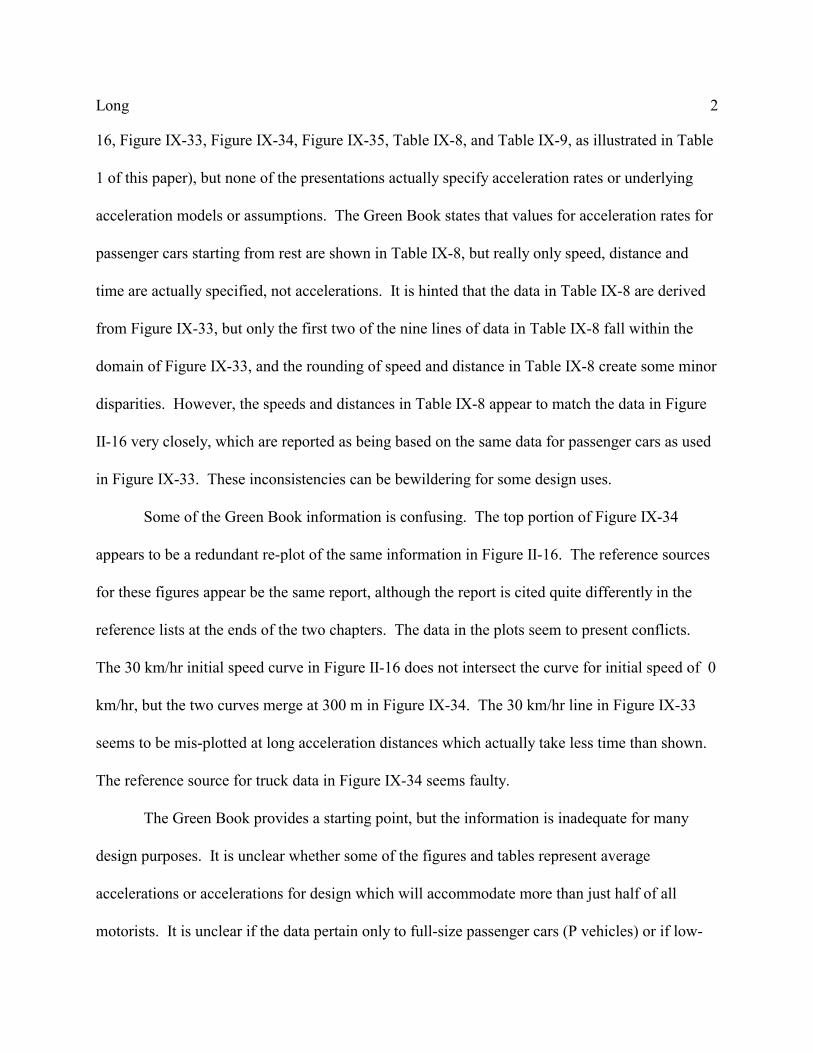
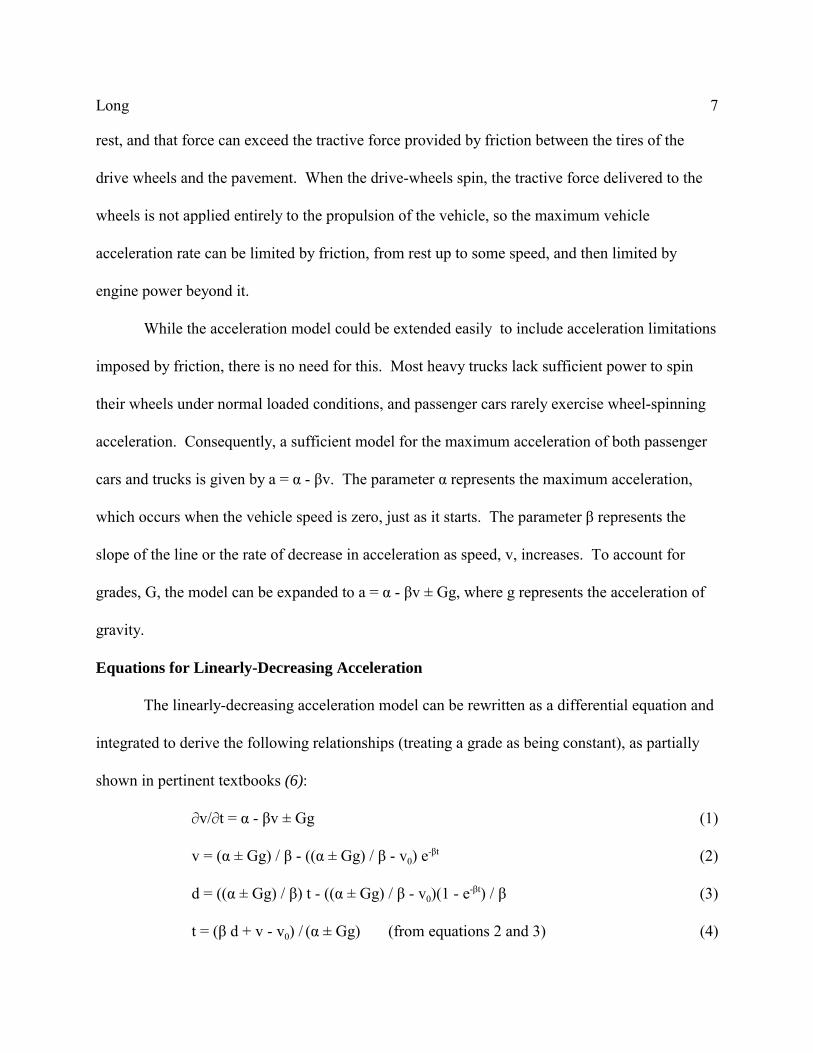
In 1937, Beakey (3) reported that the Oregon State Highway Department conducted
measurements of accelerations of the lead automobiles starting from rest at a traffic signal as they
traveled straight forward through a series of traps spanning a total of 290 meters (950 feet). The
roadway had no major street intersections, few minor intersections, and rural highway speeds
were permissible and immediately attainable after clearing the intersection traffic signal control
area towards the middle of the 290-meter observation zone. Most vehicles reached speeds of 48-
64 kph (30-40 mph) at the end of the 290-meter zone, and were still accelerating. These
observations were grouped together as average motorists. A few vehicles reached speeds of 64-
81 kph (40-50 mph) and were still accelerating at the end of the 290-meter zone. These were
grouped together as faster-than-average motorists. A few other vehicles only reached speeds of
32-48 kph (20-30 mph) and were no longer accelerating at the end of the 290-meter zone. These
were grouped together as slower-than-average motorists. The proportions of motorists in each
group were not reported. From the figures reported by Beakey, observed accelerations related to
automobile speeds were calculated and are presented in Figure 2 for each of the three groups of
motorists. Also shown in Figure 2 are the automobile maximum accelerations reported by
Loutzenheiser from Figure 1.
Each of the relationships displayed in Figure 2 exhibits linearly-decreasing accelerations
associated with increasing automobile speeds. Each of the three groups of motorists appears to
start from rest at an acceleration which is about the maximum of the vehicle, probably due to
revving up the engine either before or while disengaging the clutch to deliver sufficient power to
avoid the engine dying as the clutch is disengaged, and releasing the clutch as quickly as possible
Long 10
to avoid unnecessary friction-heat or wear. The parameter values for α and β were determined
for each group of motorists in Figure 2 and are presented in the motorist observations section of
Table 2.
The Bureau of Public Roads also addressed the issue of “normal” accelerations by
motorists in the studies reported in 1937 by Loutzenheiser (2). Rather than observing motorist
behavior in actual traffic conditions, the test drivers used in measuring maximum automobile
accelerations were instructed to drive the same test vehicles again in a series of trials, but to
emulate what they perceived to be their normal driving behavior. Loutzenheiser compared the
results with the findings of Beakey and observed that accelerations of the test drivers were
similar but slightly slower than the faster-than-average drivers reported by Beakey. He noted that
this somewhat faster than average result was not surprising since the advance-alerted test drivers
were probably concentrating more on their driving and likely were going faster than the unalerted
public motorists. He also noted some disparities in the test drivers replicating their “normal”
driving performances in repeated tests involving the same acceleration ranges.
Although the relationship between acceleration and speed for normal driving found by the
Bureau of Public Roads appeared to be somewhat curved rather than straight, Loutzenheiser
deduced that the normal acceleration rate was about two-thirds of the maximum automobile
acceleration rate. Loutzenheiser concluded that the Bureau of Public Roads’ tests seemed to
support the Oregon State Highway Department’s findings about normal driving behavior.
Other Parameter Sources
The decreasing linear relationship between acceleration and vehicle speed has been
reported in a number of studies. In a detailed investigation in NCHRP Report 185 of the effect of
Long 11
grades on traffic movements, St. John and Kobett (5) examined test results reported in the
literature along with underlying theoretical considerations and determined that the acceleration
capability of passenger cars, pickup trucks and recreational vehicles was a linearly-decreasing
function of speed. This was verified by their own tests in which they found a linear relationship
with α = 3.36 (11.0) and β = 0.0803 for a 1970 Chevrolet sedan on level terrain, and α = 5.19
(17.0) and β = 0.1478 for a 1971 Chevrolet 3/4-ton pickup truck on level terrain, under maximum
acceleration. They provide similar results for other vehicles.
Glauz et al. (7) established a linear relationship with α = 2.5 (8.2) and β = 0.104 for the
acceleration characteristics of the lowest 10% in performance capabilities of 1975-1995
recreational vehicles, and α = 2.85 (9.36) and β = 0.0853 for passenger cars. These were
forecasts, but they reflect a departure from the typical approach of trying to identify the average
acceleration characteristics of a class of vehicles in favor of an approach more suitable for design
purposes where more than just half of a class are intended to be accommodated. Vehicle
acceleration capabilities, of course, may not be as important in design as the acceleration rates
chosen by the slowest 10% of motorists.
In 1958, Bellis (8) collected data at three signalized intersections in New Jersey using a 5-
man field crew pressing telegraph keys wired to a 20-pen chart recorder. Only a couple of traps
were configured at most locations, which are not useful for determining acceleration profiles, but
average travel times were reported for one location at six positions. Data for passenger cars were
too incomplete to be useful, but the truck data had fewer gaps and exhibited a linearly decreasing
relationship with α = 1.67 (5.47) and β = 0.1229. Bellis identified heavy trucks as having an
average length of 12.8 meters (42 feet), which suggests that today’s heavy trucks may be bigger
Long 12
and heavier, and the trucks in Bellis’ study may be closer to SU vehicles.
In 1966, Dockerty (9) used motion picture photography to study the acceleration
characteristics of leading vehicles queued at two traffic signals in England to capture actual
motorist behavior in traffic streams instead of using observations made on test tracks under
controlled conditions. He measured the distances of movement during 1-second intervals
commencing at the beginning of vehicle motion. Observations were separated for passenger
cars, small vans and medium vans from heavy vehicles, which included all others. While his
report did not present it, a linearly-decreasing model with α = 2.27 (7.45) and β = 0.1487 fits the
data from his observations of cars starting in the median lane. His data reflect that leading
vehicles tend to accelerate in the outside travel lane a little slower, with α = 1.88 (6.17) and β =
0.1201. These two sets of findings are similar to Beakey’s findings from 1935. Dockerty’s data
indicate leading trucks in both lanes accelerated slower yet, with α = 1.49 (4.87) and β = 0.1455,
which is similar to Bellis’ data. The site had no pedestrian interference, but where this
interference existed in his site in London, a linearly-decreasing model does not fit his leading car
accelerations, which instead seem to begin accelerating very slowly, and then gradually increase
to a maximum before gradually reducing acceleration.
In 1972, Evans and Rothery (10) collected speed and acceleration data on the
characteristics of 15,138 queued motorists crossing a trap after stopping for a red traffic signal at
a suburban location near Detroit. From their data, Bonneson (11) calculated a strong linearly-
decreasing relationship between acceleration and speed. The first sensor in their trap, however,
was so far beyond the stop-line that speed measurements reached 35 to 55 kph (22 to 34 mph),
which requires excessive extrapolation, with no intervening data points, back to a speed of zero
Long 13
to determine the maximum acceleration at startup. Their data showed slightly higher rates of
acceleration of about 0.1 mps2 (0.33 fps2) in the left travel lane than in the right lane at all
positions in the queues. Of course, motorists in a queue cannot go faster than the motorists in
front of them, but they can always choose to go slower. Consequently, queue accelerations can
be slightly slower than the accelerations of queue leaders, but they represent the majority of
“normal” accelerations for use in design.
In 1989, Bonneson (11) applied the technique of Evans and Rothery (but with the first
sensor located close to the stop-line) and collected acceleration and speed data for a large sample
of 4,820 passenger cars accelerating straight ahead at five different signalized sites in two States.
His data, which consisted of averages over different distances of acceleration, showed very
strong linear relationships between acceleration and speed, with α = 2.02 (6.63) for each traffic
stream. The five through-traffic streams had very similar accelerations ranging from β = 0.1184
to β = 0.1326. This is very close to the data of both Beakey and Dockerty. In another treatise,
Bonneson (12) reported on eight left-turning movements with a total sample of 13,881 observed
passenger cars also having α = 2.02 (6.63) that were studied at this same set of sites. All left-
turning movements showed slower accelerations at higher speeds than through movements,
ranging from β = 0.1339 to β = 0.3157, probably due to centrifugal forces affecting occupant
comfort while turning through different radii under “normal” conditions.
Acceleration data for a sample of 98 left-turning and 342 right-turning vehicles moving
from minor streets into cross-street gaps of 10 seconds or less were reported in 1996 by Harwood
et al. in NCHRP Report 383 (13). This limitation on gap time was imposed to select samples
where drivers had some incentive to use relatively high accelerations. Speeds were measured

Long 14
across a series of four 61-meter to 122-meter (200-foot to 400-foot) traps on the cross streets, so
the observations did not provide much detail, did not provide startup accelerations, and were only
summarized in NCHRP Report 383. All of their computations assumed that each vehicle had a
constant acceleration over each long trap. Rather than rely on these data for design accelerations,
AASHTO 1994 Green Book values were stated as being similar and were used by the authors.
Akcelik and Biggs (14) used measurements of the second-by-second speeds of 1,037
samples of vehicles accelerating from a stop in three types of locations (CBD, urban and
nonurban) in Australia, collected with an instrumented chase-car, to calibrate a polynomial
model for acceleration. The polynomial model was formulated to satisfy conceptual constraints
of zero jerk at the start and end of acceleration by starting and ending acceleration with an
acceleration rate of zero and requiring smooth changes in acceleration in between. While the
polynomial model was reported to provide the best fit to the data, detailed evidence of its
effectiveness was not provided. Instead of being linear, the relationship appears nearly as a
semicircle on an acceleration versus speed plot. However, except for two data points, the model
seems to conform relatively well to Dockerty’s results from a location having pedestrian
interference. Furthermore, unlike other data collection techniques which obtain only one or two
or maybe three speed measurements for each vehicle, and few, if any, measurements within the
first few seconds of movement, the second-by-second data stream captures an average of about
19 measurements for each starting vehicle, and all of the measurements are evenly-spaced in
time. With 19 measurements pertaining to the accelerations of each of a thousand different
vehicles having different drivers at multitudes of different locations (956 km of urban roads and
1361 km of nonurban roads), this data set would be expected to be superior to most data for

Long 15
deriving and calibrating a model for accelerations at slow speeds. However, to be reliable, the
chase-car spacing must be very accurately known or somehow maintained at a rigorously
constant distance. This is difficult to achieve, and how it was accomplished was not reported.
ACCELERATION DESIGN VALUES
For design purposes, AASHTO (and formerly AASHO) has prepared and released a
series of design policies recommending what a consensus of State and Federal transportation
officials, and other professionals, have deemed to be the best practices for use throughout the
U.S. This started with 7 separate design policies released between 1938 and 1944, which were
integrated into the Blue Book (15) of 1954 and its second edition in 1965. Subsequent works
include a reorientation and refinement of these policies in the Green Book (1) of 1984 with its
succeeding editions in 1990 and 1994. Promoting consistency in design across the U.S., these
and some companion documents have been widely adopted as the standards for most design
activities.
Early Design Values for Acceleration
For two design issues, the design of the lengths of acceleration lanes needed for merging
traffic and the design of intersections with stop control on a minor road crossing a major
highway, acceleration rates are needed. In the 1954 Blue Book, a plot of acceleration rates
versus speed, similar to the graph reported by Loutzenheiser (2), was provided as Figure VII-17
(see Table 1). It included Loutzenheiser’s and some of Beakey’s (3) findings, and was
augmented with some later findings. The text stated that limited available data showed that the
average or normal accelerations of more recent vehicles having semi-automatic and fully
automatic gear shifts and torque converters were in the same range as vehicles with manual gear
Long 16
shifts as in Loutzenheiser’s and Beakey’s studies. It was declared that the acceleration rate of the
normal or average driver was about 60% of the automobile maximum rate that was reported in
Loutzenheiser’s tests, which was slightly less than the two-thirds proportion concluded by
Loutzenheiser. This relationship was used in preparing curves describing acceleration times in
Figure VIII-4 for use in the design of two-way stop-controlled intersections. The specific
acceleration values that were applied were not disclosed, but Loutzenheiser’s nonlinear test-
driver accelerations evidently were intentionally replaced with 60% of his automobile maximum-
acceleration test results, which resulted in a linearly-decreasing relationship being adopted for
normal motorist accelerations.
A line corresponding to 60% of the automobile maximum acceleration rate is shown in
Figure 2. It is easily seen that this relationship is grossly inconsistent with the behavior of actual
traffic as observed by Beakey. Its slope is flatter than the maximum vehicle acceleration line
whereas the slope from observed traffic is steeper. The initial acceleration rates are much too
small.
With a value of α = 1.29 (4.23) and β = 0.045 in the linearly-decreasing acceleration
model, a resulting curve can be drawn that will coincide with the one in Figure VIII-4 of the 1954
Blue Book for passenger cars starting from rest on level surfaces under normal acceleration. A
curve for maximum accelerations of passenger cars is also shown in Figure VIII-4. With a value
of α = 1.75 (5.75) and β = 0.045 in the linearly-decreasing acceleration model, a resulting curve
can be drawn that will coincide with the full acceleration curve. These parameter values are in
agreement with those shown in Table 2 for maximum accelerations of 1935-1937 automobiles, as
was intended. However, the ‘normal’ motorist accelerations are 73.6 % of the maximum

Long 17
automobile accelerations at start-up, and drop to 60% at 30 mph and then below 60% at faster
speeds. Instead of “being six-tenths the maximum rate” at any given speed as declared, they are
simply 0.458 mps2 (1.5 fps2) lower at all speeds. Yet, the linearly-decreasing accelerations that
were accordingly adopted for normal driving, with α = 1.29 (4.23) and β = 0.045, are surely more
realistic than estimates simply intended to be 60% of vehicle maximum values.
Although the 1954 Blue Book cited Beakey’s report (3) in one of the curves plotted in
Figure VII-19 regarding maximum automobile accelerations, it did not reference the findings
from his observations of normal motorist accelerations. This is probably because Beakey did not
include a table or figure in his paper directly displaying his observed normal motorist
accelerations related to speed. Consequently, it appears that the Blue Book may have missed the
best information available on which to base design accelerations.
For use in the design of acceleration lanes, the 1954 Blue Book contains Figure VII-20,
showing the distance automobiles travel on level surfaces related to starting and final speeds.
The acceleration rates are supposedly based on the same data as used in Figure VIII-4 pertaining
to normal motorists. With a value of α = 1.15 (3.78) and β = 0.0368 in the linearly-decreasing
acceleration model, a resulting curve can be drawn that will coincide closely with the one in
Figure VII-20 for passenger cars starting from rest on level grades. The curve from the model in
this instance deviates slightly from the design curve at speeds reached that exceed 72 mps (45
mph) possibly because the nonlinear test-driver results of Loutzenheiser (2) were used rather than
the 60% of maximum acceleration estimates. This yielded acceleration estimates for design
which are slower at start-up than were observed for average motorists, and faster at high speeds.
However, it produced better estimates of observed motorist behavior than estimates based on
Long 18
60% of maximum automobile accelerations. The reason for different sets of accelerations,
interpreted from the same data, being used for the design of acceleration lanes in contrast to those
used for the design of stop-controlled intersections, is surely that different AASHO
subcommittees or task forces prepared these different sections and interpreted Figure VII-19
differently.
Above-Normal Accelerations for Design
The 1954 Blue Book indicated that most drivers accelerate somewhat more rapidly than
‘normal’ when crossing a major highway, and consequently an “assumed” curve was presented in
Figure VIII-4 with higher than normal accelerations for passenger cars, for use in intersection
design. Most drivers are usually willing to accelerate faster than normal to squeeze into a tight
gap, so this seems like a reasonable hypothesis for some aspects of intersection design.
However, the maximum acceleration rate acceptable to 85% of all motorists for squeezing into a
tight gap is likely not the same as the usual acceleration rate of the fastest motorists, and there
may be no association between the two, so inferences about the applicability of Beakey’s data in
this situation must be considered with caution. Also, intersection design is mostly based on
turning vehicles, and some studies such as Bonneson (12) have found turning accelerations to
differ from through vehicles.
The above-normal acceleration curve for passenger cars in the 1954 Blue Book was
located between the normal acceleration and maximum vehicle acceleration curves, 1/3 from the
normal curve at all speeds. With a value of α = 1.43 (4.70) and β = 0.045 in a linearly-decreasing
acceleration model, a resulting curve can be drawn that will coincide with the “assumed”
acceleration curve.
Long 19
The 1954 Blue Book also considered buses and trucks as potential stopped vehicles
crossing a major roadway, and noted that their rates of acceleration are substantially lower than
passenger cars. It was noted that the high gear ratios in low gears that are necessary for starting
heavily-loaded trucks and truck combinations in motion result in very low accelerations. The
text states that from unpublished studies of truck operations it was determined that the
accelerating times for SU and C-50 design vehicles should be assumed to be 135% and 160%,
respectively, of passenger cars. The curves for SU and C-50 vehicles in Figure VIII-4 correspond
to assumed acceleration times that are exactly 135% and 160% of the above-normal acceleration
times shown in the curve for the “assumed” acceleration of P vehicles. With a value of α = 0.84
(2.77) and β = 0.055 in a linearly-decreasing acceleration model, a resulting curve can be drawn
that will coincide with the one in Figure VIII-4 of the Blue Book assumed for the SU vehicle.
With a value of α = 0.62 (2.04) and β = 0.055 in a linearly-decreasing acceleration model, a
resulting curve can be drawn that will coincide with the one in Figure VIII-4 assumed for the C-
50 vehicle. It should be observed that the 135% and 160% factors were applied to acceleration
times, not acceleration rates. All three assumed acceleration relationships, for P, SU, and C-50
design vehicles, were based on the presumption of above-normal accelerations by motorists at
stop-controlled intersections, and would not seem applicable for situations where normal
motorist behavior should be expected or where below-normal accelerations need to be
accommodated for safety. The parameters derived for the design curves in Figure VIII-4 of the
1954 Blue Book are summarized in Table 2 for comparison with the parameters from observed
accelerations.
Long 20
EVOLUTION OF DESIGN ACCELERATION RATES
While acceleration rates for design policies were based on passenger car data that were
already 17 to 19 years old in the 1954 Blue Book, they remained essentially unchanged for 36
more years until the 1990 Green Book. As shown in Table 1, the 1965 Blue Book contained the
same acceleration information as the 1954 Blue Book. The 1957 and 1973 Red Books (16)
simply referred to the prior Blue Books for information involving vehicle accelerations.
Although one new figure and an addition to another were added to the 1984 Green Book,
the other exhibits pertaining to acceleration were still essentially the same as in the 1954 Blue
Book. The extended figure presented normal truck acceleration distances, but the source of the
data, type of truck, and weight-to-power ratio were undisclosed. The new figure was a redundant
copy of the figure displaying passenger car acceleration distances, but with an expanded domain.
The figure showing acceleration times also had its domain expanded.
Although Figure VII-19 presenting the acceleration data that served as the source for the
design rates from the 1954 Blue Book was included in the 1965 Blue Book, it was not presented
again in later editions. Furthermore, the sources for the acceleration rates were no longer
disclosed, just as the actual values of the acceleration rates used to create the exhibits were never
revealed. This could have been to avoid divulging that most of the underlying data were over 50
years old, sketchy at best, and pertained to the operation of vehicles from a different era having
3-speed manual transmissions and different physical characteristics.
The word “assumed” disappeared from the curves for acceleration times for the SU and
WB-50 (previously C-50) vehicles in the 1984 Green Book (Figure IX-21). Furthermore, the text
became a little garbled and no longer indicated clearly that these acceleration curves were only
Long 21
assumptions!
1990 Revisions
Accelerations for cars were increased in Figure IX-34 and Figure II-16 of the 1990 edition
of the Green Book. The plot in Figure II-16 appears to be a little more accurate and properly
referenced. The reference source of the data for passenger cars in Figure IX-34 appears to be
faulty. With a value of α = 1.71 (5.6) and β = 0.043 in the linearly decreasing acceleration
model, a resulting curve can be drawn that will coincide with the one in Figures II-16 and IX-34
for passenger cars starting from rest on a level road under normal acceleration.
The source of the revised accelerations for P vehicles in normal travel conditions was
reported as being Appendix F of NCHRP Report 270 (17). This, in turn, was based on data in
ITE’s Transportation and Traffic Engineering Handbook (18) which indicated that normal
acceleration, averaged over a range in speed from 0 to 64.4 kph (40 mph), was 1.48 mps2 (3.3
mph/sec or 4.84 fps2). This information was obtained from unpublished data collected in
conjunction with NCHRP Report 111 using a chase-car, equipped with an accelerometer, that
endeavored to match the speed change rates of an undisclosed sample of other cars in traffic.
NCHRP Report 270 plotted an acceleration versus speed chart similar to the 1965 Blue
Book Figure VII-17 and noted that a line corresponding to the ITE Handbook accelerations for
speeds above 56.35 kph (35 mph) indicated faster motorist accelerations than the 1935-37
vehicle accelerations that were considered in the design policy. These were also faster than the
assumed rates for “normal” driving given in the Blue Book. Since most passenger cars in 1984
had more pickup capability than those of the mid-1930s which served as the basis for the
standards, and were lighter and had automatic rather than manual transmissions, it was perhaps

Long 22
feasible to expect that motorists might be accelerating more quickly under normal conditions
than they did in the mid-1930s. However, motorists with newer cars usually have to travel being
mixed into traffic streams with older cars and trucks, and cannot usually travel faster than the
slowest vehicle ahead when starting from rest. This tends to condition motorists to accelerate at
a rate similar to normal traffic, except perhaps during episodes of urgency or impatience.
Moreover, even the older cars have more acceleration capability than is utilized by motorists, so
it could also be expected that having more excess vehicle performance capability might not
induce much change in motorist behavior.
Augmented to the acceleration vs. speed chart in NCHRP Report 270 were curves of the
maximum acceleration capabilities of two recently manufactured cars, and a line representing a
forecast of the maximum vehicle acceleration capability that was expected to be exceeded by
90% of passenger cars in use during the next 11 years. ITE’s data from observed accelerations
exceeded some of these curves of maximum vehicle capabilities at higher speeds, so a
hypothetical “design” car curve slightly slower than these maximum vehicle capabilities was
created in NCHRP Report 270 with accelerations set at 1.48 mps2 (3.3 mph per second) between
speeds of 0 and 56.35 kph (35 mph).
With so little information available, many vastly different feasible design car curves
could be drawn, and NCHRP Report 270 offered the suggested curve only as “one such choice”.
From this hypothetical design-car curve, a set of slightly discontinuous average acceleration rates
were interpolated: 1.48 (3.3), 1.34 (3.0), 1.12 (2.5), 0.895 (2.0) and 0.671 (1.5) mps2 (mph/sec)
for speeds of 0 0-32.2 (0-20), 32.2-48.3 (20-30), 48.3-64.4 (30-40), 64.4-80.5 (40-50), and 80.5-
96.6 (50-60) kph (mph), respectively. These rates were then applied to develop part of a chart

Long 23
similar to Blue Book Figure VII-18.
Apparently the NY DOT applied these rates to expand the chart into Figure II-16 in the
1990 Green Book. Again, as in the original AASHO formulation, vehicle maximum acceleration
capability data dominated the information that was considered. Very little information from
actual traffic behavior was involved, since the curve for the hypothetical design car was simply
drawn between four sets of maximum vehicle acceleration curves and one set of five unpublished
data points based on actual traffic observations from preliminary work in the project presented in
NCHRP Report 111 (reported as having been collected only “for planning project operations”
(15) and possibly did not have rigorous chase-car spacing control). Test-car motorist
accelerations from 1935-37 were included on the plot and were rejected without any justification
beyond simply being declared as too slow for current design uses.
NCHRP Report 270 seems to have offered this conceptualization, based on conjecture
and limited data, as a suggestion for AASHTO to re-examine and update its acceleration
information. As the report title indicated, the subject of NCHRP Report 270 pertained to
parameters affecting stopping sight distance, relating more to deceleration rather than
acceleration. AASHTO apparently instead accepted this mostly hypothetical construct as a
definitive basis for policy revisions. The text of the Green Book states that the revised time-
distance data for the P-vehicle were “developed from studies performed...”, which allows users to
infer a more rigorous observational data foundation than the actual speculative underpinnings.
Figure IX-33 in the 1990 Green Book is exactly the same as Figure IX-21 in the 1984
edition for SU and WB-50 vehicles. For P vehicles, the curve for normal acceleration was
discarded, and the design accelerations for the curve for passenger vehicles stopped to cross a

Long 24
major roadway, based on faster than normal accelerations, were increased, thereby reducing
acceleration times. This revision was likely made in response to the changes made in Figures II-
16 and IX-34 to increase accelerations. With changes to the P curve and no changes to the SU
and WB-50 curves, the relationship between the acceleration times became approximate at about
140% and 170% of the P values, respectively, instead of the 135% and 160% as previously
hypothesized.
Although the acceleration rates for P vehicles were increased in Figure IX-33, thereby
reducing the acceleration times, they were not increased quite enough to be consistent with
accelerations used in Figures II-16 and IX-34. A linearly-decreasing model with α = 1.65 (5.4)
and β = 0.044 coincides with the P curve in Figure IX-33, but a model with α = 1.71 (5.6) and β
= 0.043 coincides with the others. It is unclear how these changes relate to the philosophy of the
1965 Blue Book that passenger car accelerations are 10% faster than normal when crossing major
roadways from rest.
A new chart for acceleration time and speed for passenger cars starting from rest under
normal acceleration rates on level grades was provided as Figure IX-34A. The data conform to a
linearly-decreasing acceleration model as described above for Figures II-16 and IX-34. A new
table, Table IX-7, was also added with final speeds and acceleration distances and times for
normal acceleration of passenger cars on level grades. These values generally conform with the
model although there are some differences apparently due to rounding.
The 1994 Green Book represents a shift to metric units. No new figures or tables
pertaining to acceleration were introduced. Close scrutiny reveals that the translation of some
curves is only approximate. The accelerations for the WB-15 vehicle in Figure IX-33 differ in
Long 25
1994 from the WB-50 vehicle in the same figure in 1990. However, the text still declares that
the accelerating time is intended to be 170% of the P-vehicle, so the discrepancy is likely
unintended. This implies that the design accelerations for the SU and WB-15 vehicles in the
1994 Green Book were probably intended to be the same as in all previous editions, as originally
hypothesized based on the maximum accelerations of 1935-37 passenger cars and speculations
about trucks drawn from unpublished data. Of course, the trucks from that era were somewhat
different than the 36,329 kg (80,000 lb) variety operating on roadways in 1994. Other caveats in
the 1994 version were presented at the beginning of this paper.
RECOMMENDED DESIGN PARAMETERS
In designing for motorists accelerating to the design speed or to some desired speed at the
end of acceleration, vdes, a linearly-decreasing acceleration model is recommended where
β = (α ± Gg) / vdes (9)
v = vdes - (vdes - v0) e-βt (10)
d = vdes t - (vdes - v0)(1 - e-βt) / β (11)
t = d / vdes + (v - v0) / (α ± Gg) (12)
Consequently, only parameter values for α are needed, based on the design vehicle type. When
starting from rest, the initial speed, v0, will be 0. On level terrain, the grade, G, will be 0 (it
might also need to be set to 0 if further research indicates that motorists do not begin to
accelerate faster on downgrades or more slowly on upgrades). The values for β which follow are
offered simply as averages extracted from observations, for comparison with results from
different sources, which may or may not apply to a specific situation.
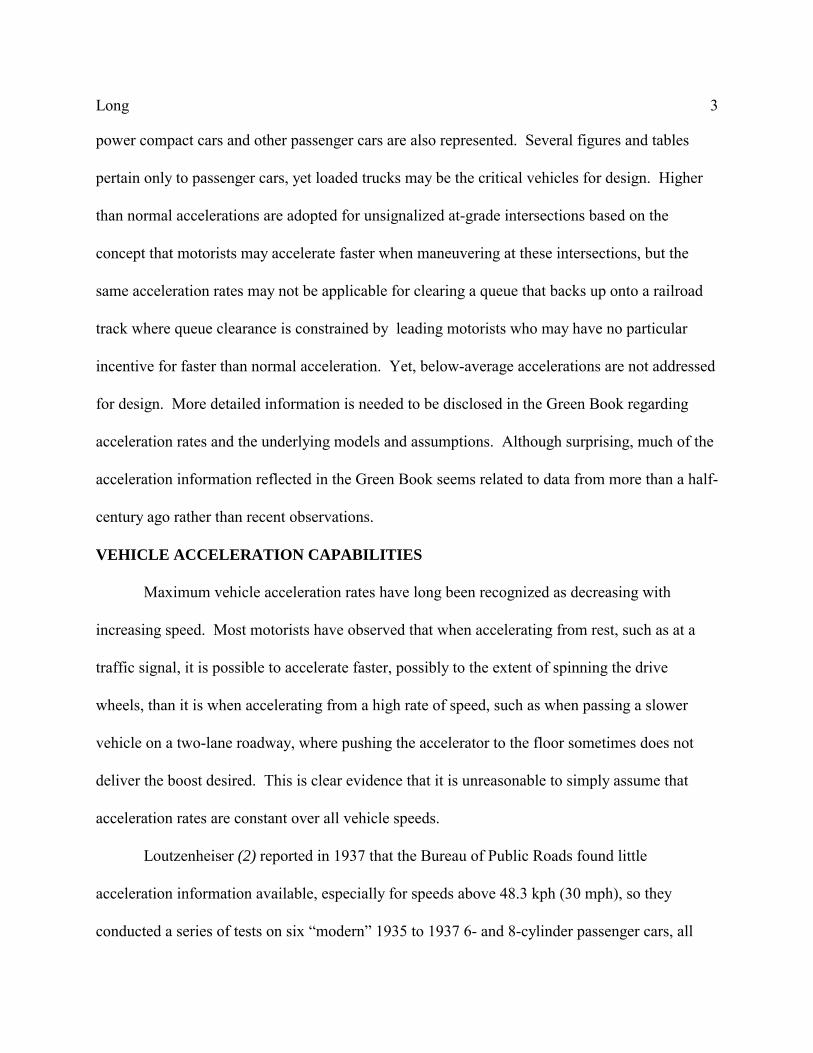
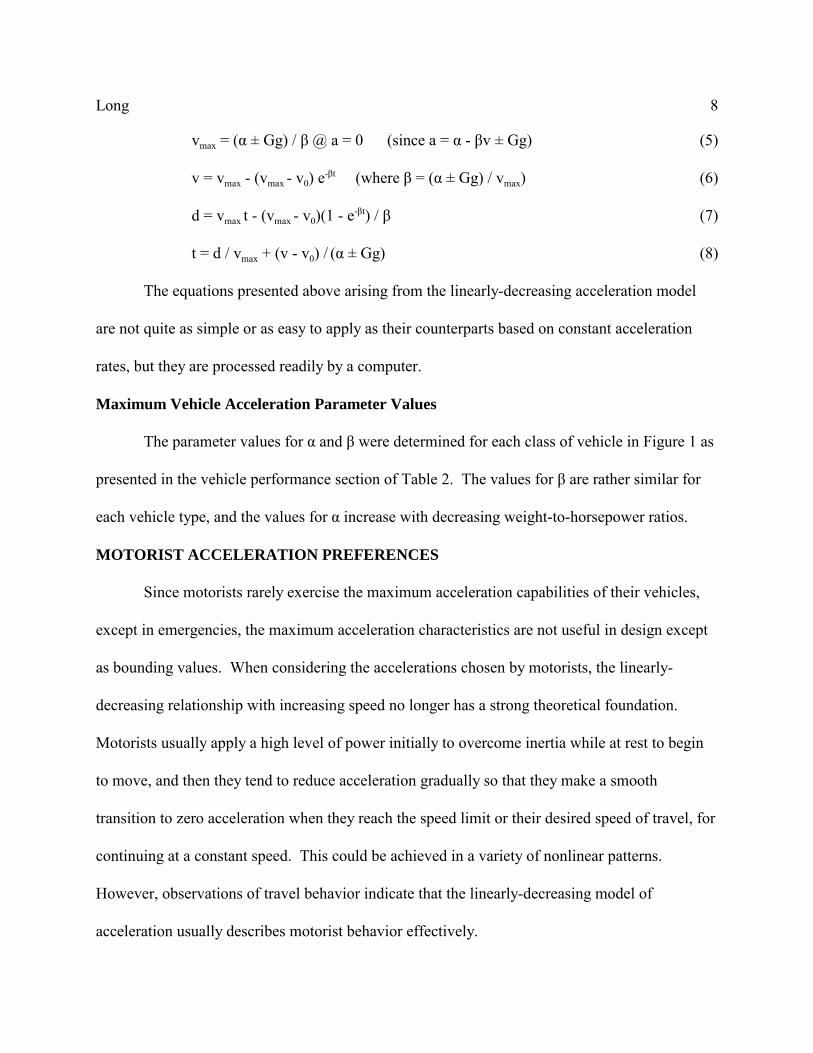
For average accelerations of passenger cars, an acceleration model with α = 2.0 (6.6) and
Long 26
β = 0.12 seems consistent with most observations of average motorist behavior. For design, an
acceleration model with α = 2.2 (7.2) and β = 0.11 corresponds to passenger cars operated by
drivers at accelerations 10% above average, and α = 1.8 (6.0) and β = 0.13 corresponds to
passenger cars operated at accelerations 10% below average. For average SU drivers, parameters
of α = 1.5 (5.0) and β = 0.13 are recommended. For WB-15 trucks, the recommended parameters
are α = 0.37 (1.2) and β = 0.02 for average driver acceleration behavior, and α = 0.15 (0.5) and β
= 0.01 for including the accelerations of most loaded trucks. These parameters are summarized
in Table 2 under the section containing recommendations for design. These values differ
substantially from the Green Book. The starting acceleration for SU trucks is almost double, P
vehicles are 22% higher, but the WB-15 is cut almost in half for average drivers, and cut in half
again to accommodate most drivers. The acceleration distances and times resulting from these
values are shown in Figure 3 in the format of the Green Book.
The recommended parameter values for normal passenger car operations yield an average
acceleration of 1.44 mps2 (4.72 fps2) over a speed range from 0 to 40.3 kph (25 mph), which is
slightly less than the average of 1.5 (4.9 fps2) found in NCHRP Report 383 (13). However, the
measurement traps in NCHRP 383 were 61 to 122 meters (200 to 400 feet) long, and an average
vehicle would accelerate from 0 to 40.3 kph in less than 61 meters, so it is not clear how to
compare such results.
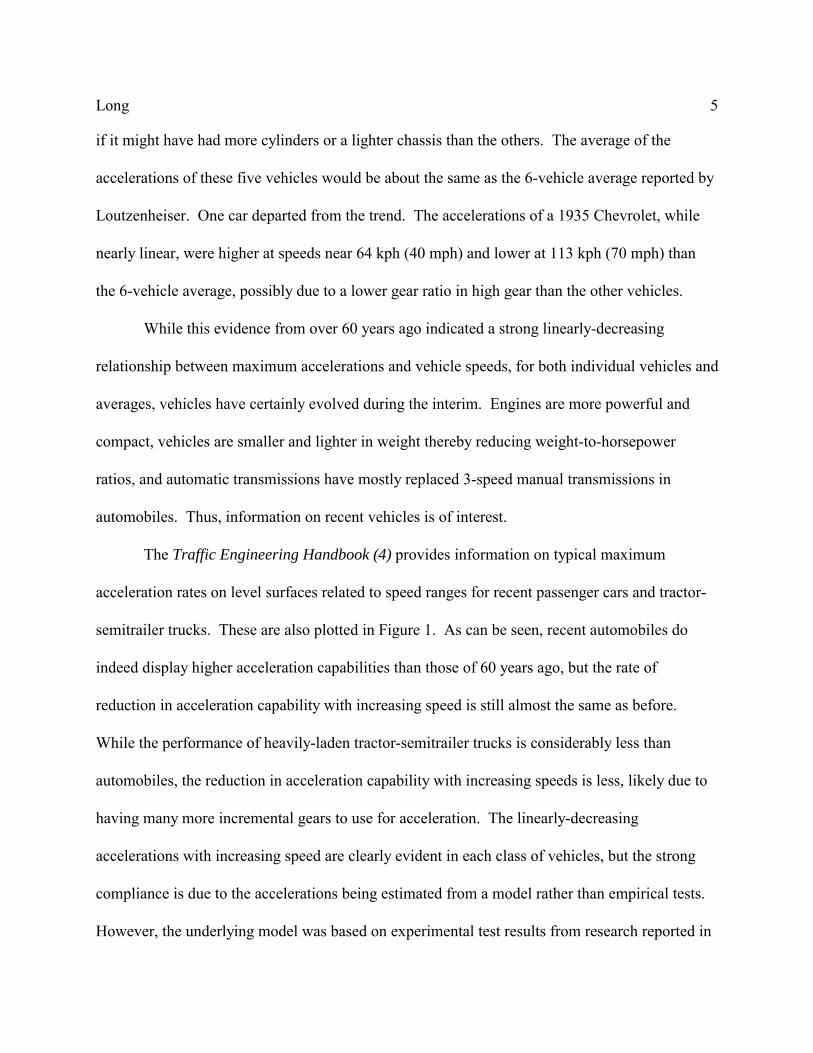
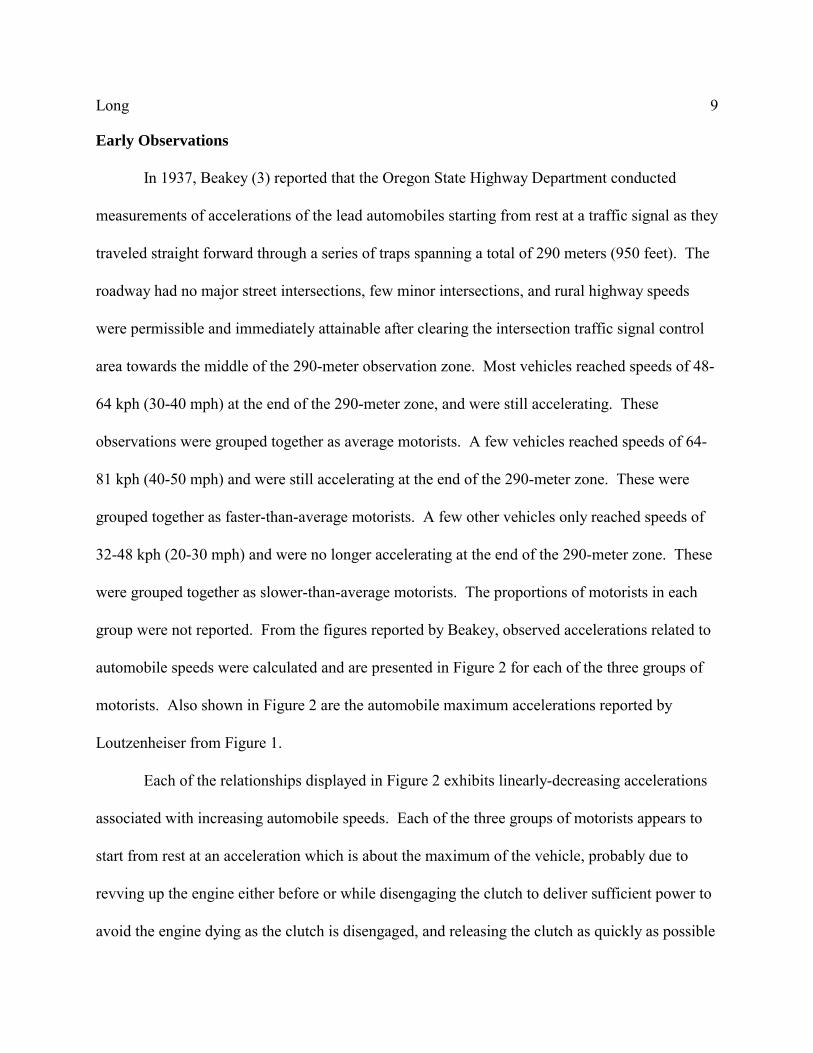
The recommended parameter values for average tractor-trailer truck operations are
slightly slower than the maximum vehicle performance capabilities shown in Table 2, accounting
for truckers who do not always operate their rigs at their maximum capabilities, even though they
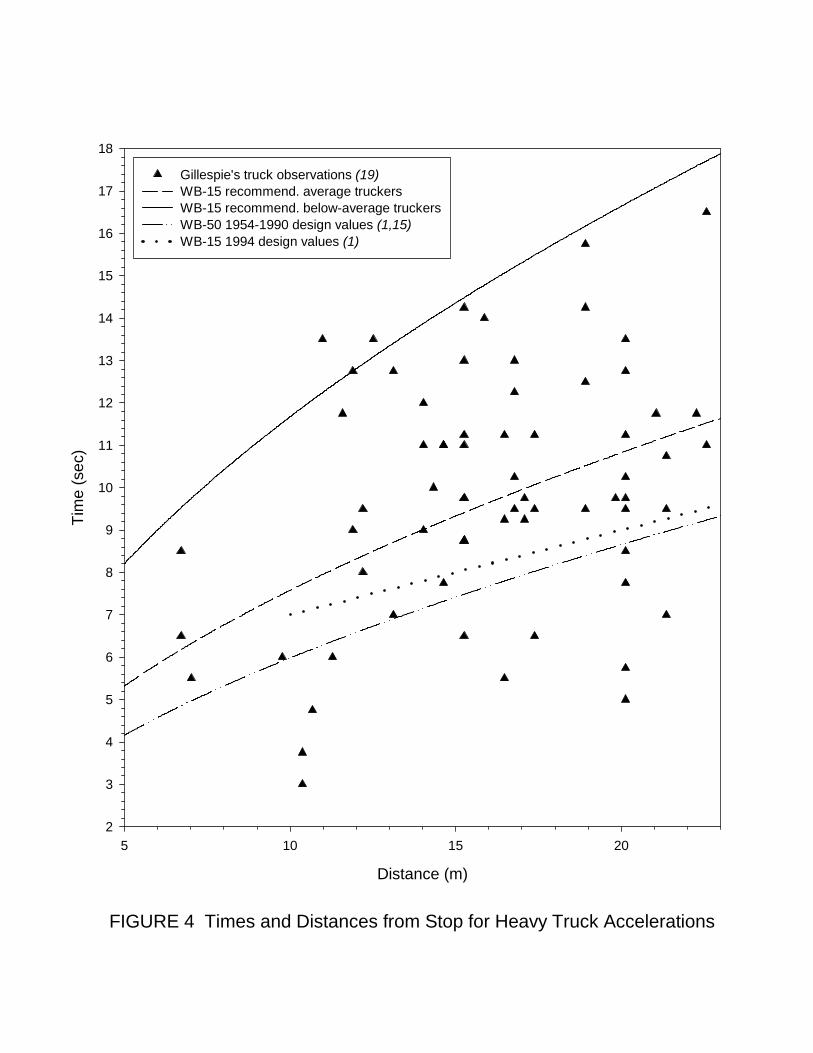
are diesel-powered. Using these parameters, as shown in Figure 4, approximately half of the

Long 27
measurements of tractor-trailer truck acceleration times and distances collected at three locations
on level terrain in Michigan (19) are faster, and the other half are slower, suggesting that these
parameters are reasonable indicators of average behavior. For average acceleration of tractor-
trailer trucks to 9.7 kph (6 mph) in first gear, the recommended model indicates an acceleration
distance of 7.44 meters (24.4 feet) in 6.5 seconds rather than 8.1 meters (26.4 feet) in 6 seconds
as indicated in the Green Book for railroad grade crossings.
The parameter values recommended for the purpose of encompassing the operations of
most loaded tractor-trailer trucks (as opposed to the average acceleration which would account
only for about half of the trucks) yield acceleration estimates that closely match most of the
slower accelerations observed in the Michigan data, and are exceeded by only a couple of
observations. It is suggested that these parameters are suitable for design use since they closely
fit observations of actual acceleration behavior without too many exceedences, as shown in
Figure 4. For loaded trucks accelerating to 9.7 kph in first gear, the recommended model
indicates an acceleration distance of 18.3 meters (60 feet) in 16 seconds to accommodate most
trucks, for an average acceleration of 0.143 mps2 (0.47 fps2), which is 0.307 mps2 (1.0 fps2)
slower than assumed in the Green Book for railroad crossings. It might be true that even the
slowest truck drivers might try to accelerate more quickly over railroad crossings than at other
locations, due to the added perils at railroad crossings. However, grades and rough crossings
may deter faster accelerations. Furthermore, when queued at a traffic signal beyond and clear of
a crossing, they may not perceive a reason to accelerate more rapidly after the signal turns green
in order to allow trailing vehicles to move forward quickly when a train is approaching.
A linear relationship also seems to exist between speed and motorist decelerations.
Long 28
Beakey’s data (3) show strong linear relationships with α = 3.23 (10.6) and β = 0.165 for average
motorists. Motorists traveling at higher speeds tended to end decelerations at higher rates. A
linear model with α = 3.0 (9.8) and β = 0.133 was fitted (R2 = 0.97) to the average decelerations
of motorists observed stopping in NCHRP 154 (20). These relationships correspond to motorists
slowly increasing the pressure applied to their brake pedals, and thus gradually increasing their
decelerations as their speeds decrease, until easing off the brake when nearly stopped perhaps to
reposition their vehicles (if they actually come to a full stop), or to avoid a jerk at the end
(deviating slightly from linearly-increasing deceleration for the final few feet).
CONCLUSIONS AND RECOMMENDATIONS
The linearly-decreasing model of acceleration related to speed of travel performs
successfully for both maximum vehicle acceleration and normal motorist-chosen acceleration
(and deceleration) for both passenger cars and trucks. Although the corresponding equations are
a little complicated, the accuracy and consistency resulting from using this model offer
significant advantages over trying to apply different constant acceleration rates over various
ranges of travel speeds. It is not acceleration that is constant during speed changes, but the rate
of change in acceleration.
While the linear-acceleration model tends to display excellent data fits, there are
relatively few data points in the available data that were collected for very slow speeds
immediately after vehicle start-up. The extrapolation of the linear-acceleration model in the
range of very slow speeds at start-up may not be completely accurate, but it probably does not
make any practical difference because travel distances at speeds near zero are negligibly short.
Although the variable in the model for initial velocity can easily be set to values other than zero

Long 29
when not starting from rest, there is no data to indicate that this model adequately describes the
start of acceleration for vehicles already in motion.
While grades affect the maximum accelerations of vehicles and constant grades can be
easily accounted for in the linearly-decreasing acceleration model, the available data do not
reveal if grades affect the starting accelerations chosen by motorists in normal traffic flow.
Studies published in the literature over the past 60 years pertaining to the observed
acceleration characteristics of motorists in actual traffic streams have presented remarkably
consistent data obtained by different techniques and in different countries at different times.
These data sources provide a rich repository of thousands of acceleration observations and can be
used as a basis to establish acceleration characteristics for use in design. Adopted design values,
however, seem to have been based mostly on the maximum acceleration performance of vehicles
in conjunction with conjecture about how much of this capability is normally utilized by drivers.
Design values appear to underestimate actual accelerations at slow speeds and overestimate
actual accelerations at higher speeds. Improvements in safety might be achieved by revising
design values to comply better with observed motorist behavior.
Vehicle maximum accelerations, as shown in Figure 1, exhibit different characteristics
than the accelerations actually chosen by motorists in normal traffic steams, a sample of which
are shown in Figure 2. Motorists start accelerating using a large portion of the maximum
acceleration capability of their vehicles, but then reduce acceleration at a much higher rate than
the attenuation in vehicular capabilities. Consequently, forecasts of expected motorist
accelerations based on future changes expected in vehicle performance capabilities may not
reflect actual motorist behavior very reliably.
Long 30
Attention needs to be directed to accommodating more than just the average motorist in a
vehicle class. While existing design acceleration values in the Green Book might attempt do
this, it is not clear if or how it is accomplished. It would be valuable to designate the 85th or 95th
percentiles in data presentations, as well as in design, in addition to the average values.
“Normal” acceleration in most research seems to pertain to through vehicles, frequently
queue leaders, starting from rest at signalized intersections. Some accelerations that are faster
than normal should be expected when traffic merges into or travels through tight gaps at stop-
controlled intersections, as assumed in AASHTO design values. However, there is not much
suitable data to establish this. Furthermore, little appropriate data were found, for example, to
establish an acceleration profile for 85th-percentile left-turning and right-turning vehicles when
merging into or through tight gaps on a cross street. Some data show slightly faster accelerations
by through-traffic in middle lanes than in outside lanes under normal conditions, so accelerations
during turns might be expected to differ, too. Some data showed initial accelerations for left-
turning passenger cars under normal conditions being the same as for through passenger cars, but
with accelerations reduced more profoundly thereafter in the turn. Right turns under normal
conditions might be expected to exhibit even lower accelerations due to shorter turning radii.
While values for α show remarkable consistency in normal accelerations at various sites
for both left-turns and through movements, the values for β display some variation, likely due to
different target speeds at the end of acceleration or different turning radii affecting occupant
comfort. This makes it difficult to establish a design value for β that would likely be universally
applicable (although one curve for all situations seems to be presumed in the Green Book). For
designing for motorists accelerating on level pavement from rest to the design speed of a
Long 31
roadway, it is recommended that β = α / vdesign. This simplifies acceleration rates to require only
one parameter, α, to be used along with the design speed, vdesign. It implies a different treatment
than the one chart for all design speeds in the Green Book.
Rather than present tables and figures in the Green Book which tend to conceal the
acceleration rates used, it would be valuable to disclose the acceleration rates and assumptions so
they can be modified when needed by the user as appropriate for different types of applications.
The acceleration standards presented in the 1994 Green Book are still based to a large
extent on rather old and rather limited research data, and a lot of conjecture. While each edition
of the Blue Book and Green Book dealt with this limitation by asserting that “due to rapid
changes being made in vehicle operating characteristics, current data on acceleration and
deceleration may soon be outdated”, this disclaimer seems to be misguided since chronological
data suggest that the acceleration rates chosen by drivers have been remarkably consistent over
time, and relatively unaffected by improved vehicle performance capabilities.
Rather than selecting acceleration values for situations involving only normal or above-
normal accelerations, values are also needed in design for below-normal accelerations. For
traffic signal preemption near a railroad crossing, for example, it would be appropriate to select
below-normal accelerations for setting preemption timings to clear a queue that might be backed
up onto the track, because the lead vehicles may proceed leisurely being unaware of any
urgencies arising behind them. Since the Green Book is the most widely accepted source for
design information, it would be appropriate to provide more complete information needed in
additional design applications.
Using the linearly-decreasing acceleration model, as recommended, the equations for
Long 32
time, distance and speed become more complicated, but accelerations may be characterized by a
single parameter, α, which seems to be remarkably stable by vehicle type and over time. Design
acceleration would be clarified and simplified. Additional field studies are still needed to
develop improved values for the average and percentile values of motorist accelerations with
different vehicles under various design conditions.

Long 33
1. A Policy on Geometric Design of Highways and Streets. AASHTO, Washington, DC, 1984,1990, 1994
2. Loutzenheiser, Donald W. Speed-Change Rates of Passenger Vehicles. Proceedings of the18th Annual Meeting, Part I, Highway Research Board, Washington, DC, 1938, pp. 90-99.
3. Beakey, John. Acceleration and Deceleration Characteristics of Private Passenger Vehicles. Proceedings of the 18th Annual Meeting, Part I, Highway Research Board, Washington,DC, 1938, pp. 81-89.
4. Traffic Engineering Handbook, 4th ed. Institute of Transportation Engineers, Washington,DC, 1992.
5. St. John, A.D. and D.R. Kobett. Grade Effects on Traffic Flow Stability and Capacity. NCHRP Report 185, Transportation Research Board, Washington, DC, 1978.
6. Drew, Donald R., Traffic Flow Theory and Control. McGraw-Hill, Inc., New York, NY,1968.
7. Glauz, W.D. et al. Projected Vehicle Characteristics Through 1995. TransportationResearch Record 772. Transportation Research Board, Washington, DC, 1981.
8. Bellis, W. R. Capacity of Traffic Signals and Traffic Signal Timing. Highway ResearchBoard Bulletin 271, Highway Research Board, Washington, DC, 1960, pp. 45-67.
9. Dockerty, A. Accelerations of Queue Leaders from Stop Lines. Traffic Engineering andControl, Vol. 8, No. 3, England, July 1966, pp. 150-155.
10. Evans, L. and R.W. Rothery. Influence of Vehicle Size and Performance on IntersectionSaturation Flow. Proceedings, 8th International Symposium on Transportation andTraffic Theory. University of Toronto Press, Toronto, Ontario, Canada, 1981, pp. 193-222.
11. Bonneson, James A. Modeling Queued Driver Behavior at Signalized Junctions. Transportation Research Record 1365. Transportation Research Board, Washington,DC, 1992, pp. 99-107.
12. Bonneson, James A. Operational Characteristics of the Single-Point Urban Interchange. Ph.D. dissertation. Texas A&M University, College Station, TX, 1990.
13. Harwood, Douglas W., John M. Mason, Robert E. Brydia, Martin T. Pietrucha and Gary L.Gittings. Intersection Sight Distance. NCHRP Report 383. Transportation Research
REFERENCES

Long 34
Board, Washington, DC, 1996.
14. Akcelik, R. and D. C. Biggs. Acceleration Profile Models for Vehicles in Road Traffic. Transportation Science, Vol. 21, No. 1. Operations Research Society of America,February 1987, pp. 36-54.
15. A Policy on Geometric Design of Rural Highways. AASHO, Washington, DC, 1954, 1965.
16. A Policy on Design of Urban Highways and Arterial Streets. AASHTO, Washington, DC,1957, 1973 (1957 version entitled A Policy on Arterial Highways in Urban Areas).
17. Olson, P.L., D.E. Cleveland, P.S. Fancher, L.P. Kostyniuk and L. W. Schneider. ParametersAffecting Stopping Sight Distance. NCHRP Report 270. Transportation Research Board,Washington, DC, June 1984.
18. Transportation and Traffic Engineering Handbook, 2nd ed. Prentice-Hall, Inc., EnglewoodCliffs, NJ, 1982.
19. Gillespie, Thomas D. Start-Up Accelerations of Heavy Trucks on Grades. TransportationResearch Record 1052. Transportation Research Board, Washington, DC, 1986.
20. Farber, E., M. S. Janoff, S. Cristinzio, J. G. Blubaugh, W. Reisener and W. Dunning. Determining Pavement Skid Resistence Requirements at Intersections and Braking Sites. NCHRP Report 154. Transportation Research Board, Washington, DC, 1974.

Long 35
List of Tables
TABLE 1 Evolution of Design Accelerations
TABLE 2 Acceleration Parameters
Long 36
TABLE 1 Evolution of Design Accelerations
Source Acceleration Acceleration Acceleration Truck Acc. Acceleration Adjustments Acceleration AccelerationRatesa Distances (a) Distances (b) Distances Times for Grades Time-Speed Time-Space
54 Blue Book Figure VII-19 Figure VII-20 Figure VIII-4 (no table no.)p. 493 p. 494 p. 507 p. 319
65 Blue Book Figure VII-17 Figure VII-18 Figure VIII-4 (no table no.)p. 355 p. 356 p. 397 p. 401
84 Green Book Figure II-12 Figure IX-22b Figure IX-22 Figure IX-21b Table IX-8p. 36 p. 784 p. 784 p. 783 p. 796
90 Green Book Figure II-16 Figure IX-34 Figure IX-34 Figure IX-33c Table IX-8 Figure IX-34a Table IX-7p. 40 p. 749 p. 749 p. 748 p. 765 p. 750 p. 764
94 Green Book Figure II-16 Figure IX-34 Figure IX-34 Figure IX-33d Table IX-9 Figure IX-35 Table IX-8p. 40 p. 706 p. 706 p. 705 p. 721 p. 707 p. 719
a Basic information in exhibits grouped within boxes appears to be unchanged among editions.b Data domain expanded beyond prior versions.c SU and WB-50 vehicle accelerations unchanged in 1990 from 1984.d P and SU vehicle accelerations unchanged, but 1994 WB-15 differs from WB-50 in 1990.

Long 37
TABLE 2 Acceleration Parameters
Description Type αa β Information SourceDerived from Vehicle Performance Tests
P @ 25 lb/hp Veh. Max. 2.94 (9.65) 0.0503 TE Handbook, 1992 (4)P @ 30 lb/hp Veh. Max. 2.49 (8.15) 0.0452 TE Handbook, 1992 (4)P @ 35 lb/hp Veh. Max. 2.16 (7.09) 0.0409 TE Handbook, 1992 (4)1935-1937 automobiles Veh. Max. 1.74 (5.72) 0.0451 Loutzenheiser, 1937 (2)WB-15 @ 100 lb/hp Veh. Max. 0.89 (2.93) 0.0286 TE Handbook, 1992 (4)WB-15 @ 200 lb/hp Veh. Max. 0.58 (1.90) 0.0199 TE Handbook, 1992 (4)WB-15 @ 300 lb/hp Veh. Max. 0.48 (1.56) 0.0180 TE Handbook, 1992 (4)WB-15 @ 400 lb/hp Veh. Max. 0.45 (1.47) 0.0200 TE Handbook, 1992 (4)70 Chevrolet sedan Veh. Max. 3.36 (11.0) 0.0803 NCHRP 185, 1978 (5)71 Chevrolet ¾-ton truck Veh. Max. 5.19 (17.0) 0.1478 NCHRP 185, 1978 (5)75-95 RVs (slowest 10%)) Veh. Max. 2.5 (8.2) 0.104 Glauz, 1981 (7)P @ 40 lb/hp (slowest 10%) Veh. Max. 2.85 (9.36) 0.0853 Glauz, 1981 (7)
Derived from Traffic ObservationsFaster motorists Motorists 1.82 (5.96) 0.0798 Beakey, 1937 (3)Average motorists Motorists 1.74 (5.72) 0.0995 Beakey, 1937 (3)Slower motorists Motorists 1.78 (5.82) 0.1344 Beakey, 1937 (3)Inner-lane cars Motorists 2.27 (7.45) 0.1487 Dockerty, 1966 (9)Outer-lane cars Motorists 1.88 (6.17) 0.1201 Dockerty, 1966 (9)Thru passenger cars, max. Motorists 2.02 (6.63) 0.1184 Bonneson, 1992 (11)Thru passenger cars, min. Motorists 2.02 (6.63) 0.1326 Bonneson, 1992 (11)Left passenger cars, max. Motorists 2.02 (6.63) 0.1339 Bonneson, 1990 (12)Left passenger cars, min. Motorists 2.02 (6.63) 0.3157 Bonneson, 1990 (12)Trucks Motorists 1.67 (5.47) 0.1229 Bellis, 1960 (8)Trucks Motorists 1.49 (4.87) 0.1455 Dockerty, 1966 (9)Tractor-trailer trucks Motorists 0.15 (0.5) 0.01 Gillespie, 1986 (19)
Derived from Established Design ValuesP (max. veh. accel.) Design 1.75 (5.75) 0.045 Blue Book, 1954 Fig. VIII-4 (15)P (design accel.) Design 1.43 (4.70) 0.045 Blue Book, 1954 Fig. VIII-4 (15)P (normal accel.) Design 1.29 (4.23) 0.045 Blue Book, 1954 Fig. VIII-4 (15)Acceleration lanes Design 1.15 (3.78) 0.0368 Blue Book, 1954 Fig. VII-20 (15)SU Design 0.84 (2.77) 0.055 Blue Book, 1954 Fig. VIII-4 (15)C-50 Design 0.62 (2.04) 0.055 Blue Book, 1954 Fig. VIII-4 (15)P (design accel. dist.) Design 1.71 (5.6) 0.043 Green Book, 1990 Fig. II-16 (1)P (design accel. time) Design 1.65 (5.4) 0.044 Green Book, 1990 Fig. IX-33 (1)
Recommended for DesignP motorists (above ave.) Design 2.2 (7.2) 0.11P motorists (ave. thru) Design 2.0 (6.6) 0.12P motorists (below ave.) Design 1.8 (6.0) 0.13P motorists (ave. left) Design 2.0 (6.6) 0.22SU motorists (ave.) Design 1.5 (5.0) 0.13WB-15 motorists (ave.) Design 0.37 (1.2) 0.02WB-15 motorists (below ave.) Design 0.15 (0.5) 0.01
Decelerations from Traffic ObservationsAverage motorists Motorists 3.23 (10.6) 0.165 Beakey, 1937 (3)Average motorists Motorists 3.0 (9.8) 0.133 NCHRP 154, 1974 (20)
a Parameters α and β are associated with accelerations in units of meters per second per second (feet per second persecond) and speeds in meters per second (feet per second).

Long 38
List of Figures
FIGURE 1 Vehicle Maximum Accelerations
FIGURE 2 Observed 1935-37 Traffic Accelerations
FIGURE 3 Times and Distances from Stop for Recommended Design Accelerations
FIGURE 4 Times and Distances from Stop for Heavy Truck Accelerations

Speed (mps)
0 5 10 15 20 25 30
Acce
lera
tion
(mps
2 )
0.0
0.2
0.4
0.6
0.8
1.0
1.2
1.4
1.6
1.8
2.0
2.2
2.4
2.6
2.8
3.0
P @ 65.8 w/kg (25 lb/hp) P @ 54.8 w/kg (30 lb/hp) P @ 47.0 w/kg (35 lb/hp) 1935-37 autosWB-15 @ 16.4 w/kg (100 lb/hp) WB-15 @ 8.2 w/kg (200 lb/hp) WB-15 @ 5.5 w/kg (300 lb/hp) WB-15 @ 4.1 w/kg (400 lb/hp) Regression lines
FIGURE 1 Vehicle Maximum Accelerations

FIGURE 2 Observed 1935-37 Traffic Accelerations
Speed (mps)
0 5 10 15 20 25 30
Acce
lera
tion
(mps
2 )
0.0
0.1
0.2
0.3
0.4
0.5
0.6
0.7
0.8
0.9
1.0
1.1
1.2
1.3
1.4
1.5
1.6
1.7
1.8
1.9
2.0
Automobile maximum (Loutzenheiser) Faster-than-average motorists (Beakey) Average motorists (Beakey) Slower-than-average motorists (Beakey) Regression lines60% of automobile maximum (AASHO)
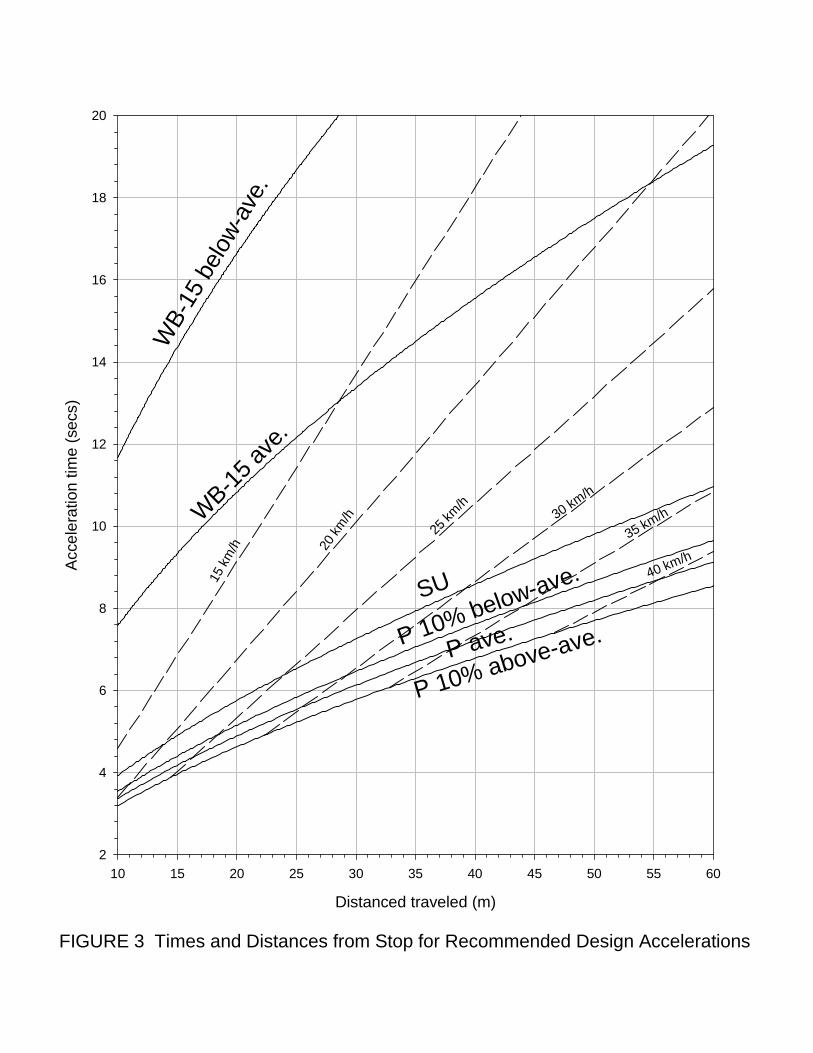
FIGURE 3 Times and Distances from Stop for Recommended Design Accelerations
Distanced traveled (m)
10 15 20 25 30 35 40 45 50 55 60
Acce
lera
tion
time
(sec
s)
2
4
6
8
10
12
14
16
18
20
WB-
15 b
elow-
ave.
WB-15 av
e.
P 10% above-ave.P 10% below-ave.
P ave.
SU15 k
m/h 20
km/h
25 km
/h30 km/h
35 km/h
40 km/h
Distance (m)
5 10 15 20
Tim
e (s
ec)
2
3
4
5
6
7
8
9
10
11
12
13
14
15
16
17
18
Gillespie's truck observations (19)WB-15 recommend. average truckersWB-15 recommend. below-average truckersWB-50 1954-1990 design values (1,15)WB-15 1994 design values (1)
FIGURE 4 Times and Distances from Stop for Heavy Truck Accelerations