Embed Size (px)
Citation preview
1
T.Y.B.Com. Paper – III
BUSINESS ECONOMICS
SECTION - I
Module 1 : Commercial Banking
(A) Commercial Banking : Assets and Liabilities of CommercialBanks - Trade-off Between Liquidity and Profitability.
(B) Banking Sector Reforms : Measures, Performance withRespect to Public, New Private and Foreign Banks in the PostReforms Period - New Technology in Banking in India.
Module 2 : Central Banking
Changing Trends in Monetary Policy in India - RBI’s Short TermLiquidity Management - Role and Performance of Micro Finance,Self Help Groups and Composite Credit.
Module 3 : Financial Markets
(A) Money Markets : Components and Features of Indian MoneyMarket - Money Market Reforms in India.
(B) Capital Markets : Significance in Economic Development -Capital Market Reforms - Role of SEBI - Role and Importanceof Mutual Funds, Equity Market, Forward, Future andCommodity Market.
SECTION - II
Module 4 : Public Finance
Changing Trends in Tax and Non-Tax in India - Public Expenditure:Classification of Public Expenditure, Causes for Increase in PublicExpenditure in India - Public Debt : Meaning and Classification -Burden of Internal and External Debt - Concepts of Deficits :Revenue, Budgetary, Fiscal and Primary Deficits - FRBM Act.
Module 5 : International Trade and WTO
Gains from International Trade - Balance of Trade and Payments -Causes of Disequilibrium in BOP - Measures to CorrectDisequilibrium in BOP - Emerging Trends in India’s BOP PositionSince 1991 - WTO : Functions and Agreements with Reference toTRIPS, TRIMS and GATS.
2
Module 6 : Exchange Rate Determination
Exchange Rate Determination - Purchasing Power Parity Theory -Foreign Exchange Market - Functions and Dealers - Spot andForward Exchange Rates - RBI’s Intervention and ForeignExchange Rate Management.
Pattern of Question Paper
Marks : 100 Time : 3 Hours
Note :
1. Attempt any Five questions by selecting Minimum TwoQuestions from each section.
2. Figures to the right indicate full marks.
SECTION - I
Q.1 (A) (10)
(B) (10)
Q.2 “ “. - Explain (20)
Q.3 Explain the following :
(A) (10)
(B) (10)
Q.4 Write explanatory notes (any two) : (10 + 10 = 20)
(A)
(B)
(C)
(D)
SECTION - II
Q.5 (A) (10)
(B) (10)
Q.6 Explain the following :
(A) (10)
(B) (10)

3
Q.7 “ “. - Explain (20)
Q.8 Write explanatory notes (any two) : (10 + 10 = 20)
(A)
(B)
(C)
(D)
4
1
Module 1(A) COMMERCIAL BANKING
Unit Structure :
1.0 Objectives
1.1 Introduction
1.2 Types of Banks
1.3 Functions of Commercial Banks
1.3.1 Primary Functions
1.3.2 Secondary Functions or Non-Banking Functions
1.3.3 Subsidiary Activities of Commercial Banks
1.4 Assets and liabilities of commercial banks
1.5 Trade off between profitability and liquidity
1.5.1 Motives of investment policy
1.5.2 Trade-off between Liquidity and Profitability
1.5.3 Reconciling Twin objectives
1.5.4 Factors affecting liquidity
1.5.5 Factors affecting profitability
1.6 Questions
1.0 OBJECTIVES
To understand the concept and working of commercial banks.
To understand the functioning of commercial banks in terms oftheir objectives and to see their exercise in balancing theirliquidity and profitability objectives.
To understand the progress of commercial banks in India since1991.
1.1 INTRODUCTION
A bank is a financial institution, which deals with the depositsand advances and other related services. It receives money fromthose who want to save it in the form of deposits and it lendsmoney to those who need it.
5
Definition: The Banking Companies Act, 1949 defines a bankingcompany as “a company which transacts the business of banking inany state of India, and the word banking has been defined asaccepting for the purpose of lending or investment of deposits ofmoney from the public repayable on demand or otherwise, andwithdrawable by Cheque, draft, order or otherwise.”
1.2 TYPES OF BANKS
Types of Banks: We can classify the banks as follows:
1) Central Bank: Central Bank is an apex institution whichsupervises, controls and regulates the activities of commercialbanks and money supply in the country. It is generally underGovernment ownership and controls and implements economicpolicy of the Government.
2) Commercial Banks: A commercial bank is an institution whichoffers full banking services to industry, trade and people of acountry. These banks accept deposits from and lend them toborrowers by charging some interest on the amount lent tothem.
3) Industrial Banks: These banks give loans to small-scaleindustries, large-scale industries. They give long term loans toindustry and trade. IDBI, SFC’s (State Finance Corporations),ICICI etc. are industrial banks.
4) Foreign Banks: A number of foreign banks with their headoffices in other countries carry on business in India through theirbranches. These banks deal in transactions involving ForeignExchange. Buying and Selling of Foreign Currency is their mainfunction. Citibank, Standard Chartered Bank etc. are ForeignBanks.
5) Export- Import Bank of India: This bank was established on7th January, 1982 by the Government of India. It solves theproblems faced by Indian Exporters and helps them in theirexport projects.
6) Regional Rural Banks: These are special types of banks whichlook after the special needs of weaker sections of rural areas.They work under the control of commercial banks whichestablish these banks.
7) Co-operative Banks: Co-operative Banks are divided into threecategories as follows: (a) Primary Co-operative Banks: Primary
6
Co-operative Banks are situated in rural areas. They give shortand medium term loans to farmers. (b) Central Co-operativeBanks: These banks refinance the Primary Co-operative Banks.(c) State Co-operative Banks: These banks refinance theCentral Co-operative Banks.
8) Land Development Banks: These banks look after the long-term requirements of farmers for agricultural development.
Check Your Progress:a. What is a commercial bank?b. What are the different types of banks that operate in our
country?
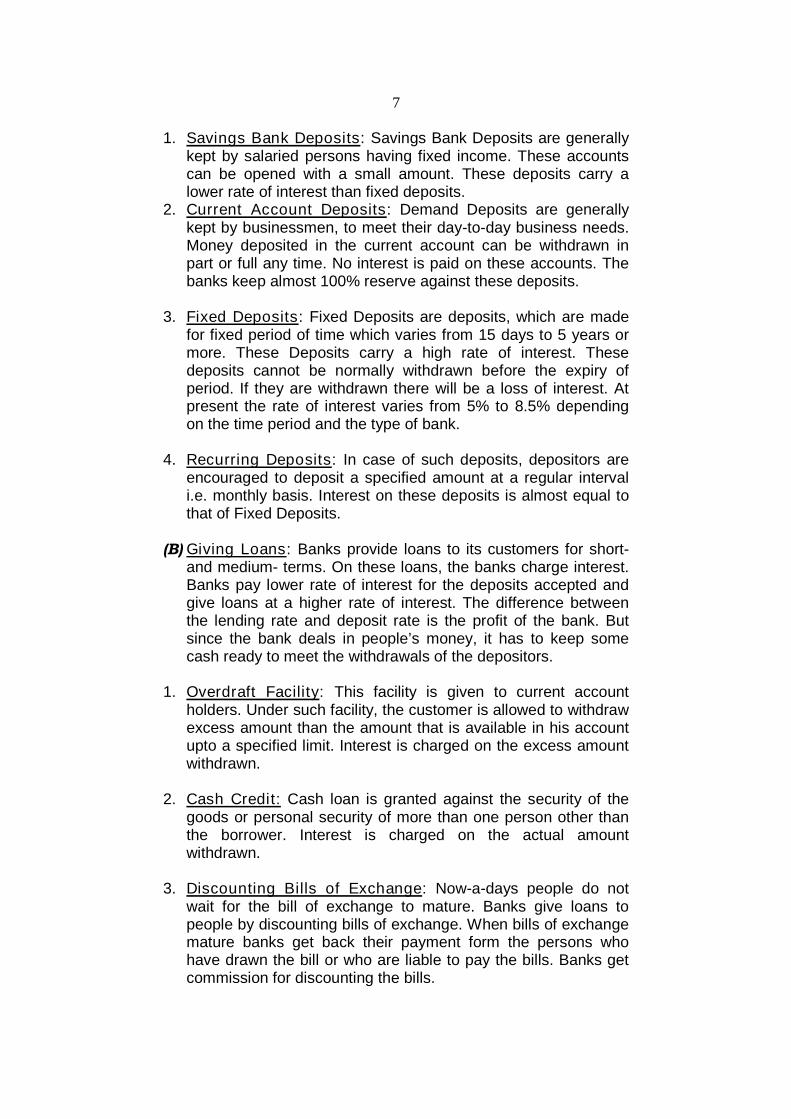
1.3 FUNCTIONS OF COMMERCIAL BANKS
The Functions of Commercial Banks can be discussed as follows:
Functions of Commercial Banks
Primary Functions Secondary Functions
Accepting Giving Development RemittanceDeposits Loans of Cheques of Funds
Agency Functions General Utility Functions
1.3.1 Primary Functions:
(A) Accepting Deposits: A Bank accepts deposits from individuals,firms and institutions. These deposits are the main sources offinance / revenue of a bank. The deposits received by bank canbe as follows:
7
1. Savings Bank Deposits: Savings Bank Deposits are generallykept by salaried persons having fixed income. These accountscan be opened with a small amount. These deposits carry alower rate of interest than fixed deposits.
2. Current Account Deposits: Demand Deposits are generallykept by businessmen, to meet their day-to-day business needs.Money deposited in the current account can be withdrawn inpart or full any time. No interest is paid on these accounts. Thebanks keep almost 100% reserve against these deposits.
3. Fixed Deposits: Fixed Deposits are deposits, which are madefor fixed period of time which varies from 15 days to 5 years ormore. These Deposits carry a high rate of interest. Thesedeposits cannot be normally withdrawn before the expiry ofperiod. If they are withdrawn there will be a loss of interest. Atpresent the rate of interest varies from 5% to 8.5% dependingon the time period and the type of bank.
4. Recurring Deposits: In case of such deposits, depositors areencouraged to deposit a specified amount at a regular intervali.e. monthly basis. Interest on these deposits is almost equal tothat of Fixed Deposits.
(B) Giving Loans: Banks provide loans to its customers for short-and medium- terms. On these loans, the banks charge interest.Banks pay lower rate of interest for the deposits accepted andgive loans at a higher rate of interest. The difference betweenthe lending rate and deposit rate is the profit of the bank. Butsince the bank deals in people’s money, it has to keep somecash ready to meet the withdrawals of the depositors.
1. Overdraft Facility: This facility is given to current accountholders. Under such facility, the customer is allowed to withdrawexcess amount than the amount that is available in his accountupto a specified limit. Interest is charged on the excess amountwithdrawn.
2. Cash Credit: Cash loan is granted against the security of thegoods or personal security of more than one person other thanthe borrower. Interest is charged on the actual amountwithdrawn.
3. Discounting Bills of Exchange: Now-a-days people do notwait for the bill of exchange to mature. Banks give loans topeople by discounting bills of exchange. When bills of exchangemature banks get back their payment form the persons whohave drawn the bill or who are liable to pay the bills. Banks getcommission for discounting the bills.
8
4. Demand Loans or Money-at-call or Short Notice: Theseloans are given by the banks for a very short period and aregenerally backed by some security. These loans have no statedmaturity and are also called as call loans. These loans arenormally given to stock brokers, dealers in stock exchange etc.They are repayable on demand at 24 hours notice or at 7 daysnotice. The entire loan amount is paid in lump sum by creditingit to the loan account of the borrower. The interest is charged onthe entire amount of loan.
5. Fixed-term Loans: Such loans are generally given for a periodof One to Ten years to traders, producers, industrialists etc. Ifthe loan is taken for 5 years or more, rate of interest is higher. Ifloan is taken for 1 or 2 years the rate of interest is low.
6. Participation or Consortium Loans: Sometimes two or morebanks five fixed term loans to the industrialist against a commonsecurity. Such loans are called Consortium or ParticipationLoans.
7. Consumer Credit: These loans are given to householders forthe Purchase of durable consumer goods like washing machine,Television, Air Conditioners, Handy cams, Higher Education,Marriages etc. Such loans are repaid in easy instalments withina given period of time.
8. Credit Creation: Credit Creation is one of the most outstandingfunctions of a modern commercial bank. Hence, it is mostly saidthat banks are manufacturers of credit. Credit is created whenone party (a person, a firm or an institution) lends money toanother party.
(C) Development of Cheques: This is also an important function ofbank in settling debts. It is more suitable to use Cheques thanCash.
1. Bearer Cheque: A bearer Cheque can be encashedimmediately when presented at the bank by the bearer (anyperson presenting the Cheque) of it.
2. Crossed Cheque: A Crossed Cheque is one in which twoparallel lines are drawn at the left hand side corner of theCheque. Such Cheques cannot be encashed immediately buthas to be deposited in the payee’s account in the bank. Theamount gets credited in the account.
(D) Remittance of Funds: Commercial Banks help in remitting(sending) funds from one place to another by issuing bank
9
drafts, mail transfers, telegraphic transfers etc. by chargingsome commission.
Check Your Progress:
a. What do you understand by the primary functions of acommercial bank?
b. State any two primary functions of a commercial bank?
1.3.2 Secondary Functions or Non-Banking Functions:
(A) Agency Services: Commercial Banks provide a number ofservices as an agent of customers. These include:
1. Transfer of Money: This is done by means of Cheques, draftsand telegraphic transfers etc. The bank charges a smallcommission for providing these services.
2. Executing Orders: Standing orders are performed such aspayment of insurance premium, payments of subscription feesof clubs and societies.
3. Collection of Money: Collection of dividend or interest onsecurities on behalf of customers.
4. Purchase & Sale: Commercial banks purchase and sellsecurities on behalf of its cutomers.
5. Trustee: Bank also acts as a trustee or executor of will createdby its customers. This means undertaking the administration ofEstates as Executor or trustee. This includes acquiring andholding and generally dealing with any property right, title orinterest in any such property.
10
(B) General Services: Commercial Banks also performs a numberof general utility services.
1. Safe Deposit Vault: Lockers are provided in various sizes onpayments on a fixed rent. The lockers are situated in a strongroom, generally underground where walls and ceilings arefireproof. The articles kept in the lockers remain in thepossession of the locker-holder and the access to the locker isgiven only after completion of certain formalities.
2. Letters of Credit: Letters of credit are issued by commercialbanks to help traders to buy goods from foreign countries oncredit. It is a document or an order issued by a bank in oneplace, authorising some other bank in some other place (foreigncountry) to honour the drafts or cheques of the person named inthe document. The payment is limited to the amount shown inthe letter and the amount is chargeable to the issuer of the letterof credit.
3. Traveler’s Cheque: The travelers Cheques are mostly utilizedto remove the risk of theft in the course of travel.
4. Foreign Exchange: A separate Foreign Exchange Departmentis maintained by most of the banks. Its function is to convertforeign currency into domestic currency and vice-versa.
5. ATM and Credit Card Facilities: Automated Teller Machinesfacilities provide cash easily and quickly 24 hours a day. CreditCard allows a person to buy goods and services upto certainspecified limit without immediate payment. Purchases can bemade on credit basis. Amount is paid to shops, hotels etc by thebank. The banks collect the amount due from the customers bydebiting their account.
1.3.3 Subsidiary Activities of Commercial Banks:
In addition to banking and non-banking functions, many functionsare also undertaking subsidiary activities such as:
1) Merchant Banking: Merchant banks offers variety of serviceslike –(i) Management, marketing and underwriting new issues(ii) Project promotion and project finance(iii)Corporate Advisory services(iv)Investment Advisory services and so on
2) Housing Finance: Housing finance is provided in the form ofmortgage loans i.e. it is provided against the security ofimmovable property of land and buildings. Many banks such as
11
SBI, Bank of India, Bank of Baroda etc. have set up housingfinance subsidiary companies.
3) Venture Capital Fund: Venture Capital Fund provides start-upshare capital to new ventures of little-known, unregistered,highly risky, young and small private businesses, especially intechnology oriented and knowledge intensive industries. Theyalso provide management and marketing expertise to suchunits. Many commercial banks such as SBI, Canara Bank, ICICIbank etc. have set up Venture Capital Fund SubsidiaryCompanies.
4) Factoring: Factoring is a continuous arrangement betweenfinancial intermediary (bank) known as a factor and a businessconcern (client) whereby the factor purchases the client’saccount receivables. Factoring is a collection and financeservice designed to improve the client’s cash flow by turning hiscredit sales into ready cash. In simple words, it is an activity ofmanaging the trade debts of a business concern. Some bankslike SBI, Canara Bank have set up subsidiaries offeringfactoring services.
5) Mutual Funds: A mutual fund is a financial intermediary thatpools (collects) the savings of the investors for a collectiveinvestment in a diversified portfolio of securities. A fund is“Mutual” since all of its returns minus expenses, are shared bythe funds investors. A mutual fund serves as s link between theinvestor and securities market by mobilizing savings from theinvestors and investing them in securities market to generatereturns.
Check Your Progress:
a. What are some of the important secondary and subsidiaryfunctions of a commercial bank?
12
1.4 ASSETS AND LIABILITIES OF COMMERCIALBANKS
The balance sheet of a commercial bank is a statement of itsliabilities and assets at a particular period of time. The liabilities ofthe bank are those items which are to be paid by the bank toshareholders, depositors and others. The assets of the bank arethose items from which the bank hopes to get an income.
The liabilities of the bank enable it to undertake its operations.The liabilities include all the amounts due to depositors(deposits) and to shareholders (capital & reserves). Theliabilities represent sources of funds.
The assets of a bank enable it to earn its income. The assetsinclude all the amounts owed by others to the bank. The assetsrepresent application of funds.
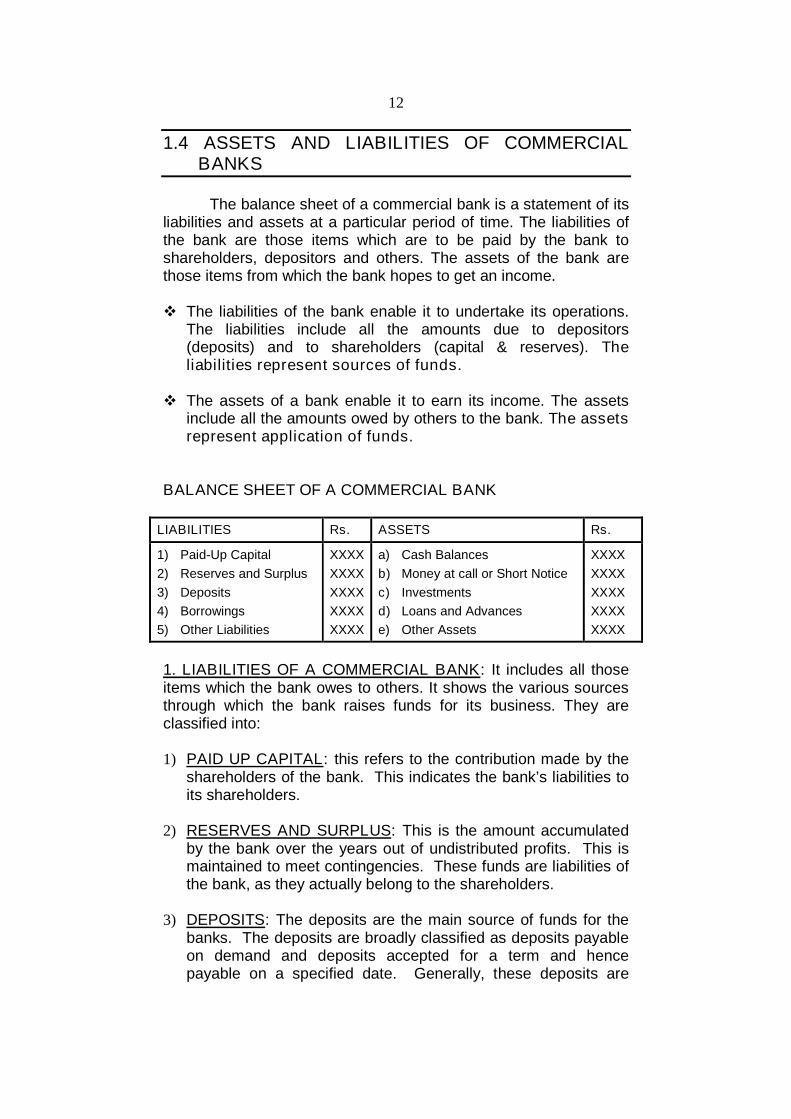
BALANCE SHEET OF A COMMERCIAL BANK
LIABILITIES Rs. ASSETS Rs.
1) Paid-Up Capital
2) Reserves and Surplus
3) Deposits
4) Borrowings
5) Other Liabilities
XXXX
XXXX
XXXX
XXXX
XXXX
a) Cash Balances
b) Money at call or Short Notice
c) Investments
d) Loans and Advances
e) Other Assets
XXXX
XXXX
XXXX
XXXX
XXXX
1. LIABILITIES OF A COMMERCIAL BANK: It includes all thoseitems which the bank owes to others. It shows the various sourcesthrough which the bank raises funds for its business. They areclassified into:
1) PAID UP CAPITAL: this refers to the contribution made by theshareholders of the bank. This indicates the bank’s liabilities toits shareholders.
2) RESERVES AND SURPLUS: This is the amount accumulatedby the bank over the years out of undistributed profits. This ismaintained to meet contingencies. These funds are liabilities ofthe bank, as they actually belong to the shareholders.
3) DEPOSITS: The deposits are the main source of funds for thebanks. The deposits are broadly classified as deposits payableon demand and deposits accepted for a term and hencepayable on a specified date. Generally, these deposits are
13
classified as current deposits, saving bank deposits and termdeposits.
Current Deposits: Current deposits are usually operated by thebusiness people. There are no restrictions on the amount or thenumber of withdrawals from these accounts. Banks do not payinterest on the current account. These funds represent interest-free balances.
Savings Deposits: These deposits are operated by individuals,trusts etc. for non-commercial purposes. They earn someinterest. Cheques can be drawn on savings account. However,there are limitations on the number of withdrawals.
Time Deposits: Deposits which are repayable after a specifiedperiod of time are included in time deposits. They have differentmaturity periods which depend on rate of interest. They includefixed deposits, cumulative deposits, deposits generated undervarious schemes etc.
4) BORROWINGS: They consists borrowings or amountrefinanced from RBI, commercial banks and other financialinstitutions. They also include overseas borrowings made byIndian branches and also borrowings made by foreign branches.
5) OTHER LIABILITIES: These are incurred by the bank duringthe course of business. They include bills payables such asdrafts, travelers cheque, pay slips, bankers cheques etc. Theyalso include provision for income tax.
2. ASSETS OF A COMMERCIAL BANK: The assets side ofbalance sheet consists of all those items which give revenue to thebank. The assets side can be analysed as follows:
1) CASH BALANCES: This is the most liquid asset. It enables thebank to meet the demand of customers. By experience thebanks know the amount of cash required to meet the demand ofthe people. They keep certain amount of deposits as reserveswith themselves. Cash has 100% liquidity but 0%profitability.
2) MONEY AT CALL AND SHORT NOTICE: It refers to the loanswhich are given for a very short period of time i.e. from 1 day to7 days. The loans are repayable on demand of either the lenderor the borrower. They are highly liquid. It is generally given tothe bill market, for the purpose of dealing in the bullion marketsand stock exchanges, between banks, discount houses, dealersin commercial bills and frequently to individuals of high financial
14
status in Mumbai for ordinary trade purpose. These assets bringin some interest income to the banks.
3) INVESTMENTS: Generally commercial banks invest in shortterm and medium term securities. They prefer governmentsecurities as they are safe and marketable. Investments inshares, debentures and bonds are also made by banks. Theyare highly profitable but have less liquidity. Commercial banksinvestment are:a) Government of India securities,b) Other approved securities andc) Non-approved securitiesInvestment in SLR securities: The first two types of securitiesare known as SLR securities. At present the banks arestatutorily required to invest 25% of their total deposits ingovernment and approved securities. Government securitiesinclude securities issued by both the central and stategovernment agencies and PSUs of state and centralgovernment. Approved securities include securities issued byQuasi-Government agencies. These securities are given SLRsecurities status on case-to-case basis.
Investment in Non-SLR securities: The third types ofsecurities are known as Non-SLR securities. After 1985, therehas been a liberalization of investment norms for banks. Theyinclude commercial papers, units of mutual funds and shares,bonds and debentures of PSUs and Private corporate sector.
4) LOANS AND ADVANCES: The most important asset ofcommercial banks balance sheet is loans and advances. Theyform the major part of assets for all the banks. The varioustypes of loans and advances provided by the banks are:
Cash Credit: Cash credit is sanctioned against a security ofcommodity stock, property etc
Overdraft: It is allowed only for current account holders. Purchase of discounting bills: It is adopted to finance trade
transactions and movement of goods. Loans: They are advances for fixed amounts repayable on
demand or installments.
5) OTHER ASSETS: They include fixed assets, such as premiseswhich are wholly or partly owned by banks forbusiness/residential purpose, furniture etc.
15
Check Your Progress:
a. What are the different assets of a commercial bank?b. How are the assets of a commercial bank arranged?c. Which of the assets is most liquid?d. What are the different liabilities of a commercial bank?
1.5 TRADE-OFF BETWEEN PROFITABILITY ANDLIQUIDITY
Commercial Banks is a profit-seeking organisation. Theability of a bank to earn profit depends upon its portfoliomanagement. Portfolio Management refers to the management ofassets and liabilities in such a way that profits are maximised.
While making profits banks are also concerned aboutliquidity and safety. In fact profitability, liquidity and safety are themain objectives of a monetary policy.
A commercial bank has to earn profit for its shareholdersand at the same time satisfy the withdrawal needs of its customers.A bank tries to achieve the twin conflicting objectives of liquidity andprofitability by selecting a diversified and balanced asset portfoliowithin the framework of the regulations of a central bank.
1.5.1 Motives of Investment Policy:
The investment policy i.e., the portfolio management, of abank is guided by two important motives:
1) Profitability: One of the important objectives of a bank is toearn profit for the shareholders. Hence, in acquiring assets, thebank will be influenced by the profit. Generally, the assets whichyield higher income are long-term in nature and cannot bereadily converted into cash to meet the demands of thedepositors.
2) Safety and Security i.e. Liquidity: The second objective of abank is its own safety and security. Since the business of a
16
bank depends upon the confidence of the depositing publicevery bank should maintain sufficient cash to meet thewithdrawal demand of depositors. Liquidity is the ability toproduce cash on demand.
3) Shiftability: Thus, apart from maintaining enough cash, a bankshould acquire assets which can be easily converted or shiftedinto cash. Shiftability is an important feature of an asset.Shiftability means that assets should be easily shiftable to otherbanks or central bank to acquire cash.
Thus, while acquiring assets, a commercial bank has to keep twoimportant considerations in mind. They are:
1. The assets distribution should be in such as way that theyshould bring maximum amount of profit for the shareholders.
2. Adequate amount of cash or the non-cash assets should bemaintained so that they can be easily converted into cash tomeet the demands of depositors.
1.5.2 Trade-Off between Liquidity and Profitability:
The above mentioned two objectives of liquidity andprofitability are contradictory (opposing) in nature.
Maximum safety or liquidity can be attained if the bank keeps ahigh proportion of cash against deposits. This will not bring anyincome for the bank. Thus, if the bank goes for maximum safetyas its primary objective, it will have to sacrifice profitabilityobjective.
On the other hand, if the bank uses all its funds to give loansand advances that bring large interest income, it will not be ableto meet the cash requirements of depositors. In this case bankwill be forced to shut down. Thus, if the bank goes for maximumprofitability as its primary objective, it will have to sacrificeliquidity objective.
1.5.3 Reconciling Twin Objectives:
A good banker should try to reconcile the twin conflictingobjectives of liquidity profitability by selecting a diversified andbalanced asset portfolio within the framework of the regulations ofa Central bank. Hence it is said that the secret of successfulbanking is to distribute resources between various forms of assetsin such a way to get a sound balance between liquidity andprofitability.
17
The asset portfolio of a bank strikes a balance between liquidityand profitability. The commercial bank arranges its assets in anascending order of profitability and descending order of liquidity. Aswe move down the balance sheet, the assets become less andless liquid and more and more profitable. The more liquid theassets, the less profitable it is.
1) Cash balances: They are held to meet the withdrawal needs ofthe depositors. They have perfect liquidity, but no profitability.
2) Money at call / short notice: Commercial banks lend theirsurplus cash to each other. This earns some interest and at thesame they are very liquid.
3) Investments in securities: Banks are required statutorily toinvest a part of their assets in government securities. Theycarry a low rate of interest but banks can borrow from the RBIagainst these securities. Thus, they provide return as well asliquidity to the bank.
4) Loans and advances: They constitute the main item of abank's assets. They are the main source of finance. In this caseliquidity is low, and profitability is high. However, banks alsotake into consideration liquidity while granting loans andadvances by giving short-term loans and advances.
Conclusion: It can be seen from the asset portfolio of banks that abank holds various assets in such a way that the requirements ofliquidity and profitability are balanced.
1.5.4 Factors Affecting Liquidity:
Banks consider number of factors in determining liquidity.The liquidity of a bank, i.e., the amount of liquid assets held by thebank, depends upon the following factors.
1) Statutory requirements: The extent of liquid reserves held bythe bank depends upon the statutory requirements such asCRR and SLR. These limits are determined by the central bank.
2) Banking habits of the people: The banking habit generallydepends upon the nature of the economy. In the developedcountries people have the cheque habit and hence, the use ofcash is considerably less. On the other hand, in the developingcountries banking habits are not fully developed and thereforethe use of cash is considerably more leading to frequentwithdrawals from the banks. Thus, the need for liquidity will behigh in the developing countries.
18
3) Monetary transactions: The size of liquid reserves will alsodepend upon the number and magnitude of monetarytransactions. During busy season such as festival times,harvest season, beginning of the month, etc. banks will have tokeep large percentage of cash.
4) Nature of Banks business: If banks resort to medium and longterm investments and on term loans with an intention to earnhigher profits then the liquidity of such banks will be less. It willresult in lack of confidence among depositors. Such banks haveto maintain required amount of cash balances and at the sametime invest in securities to earn higher returns.
5) Nature of money market: If the money market of the country isfully developed, it will be easy for the banks to buy and sellsecurities. In such cases the need for liquid cash will be less.
6) Structure of the banking system: Under the branch bankingsystem, the cash reserves can be centralized in the head officeand branches can manage with smaller liquid reserves. On theother hand, under the unit banking system, every bank is anindependent unit and hence has to keep a higher degree ofliquidity.
7) Number and size of deposits: As the number and size ofdeposits rise, banks will require more liquidity to meet thedemand for cash by the depositors.
8) Nature of deposits: Liquidity requirements will depend uponthe nature of deposits with banks. The deposits are of varioustypes such as time deposits, demand deposits, term depositsand so on. Larger the demand deposits and short-termdeposits, larger will be the need for liquidity.
9) Liquidity Policy: If other banks in the same area have a policyof maintaining high liquidity, other banks may also like tomaintain high liquidity. As high liquidity builds goodwill amongthe depositors. And in turn earns trust an confidence of thedepositors.
1.5.5 Factors Affecting Profitability :
Banks consider number of factors in determining profitability.The profitability of a bank, i.e., the amount of profits generated bythe bank from its assets, depends upon the following factors.
1) Amount of working funds deployed: Working funds are thefunds deployed by a bank in its business. The profitability is
19
directly related to the amount of working funds deployed by thebanks.
2) Cost of funds: The sources of funds for a bank comprise sharecapital and reserves (owned funds), deposits, borrowing andother liabilities. The cost of funds mainly refers to interestexpenses.
3) Yield on funds: The funds mobilized by a bank throughdifferent sources are utilized for CRR and SLR requirements,granting loans and advances and so on. Many of these giverise to yields mainly in terms of interest income. This willdepend upon the portfolio management of the banks.
4) Spread: Spread is defined as the difference between interestincome and interest expenses. High interest rate spreads couldindicate the tewd of efficiency of the financial intermediationand also a relatively less competitive market.
5) Operating Costs: These are also called management costsand include all costs other than cost of funds and provisions.They consists of staff cost, i.e., salaries and other paymentssuch as bonus, gratuity, etc. made to staff and overheads suchas expenses on stationary and printing, postages, rents,depreciation on assets, etc.
6) Risk Costs: The risk cost is the cost associated with the likelyannual loss on assets. Provisions made towards bad anddoubtful debts, etc. are included under risk cost.
7) Non-Interest income: This is the income derived from non-financial asset and services and includes commission andbrokerage on remittance facilities, guarantees, underwriting,contracts, etc., locker rentals and other service charges.
8) Burden: The difference between the non-interest expenses andnon-interest income is called burden. When making a cost pluspricing of loans this difference (i.e. burden) has to be includedon the rate of interest. The concept of burden also brings outthe importance of non-interest income of the bank. A high levelof non-interest income cannot only recover the entire operatingcost, it can enable a bank to pay high level of compensation toits employees. This is the case of foreign banks.
9) Level of NPAs: The profitability of the banks depends uponNon-Performing Assets (NPAs). Larger NPAs will lead to lowerprofitability.
10) Level of competition: As the level of competition increases, itmay lead to fall in margins and hence to lower profitability.
20
Conclusion: A successful banker will adopt a prudent investment,policy keeping the requirements of liquidity and profitability.
Check Your Progress:
a. What are the twin principles that a bank has to follow to maintainits profitability and liquidity?
1.6 QUESTIONS
1. Explain the various functions of a commercial bank.
2. What do you understand by the liquidity and profitability of acommercial bank?
3. Examine the various liabilities of a commercial bank.
4. What are the different assets of a commercial bank? Who are theclassified?
5. Discuss the factors that determine the profitability of acommercial bank.
21
2
(B) BANKING SECTOR REFORMS
Unit Structure:
2.0 Objectives
2.1 Structure of Banking in India
2.2 Growth of Commercial Banks
2.3 Banking Sector Reforms in India since 1991
2.4 Implementation of banking sector reforms
2.5 Questions
2.0 OBJECTIVES
To understand the nature of banking system in India.
To understand the rationale and nature of banking sectorreforms undertaken since 1991.
2.1 STRUCTURE OF BANKING IN INDIA
Banking activity after independence was mainly a stateactivity. The government ownership was completed in stages. TheReserve Bank of India was nationalized in 1949. It was followed bynationalization of Imperial Bank of India in 1955 [Now known as theState Bank of India]. In July 1969, 14 major commercial bankshaving assets in excess of Rs. 50 Crore were nationalized. In April1980, 6 more banks having assets in excess of Rs. 200 Crore werenationalized. Banking business in India was a near monopoly of theGovernment until the introduction of economic reforms.
1. SCHEDULED BANKS: Scheduled Commercial banks are thosebanks which are included in the Second Schedule of BankingRegulation Act, 1965. In order to be included in Second Schedule,a bank must fulfill the following conditions:
Must have a paid-up capital and reserves of not less thanRs. 5 Lakhs
22
It must also satisfy the RBI, that its affairs are not conductedin a manner detrimental (damaging/unfavorable) to theinterest of the depositors.
COMMERCIAL BANKS: It includes public sector banks, privatesector banks and foreign banks. They are organized joint stockcompanies under the Indian companies Actor as PublicCorporations under separate acts of Parliament (such as the SBI).
Public Sector Banks: As of March, 2009, there are 27 PublicSector Banks consisting of SBI and 6 associated banks, 19Nationalized Banks and IDBI Ltd.
Regional Rural Banks (RRBs): RRBs came into existence in1975. They are sponsored by large commercial banks. The sharecapital of RRBs is contributed by Central Government (50%), StateGovernment (15%) and Commercial Bank (35%). The number ofRRBs has declined from 196 in 2002-03 to 86 in 2008-2009 as partof resturcturing.
Private Sector Banks: Private Sector banks include old privatesector banks and new private sector banks. There are 7 newprivate sector banks and 15 old private sector banks in India as ofMarch 2009. The private banks mostly operate in urban areas.
Foreign Banks: Foreign banks are those banks which areregistered in some other country. They operate in India by startinga subsidiary company in India to do banking activities. There are 31foreign banks in India as of March 2009. The foreign banks mostlyoperate in big cities and their presence in rural areas is almostzero.
2. NON-SCHEDULED BANKS: Non-Scheduled Commercial banksare those banks which are not included in the Second Schedule ofBanking Regulation Act, 1965. As on March 2009, there were only4 non-Scheduled banks operating in India. Non-Scheduled bankshave to maintain 3% of the total deposits by way of cash reserveswith itself or by way of balance in a current account with RBI.
2.2 GROWTH OF COMMERCIAL BANKS
Indian Banking system was a highly regulated due to which thecustomer service i.e. both borrowers as well as depositors hadsuffered. With the help of financial sector reforms an attempt ismade to overcome these weaknesses. At present, India has a moredeveloped and integrated banking system with large number ofbanks in the country.
23
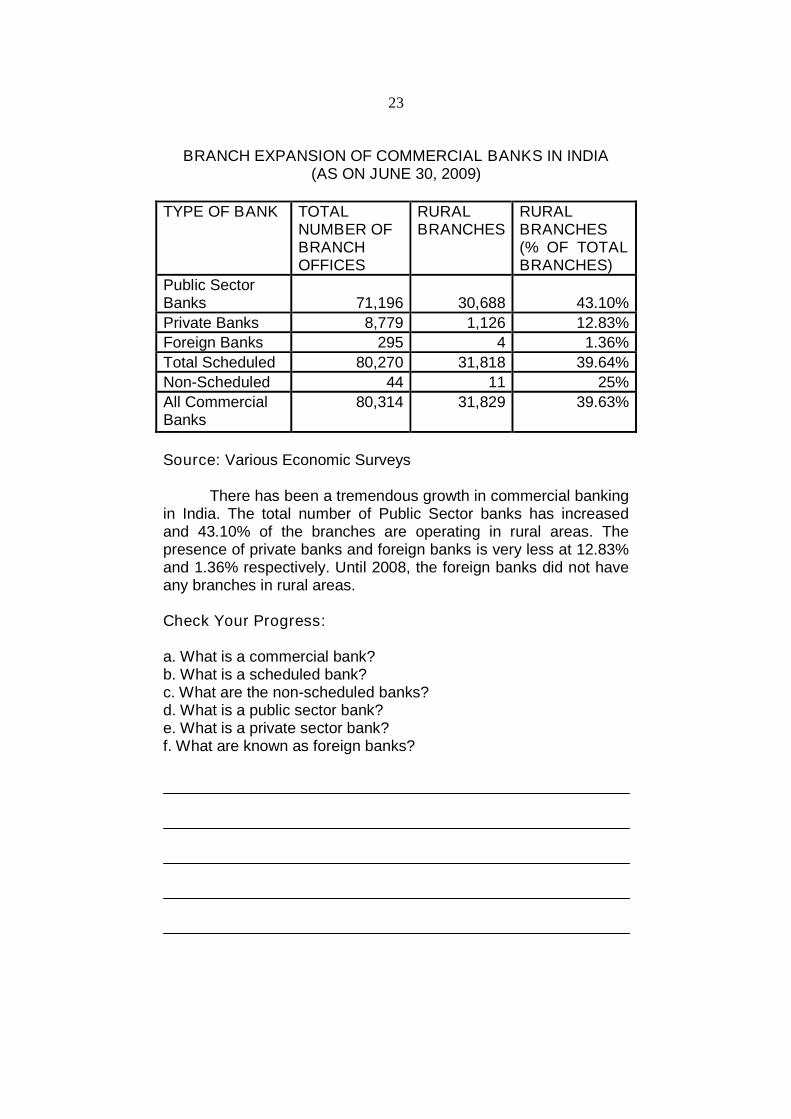
BRANCH EXPANSION OF COMMERCIAL BANKS IN INDIA(AS ON JUNE 30, 2009)
TYPE OF BANK TOTALNUMBER OFBRANCHOFFICES
RURALBRANCHES
RURALBRANCHES(% OF TOTALBRANCHES)
Public SectorBanks 71,196 30,688 43.10%
Private Banks 8,779 1,126 12.83%
Foreign Banks 295 4 1.36%
Total Scheduled 80,270 31,818 39.64%
Non-Scheduled 44 11 25%
All CommercialBanks
80,314 31,829 39.63%
Source: Various Economic Surveys
There has been a tremendous growth in commercial bankingin India. The total number of Public Sector banks has increasedand 43.10% of the branches are operating in rural areas. Thepresence of private banks and foreign banks is very less at 12.83%and 1.36% respectively. Until 2008, the foreign banks did not haveany branches in rural areas.
Check Your Progress:
a. What is a commercial bank?b. What is a scheduled bank?c. What are the non-scheduled banks?d. What is a public sector bank?e. What is a private sector bank?f. What are known as foreign banks?
24
2.3 BANKING SECTOR REFORMS IN INDIA SINCE1991
The Government of India appointed a committee under theChairmanship of Mr. M. Narasimham (the former Governor of RBI)in July 1991 to examine India's financial system and to recommendimprovements in the working of the financial system. This is knownas the Committee on Financial Sector Reforms. This was followedby another committee under him in 1998. The second committeewas asked to look in to the progress of reforms till 1998 and to lay acourse for further reforms. This committee is known as Committeeon Banking Sector Reforms, 1998. The Reports of these twocommittees form the basis for reforms in the Indian banking sector.
1. First Phase of Reforms 1991 to 1998:
The Narasimham Committee submitted its first report in1991. The following are the recommendations of NarsimhamCommittee applicable to banking sector:
1) Four-Tier Hierarchy in Banking: The committeerecommended a four-tier hierarchy in the banking sector:
a) 3 to 4 large banks (at the top of hierarchy) with internationalstatus.
b) 8 to 10 banks (at the second tier) with wide network ofbranches throughout the country to perform general bankingfunctions.
c) Local banks whose operations to be confined to a particularregion.
d) Rural banks (at the bottom of hierarchy) to financeagriculture and allied activities.
2) Reduction in Statutory Liquidity Ratio (SLR): The committeerecommended for the reduction in SLR. The SLR is thepercentage of deposits (time and demand liabilities) to beinvested in Government securities. The committee suggestedfor reduction in SLR from 38.5% to 25% over a period of aboutyears. The reduction in SLR would enable the banks to havemore liquid funds for the purpose of lending in the market.
3) Reduction in Cash Reserve Ratio (CRR): The committeerecommended for reduction in CRR. The CRR is a percentageof total time and demand liabilities to be maintained as reserveswith RBI. The CRR to be reduced from 15% to 10% over aperiod of about 5 years. The reduction in CRR would enable'banks to have more liquid funds for the purpose of lending in themarket.
25
4) Deregulation of Interest Rates: The Committee stronglyrecommended the deregulation of interest rates by RBI both onadvances and deposits. The deregulation in interest rates wouldbring flexibility in interest rates and transparency in bankingtransactions. Thus, deregulation of interest rates wouldgenerate competition in the banking sector, which in turn wouldimprove efficiency of the banking sector.
5) Capital Adequacy Ratio (CAR): The committee suggested forincreasing the CAR from 2% to 8% in a phased manner over aperiod of time. CAR refers to the minimum capital to be raised inrelation to risk assets. It is normally referred as minimum capitalto risk assets ratio (CRAR).
6) Classification of Assets: The committee recommended forproper classification of assets and full disclosure andtransparency of accounts of banks and FIs.
7) Capital Markets: The committee recommended for reforms inthe capital market sector. The reforms in the capital marketwere recommended to give a boost to the Indian capitalmarkets. The reforms include:
a) Issuer of capital (company) to fix its own price for the issueof securities without government permission.
b) Foreign financial investors to invest in Indian capital market.c) SEBI to frame effective guidelines to protect the interest of
investors.
8) Asset Reconstruction Fund (ARF): The Committeerecommended for setting up ARF by RBI. The ARF would takeover a part of the doubtful debts/NPAs or the banks and recoverdues from defaulters. The ARF would provide liquidity support tobanks by taking over a part of NPAs.
9) Redefining Priority Sector: The committee recommended forredefining the priority sector. The committee favoured a newpriority sector which would include only small and marginalfarmers, cottage and tiny sector. The new priority sector shouldget 10% of the funds/advances of the total advances from thebanking sector.
10)Quasi-Autonomous Body: The Committee recommended forthe seeing up of a quasi-autonomous body to supervise over thefunctioning of banks and Financial Institutions under thesponsorship of the Reserve Bank.
26
11) Other Recommendations:
a) IDBI to play only refinancing role.b) Abolition of branch licensing policy.c) No further nationalization of banks.d) The dual control on the financial system (of RBI and Banking
Division of Ministry of Finance) to end.
2. Second Phase of Reforms 1998 onwards:
The Government again set up a committee under M.Narsimham to study the financial sector and to makerecommendations. The committee submitted its report in April1998. Some of the major recommendations are as follows:
1) Mergers: Strong banks should be merged, while weaker banksshould be closed down.
2) Capital Adequacy Ratio: The CAR to be increased from 8% to10%.
3) Three-Tier Banking Hierarchy: Narsimham recommendedthree-tier hierarchy in the banking system
a. 2 to 3 banks with international status.
b. 8 to 10 banks with national status.
c. A number of local banks.
4) Credit Recovery Mechanism: Legal framework for creditrecovery to be strengthened.
5) NPAs: Net non-performing assets for all banks to be broughtdown to below 5% by the year 2000 and to 3% by 2002.
6) Technology: Technological upgradation of banks to improveproductivity and to offer better customer service.
7) Autonomy to Banks: Greater operational flexibility andautonomy to banks. No interference of politicians in theappointment of the banks' Board of Directors, which would bringprofessionalism in bank management.
8) Licensing Policy: The policy of licensing new private banksmay be continued.
9) Foreign Banks: Foreign banks may be allowed to set upsubsidiaries or joint ventures in India.
10)Integrated System Of Regulation: There has to be anintegrated system of regulation and supervision of the activitiesof banks, Fls, and other players in the financial sector.
27
2.4 IMPLEMENTATION OF BANKING SECTORREFORMS
RBI introduced the First Phase of Banking Sector Reformsbased on Narasimham Committee Report 1991. Some of theimportant reforms are:
1. FIRST PHASE OF BANKING REFORMS (1991-1998):Following are some of the measures taken by the Reserve
Bank to implement the recommendations of the Committee.
1) Prudential Norms: RBI has laid down prudential norms in orderto bring professionalism in commercial banks. The purpose ofprudential norms include proper disclosure of income,classification of assets and provision for bad debts so as toensure that the books of commercial banks reflect the accurateand correct picture of its financial position.
Banks are supposed to disclose non-performing assets (NPAs).With effect from March 31, 2004, a NPA is an advance where,the loans and advances are overdue in terms of interest and/orinstallment payment for a period of more than 90 days, (earlierthe norm was 180 days).
2) Recovery of Dues: In early 1990s, the financial position ofseveral public sector banks appeared very weak due to highNPAs. The overall gross NPAs of the scheduled commercialbanks were over 10% of the total gross advances. Some of thepublic sector banks made huge losses due to high NPAs. Inorder to solve, this problem, the RBI set up a Special RecoveryTribunal so as to provide legal assistance to the banking sectorto recover their dues at a quicker pace.
In 2004-05, the gross NPAs of scheduled commercial banks asa percentage to total gross advances have declined to 5.2%from nearly 13% in 1999-00. In 2008-09, the gross NPAs stoodat 2.3% of all scheduled commercial banks.
3) Reduction of CRR: The CRR is the cash ratio of a bank's totaldeposits to be maintained with RBI. A high CRR reduces thecash for lending and a low CRR increases the funds for lending.The CRR has been brought down from 15% in 1991 to 6% inApril 2010.
4) Reduction of SLR: Under SLR, the government has imposedan obligation on the banks to maintain a certain ratio to its totaldeposits with the RBI in form of liquid assets like cash, gold, andother securities. The SLR has been reduced from 38.5% in1991 to 25% (present level). The reduction in CRR and SLR
28
releases more funds in the market by way of loans andadvances.
5) Deregulation of Interest Rates: The RBI has deregulatedinterest rates since 1989. At present, banks are allowed to fixinterest rates for all deposits except savings, and for alladvances except export credit.
The deregulation of interest rates would bring transparency tothe banking transactions. It would also generate competitionamong the banks, which in turn would improve efficiency of thebank personnel. This in turn would bring better service to thebank's customers.
6) Minimum Lock-In Period: RBI has reduced the minimum lock-in period of term deposits from 15 days to 7 days in October2004. This would be an advantage to the term depositors. Theywould be encouraged to deposit money for 7 days rather than tokeep idle with them. This would increase the short termdeposits, which can be effectively deployed by the banks in callmarkets, repos, etc.
7) Capital Adequacy Ratio: As per the recommendations of theNarsimham Committee, the Capital adequacy ratio is the ratio ofminimum capital to risk assets. Increase in capital adequacyratio improves confidence of the depositors in the bankingsector. At present, all banks have the CAR above the minimumlevel of 9%. By 31st March, 2009 the CAR of as many as 78banks was above 10% and that of only one bank was in therange of 9 to 10%. In fact, the overall CAR of all SCBs was13.2% by 31 March 2009.
8) Asset Liability Management: To facilitate better asset liabilitymanagement, banks are allowed discretion to disallowpremature withdrawal of large deposits except in respect ofindividuals and Hindu Undivided Families, subject to informingthe depositors in advance.
9) Freedom of Operation: Scheduled commercial banks aregiven freedom to open new branches and upgrade extensioncounters, after attaining capital adequacy ratio and prudentialaccounting norms. The banks are also permitted to close non-viable branches other than in rural areas. Bank lending normshave been liberalized.
29
2. SECOND PHASE OF BANKING SECTOR REFORMS 1998onwards:
The RBI introduced the Second Phase of Banking SectorReforms based on Narasimham Committee Report 1998. Thereforms are:
1) Securitisation of Assets: The introduction of Securitisation,Reconstruction of Financial Assets and Enforcement of SecurityInterest Act, 2002, is an important milestone in the bankinghistory in India. This Act enables the setting up of assetmanagement companies for solving the problems of non-performing assets of banks and financial institutions.
Under this Act, an asset management company is authorized toacquire assets of any bank or FIs by issuing a debenture orbond or any other security for consideration agreed upon bysuch Asset Management Company and bank or FI.
2) Measures for Urban Cooperative Banks (UCBs): To ensuregreater security to depositors and members of urbancooperative banks (UCBs), interim prudential measures havebeen announced by RBI in 2001-02, such as
Direct or indirect lending by UCBs to individuals againstsecurity of shares stopped.
Existing lending to brokers or direct investment in shares tobe unwound.
Borrowing from call money market limited to 2% ofaggregate deposit at the end of the previous financial year.
Increase in SLR holdings of scheduled UCBs from 15% to20% w.e.f. March, 2002.
3) FDI limit in Banking Sector: Govt. of India has increased theFDI limit in private sector banks from 49% to 74%. The increasein FDI enables Indian private banks to obtain more foreigncapital, but also expertise and technology from foreign parties.This can have a direct effect on the efficiency of the privatesector banks.
4) Mergers and Amalgamation: RBI has issued guidelinesmergers/amalgamation of private sector banks in May 2005.The guidelines cover details regarding the process of mergerproposal, determination of swap ratios, disclosures and normsfor buying/selling of shares by promoters before and during theprocess of merger.
30
5) Anti-Money Laundering Guidelines: Prevention of moneylaundering has assumed greater importance because of fundingof terrorist and other illegal activities. Therefore, in November2004, RBI revised Know Your Customer (KYC) guidelines.Banks have to frame policy guidelines regarding proceduresrelating to:
Customer acceptance Customer identification Risk management Monitoring transactions of suspicious nature, so as to report
to Government.
6) Adoption of BASEL-II Norms: The Basel Committee onBanking Supervision released the New Capital Adequacy-BaselII Framework on June 26, 2004. Accordingly, RBI has issuedguidelines to banks for the implementation of Basel II norms.Several measures have been taken by RBI to prepare thebanking system to move towards Basel II norms.
7) Managerial Autonomy for Public Sector Banks: Governmentof India has provided managerial autonomy to public sectorbanks in February 2005, so as to enable them to compete withprivate sector banks. PSBs are allowed to:
Undertake new lines of business and Exit from a line ofbusiness.
Make suitable acquisitions. Close or merge unviable branches. Open branches abroad. Set up subsidiaries. Decide on issues such as recruitment, place training,
promotion, etc.
8) Customer Service: Several measures have been taken by RBIto improve customer service of commercial banks, such as:
a) Customer Service Committee of the Board: All banks -public and private are advised to set up CSCB in order to:
Strengthen corporate governance in the banking system. Improve quality of customer service provided by banks.
b) Ombudsman Scheme: To increase the effectiveness of theBanking Ombudsman Scheme, banks are advised (in April2005) that the CSCB should play more active role relating tocomplaints received by the Banking Ombudsman of variousstates.
31
c) Credit Card Facility: RBI framed guidelines on credit cardfacility (June 2005) for all commercial banks and non-banking finance companies (NBFCs) regarding credit cardoperations. As per the guidelines, each bank/NBFC musthave proper policy and a 'Fair Practices Code' for credit cardoperations.
9) Deposits of Deceased Depositors: RBI has advised banks (inJune 2005) to simplify the procedure tor settlements of claimsby legal heir of deceased depositors.
10)Technology: Technology infrastructure for the payment andsettlement system has been strengthened with the introductionof:
Electronic Fund Transfer Centralized Fund Transfer System Structured Financial Messaging Solution Negotiated Dealing System Real Time Gross Settlement (RTGS) System
11) New Areas for Bank-financing: New areas have been openedup for bank financing such as Insurance, Credit and DebitCards, Investment Banking, Infrastructure Financing, HousingFinance, Factoring, Venture Capital Funds and Mutual Fundsetc.
Check Your Progress:
a. Lowering of cash reserve ratio is good for the banks.b. Introduction of new technology helps the banks.
2.5 QUESTIONS
1. Examine the nature of banking sector reforms since 1991.
2. Examine the banking sector reforms since 1998.
32
3
PERFORMANCE OF COMMERCIALBANKS IN THE POST-REFORM PERIOD
ANDNEW TECHNOLOGIES IN BANKING
SECTOR
Unit Structure:
3.0 Objectives
3.1 Performance of Commercial Banks in the Post-ReformPeriod
3.2 New Technologies in Banking
3.3 Questions
3.0 OBJECTIVES
Understand the impact of reforms on the Indian banking sector.
Understand the impact of new technologies on the working ofcommercial banks in India.
3.1 PERFORMANCE OF COMMERCIAL BANKS INTHE POST-REFORM PERIOD
The performance or efficiency of commercial banks isanalysed in terms of profitability, productivity, financial soundnessand quality of assets.
(I) PROFITABILITY INDICATORS: Profitability of banks ismeasured in terms of net profits of the commercial banks. Netprofit is further influenced by interest and non-interest incomeand expenses.
1) Interest Income Ratio: It is the ratio of interest income to totalassets. An increase in this ratio indicates higher profitability,and vice-versa.
2) Interest Expended Ratio: It is the ratio of interest expenses tototal assets. An increase in this ratio indicates lower profitability,and vice-versa.
33
3) Net Interest Margin Ratio (NIMR): It is the ratio of net interestincome to total assets. Net interest income (spread) is equal tointerest income minus interest expenses. An increase in thisratio indicates higher profitability. A fall in this ratio indicateslower profitability, and therefore, the bank must redesign itspolicies and practices to generate higher yields with a focus oncheaper funds.
4) Intermediation Cost to Asset Ratio (ICAR): It is the ratio ofintermediation or operating expenses (non-interest expenses) tototal assets. An increase in this ratio indicates lower efficiencyand lower profitability.
5) Burden Ratio: It is also called as Overhead Efficiency Ratio. Itis the ratio of non-interest expenses to non-interest income. Anincrease in this ratio indicates higher burden or lower profitabilityof the bank.
6) Return on Assets Ratio (ROAR): It is the ratio of net profit tototal assets. This ratio indicates the profitability of a bank basedon its assets. An increase in this ratio indicates higherprofitability of a bank.
7) Return on Equity Ratio: It is the ratio of net profit to totalequity. An increase in this ratio indicates higher performanceand profitability of a bank. This ratio enables a bank to raisemore funds from the capital markets.
8) Stock Market indicators: The performance of a bank's scrip(shares) on the stock market is based on its profitability, whichis indicated by two parameters:
a) Earning per Share (EPS): It is the ratio of net profit tonumber of equity shares.
b) Price by Earning (P/E) Ratio: It is the ratio of share price toEPS.
(II) PRODUCTIVITY INDICATORS: The productivity indicators arebased on the performance of employees. The two mainproductivity indicators include:
a) Profit per Employee: It is the ratio of net profit to number ofemployees. An increase in this ratio indicates higherproductivity of employees.
b) Business per Employee: It is the ratio of total turnover(revenue) to number of employees. An increase in this ratioindicates higher productivity of employees.
34
(III) FINANCIAL STABILITY INDICATORS: The financial stability(soundness) of a bank is reflected in its capital adequacy ratioor capital to risk-weighted assets ratio (CRAR). It is the ratio ofBank's capital to risk-weighted assets. Under these norms,each asset of the commercial bank is assigned a specific riskand the bank has to maintain unencumbered Tier I capitalagainst these assets. Depending on the risk exposure ofassets (loans or investments), weights are assigned to theassets of the bank. The higher the ratio more is the safety forthe depositors.
Example: If CRAR is 10%, then a loan of Rs.100,000/- isbacked by 10% of the bank's capital. If the bank suffers baddebts upto 10% (upto Rs. 10,000/-), there is no problem forthe depositors.
(IV) QUALITY OF ASSETS INDICATORS: The quality of bank'sassets depends on the level of non-performing assets (NPAs).The NPAs are those assets on which the interest and principalamount receivable is overdue for a period of more than 90days. Higher NPAs indicate poor quality of assets(loans/investments). Generally, the following ratios are used:
a) Ratio of Gross NPAs to Gross Advances (i.e. total NPAs toTotal Advances)
b) Ratio of Net NPAs to Net Advances (i.e. net NPAs to Netadvances)
A lower ratio indicates a better assets quality.
3.1.1 PERFORMANCE WITH RESPECT TO PUBLIC SECTORBANKS, NEW PRIVATE SECTOR BANKS AND FOREIGNBANKS:
In the pre-reform period (before 1991), the performance ofbanking sector was affected due to lack of competition, inefficiencyand corruption, low capital base, and high operating costs. Afterintroduction of reforms, there is an overall improvement in theperformance of most of the commercial banks including publicsector banks, private sector banks and foreign banks in India. Thecomparative performance of public sector banks, new private sectorbanks, and foreign banks is stated as follows:
1. PROFITABILITY INDICATORS: The performance of commercialbanks based on profitability indicators indicate that overallperformance of ail categories of commercial banks have improvedsince 2000-01, However, there is marked improvement in the caseof foreign banks, and new private banks as compared to PSBs inIndia.
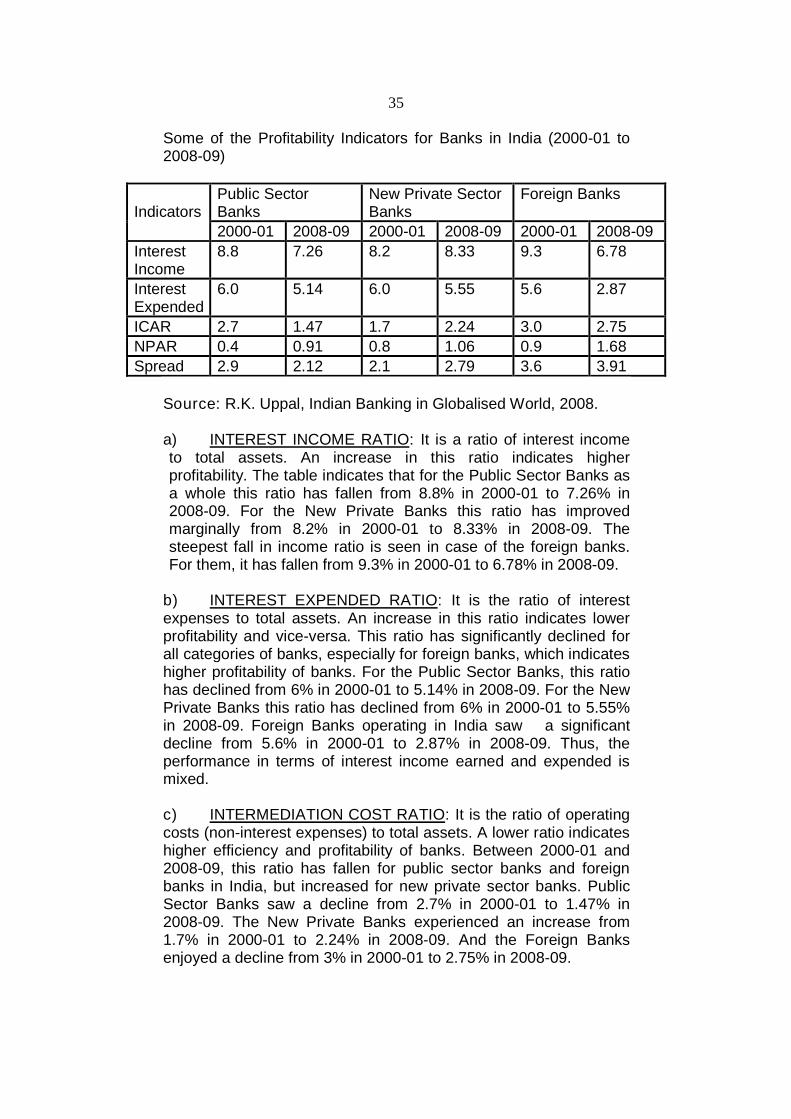
35
Some of the Profitability Indicators for Banks in India (2000-01 to2008-09)
Public SectorBanks
New Private SectorBanks
Foreign BanksIndicators
2000-01 2008-09 2000-01 2008-09 2000-01 2008-09
InterestIncome
8.8 7.26 8.2 8.33 9.3 6.78
InterestExpended
6.0 5.14 6.0 5.55 5.6 2.87
ICAR 2.7 1.47 1.7 2.24 3.0 2.75
NPAR 0.4 0.91 0.8 1.06 0.9 1.68
Spread 2.9 2.12 2.1 2.79 3.6 3.91
Source: R.K. Uppal, Indian Banking in Globalised World, 2008.
a) INTEREST INCOME RATIO: It is a ratio of interest incometo total assets. An increase in this ratio indicates higherprofitability. The table indicates that for the Public Sector Banks asa whole this ratio has fallen from 8.8% in 2000-01 to 7.26% in2008-09. For the New Private Banks this ratio has improvedmarginally from 8.2% in 2000-01 to 8.33% in 2008-09. Thesteepest fall in income ratio is seen in case of the foreign banks.For them, it has fallen from 9.3% in 2000-01 to 6.78% in 2008-09.
b) INTEREST EXPENDED RATIO: It is the ratio of interestexpenses to total assets. An increase in this ratio indicates lowerprofitability and vice-versa. This ratio has significantly declined forall categories of banks, especially for foreign banks, which indicateshigher profitability of banks. For the Public Sector Banks, this ratiohas declined from 6% in 2000-01 to 5.14% in 2008-09. For the NewPrivate Banks this ratio has declined from 6% in 2000-01 to 5.55%in 2008-09. Foreign Banks operating in India saw a significantdecline from 5.6% in 2000-01 to 2.87% in 2008-09. Thus, theperformance in terms of interest income earned and expended ismixed.
c) INTERMEDIATION COST RATIO: It is the ratio of operatingcosts (non-interest expenses) to total assets. A lower ratio indicateshigher efficiency and profitability of banks. Between 2000-01 and2008-09, this ratio has fallen for public sector banks and foreignbanks in India, but increased for new private sector banks. PublicSector Banks saw a decline from 2.7% in 2000-01 to 1.47% in2008-09. The New Private Banks experienced an increase from1.7% in 2000-01 to 2.24% in 2008-09. And the Foreign Banksenjoyed a decline from 3% in 2000-01 to 2.75% in 2008-09.
36
d) NET PROFIT RATIO: It is the ratio of net profits to total assets.Over the years, this ratio has improved for all types of banks,which indicates better deployment of funds or assets. This canbe seen in case of Public Sector Banks in an increase from0.4% in 2000-01 to 0.91% in 2008-09. For the New PrivateBanks from 0.8% in 2000-01 to 1.06% during 2008-09. Inaddition, to the Foreign Banks from 0.9% in 2000-01 to 1.68% in2008-09.
e) SPREAD RATIO: It is the ratio of net interest to total assets.The spread is equal to interest income minus interest expenses.The spread ratio has improved for new private banks andforeign banks, whereas, it has reduced in the case of publicsector banks. The Public Sector Banks witnessed this ratiofalling from 2.9% in 2000-01 to 2.12% in 2008-09. The NewPrivate Banks experienced an increase from 2.1% in 2000-01 to2.79% in 2008-09. And the Foreign Banks saw this ratioincreasing from 3.6% in 2000-01 to 3.91% in 2008-09.
f) PRODUCTIVITY INDICATORS: The productivity of banks ismeasured in terms of business per employee, profits peremployee and business per branch. Productivity is directlyrelated to profitability of banks, i.e., higher the productivity,higher is the profitability. Productivity of commercial banks hasimproved specially in public sector banks and foreign banks inIndia. But, the productivity in new private banks has declinedmainly due to higher base effect.
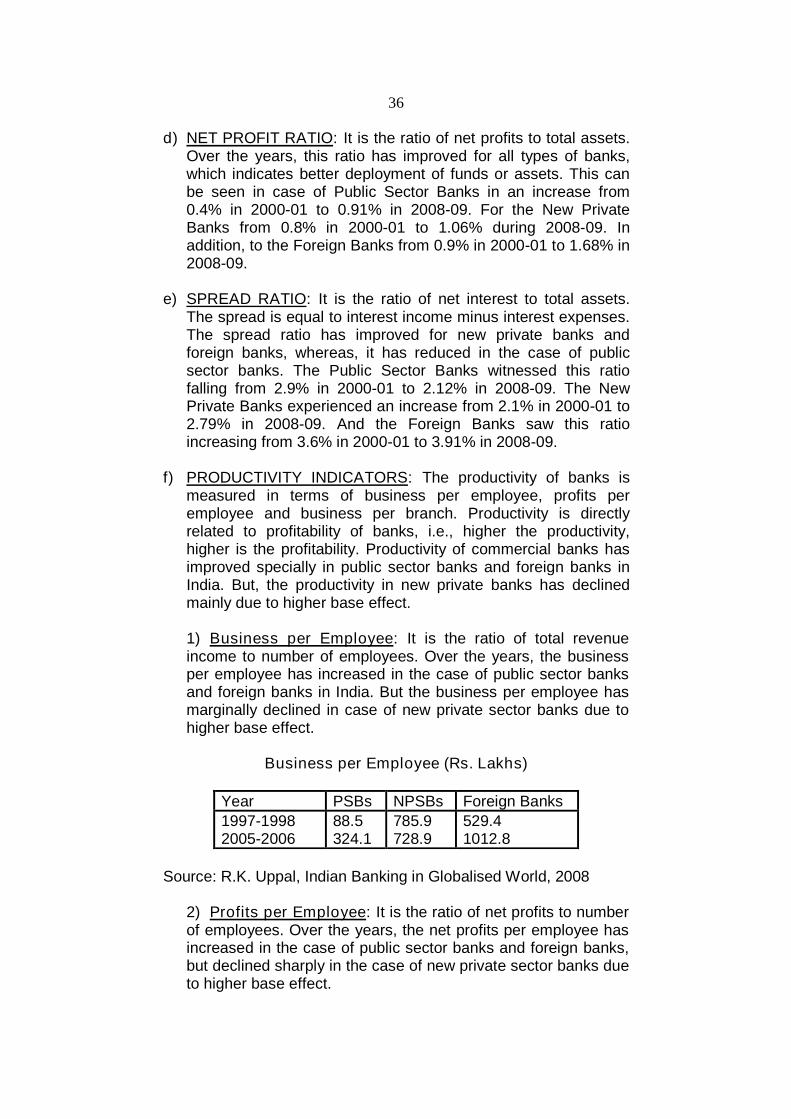
1) Business per Employee: It is the ratio of total revenueincome to number of employees. Over the years, the businessper employee has increased in the case of public sector banksand foreign banks in India. But the business per employee hasmarginally declined in case of new private sector banks due tohigher base effect.
Business per Employee (Rs. Lakhs)
Year PSBs NPSBs Foreign Banks
1997-19982005-2006
88.5324.1
785.9728.9
529.41012.8
Source: R.K. Uppal, Indian Banking in Globalised World, 2008
2) Profits per Employee: It is the ratio of net profits to numberof employees. Over the years, the net profits per employee hasincreased in the case of public sector banks and foreign banks,but declined sharply in the case of new private sector banks dueto higher base effect.
37
Profits per Employee (Rs. Lakhs)
Year PSBs NPSBs Foreign Banks
1997-19982005-2006
0.72.9
11.46.3
4.526.5
Source: R.K. Uppal, Indian Banking in Globalised World, 2008
3) Business per Branch: The business per branch has increasedacross all types of banks. But the overall business per branch islower in case of public sector banks as compared to new privatesector banks and foreign banks. For instance, business perbranch was 10 times more in case of foreign banks ascompared to public sector banks and 2 times more in case offoreign banks as compared to public sector banks in 2004-05.
Business per Branch (Rs. Crore)
Banks 1999-2000 2004-2005
Public Sector 50.12 116.96
Private Sector 149.89 216.56
Foreign 548 1147.68
Source: R.K. Uppal, Indian Banking in Globalised World, 2008
4. FINANCIAL STABILITY OF COMMERCIAL BANKS: Thefinancial stability of commercial banks is based on CapitalAdequacy Ratio. It is the ratio of capital to risk assets. RBI has keptminimum capital adequacy ratio of 9%. All types of banks havereached the minimum capital adequacy ratio. In fact, new privatesector banks and foreign banks have crossed 15.1% capitaladequacy ratio, and public sector banks have crossed 12.3% inMarch 2009.
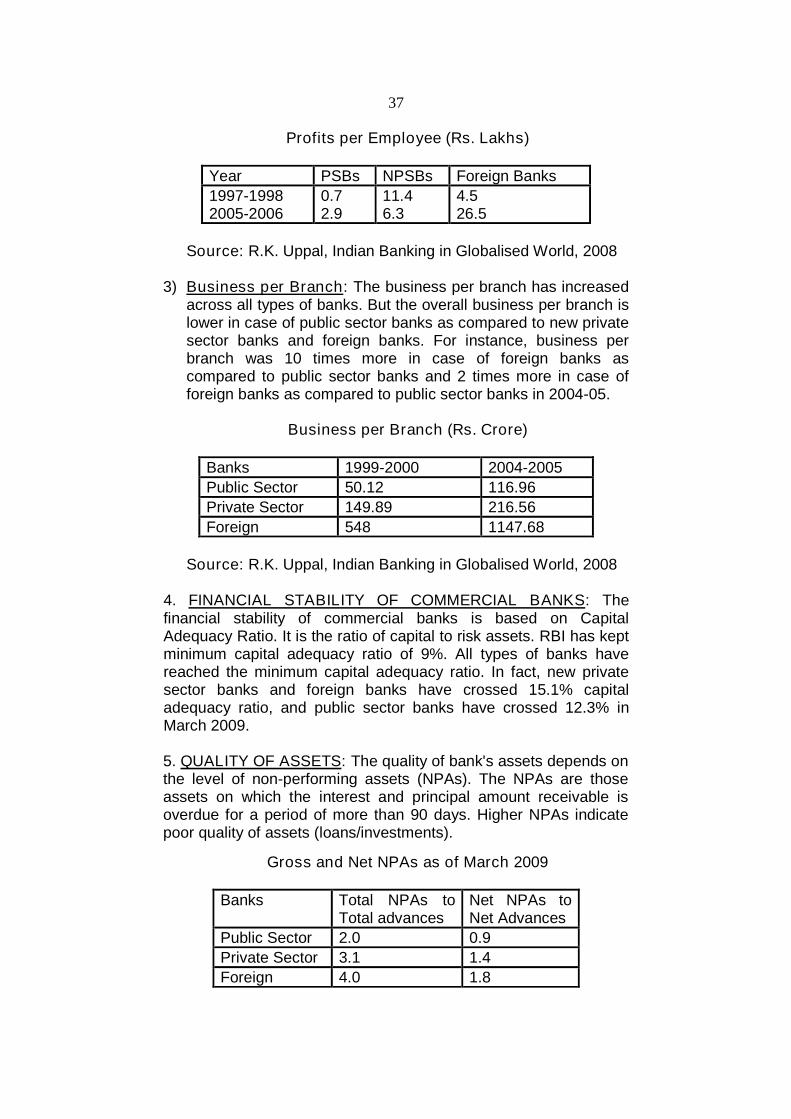
5. QUALITY OF ASSETS: The quality of bank's assets depends onthe level of non-performing assets (NPAs). The NPAs are thoseassets on which the interest and principal amount receivable isoverdue for a period of more than 90 days. Higher NPAs indicatepoor quality of assets (loans/investments).
Gross and Net NPAs as of March 2009
Banks Total NPAs toTotal advances
Net NPAs toNet Advances
Public Sector 2.0 0.9
Private Sector 3.1 1.4
Foreign 4.0 1.8
38
Source: R.K. Uppal, Indian Banking in Globalised World, 2008Higher amount from NPAs were recovered during 2008-09
indicating improvement in the asset quality of banks. The SecurityAct and the Debt Recovery Tribunals have been the most effective.The Total NPAs to Total Advances ratio and Net NPAs to NetAdvances ratio of public sector banks was 2.0% and 0.9% as ofMarch 2009. But in the case of private sector banks and foreignbanks both the ratios were increased.
Check Your Progress:
a. What are the different performance indicators of a commercialbank?
b. In what ways the performance of PSBs after 1998 is worse thanthat of private sector and foreign banks in India.
c. What is capital adequacy ratio?
d. What are NPAs?
3.2 NEW TECHNOLOGIES IN BANKING
Introduction of Information Technology-Act of 1999 underbanking sector reforms gave new dimensions to the Indian bankingindustry. ATMs, Smart cards, Internet banking, tele banking, etc.has transformed the banking structure, business process, workculture and human resource development. The banks in India havestarted using electronic and telecommunication networks forproviding a wide range services. The various new technologies thatare being used by the banks are explained below:
1) Virtual Banking: It includes providing of banking and relatedservices through extensive use of IT to the customer. Theservices are delivered to the customers by depending only onIT. The most important types of virtual banking services areAutomated Teller Machines (ATMs), electronic fund transfer,phone-banking, credit card, debit card, smart card, internetbanking and so on.
2) ATMs (Automated Teller Machines): ATMs are self servicevendor machine that help the banks to provide round the clockbanking services to their customers at convenient placeswithout visiting to the bank premises. To get ATM services
39
customers are provided with ATM card, which is a small plasticcard with magnetic strip, containing information about the nameof bank, name of the customer, card number, validity period andsignature panel. The ATM provide a number of services such aswithdrawal of cash upto a particular limit, deposit of cash,cheques and drafts, updated balance of customer, transfer ofmoney from one account to another accounts, mini accountstatement and so on.
3) Debit Card: It is a prepaid card with some stored value. APersonal Identification Number (PIN) will be issued to thecustomers for using the debit card. It can be used at all outletsthat accept such cards for payments. In this case, thetransaction amount is directly debited to the bank account of thecustomer. Debit card does not permit a customer to spend overand above his cash balance in the bank.
4) Credit Card: It enables a customer to purchase goods andservices within the prescribed limits from authorized outletswithout making immediate cash payments. The main differencebetween a credit card and debit card is that while credit card isa 'post paid', the latter is 'pre-paid'.
5) Point of Sale (PoS): The PoS terminal is a machine thatfacilitates transactions through swipe of a card in an onlineenvironment. Merchant business establishments operate pointof sale in their premises in order to accept plastic cards. ThePoS terminals facilitate electronic funds transfer. PoS systemidentify the cardholder and check whether the customersaccount has sufficient funds to cover the purchase. Thecustomized PoS terminals can support both debt and creditcards and can also be made to support different kinds of plasticincluding magnetic and smart chip based cards to make thetransaction possible.
6) Door Step Banking: This means banking services andproducts made available to a customer at his place of residenceor work. Under this system, there is no need for the customer tovisit the branch for getting services or products from the bank.
7) Internet Banking: It is also called on-line banking where thetraditional banking services are provided through the internet.Internet banking is a product of e-commerce in the field ofbanking and financial services. Internet banking enablescustomers to open accounts, pay bills, know account balances,forward loan application, view and print copies of cheques,transfer funds, stop payments, etc. Different banks havedifferent levels of such devices offered, starting from low level
40
where only information is provided to high level where onlinetransactions are made possible.
8) Mobile banking: It is an extension of internet banking. It giveseverybody with a mobile phone to access banking services,irrespective of their location. In this system, a customer canaccess his account details on a mobile phone by using theShort Messaging Service (SMS) technology. It provides manyservices such as account balance, mobile alerts about creditcard or debit card transactions, mini account statement and soon.
9) Tele-banking: It is another form of electronic banking throughwhich banking services or products are rendered throughtelephone to its customers. It is a 24 hour banking facility to thecustomer. It is based on the voice processing facility availableon bank computers.
10)Phone banking: Under this service a customer can talk to aphone banking officer for transacting a banking business. Thecustomer can do entire non-cash related banking services ontelephone, anywhere at any time.
11)Electronic Fund Transfer (EFT): It is an easy and speedymechanism to facilitate the transfer of funds from one place toanother. It enables the customers to transfer money instantlyfrom one bank account to another one of the same or anothercustomer, from one branch or the other of the same bank or adifferent bank not only within the country but also withinanywhere else of the world through electronic message. Itenables the beneficiary to receive money on the same day orthe next day of money transfer.
12)Electronic Clearing Services (ECS): It is non-paper basedmovement of funds. It consists of:
Electronic Credit Clearing service is a reliable device usedfor bulk and repetitive credit-push payments such as salary,pension, dividend, commission, IPO refunds, interest, etc..
Electronic Debit Clearing Service was introduced to facilitatethe payment of credit-pull transactions such as payment ofutility bills, insurance premium and repayment of loaninstallments.
13)Real Time Gross Settlement (RTGS): RBI introduced RTGSsystem in order to enhance the efficiency of the cheque clearingsystem. It is a single, all-India system with the settlement beingeffected in Mumbai. The settlement of funds is final andirrevocable. The settlement is done in near real time (maximum
41
of 2 to 4 hours) and the funds settled can be further usedimmediately. It was started in March 2004.
Check your Progress:a) What is a credit card?b) What is a debit card?c) What electronic funds transfer?
3.3 QUESTIONS
1. Explain the performance of commercial banks in India after 1991.
2. Explain the nature of technological changes in the banking sectorafter 1991.
42
4
Module 2
CENTRAL BANKING
RESERVE BANK OF INDIA’S MONETARYPOLICY
Unit Structure :
4.0 Objectives
4.1 Introduction of Moneatry policy and its objectives
4.2 Liquidity management by the reserve bank of India
4.3 Evaluation of RBI’s monetary policy
4.4 Questions
4.0 OBJECTIVES
To understand the concept of monetary policy.
To understand the objectives of monetary policy in India.
To understand the Reserve Bank’s strategy of managingliquidity.
To understand the importance of micro-finance organisations inIndia.
4.1 INTRODUCTION MONEATRY POLICY AND ITSOBJECTIVES
The central bank of a country is its apex financial institution.It is charged with the responsibility of controlling the money supplyover which it has monopoly control, ensure adequate credit to theeconomy at reasonable cost. For this purpose, it is given controlover the working of all commercial banks operating in the country. Italso serves as the custodian of the country’s foreign exchangereserves and strives to maintain a stable exchange rate to facilitateinternational trade.
43
Monetary policy refers to the decisions of the central bankwith reference to the availability of money, the cost and availabilityof credit to the different users. Thus, monetary policy is defined as‘a set of deliberate decisions of the central bank regarding theavailability of cash and the cost and availability of credit.’ It isimportant to note in this context that the central bank does notformulate its policy in vacuum. It aims at certain objectives andoperates on its different instruments to facilitate the smoothachievement of these objectives. The Reserve Bank of India (RBI)since Independence is working towards certain objectives. Until1969, the Reserve Bank was primarily concerned with fightinginflationary pressures that arose due to the massive investments bythe government with the aim of achieving rapid industrialisation andeconomic growth. The Reserve Bank used to finance massivegovernment borrowing programmes and had to reign in thecommercial banks to counter the inflation. In 1969, the ReserveBank adopted the objective of ‘growth with stability.’ This objectiveemphasized the need to control inflation to ensure a faster growthof the economy.
In 1991, with the introduction of the economic reforms, theReserve Bank adopted the objective of “Controlled Expansion.”This objective translates into the following:
a. Ensure acceleration in industrial investment and economicgrowth.
b. Maintain the rate of inflation around 5 to 6 percent.c. Bring about improvements in the credit delivery mechanisms,
especially for agriculture, small and medium sectors.d. Bring about the necessary reforms in the financial system to
achieve these objectives.
RBI has introduced various monetary policy instruments toachieve the twin objectives of economic growth and control ofinflation. Following the introduction of economic reforms in India in1991, the RBI has re-oriented its monetary policy formulation andinstruments in order to achieve these objectives. An importantaspect of monetary policy is that the RBI has to operate in a newatmosphere which is characterised by:
1. The increasing role of market forces in the determination of thecost and availability of credit.
2. The monetary policy is largely insulated from temporarydomestic uncertainities.
3. The monetary policy has to have continuity in maintaining thepace of reform process.
44
4. The responses have to be contextual- that is depened on thechanging national and international environment.
5. Improve the efficiency of financial sector to ensure highergrowth and social justice and
6. Strengthen the institutional structures to effectively respond tochallenges. In order to achieve this, the RBI has strengthenedsome of the traditional instruments and introduced some newones. We shall now examine these instruments and theirdeployment by the RBI since 1991.
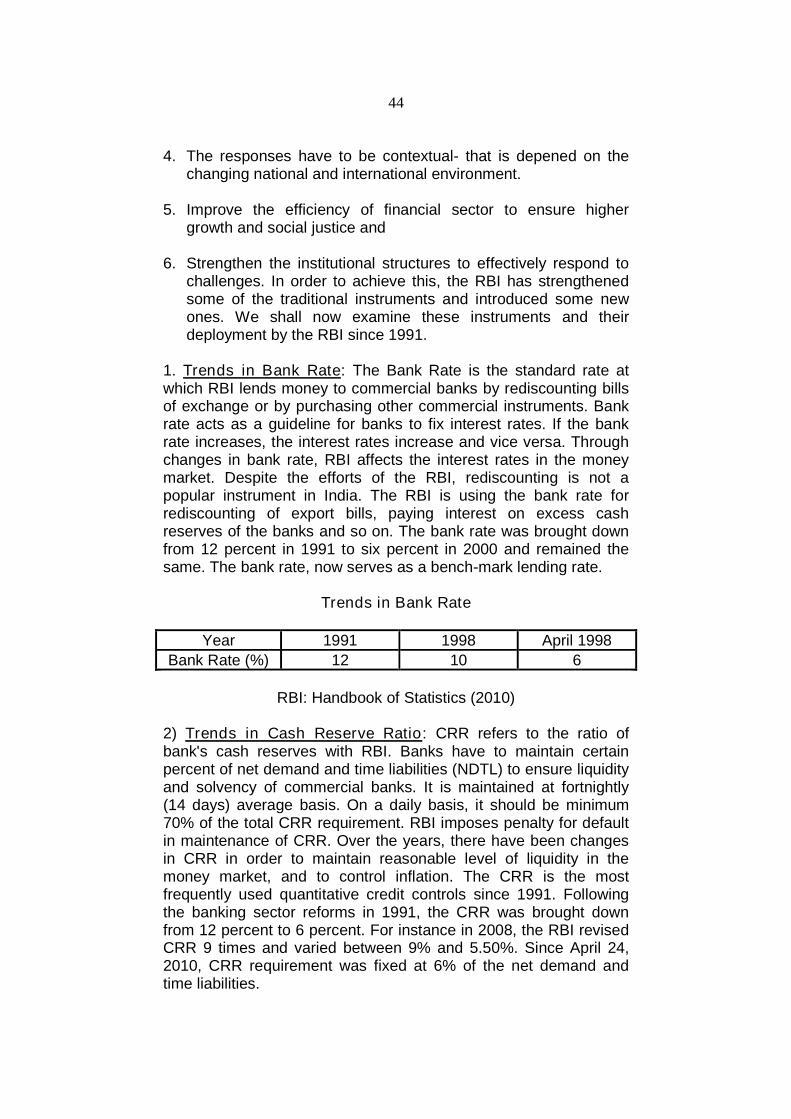
1. Trends in Bank Rate: The Bank Rate is the standard rate atwhich RBI lends money to commercial banks by rediscounting billsof exchange or by purchasing other commercial instruments. Bankrate acts as a guideline for banks to fix interest rates. If the bankrate increases, the interest rates increase and vice versa. Throughchanges in bank rate, RBI affects the interest rates in the moneymarket. Despite the efforts of the RBI, rediscounting is not apopular instrument in India. The RBI is using the bank rate forrediscounting of export bills, paying interest on excess cashreserves of the banks and so on. The bank rate was brought downfrom 12 percent in 1991 to six percent in 2000 and remained thesame. The bank rate, now serves as a bench-mark lending rate.
Trends in Bank Rate
Year 1991 1998 April 1998
Bank Rate (%) 12 10 6
RBI: Handbook of Statistics (2010)
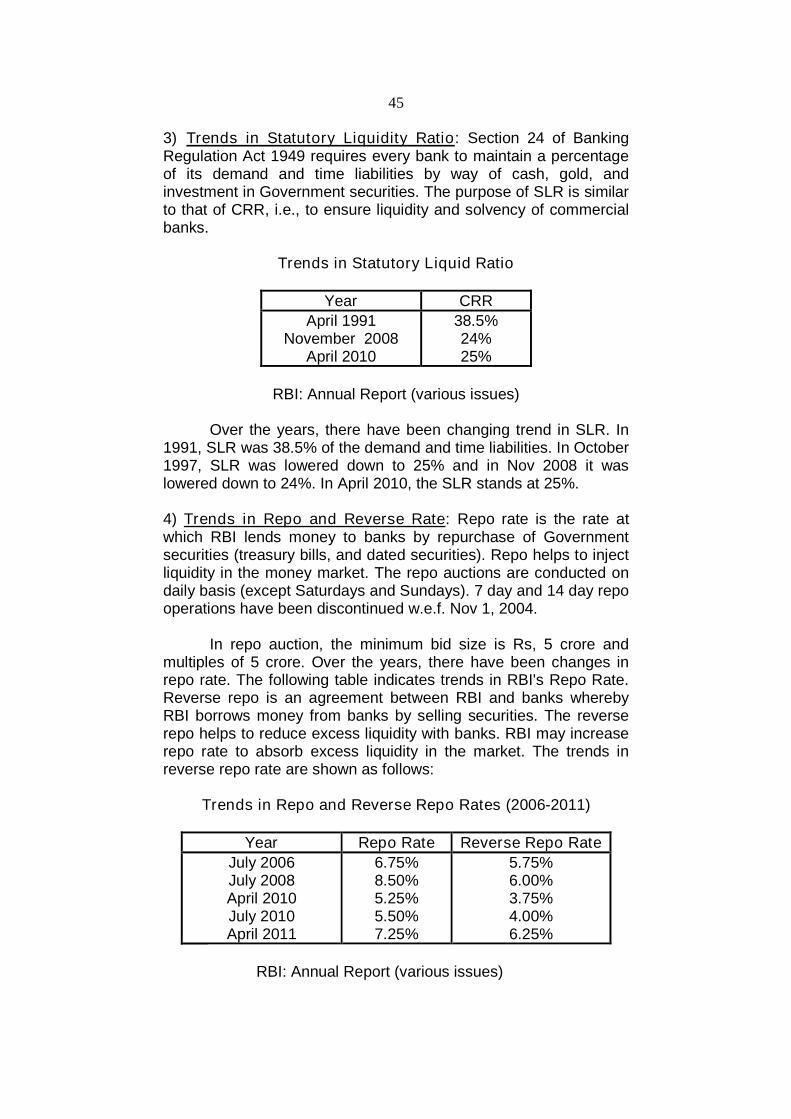
2) Trends in Cash Reserve Ratio: CRR refers to the ratio ofbank's cash reserves with RBI. Banks have to maintain certainpercent of net demand and time liabilities (NDTL) to ensure liquidityand solvency of commercial banks. It is maintained at fortnightly(14 days) average basis. On a daily basis, it should be minimum70% of the total CRR requirement. RBI imposes penalty for defaultin maintenance of CRR. Over the years, there have been changesin CRR in order to maintain reasonable level of liquidity in themoney market, and to control inflation. The CRR is the mostfrequently used quantitative credit controls since 1991. Followingthe banking sector reforms in 1991, the CRR was brought downfrom 12 percent to 6 percent. For instance in 2008, the RBI revisedCRR 9 times and varied between 9% and 5.50%. Since April 24,2010, CRR requirement was fixed at 6% of the net demand andtime liabilities.
45
3) Trends in Statutory Liquidity Ratio: Section 24 of BankingRegulation Act 1949 requires every bank to maintain a percentageof its demand and time liabilities by way of cash, gold, andinvestment in Government securities. The purpose of SLR is similarto that of CRR, i.e., to ensure liquidity and solvency of commercialbanks.
Trends in Statutory Liquid Ratio
Year CRR
April 1991November 2008
April 2010
38.5%24%25%
RBI: Annual Report (various issues)
Over the years, there have been changing trend in SLR. In1991, SLR was 38.5% of the demand and time liabilities. In October1997, SLR was lowered down to 25% and in Nov 2008 it waslowered down to 24%. In April 2010, the SLR stands at 25%.
4) Trends in Repo and Reverse Rate: Repo rate is the rate atwhich RBI lends money to banks by repurchase of Governmentsecurities (treasury bills, and dated securities). Repo helps to injectliquidity in the money market. The repo auctions are conducted ondaily basis (except Saturdays and Sundays). 7 day and 14 day repooperations have been discontinued w.e.f. Nov 1, 2004.
In repo auction, the minimum bid size is Rs, 5 crore andmultiples of 5 crore. Over the years, there have been changes inrepo rate. The following table indicates trends in RBI's Repo Rate.Reverse repo is an agreement between RBI and banks wherebyRBI borrows money from banks by selling securities. The reverserepo helps to reduce excess liquidity with banks. RBI may increaserepo rate to absorb excess liquidity in the market. The trends inreverse repo rate are shown as follows:
Trends in Repo and Reverse Repo Rates (2006-2011)
Year Repo Rate Reverse Repo Rate
July 2006July 2008April 2010July 2010April 2011
6.75%8.50%5.25%5.50%7.25%
5.75%6.00%3.75%4.00%6.25%
RBI: Annual Report (various issues)
46
5) Multiple Indicator Approach: Initially the RBI used monetarytargeting approach while formulating monetary policy. MonetaryTargeting refers to monetary policy aimed at maintaining pricestability by changing the composition of growth in money supply.Post reforms this approach was difficult to follow as monitoringmoney supply and maintaining price stability became difficultdue to NBFIs. So, RBI adopted Multiple Indicator approach inwhich it looks at a variety of economic indicators such asmoney, credit, output, trade, capital inflows, fiscal position, rateof returns in various markets, inflation rate as well as exchangerate and their impact on economic growth.
6) Phasing of Qualitative Methods: The qualitative or selectivemethods of credit control are being slowly phased out. Theindirect methods of credit control (such as CRR, SLR, RepoRate, Reverse Repo Rate, etc) are becoming more relevant incontrolling money supply and credit in the economy.
7) De-linking of Monetary Policy from Budget: In 1994, anagreement was sighed between the Central Government andRBI to phase out the use of ad hoc treasury bills to financeGovernment deficit. With the phasing out of ad hoc treasurybills, RBI would no longer finance Government deficits.
8) Deregulation of Interest Rates: The bank lending rates wereearlier fixed by RBI. Since 1991, this system has changed andthe lending rates are no longer regulated by RBI. Now thelending rates are fixed by banks depending upon market forces,i.e., demand for and supply of funds with the banks.
9) Provision of Micro-Finance: The RBI has introduced Micro-Finance scheme for the benefit of rural poor households andlinking them with Self-Help Groups (SHGs) and banking system.
Check Your Progress:
1. What do you understand by monetary policy?2. What are the objectives of monetary policy in India since 1991?3. What is bank rate?4. What do you understand by cash reserve ratio (CRR)?5. What is a repo rate?6. What is a reverse repo?
47
4.2 LIQUIDITY MANAGEMENT BY THE RESERVEBANK OF INDIA
Liquidity management of a central bank is defined as theframework, set of instruments and the rules that the central bankfollows in order to manage the amount of money supply, to controlshort term interest rates with the overall objective of price stability.Liquidity management of RBI refers to management of moneysupply and credit in order to achieve its objectives of economicgrowth and price stability (control of inflation).
1. SIGNIFICANCE OR IMPORTANCE OR NEED OF SHORT-TERM LIQUIDITY MANAGEMENT:
1) Reforms: Post 1990s many reforms were introduced in thefinancial sector. Deregulation of interest rates and deregulationof exchange rates were the major reforms and these rates wereearlier were determined by the RBI. After the reforms, marketforces determined by market demand and supply.
2) Liberalization & Globalization: Due to liberalization andglobalization the capital flows between countries have increasedrapidly. Huge inflows of foreign capital in the form of ForeignDirect Investment and Foreign Institutional Investments. ForeignInvestment increases from US $ 118 million during 1991-92 toUS $ 15 Billion in 2004-2005.
3) Volatility and Uncertainty: Foreign capital inflows resulted increation of employment and helped India achieve higher growthrate. But at the same time they have brought in volatility anduncertainty in the financial markets.
4) Export Earnings: The foreign capital inflows add to the supplyof foreign currency and as a result there is appreciation of thedomestic currency. This makes exports of the country expensiveto foreigners and the export earnings suffer.
5) Increase in Money Supply: The capital inflows get convertedinto rupees and get injected in the economy. This increasesmoney supply. This increase in money supply increasesdemand for goods and services as purchasing power expands.This causes demand-pull inflation.
Therefore, it was necessary that the RBI should manageboth the exchange rate and the interest rate in order to maintainprice stability (i.e. control inflation)
48
2. MEASURES TOWARDS SHORT TERM LIQUIDITYMANAGEMENT:
1) STERILIZATION: RBI has introduced sterilization method todeal with the undesirable effects of capital inflows.
Meaning: Sterilization means re-cycling of foreign capitalinflows to prevent appreciation of the domestic currency and tocheck the inflationary impact of foreign capital inflows.
Instrument used: Sterilization is usually carried out through theuse of Open Market Operations, where RBI sells bonds andsecurities in the open market to absorb the excess liquidity thatcomes from sudden increase in capital flows.
Related Problems: Sterilization may lead to certain problems.For instance, when the Government sells securities to absorbexcess liquidity, it will increase the demand for funds in thedomestic market, which would raise interest rates. This mayfurther attract more foreign capital to take advantage of higherinterest rate.
2) REPO RATE AND REVERSE REPO RATE:
Repos Rate: RBI introduced repo in December 1992 to improveshort term liquidity management in the money market. Underrepo, RBI lends money to banks by repurchasing securities.Therefore, repo increases liquidity with the banks.
RBI increases or decreases rates of repo and reverse repo. Ifthe repo rate increases, banks will borrow lesser funds fromRBI, and therefore, short term liquidity will be controlled. But, ifthe repo rate is reduced, banks may borrow more funds fromRBI.
Reverse Repo Rate: RBI has also introduced reverse repo.Under reverse repo, RBI borrows money from banks by issuingsecurities. The reverse repo reduces excess liquidity with thebanks. In case of reverse repo, if rates are increased, banksmay lend more funds to RBI, and if it reduces, banks may lendlower funds to banks. Therefore increase in repo rate andreverse repo helps RBI to reduce short term liquidity so as tocontrol prices/inflation.
3) INTERIM LIQUIDITY ADJUSTMENT FACILITY: In 1998,Narsimham Committee recommended LAF as a means todevelop short term money market. Accordingly, RBI introducedthe ILAF in April 1999. ILAF enabled RBI to manage short-termliquidity through a combination of repos, export credit refinance,
49
collateralized lending facilities and open market operations.Based on the experience of ILAF, Internal Group of RBIrecommended phased implementation of full-fledged LAF.
4) LIQUIDITY ADJUSTMENT FACILITY: Full-fledged LAF wasintroduced in June 2000. On the recommendations of RBI'sInternal Working Group, RBI revised the LAF scheme in March2004. Subsequently further revision took place in LAF in Oct2004. The revised LAF scheme has the following features:
Aim: The funds are used by banks for their day-to-daymismatches in liquidity.
Instruments used: Reverse repo auctions (for absorption ofliquidity) and repo auctions (for injecting liquidity) are conductedon a daily basis.
Participants: All commercial banks (except RRBs) and primarydealers having current account with RBI.
Minimum Bid Amount: Rs. 5 crore and further in multiples ofRs. 5 crores.
Securities used: The sale and repurchase of securities takesplace in transferable Central Government dated securities andtreasury bills.
Rates: RBI announces the rate of interest on repos and reverserepos from time to time. On July 2, 2010, the repo rate wasincreased to 5.50% from the earlier 5.25%. In the case ofreverse repo, it was increased to 4% from the earlier 3.75%.
Liquidity absorption through reverse repo reached its peak onSeptember 4, 2009 at Rs. 168,215 Crores. It is the singlebiggest factor that helped to manage short-term liquidity andmaintain interest rate stability.
5) MARKET STABILIZATION SCHEME (MSS): On therecommendations of RBI's Internal Working Group in 2004, RBIannounced the launching of MSS and formally signed aMemorandum of Understanding with Govt. The main featuresare:
Implementation Date: MSS is effective from April 2004.
Aim: The main aim is to absorb excess liquidity from thesystem. For this purpose, Government issues securities tobanks.
50
Instruments used: The Government issues dated securities(maturity period of over one year) and/or treasury bills. Thetreasury bills or dated securities issued under MSS are similarto that of existing treasury bills and dates securities. These areeligible for SLR, repo and LAF. The securities are issued by wayof auctions.
Amount of Securities: The Government in consultation withRBI fixes an annual ceiling for securities issued under MSS.This ceiling would hold good till revision is done during thecourse of the year.
When the government issues Treasury Bills and securitiesunder MSS, it has to be matched by an equivalent cash balanceheld by the government in separate cash account, the MSSAccount, maintained and operated by the Reserve Bank.
Check Your Progress:
1. What is market stabilisation scheme (MSS)?2. What is liquidity adjustment facility (LAF)?
4.3 EVALUATION OF RBI’s MONETARY POLICY
1) The monetary policy aims at economic growth. Monetary policyfacilitates provision of credit to various sectors of the economy.Increase in business activities results in economic growth in theeconomy. RBI's monetary policy is responsible for good growthof Indian economy. At present, India has the second highest(after China) rate of GDP growth in the world.
2) The monetary policy has resulted in healthy competition in thebanking sector in India. Deregulation of interest rates hasbrought transparency in banking transactions, and at the sametime generated competition in the banking sector. Due tohealthy competition, the overall efficiency of the banks hasimproved and considerable improvement in customer service.
51
3) It is necessary that the Domestic scheduled commercial banks -both public sector and private sector are required to provide40% of their adjusted net bank credit (ANBC) to priority sector.Foreign banks in India, are required to provide 32% of theirANBC to priority sector. Only Three public sector banks, Fiveprivate sector banks and Four Foreign banks did not achievethe target in 2008-09.
4) Monetary policy has resulted in financial discipline in thebanking sector. The financial discipline is due to the directivesissued by RBI to the banks to ensure financial discipline. Thedirectives are to be strictly followed by commercial banks.
5) RBI's monetary policy has improved the short term liquidityposition in the money market. RBI has introduced variousmeasures to improve short term liquidity in order to maintainstability in interest rates. The various methods adopted by RBIto manage short term liquidity position include: Sterilization to control foreign capital inflows Changes in Repo and Reverse Repo rates. Liquidity Adjustment Facility Introduction of Market Stabilization Scheme.
6) In India, there is a presence of large unorganized money marketin form of money lenders, chit funds, indigenous bankers, etc.Due to the unorganized money market, there is more moneysupply in the economy, which affects the effectiveness ofmonetary policy to control inflation and to increase-economicgrowth.
7) The circulation of black money increases money supply, and assuch RBI's measures to control inflation may get affected.Therefore, the government has to come up with innovative ideasto reduce the circulation of black money in the economy.
8) For effective implementation of monetary policy, there must bestrong banking infrastructure, which is lacking, especially in ruralareas. Therefore, the economic growth in rural areas, includingthat of agriculture is poor.
9) In India, there is preference for cash transactions, especially inthe case of retail trade. The monetary policy mainly focuses onbank credit, and money supply with the banks. Therefore, theeffectiveness of monetary policy is restricted to the bankingsector.
10)RBI finds it difficult to control inflation in the country. Forinstance, WPI inflation in May 2010 was over 10%. RBI makeseffort to control inflation by increasing CRR and repo rate.
52
However, inflation has remained very high in 2009 and first halfof 2010. However, it is to be noted that RBI is alone notresponsible for inflation in the country. For instance, the.inflation on account of food items was due to the failure ofagriculture in 2009 due to drought in several parts of thecountry.
11)Many cases have been reported where some officials of banksare corrupt and inefficient. They do not follow the guidelines ofRBI in respect of lending to brokers, and others. The ceiling onlevel of credit and the margin requirements are not followed.This gives rise to financial scams, and thus the economy getsaffected.
12)Selective credit control measures taken by RBI are moresuccessful in controlling the sector specific inflation. Methodslike credit rationing and differential interest rates are moreeffective under such situations. But, selective methods arebeing phased-out by RBI slowly as preference for generalmethods.
4.4 QUESTIONS
1. What are the objectives of monetary policy in India?2. Explain RBI’s monetary policy after 1999.3. What is short-term liquidity management and explain RBI’s
liquidity management policy.
53
5
MICRO-FINANCE, SELF HELP GROUPSAND COMPOSITE CREDIT
Unit Structure :
5.0 Objectives
5.1 Introduction
5.1.1 Micro Finance Services
5.2 Role and importance of micro finance
5.3 Government initiative towards micro finance
5.4 Self-help groups
5.5 Need for SHGs and importance of SHGS
5.6 Government programmes for self-help groups
5.7 Problems related to SHGs
5.8 Composite loans / composite credit
5.8.1 Government initiatives towards composite loans
5.9 Questions
5.0 OBJECTIVES
To study the concept of micro finance. To understand the role & importance of micro finance. To study government initiatives towards micro finance. To study the concept of Self-help groups. To study the need & importance of SHGs. To study government programmes for SHGs To understand problems related to SHGs. To understand the meaning and concept of composite loan.
5.1 INTRODUCTION
Studies conducted by NABARD independently and inassociation with Self-Help Groups to study rural credit in India inthe early 1980s, showed a dismal performance of rural bankbranches in rural development. Rural bank branches were helpingin creating self-employment by providing bank credit but a largenumber of rural population were not even having access to thebanking system. NABARD came to the conclusion that existing
54
banking policies, procedures and system was not suitable for thelarge number of poor people. So, NABARD recommended newpolicies, procedures and systems to be formulated in order to giveaccess of banking to the Indian poor population. In this way theobjective of Financial Inclusion will be achieved.
Definition of Financial Inclusion: Financial inclusion is processwhereby financial services and adequate credit is provided toweaker sections and low income groups at an affordable cost in atimely manner.
It has been accepted that micro-finance is the mostimportant tool of financial inclusion.
Definition of Micro-Finance: Micro-Finance can be defined asprovision of financial services to poor and low-income clients so asto help them raise their income, thereby improving their standard ofliving.
Micro-Finance and Micro-Credit: There is a huge difference in theterms micro-finance and micro-credit. Micro-Finance includesprovision of multiple services like loans, savings, insurance,transfer services, micro-credit loans etc. Micro-Credit includes smallamount of money given as loan by a bank or any legally registeredinstitution.
INSTITUTIONS ASSOCIATED WITH MICRO FINANCE: Atpresent, banks and financial institutions that are connected withmicro finance include RBI, SIDBI, NABARD, commercial banks,RRBs, cooperative banks, Non Banking Finance Companies(NBFCs) and micro finance Institutions (MFIs).
5.1.1 MICRO FINANCE SERVICES:
Micro finance services are provided through the followingtwo models:
(A)SELF-HELP GROUP – BANK LINKAGE PROGRAMMEMODEL:
Self-Help Group: A self-help group is a rural based financialintermediary. It is a group composed of 10-20 members, usuallylocal women. These groups are supported by Non-GovernmentOrganisations (NGOs) or by Government Agencies. Members ofthe group contribute small savings regularly over a few monthsto collect enough capital which is then used for lending to thegroup members.
55
SBLP: This programme was started by NABARD in 1992.During this period SHGs were directly financed by banks. It isknown as a linkage model because it is based on the strength ofvarious participants i.e. NGOs, Banks and the rural poor people.Under SBLP, three models have been emerged. They are asfollows:
Model 1: SHGs promoted, guided and financed by banks.
Model 2: SHGs promoted by NGOs/Government agencies andfinanced by banks.
Model 3: SHGs promoted by NGOs and financed by banksusing NGOs/formal agencies as financial intermediaries.
Model 3 has emerged as the most popular model underSBLP. Commercial banks, co-operative banks and the RRBshave been actively participating in this programme.
(B)MICRO-FINANCE INSTITUTIONS: Existence of MFIs datesback to ancient times and with changes in times they have alsoadapted to the changes. MFIs include NGOs, trusts, social andeconomic entrepreneurs lend small amount of loans toindividuals or SHGs. They also provide other services such ascapacity building, training, marketing, etc. In India, MFIs exist inthe form of registered trusts, registered societies, registered co-operatives, NBFCs-MFIs which are registered under CompaniesAct, 1956 and NBFC registered with RBI. MFIs operates underthe following two models:
a) Bank-Partnership Model: This includes partnership betweenthe bank and Micro0-Finance Institutions. This model is furtherdivided into:
1) MFI as an Agent: In this model, bank is lender and MFI actsas an agent. MFI handles work relating to monitoring ofcredit, supervision and recovery. MFI takes care of allrelationship with the borrower, from first contact till the finalrepayment.
2) MFI as Holder: In this model, MFI which is a Non-BankingFinancial Company holds the individual loan on its books fora short-period before securitizing and selling them to thebank.
b) Banking-Facilitators/Correspondents Model: In January2006, RBI permitted the banks to use the services of NGOs,MFIs other than NBFCs and other civil society organisations toacts as intermediaries in providing finance and banking services
56
to the poor. These intermediaries are known as businessfacilitators or business correspondents. These intermediariescarry out banking functions in rural areas where it is not possibleto open a branch.
5.2 ROLE AND IMPORTANCE OF MICRO FINANCE
Micro-Finance has indeed become the most of important toolof financial inclusion. During the last two decades the concept ofmicro-finance has been of great significance.
1) Poverty Alleviation: Due to micro finance, poor people getemployment. Employment increases income level which in turnreduces poverty of people to a certain extent. It is provided topoor people living in rural or urban areas.
2) Financial Inclusion: As poor people do not get the advantageof organised banking sector, micro-finance facilitates financialinclusion of weaker sections. Micro-finance links poor people tothe organised banking sector from unorganised sectors. Thisreduces exploitation of poor by money lenders and landlords.
3) Employment Generation: Micro credit and other services aremade available to small entrepreneurs, village artisans, poorpeople, SHGs, etc. The people who get the benefit of microfinance set up small business units, thereby generatingemployment,
4) Economic Growth: Increase in investment results in increasein the production of goods and services. Increase in productionof goods and services increases the GDP of a country. So,micro finance contributes to economic growth in the country.
5) Savings and Investment: Micro finance develops saving habitsamong the people. For instance, the SHGs who get microfinance encourage saving habits among its members. Thefinancial resources generated through savings and micro creditobtained from banks are utilised to provide loans or advances tothe members. The members of the SHG use the financialresources for setting up small business units or for workingcapital of the existing units.
6) Skill Development: Due to micro finance, SHGs encourage itsmembers to set up small business units either jointly orindividually. The small entrepreneurs may also receive trainingfrom supporting institutions or they may learn to develop theirskills by operating small businesses. Small businessmen mayalso learn leadership skills which may be useful for the villagecommunity as a whole, especially in rural areas.
57
7) Social Welfare: Due to employment, the income level of thepeople increases. As a result, people may go for bettereducation, health, family welfare etc. Hence, micro finance isresponsible for the betterment of the society.
8) Empowerment of Women: Normally, 50% of the SHGs areformed by women. The women of a village come together toform SHG. After formation of group, they get micro financefacilities from the banking sector. They are also supported byNGOs. The village women learn to manage the affairs of SHGsand also set up small business, which enables them to save apart of their income. Therefore, micro finance empowers poorwomen economically and socially.
5.3 GOVERNMENT INITIATIVE TOWARDS MICROFINANCE
Many micro-policies and regulations have been introducedby the Reserve Bank of India, NABARD and SIDBI. These policiesand regulations directly affect the functioning of Self-Help Groupsand Micro-Finance Institutions in India. Some of the importantpolicies initiated are as follows:
(A)POLICIES INITIATED BY RBI:
1) Savings Bank Account for SHGs: In 1993, registered andunregistered SHGs were allowed to open savings bankaccount with banks by the RBI.
2) Incentives to bank for financing the SHGs: In October2002, the Reserve Bank of India set up four informal groupsto look into various issues related to micro financeinstitutions. Based on the recommendations of the groups,banks were advised that they should provide adequateincentives to their branches for financing the SHGs.
3) Business Correspondents: In order to examine issuesrelating to rural credit and micro finance, an internal groupwas set up under the chairmanship of H.R. Khan in 2005.Based on the recommendations of the group, banks werepermitted in January 2006 to use the services ofNGOs/SHGs, MFIs (other than NBFCs) and other civilsociety organisations as intermediaries in providing financialand banking services through business facilitator andbusiness correspondent models.
58
4) Interest Rates: The RBI decided that interest ratesapplicable to loans given by banks to microfinanceorganisations or by microfinance organisations to SHGmembers would be decided by the banks and SHGs with nointervention by RBI.
(B)POLICIES INITIATED BY NABARD:
1) Micro-Enterprise Development Programme (MEDP): In2006, NABARD launched the MEDP for skill development ofthe SHG members. For this NABARD conducted severaltraining programmes to improve the capacities of SHGs totake up micro enterprises.
2) Micro-Enterprise Promotion Agency (MEPA): In 2005-06,a pilot project for promotion of micro-enterprises waslaunched by NABARD. This is being implemented by NGOsacting as micro-enterprise promotion agency (MEPA) in ninedistricts. Many micro-enterprises were established underthe project.
3) SHG Federations: In many places, group of SHGrepresentatives have formed Federations. TheseFederations are important for the growth of SHGs becausethey improve the bargaining power of group members.Recognizing the growing role of the SHG Federations, in2007-08, NABARD decided to support them by way of grantassistance for training and capacity building.
4) Committee on Financial Inclusion: Recently NABARDappointed a Committee on Financial Inclusion under theChairmanship of Dr. C. Rangarajan. The Committeesubmitted its final report in January 2008.
Recommendations of the Committee:
Outreach of microfinance programme needs to be expandedfurther.
NBFCs may also be recognized as BusinessCorrespondents of banks for providing only savings &remittance services and also act as insurance agents.
Opening of specialized microfinance branches in urbancenters for the poor.
(C)POLICIES INITIATED BY SIDBI:
1) SIDBI Microfinance Programme: SIDBI launched its microfinance programme in 1994 on a pilot basis. The programmeprovided small doses of credit funds to the NGOs all acrossthe country.

59
2) Finance to NGO/MFI: SIDBI was one of the first institutionsthat identified and recognised NGO/MFI channel for reachingfinancial services to the poor. Today, SIDBI is one of thelargest providers of micro finance through the MFIs.
3) Capacity Assessment Rating: There are no collaterals orsecurities in case of microfinance lending. This makes suchlending risky for banks. In order to reduce such risks, SIDBIstarted the concept of capacity assessment rating (CAR) forthe MFIs.
4) Transformation Loan: SIDBI introduced a product called'transformation loan in 2003 to enable the MFIs to transformthemselves from an informal set up to more formal entities.This loan has longer repayment period and part of the loancan be converted into equity at a later date, when the MFIdecides to convert itself into a corporate entity. A number ofMFIs went ahead with the transformation and some of themhave now grown significantly and are serving millions ofclients.
MICROFINANCE REGULATION: Currently, there are multipleregulatory mechanisms for different entities engaged inmicrofinance. As a result the microfinance sector is experiencingseveral problems. Keeping this in mind, the government hasdecided to regulate the sector through the Micro Financial Sector(Development & Regulation) Bill, 2009. The regulation aims tosafeguard interests of customers and ensure development andorderly growth of the microfinance in rural and urban areas. TheUnion Cabinet is likely to approve the Bill soon.
5.4 SELF-HELP GROUPS
DEFINITION: Self-Help Group is a rural based financialintermediary, usually composed of 10-20 local women. The groupmembers save regularly and convert their savings into a commonfund known as group corpus fund. The group members use thecorpus fund and the other funds which they receive from banks orGovernment and utilised them for employment generation.
Self Help Group is a voluntary association of poor formed with thecommon goal of social and economic empowerment. The mainobjective of the formation of SHG is to generate employment,thereby solving the problem of poverty.
60
FEATURES OF SHGs:
1) Membership and Members: The SHG may consist of 10 to 20persons. But for minor irrigation projects, there is no ceiling onnumber of persons in a group. Normally, members of the groupbelong to Below Poverty Line (BPL) families. However, AbovePoverty Line (APL) persons can be included. But the APLmembers will not be eligible for subsidy from the Government.Normally, APL members comprise of about 20% of the totalmembers.
2) Composition of group: Normally, the group consists of onlyone member from one poor family. A person should be amember of only one group. He cannot be a member of twogroups.
3) Management and Office bearers: The BPL members musttake active interest in the management of the group, and theAPL members of the SHG cannot become office bearers. OnlyBPL members are eligible to become Group Leader, AssistantGroup Leader and Treasurer of the group.
4) Registration: Registration of SHG is optional. This meansSHGs are registered as well as non-registered ones.
5) Services focused: The group members save regularly a part oftheir income and the saved funds are lent to group members.
6) Meetings: There SHG hold regular meetings - weekly orfortnightly.
7) Operation of Accounts and Records: The group operates abank account to deposit the balance amount after disbursingloans to the members. The group maintains simple basicrecords such as minute’s book, attendance register, loan ledger,cash book, bank pass book, and individual pass books.
8) Interest: The members who contribute savings are paid aninterest of 4.25% plus share in profits and interest charged onloan is in the range of 24% - 28%.
9) Size of loan and Insurance: Initial loan size is between Rs.5000 to Rs. 10000. Usually the loan is linked with life or healthinsurance.
The poor people in rural areas are at a disadvantage due tolow literacy, social backwardness, and very low level of income. Apoor person is socially and economically backward and also doesnot have required information and knowledge of today's
61
development process. However, due to formation of a group, someof the problems faced by poor can be removed.
5.5 NEED FOR SHGs and IMPORTANCE OF SHGS
1) Promote Savings: SHGs play a very important role in linkingthe poor people to the banking system by encouraging andmobilising the savings for collective economic development. Itimproves social and economic life of the members of the group.
2) Raising Standard of Living: Removal of poverty is one of themajor objectives of SHG-Bank linkage programme. Investmentmade with the credit provided by SHGs would generate incomeand improve living conditions of the poor, especially in ruralareas.
3) Skill Utilisation and Skill Development: Many rural poor areuneducated. By working as a member of a SHG they developcertain skills. They utilize individual skills for group's interest.Entrepreneurship skills among the poor are developed byproviding them training. It leads to social and economicdevelopment of rural poor.
4) Utilisation of Resources: Under the SBLP, as on March 2009,SHGs held a total savings of Rs. 5545 crores with thebanks. SHGs play a very important role in utilising localresources for the betterment of the members of the group.
5) Awareness and Empowerment: SHGs have been successfulin creating awareness of the rights of the poor people, so thatthey are not exploited by landlords and local politicians. SHGshave also made a number of rural women economically, sociallyand politically empowered.
6) Overcome social and personal problems: SHGs helps toovercome the problem of poverty, especially in rural areas.SHGs also help the group members to understand each othersproblems in a better way.
7) Employment Generation: The members of the group areencouraged to start micro-enterprises. It generates employment,including self-employment. Small rural enterprises reduce theincidence of disguised and seasonal unemployment in ruralareas.
62
5.6 GOVERNMENT PROGRAMMES FOR SELF-HELPGROUPS
The RBI, NABARD, SIDBI and Government of India haveinitiated many programmes in association with SHGs. Some of thehighly successful programmes are:
a) Prime Minister's Rozgar Yojana (PMRY): SHGs areconsidered for financial assistance under PMRY. The SHG mustconsist about 5 to 20 educated unemployed youth. Financialassistance is given to set up self-employment projects. SHGmay undertake common economic activity for which loan issanctioned. Subsidy is provided to the SHG. There is exemptionlimit for providing collateral security against loan, which is Rs. 5lakhs in case of projects under the Industry Sector.
b) Swarnajayanti Gram Swarozgar Yojana (SGSY): The SGSYscheme was launched in 1999. The objective of this scheme isto bring the poor people above the poverty line within 3 years.Financial assistance is given to set up self-employment projects.For the purpose of providing financial assistance, preference isgiven to well functioning SHGs in the villages both under thegroup finance and individual finance.
c) SHG-Bank Linkage Programme: This programme waslaunched in 1992 by NABARD. This was the first time SHGswere directly financed by banks. RBI is encouraging thecommercial banks, cooperative banks and RRBs to implementthe SHG-Bank Linkage Programme. At present, this programmehas emerged as the major micro finance programme in thecountry. Under this programme, as on March 31, 2009 about61,21,147 SHGs held savings bank accounts with total savingsof Rs. 5545 crore.
5.7 PROBLEMS RELATED TO SHGs
In spite of the spread and success of SHGs as agents ofmicrofinance, they experience many problems and suffer frommany drawbacks.
1) Management and Control: It has been observed that manySHGs suffer due to poor management. There is a lack ofinternal control systems in many SHGs and SHG Federations.Internal controls are the systems and processes that are used tomanage day to day operations. Roles and responsibilities ofmembers and office bearers are also not properly defined. Inmany cases, there has been poor management of cash flows aswell.
63
2) Impact on Poverty: Though the SHGs are developed as a toolfor poverty alleviation, they have not made much impact onpoverty in rural areas in all the states. They have provided creditto a very large number of poor people but have not been able tosuccessfully bring them above the poverty line.
3) Unequal Regional Impact: The SHG program has beenpredominant in the Andhra Pradesh, Tamil Nadu, West Bengal,Karnataka, and Uttar Pradesh. Further, among these states theprogram was heavily concentrated in Andhra Pradesh, where40% of credit linkages were established. The model has notbeen able to make much impact in other states.
4) Leadership Problems: A few members dominated in most ofthe SHGs. Many study groups have observed this phenomenon.The educated and well-off leaders dominating the groups aregetting re-elected several times. This is due to the lack ofeducation among other group members.
5) Governance: As these organisations are an informalorganization and a SHG federation is group of informalorganizations it has been observed that there is poorgovernance. The capacity of the members to provide goodgovernance is also weak. The members of SHGs do not havemuch experience with various functions or to observe differentlegal regulations.
6) Dropouts: There are incidences of dropouts from groups. Thedropout rate for the very poor is about 11% and for the non-poorabout 7%. The major causes of dropouts are migration foremployment outside the village, and inability to make regularsavings deposits.
7) Poor Record Keeping: A large number of SHGs groups haveweak record keeping practices. This is due to the informalnature of the groups and lack of education and accounting skillsamong members.
8) Regulation: SGH are governed by multiplicity of regulations fordifferent entities. This makes formation and functioning of SHGsdifficult in many cases. Besides, the interests of group membersare not safeguarded without proper regulations. Micro FinancialSector (Development & Regulation) Bill, 2009 is expected tosort out this problem by making NABARD the single regulatorybody for SHGs.
64
5.8 COMPOSITE LOANS / COMPOSITE CREDIT
Micro and small business enterprises require working capitalas well as fixed capital. Provision of credit by banks and financialinstitutions for working capital and fixed capital of micro and smallenterprises is called as Composite Credit. The Governmentencourages banks to provide composite credit to micro and smallenterprises. The Government has increased the composite loanlimit. In 2000, the composite loan limit was increased from Rs. 10lakhs to Rs. 25 lakhs, which was further increased to Rs. 50 lakhsand in October 2004, the Government increased the compositeloan limit to Rs. 1 Crore. Under the Composite Loan Scheme, theSSI units or entrepreneurs can obtain working capital and term loantogether from a single agency. This scheme is operated by banksand financial institutions. State Financial Corporations under singlewindow scheme provide working capital loan along with term loanto new tiny and small sector units so as to overcome the initialdifficulties and delays faced by them to start production.
INDICATIVE PARAMETERS: The composite loan scheme issubject to the following parameters:
1) Debt-Equity Ratio: The debt equity ratio should be 3:1 in thetotal project outlay (i.e., cost of the project plus working capitalrequirement) after taking in account the amount ofinvestment/subsidy/incentives available for the project.
2) Promoters Contribution: As may be required to arrive at thedebt-equity ratio of 3:1.
3) Margin for Term Loan: All backward areas in the State 25% Other areas and municipal limits of all cities of the State
30%.
4) Repayment: Working Capital: Not exceeding 10 years. Term Loans not exceeding 8 ½ years.
5) Security: The State Financial Corporation will have first chargeon fixed assets and hypothecation of the current assets. SFCmay also ask for collateral security against working capital loan.
5.8.1 GOVERNMENT INITIATIVES TOWARDS COMPOSITELOANS:
1) Credit Guarantee Fund Scheme (CGFS) for Micro and SmallEnterprises was launched by the Government of India to make
65
available collateral-free composite loans to the micro and smallenterprises and to SHGs that have the potential to becomemicro enterprises. Due to the CGFS, financial institutions andbanks are encouraged to lend money under composite creditscheme to micro and small enterprises. Both the existing andthe new enterprises are eligible to be covered under thescheme. To implement the CGFS, The Ministry of MSME andSIDBI established a Trust name Credit Guarantee Fund Trustfor Micro and Small Enterprises. Some important features ofthe Fund Scheme are:
a) Corpus is being contributed by Government of India andSIDBI in ratio of 4:1
b) Scheduled Commercial Banks, select RRBs, National SmallIndustries Corporation Limited, North Easter DevelopmentFinance Corporation Ltd and SIDBI are eligible to lendcomposite loans under the Scheme.
c) Terms loans and working capital facility upto Rs. 50 Lakhextended without any collateral security are eligible underthis scheme.
d) The guarantee cover available under this scheme is 75% ofthe sanctioned credit amount. The guarantee cover isextended to 80% in some special cases like for loans tomicro enterprises upto Rs. 5 Lakh, MSEs operated and/orowned by women, all loans towards the north-easternregion.
e) MSE proposals for an amount of Rs. 9200 Crores have beenapproved for extending loans without any collateral securityor third party guarantee under this scheme.
2) Swarozgar Credit Card Scheme (SCCS) was introduced byGovernment in 2003 to provide adequate composite credit tosmall artisans, handloom weavers, fishermen, serf employedpersons, rickshaw owners, and other micro enterprises andSHGs from the banking system in a cost effective manner. As ofMarch 2009, a total of 9.84 lakhs cards have been issued bybanks involving a credit amount of Rs. 4,007.33 Crores.
3) Composite Credit Scheme for Agriculture Lending (CCSAL)was introduced by Oriental Bank of Commerce. The purpose isto meet credit needs of farmers including those for farmoperations, development of agriculture, etc. and domesticexpenditure. The amount of loan is up to 50% of the value of theland offered as security or Rs. 7.50 lakh whichever is lower. Theterm loan is granted for a period of upto 7 years, and the
66
working capital is in the form of revolving credit. In this scheme,security is required which may be in the form of mortgage ofagriculture land valuing twice the amount of loan andhypothecation of crops.
5.9 QUESTIONS
1. Explain the significance of micro finance.2. What measures are taken to promote micro finance institutions in
India?3. Write a note on Self Help Groups in India.
67
6
Module 3
FINANCIAL MARKETS
(A) MONEY MARKET IN INDIA
Unit Structure :
6.0 Objectives
6.1 Features of Indian Money Market
6.2 Money Market Instruments and Reforms in India since 1991
6.3 Questions
6.0 OBJECTIVES
Understand the concept and importance of money market. Understand the features of money market in India. Understand the various instruments of money market in
India.
Understand the reforms in Indian money market since 1991.
6.1 FEATURES OF INDIAN MONEY MARKET
Money market refers to a market for financial assets that areclose substitutes for money. It is a market of assets that mature inone day to one year. It is not a physical market. It is a wholesalemarket for several instruments and thus is not a single market. Inthis market, the creditworthiness of the borrower is important. Itallows the balancing of the demand and supply of short-run fundsat reasonable rate of interest. The organised money market is thefocal point for the central bank intervention for influencing liquidityand interest rates. It also acts as the link between the short-termand long-term interest rates on financial instruments. The RBI, theDiscount and Finance House of India Ltd. (DFHI), mutual funds,commercial banks, NBFCs, Securities Trading Corporation of India(STCI), public sector undertakings, state governments, and NRIsare important players. The size of this market has considerablyincreased in recent years and a sum equivalent to two percent of
68
the GDP is transacted every day in this market. The following aresome of the features of Indian money market:
1. Segmented Market:The Indian money market is divided into the two segments-
a) the organised market and b) the unorganised market. The formerrefers to the RBI, the scheduled commercial banks (SCBs), andunder financial institutions that operate under the supervision andcontrol of the RBI. The RBI monitors the rates of interest in thissegment. The unorganised segment consists of chit funds,moneylenders, indigenous bankers and others. These are notunder the supervision of the RBI. As a result, the interest rates inthis segment are very high, often more than 100 percent. This leadsto an exploitation of the debtors.
2. Seasonal Variations in the Interest Rates:The Indian money market is characterised by seasonal
variations in the interest rates. During the months of July toNovember, known as the busy season, the interest rates are highbecause of the demand for farm loans. From December to June,when the agricultural demand for fund/loans is low, known as theslack season, the interest rates are low. The Reserve Bank for longhad to announce a credit policy for the busy season, and anotherfor the slack season.
3. Multiple Interest Rates:Due to the segmentation of the money market, there are
different rates for different borrowers and for different users. Thisfeature made the traditional credit controls like bank rate policyredundant in controlling the short-term interest rates.
4. Absence of Bill Market:An important feature of an active money market is the
presence of bill market which allows re-discounting of bills andprovides the central bank with the ability to control the interestrates. In India, there is no sizable bill market. As a result, the role ofbank rate is very limited. Despite its attempts at different times, theReserve Bank could not help in creating an active bill market. As aresult, the ability to influence the interest rates is limited. TheReserve Bank introduced alternative instruments to regulate theinterest rates.
6.2 MONEY MARKET INSTRUMENTS AND REFORMSIN INDIA SINCE 1991
Following are the instruments of the organised moneymarket.
69
A. Call/Notice Market: This is the most import important segmentof the money market dealing with day-to-day trading of surplusfunds of commercial banks. Its maturity varies from a day to afortnight. When money is borrowed/lent for a day it is known as call(overnight) money. When it is borrowed for more than a day up to14 days, it is known as notice money. This is a highly risky andextremely volatile market. Banks use this market to mobilise fundsto meet the CRR requirements and to invest their surplus funds.This market reflects the liquidity condition of the economy andhence the central banks world over use this market to influence theinterest rates to achieve monetary policy objectives. Since August2005, this market is made a purely inter-bank market and only theprimary dealers (PDs) are the non-bank players that are allowed bythe RBI to operate in this market. The total turnover in the callmoney market as on 31 March 2011 was Rs. 22,913 crore. Theinterest rates in the call money varied between 7 to10.6 per cent inrecent period, indicating a certain degree of stability in the financialmarkets.
B. Treasury Bills (TBs): Treasury Bills refers to the short-termgovernment debt and are the most liquid instruments. There arefour types of TBs depending on the maturity. i) 14 day TreasuryBills were issued between 1997 and 2001. These were eligible forrediscounting but were non-transferable. These were not popularinstruments and the outstanding amount varied between Rs. 200crore to Rs. 325 crore. ii) 91-day Treasury Bills were first introducedin 1955 and till April 1, 1997, government used to issue the 91-dayad hoc TBs to obtain funds to finance the monetised deficit of thegovernment from the RBI without any obligation to pay interest.With the introduction of the Ways and Means Advances (WAMAs)in 1997, the ad hoc TBs were abolished. In April 1992, the RBIintroduced the auctioned TBs. The yield on these instruments ismarket determined. The volume of TBs offered for auction isdetermined by the RBI on the basis of the overall liquidity, size ofthe capital inflows, and the repo rate. Since 2001-02, RBI has notsubscribed to the issues of these. The volume of these declinedsteadily after 1997-98, and by March 2006, the outstanding 91-dayTBs were Rs. 16,316 crore. iii) 182 day TBs were first introduced in1987 but were abolished during 1992-99 and further during 2001-05 and were reintroduced since April 2005 since they offer higherreturns and are a popular instrument with the commercial banks. Ason 29 April, 2011, the outstanding 91-day Treasury Bills were equalto Rs. 73,766.5 crore. The 182-day Treasury Bills outstanding were26,750.55 crore in April 2011. The outstanding 364-day TreasuryBills were Rs. 43,456.4 crore in April 2011.Though the yield onthese reduced in recent years, they are a popular money marketinstruments because of their liquidity.
70
C. Commercial Paper: This instrument was introduced in January1990. A commercial paper (CP) is ‘an unsecured short-termpromissory note issued at a discount by credit worthy corporates,primary dealers (PDs) and all-India financial institutions’. They canbe issued by these agencies if the net worth is Rs. 4 cr. and with aP2 ranking. A CP has a maturity between 7-days to one year. Onlya scheduled commercial bank (SCB) can be an Issuing and PayingAgent (IPA). Corporates are allowed to issue CPs up to 100% oftheir working capital limits. Initially most of the CPs was to beissued by manufacturing companies. Now this market is dominatedby leasing and finance companies. SCBs are the major investors inthis instrument. Issuance of CPs is inversely related to the interestrate in the money market. PSBs invest in this instrument onlyduring slack season. During 1990-91 and 2010-11, the total valueof CPs increased from Rs. 65 cr. to Rs. 1,24,991 cr. The interestrate on CPs varied between 6.39 to 12.5 per cent in recent years.This instrument does not have a secondary market and the stampduty to be paid also makes it less attractive.
D. Commercial Bills: A Commercial Bills is a short-term, self-liquidating instrument with low risk. “It is a written instrumentcontaining an unconditional order, signed by the maker, directing topay a certain amount of money only to a particular person, or to thebearer of the instrument”. When these bills are accepted by banks,they are called commercial bills. Maturity of these bills varies from30 to 90 days. In India, a particular type of bills known as ‘hundis’are used. The introduction of derivative usance promissory notes ofdays allowed for multiple re-discounting. In India, the imposition ofstamp duties made these instruments unattractive and so thegovernment abolished stamp duty as a part of money marketreforms. These bills are less popular as cash credit is moreprevalent in India. In order to avoid the misuse of the bills, the RBIdisallowed the re-discounting of service sector bills.
E. Certificates of Deposit: These are introduced in June 1989, inorder to tap the liquidity in the market. The SCBs other than theRRBs, and local area banks, and six financial institutions areallowed to issue the CDs. These are negotiable money marketinstruments and are issued in demat form subject to the overallterm money borrowings of these institutions. These instruments areissued at a discount on face value. The banks use them when thedeposit growth is sluggish and credit demand is high. The minimumsize of a CD is Rs. One lakh and the minimum maturity is 15 days.The banks have to maintain CRR and SLR on the issue of the CDs.They are freely transferable by endorsement and delivery. Noloans/credit can be granted against CDs and the issuing agencycan not buy them back. They are repayable through a ‘CDRedemption Account’ to be maintained by each issuing agency.Though the Discount and Finance House Ltd., provides tow-way
71
quotes, the secondary market for the CDs is still not popular. Afterrapid expansion during 1991-98, this market lost its significance asbanks were having enough liquidity. During 2010-11, theoutstanding CDs were Rs. 4,24,740 cr. and the interest rate variedbetween 9 to 10.6 percent in recent years. It is easy to understandthat the demand for CDs is inversely related to the CPs.
F. Term Money Market: This market deals with funds up to oneyear maturity. This market India deals mostly with maturitiesbetween 90 to 180 days. This market is dominated by IDBI, andother development finance institutions along with EXIM Bank,NABARD, and NHB. This is because; the predominance of cashcredit forces the SCBs to confine to call money market. The SCBsare exempted from the need to maintain CRR and SLR on fundsfrom this market. During 1991 and 2006, the size of funds borrowedfrom this market varied between Rs. 274 cr. to Rs. 1,338 cr.
The introduction of new instruments did improve the depthand spread of the organised money market since 1991. However,in some segments the volumes traded are still very marginal andthus not very significant in terms of monetary policyimplementation. The RBI is following a gradualist approach infacilitating the modernisation of the Indian money market
Check Your Progress:
1. What is call money market?2. What are Certificates of Deposits?3. What is a repo operation?4. How does the reverse repo operation influence the interest
rates?
6.3 QUESTIONS
1. Explain the various features of Indian money market.2. Discuss the various reforms introduced in the Indian money
market since 1991.
72
7
(B) CAPITAL MARKET IN INDIA
Unit Structure :
7.0 Objectives
7.1 Introduction
7.2 Functions of the Capital Market
7.3 Reforms in the Capital Market
7.3.1 Primary Market Reforms
7.3.2 Secondary Market Reforms
7.4 Role of SEBI in the development of Capital Market
7.5 Mutual Funds in India
7.6 Forward, Futures and Commodity Market in India
7.7 Questions
7.0 OBJECTIVES
To understand the nature of capital market.
To understand the significance of capital markets ineconomic development.
To understand the different reforms introduced in capitalmarket in India.
To understand the functions of SEBI.
To understand the functioning and progress of mutualfunds in India.
To understand the nature and working of forward, futuresand commodity markets in India.
7.1 INTRODUCTION
Capital market refers to the market for long-term funds forinvestment purposes. The capital market is the source of funds forcorporates, governments and provides opportunities to savers topark their long-term savings. The capital market comprises of twosegments- the primary and the secondary markets. The primarymarket allows the flow of long-term funds from the surplus sector to
73
governments, corporates, banks and NBFCs. It helps in thecreation of net fixed assets. Initial public offers (IPOs), privateplacements, rights issues, preferential issues are the importantinstruments of the primary market. In recent years, there is aconsiderable widening and deepening of the primary market withPSBs, financial institutions, PSUs, mutual funds entering themarkets as borrowers and the merchant banks, investment andconsulting agencies and registrars to the issues as the managers.The capital mobilised in the primary market by non-governmentpublic limited companies increased from Rs. 7,077.2 crore throughprospectus in1992-93 to Rs. 47,477.5 crore in 2007-08. The rightsissues mobilised Rs. 12,726.2 core in 1992-93 and Rs. 9,370.8core in 2007-08. The secondary market deals with transactions inoutstanding securities, creating liquidity. The recognised stockexchanges, National Stock Exchange (NSE) (1994), Over theCounter Exchange of India (OTCEI) (1992), and the InterconnectedStock Exchange of India (ISE) (1999) are the important players inthe secondary market. This market deals with governmentsecurities, PSB bonds and corporate securities and debtinstruments. This market allows the investors to off load theirequity/debt and gain.
7.2 FUNCTIONS OF THE CAPITAL MARKET
1) The capital market allows to mobilise savings for long-terminvestments. 2) It provides risk capital in the form of equity. 3) Itallows broader ownership of productive assets. 4) It providesliquidity by permitting the sale of the instruments in the secondarymarket. 5) By providing funds on the basis of open bids, it lowersthe cost of funds and helps in better price realisation. 6) In createsinvestor awareness leading to informed choices in making use ofsavings. 7) It lowers the price and market risk of investment byproviding derivative trading, investor protection fund. 8) It improvesthe efficiency of the market by lowering the transaction costs andsettlement timings. 9) It integrates the real and financial sectors,equity and debt instruments, long-terms and short-term funds,private and government sectors, domestic and international funds.
The following factors contributed to the growth of capitalmarket in India: Specialised financial institutions like IDBI, ICICI,IFCI, UTI and the State Finance Corporations (SFCs) led to theprovision of long-term funds. Till 1992, the Controller of CapitalIssues (CCI) regulated the volume of public issues, premia, anddividend payments. With the setting up of SEBI, Securities TradingCorporation of India (STCI) the institutional framework was set upfor these functions to become more transparent and market-determined. Despite the 1991 scandal, people reposed faith in thestock markets and with the SEBI becoming more vigilant, such
74
incidents have become rare. As people realised the opportunitiesfor investment and returns through the stock markets, they startedparking their investible funds in the stock markets. The bankdeposits lost their attraction as a source of long-term investment.The setting up of mutual funds also helped the average investor tobenefit from the stock market boom. The RBI introduced the‘Delivery vs. Payment (DVP) system, to minimise the settlementrisk in securities. With the FIIs allowed to participate in the debtfunds, the Treasury Bill market became buoyant. As the badalasystem was banned, the transactions shifted to the rollingsettlement. From July 2001, government allowed individual stockoptions and index stock options. This has helped in developing thederivative markets. From January 2003, SEBI allowed futurestrading in 41 stocks. Since July 2002, SEBI introduced theElectronic Data Information Filling and Retrieval (EDIFAR) systemfor all firms to file disclosures electronically. All transactions arerecorded to avoid benami transactions in the stock markets.
7.3 REFORMS IN THE CAPITAL MARKET
With the introduction of economic reforms, the need toensure an efficient and orderly capital markets became imminent.As a result, the government introduced various reforms both in theprimary as well as the secondary markets. Most of these reformsare carried out through the mandate of the Securities andExchange Board of India (SEBI).
7.3.1 Primary Market Reforms:
These reforms are based on the concerns about allowingfunds to raise adequate funds at reasonable cost and at the sametime ensuring the protection of investors’ interests in terms of safetyof the funds and the return on them. Some of these reforms are asunder:
1) SEBI was set up in 1988 and is given statutory powers in 1992.SEBI is mandated to ensure investor protection and the orderlydevelopment of the capital market. SEBI oversees the functioningof the merchant banks, mutual funds, portfolio managers, registrarsof an issue, share transfer agents, underwriters and venture capitalfunds (VCFs). With the repelling of Capital Issues (Control) Act1947, SEBI is empowered to supervise the new issue market byproviding guidelines for disclosure and investor protection. Thelisted companies with satisfactory record for filing periodic returnswith stock exchanges are exempted from filing repetitivedisclosures. SEBI also allows the mobilisation of additionalresources also. While underwriting is made optional, except in caseof infrastructure companies, if less than 90 percent of public offer is
75
not subscribed, the company concerned is obliged to repay theentire amount to the investors. Under the new disclosure andinvestor protection (DIP) guidelines, IPOs with five times the size ofpre-issue net worth are allowed only if the company had a record ofprofitability and a net worth of Rs. 1 core in three out of the last 15years. Companies without such a record or an issue beyond fivetimes the pre-issue net worth are allowed to make IPOs onlythrough book-building with 60 percent of the issue is placed withqualified institutional borrowers (QIBs). In such cases, thepreference shares issued to individuals have a lock in period of oneyear. All allocations are to be made only in the demat form and allrefunds should be through electronics clearance system. TheCentral Listing Authority ensures uniform and standard practices forlisting the securities on stock exchanges. From April 2005, retailinvestor is one who applies for securities up to Rs. One lakh and35% of the issue must be allocated to them. The allocation to highnet-worth individuals cannot be more than 15%. Bidding period isfixed at 3-7 working days. The price band/floor price must bedisclosed at least one day before the opening of the bid. Optionalgrading of IPOs b rating agencies is allowed. Also, 5% of the issueis to be allocated to each to MFs and QIBs. In order to promoteinvestor protection, venture capital funds and private equity firmsare barred from selling their stake in a company after its IPO.Further, from March 2003, companies floating IPOs should havenet tangible asters of Rs. 3 core in each of the two preceding twoyears. Of this, not more than 50% should be held in cash/monetaryassets. Companies changing their names must derive a minimumof 50% of the total revenue form the business activity suggested bythe new name. SEBI has emerged as an effective market regulatorby taking steps from time to time to meet the new challenges thatare natural to an emerging economy.
2) The foreign institutional investors (FIIs) are allowed to participatein the capital market subject to a maximum of 49 percent of theequity. This measure helped to integrate the Indian capital marketwith the global capital markets.
3) Indian companies are allowed to raise capital from internationalmarkets through Global Depository Receipts (GDRs), AmericanDepository Receipts (ADRs), Foreign Currency Convertible Bonds(FCCBs) and External Commercial Borrowings (ECBs). Indiancompanies are now permitted to invest the proceeds forADRs/GDRs abroad.
4) Companies asking for IPO will have to demonstrate an ability topay dividend.
5) Companies can now issue debt security without the prior listingof equity. Issues of more than Rs. 100 crore need investmentgrades rating from at least two rating agencies and the promoters
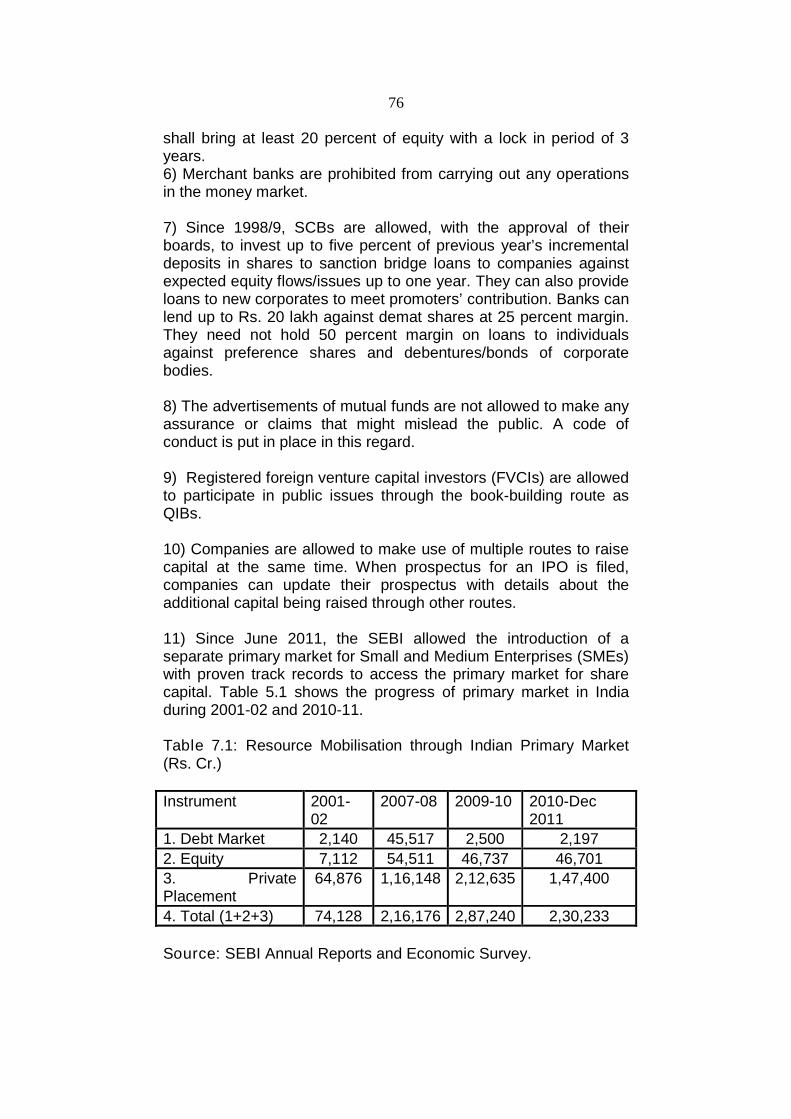
76
shall bring at least 20 percent of equity with a lock in period of 3years.6) Merchant banks are prohibited from carrying out any operationsin the money market.
7) Since 1998/9, SCBs are allowed, with the approval of theirboards, to invest up to five percent of previous year’s incrementaldeposits in shares to sanction bridge loans to companies againstexpected equity flows/issues up to one year. They can also provideloans to new corporates to meet promoters’ contribution. Banks canlend up to Rs. 20 lakh against demat shares at 25 percent margin.They need not hold 50 percent margin on loans to individualsagainst preference shares and debentures/bonds of corporatebodies.
8) The advertisements of mutual funds are not allowed to make anyassurance or claims that might mislead the public. A code ofconduct is put in place in this regard.
9) Registered foreign venture capital investors (FVCIs) are allowedto participate in public issues through the book-building route asQIBs.
10) Companies are allowed to make use of multiple routes to raisecapital at the same time. When prospectus for an IPO is filed,companies can update their prospectus with details about theadditional capital being raised through other routes.
11) Since June 2011, the SEBI allowed the introduction of aseparate primary market for Small and Medium Enterprises (SMEs)with proven track records to access the primary market for sharecapital. Table 5.1 shows the progress of primary market in Indiaduring 2001-02 and 2010-11.
Table 7.1: Resource Mobilisation through Indian Primary Market(Rs. Cr.)
Instrument 2001-02
2007-08 2009-10 2010-Dec2011
1. Debt Market 2,140 45,517 2,500 2,197
2. Equity 7,112 54,511 46,737 46,701
3. PrivatePlacement
64,876 1,16,148 2,12,635 1,47,400
4. Total (1+2+3) 74,128 2,16,176 2,87,240 2,30,233
Source: SEBI Annual Reports and Economic Survey.
77
It can be seen from the above table that most of the funds inthe primary market are mobilised through the private placementchannel. This indicates a lack of diversity of investors and needs tobe addressed effectively.
7.3.2 SECONDARY MARKET REFORMS
These reforms are based on the concerns of investorprotection and ensuring adequate liquidity in the markets. The 1991Securities Scam (Harshad Mehta Scam) and the 2001 Scam(Ketan Parekh Scam) involving the co-operative bank fromAhmedabad. Some of these reforms are as under:1) All stock exchanges in the country introduced on line screenbased electronic trading.
2) With effect from April 1, 2003, a uniform T+2 settlement systemwas introduced in all the stock exchanges.
3) Settlement guarantee funds (SGFs) are introduced to meetshortfalls in settlement of obligations by members of the stockexchanges. The National Securities Clearance Corporation (NSCC)acts as counter-party to all trade in the capital market segment ofNSE.
4) To enhance investor protection, all securities are dematerialised.The National Securities Depository Ltd. (NSDL) (1996) and theCentral Depository Services Ltd. (CDSL) (1999) ensures that allactively trades securities are held, traded and settled in dematform. From November 2001, a mandatory client code is introduced.Except in case of infrastructure companies, 25% of floating stockmust be continuously listed. The listing requirements arestandardised to all stock exchanges. From July 2001, a 99% valueat risk (VaR) based margin system for all scrips in rolling settlementwere introduced. In October 2001, an investor education andprotection fund (IEPF) was set up to create awareness amongstinvestors and protection of their interests. Brokers have to declareall trading which account for 70.5% of equity shares of a listedcompany. Every intermediary is allocated a unique identificationnumber to promote up to date information about all marketparticipants.
5) Given the dominance of mutual funds in the capital market, auniform cut-off time for calculating and applying NAVs is prescribedfor them. The minimum number of investors in a scheme is alsoprescribed. No single investor should hold more than 25% of thefunds in any scheme/plan. The roles of CEOs and fund managersof mutual funds are clearly defined.
78
6) The depositories/depositor participants (DPs) cannot levy anycharges when securities are transferred to another branch/DP ofthe same depository or another depository by an account holder.
7) SEBI introduced norms about corporate governance for all listedcompanies to promote commitment to values, ethical businessconduct and a high degree of transparency. Restrictions are placedon insider trading and hostile bids. Cross-deals, private off-marketdeals in shares and corporate debt are banned. Failure to complywith these would entail delisting.
8) All listed companies should announce quarterly results. All listedcompanies must publish the number of investor complaintsreceived, disposed of, and unresolved along with quarterly results.Companies are allowed to buy back up to 25% of the paid-upcapital and free reserves for capital restructuring. SEBI can delist acompany when it is satisfied about the company’s performance interms of losses, vanishing from the market, providing false address,not complying with the disclosure norms.
9) Boards of all stock exchanges are made broad-based torepresent the interests of different stake-holders.
10) FIIs and NRIs are allowed invest in all exchange-tradedderivative contracts and stock brokers are allowed to trade incommodity derivatives. FIIs are also permitted to participate indelisting offers, sponsored ADR/GDR programmes anddisinvestment by the government in listed companies.
11) Trading in futures and options is allowed. Interest rate futurescontracts and futures and options contracts on sectoral indiceswere introduced in June and August 2003 respectively.
12) From November 2005, BSE and NSE activated separatewindow for execution of large trades without impacting the market.
7.4 ROLE OF SEBI IN THE DEVELOPMENT OFCAPITAL MARKET
SEBI was setup in 1988 and became statutory in 1992. TheSEBI is mandated to perform the following functions:
a. Perform the functions of the CCI.
b. Regulate the stock market and other securities markets forhealthy growth of the market.
c. Register and regulate the working of stockbrokers and otherintermediaries in the securities market.
79
d. Register and regulate the working of financial institutions,including the mutual funds operating in the market.
e. Promote and regulate self-regulatory organisations.
f. Prohibit insider-trading and other unfair practices in the capitalmarkets.
g. Educate the investors and train the intermediaries operating inthe market.
h. Regulate acquisitions and take-over bids for the companies.
i. Conduct research and publish about the working of the capitalmarket.
To perform these functions, SEBI is given wide-rangingpowers like the supervision of the mutual funds, conduct annualinspection of stock exchanges, regulation of new issues, registerand regulate the intermediaries in the capital markets. So far, theworking of SEBI has been mixed, but it has succeeded largely.
The capital markets have seen significant increase since theestablishment of SEBI. The success rate in solving investors’complaints is claimed to be 83.8%. It played a very important role ineliminating the ‘badala’ system and has successfully placed a‘rolling settlement’ system. SEBI introduced certified trainingprogrammes for the training of brokers and a code of conduct forthe brokers. The brokers are prohibited from inclusion on themanaging committees of the stock markets. It has made itmandatory for all merchant bankers to adhere to the capitaladequacy norms and the code of conduct laid by it. SEBI allowedthe free pricing of shares, subject to credit rating. It also removedrestrictions on promoter’s contribution and under-writing. SEBIintroduced measures to curb insider-trading. It has allowed liberalaccess of markets to infrastructure firms.
However, it is generally felt that SEBI takes the side of thecorporates and neglects the interests of the investors. There is toomuch of discretionary powers vested with the officials of SEBI andso their working is often considered arbitrary. SEBI has been oftenhesitant to take action against big brokers or allowed them tofunction even when it was aware of the malpractices. It has failed toprevent speculation and unfair trade in the market.
7.5 MUTUAL FUNDS IN INDIA
The rationale for mutual funds arises from the fact that thecapital market provides the highest rate of return in the long-run.Mutual Funds are financial institutions that mobilise the savings ofsmall investors and invests them on their behalf in equity markets.
80
They have the expertise to invest in a well-balanced, well-diversified portfolio of stocks. Since the individual small investormay not have the resources, knowledge, skill, experience and thetime to directly access the capital market, the mutual funds help toreduce risk and earn a higher rate of return to the individualinvestors. The mutual funds sell units to the investors and the fundsare invested in the equity markets. Some of the schemes are openfor investors to enter at any time. Such are known as open-endedscheme. In case of others, the entry is open for a limited period oftime. Such schemes are known as closed scheme. The Unit Trustof India (UTI) was the first mutual fund to be set up in 1964. In1987, the government allowed public sector banks and financialinstitutions to foal their own mutual funds. Further liberalisation sawthe private operators also entering with mutual funds. By 2004,more than 37 institutions with 300 schemes are operating.
However, the progress of mutual funds in India has not beeneven. During 1993-94, and 1995-97 there was a sharp decline inthe investments in the mutual funds. Lack of transparency, delaysin refunds, poor accountability and lack of efficient services havebeen the main problems in the progress of mutual funds in India.The problems in the UTI, bearish sentiments in the capital marketare the main factors that determine the funds available to themutual funds. Tax incentives given in 1999-2000 encouragedinvestments to some extent. In India, less than 5 percent of GDP isinvested in the mutual funds while in many countries, including thedeveloping countries, this is as high as 35 percent. Since the ruralareas remain unserviced, the size of the mutual funds remainslimited to the urban areas. Most of the funds of mutual funds areinvested in the money market instruments. Thus, instead ofproviding opportunities in long-term investment, they are confinedto short-term opportunities. Given the large number of funds, thereis often confusion in the investors about the relative merits of thevarious schemes and this results in withdrawals as well. It isgenerally felt that there is no effective monitoring of the mutualfunds. Table 5.2 shows the progress of mutual funds in India during2000-01 and 2010-11. In fact, during 2008-09, there was a netoutflow of Rs. 28,296 crore from the mutual funds. This is attributedto the global financial crisis, the pessimism in the stock marketsand other factors.
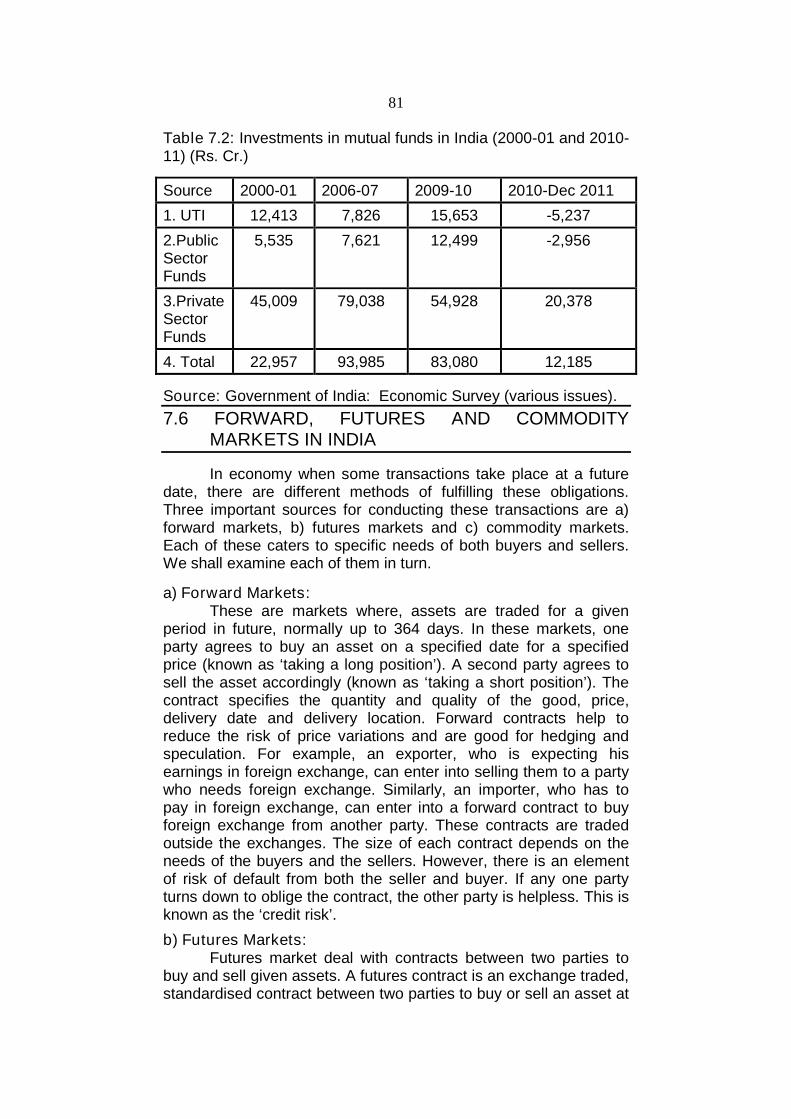
81
Table 7.2: Investments in mutual funds in India (2000-01 and 2010-11) (Rs. Cr.)
Source 2000-01 2006-07 2009-10 2010-Dec 2011
1. UTI 12,413 7,826 15,653 -5,237
2.PublicSectorFunds
5,535 7,621 12,499 -2,956
3.PrivateSectorFunds
45,009 79,038 54,928 20,378
4. Total 22,957 93,985 83,080 12,185
Source: Government of India: Economic Survey (various issues).
7.6 FORWARD, FUTURES AND COMMODITYMARKETS IN INDIA
In economy when some transactions take place at a futuredate, there are different methods of fulfilling these obligations.Three important sources for conducting these transactions are a)forward markets, b) futures markets and c) commodity markets.Each of these caters to specific needs of both buyers and sellers.We shall examine each of them in turn.
a) Forward Markets:These are markets where, assets are traded for a given
period in future, normally up to 364 days. In these markets, oneparty agrees to buy an asset on a specified date for a specifiedprice (known as ‘taking a long position’). A second party agrees tosell the asset accordingly (known as ‘taking a short position’). Thecontract specifies the quantity and quality of the good, price,delivery date and delivery location. Forward contracts help toreduce the risk of price variations and are good for hedging andspeculation. For example, an exporter, who is expecting hisearnings in foreign exchange, can enter into selling them to a partywho needs foreign exchange. Similarly, an importer, who has topay in foreign exchange, can enter into a forward contract to buyforeign exchange from another party. These contracts are tradedoutside the exchanges. The size of each contract depends on theneeds of the buyers and the sellers. However, there is an elementof risk of default from both the seller and buyer. If any one partyturns down to oblige the contract, the other party is helpless. This isknown as the ‘credit risk’.
b) Futures Markets:Futures market deal with contracts between two parties to
buy and sell given assets. A futures contract is an exchange traded,standardised contract between two parties to buy or sell an asset at
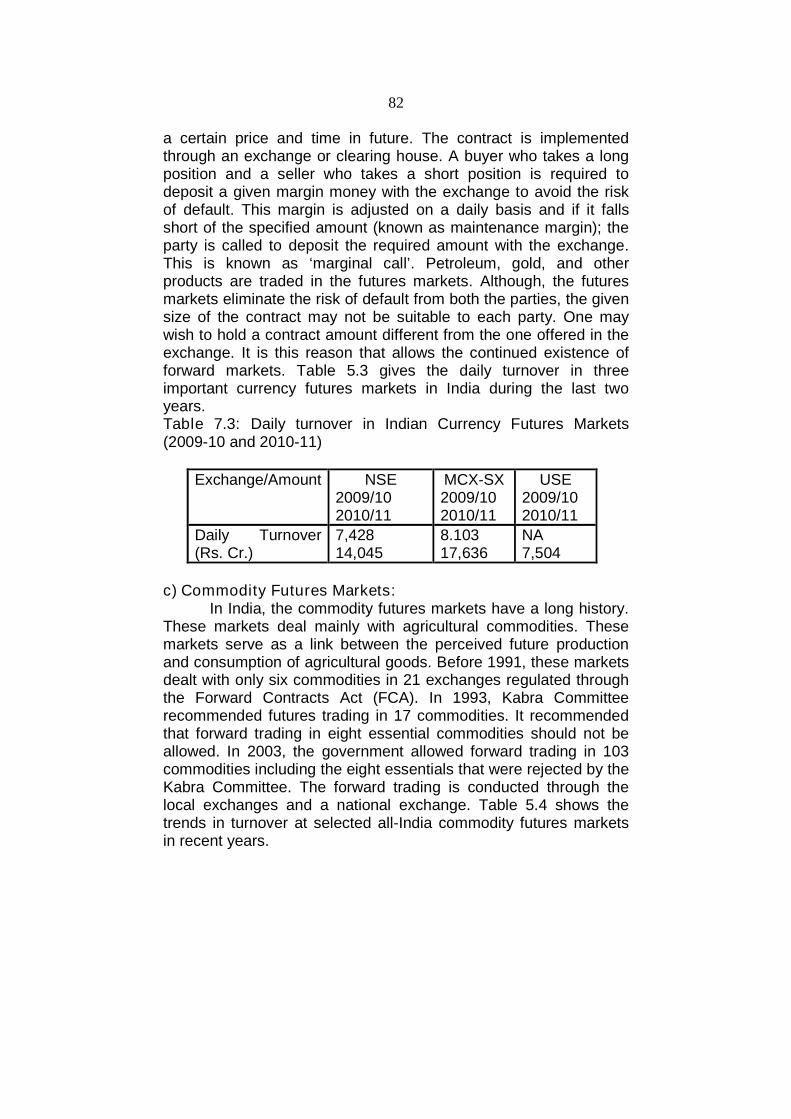
82
a certain price and time in future. The contract is implementedthrough an exchange or clearing house. A buyer who takes a longposition and a seller who takes a short position is required todeposit a given margin money with the exchange to avoid the riskof default. This margin is adjusted on a daily basis and if it fallsshort of the specified amount (known as maintenance margin); theparty is called to deposit the required amount with the exchange.This is known as ‘marginal call’. Petroleum, gold, and otherproducts are traded in the futures markets. Although, the futuresmarkets eliminate the risk of default from both the parties, the givensize of the contract may not be suitable to each party. One maywish to hold a contract amount different from the one offered in theexchange. It is this reason that allows the continued existence offorward markets. Table 5.3 gives the daily turnover in threeimportant currency futures markets in India during the last twoyears.Table 7.3: Daily turnover in Indian Currency Futures Markets(2009-10 and 2010-11)
Exchange/Amount NSE2009/102010/11
MCX-SX2009/102010/11
USE2009/102010/11
Daily Turnover(Rs. Cr.)
7,42814,045
8.10317,636
NA7,504
c) Commodity Futures Markets:In India, the commodity futures markets have a long history.
These markets deal mainly with agricultural commodities. Thesemarkets serve as a link between the perceived future productionand consumption of agricultural goods. Before 1991, these marketsdealt with only six commodities in 21 exchanges regulated throughthe Forward Contracts Act (FCA). In 1993, Kabra Committeerecommended futures trading in 17 commodities. It recommendedthat forward trading in eight essential commodities should not beallowed. In 2003, the government allowed forward trading in 103commodities including the eight essentials that were rejected by theKabra Committee. The forward trading is conducted through thelocal exchanges and a national exchange. Table 5.4 shows thetrends in turnover at selected all-India commodity futures marketsin recent years.
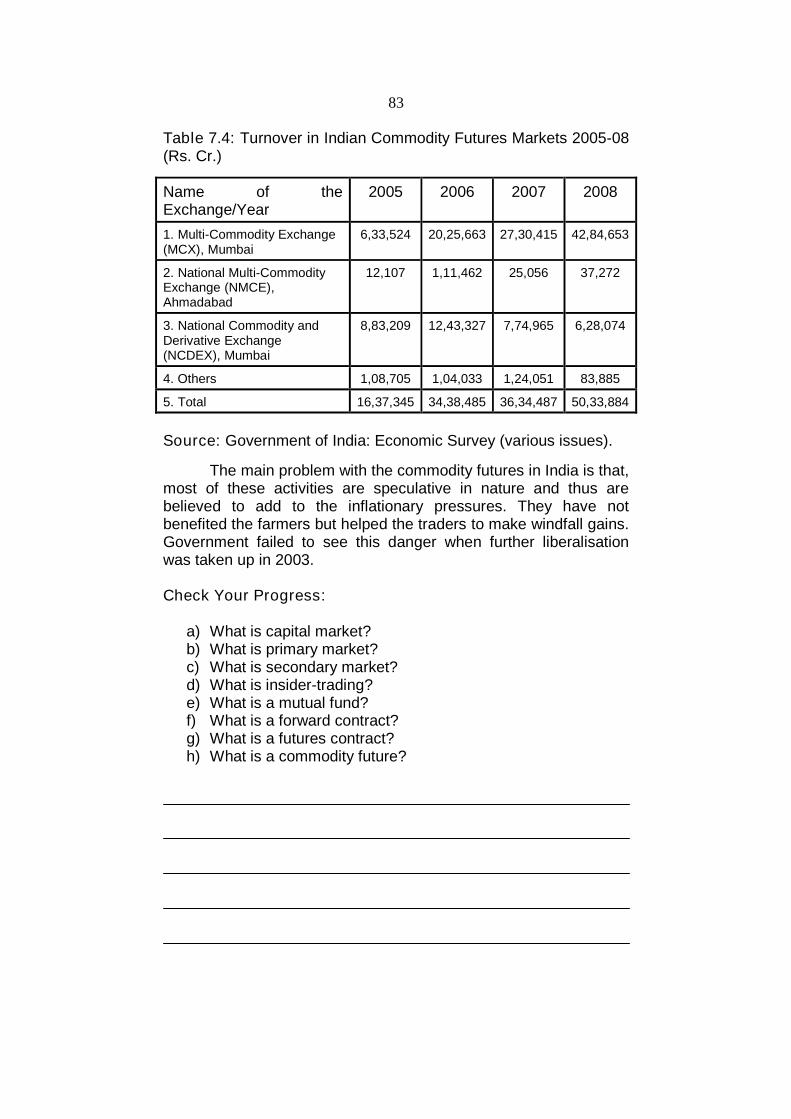
83
Table 7.4: Turnover in Indian Commodity Futures Markets 2005-08(Rs. Cr.)
Name of theExchange/Year
2005 2006 2007 2008
1. Multi-Commodity Exchange(MCX), Mumbai
6,33,524 20,25,663 27,30,415 42,84,653
2. National Multi-CommodityExchange (NMCE),Ahmadabad
12,107 1,11,462 25,056 37,272
3. National Commodity andDerivative Exchange(NCDEX), Mumbai
8,83,209 12,43,327 7,74,965 6,28,074
4. Others 1,08,705 1,04,033 1,24,051 83,885
5. Total 16,37,345 34,38,485 36,34,487 50,33,884
Source: Government of India: Economic Survey (various issues).
The main problem with the commodity futures in India is that,most of these activities are speculative in nature and thus arebelieved to add to the inflationary pressures. They have notbenefited the farmers but helped the traders to make windfall gains.Government failed to see this danger when further liberalisationwas taken up in 2003.
Check Your Progress:
a) What is capital market?b) What is primary market?c) What is secondary market?d) What is insider-trading?e) What is a mutual fund?f) What is a forward contract?g) What is a futures contract?h) What is a commodity future?
84
7.7 QUESTIONS
1. Explain the role of capital market in a country’s economicdevelopment.
2. Discuss the various reforms in the Indian capital market since1991.
3. Explain the primary market reforms in India since 1991.4. Examine the nature of reforms in the secondary capital market
in India.5. Examine the role of SEBI in the development of Indian capital
market.6. Examine the role of mutual funds in India.7. Write a note on forward, futures and commodity markets in
India.
85
8
Module 4
PUBLIC FINANCECHANGING TRENDS IN TAX AND NON-
TAX REVENUE IN INDIA
Unit Structure :
8.0 Objectives
8.1 Introduction
8.2 Sources of Public Revenue
8.3 Changing Trends in Tax and Non-tax Revenue in India
8.4 Questions
8.0 OBJECTIVES
Understand the nature of public finance.
Understand the nature of tax and non-tax revenue to thegovernment.
Understand the trends in tax revenue in India.
8.1 INTRODUCTION
Public finance is one of the important branches ofeconomics. It is the study of the financial operations of the centraland state government. According to H. Dalton, ‘Public finance is thestudy of income and expenditure of public authorities.’ Publicfinance broadly implies the various activities undertaken by thepublic authorities regarding- raising resources of funds, their properutilization and achieving various objectives namely, rapid economicdevelopment, full employment, price stability, equitable distributionof income etc. The subject matter of public finance includes publicrevenue, public expenditure, and public debt.
In developed countries, public finance is used to maintaineconomic stability through the control of inflation and recession. Indeveloping countries, the role of public finance is different from thatin developed countries. In such countries, public expenditure isdirected towards economic development and public revenue, as asource of financing the development activities.
86
8.2 SOURCES OF PUBLIC REVENUE
The income of the government from all possible sources iscalled as public revenue. Different economists have offereddifferent classification of public revenue. Among them theclassification offered by Adam Smith, Seligmen and Bastable arewell known. Based on some classifications the various sources ofpublic revenue are divided into two groups- A) Tax Revenue and B)Non-tax Revenue.
A) Tax Revenue- The revenue from taxes is called tax revenue.Tax is the most important source of revenue to the government. ‘Atax is a compulsory contribution made by the citizens of a countryto the government without expecting any benefits.’
Tax is required to meet its general expenses incurred in thecommon interest of all. These expenses are incurred with anycorresponding benefits to the taxpayers. There are two types oftaxes- i) Direct taxes and ii) Indirect taxes. Personal income tax,corporate tax, capital gain tax, wealth tax, gift tax etc. are calleddirect taxes. Sales tax, excise duty, custom duty etc., are calledindirect taxes. Taxation has been considered to be an importantsource of raising revenue. However, at present, it is also used as ameans to achieve various objectives of society. The importantcharacteristics are-
1. Tax is a compulsory payment; every citizen is legally bound topay.
2. If any person does not pay the tax, he can be punished by thegovernment.
3. There is no direct quid- pro- quo between taxpayers and thegovernment.
4. Tax is imposed on income, goods, and services.
Progressive taxes help to reduce the inequality of incomeand wealth. Taxation affects production, consumption anddistribution. It can be used as an effective instrument to achieveprice stability.
B) Non-tax Revenue: The revenue obtained by the governmentfrom sources other than tax is called as non- tax revenue. Theymay be classified as-
1. Administrative Revenue2. Profit of Public Enterprises and3. Gifts and Grants.
87
1. Administrative Revenue:- Government gets revenue from thepublic for administrative work in the form of fees, fines andpenalties, special assessment.
i) Fees: - Fee is the government for providing certain services tothe people for e.g. court fee, license fee etc, and charges Fees.Generally, fees are charged to recover the cost of services. Thosecitizens who make use of certain special services by thegovernment pay fee. There is always a definite relationshipbetween the fee paid and the benefits received by the citizens.However, there is no relationship between tax paid and benefitsreceived by the taxpayers. Unlike tax, there is no compulsion incase of fee. Fees are an important source of non-tax revenue to thegovernment.
ii) Fines and penalties: - Fines and penalties are levied onoffenders of laws as a punishment. The main objective of thegovernment is not to earn income but to prevent the offending oflaws. Hence, they are an insignificant source of revenue. Fines andpenalties are arbitrarily determined. They are not related togovernment activities. Like taxes, fines are compulsory paymentwithout quid-pro-quo. They are not expected to be a major sourceof revenue to the government.
iii) Special assessment: - A special type of compulsorycontribution made by the citizens of a particular locality in exchangefor certain special facilities given to them by the authorities isknown as special assessment. For example, if the municipalcorporation in a city builds ‘pucca’ road or makes arrangement forthe supply of electricity and water in particular locality, the value ofproperty in that locality will inevitably go up. Therefore, themunicipal corporation can levy a special tax on the residents inproportion to the increase in the value of the property, to cover apart of the cost of facilities. There is quid-pro-quo between thespecial taxpayer and the local public authority.
2) Profits of public enterprises: - Almost all countries have publicenterprise involved in commercial activities. The profits of theseenterprises are an important source of non-tax revenue to thegovernment. The revenue collected in the form of profits is largelyinfluenced by the manner in which the government determines theprices of goods and services it sells. When state has an absolutemonopoly high prices are charged. There is quid-pro-quo.
3) Gifts and grants: -Gifts are voluntary contributions made byindividuals or NGOs to the government. This is done for a specificpurpose such as relief fund, war fund, draught fund, earthquakefund etc. The volume of gifts is normally small.
88
Grant refers to the funds provided by the central governmentto a state government for undertaking special activities. Stategovernments also provide grants to the local government to carryout their functions. Grant from foreign countries is known as foreignaid. Developing countries receive military aid, food aid, economicand technical aid etc. from developed countries. Such grants arenormally conditional. They constitute insignificant source of revenueto the government. In short, mainly tax and non-tax sources areways and means of government revenue.
B. Direct and Indirect Taxes:
There are two types of taxes in India. They are classified as-1) Direct taxes and 2) Indirect taxes.
1) Direct Taxes: - ‘A direct tax is one which is paid by a person onwhom it is legally imposed and the money burden of can not beshifted to any other person.’ The impact (means initial burden) andthe incidence (means ultimate or final money burden) of a direct taxare on the same person. Direct taxes are imposed on the incomeand wealth of individuals and organizations. Personal income tax,corporate tax, wealth tax, capital gain tax, gift tax etc. are importanttypes of direct tax.
2) Indirect Taxes: - ‘An indirect tax is one in which a tax is legallyimposed on one person but the money burden of the tax is shiftedto other person (final consumer).’ The tax payer is not the taxbearer. The impact and incidence of indirect tax lies on differentpersons. The impact of indirect tax is on the person on whom it islevied but the incidence of indirect tax is on the person on whommoney burden falls. Sales tax, excise duty, custom duty, VAT,Octroi etc. are important types of indirect taxes.
Check Your Progress:
1. What are the different sources of public revenue?2. What is a tax?3. How does tax revenue differ from other sources of public
revenue?
89
8.3 CHANGING TRENDS IN TAX AND NON-TAXREVENUE IN INDIA
Broadly, the budgets of the central government give acomplete picture of changing trends in tax and non-tax revenue inIndia. The government raises revenue from tax and non-taxsources. The changing trends in tax and non-tax revenue in Indiacan be explained as under.
A) Tax Revenue: -India has well developed tax structure. The power to impose
taxes and duties is distributed between the central and stategovernments and local bodies. Central government imposes taxeslike income tax, corporate tax, wealth tax, gift tax, custom duties,and central excise duty and service tax.
Sales tax, VAT, state excise duty, stamp duty, land revenueetc. are levied by state governments. And local bodies levy taxeslike Octroi, property tax etc.
Since 1991, the Indian tax structure and system both haveundergone several reforms. Tax reform committees like Chelliahand Kelkar were appointed by the government to reform the taxstructure. These committees were made number ofrecommendations. As per recommendations several reforms likereduction in rates of all taxes, broaden the base of taxes,simplification of laws and procedures, modernization of theadministrative and enforcement machinery have been introducedby government. Following are some of the important trends in taxrevenue in India.
1. Trends in Gross Tax Revenue and Tax-GDP Ratio: -
A revenue receipt from direct and indirect taxes hasincreased significantly during 1990-91 to 2009-10. This is mainlybecause of reduction in tax rates, simplification of tax procedureand high growth rate of GDP. Though tax revenue of thegovernment has increased, the tax-GDP ratio has remained moreor less stable since 1991. India’s tax-GDP ratio is very low ascompared to other developed and developing countries of theworld. Negligible tax contribution from the agricultural sector andnumerous tax exemptions are some of causes for the low taxrevenue-GDP ratio in India.
90
Table No.8.1 Trends in tax revenue and GDP ratio
Year Tax revenue % of GDP
1990-91 57,576 10.1
2009-10 6,41,979 10.4
Source: Economic surveys
2. Relative Share of Direct and Indirect Taxes: -
The relative share of direct taxes in total tax revenue hasalso undergone significant change since 1991. It indicates that theshare of direct taxes has been increasing on the one hand and theshare of indirect taxes has been declining on the other hand. This isa positive and welcome trend in Indian economy. The growingshare of direct tax is largely due to the increase in share ofcorporate tax. This is shown in the following table.
Table No.8.2 Changing Shares of Direct and Indirect Taxes
Year Direct Taxes Indirect Taxes
1990-91 19.1 80.9
2009-10 57.7 42.3
Source: Economic surveys
3. Trends in Direct Taxes:-The share of direct taxes in total tax revenue increased
considerably from 19.1% to 57.7%. This trend is mainly because ofreduction in rates of all direct taxes and increase in per capitaincome of the people. The direct tax code is also introduced by thegovernment which is expected to bring radical changes in directtaxes.♣ Important Direct Taxes-
a) Corporate Tax: - Refers to a tax levied on the profits ofcompanies. Domestic companies are taxed at the rate of 30% butfor foreign companies, the tax rate depends upon different factors.Corporate tax is the most important direct tax in terms of revenue.The share of this tax in total tax revenue has increased significantlysince 1991. This is mainly because of growing profits of corporatecompanies.
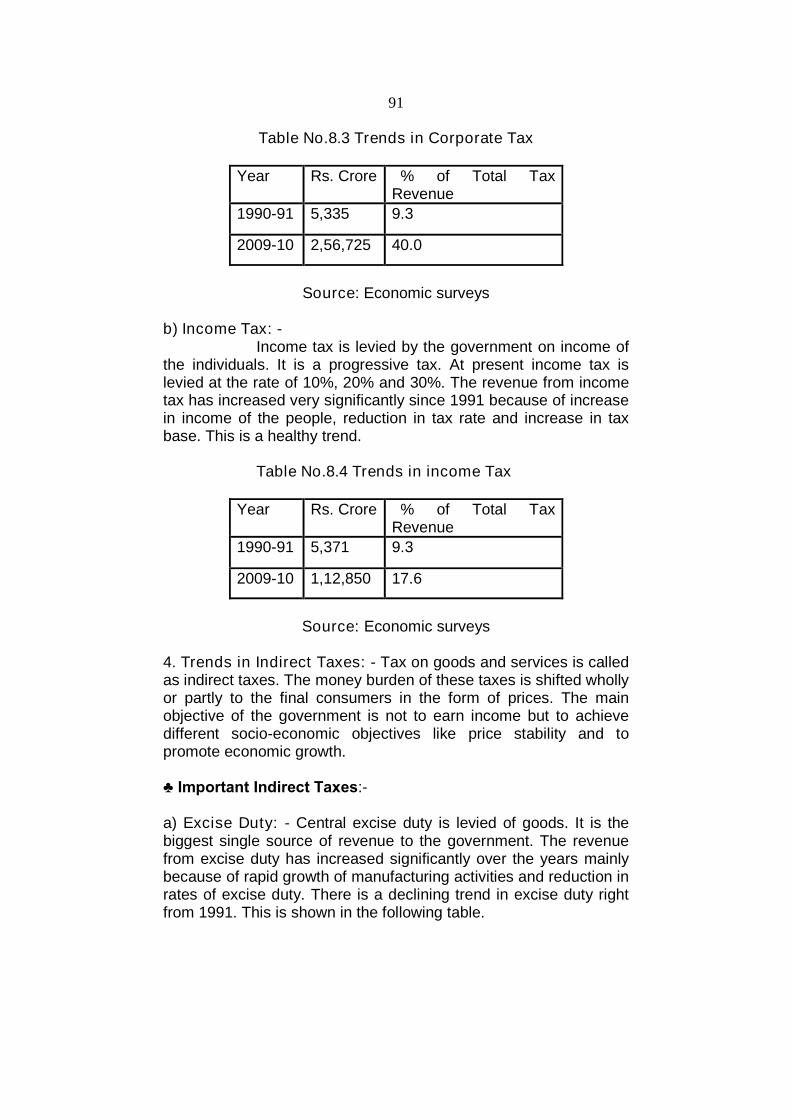
91
Table No.8.3 Trends in Corporate Tax
Year Rs. Crore % of Total TaxRevenue
1990-91 5,335 9.3
2009-10 2,56,725 40.0
Source: Economic surveys
b) Income Tax: -Income tax is levied by the government on income of
the individuals. It is a progressive tax. At present income tax islevied at the rate of 10%, 20% and 30%. The revenue from incometax has increased very significantly since 1991 because of increasein income of the people, reduction in tax rate and increase in taxbase. This is a healthy trend.
Table No.8.4 Trends in income Tax
Year Rs. Crore % of Total TaxRevenue
1990-91 5,371 9.3
2009-10 1,12,850 17.6
Source: Economic surveys
4. Trends in Indirect Taxes: - Tax on goods and services is calledas indirect taxes. The money burden of these taxes is shifted whollyor partly to the final consumers in the form of prices. The mainobjective of the government is not to earn income but to achievedifferent socio-economic objectives like price stability and topromote economic growth.
♣ Important Indirect Taxes:-
a) Excise Duty: - Central excise duty is levied of goods. It is thebiggest single source of revenue to the government. The revenuefrom excise duty has increased significantly over the years mainlybecause of rapid growth of manufacturing activities and reduction inrates of excise duty. There is a declining trend in excise duty rightfrom 1991. This is shown in the following table.
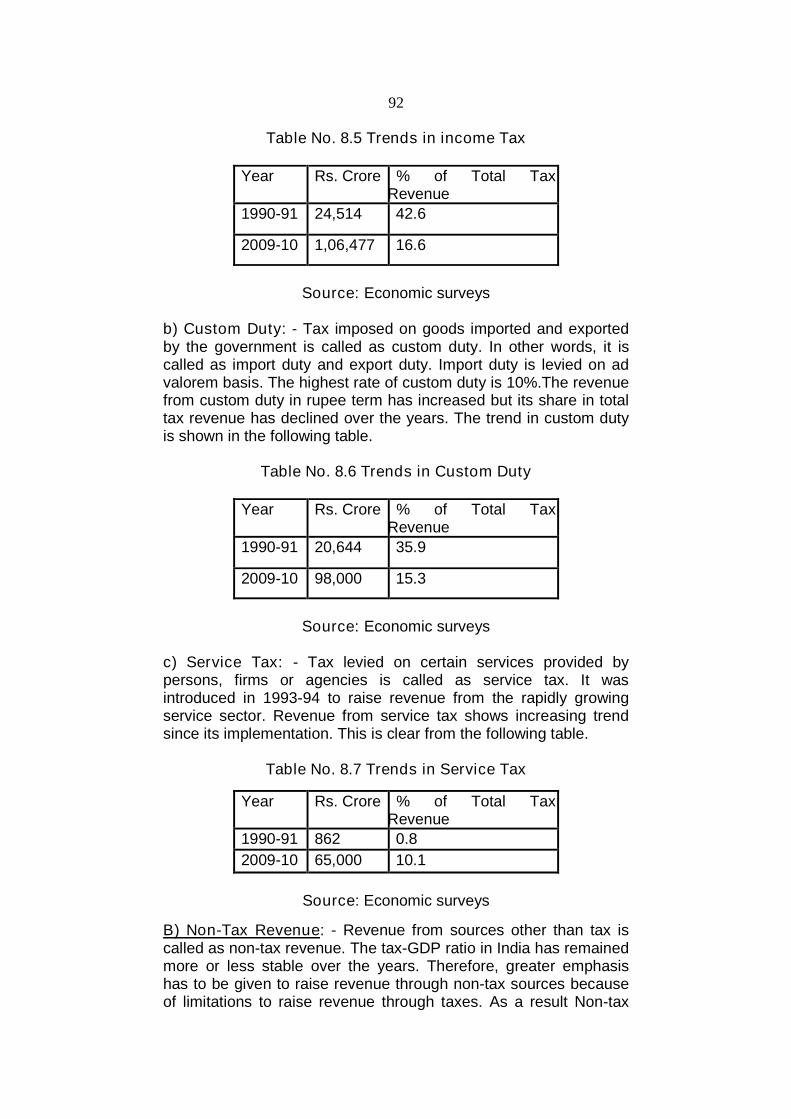
92
Table No. 8.5 Trends in income Tax
Year Rs. Crore % of Total TaxRevenue
1990-91 24,514 42.6
2009-10 1,06,477 16.6
Source: Economic surveys
b) Custom Duty: - Tax imposed on goods imported and exportedby the government is called as custom duty. In other words, it iscalled as import duty and export duty. Import duty is levied on advalorem basis. The highest rate of custom duty is 10%.The revenuefrom custom duty in rupee term has increased but its share in totaltax revenue has declined over the years. The trend in custom dutyis shown in the following table.
Table No. 8.6 Trends in Custom Duty
Year Rs. Crore % of Total TaxRevenue
1990-91 20,644 35.9
2009-10 98,000 15.3
Source: Economic surveys
c) Service Tax: - Tax levied on certain services provided bypersons, firms or agencies is called as service tax. It wasintroduced in 1993-94 to raise revenue from the rapidly growingservice sector. Revenue from service tax shows increasing trendsince its implementation. This is clear from the following table.
Table No. 8.7 Trends in Service Tax
Year Rs. Crore % of Total TaxRevenue
1990-91 862 0.8
2009-10 65,000 10.1
Source: Economic surveys
B) Non-Tax Revenue: - Revenue from sources other than tax iscalled as non-tax revenue. The tax-GDP ratio in India has remainedmore or less stable over the years. Therefore, greater emphasishas to be given to raise revenue through non-tax sources becauseof limitations to raise revenue through taxes. As a result Non-tax
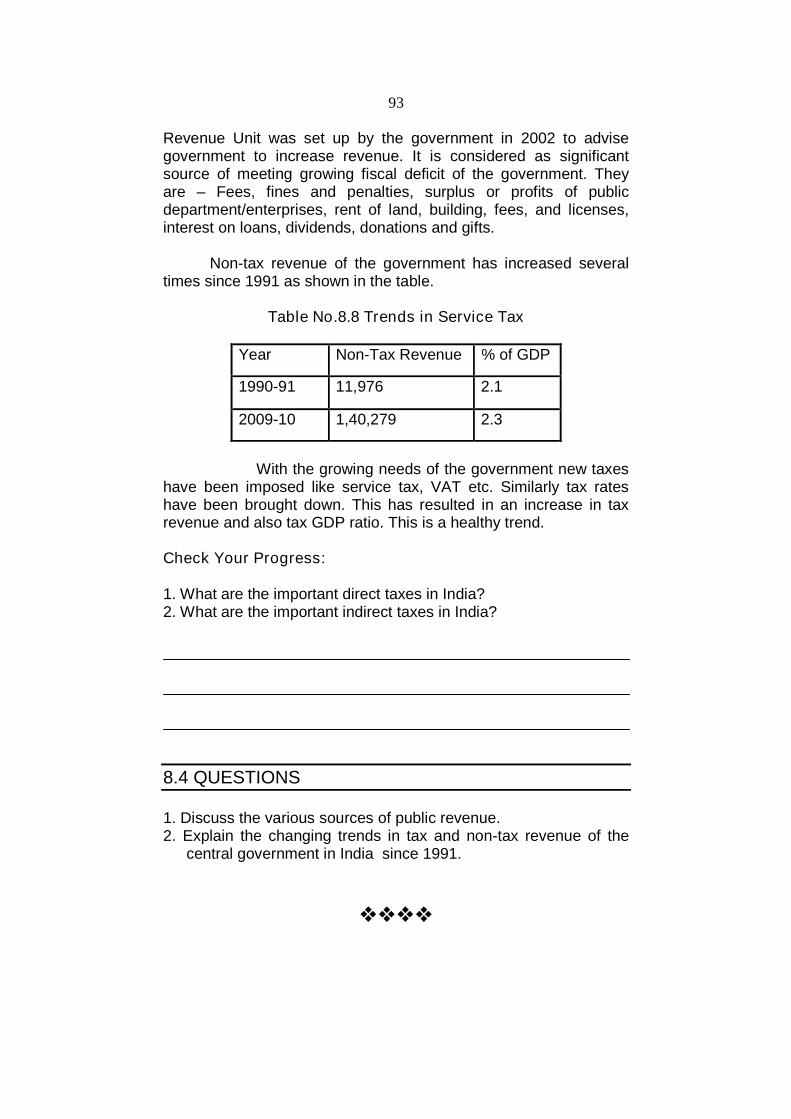
93
Revenue Unit was set up by the government in 2002 to advisegovernment to increase revenue. It is considered as significantsource of meeting growing fiscal deficit of the government. Theyare – Fees, fines and penalties, surplus or profits of publicdepartment/enterprises, rent of land, building, fees, and licenses,interest on loans, dividends, donations and gifts.
Non-tax revenue of the government has increased severaltimes since 1991 as shown in the table.
Table No.8.8 Trends in Service Tax
Year Non-Tax Revenue % of GDP
1990-91 11,976 2.1
2009-10 1,40,279 2.3
With the growing needs of the government new taxeshave been imposed like service tax, VAT etc. Similarly tax rateshave been brought down. This has resulted in an increase in taxrevenue and also tax GDP ratio. This is a healthy trend.
Check Your Progress:
1. What are the important direct taxes in India?2. What are the important indirect taxes in India?
8.4 QUESTIONS
1. Discuss the various sources of public revenue.2. Explain the changing trends in tax and non-tax revenue of the
central government in India since 1991.
94
9
PUBLIC EXPENDITURE
Unit Structure :
9.0 Objectives
9.1 Introduction
9.2 Objectives of Public Expenditure
9.3 Canons or Principles of Public Expenditure
9.4 Classification of Types of Public Expenditure
9.5 Causes for increase in Public Expenditure in India
9.6 Questions
9.0 OBJECTIVES
Understand the nature of public expenditure. Understand the objectives of public expenditure Understand the canons of public expenditure. Understand the classification of public expenditure. Understand the causes of increase in public expenditure in
India.
9.1 INTRODUCTION
Public expenditure is the most important part of thepublic finance. Public expenditure refers to the expenditure incurredby public authorities for the benefit of society as a whole. There aredifferent views regarding public expenditure. The classical definitionof public expenditure indicates that, government should play limitedrole like protection and maintaining law and order. On the otherhand, Keynes stated that, that system of public expenditure is thebest which is highest in amount. It means government shouldspend more than its income to maximize the welfare of the society.Modern state is a welfare state economy in which government hasto play different role and perform a number of functions. Hencepublic expenditure has increased enormously to promote maximumsocial welfare.
95
9.2 OBJECTIVES OF PUBLIC EXPENDITURE
The public expenditure is defined as, ‘that expenditure whichis incurred by the public authorities like, central, state and localgovernment bodies to satisfy collective social wants of the people.’
The expenditure incurred by the government on defense,administration, maintenance of law and order, economicdevelopment, welfare activities etc. is called as public expenditure.In modern welfare state, the functions of the state have beenenlarged and the importance of public expenditure has increased.The government has to spend a lot for achieving various socio-economic and political objectives. Public expenditure is an effectivemeasure to achieve certain objectives.
1. Price stability2. Full employment3. Maintenance of law and order4. Development of industries5. Creation of social goods6. Provision of education and health7. Development of transport and communication.8. Protection from external aggression etc.9. Promotion of economic stability10. Elimination of socio-economic inequalities etc.
9.3 CANONS OR PRINCIPLES OF PUBLICEXPENDITURE
Public expenditure affects the economic life of themasses. It is therefore necessary to have some criteria or principlesor canons by which we can judge whether any item of publicexpenditure is justified or not, whether it should be taken up or not.These principles or canons of public expenditure are concernedwith those fundamental rules which should govern the expenditurepolicy of the government. Canons of public expenditure woulddetermine the efficiency of public expenditure itself. Prof. FindleShirras has suggested some important principles/ canons of publicexpenditure, which can be discussed as follows.
1. Canon of Benefit: - This canon implies that public expenditureshould be incurred in such a way that, it promotes maximum socialadvantage. The ultimate purpose of public expenditure should besocial benefit. Therefore, it is essential for the government to incurits expenditure not only for any particular individual or group ofpeople but for the masses of peoples. It is only by doing so thatpublic expenditure can promote maximum social benefit of society.
96
2. Canon of Economy: - The expenditure of the governmentshould be economical. The government should see that the hard-earned money of the tax-payers is not spent on wasteful projects. Itis also essential to check duplication of expenditure to avoidwastage of funds. Government expenditure should not produce anyunfavourable effects on production. It does not produce anyadverse repercussions on the will and power of the people to save.It should ensure optimum utilization of resources.
3. Canon of Sanction: - All government expenditure should beincurred only after the approval of a competent authority. Thissanction is required for proper allocation of resources and further,to avoid the misuse of funds.
4. Canon of Surplus: - This implies that the government shouldcreate a surplus in budget and avoid deficit. An ideal budget is onethat creates a surplus by keeping the public expenditure belowpublic revenue. This ensures the creditworthiness of thegovernment.
5. Canon of Elasticity: - This implies that there should beelasticity in public expenditure. In other words, there should bescope for changes in public expenditure as per the requirement ofthe economy.
6. Canon of Productivity: - This implies that public expendituremust be productive. As such a sizeable part of the publicexpenditure in an economy should be incurred for developmentpurposes.
Check Your Progress:
1. What is public expenditure?2. What are the main objectives of incurring public expenditure?3. What do you understand by canons of public expenditure?
97
9.4 CLASSIFICATION OR TYPES OF PUBLICEXPENDITURE
There are different types of public expenditure. The publicexpenditures are classified as follows.
1. Revenue Expenditure and Capital Expenditure: -Based on the government budget there are two types of
public expenditure. The expenditure incurred in revenue account ofthe budget is called revenue expenditure. Revenue expenditureincludes expenditure incurred for current flow of goods and servicesand to maintain capital stock intact. Revenue expenditure is knownas current expenditure in the form of consumption. Expenditureincurred on civil administration, defence forces, public health,education, etc., is known as revenue expenditure. This type ofexpenditure is of recurrent type, which is incurred year after year.
The expenditure incurred in capital account of the budget isknown as capital expenditure. It is a long term investmentexpenditure done by the government. This expenditure helps toincrease productive capacity of the economy. The expenditureincurred on building durable assets like-highway, dams, irrigationproject, buying machinery and equipment is known as capitalexpenditure. They are non-recurrent type of expenditure.
2. Productive Expenditure and Unproductive Expenditure: -
Based on creation of productive capacity there are two typesof expenditure. The expenditure, which increases the productivecapacity of the country, is known as productive expenditure. Thistype of expenditure helps to increase volume of output andemployment in the country. The expenditure on establishment ofpublic sector industries, infrastructure development, development ofagriculture, roads, dams, railway, airport etc. is known asproductive expenditure.
Unproductive expenditure is an expenditure, which does notincrease productive capacity of a nation. The expenditure, whichdoes not create as asset, is known as unproductive expenditure.Expenditure in the form of defence, maintenance of law and order,interest payment, administrative expenses is known asunproductive expenditure.
Modern economist have classified these expenditure asdevelopment and non- development expenditure. Theexpenditure, which promotes economic growth and development, iscalled as development expenditure. Unproductive expenditures aretermed as non-development expenditure.
98
3. Transfer Expenditure and Non-transfer Expenditure: -Based on transfer of income there are two types of
expenditure. Transfer expenditure is that expenditure whichinvolves the transfer of income from one person to another. It isredistribution of money income within the community. Expendituredone by the government on pension, unemployment allowances,sickness benefit, welfare benefits, interest payment, public debt andsubsidies is known as transfer expenditure. Transfer expendituredoes not involve creation of goods and services.
The expenditure done by the government to create outputand income in the country is known as non-transfer expenditure.Such expenditures are incurred for buying or using goods andservices, these include expenditure on defence, education, publichealth etc. Non-transfer expenditure uses productive resources andgenerates employment and income directly in the country.
4. Plan Expenditure and Non-plan Expenditure: -The expenditure incurred by the government for
development schemes, which are outlined in the ongoing five yearplan. Plan expenditure is one, which is provided in the budget. Thisexpenditure is called as development expenditure because itpromotes economic growth and development. For example, theexpenditure incurred for the implementation of NREGS, SarvaShiksha Abhiyan and such other schemes.
Non-plan expenditure refers to that expenditure which is notincluded in the ongoing five-year plan. Non-plan expenditure doesnot have any provision in the budget. It consists of non-development expenditure and thus termed as non-developmentexpenditure.
5. Mrs. Hicks Classification of Public Expenditure: - Prof. UrsulaHicks classified public expenditure based on duties of thegovernment. There are-
a) Defence Expenditure: - Expenditure done by the government toprovide security to the citizens of a country against externalaggression is called as defense expenditure. For exampleexpenditure on defence equipment, wages and salary of armedforce, navy and air force etc.
b) Civil Expenditure: - Expenditure on maintaining law and order,justice system, police dept. etc.
c) Development expenditure: - Expenditure for the growth anddevelopment of agriculture, industry and service sector.
99
6. Dalton’s Classification of Public Expenditure: -
a) Expenditure on political executive: - Expenditure onceremonial heads of state.
b) Administrative expenditure: - Expenditure on governmentdepartments and offices etc.
c) Security expenditure: - Expenditure on defence.
d) Expenditure on administration of justice.
e) Development expenditure.
f) Social expenditure: - Expenditure on public health,community welfare, social security, education etc.
Check Your Progress:
1. What is development expenditure?2. What are transfer payments?3. Does revenue expenditure result in creation of assets?
9.5 CAUSES FOR INCREASE IN PUBLICEXPENDITURE IN INDIA
In recent years, the volume of public expenditure of thegovernment has increased tremendously in the country. Indeed,both intensive and extensive expansion in the activities of thegovernment during the planning period was responsible forcontinuous increase in public expenditure.
In India there has been spectacular increase in publicexpenditure since 1950-51. The ratio of public expenditure to GDPhas steadily risen till 1991. Only during mid 1990s it had shown atendency to decline. Since then this trend has reversed and thepublic expenditure GDP ratio has been rising. The ratio of publicexpenditure to GDP was 24.7 per cent in 1996-97 rose to as highas 28.4 per cent of GDP in 2007-08. At this level it was one of thehighest in developing countries and very much comparable to theones in the USA, Canada, U.K. France and Germany.
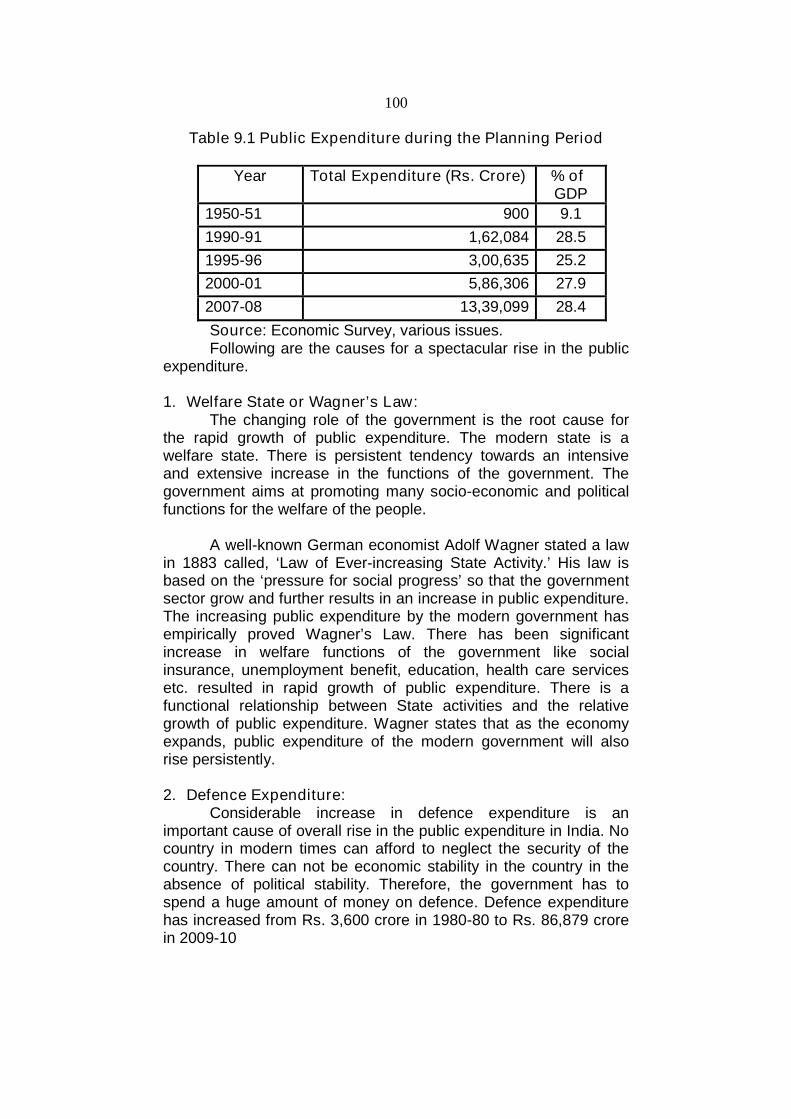
100
Table 9.1 Public Expenditure during the Planning Period
Year Total Expenditure (Rs. Crore) % ofGDP
1950-51 900 9.1
1990-91 1,62,084 28.5
1995-96 3,00,635 25.2
2000-01 5,86,306 27.9
2007-08 13,39,099 28.4
Source: Economic Survey, various issues.Following are the causes for a spectacular rise in the public
expenditure.
1. Welfare State or Wagner’s Law:The changing role of the government is the root cause for
the rapid growth of public expenditure. The modern state is awelfare state. There is persistent tendency towards an intensiveand extensive increase in the functions of the government. Thegovernment aims at promoting many socio-economic and politicalfunctions for the welfare of the people.
A well-known German economist Adolf Wagner stated a lawin 1883 called, ‘Law of Ever-increasing State Activity.’ His law isbased on the ‘pressure for social progress’ so that the governmentsector grow and further results in an increase in public expenditure.The increasing public expenditure by the modern government hasempirically proved Wagner’s Law. There has been significantincrease in welfare functions of the government like socialinsurance, unemployment benefit, education, health care servicesetc. resulted in rapid growth of public expenditure. There is afunctional relationship between State activities and the relativegrowth of public expenditure. Wagner states that as the economyexpands, public expenditure of the modern government will alsorise persistently.
2. Defence Expenditure:Considerable increase in defence expenditure is an
important cause of overall rise in the public expenditure in India. Nocountry in modern times can afford to neglect the security of thecountry. There can not be economic stability in the country in theabsence of political stability. Therefore, the government has tospend a huge amount of money on defence. Defence expenditurehas increased from Rs. 3,600 crore in 1980-80 to Rs. 86,879 crorein 2009-10
101
3. Growth of Population:During the last 58 years, India is passing through the second
stage of demographic transition. India has faced populationexplosion. In 1951 the population of India was 36 crore. It rose to102.9 crore in March 2001. Growth of population has made itnecessary for the government to spend ever increasing amounts oneducation, health, infrastructure, subsides and developmentactivities etc.
4. Urbanization Effect:Since independence, the percentage of urban population
has increased in this country from 17.3 percent in 1951 to 27.8percent in 2001. The process of urbanization in India has resultedin heavy expenditure on infrastructure. Government has to spendnot only on creating new infrastructure for cities but also on themaintenance and replacement of such infrastructure.
5. Economic Planning:In underdeveloped and developing economies economic
planning is undertaken for achieving the goals of rapid economicdevelopment. In a planned economy, the government has to incurhuge outlay on agriculture, industry, essential infrastructure etc. foraccelerating the rate of economic growth. Development projectsand large scale industries caused substantial increase in publicexpenditure.
6. Social Security Measures:In a welfare state economy, the government has to provide
social security measures like unemployment benefits, sicknessbenefits, old age pension, free education and medical facilities,compensation for accidents, public works and relief programmesetc. for the welfare of the people. This has resulted in continuousincrease in public expenditure over the years.
7. Development of Agriculture:In India more than 60 percent of the population depends
upon the agriculture. It is the source of employment and income tomore than 70 percent of the population. The government has beenspending huge amount on agriculture by providing seeds, fertilizers,irrigation facilities, cheap loans etc. It may also promote agriculturalresearch, soil conservation and rural development. This has raisedpublic expenditure considerably in the country.
8. Development of Industries:The overall socio-economic development of the country also
depends upon the development of Industries. The government hasbeen encouraging the growth of private sector industries throughprotection, subsidies to exports, loans at a cheap rate of interestetc. causing rise in public expenditure.
102
9. Inflation:Inflation has now become a global phenomenon. The rise in
the price level has naturally resulted in the increase in publicexpenditure. During the inflationary situation the cost of supplyingpublic goods and services increases. This has caused the increasein public expenditure.
10.Law, Peace and Order:With increase in population, huge expenditure has to be
incurred for the maintenances of law, peace and order in thecountry.
11.Poverty alleviation:In a developing country like India for the eradication of
poverty and to solve the problem of unemployment government hasundertake number of poverty alleviation programmes as well asemployment generation schemes. These programmes andschemes require continuous ongoing expenditure for theimplementation. This has raised public expenditure of thegovernment enormously.
12.Servicing of Public Debt:India is resorting to heavy public debt both internal and
external to finance various development projects. This has resultedin huge burden of interest payments. The sharp rise in interestpayment has further resulted in tremendous growth in publicexpenditure in modern times.
In addition to these causes there are some other factors likeincrease in national income, expansion of administrativemachinery, Development projects, subsidies, maintenance ofdemocratic institutions, rural development, health andeducation etc responsible for rapid growth of public expenditure.
Check Your Progress:
1. What is Wagner’s law?2. How does inflation cause an increase in public expenditure?
103
9.6 QUESTIONS
1. Discuss the canons or principles of Public expenditure.2. How is public expenditure classified?3. Explain different types of public expenditure.4. Explain the causes of public expenditure in India.
104
10
PUBLIC DEBT
Unit Structure
10.0 Objectives
10.1 Introduction
10.2 Meaning of public debt
10.3 Types of Classification of public debt
10.4 Burden of public debt10.5 Questions
10.0 OBJECTIVES
Understand the nature of public debt. Understand the different types of public debt. Understand the effects of public debt on the economy.
10.1 INTRODUCTION
Public debt is considered an important source of income ofthe government. If revenue of the government from tax and non-tax sources is not adequate to meet its expenditure, thegovernment very often borrows funds from the public to meet thedeficit in its budget. As is well known, like a private individual, thegovernment has also to borrow from the public in order to meet itsexpenditure. The size of public debt has increased tremendously inmodern times. There is hardly any government today, which hasnot borrowed from its people.
The developing countries like India, in view of inadequaterevenue resources, may resort to extensive internal and externalborrowing for developmental expenditure.
10.2 MEANING OF PUBLIC DEBT
Public debt implies the borrowings by the government frombanks, business organizations and individuals. The debt is in theform of promises by the government to pay to the holders of these
105
promises a principal sum and in most instances interest on thatprincipal.
Public debt may be defined as, ‘financial obligationsaccepted by the government by way of raising loans or funds, eitherwithin or outside the country for financing public activities.’ Thegovernment loan is generally in the form of various types of bondsand securities. These liabilities are redeemable within a specificperiod.
In India, public debt consists of government treasury bills,post office savings certificates, national savings certificates, publicprovident funds etc. Public debt may be raised internally fromindividuals, banks and financial institutions or externally frominternational financial institutions like IMF, World Bank or from theadvanced countries of the world.
10.3 TYPES OR CLASSIFICATIONS OF PUBLIC DEBT
Public debts are classified in many ways. They differ fromone another according to the conditions of repayment, the market inwhich loans are raised, the purpose for which they are raised, thelength of the period for which loans are raised, etc. The mainclassifications of public debt are as follows.
1. Internal and External Public Debt:
When the government of a country takes loans fromindividuals, business organizations and banks and financialinstitutions within the country, it is called as internal public debt.Internal debt is taken by the government by issue of bonds and saleof treasury bills to the general public and financial institutions.Under internal debt the availability of resources does not rise.When the government raises loan the resources are just transferredfrom individuals and institutions to the government. Thegovernment then uses these resources for public purposes. Whenthe government pays back interest and principal amount to thebond or security holders’ resources are transferred fromgovernment to the public.
Internal public debts are less burdensome on nationbecause it has to be repaid in the domestic currency. But thesedebts have real burden as transfer of purchasing power betweendifferent groups of people takes place when these debts are repaid.Internal public debt may be voluntary of compulsory.
When the government borrows money from internationalfinancial institutions like IMF, World Bank, Asian Development Bankand from the government of other countries it is called as external
106
public debt. External public debt increases the (foreign exchange)resources of the borrowing country. When the government takesexternal debt transfer of recourses take place from the creditorcountry to the debtor country. In case of payment of interest andrepayment of principal, there is a transfer of resources for thedebtor country to the creditor country causing decline in theresources of the debtor country.
External debts are more burdensome because it has to berepaid in the form of foreign currency. External debt imposes bothmoney burden and real burden on the community. External debtscan be only voluntary.
2. Productive and Unproductive Public Debt:Debt raised by the government for some productive purpose
like investment in economic and social infrastructure i.e.development of roads, railways, telecommunication, power,schools, hospitals establishment of industries etc. is called asproductive public debt. Productive debt helps to increase theproductive capacity of country. It helps to generate employmentand income which further builds up the repayment capacity of thenation. Such debts are less burdensome on a nation. Productivedebts add to the productive assets of a country.
Debt taken for unproductive purposes like financing war,famine relief, maintenance of law and order, public administrationetc. is called as unproductive debt. Such debt does not help toincrease the productive capacity of a country. Similarly it does nothelp to generate employment, income and repaying capacity of acountry. Hence it is referred to as “Dead weight public debts”.Unproductive debts are more burdensome on a nation.
3. Funded and Unfunded Public Debt:Funded public debt is a long term debt raised by the
government for a period of 10 to 20 years or even more. Fundeddebts are raised for creation of some permanent assets likeconstruction of roads, railways lines, bridges, dams etc. Usually thegovernment creates a special fund to repay such debts.
Unfunded debt is one which is taken by the government forthe period of one year or less than one year. Such loans are calledas short term loans. Unfunded debt is taken to meet temporaryneeds of the government. No fund is created by the government forthe repayment of such debt.
4. Redeemable and Irredeemable Public Debt:Redeemable public debt is the debt which government
promises to repay at some specific future date. Hence thegovernment has to make arrangements for repayment of interest
107
and principal amount within a specific period of time. Such loansare called as “terminable loans”.
When the public authorities do not repay the loans butcontinue to pay the interest on them, such loans are calledirredeemable public debt. Repayment of irredeemable loans is atthe option of the government because maturity period is not fixed.Hence they are called as “Non-terminable loans”.
5. Compulsory and Voluntary Public Debt:Compulsory debt refers to that debt which is taken by the
government from the public by applying some force. Compulsorydebts are raised by the government during financial emergency orexceptional circumstances like war. Under compulsory debtindividuals, business organizations and banks and financialinstitutions have to compulsorily subscribe to the government.
Generally public debts are voluntary in nature. When thegovernment raises loans through securities and bonds, people arevoluntarily subscribe to them and there is usually no compulsioninvolved. Voluntary public debts are taken by the governmentduring normal times to finance various activities.
6. Short Term, Medium Term and Long Term:a) Short term debt: Loans for a period of less than one year isknown as short term debt. For e. g. Treasury bill is short term debtpayable within 90 days by the government. Interest rates on suchdebts are very low. Short term loans are taken to cover thetemporary deficits in the budget.
b) Medium term debt: Loans for a period of more than 1 to 5 yearsare called as medium term debts. The interest rates on such loansare reasonable. Medium term loans are preferred for war finance,to meet expenditure on health, education etc.
c) Long term debt: Loans for a period of more than 5 years arecalled as long term debt. Such loans are usually raised by thegovernment for the development finance. The interest rate on suchloans is high.
10.4 BURDEN OF PUBLIC DEBT
During the post-reform period, public debt in India hasincreased at an alarming rate, with the significant increase in deficitin the budget of the government. Public debt, both internal andexternal debt which is an obligation of the government has to berepaid by the government. Such repayment of public debts imposesburden on the society.
108
The Government raises public debt from private individualsand institutions. When it spends the funds for promoting economicdevelopment and various welfare schemes it provide benefits to thesociety. But when a loan is repaid along with interest, people haveto make sacrifice. Such sacrifice is called burden of public debt.The payment of interest and the repayment of loans will make thegovernment to raise money by way of taxes.
The burden of public debt can be further divided into twocategories. They are as follows.
A) Burden of Internal Debt:Internal public debts are raised and repaid by the
government within the country. Therefore, they have no directmoney burden on the society. But the repayment of internal publicdebt results in transfer of purchasing power form one group ofpeople to another. The government imposes taxes for the paymentof interest and repayment of internal debt. Such internal public debtgives rise to real burden. Burden of internal debt can be discussedas follows.
Direct Money burden:According to Dalton, internal debt does not constitute any
direct money burden on the community. In this case there is atransfer of wealth or purchasing power from one group of people toanother within the country. It implies that, as a loan is raised fromindividuals and institutions, repayment does not cause any changein the total resources of the community. When government leviestaxes on the people, the same amount is distributed among thecreditor by way of interest payment and repayment of loans. Thetax payer and the creditor may be the same person.
Direct real burden:In this case transfer of purchasing power will take place
because government imposes taxes to repay the internal debt.When purchasing power is transferred from tax payer to creditor itwill influence the distribution of income in the country. Whilerepaying debt, if tax burden falls more heavily on the poor theninequality of income distribution will increase. If debt is repaid bylevying heavy taxes on the higher income group people, the directreal burden will be less. In a developing country, rich peoples aremore benefited when debts are repaid. Such countries dependsmore on indirect taxes than direct taxes, which imposes greaterburden on relatively poor than rich. Therefore, in case of repaymentof internal debt transfer of purchasing power does take place frompoor people to the rich or from the younger (future generation) tothe older generations or from the active to the passive elements in
109
the economic life of the community. This is the direct real burden ofinternal debt.
Indirect real burden:
The internal debt burden may have negative effect on thecommunity. When government imposes high rate of taxes for therepayment of loans, it reduces People’s ability and willingness towork, save and invest. This will further affect the productivity andinvestment in the economy.
While borrowing money from the public government mayoffer high rates of interest. Most people believe that governmentsecurities or small savings are more safe to invest their money in.Hence, a large amount of domestic savings are directed towardspublic debt. This reduces the funds available for the private sectorinvestment and further affects the growth of this sector.
In a developing country like India, public debt is used tomeet revenue deficit of the government. Such debt is known asunproductive public debt. With an increase in public debt, theinterest burden also increases. A large portion of the governmentrevenue is then spent on paying interest. Thus the government isunable to make adequate capital expenditure on developmentactivities. This will further affect the growth and developmentprocess of the economy.
When government imposes taxes at a high rate for therepayment of debt, inflation may take place. This will reduce realincome of the poor, further it increases the hardship of the poor.The poor people will have to work hard to earn more income tosatisfy their basic needs.
B) Burden of External Public Debt:
When a country borrows from foreign countries, financialinstitutions like the IMF, World Bank, etc. is called as externalpublic debt. Such debts result in inflow of capital into the borrowingcountry. But when these debts need to be repaid it results inoutflow of money in the form of interest and principal fromborrowing country to creditor’s country. External debts create thefollowing money and real burden.
Direct Money Burden:
When governments raises public debt and receive fundstransfer of wealth takes place from the foreign country to theborrowing country. When this loan is repaid the transfer of wealthtakes place from the debtor country to the creditor country. Hence
110
there is a transfer of purchasing power out of the country. Whendebtor country makes repayment public debt, it creates directmoney burden on the community. It is the sum of payments in theform of interest and principal of external public debt.
There may also be a drain of foreign exchange reserves.If the export earnings are inadequate and the import is inelastic,then the borrowing country will have a great problem in repayingexternal debt.
Direct Real Burden:
Direct real burden vary according to the proportion in whichthe various sections of the community contributes payments. Whenthe government imposes taxes for the repayment of such debt itcreates direct real burden of the community. If the relative burdenof taxation falls heavily on the rich, then the direct real burden willbe less. If the relative burden of taxes falls heavily on the poor, thenthe direct real burden will be more.
The repayment of external public debt reduces theconsumption of poorer and weaker section of the society. It ismeasured in terms of loss of welfare suffered by the debtor countrydue to the repayment of debt.
If foreign debts are taken for unproductive purposes then theburden of repayment of debt will be very high on the economy.External debts for productive purposes will provide benefits to thedebtor country.
Indirect Money Burden and Indirect Real Burden:
The repayment of external public debt involves an increasein the demand for the currency of the creditor country. This willraise the exchange rate of the creditor’s currency in relation to thedebtor’s currency. The creditor country may also be adverselyaffected if it is induced to import more from debtor country. Thismay affect the growth of their domestic industries and causeunemployment.
The repayment of external public debt results in reduction inpublic expenditure of the government. The fall in public expenditurefurther reduces the volume of investment, output and employmentin the country. This will further cause reduction in production andconsumption in the country.
Generally the advanced countries while granting loans topoor countries imposes various terms and conditions to be followedby the debtor country. Some times even they force the poor
111
countries to change their economic policies in their favour. Thisresults in loss of economic sovereignty to the poor countries. Heavydependence on one or more powerful creditor country may result inthe debtor country being economically and politically dominated bythe creditor country.
Check Your Progress:
1. Internal debt is loans borrowed by the government from withinthe country.
2. External debt is borrowed from other countries.3. External debt involves a transfer of resources from the debtor
country to the creditor country.
10.5 QUESTIONS
1. Explain the classifications or types of public debt.2. Examine the burden of internal and external debt.
112
11
BUDGET, DEFICIT and FRBM ACT
Unit Structure :
11.0 Objectives
11.1 Introduction
11.2 Types of Budget
11.3 Components of Budget
11.4 Concepts or Types of Deficit
11.5 Trends of Central Government Deficits in India during 1990-91 and 2009-10
11.6 Fiscal Responsibility and Budget Management Act 2003
11.7 Questions
11.0 OBJECTIVES
Understand the concept of government budget. Understand the concept of deficit financing. Understand the various concepts of deficits. Understand the nature and significance of FRBM Act of 2003.
11.1 INTRODUCTION
The financial operations of the government comprising publicrevenue, public expenditure and public borrowing for a year areestimated. ‘The statement with estimates of planned expenditureand the expected revenues from taxes and other sources is calledas budget.’ In other words, ‘an annual financial statement ofanticipated revenues and planned expenditure of the government iscalled as budget.’
Thus, budget deals with how the government raises itsresources to meet its ever-increasing expenditure. In this sense, abudget may be considered a description of both the fiscal policiesand the financial plans of the government. Budget is an importantinstrument for achieving various fiscal objectives of thegovernment.
113
11.2 TYPES OF BUDGET
There are three types of budget.
1. Balanced budget: - ‘When the expected total revenues of thegovernment are equal to its total expenditure during a given year iscalled as balanced budget.’ The classical economists haveadvocated laisez faire policy, they believed that the governmentshould follow sound finance and balanced budget.
2. Surplus budget: - ‘When the expected total revenue exceedsthe total expenditure of the government during a given year iscalled as surplus budget.’
3. Deficit budget: - ‘When the total planned expenditure exceedsexpected total revenues of the government during a given year iscalled as deficit budget.’ With the emergence of Welfare State andmassive increase in public expenditure, balanced or surplus budgethas become a rare phenomenon. However, modern economistsadvocate deficit budget. Because they believe that the governmentshould spend more than its income to maximize welfare of thepeople.
Check Your Progress:
1. What is a deficit budget?2. When is a budget considered to be balanced?
11.3 COMPONENTS OF A BUDGET
The budget of a government is generally divided into twoaccounts, namely (1) The Revenue Account or Revenue Budget,and (2) The Capital Account or Capital Budget.
1) The Revenue Account or Budget:The Revenue Account shows both revenue receipts and
revenue expenditure. Revenue receipts are divided between taxrevenue and non-tax revenue. The two components of tax revenue
114
are 1) revenue from direct taxes, particularly tax on personalincome and corporate tax, and 2) revenue from indirect taxes likethe excise duties and customs duties are most notable. Non-taxrevenue includes fees, fines and penalties, interest receipts andsurplus or profits from public enterprises and gift and grants.
Revenue expenditure is usually divided intodevelopmental and non-developmental expenditure. Revenueexpenditure of the government of India is defence expenditure,interest payments, subsidies wages and salaries, etc.
2) Capital Account or Budget: -The Capital Account shows capital receipts and capital
expenditure. Capital receipts include market borrowings, smallsavings, provident funds, special deposits, recoveries of loans,external loans and receipts from disinvestment.
Capital expenditure includes repayment of debts andexpenditure incurred on creation of capital assets. Capitalexpenditure is also two types, development expenditure and non-development expenditure.
11.4 CONCEPTS OR TYPES OF DEFICIT
Budget deficits represent excess of all expenditure by thegovernment over its receipts from revenue and capital accounts.This means, the government spends more than it collects throughtaxes and non-tax receipts. It may be noted that the deficit mayoccur either in the revenue account or capital account or in both.Thus budget deficit can be obtained as Budget Deficit = TotalExpenditure – Total Revenue.
This deficit may be financed by withdrawing cash balance ofthe government with the RBI or by borrowing from the public to fillup the gap between current income and expenses. Further, abudget deficit may also be financed through the creation of newmoney. In other words, the government may cover the deficit byborrowing from the central bank of the country.
The various concepts of deficit used in budget in modernworld are as follows.
1) Revenue Deficit:The deficit in revenue account of the budget is called as
revenue deficit. It takes place when revenue expenditure is morethan revenue receipts. It refers to the excess of revenueexpenditure over the revenue receipts of the government. Revenuereceipts come from direct, indirect taxes, and other sources likefees, fines, surplus of public enterprises. Revenue expenditures are
115
made on civil administration, law and order, justice, defence,interest payments on public debt, subsidies, education, health etc.Revenue Deficit = Revenue Expenditure > Revenue Receipts
Revenue deficit reflects the inability of the government tofinance current expenses through tax and non-tax revenues. Itshould be noted that most of the expenditure on revenue accountrepresents collective consumption of the society. It thus does notcreate income-earning assets. Prudent fiscal management requiresthat receipts on revenue account should be more than theexpenditure on revenue account. When there is a deficit in revenueaccount, the borrowed funds from capital account are used to meeta part of the consumption expenditure of the government.
2. Budgetary Deficit: -It is defined as excess of total budgetary expenditure over
total budgetary receipts (both revenue and capital account) of thegovernment. The budgetary deficit in India is met by eitherwithdrawing cash balance kept with the RBI or by net addition tothe Treasury bill issued by the central government. It is only apartial measure of budgetary imbalances, as it does not reflect thetotal indebtedness of the government.
Budgetary Deficit = Total Expenditure > Total Revenue
3. Fiscal Deficit: -The fiscal deficit is an internationally used concept. It is an
important and complete measure of deficit. Fiscal deficit is theexcess of total expenditure (both revenue and capital account) overrevenue receipt and non-borrowing types of capital receipts likeproceeds from disinvestment of public enterprises. It shows thetotal resource gap in the financial operation of the government. It isa comprehensive measure of budgetary imbalance as it fullyreflects the total indebtness of the government.
Fiscal Deficit = Revenue Expenditure + Capital Expenditure >Revenue Receipts + Non Borrowing Capital Receipts
The government in two ways can meet fiscal deficit firstly, byborrowing –both internal and external market borrowing secondly,by borrowing from the Central Bank against its own securities.When the government borrows from the Central Bank, new moneyor currency is created. This is called monetizing the deficit becauseit leads to the creation of reserve money of high-powered money.Monetizing fiscal deficit is called deficit financing in India. In otherwords, Fiscal deficit is the excess of total expenditure, excludingrepayment of debt, over total receipts excluding debt capitalreceipts.
116
4. Primary Deficit: -Primary deficit is obtained by deducting interest
payment from fiscal deficit. It is a measure of budget deficit, whichindicates the real position of the government finance. If the interestpayments on past borrowings are high the fiscal deficit is high.Hence, fiscal deficit may be high and primary deficit may be low. Ifpublic debt is reduced b mobilizing resources and curtailing publicexpenditure, then fiscal deficit would be reduced.
Primary Deficit = Fiscal Deficit – Interest Payment
5. Monetized Deficit: -It refers to the increase in net RBI credit to the government.
It is the sum of net increase in holding of Treasury bill of centralbank and its contribution to the market borrowing of thegovernment.
It gives rise to the expansion of new money of currency iscalled Monetizing the deficit. Hence it leads to the creation ofreserve money or high powered money by the RBI. When thegovernment is monetizing the fiscal deficit, it shows the extent ofdeficit financing in India. Thus monetized deficit is responsible fordirectly raising the general price level.
To conclude, the fiscal imbalance was attributed to a numberof factors such as rapid increase in government spending,inadequate rise in revenue receipts, excessive borrowing,unproductive use of the resources etc. In fact, the large andincreasing fiscal imbalance affected adversely the economy interms of deficits because of balance of payments, large inflationaryrise in the general price level, and cut in capital expenditure.
Check Your Progress:
1. How is fiscal deficit different from budgetary deficit?2. What is primary deficit?
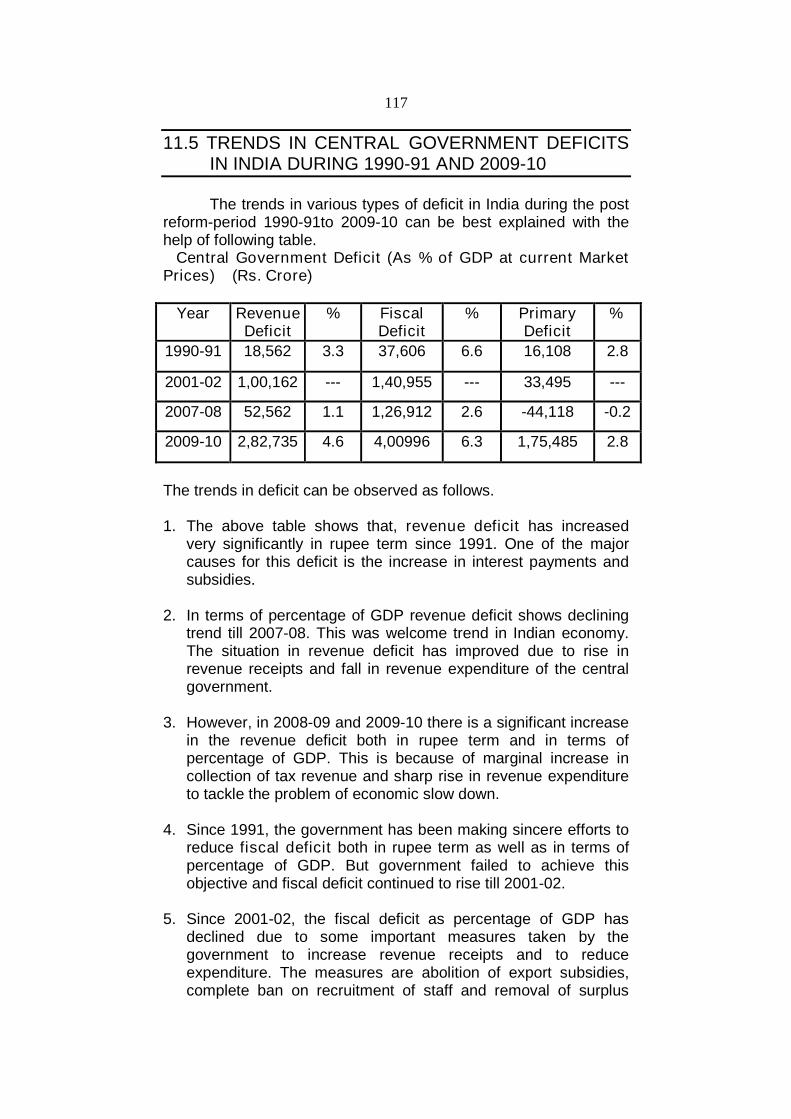
117
11.5 TRENDS IN CENTRAL GOVERNMENT DEFICITSIN INDIA DURING 1990-91 AND 2009-10
The trends in various types of deficit in India during the postreform-period 1990-91to 2009-10 can be best explained with thehelp of following table.
Central Government Deficit (As % of GDP at current MarketPrices) (Rs. Crore)
Year RevenueDeficit
% FiscalDeficit
% PrimaryDeficit
%
1990-91 18,562 3.3 37,606 6.6 16,108 2.8
2001-02 1,00,162 --- 1,40,955 --- 33,495 ---
2007-08 52,562 1.1 1,26,912 2.6 -44,118 -0.2
2009-10 2,82,735 4.6 4,00996 6.3 1,75,485 2.8
The trends in deficit can be observed as follows.
1. The above table shows that, revenue deficit has increasedvery significantly in rupee term since 1991. One of the majorcauses for this deficit is the increase in interest payments andsubsidies.
2. In terms of percentage of GDP revenue deficit shows decliningtrend till 2007-08. This was welcome trend in Indian economy.The situation in revenue deficit has improved due to rise inrevenue receipts and fall in revenue expenditure of the centralgovernment.
3. However, in 2008-09 and 2009-10 there is a significant increasein the revenue deficit both in rupee term and in terms ofpercentage of GDP. This is because of marginal increase incollection of tax revenue and sharp rise in revenue expenditureto tackle the problem of economic slow down.
4. Since 1991, the government has been making sincere efforts toreduce fiscal deficit both in rupee term as well as in terms ofpercentage of GDP. But government failed to achieve thisobjective and fiscal deficit continued to rise till 2001-02.
5. Since 2001-02, the fiscal deficit as percentage of GDP hasdeclined due to some important measures taken by thegovernment to increase revenue receipts and to reduceexpenditure. The measures are abolition of export subsidies,complete ban on recruitment of staff and removal of surplus
118
staff, drastic reduction in capital expenditure and removal offood subsidies etc.
6. However, because of economic slowdown in 2009-10 publicexpenditure increased significantly.
7. The situation of primary deficit is disappointing during the post-reform period. The above table shows that the primary deficithas declined both in rupee term and percentage terms especialafter the introduction of FRBM Bill in 2000. But again primarydeficit started rising which indicate increase in burden of interestpayment. This shows complete failure of the government toreduce this burden in the country.
In short, the government has to make serious effortsto reduce burden of interest payment and to bring animprovement in the situation of primary deficit.
11.6 FISCAL RESPONSIBILITY AND BUDGETMANAGEMENT ACT 2003
The fiscal situation in India was deteriorated throughout1980’s and reached to a peak level of crisis in the year1990-91.The fiscal deficit in 1990-91 was 6.6 percent of GDP while revenuedeficit was as high as 3.3 percent of GDP. The primary deficit was2.8 percent in the same period. The situation did not improvesignificantly. This further indicates deterioration in fiscal situationdue to rise in burden of interest payments. This was one of thefactors responsible for the BOP crisis in 1990-91. But by the timethe stock of government liabilities had become very large. It wasaffecting government functioning. Therefore, the centralgovernment appointed a committee on Fiscal ResponsibilityLegislation on Jan. 17, 2000 to look into various aspects of fiscalsystem and recommended a draft legislation on fiscal responsibilityof the government . To ensure fiscal discipline the centralgovernment according introduced ‘fiscal responsibility and budgetmanagement bill’ in the parliament in December 2000 with theprimary objective of reducing the central government’s deficits anddebts. Later on it became an act. The fiscal responsibility andbudget management act was passed and came into force on 5 July2004.
Objectives of the FRBM Act 2003
1. To set the limits on government borrowing, under a time boundprogramme.
2. Achieve zero revenue deficit, to achieve sufficient revenuesurplus and bring down fiscal deficits.
119
3. Make government responsible to ensure long-term macro-economic stability.
4. To make government responsible to reduce burden of debtrepayment on future generations and to adopt prudent debtmanagement.
5. Improve the transparency in fiscal operations of the government.
Main Features of FRBM Act 2003 and FRBM Rules 2004:
1. Reduction in Revenue Deficit:- The FRBM rules states that,the central government must take appropriate measures to reducerevenue deficit by 0.5 percent of GDP or more at the end of eachfinancial year beginning with 2004-05. The FRBM Act furtherStipulates that, revenue deficit should be reduced to zero within aperiod of 5 years ending with 31st March 2009.
2. Reduction in Fiscal Deficit:- The FRBM Rules states that, thecentral government should take appropriate measures to reducefiscal deficit but 0.3 percent of GDP or more at the end of eachfinancial year beginning with 2004-05. The Act further states thatfiscal deficit should be reduced to 3 percent of GDP by the end of2008-09.
3. Borrowing from the RBI:- The FRBM Rules states that, thecentral government should not borrow directly from the RBI witheffect from 1st March 2006 except by way of advances to meettemporary shortage of cash. The RBI should not subscribe to theissue of government securities from 2006-07.
4. Additional Liabilities:- The FRBM Rules states that, the centralgovernment should limit the additional liabilities to 9 percent of theGDP in 1004-05 and should reduce this limit to by one percentpoint of GDP at the end of each financial year.
5. Relaxation of Deficit Reduction Targets:- The FRBM Actstates that, the revenue and fiscal deficit may be more than thespecified targets in the rules, but only on ground of nationalsecurity, national calamities, or other exceptional cases relaxationfrom deficit reduction targets may be granted to the centralgovernment.
5. Quarterly Reviews: - The FRBM Act states that, the FinanceMinister should take quarterly review of receipts and expenditure,and should place the outcome report of review before theparliament. He must present a statement in the parliament byexplaining the reasons for changes in FRBM Act targets. Similarly,government should announce the corrective measures to be takento overcome these changes.
120
6. Fiscal Transparency: - The FRBM Act clearly stated twoimportant measures to ensure greater transparency in fiscaloperation of the government. They are
I) The central government should minimize secrecy in preparationof annual budget.II) The central government should disclose the information relatingto the significant changes in accounting standards, policies andpractices as well as revenue arrears, guarantees and assets by2006-07.
7. Government Guarantees:- The Act states that, the centralgovernment should not provide guarantee to loans borrowed by thestate governments and public sector undertakings in excess of 0.5percent of GDP in any financial year beginning with 2004-05.
8. Placing Reports: - The Act further states that, the governmentshould present three reports before the parliament every financialyear.
Macroeconomic Framework Statement- This report stateswhat is the growth rate expected to be achieved and also themacroeconomic situation in the economy. Fiscal Policy Strategy Statement- This report states thepolicy measures relating to taxation, expenditure, borrowing,subsidies and administrative prices. Medium term Fiscal Policy Statements- This report statesthree year rolling targets for prescribed fiscal indicators.
Evaluation of FRBM Act- The critical evaluation of FRBM Act2003 can be done by analyzing it broadly into to groups. They areA) Achievements and B) Limitations.
A) Achievements:- The three main achievements of FRBM Act2003 are as follows.
1. Reduction in Revenue Deficit:- The first major achievement ofthe Act is the reduction in revenue deficit from 3.6 percent of GDPin 2003-04 to 1.1 percent of GDP in 2007-08.
2. Reduction in Fiscal Deficit: - The second major achievement isreduction in fiscal deficit from 4.5 percent of GDP in 2003-04 to 2.7percent of GDP in 2007-08.
3. Reduction in Revenue Expenditure: - The third majorachievement is reduction in revenue expenditure from 3.1 percentof GDP in 2003-04 to 1.1 percent of GDP in 2007-08.
121
B) Limitations; - Though the government has taken credible effortsto reduce revenue and fiscal deficits FRBM Act has certainlimitations. They are as follows.1. False expectations of revenue deficit target: - It wasexpected that the revenue deficit is to be brought down to zero.Central government failed to reduce revenue deficit during the1990s. The revenue deficit of the government rose from 2.4 percentof GDP in 1996-97 to 4.1 percent of the GDP in 223-04. This is dueto a decline in tax-GDP ratio and rise in interest payment,subsidies, defence expenditure and other non-plan expenditure. Ifrestrictions are imposed on the government to reduce revenuedeficit the real possibility is that the government may cut downsocial sector spending especially on health and education. This willadversely affect large sections of the population.2. Low level of capital expenditure:- One of the major limitationsof FRBM Act is the continuous decline in capital expenditure.According to critics to reduce fiscal deficit the government hasreduced capital expenditure from 5.6 percent of GDP in 1990-91 to3.02 percent of GDP in 2002-03. This will restrict governments’investment in infrastructure in future which is vital for rapideconomic growth.3. Neglect of equity and growth: - According to critics one of themajor limitations of the FRBM Act is the bill has not favouredinvestment in human resource development and infrastructurebecause the returns on these do not contribute directly togovernment revenue. But these areas are crucial for equity andeconomic growth. The FRBM bill has no time bound targets.4. Lack of seriousness about financing public expenditure: -The FRMB Act does not address the problem of financing publicexpenditure in a serious manner. During 1990s the tax-GDP ratiodeclined significantly. Hence there was a need to raise this ratio,but it has not received top priority under the Act. There is no targetunder the Act for the tax-GDP ratio. The problem of financing publicexpenditure is callously dealt with by imposing a restriction on thecentral government borrowing from the RBI to finance governmentexpenditure.5. Flawed assumptions of the FRBM Act: - The FRBM Act isbased on the following assumptions.
i. Lower fiscal deficits lead to higher and more sustained growth.ii. Larger fiscal deficits necessarily lead to higher inflation.iii. Larger fiscal deficits increase external vulnerability of the
economy.
These assumptions have been rejected by C.P.Chandrashekhar and Jayati Ghosh who have given the followingarguments.1. If the deficit is in the form of capital expenditure, it wouldcontribute to future growth.
122
2. Fiscal deficit is not the only cause for higher inflation. During thelate 1990s, the rate of inflation has fallen even when the fiscaldeficit was as high 5.5 percent of GDP.
3. Higher fiscal deficit need not necessarily cause external crisis.The external vulnerability depends more on capital and tradeaccount convertibility. In India, we have managed to build largeforeign exchange reserves, though fiscal deficit has not comedown.
In short the assumptions of the FRBM Act are theoreticallyincorrect.
6. Neglect of primary deficit: - According to critics the FRBM Actcompletely neglected the primary deficit because it did notdetermine any specific target for it despite high burden of interestpayment on nation.
7. Target for gross fiscal deficit very stringent: - The Act statesthat gross fiscal deficit should be reduced to 3 percent of GDP up toMarch 31, 2009. This means that government borrowings would berestricted to 3 percent of GDP. According to Dr. Chelliah this targetis very stringent. The ratio of gross fiscal deficit to GDP should be 4to 5 percent of GDP to boost investment in infrastructure andaccelerate the process of economic development.
To conclude, the government has introduced severalmeasures of improving fiscal situation. The Task Force constitutedunder the chairmanship of Dr. Vijay Kelkar, submitted its report tothe government. It has outlined measure to increase revenue andreduce revenue expenditure. It has also recommended raisingcapital expenditure to induce economic growth. On account of suchreforms, the Task Force has estimated that the tax-GDP ratio canimprove considerably in 2008-09. At the same time there would bea decline in total expenditure. As a result, revenue surplus would be2 percent of GDP while the fiscal deficit could be brought down to2.8 percent of GDP.
11.7 QUESTIONS
1. Explain briefly various concepts of deficit and discuss the trendsin deficit in India during the post -reform period.
2. Critically Evaluate the Fiscal Responsibility and BudgetManagement Act 2003.
123
12
Module 5
INTERNATIONAL TRADE AND WTO
GAINS FROM TRADE ANDBALANCE OF PAYMENTS
Unit Structure :
12.0 Objectives
12.1 Introduction
12.2 Gains from Trade
12.3 The Balance of Payments
12.4 Types / Causes of Disequilibrium in the Balance ofPayments
12.5 Methods of Balance of Payments Adjustment
12.6 Questions
12.0 OBJECTIVES
Understand the concept and different types of gains frominternational trade.
Understand the balance of payments and disequilibrium inpayments.
Understand the measures to correct payments disequilibrium.
12.1 INTRODUCTION
International trade refers to the exchange of goods andservices among different countries of the world. It is based on theprinciple that due to differences in resource endowments, a countrywill not be in a position to produce all the goods and services itneeds. Hence, countries would export those goods, which areproduced in excess of their requirement and import those goods inwhich they experience a shortage. This takes us to the concept ofgains from trade.
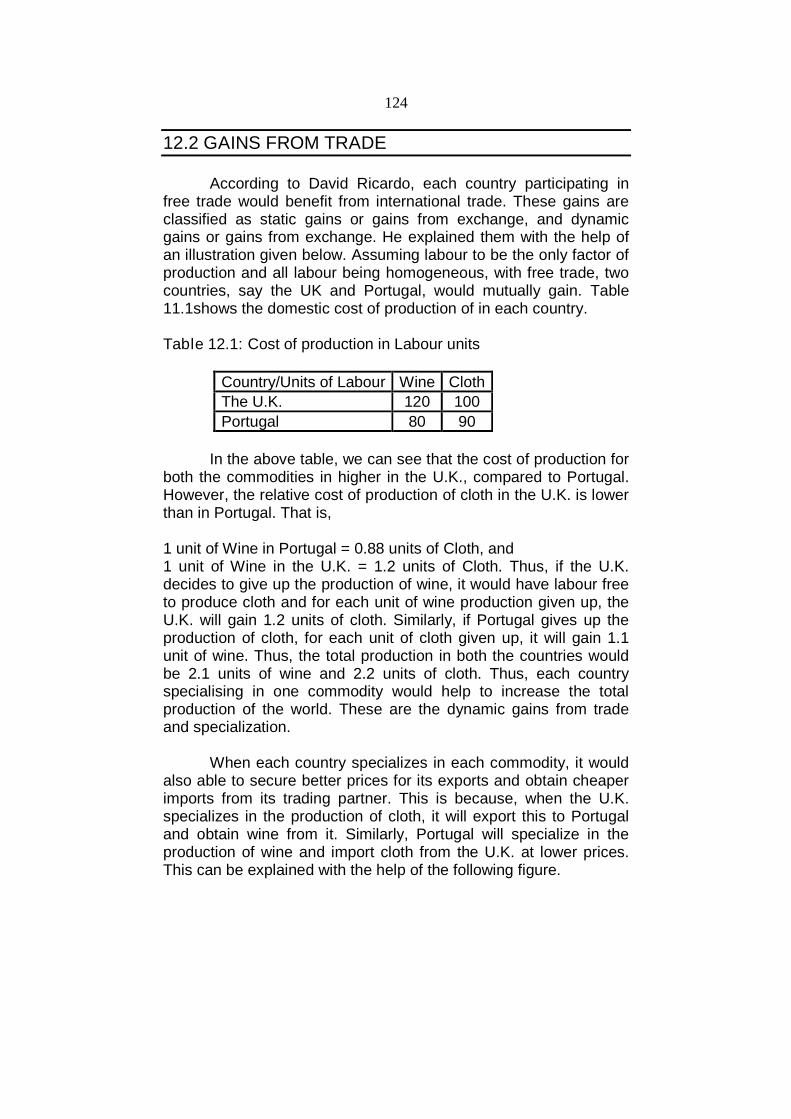
124
12.2 GAINS FROM TRADE
According to David Ricardo, each country participating infree trade would benefit from international trade. These gains areclassified as static gains or gains from exchange, and dynamicgains or gains from exchange. He explained them with the help ofan illustration given below. Assuming labour to be the only factor ofproduction and all labour being homogeneous, with free trade, twocountries, say the UK and Portugal, would mutually gain. Table11.1shows the domestic cost of production of in each country.
Table 12.1: Cost of production in Labour units
Country/Units of Labour Wine Cloth
The U.K. 120 100
Portugal 80 90
In the above table, we can see that the cost of production forboth the commodities in higher in the U.K., compared to Portugal.However, the relative cost of production of cloth in the U.K. is lowerthan in Portugal. That is,
1 unit of Wine in Portugal = 0.88 units of Cloth, and1 unit of Wine in the U.K. = 1.2 units of Cloth. Thus, if the U.K.decides to give up the production of wine, it would have labour freeto produce cloth and for each unit of wine production given up, theU.K. will gain 1.2 units of cloth. Similarly, if Portugal gives up theproduction of cloth, for each unit of cloth given up, it will gain 1.1unit of wine. Thus, the total production in both the countries wouldbe 2.1 units of wine and 2.2 units of cloth. Thus, each countryspecialising in one commodity would help to increase the totalproduction of the world. These are the dynamic gains from tradeand specialization.
When each country specializes in each commodity, it wouldalso able to secure better prices for its exports and obtain cheaperimports from its trading partner. This is because, when the U.K.specializes in the production of cloth, it will export this to Portugaland obtain wine from it. Similarly, Portugal will specialize in theproduction of wine and import cloth from the U.K. at lower prices.This can be explained with the help of the following figure.
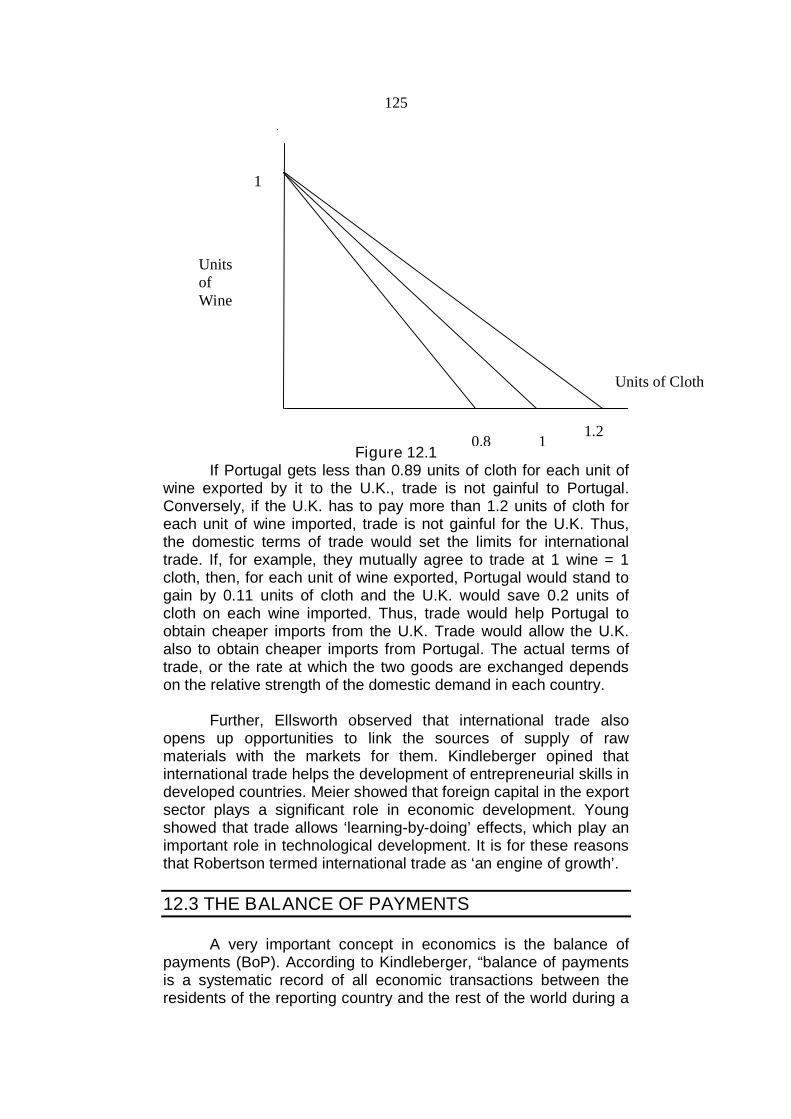
125
Figure 12.1If Portugal gets less than 0.89 units of cloth for each unit of
wine exported by it to the U.K., trade is not gainful to Portugal.Conversely, if the U.K. has to pay more than 1.2 units of cloth foreach unit of wine imported, trade is not gainful for the U.K. Thus,the domestic terms of trade would set the limits for internationaltrade. If, for example, they mutually agree to trade at 1 wine = 1cloth, then, for each unit of wine exported, Portugal would stand togain by 0.11 units of cloth and the U.K. would save 0.2 units ofcloth on each wine imported. Thus, trade would help Portugal toobtain cheaper imports from the U.K. Trade would allow the U.K.also to obtain cheaper imports from Portugal. The actual terms oftrade, or the rate at which the two goods are exchanged dependson the relative strength of the domestic demand in each country.
Further, Ellsworth observed that international trade alsoopens up opportunities to link the sources of supply of rawmaterials with the markets for them. Kindleberger opined thatinternational trade helps the development of entrepreneurial skills indeveloped countries. Meier showed that foreign capital in the exportsector plays a significant role in economic development. Youngshowed that trade allows ‘learning-by-doing’ effects, which play animportant role in technological development. It is for these reasonsthat Robertson termed international trade as ‘an engine of growth’.
12.3 THE BALANCE OF PAYMENTS
A very important concept in economics is the balance ofpayments (BoP). According to Kindleberger, “balance of paymentsis a systematic record of all economic transactions between theresidents of the reporting country and the rest of the world during a
UnitsofWine
1
1.210.8
Units of Cloth
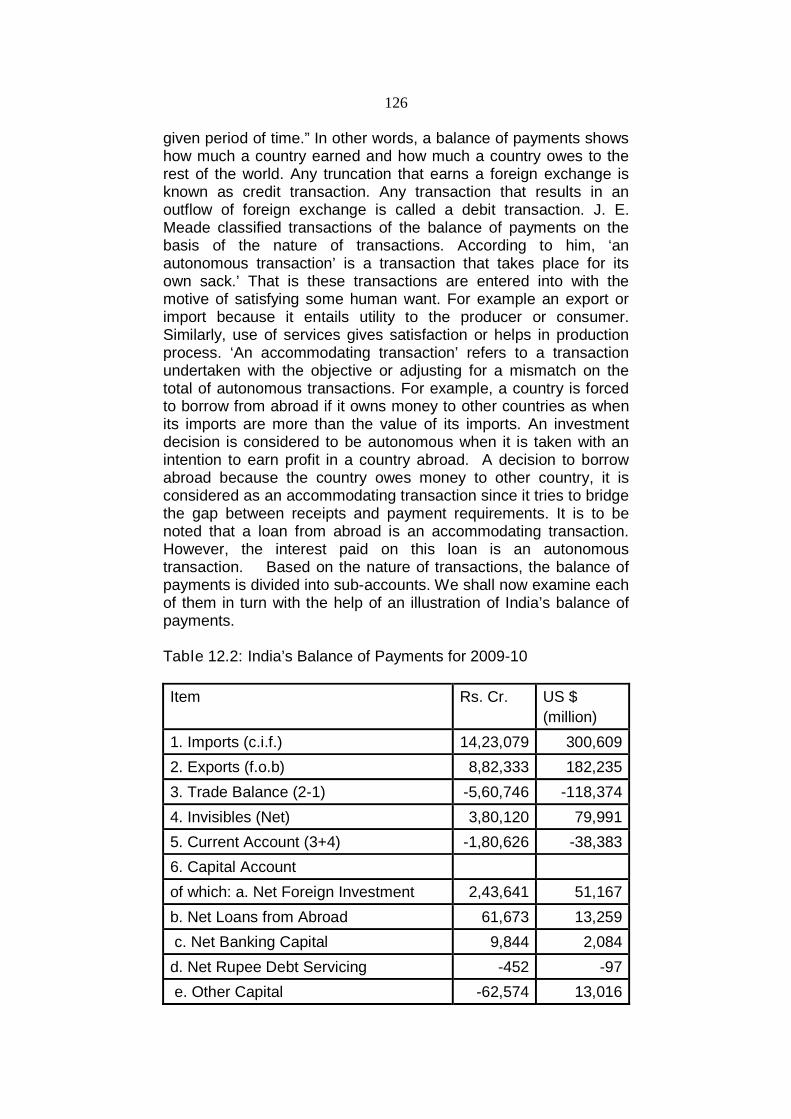
126
given period of time.” In other words, a balance of payments showshow much a country earned and how much a country owes to therest of the world. Any truncation that earns a foreign exchange isknown as credit transaction. Any transaction that results in anoutflow of foreign exchange is called a debit transaction. J. E.Meade classified transactions of the balance of payments on thebasis of the nature of transactions. According to him, ‘anautonomous transaction’ is a transaction that takes place for itsown sack.’ That is these transactions are entered into with themotive of satisfying some human want. For example an export orimport because it entails utility to the producer or consumer.Similarly, use of services gives satisfaction or helps in productionprocess. ‘An accommodating transaction’ refers to a transactionundertaken with the objective or adjusting for a mismatch on thetotal of autonomous transactions. For example, a country is forcedto borrow from abroad if it owns money to other countries as whenits imports are more than the value of its imports. An investmentdecision is considered to be autonomous when it is taken with anintention to earn profit in a country abroad. A decision to borrowabroad because the country owes money to other country, it isconsidered as an accommodating transaction since it tries to bridgethe gap between receipts and payment requirements. It is to benoted that a loan from abroad is an accommodating transaction.However, the interest paid on this loan is an autonomoustransaction. Based on the nature of transactions, the balance ofpayments is divided into sub-accounts. We shall now examine eachof them in turn with the help of an illustration of India’s balance ofpayments.
Table 12.2: India’s Balance of Payments for 2009-10
Item Rs. Cr. US $
(million)
1. Imports (c.i.f.) 14,23,079 300,609
2. Exports (f.o.b) 8,82,333 182,235
3. Trade Balance (2-1) -5,60,746 -118,374
4. Invisibles (Net) 3,80,120 79,991
5. Current Account (3+4) -1,80,626 -38,383
6. Capital Account
of which: a. Net Foreign Investment 2,43,641 51,167
b. Net Loans from Abroad 61,673 13,259
c. Net Banking Capital 9,844 2,084
d. Net Rupee Debt Servicing -452 -97
e. Other Capital -62,574 13,016
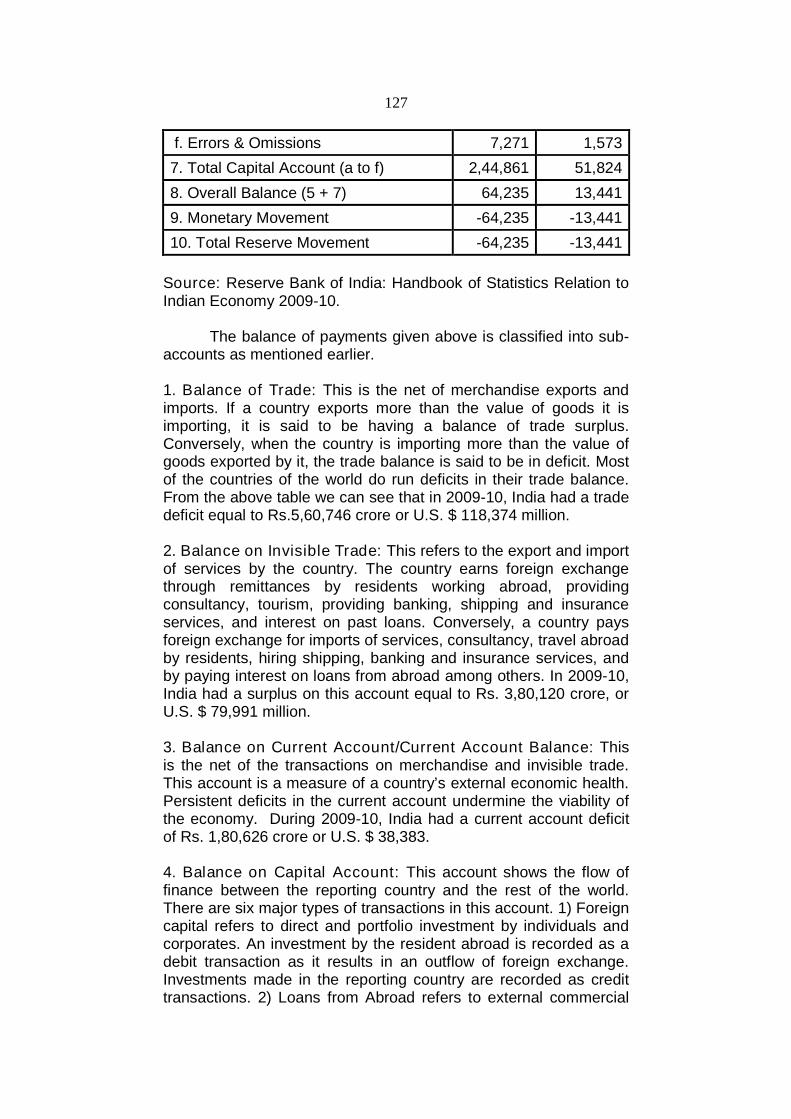
127
f. Errors & Omissions 7,271 1,573
7. Total Capital Account (a to f) 2,44,861 51,824
8. Overall Balance (5 + 7) 64,235 13,441
9. Monetary Movement -64,235 -13,441
10. Total Reserve Movement -64,235 -13,441
Source: Reserve Bank of India: Handbook of Statistics Relation toIndian Economy 2009-10.
The balance of payments given above is classified into sub-accounts as mentioned earlier.
1. Balance of Trade: This is the net of merchandise exports andimports. If a country exports more than the value of goods it isimporting, it is said to be having a balance of trade surplus.Conversely, when the country is importing more than the value ofgoods exported by it, the trade balance is said to be in deficit. Mostof the countries of the world do run deficits in their trade balance.From the above table we can see that in 2009-10, India had a tradedeficit equal to Rs.5,60,746 crore or U.S. $ 118,374 million.
2. Balance on Invisible Trade: This refers to the export and importof services by the country. The country earns foreign exchangethrough remittances by residents working abroad, providingconsultancy, tourism, providing banking, shipping and insuranceservices, and interest on past loans. Conversely, a country paysforeign exchange for imports of services, consultancy, travel abroadby residents, hiring shipping, banking and insurance services, andby paying interest on loans from abroad among others. In 2009-10,India had a surplus on this account equal to Rs. 3,80,120 crore, orU.S. $ 79,991 million.
3. Balance on Current Account/Current Account Balance: Thisis the net of the transactions on merchandise and invisible trade.This account is a measure of a country’s external economic health.Persistent deficits in the current account undermine the viability ofthe economy. During 2009-10, India had a current account deficitof Rs. 1,80,626 crore or U.S. $ 38,383.
4. Balance on Capital Account: This account shows the flow offinance between the reporting country and the rest of the world.There are six major types of transactions in this account. 1) Foreigncapital refers to direct and portfolio investment by individuals andcorporates. An investment by the resident abroad is recorded as adebit transaction as it results in an outflow of foreign exchange.Investments made in the reporting country are recorded as credittransactions. 2) Loans from Abroad refers to external commercial
128
borrowings and external assistance, including the trade creditaccessed by exporters. 3) Banking capital refers to inflows andoutflows in the commercial banking sector. 4) Rupee DebtServicing refers to the interest paid on loans taken from theerstwhile Soviet Bloc countries. 5) Other capital flows aremiscellaneous flows India witnessed an outflow on this account in2009-10. 6) Errors and Omissions are the sum of recording errors.For India, in 2009-10, the sum of these six transactions amountedto Rs. 2,24,861 crore or U.S. $ 51,824 million.
5. Overall Balance: This is the net of current and capital accountbalance. In 2009-10, for India this amount was Rs. 64,235 crore, orU.S. $ 13,441 million. The net inflow of capital results in reserveaccretion or addition to the stock of the foreign currency assets(FCAs) of the country. If the country cannot mobilize adequatefunds on its own, it will have to borrow from the InternationalMonetary Fund (IMF). Monetary movements refer to transfer offoreign exchange reserves/gold held by the central bank of thecountry to settle the disequilibrium in the balance of payments. Ifthe country has a surplus in the trade balance and/or the invisibles,it may run a surplus in the current account. This surplus iscompensated by an off-setting deficit in the capital account.Conversely, when the country has a deficit in the trade balanceand/or a deficit in the invisibles, it may run a deficit in the currentaccount. This is compensated by borrowings from other countries,running down the reserves, and/or a loan from the IMF. In all suchcases, the country would run a surplus in the capital account. Thus,a country may have a deficit or a surplus in any one account but theoverall balance of payments always balances.
Check Your Progress:
1. Balance of payments shows all the economic transactionsbetween a country and the rest of the world.
2. Balance of payments always balances because ofaccommodating transcations.
3. Capital account transactions are of long-term in nature.
129
12.4 TYPES/CAUSES OF DISEQUILIBRIUM IN THEBALANCE OF PAYMENTS
A balance of payments may not always be in balance. Thatis, at any point of time, during a given period of time, a country mayexperience a mismatch between its receipts and payments.However, a balance of payments disequilibrium then has a specificconnotation and should not be confused with a temporary deviation.According to Machlup, a balance of payments disequilibrium refersto continuous, persistent occurrence of deficits or surpluses. Sincethe deficits are more common and difficult to handle, the traditionalinternational trade theory focused on them, with little attention tocases where there are surplus. According to Kindleberger, thereare three types of disequilibrium depending on the nature and theunderlying causes. They are classified as under:
1. Cyclical Disequilibrium:This refers to payments disequilibrium due to trade cycles.
Thus, during a boom, a country would be experiencing importsurplus; exports would decline due to higher domestic prices, andrun a trade deficit. Alternately, when there is a recession, thecountry would experience a surplus since the demand for importswill decline and due to lower prices, the exports would increase.This type of disequilibrium does not require an special measures tocontain the payments disequilibrium since the domestic stabilisationpolicies would automatically take care of the disequilibrium. Whenthere are two countries, the country with a stronger trade cyclewould alternatively be fluctuating compared to its trading partner.
2. Secular Disequilibrium:This case is applicable to most of the developing countries.
In developing countries, the available investment opportunities farexceed the available savings/resources. In such cases, the countrymay have to borrow for a long period until it can generate adequateexportable surpluses. As a country develops, its productioncapacity increases, increases the exports and the country earn thecapacity to repay the loans. In this case, also, there is no need for aseparate balance of payments adjustment policy.
3. Structural Disequilibrium:A structural disequilibrium affects only one or few sectors of
the economy. Thus, it is different from the cyclical and seculardisequilibrium, which affect the entire economy. Kindlebergeridentified two types of structural disequilibria.
A). Structural disequilibrium in the goods market: this refers tothe changes in the demand and supply conditions in a particularsector. A sudden, permanent change in demand, like in the case of
130
jute industry due to the introduction of plastic; the effect on demandfor cotton textiles due to the introduction of synthetic fibers; theimpact on metal industry due to the introduction of poly fibers, aresome of the examples of structural disequilibrium. A sudden cropfailure, shortage of raw materials, a strike in the major industrywould force the country to opt for imports as in the case of the USsteel imports and cause a large deficit in the balance of payments.Sometimes a country may suffer a loss of service income like Egyptwhen the Suez canal was closed, Belgium due to the closure ofcopper mines in Congo; India in case of Gulf Crisis.
B). Structural disequilibrium in the factor markets arises when thefactor prices fails to reflect the relative factor availability. Whengovernment tries to protect the labour and introduce wageregulations, the cost of labour increases relative to that of thecapital. In such cases, the producers would prefer to employ morecapital and less labour. As a result, the production structure will bedistorted and the country would be producing goods that need moreof imported raw materials and a continuous worsening of thebalance of payments. In countries like India and many otherdeveloping countries, this has happened.
C). A persistent and high rate of Inflation tends to push the relativeprices higher than the world prices. As exports become costlier,demand will shrink. At the same time, imports would be cheaperand increasing. Thus, the trade balance will continue to worsen.The high rates of domestic inflation in case of many developingcountries were found to be the main reason for decline in exports.
D). Flight of capital is also an important cause of a structuraldisequilibrium. In Europe, during the 1930s, the withdrawal offoreign capital lead to severe decline in the levels of output andemployment and resulted in the World War II. Similarly, in case ofIndia, Egypt, Latin America the political uncertainties due toindependence movements led to withdrawal of foreign capital thatpermanently affected the economy. In recent years, the fear thatChina may introduce communist rule in Hong Kong led to flight ofcapital. A continuous depreciation in a currency also triggers flightof capital and therefore, the central banks try to maintain a stableexchange rate.
4. Fundamental Disequilibrium:According to the International Monetary Fund (IMF), the
case of a ‘fundamental disequilibrium’ is the most important form ofdisequilibrium and needs special attention. A country is said to besuffering from a fundamental disequilibrium if the followingconditions are observed:
131
1) A persistent and high rates of domestic inflation.
2) A persistent and high levels of fiscal deficits (more than 3% ofGDP).
3) An overvalued exchange rate.
4) Factor market distortions, where the price of labour is higherthan the marginal product of labour and/or subsidisation ofcapital with the price of capital being lower than its marginalproduct.
5) An irrecoverable loss of export markets due to changes indemand or introduction of substitutes and/or introduction of newtechnologies- India loosing markets for its jute exports; Egyptloosing markets for its cotton exports and Ghana losing its tinexport markets.
6) Consistently adverse capital flows
7) Persistent and high external borrowings, and,
8) Domestic distortions in the form of adverse trade and industrialpolicies.
Check Your Progress:
1. Trade cycles cause cyclical disequilibrium.2. Secular disequilibrium is common in developing countries.3. Factor market distortions lead to structural disequilibrium.4. Inflation causes a fall in exports and an increase in imports.
12.5 METHODS OF BALANCE OF PAYMENTSADJUSTMENT
As noted earlier, though the balance of paymentsdisequilibrium refers to both a deficit and a surplus, economictheory concerned it with correcting a deficit since it is more difficultto tackle. We shall now examine some of the methods of adjustingor overcoming a balance of payments deficit. They are broadlyclassified as monetary and non-monetary methods.
132
1. Monetary Measures:These methods try to change the demand and supply of
money, interest rates, availability of credit and the exchange ratesto bring about a change in the demand for exports/imports and thesupply of exports. We shall examine them in detail now.
A). Deflation:Under this method, the central bank of the country with a
payments deficit will reduce the supply of credit through increase inopen market operations, reduction in money supply. The centralbank will reduce the loans to the government since budget deficitsare an important source of excess demand for goods and services.It will increase the bank rate so that the lending rates in theeconomy increases and this will bring down the demand for bankcredit. As the levels of expenditure and investment fall, the demandfor imports would decrease. At the same time, as the domesticprice level falls, the exports would become cheaper and thebalance of trade would improve. However, this method lost itssheen after the Great Depression.
B). Depreciation:In this case, the central bank of the country allows the
market value of exchange rate to decrease. When imports increaseand exports fall, the demand for the country’s currency decreasesin the market and the demand for foreign currency increases. In thiscase, the exchange rate starts falling. As the exchange ratedepreciates, it results in a fall in demand for imports and exportsstarts picking up. However, this method is rarely resorted to since acontinuous depreciation in a currency results in speculative attacksand this can result in flight of capital, which we discussed in thecauses of disequilibrium. It is important to remember that since thedepreciation is market determined, a currency may depreciate vis-à-vis one currency and appreciate vis-à-vis another at the sametime depending on the relative demand for each currency. The1998 Asian Contagion is one example of speculative attacks on acurrency.
C). Devaluation:This is a method where, the central bank of the country will
lower the official value of the currency. The currency of eachcountry is officially declared in terms of gold or SDRs. When facedwith persistent deficits, central banks devalue their currency. Since1946, all the member countries of the IMF require its priorpermission to devalue their currency. In June 1991, India devaluedits currency in order to overcome its balance of payments crisis. Incase of devaluation, the value of the currency falls vis-à-vis all itstrading partners. Thus, exports to all countries and imports from allcountries are affected equally. The use of devaluation is governedby certain principles. This is known as the “Marshall-Lerner
133
Condition.” Let us examine this condition first. According to thiscondition, a country should devalue only when it faces elasticdemand for both its exports and imports. This is given as:
In the above equation, = the rate of change in the trade balance
due a devaluation. = elasticity of demand for exports of the
devaluing country. = elasticity of demand for imports in the
devaluing country. If the sum of the elasticity is more than one, thenonly a country will gain from devaluation. This is explained with thehelp of an example:
Say, India’s export elasticity is 2.1, and its import elasticity is 2.4. Insuch a case, a 7.5 percent devaluation of rupee results in a 15.75percent increase in its exports and an 18.00 percent fall in itsimports. Thus, India’s trade balance would improve by 33.75percent. However, using devaluation needs caution due to thefollowing factors:
a) Competitive Devaluation: In this case, as a country tries toimprove its trade balance through devaluation, its trading partnersmay also try the same. In such a case, the total trade will fall, asexports of one country are nothing but imports by another. This hasactually happened in the 1930s. It is for this reason that the IMFensures maintenance of stable exchange rates by all its members.
b) Nature of Trade: Devaluation can be successful only when thecountry concerned imports/exports goods that have elasticdemand. In case of most of the developing countries, their importsare of essential in nature like, oil, fertilizers and machinery. Thedemand for these goods is inelastic. They export primary goods forwhich the demand is either stagnant or declining. In such cases, adevaluation of the currency may actually deteriorate the balance ofpayments.
c). J-curve: It is observed that when a country devalues itscurrency, the immediate effect is a worsening of the trade balance.This is because; the demand and supply conditions will have toadjust to the new prices. Till such time, a fall in the exchange ratewould reduce the export earnings and the increase in import priceswill increase the import bill. It will take three months for the tradebalance to improve. During such time, the government should nottry to interfere with the working of the market. It is observed bystudies that in June 1966, when the Indian rupee was devalued, theimmediate effect was a worsening of the trade balance. Politicalpressures forced the government to reverse all the policies thatwere introduced to promote trade.
134
d). Speculation: It is observed that devaluation can result in furtherexpectations about the fall in exchange rate. Thus, the central bankhas to be on guard against such possibilities. This was the casewith many Latin American countries in 1970s and 1980s.
C). Exchange Controls: Under this method, the central banktries to control the use of scarce foreign exchange for specifiedpurposes. It also enters into agreements with important tradingpartners about the rate at which the exports and imports of eachcountry need to be traded. It also determines different exchangerates for different purposes/types of imports. Though thesemethods were extensively used until recently, the IMF ensured thatmost of them are eliminated.
2. Non-Monetary Measures:These methods try to reduce imports and/or increase
exports to improve the trade balance. The important among theseare as under:
A). Tariffs:A tariff refers to a tax on imports and/or exports. If taxes are
imposed on exports, it is known as ‘export tariffs’ or ‘export duties’.However, export tariffs are rare, since no country would like to seea fall in exports due to higher prices. An ‘import tariff’ or ‘importduty’ refers to a tax on imports. Since a tax increases the price ofimports, these are popular method of controlling imports. Further,import tariffs are an important source of public revenue in manycountries. ‘Transit duties’ are taxes imposed on goods passingthrough the borders of a country, but not meant for sale in thecountry. Since early 1990s, many countries have opted forliberalization of trade and industry and as such, the role of tariffs inadjustment has reduced greatly. Further, any discriminating tariff issubject to the jurisdiction of WTO and is not allowed. Thus, the roleof tariffs to improve the trade balance virtually ended in 1995.
B). Quotas:These are restrictions on the volume of trade. They may be
specified in physical terms, as imports of a given quantity needgovernment clearance. They can be specified in terms of foreignexchange allowed on a particular import. These are also redundantnow since the WTO disallows are quota restrictions on trade.
135
Check Your Progress:
1. A depreciation of currency is determined by the market.2. Devaluation reduces the prices of exports for all trading partners
equally.3. Devaluation does not result in immediate improvement in the
trade balance.
12.6 QUESTIONS
1. Explain the different gains from trade.2. What are the various causes of balance of payments
disequilibrium?3. Examine the different monetary measures of adjustment.
136
13
TRENDS IN INDIA’S BALANCE OFPAYMENTS AND
WTO AGREEMENTS ON TRIPS, TRIMS,AND GATS
Unit Structure :
13.0 Objectives
13.1 Introduction
13.2 Trends in India’s Balance of Payments
13.3 TRIPs, TRIMs and GATs
13.7 Questions
13.0 OBJECTIVES
Understand the major trends in India’s balance of paymentssince 1991.
Understand the nature of WTO Agreements on TRIPs, TRIMsand GATS.
13.1 INTRODUCTION
Since its Independence in 1947, India continuouslyexperienced balance of payments disequilibrium. During the 1940sand 1950s, India could withdraw from the sterling balances held atthe Bank of England. In the sixties and seventies, the huge tradedeficits were mitigated to certain extent by the inflow of remittances.In the 1980s, external borrowings covered these deficits. Thus, by1990, the Indian economy was faced with the threat of default andinability to raise further loans to finance the trade deficits. In June1991, the government was forced to introduce economic reforms.Important among them were the trade policy reforms. Thesignificance of these reforms reflects in the changing trends inIndia’s balance of payments since 1991.
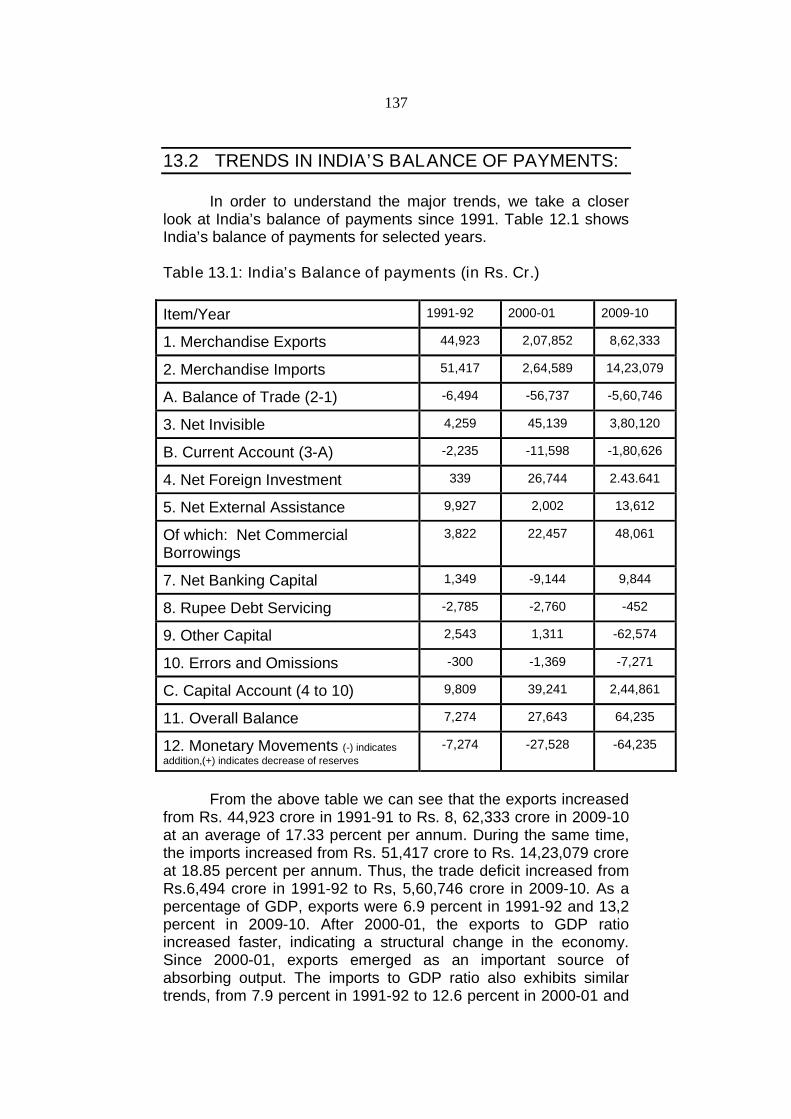
137
13.2 TRENDS IN INDIA’S BALANCE OF PAYMENTS:
In order to understand the major trends, we take a closerlook at India’s balance of payments since 1991. Table 12.1 showsIndia’s balance of payments for selected years.
Table 13.1: India’s Balance of payments (in Rs. Cr.)
Item/Year 1991-92 2000-01 2009-10
1. Merchandise Exports 44,923 2,07,852 8,62,333
2. Merchandise Imports 51,417 2,64,589 14,23,079
A. Balance of Trade (2-1) -6,494 -56,737 -5,60,746
3. Net Invisible 4,259 45,139 3,80,120
B. Current Account (3-A) -2,235 -11,598 -1,80,626
4. Net Foreign Investment 339 26,744 2.43.641
5. Net External Assistance 9,927 2,002 13,612
Of which: Net CommercialBorrowings
3,822 22,457 48,061
7. Net Banking Capital 1,349 -9,144 9,844
8. Rupee Debt Servicing -2,785 -2,760 -452
9. Other Capital 2,543 1,311 -62,574
10. Errors and Omissions -300 -1,369 -7,271
C. Capital Account (4 to 10) 9,809 39,241 2,44,861
11. Overall Balance 7,274 27,643 64,235
12. Monetary Movements (-) indicates
addition,(+) indicates decrease of reserves
-7,274 -27,528 -64,235
From the above table we can see that the exports increasedfrom Rs. 44,923 crore in 1991-91 to Rs. 8, 62,333 crore in 2009-10at an average of 17.33 percent per annum. During the same time,the imports increased from Rs. 51,417 crore to Rs. 14,23,079 croreat 18.85 percent per annum. Thus, the trade deficit increased fromRs.6,494 crore in 1991-92 to Rs, 5,60,746 crore in 2009-10. As apercentage of GDP, exports were 6.9 percent in 1991-92 and 13,2percent in 2009-10. After 2000-01, the exports to GDP ratioincreased faster, indicating a structural change in the economy.Since 2000-01, exports emerged as an important source ofabsorbing output. The imports to GDP ratio also exhibits similartrends, from 7.9 percent in 1991-92 to 12.6 percent in 2000-01 and
138
21.7 percent in 2009-10. This is attributed to the liberalisation of theimports of a number of consumer goods like automobiles, winesand others. As India emerged as the second fastest growingeconomy of the world, its imports were growing faster. At the sametime, the post-reform period saw the global slowdown due to theAsian Contagion, the Argentine Banking Crisis, the GlobalSlowdown and the Global Financial Crisis in 1998, 2000, 2009-11.This led to adverse external demand conditions for India’sexports. During the post-reform period, the trade deficit to GDPratio increased from -1.0 to -2.7 and to 8.6 percent respectively in1991-92, 2000-01 and 2009-10. Thus, the trade balance turnedadverse during the post-reform period.
The invisibles rose from Rs. 4,259 crore in 1991-92 to Rs.3,80,120 crore during 1991-92 and 2009-10. They registered anannual growth of 24.11 percent. As a percentage of GDP, invisibleswere 0.7, and 5.8 during this period. The invisibles also postedhigher growth after 2000-01.
The current account deficit averaged to 1.1 percent during1991-92 and 2000-01. It was in surplus for three years during 2001-02 and 2003-04. The current account turned into deficit after thisand averaged to 1.6 percent subsequently. Thus, the net invisiblesfinanced most of the current account deficits during the post-reformperiod.
The capital account continues to be a major source ofconcern. Although the net foreign investment in India rose from Rs.339 crore in 1991092 to Rs. 2,43,641 crore in 2009-10, as apercentage of GDP, this is 1.4. Thus, the attempts to attract foreigncapital to facilitate growth have not yielded the desired results.India’s failure to attract foreign investment is attributed to lack ofconsistent policies, bureaucratic hurdles, and global factors. T. N.Srinivasan felt that India is fraught with excessive controls and thuscould not emerge as a destination for investment. Most of theforeign investment is confined to production of luxury goods andthus faces the threat of stagnant demand.
External assistance rose from Rs. 9,927 crore to Rs. 13,612crore during 1991-92 and 2009-10. External commercial borrowings(ECBs) rose from Rs. 3,822 crore to Rs. 48,061 crore during thisperiod. The total external debt as percentage of the GDP rose from2.1 in 2000-01 to 2.6 in 2009-10. More importantly, the debt-servicing burden declined from 35.3 percent in 1990-91 to 16.6percent in 2000-01 and further to 5.5 percent in 2009-10. This isbecause; India still relies on long-term debt to finance its externalliabilities. However, after 2005-06, the share of short-term debt hasbeen increasing. As a result, the funds are required to redeemthese liabilities at short intervals and any volatility in exchange rate
139
and/or export import performance will strain the balance ofpayments. This causes adjustment problems when the externalconditions turn adverse. Most of the external liabilities are in theform of inter-government loans and NRI deposits.
Net banking capital inflows rose from Rs. Rs. 1,349 crore in1991-92 to Rs. 9,844 crore in 2009-10. However, during 2000-01and 2007-08, there were outflows due to adverse externalconditions. As the role of Soviet Bloc declined in India’s trade, therupee debt servicing fell from Rs. 2,543 crore in 1991-92 to Rs. 452crore in 2009-10.
The most important development during the nineties is thereserve accumulation by India. India emerged as the fourth largestholder of foreign exchange reserves at $ 297 billion by December2010. Because of this, the import cover rose from 2.5 months in1990-91 to 8.8 months in 2000-01 and to 11.1 months by March2010.
It can be safely concluded that after 1991, India’s balance ofpayments show a healthy set of indicators. This is in face offrequent adverse external conditions. Though the imports ratiocontinues to be high, it is to be understood that most of theseimports are inputs/components that are used in production. Thedomestic industry adopted itself to the external competition andcould emerge as a successful exporter as well. As of now, there isno immediate threat to the viability of the balance of payments.
Check Your Progress:
1. Why does India have a trade deficit?
2. What are the important factors that moderate the trade deficit?
3. What are the important items on capital account for India?
13.3 TRIPS, TRIMS AND GATS
The World Trade Organisation (WTO) was set up in 1995 asthe watchdog for ensuring the free flow of trade among nations.India is one of the founder members of the WTO and played a vital
140
role in the multilateral trade negotiations. Initially, the WTO was toconfine itself to the regulation of trade in goods. As thesenegotiations known as Uruguay Round progressed, the developedcountries succeeded in bringing in a number of issues that are notdirectly related to trade in goods under the gamut of the WTO.Important among these are the Trade Related Aspects ofIntellectual Property Rights (TRIPs), Trade Related InvestmentMeasures (TRIMs) and the General Agreement on Trade inServices (GATS). These three agreements are since considered tobe more detrimental to the national interests of the developingcountries than the tariff and non-tariff barriers that these countrieshad to face. The benefits of lowered tariff rates were more thanoffset by these agreements. We shall examine them in detail.
13.3.1 Trade Related Aspects of Intellectual Property Rights(TRIPs):
Intellectual property is considered as the corner stone for theprogress of developed countries. It refers to the creation and use ofknowledge. In simple terms, it refers to the protection that isaccorded to the creators of knowledge. Under the TRIPsAgreement, it is proposed that Member countries should grantprotection to the patents obtained by individuals and organisationsfrom the other member countries. Thus, a firm can claim a patent inthe USA and this protection is accorded to it in all the membercountries of the WTO. An important aspect of the new regimeproposed under the TRIPs agreement is that a patent is a productpatent. That is protection is given to entire product. Apart frompatents, the protection is given in the form of ‘exclusive marketrights’ also. Under this, a firm can obtain license as the solesupplier of a designated product in a particular market/country. Noother firm would be allowed to enter in to this market. It is arguedthat these protections would encourage innovation andtechnological progress. However, over the years, a number ofissues emerged that showed the iniquitous nature of thisagreement. We shall now examine some of them.
1. Protection of the intellectual property goes against the spiritof free trade. Most of the patents are claimed by the multi-nationalcorporations (MNCs) operating from the USA and Europe. In caseof pharmaceutical sector, the prices of medicines with patents andexclusive market rights, the prices are much higher than incountries with no such protection. This causes the exploitation ofthe consumer. It is interesting to note that the USA has been avocal supporter of these measures. When some countries likeSouth Africa and Brazil proposed to waive off the protection onsome of the life saving drugs for HIV/AIDS treatment, the USopposed it claiming the ‘national emergency’ clause cannot beinvoked by a member country. However, in wake of the terrorist
141
attacks on the USA, the anthrax medicines were required on alarge scale. Novartis Company had the exclusive market rights forthis product in the USA. When it was found that the medicinesprovided by Novartis are three to four times higher than thosesupplied by companies in the developing countries like India, theUS proposed to waive the protection accorded to Novartis. Thus,the USA, who champions the cause of free trade, is moreopportunistic than the others are. The Supreme Courts of Brazil,South Africa and others, that the national government alone has theauthority to declare a situation as a national emergency and nointernational agreement can absolve a country of this right haveruled it.
2. The introduction of product patents led to a situation wherethe domestic pharmaceutical industries have to face a survivalproblem. The production of generic drugs has been an importantsource of innovation that contributed to lower prices and expansionof firms. The introduction of product patents in India in 2005 createda number of problems.
3. The patent regime, created a situation where traditionalknowledge also could be exploited by profit-seeking MNCs. In caseof many Latin American countries, this has happened. In case ofIndia, the introduction of a particular variety of rice, termed as“Texamati” created a furore. Similarly, attempts to seek patents onturmeric and neem products also demonstrated the dangers of theTRIPs agreements.
4. The TRIPS agreement provides for protection of traditionalknowledge from being patented. This includes plant varieties also.The country has to declare a list of such items that are termed as‘traditional’. In many developing countries, including India, preciouslittle is being done in this direction and thus, the MNCs can easilyclaim protection on them.
5. Patenting of plant varieties will lead to serious problems inthe developing countries. Providing seeds at reasonable prices isa task of all the national governments. If patents are granted to theprofit-driven MNCs on plants, the farmers would be left withnothing for survival. An undeniable right of the farmers has been touse the produce of a year as seeds for the next. It is observed thatin case of certain seeds supplied by the MNCs, this is not possible.In other words, the farmer cannot use his produce as seeds andhas to return to the same MNC each year for seeds.
6. The patenting of microorganisms is a further cause ofconcern. These are used extensively in agriculture,pharmaceuticals and biotechnology. In the coming years, thesetechnologies would hold the key for increased production andefficiency. Once the MNCs obtain the protection, these benefits
142
would be denied to a vast majority of population in the developingcountries.7. Most importantly, the developing countries are helplessvictims of the new global trade regime imposed by the developedcountries at the behest of the MNCs, which provide funds to thesegovernments. The WTO provides for a dispute settlementmechanism. Experience however, shows that in many cases, thedeveloping countries are forced to suffer the losses than tochallenge the will of the advanced countries.
Thus, it is reasonable to conclude that the TRIPs agreementconferred undue advantages to the rich nations at the cost of thedeveloping countries.
Check Your Progress:
1. What are the main provisions of the TRIPs?2. What losses are associated with the granting of product patents
in pharmaceuticals?3. Granting of patents in agriculture will be harmful to the farmers.
13.3.2. Trade Related Investment Measures:The Agreement on Trade Related Investment Measures
(TRIMs) relates to the restrictions on foreign investment, domesticregulations of industrial activity and the incentives accorded to thedomestic industries. ‘The national treatment clause’ allows for non-discrimination between a domestic and a foreign firm in access tothe markets in a member country. On the face of it, this agreementlooks innocuous. However, the actual implications have disastrousconsequences. Let us now examine them in detail.
1. An important provision for the development of domesticindustries has been the local content requirements. Under thisprovision, each foreign firm when enters into a country is requiredto obtain a certain percentage of its value added from the domesticsuppliers. This arrangement was historically used by all the presentday developed countries, including the USA. However, under thenew WTO regime, this benefit is denied to the developing countries.All the local content requirements are declared as invalid. This has
143
adversely effected the development of industrial sector in thedeveloping countries, including India.2. Providing subsidised capital for industries of nationalimportance has also been an important measure at promotingeconomic development. However, the TRIMs do not allow suchprovisions. In one case, the EU approached the WTO DisputeSettlement Board seeking to revoke the interest subsidies to ironand steel industry in India. Since India did not have a balance ofpayments problem, the DSB ruled that India should stop thesesubsidies.
3. The TRIMs do not allow the host country to select theindustries in which it would like to attract foreign capital. Thus,under this regime, only profit seeking capital would be flowing intothe developing countries. The increase in investments by manyluxury foreign brands in India after 1991 is an indication of theadverse consequences of TRIMs. The EU countries have beendemanding the liberalisation of wine/liquor investments in India.Profits, rather than public welfare are the guiding force of capitalistinvestment.
Check Your Progress:1. What is TRIMs?2. What do you understand by the local content requirements?
13.3.3. General Agreement on Trade in Services (GATS):According to the IMF, trade in services refer to ‘economic
output of intangible commodities that may be produced, transferredand consumed at the same time.’ There are three importantcomponents of trade in services:
a. Transport: This covers all transport services provided byresidents of one economy for those of other and involvetransport of passengers, goods and so on. Insurance freightis not cluded here.
b. Travel: This covers goods and services acquired form aneconomy by travellers in that economy for their own useduring visits of less than one-year duration for business and
144
personal purposes. This includes meals, lodging, andtransport.
c. Other commercial services: These include activities likeinsurance and financial services, internationaltelecommunications, and postal and courier services,computer data, news related service transactions betweenresidents and non-residents, construction services, rolaytiesand license fees, miscellaneous business, professional andtechnical services, and personal, cultural, and recreationalservices.
The GATS encompasses all that is traded under the four modesof service transactions carried out among different countries: i)cross-border trade (Mode 1); ii) consumption abroad (Mode 2); iii)Commercial presence (Mode 3); and iv) movement of naturalpersons (Mode 4). It proposes to bring in more transparency in thetrade of these services and to provide a level-playing field for allmembers.
Indian commitments at the GATS cover 33 activities likebusiness services; communications; construction work for civilengineering; financial services; health-related and social services;tourism among others. These commitments have sectoralvariations in terms of free access to Foreign Service providers. Italso committed on market access and national treatment clauseson sectoral restrictions in services. India did not undertake anycommitments in services relating to distribution, education,environment, recreation, culture and sports; transport; and otherservices. It has made specific MFN exemptions and furtherreserves the right to liberalise to some WTO members in the areasof communications, recreational and transport services. FurtherIndia is a member of the 43 country Information TechnologyAgreement (ITA) covering computers, telecommunicationequipment, semiconductors, manufacturing equipment forsemiconductors, software and scientific equipment. As a part of itscommitments under GATS, India adopted zero tariff on 217information technology related tariff lines.
The significance of GATS can be understood when oneobserves that studies pointed out that the inefficient service sectorraises the manufacturing costs substantially for the industrialsector. In case of India, it is estimated that in electrical machinery,steel and ferrous alloys, fertilizers and woollen textiles, theinefficient services are responsible for manufacturing costs beinghigher by 25 percent and above.
India undertook gradual liberalisation of the FDI norms inmany services in light of these commitments. Since it has
145
substantial presence in the software sector, it needs to undertakesome reciprocal liberalisation.
However, it is pointed out that India opted for its short-terminterests at the Hong Kong Ministerial and thus gained at the costof its leadership of the Third World Countries.
The US stand on H1B visas also is a case of inability tobargain for the advantage of the country. In many cases, Indiafailed to ascertain its advantages and adopted a rather cautiousstand on the liberalisation of services.
Check Your Progress:1. What do you understand by GATS?2. What are the main services included in the GATS.3. Bring out the importance of services to manufacturing.
13.4 QUESTIONS
1. Bring out the main trends in India’s balance of payments since1991.
2. What do you understand by TRIPs, TRIMs and GATS?3. Bring out the positive and negative aspects of these agreements
for India.
146
14
Module 6
EXCHANGE RATE DETERMINATION
Unit Structure :
14.0 Objectives
14.1 Concept of Foreign Exchange and Exchange Rate
14.2 Determination of the Exchange rate:
14.3 The Purchasing Power Parity Theory:
14.4 Foreign Exchange Market in India and Reserve Bank’sIntervention:
14.7 Questions
14.0 OBJECTIVES
Understand the concept of exchange rate.
Understand the factors determining the demand and supply offoreign exchange.
Understand the theories of exchange rate determination.
Understand the concept of equilibrium exchange rate.
14.1 CONCEPT OF FOREIGN EXCHANGE ANDEXCHANGE RATE
As we all know, each country has its own currency or itsdomestic measure of value, e.g., the USA has dollar, India hasrupee, and Russia has its rubble. When countries exchange goodsand services, they earn or have to pay the other countries.Exporting earns the currency of other countries and importingrequires payment in the other country’s currency. Foreign exchangerefers to the receipts or payments in terms of other countries’currencies. The residents in a country have their own domesticcurrency, which is not legal tender in the other countries. Hence, itis necessary to convert the currency of one country into that of theother country. The rate at which one unit of a country’s currency isconverted in to that of another is known as the exchange rate.Alternatively, it is the price of foreign exchange per unit of domesticcurrency. When one unit of domestic currency purchases more
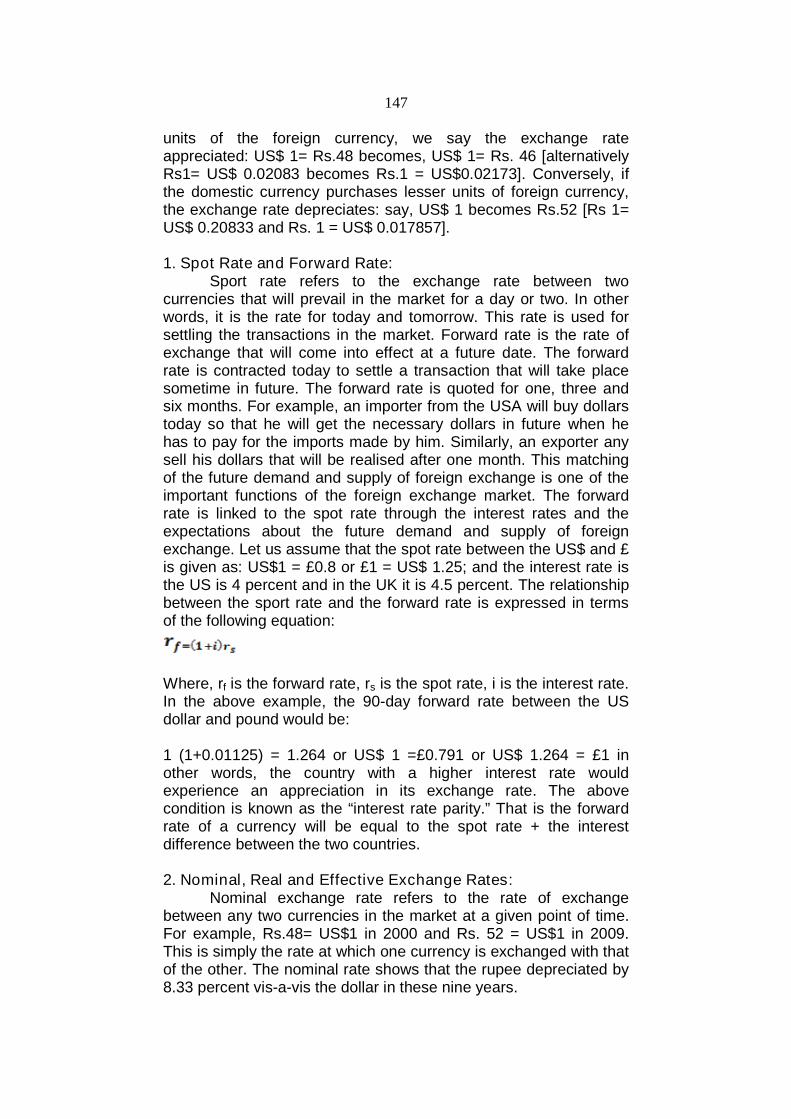
147
units of the foreign currency, we say the exchange rateappreciated: US$ 1= Rs.48 becomes, US$ 1= Rs. 46 [alternativelyRs1= US$ 0.02083 becomes Rs.1 = US$0.02173]. Conversely, ifthe domestic currency purchases lesser units of foreign currency,the exchange rate depreciates: say, US$ 1 becomes Rs.52 [Rs 1=US$ 0.20833 and Rs. 1 = US$ 0.017857].
1. Spot Rate and Forward Rate:Sport rate refers to the exchange rate between two
currencies that will prevail in the market for a day or two. In otherwords, it is the rate for today and tomorrow. This rate is used forsettling the transactions in the market. Forward rate is the rate ofexchange that will come into effect at a future date. The forwardrate is contracted today to settle a transaction that will take placesometime in future. The forward rate is quoted for one, three andsix months. For example, an importer from the USA will buy dollarstoday so that he will get the necessary dollars in future when hehas to pay for the imports made by him. Similarly, an exporter anysell his dollars that will be realised after one month. This matchingof the future demand and supply of foreign exchange is one of theimportant functions of the foreign exchange market. The forwardrate is linked to the spot rate through the interest rates and theexpectations about the future demand and supply of foreignexchange. Let us assume that the spot rate between the US$ and £is given as: US$1 = £0.8 or £1 = US$ 1.25; and the interest rate isthe US is 4 percent and in the UK it is 4.5 percent. The relationshipbetween the sport rate and the forward rate is expressed in termsof the following equation:
Where, rf is the forward rate, rs is the spot rate, i is the interest rate.In the above example, the 90-day forward rate between the USdollar and pound would be:
1 (1+0.01125) = 1.264 or US$ 1 =£0.791 or US$ 1.264 = £1 inother words, the country with a higher interest rate wouldexperience an appreciation in its exchange rate. The abovecondition is known as the “interest rate parity.” That is the forwardrate of a currency will be equal to the spot rate + the interestdifference between the two countries.
2. Nominal, Real and Effective Exchange Rates:Nominal exchange rate refers to the rate of exchange
between any two currencies in the market at a given point of time.For example, Rs.48= US$1 in 2000 and Rs. 52 = US$1 in 2009.This is simply the rate at which one currency is exchanged with thatof the other. The nominal rate shows that the rupee depreciated by8.33 percent vis-a-vis the dollar in these nine years.
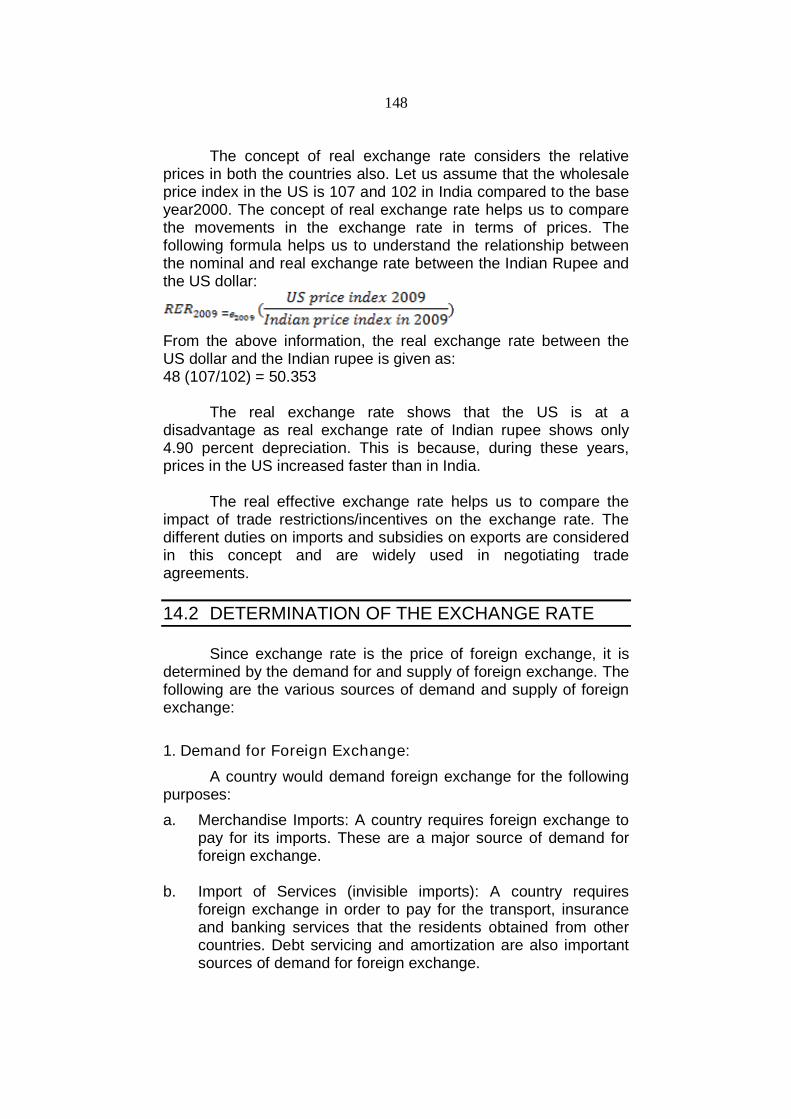
148
The concept of real exchange rate considers the relativeprices in both the countries also. Let us assume that the wholesaleprice index in the US is 107 and 102 in India compared to the baseyear2000. The concept of real exchange rate helps us to comparethe movements in the exchange rate in terms of prices. Thefollowing formula helps us to understand the relationship betweenthe nominal and real exchange rate between the Indian Rupee andthe US dollar:
From the above information, the real exchange rate between theUS dollar and the Indian rupee is given as:48 (107/102) = 50.353
The real exchange rate shows that the US is at adisadvantage as real exchange rate of Indian rupee shows only4.90 percent depreciation. This is because, during these years,prices in the US increased faster than in India.
The real effective exchange rate helps us to compare theimpact of trade restrictions/incentives on the exchange rate. Thedifferent duties on imports and subsidies on exports are consideredin this concept and are widely used in negotiating tradeagreements.
14.2 DETERMINATION OF THE EXCHANGE RATE
Since exchange rate is the price of foreign exchange, it isdetermined by the demand for and supply of foreign exchange. Thefollowing are the various sources of demand and supply of foreignexchange:
1. Demand for Foreign Exchange:
A country would demand foreign exchange for the followingpurposes:
a. Merchandise Imports: A country requires foreign exchange topay for its imports. These are a major source of demand forforeign exchange.
b. Import of Services (invisible imports): A country requiresforeign exchange in order to pay for the transport, insuranceand banking services that the residents obtained from othercountries. Debt servicing and amortization are also importantsources of demand for foreign exchange.
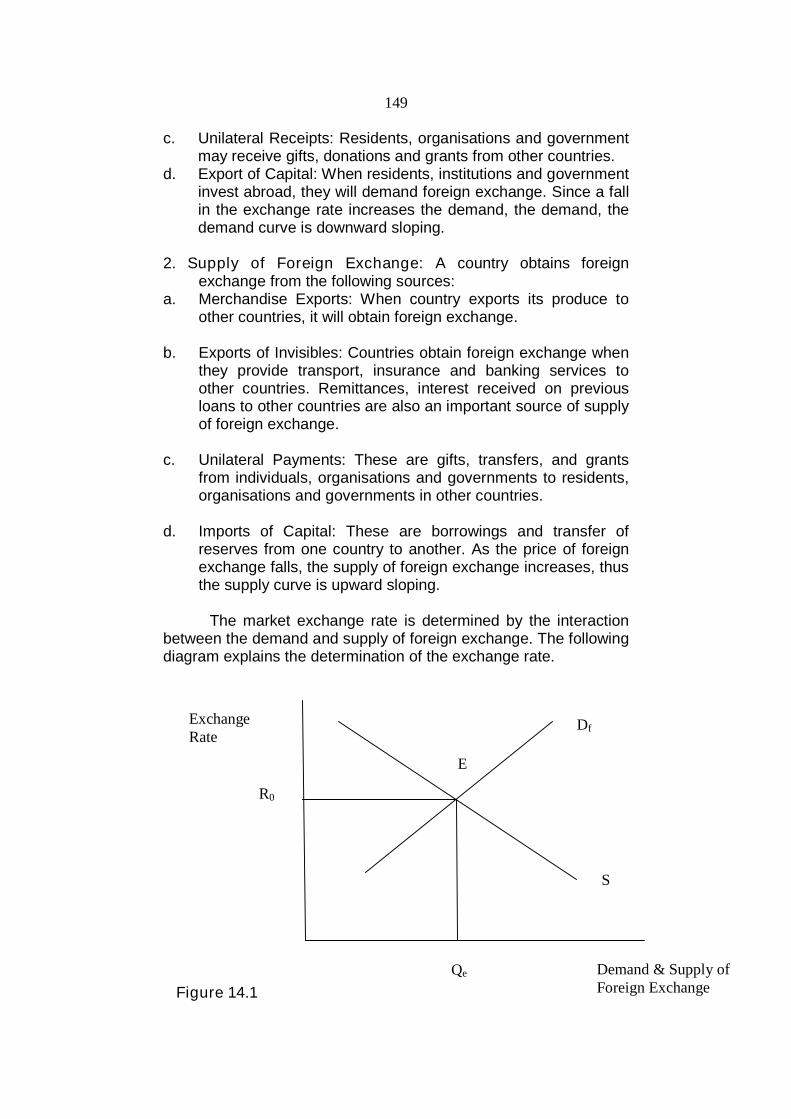
149
c. Unilateral Receipts: Residents, organisations and governmentmay receive gifts, donations and grants from other countries.
d. Export of Capital: When residents, institutions and governmentinvest abroad, they will demand foreign exchange. Since a fallin the exchange rate increases the demand, the demand, thedemand curve is downward sloping.
2. Supply of Foreign Exchange: A country obtains foreignexchange from the following sources:
a. Merchandise Exports: When country exports its produce toother countries, it will obtain foreign exchange.
b. Exports of Invisibles: Countries obtain foreign exchange whenthey provide transport, insurance and banking services toother countries. Remittances, interest received on previousloans to other countries are also an important source of supplyof foreign exchange.
c. Unilateral Payments: These are gifts, transfers, and grantsfrom individuals, organisations and governments to residents,organisations and governments in other countries.
d. Imports of Capital: These are borrowings and transfer ofreserves from one country to another. As the price of foreignexchange falls, the supply of foreign exchange increases, thusthe supply curve is upward sloping.
The market exchange rate is determined by the interactionbetween the demand and supply of foreign exchange. The followingdiagram explains the determination of the exchange rate.
Figure 14.1
ExchangeRate
R0
Demand & Supply ofForeign Exchange
Qe
S
Df
E
150
In the above diagram, we showed the demand (Df) andsupply (Sf) of foreign exchange. At point E, the demand and supplyare equal and Re is the equilibrium exchange rate.
Check your Progress:1. What is exchange rate?2. What is the spot rate?3. What is the forward rate?4. Interest parity ensures exchange rate equilibrium.5. What is nominal exchange rate?6. What is real exchange rate?7. Demand for foreign exchange is downward sloping.8. Supply of foreign exchange rate is upward sloping.
14.3 THE PURCHASING POWER PARITY THEORY
One of the most important concepts in international trade isthe purchasing power parity. Before 1914, the value of eachcurrency was expressed in terms of the gold it could buy. Forexample, if we required £ 5 to buy one ounce of gold and $ 7.5 tobuy the same ounce of gold, the exchange rate was given as £1 =US$ 1.5 or the purchasing power of a pound is one-and a-half ofthe dollar. Following the First World War, the gold standard wasgiven up and inconvertible paper currencies were introduced. Inorder to arrive at the equilibrium exchange rate under this system,in 1922, Gustav Cassel of Sweden proposed a new theory. Thistheory is known as the purchasing power parity theory. It attemptsat arriving the value of a currency in terms of the goods itcommands. Thus, the prices of traded goods in two countries arecompared for the equilibrium exchange rate between the two.
14.3.1 The Absolute Version:In this version, the price of a particular traded commodity is
compared to arrive at the exchange rate. For example, if an
151
automobile costs £100,000 in the UK and $ 125,000 in the US, theequilibrium exchange rate would be £1 = $1.25.
This version is based on the assumptions that there are nobarriers to trade, no transport cost, perfect competition in both thecountries and there are no capital movements.
As can be seen easily, this version can give us more than oneexchange rate. If we consider another commodity, say textiles, theprices might have been £1.5 and $ 3.5, in this case, the exchangerate would be: £1 = $2.33. So obviously, the problem would bewhich rate should be considered as the equilibrium exchange rate.
14.3.2 The Relative Version:In order to answer this question, Cassel introduced the relative
version. This version is based on the following assumptions:
1. There is free trade between the two countries.2. There is full employment in both the countries.3. There are constant returns to scale in both the countries.4. Changes in the price level are only due to changes in money
supply.5. Only the prices of traded goods are considered. Non-traded
goods do not influence the purchasing power.6. There are no international capital flows.7. There is perfect competition in both the countries.8. There is no transport cost between the two countries.
Given the above assumptions, Cassel shows that themovement in the purchasing power parity equilibrium exchangerate can be shown as:
Let £1 = US$ 1.758 in 2000; the base year is 2000; UK’s priceindex of traded goods is 228 and that of US is 248 in 2010; then,the new exchange rate based on the purchasing power paritybetween the pound and dollar would be:
1.758(248/228) = 1.9122 implying that the dollar would depreciateby 8.77 percent or the pound would appreciate by 8.77 percent.Therefore, a country with a higher increase in the price level wouldlose its purchasing power.
Criticism:There has been extensive research on the purchasing power
parity since it is necessary to understand the changes in a country’sprice competitiveness. This has led to a number of observations onthe determination of the value of a currency. Following are some ofthe important observations in this direction.
152
1. It is difficult to choose an appropriate base year for thecomparison of the changes in the price levels in the twocountries. It is generally considered that a year in which thereare no major economic disturbances can be considered as abase year.
2. The assumption that there is full employment in both thecountries is not realistic. In the absence of full employment, anincrease in money supply does cause the output to increase.Therefore, it is necessary to understand the changes in the levelof employment before the price changes are being compared.
3. Changes in money supply alone do not cause changes in theprice level. Expectations about the future prices also have a rolein influencing the price level.
4. Balassa observed that the changes in the price level are closelyrelated to non-monetary factors like changes in productivity,propensity to save and so on. In such cases, the changes inprice level cannot be attributed to the changes in money supplyalone.
5. Balassa further observed that that non-traded goods also enterinto the determination of the exchange rate. The theory now ismodified to incorporate the non-traded goods also. Thepurchasing power parities using the consumers’ price index arethe most effective measures.
6. Nurkse observed that the exchange rates are significantlyrelated to the fluctuations in capital flows. The short-term capitalflows are found to be particularly responsible for exchange ratevitality. Non-exclusion of capital flows is a major flaw in thepurchasing power parity theory.
7. While the theory assumes constant returns to scale, in realitythey are rare. Moreover, Taylor observed that in internationaltrade increasing returns to scale are more dominant and thusinfluences the level of flow of goods among trading partners.
8. While the theory is based on the assumption of free trade, inreality, the presence of tariff and non-tariff barriers distorts theprice levels of traded goods and thus the exchange rates do notreflect the true purchasing power of a currency.
9. Yeats showed that the transport cost is often an important thataffects the export and import prices. In such cases, the actualpurchasing power of a currency is distorted.
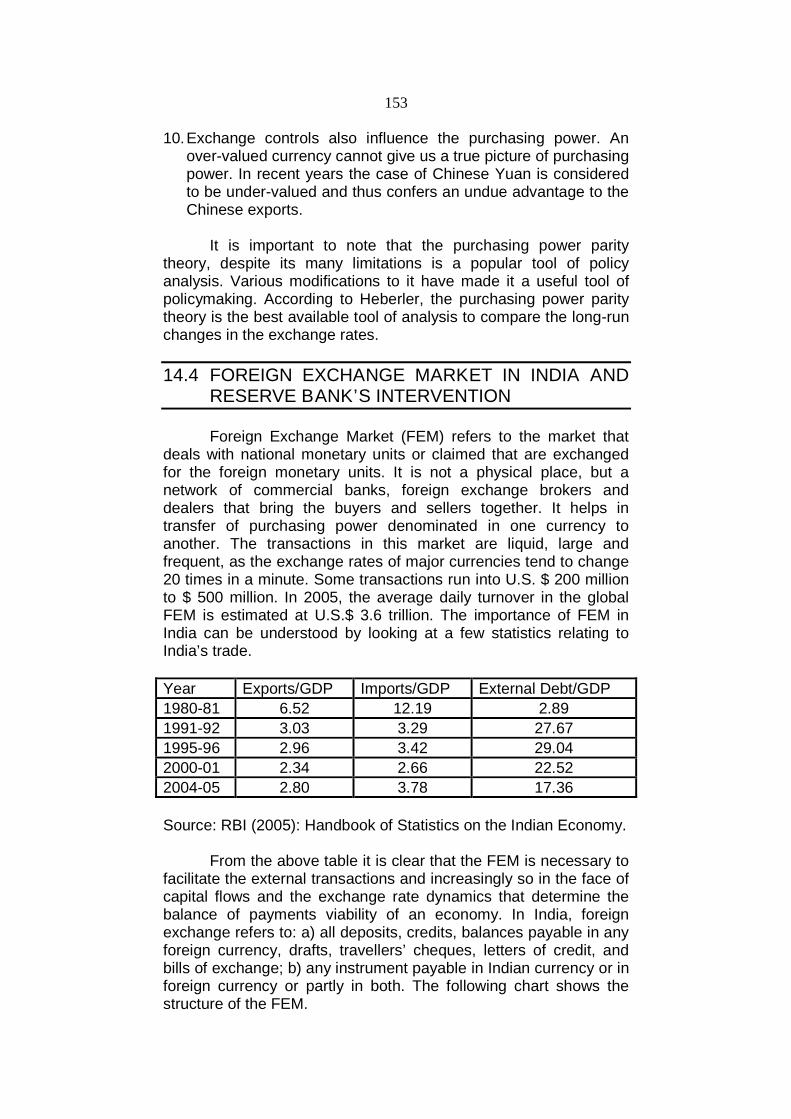
153
10.Exchange controls also influence the purchasing power. Anover-valued currency cannot give us a true picture of purchasingpower. In recent years the case of Chinese Yuan is consideredto be under-valued and thus confers an undue advantage to theChinese exports.
It is important to note that the purchasing power paritytheory, despite its many limitations is a popular tool of policyanalysis. Various modifications to it have made it a useful tool ofpolicymaking. According to Heberler, the purchasing power paritytheory is the best available tool of analysis to compare the long-runchanges in the exchange rates.
14.4 FOREIGN EXCHANGE MARKET IN INDIA ANDRESERVE BANK’S INTERVENTION
Foreign Exchange Market (FEM) refers to the market thatdeals with national monetary units or claimed that are exchangedfor the foreign monetary units. It is not a physical place, but anetwork of commercial banks, foreign exchange brokers anddealers that bring the buyers and sellers together. It helps intransfer of purchasing power denominated in one currency toanother. The transactions in this market are liquid, large andfrequent, as the exchange rates of major currencies tend to change20 times in a minute. Some transactions run into U.S. $ 200 millionto $ 500 million. In 2005, the average daily turnover in the globalFEM is estimated at U.S.$ 3.6 trillion. The importance of FEM inIndia can be understood by looking at a few statistics relating toIndia’s trade.
Year Exports/GDP Imports/GDP External Debt/GDP
1980-81 6.52 12.19 2.89
1991-92 3.03 3.29 27.67
1995-96 2.96 3.42 29.04
2000-01 2.34 2.66 22.52
2004-05 2.80 3.78 17.36
Source: RBI (2005): Handbook of Statistics on the Indian Economy.
From the above table it is clear that the FEM is necessary tofacilitate the external transactions and increasingly so in the face ofcapital flows and the exchange rate dynamics that determine thebalance of payments viability of an economy. In India, foreignexchange refers to: a) all deposits, credits, balances payable in anyforeign currency, drafts, travellers’ cheques, letters of credit, andbills of exchange; b) any instrument payable in Indian currency or inforeign currency or partly in both. The following chart shows thestructure of the FEM.
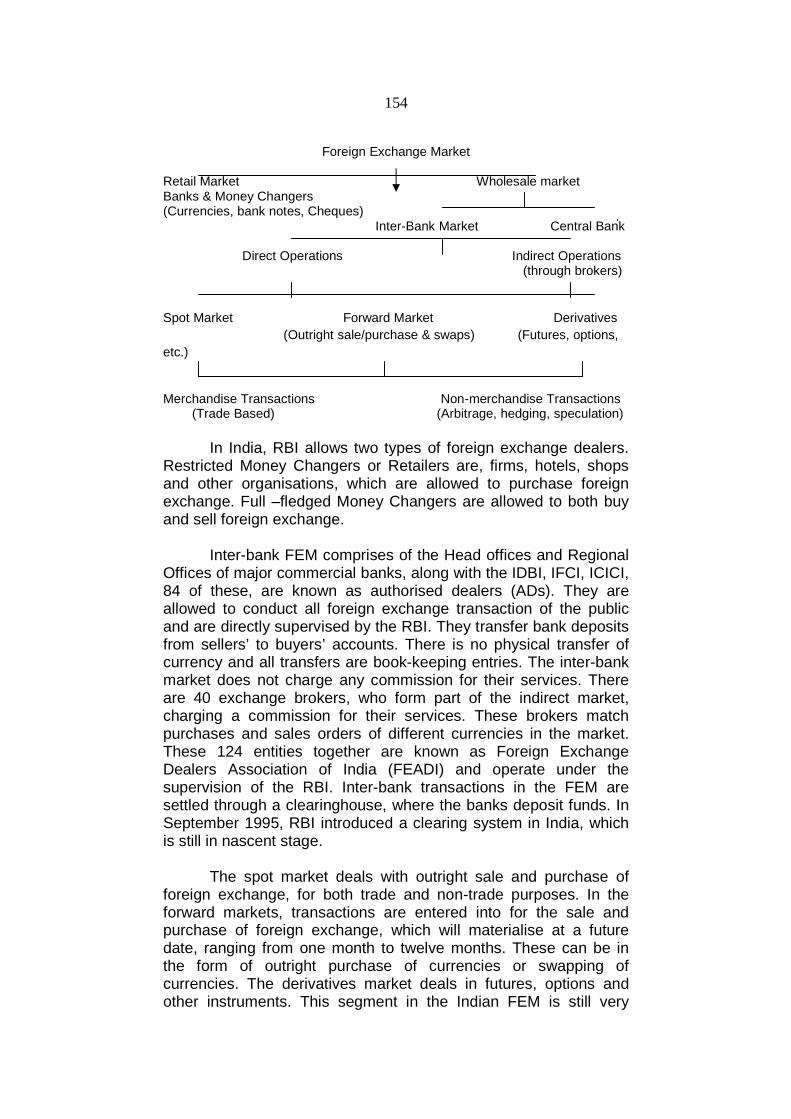
154
Foreign Exchange Market
Retail Market Wholesale marketBanks & Money Changers(Currencies, bank notes, Cheques)
Inter-Bank Market Central Bank
Direct Operations Indirect Operations(through brokers)
Spot Market Forward Market Derivatives
(Outright sale/purchase & swaps) (Futures, options,
etc.)
Merchandise Transactions Non-merchandise Transactions(Trade Based) (Arbitrage, hedging, speculation)
In India, RBI allows two types of foreign exchange dealers.Restricted Money Changers or Retailers are, firms, hotels, shopsand other organisations, which are allowed to purchase foreignexchange. Full –fledged Money Changers are allowed to both buyand sell foreign exchange.
Inter-bank FEM comprises of the Head offices and RegionalOffices of major commercial banks, along with the IDBI, IFCI, ICICI,84 of these, are known as authorised dealers (ADs). They areallowed to conduct all foreign exchange transaction of the publicand are directly supervised by the RBI. They transfer bank depositsfrom sellers’ to buyers’ accounts. There is no physical transfer ofcurrency and all transfers are book-keeping entries. The inter-bankmarket does not charge any commission for their services. Thereare 40 exchange brokers, who form part of the indirect market,charging a commission for their services. These brokers matchpurchases and sales orders of different currencies in the market.These 124 entities together are known as Foreign ExchangeDealers Association of India (FEADI) and operate under thesupervision of the RBI. Inter-bank transactions in the FEM aresettled through a clearinghouse, where the banks deposit funds. InSeptember 1995, RBI introduced a clearing system in India, whichis still in nascent stage.
The spot market deals with outright sale and purchase offoreign exchange, for both trade and non-trade purposes. In theforward markets, transactions are entered into for the sale andpurchase of foreign exchange, which will materialise at a futuredate, ranging from one month to twelve months. These can be inthe form of outright purchase of currencies or swapping ofcurrencies. The derivatives market deals in futures, options andother instruments. This segment in the Indian FEM is still very
155
limited. In many LDCs, including India, the FEM deals more in traderelated settlements (up to 85%) and less in foreign capital. GlobalFEM transactions are predominantly hedging-based andspeculative in nature.
Central Bank is an important player in the FEM. Itdecides the nature of the market by determining the exchange rateregime. It ensures a smooth and orderly functioning of the marketby supervising, monitoring and regulating its activities to facilitatetrade and capital flows, and preventing speculative attacks on thenational currency. The RBI enters the FEM on its own as well as onbehalf of the government through ADs. It enters the market tostabilise the Indian rupee and as the banker to the government, itenters to provide funds for the government. In 1984, RBI allowedADs to join the Society for Worldwide Inter-Bank FinancialTelecommunication (SWFIT) to facilitate better operations. Sincethe introduction of economic reforms in 1991, RBI has been activein promoting an orderly and vibrant FEM in India to meet thegrowing needs for foreign exchange both for trade and investmentpurposes. It introduced reforms to integrate the Indian foreignexchange market with the global market. The ADs are allowed toprovide forward cover to exporters/importers in selected foreigncurrencies. Relaxations are also provided for foreign investors andshipping companies based on past performance and businessprojections. In 1996, selected banks were allowed to initiate cross-currency options on a fully covered basis. The RBI allowed ADs toprovide hedging products to Indian corporates without the priorapproval of the government/RBI. Currency, interest, coupon swapsare allowed along with book and cancel options. They are requiredto maintain cash balances with overseas branches commensurateto the normal business needs and must necessarily seek cover fortheir Indian operations before seeking cover in the foreign markets.They are also directed to keep a watch on ‘hot money flows’.Effective from January 1996, RBI allowed banks to fix theirovernight position subject to the approval of the RBI.
The RBI allowed Foreign Institutional Investors (FIIs) to openforeign currency denominated accounts with designated banks,transfer of funds from the foreign currency accounts to the rupeeaccount and vice versa, transfer/repatriation of capital, capitalgains, dividends, interest income, etc., and external commercialborrowings (ECBs) for selected purposes up to US$ 3 million.
The RBI prepared ‘Guidelines for Internal Control overForeign Exchange Business of Banks’ for an orderly functioning ofthe FEM. These cover the organisation of the ‘dealing’departments, dealings through exchange brokers, management ofrisks through dealers’ limits, control over dealers’ profit/losses,control over reconciliation of Nostro Balances (balances of an
156
Indian bank holding an account with a foreign currency bank),management of risks arising in Vostro accounts [balances offoreign currency banks holding an account with an Indian bank],and control over other aspects of dealing operations.
Unnikrishnan and Ravimohan, using the daily data on theIndian rupee for January 1996 to March 2002 observed that rupeewas stable over long period with occasional volatility after it became‘fully float’ in 1994. In 2005-06, RBI purchased U.S. dollars8,142.88 million equal to Rs. 35,328.43 crore to stabilise the Indianrupee. During this period, the RBI objectives have been a) tocontain volatility and b) to meet temporary demand and supplymismatches. Further, ‘the prime objective of the RBI is to managevolatility with no fixed target for the exchange rate which isdetermined by the market forces.’ From this, it is clear that the RBIpolicy is to tamper with the rate of change in the exchange raterather than reversing it. According to Unnikrishnan and Ravimohan,the RBI is adopting ‘a leaning against the wind’ policy. In order toachieve its objective of maintaining a stable rupee, the RBI isengaged in sterilisation.
14.5 QUESTIONS
1. Explain the concepts of spot and forward rates.2. Examine the factors that determine the demand and supply of
foreign exchange.3. Explain the purchasing power parity theory.4. Examine the objectives of RBI’s intervention in the foreign
exchange market.5. Explain how the RBI tries to stabilise the Indian rupee under the
managed float.