Embed Size (px)
Citation preview

IASH 2011, the 12TH INTERNATIONAL CONFERENCE ONSTABILITY, HANDLING AND USE OF LIQUID FUELS
Sarasota, Florida, USA16-20 October 2011
BEHAVIOUR OF WATER IN AVIATION FUELS AT LOW TEMPERATURES
Mark D. Carpenter1, Janice I. Hetherington2, Liyun Lao3, Colin Ramshaw3, Hoi Yeung3,Joseph K.-W. Lam4, Simon Masters4, and Sarah Barley5
1Cranfield University, Defence Academy of the United Kingdom, Shrivenham, Swindon SN68LA, UK, [email protected] University, Defence Academy of the United Kingdom, Shrivenham, Swindon SN68LA, UK3Cranfield University, Cranfield, Bedfordshire MK43 0AL, UK4Airbus Operations Ltd., Filton, Bristol BS99 7AR, UK5EADS Innovation Works, Filton, Bristol BS99 7AR, UK
AbstractThe presence of water in aviation fuel has been a topic of concern for the aviation industryfor many decades since any contaminating water may freeze during long flights at highaltitudes creating fuel flow problems. The aim of the present work was to improve thefundamental understanding of the behaviour of water in aviation fuel at the low temperaturesexperienced during flight.
Water droplet and ice formation were studied at temperatures down to 60°C in jet fuelsrepresentative of 100% Merox, 100% hydroprocessed and commercially-supplied Jet A-1fuels. Parallel studies were carried out in model hydrocarbons representing the aromatic,cyclic and alkane components of jet fuel.
The dependence of water droplet and ice particle size was investigated as a function ofparameters such as initial water concentration, rate of cooling, fuel composition andhydrocarbon type, and the presence of additives and impurities.
Initial studies using low temperature microscopy and particle size analysis indicated that, asthe fuel cools, water is released in very fine droplets of size 5µm and below. On cooling thefuel to 44°C the droplets appear to remain and there was no indication of ice crystalstructures being formed. Differential Scanning Calorimetry indicated that the water dropletswere supercooling to temperatures as low as -40°C. The factors affecting droplet formationare discussed.

2
Keywords Aviation fuel, Jet A-1, aromatic hydrocarbons, low temperatures, water, ice, DSC,cold stage
1. Introduction
Water can dissolve in aviation fuel or be present as free water. Its presence is of concern tothe aviation industry since free water may freeze over the course of a long flight at altitudeand the resulting ice particles could block fuel filters or otherwise interfere with the steadyflow of fuel to aircraft engines. The mechanism of water uptake, water shedding, dropletformation and the subsequent formation of ice is not well understood. It is a complexproblem demanding an understanding of the solubility of water in jet fuel, nucleation andgrowth of water droplets, ice nucleation and growth, and the influence of fuel compositionand fuel additives. The aim of the present work is to add to the understanding of thesephenomena.
Hydroprocessed and Merox treated jet fuels can differ in some of their properties such aswater retention and water shedding due to the difference in their chemical compositionresulting from their different treatment in the refinery. Hydroprocessing removes the sulphurand many of the polar impurities from the fuel, which may act as surfactants. The Meroxprocess ‘wraps up’ the sulphur within the hydrocarbon molecules converting it to a lessreactive form; it does not reduce the total amount of sulphur nor the natural impurities orsurfactants which come from the original crude oil. A typical Jet A-1 will contain a mixtureof hydroprocessed and Merox treated fuel.
All conventional jet fuels consist wholly of hydrocarbons which are a mixture of straightchain, branched chain, cyclic and aromatic compounds. The hydrocarbon compounds willhave between 8 and 16 carbon atoms, with the highest proportion having 12 carbon atoms.The only limit on the hydrocarbon composition of jet fuel is a maximum permitted value of25% by volume of aromatic species.
Aromatic hydrocarbons have been found to have a greater solubility in water than otherhydrocarbon structures with similar numbers of carbon atoms1. There is also some evidencethat water may dissolve in higher concentrations in aromatic compounds than in alkane orcyclic compounds of similar molecular mass. It is possible that fuels with a high aromaticcontent will tend to have a higher concentration of dissolved water. New synthetic fuels canhave a very low aromatic content and therefore could show different water handlingcharacteristics from conventional jet fuel.
By gaining a more fundamental understanding of water dropout and ice formation in modelhydrocarbons and jet fuels over the temperature range experienced in aircraft flight, it ispossible that a methodology can be developed to assist with the problem of watermanagement in aviation fuels.
3
2. Fuels and Model Hydrocarbons used in this Study
By its nature, jet fuel is a bulk-supplied product and it is difficult to acquire small quantitiesof fuels, of known provenance, for research purposes; however, a major UK oil refiner agreedto supply two types of jet fuel which represented processing extremes for conventional fuels.A third fuel was supplied from an operating UK airfield:
(i) 100% Merox treated jet fuel(ii) 100% hydroprocessed jet fuel
(iii) Airfield Jet A-1.
The aromatics content of the hydroprocessed fuel was reported as 21.8% and the Merox fuelas 16.6%; the aromatics content of the airfield fuel was not reported since it was a blend fromtwo batches of fuel. The fuels were supplied against the Jet A-1 specification. The first twofuels were not ideally fresh, being approximately one year old at the time of supply, but wereessentially within specification. Using ‘old’ fuel is not ideal but, as has been noted, there aresignificant difficulties with supply of research quantities of Jet A-1.
The model hydrocarbons included in the study were:
(i) N-octane to represent straight chain hydrocarbons(ii) Methylcyclohexane, to represent cyclic hydrocarbons
(iii) Toluene, to represent aromatic hydrocarbons
All the hydrocarbons were AnalaR or HPLC grade.
The hydrocarbons chosen have a similar number of carbon atoms in their respectivemolecules. Various selection parameters were used, but the melting point was the mostcritical, followed by safety concerns over materials with low flashpoints. Some data on watersolubility in various hydrocarbons has been reported2,3,4,5,6.
3. Control and Measurement of Dissolved Water Concentration
It is well documented that the dissolved water content of fuels and hydrocarbons will changewith temperature7 and relative humidity8. For consistency, it was deemed necessary todevelop a procedure to prepare samples with reproducible concentrations of dissolved water.The fuel or hydrocarbon was contained in a glass beaker within a desiccator and a few ml ofdistilled water was added to the bottom of the desiccator so that water was always present tomaintain 100% relative humidity. The desiccator was held at 25°C in a controlledtemperature chamber and the fuel was stirred using a magnetic stirrer; the assembly wasconditioned for a minimum of 24 hours. Samples were withdrawn by glass syringe and fineneedle through a septum fitted to the desiccator, to avoid disturbing the equilibrium of thesystem.
4
This ‘conditioning’ procedure was used to produce hydrocarbon and fuels samples withrepeatable (saturated) water content for the experimental programme.
Water concentrations were determined using a Metrohm 684 Karl Fischer Coulometer. Thissystem uses a coulometric titration technique to measure both the dissolved and free water,and so gives the total water in a sample. Typically, ten measurements of water content weremade for each sample and sample condition; data shown in the tables is the average of thesemeasurements and also gives the degree of scatter.
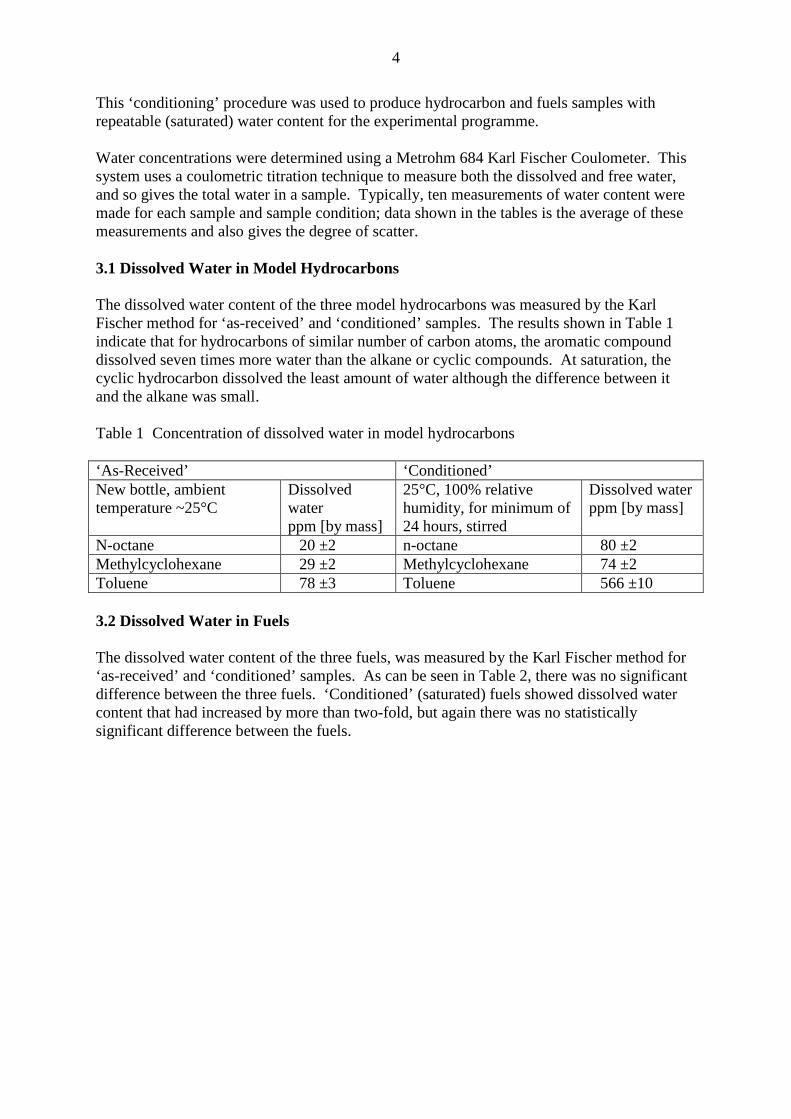
3.1 Dissolved Water in Model Hydrocarbons
The dissolved water content of the three model hydrocarbons was measured by the KarlFischer method for ‘as-received’ and ‘conditioned’ samples. The results shown in Table 1indicate that for hydrocarbons of similar number of carbon atoms, the aromatic compounddissolved seven times more water than the alkane or cyclic compounds. At saturation, thecyclic hydrocarbon dissolved the least amount of water although the difference between itand the alkane was small.
Table 1 Concentration of dissolved water in model hydrocarbons
‘As-Received’ ‘Conditioned’New bottle, ambienttemperature ~25°C
Dissolvedwaterppm [by mass]
25°C, 100% relativehumidity, for minimum of24 hours, stirred
Dissolved waterppm [by mass]
N-octane 20 ±2 n-octane 80 ±2Methylcyclohexane 29 ±2 Methylcyclohexane 74 ±2Toluene 78 ±3 Toluene 566 ±10
3.2 Dissolved Water in Fuels
The dissolved water content of the three fuels, was measured by the Karl Fischer method for‘as-received’ and ‘conditioned’ samples. As can be seen in Table 2, there was no significantdifference between the three fuels. ‘Conditioned’ (saturated) fuels showed dissolved watercontent that had increased by more than two-fold, but again there was no statisticallysignificant difference between the fuels.

5
Table 2 Concentration of dissolved water in fuels
‘As-Received’Sample Storage Condition Dissolved Water
ppm [by mass]Airfield Jet A-1 (i) Not recorded
(ii) Relative humidity 46%Temp 23.5 - 23.4°C
(i) 43 ±4(ii) 46 ±2
100% hydroprocessed jet fuel Relative humidity 46%Temp 22.0 - 23.3°C
40 ±2
100% Merox jet fuel Relative humidity 46%Temp 23.5 - 23.4°C
38 ±3
‘Conditioned’ (25°C, 100% relative humidity, stirred)Sample Conditioning Period Dissolved Water
ppm [by mass]Airfield Jet A-1 1 day
5 days9 days
105 ±6108 ±1399 ±8
100% hydroprocessed jet fuel 2.5 days3.5 days
97 ±694 ±4
100% Merox jet fuel 1 day2.5 days
104 ±3100 ±3
3.3 Effect of Static Dissipator Additive on Dissolved Water Uptake
Static dissipator additive (SDA) is known to increase the settling time9 of added free waterdroplets in the MSEP test for jet fuel. Limited tests were carried out to establish whetherSDA might influence water uptake in two of the model hydrocarbons; Stadis 450 was usedfor this purpose. Samples of both toluene and n-octane were doped with 5ppm SDA,‘conditioned’ as described previously and then tested for water content using the Karl Fischercoulometer. There was no significant difference in the water content between the toluene andn-octane samples with and without SDA, although the difference in conductivity between thedoped and undoped samples was considerable.
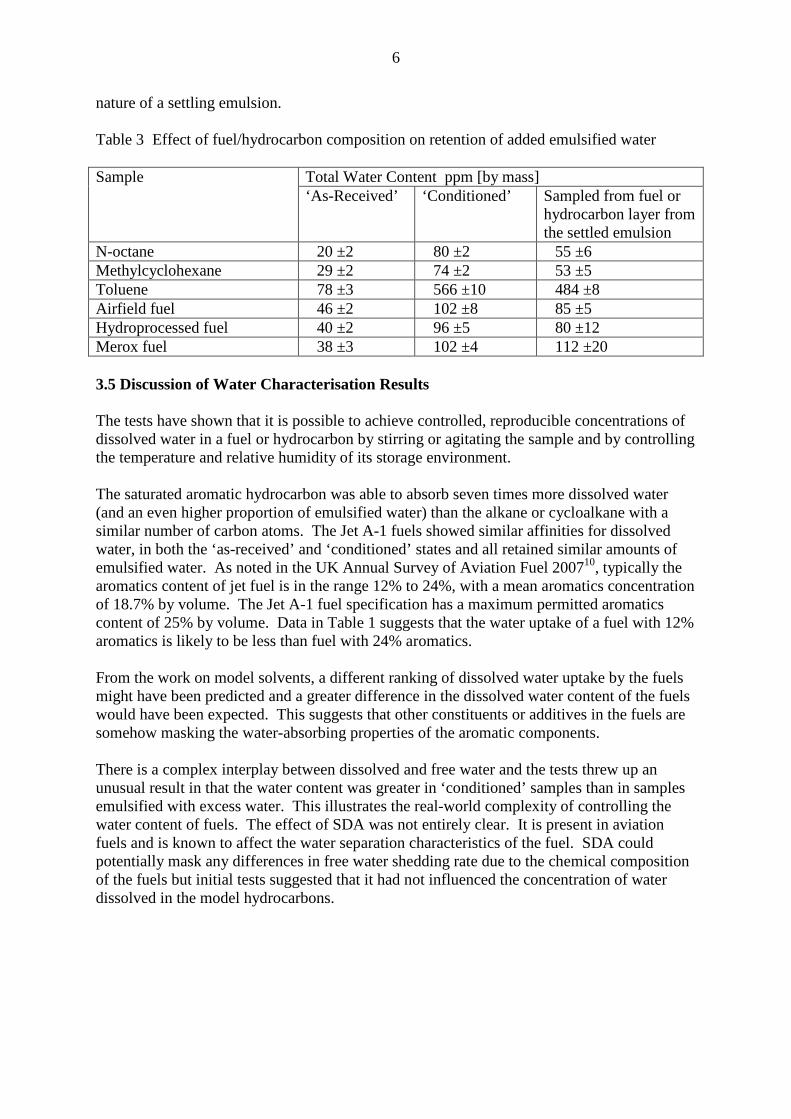
3.4 Effect of Fuel Composition on Retention of Added Emulsified Water
Previous sections have discussed the uptake of dissolved water. It is also important toconsider the retention of free, suspended water within the fuel. For this test, water wasemulsified in the fuel or hydrocarbon by mixing 25ml water with 25ml fuel or hydrocarbonsample in a syringe using a 30 second high shear mixing cycle on an EMCEEMicroseparometer. The mixture was left to settle in the syringe with a plunger in place toprevent water loss or ingress. After 24 hours the water content of the fuel layer, sampledfrom its mid-point, was determined by the Karl Fischer method.
Table 3 shows that there is no significant difference in the free water retention characteristicsof the three fuels although the uncertainty in the measurement is larger due to the transient
6
nature of a settling emulsion.
Table 3 Effect of fuel/hydrocarbon composition on retention of added emulsified water
Total Water Content ppm [by mass]Sample‘As-Received’ ‘Conditioned’ Sampled from fuel or
hydrocarbon layer fromthe settled emulsion
N-octane 20 ±2 80 ±2 55 ±6Methylcyclohexane 29 ±2 74 ±2 53 ±5Toluene 78 ±3 566 ±10 484 ±8Airfield fuel 46 ±2 102 ±8 85 ±5Hydroprocessed fuel 40 ±2 96 ±5 80 ±12Merox fuel 38 ±3 102 ±4 112 ±20
3.5 Discussion of Water Characterisation Results
The tests have shown that it is possible to achieve controlled, reproducible concentrations ofdissolved water in a fuel or hydrocarbon by stirring or agitating the sample and by controllingthe temperature and relative humidity of its storage environment.
The saturated aromatic hydrocarbon was able to absorb seven times more dissolved water(and an even higher proportion of emulsified water) than the alkane or cycloalkane with asimilar number of carbon atoms. The Jet A-1 fuels showed similar affinities for dissolvedwater, in both the ‘as-received’ and ‘conditioned’ states and all retained similar amounts ofemulsified water. As noted in the UK Annual Survey of Aviation Fuel 200710, typically thearomatics content of jet fuel is in the range 12% to 24%, with a mean aromatics concentrationof 18.7% by volume. The Jet A-1 fuel specification has a maximum permitted aromaticscontent of 25% by volume. Data in Table 1 suggests that the water uptake of a fuel with 12%aromatics is likely to be less than fuel with 24% aromatics.
From the work on model solvents, a different ranking of dissolved water uptake by the fuelsmight have been predicted and a greater difference in the dissolved water content of the fuelswould have been expected. This suggests that other constituents or additives in the fuels aresomehow masking the water-absorbing properties of the aromatic components.
There is a complex interplay between dissolved and free water and the tests threw up anunusual result in that the water content was greater in ‘conditioned’ samples than in samplesemulsified with excess water. This illustrates the real-world complexity of controlling thewater content of fuels. The effect of SDA was not entirely clear. It is present in aviationfuels and is known to affect the water separation characteristics of the fuel. SDA couldpotentially mask any differences in free water shedding rate due to the chemical compositionof the fuels but initial tests suggested that it had not influenced the concentration of waterdissolved in the model hydrocarbons.
7
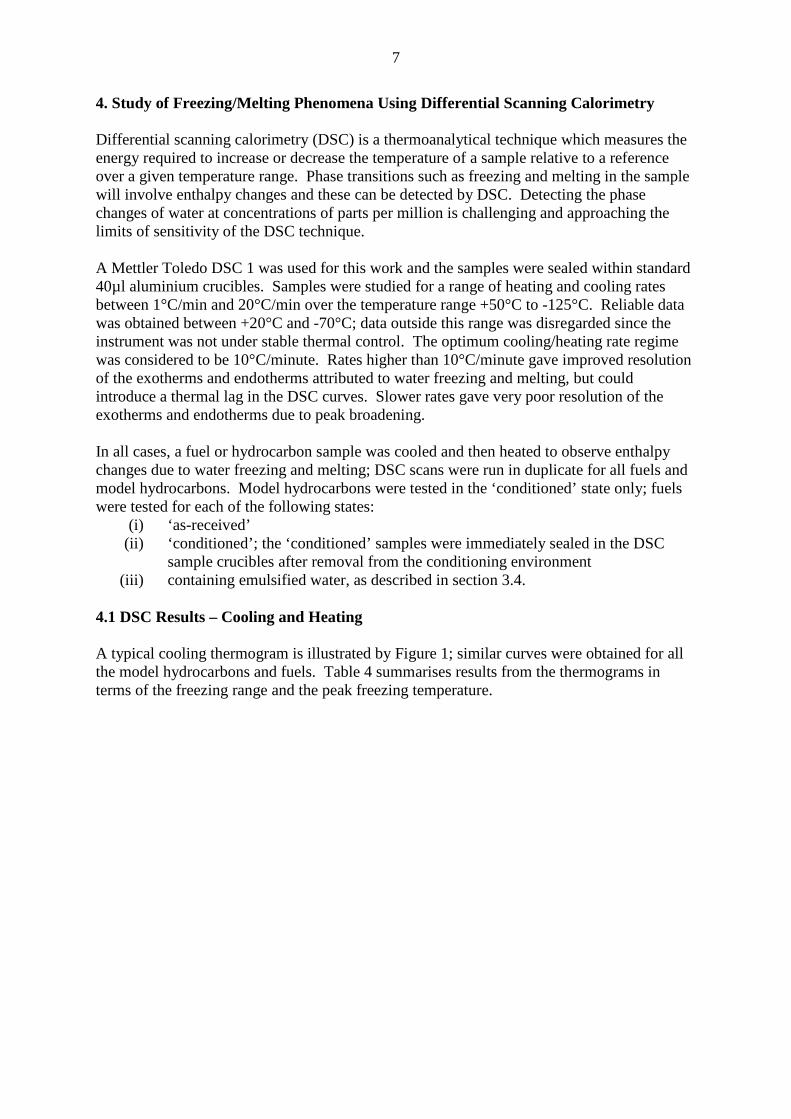
4. Study of Freezing/Melting Phenomena Using Differential Scanning Calorimetry
Differential scanning calorimetry (DSC) is a thermoanalytical technique which measures theenergy required to increase or decrease the temperature of a sample relative to a referenceover a given temperature range. Phase transitions such as freezing and melting in the samplewill involve enthalpy changes and these can be detected by DSC. Detecting the phasechanges of water at concentrations of parts per million is challenging and approaching thelimits of sensitivity of the DSC technique.
A Mettler Toledo DSC 1 was used for this work and the samples were sealed within standard40µl aluminium crucibles. Samples were studied for a range of heating and cooling ratesbetween 1°C/min and 20°C/min over the temperature range +50°C to -125°C. Reliable datawas obtained between +20°C and -70°C; data outside this range was disregarded since theinstrument was not under stable thermal control. The optimum cooling/heating rate regimewas considered to be 10°C/minute. Rates higher than 10°C/minute gave improved resolutionof the exotherms and endotherms attributed to water freezing and melting, but couldintroduce a thermal lag in the DSC curves. Slower rates gave very poor resolution of theexotherms and endotherms due to peak broadening.
In all cases, a fuel or hydrocarbon sample was cooled and then heated to observe enthalpychanges due to water freezing and melting; DSC scans were run in duplicate for all fuels andmodel hydrocarbons. Model hydrocarbons were tested in the ‘conditioned’ state only; fuelswere tested for each of the following states:
(i) ‘as-received’(ii) ‘conditioned’; the ‘conditioned’ samples were immediately sealed in the DSC
sample crucibles after removal from the conditioning environment(iii) containing emulsified water, as described in section 3.4.
4.1 DSC Results – Cooling and Heating
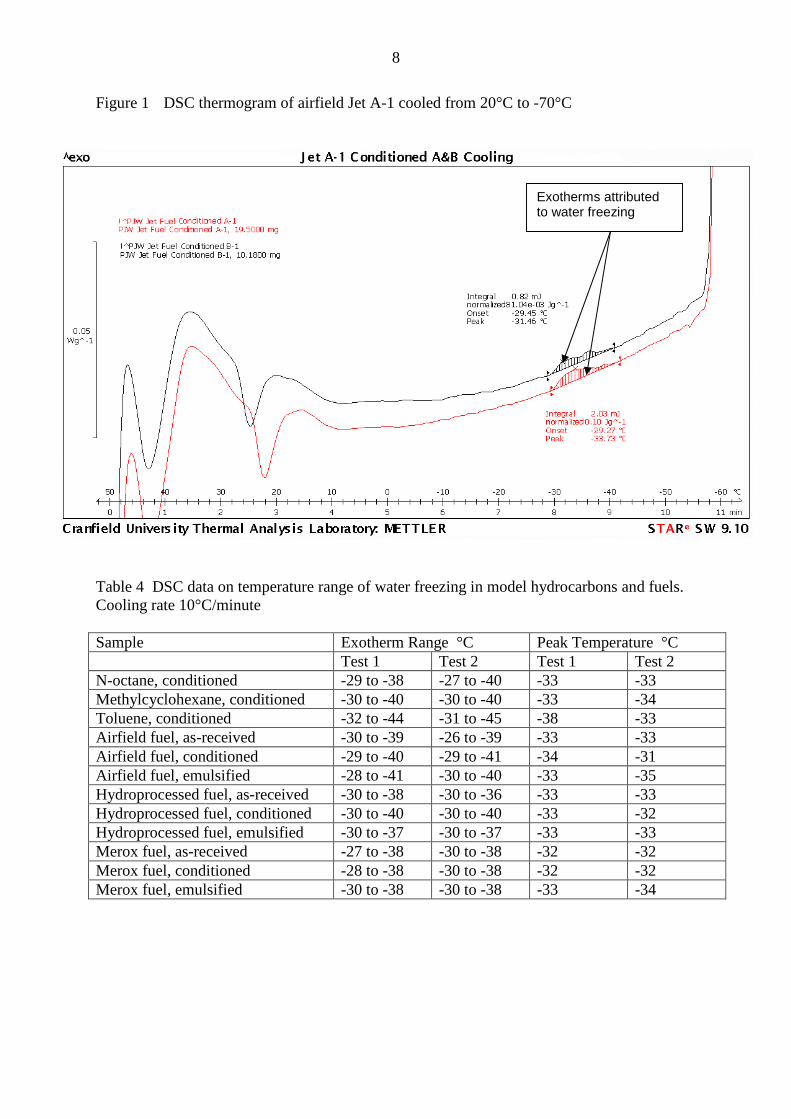
A typical cooling thermogram is illustrated by Figure 1; similar curves were obtained for allthe model hydrocarbons and fuels. Table 4 summarises results from the thermograms interms of the freezing range and the peak freezing temperature.
8
Figure 1 DSC thermogram of airfield Jet A-1 cooled from 20°C to -70°C
Table 4 DSC data on temperature range of water freezing in model hydrocarbons and fuels.Cooling rate 10°C/minute
Sample Exotherm Range °C Peak Temperature °CTest 1 Test 2 Test 1 Test 2
N-octane, conditioned -29 to -38 -27 to -40 -33 -33Methylcyclohexane, conditioned -30 to -40 -30 to -40 -33 -34Toluene, conditioned -32 to -44 -31 to -45 -38 -33Airfield fuel, as-received -30 to -39 -26 to -39 -33 -33Airfield fuel, conditioned -29 to -40 -29 to -41 -34 -31Airfield fuel, emulsified -28 to -41 -30 to -40 -33 -35Hydroprocessed fuel, as-received -30 to -38 -30 to -36 -33 -33Hydroprocessed fuel, conditioned -30 to -40 -30 to -40 -33 -32Hydroprocessed fuel, emulsified -30 to -37 -30 to -37 -33 -33Merox fuel, as-received -27 to -38 -30 to -38 -32 -32Merox fuel, conditioned -28 to -38 -30 to -38 -32 -32Merox fuel, emulsified -30 to -38 -30 to -38 -33 -34
Exotherms attributedto water freezing

9
The DSC results suggest that for the model hydrocarbons, the dissolved water precipitatedout of solution and solidified at temperatures in the range -27°C to -45°C with the typicalpeak freezing temperature being -33°C. For the fuels, both ‘as-received’ and ‘conditioned’,the dissolved water precipitated out of solution and froze at temperatures in the range -26°Cto -41°C with the typical peak freezing temperature being -32°C or 33°C. Fuel containingemulsified water showed a similar range of water freezing temperature and peak freezingtemperature behaviour.
Data from the heating thermograms is presented in Table 5 and a typical curve is depicted byFigure 2. Duplicate test data has been condensed into a single column; note that severalcurves showed two endotherms between 5 and 15°C apart. In all cases, the enthalpy ofmelting was very small, about one tenth of the enthalpy of freezing and around the detectionlimit of the method.
Figure 2 DSC thermogram of airfield Jet A-1 heated from -70°C to 20°C
Endotherm 1attributed to ice melting
Endotherm 2

10
Table 5 DSC data on temperature range of water melting in model hydrocarbons and fuels.Heating rate 10°C/minute
Sample Endotherm 1 Endotherm 2Range °C Peak °C Range °C Peak °C
N-octane, conditioned v small v small none noneMethylcyclohexane, conditioned -1 to +2 +0.6, +0.8 v small v smallToluene, conditioned -20 to 0 -4, -0.2 none noneAirfield fuel, as-received -5 to +1 -1, -1 none noneAirfield fuel, conditioned -2 to +2 -0.7, +0.4 +4 to +10 +8, +10Airfield fuel, emulsified -5 to -0 -4, -3 +8 to +18 +15, +15Hydroprocessed fuel, as-received -2 to -2 0, 0.5 +4 to +11 +8, +8Hydroprocessed fuel, conditioned -0.4 to +2 +0.6, +0.6 none noneHydroprocessed fuel, emulsified -0.6 to +2 +0.5, +0.6 v small v smallMerox fuel, as-received -2 to +2 +0.5, -0.8 +3 to +10 +5, +6Merox fuel, conditioned -0.4 to +2 +0.6, +0.6 v small v smallMerox fuel, emulsified -0.8 to +2 +0.6, +0.5 +4 to +10 +10, +8
4.2 Discussion of DSC Results
As has been noted, using DSC to detect phase changes in water at concentrations of parts permillion is pushing the technique to the limits of its sensitivity; other small changes within thefuel or hydrocarbon sample could mask any real effects being measured. However, theexotherm on cooling the samples was identifiable and typically occurred in the range 26°Cto 41°C, with a peak freezing temperature between 32°C and 34°C. This would beconsistent with the water precipitating out of solution as minute droplets, as the fuel iscooled, but remaining as a supercooled liquid until it was able to nucleate homogeneously.Homogeneous nucleation would be the preferred crystal nucleation mode for very smallwater droplets with few impurities. These findings agree with reported11 experimentalstudies of small water droplets (up to 50µm) homogeneously nucleating and freezing in cloudchambers in the temperature range -36°C to 40°C.
Tests on fuel samples containing emulsified water showed similar freezing characteristics tothe ‘as-received’ and ‘conditioned’ samples. The water droplets still in suspension afterseveral hours are probably 10µm or less in diameter and therefore unlikely to settle out; thesemight be expected to freeze in a similar way to small water droplets that have come out ofsolution.
The DSC endotherms attributed to ice melting were much less well defined. The reason forthis is uncertain but a similar phenomenon has been observed in a study on jet fuel freezing12.It could be an indication that frozen water droplets are being slowly reabsorbed in the fuel asthe temperature increases or that the droplets froze as a water-fuel mixture, which has nosharply defined melting point. DSC studies suggest that, in all three fuels, the frozen waterdroplets were melting over a temperature range of -5°C to +2°C, with the typical peakmelting temperature being +0.6°C. Similar results were noted for the model n-alkane andcycloalkane. Toluene, the model aromatic hydrocarbon, showed droplet melting from 20°Cto 0°C.

11
The second endotherm, which occurred at several degrees Celsius above the melting point ofice, and was visible in some of the heating thermograms, is even harder to explain, but maybe associated with system energy changes related to the solution of water in the fuel ormelting of trace amounts of high molecular weight hydrocarbons in the fuels.
5. Study of Ice Crystal Formation in Fuels and Model Hydrocarbons
A Leica DM LM optical microscope fitted with a phase contrast system and LinkamTHMS600 cold stage was selected as being suitable for investigating ice crystal formation incooled fuels and hydrocarbons. The cold stage includes a micro heating element andautomated liquid nitrogen cooling system to give accurate thermal control over a wide rangeof temperatures.
5.1 Sample Preparation and Selection
Sample preparation and cleanliness of the sample holder are important for opticalmicroscopy, especially where nucleation of crystals at low temperature is to be studied.
For all the results presented in this report, the sample was contained in a small quartz crucibleof approximately 400µl volume fitted with a cover slip. A rigorous cleaning regime wasadopted for the crucible and cover. On each occasion, prior to use, crucible parts werecleaned with Decon 90 detergent, in an ultrasonic bath, rinsed twice in distilled water anddried with a hot air blower. The crucible was completely filled with the fuel or hydrocarbonbeing studied so that there were no air bubbles visible when the cover slip was applied. Thecrucible was placed in a carrier within the cold stage to allow visual scanning of the samplewithout opening the cold stage compartment.
To prevent condensation from forming on the windows of the cold stage, the interior waspurged with dry nitrogen prior to cooling and, in operation, a steady stream of nitrogen wasblown across the exterior surfaces.
Each of the fuels and model hydrocarbons described previously was studied in themicroscope cold stage for a range of cooling regimes. As with any optical microscopytechnique, at any one time only a small proportion of the sample is within the focal plane.For comparison of results the samples were studied near the midpoint of the sample depthand also at the bottom of the cell.
5.2 Cooling/Heating Regimes
The maximum freezing temperature specified for Jet A-1 is -47°C and the fuel temperatureduring flight should always be 3°C above the recorded fuel freezing temperature. For thisreason, -44°C was chosen as the lower temperature limit for many of the fuel microscopystudies.
The fast cooling rate was chosen as 10°C per minute as this was the rate used in the DSCthermography tests; a slow cooling rate of 1°C per minute was selected to establish whetherprecipitation of water and nucleation of ice was a time dependent process. A third cooling

12
regime was based on real aircraft data. The fuel temperature during the last flight of G-YMMM from Beijing to London Heathrow was recorded prior to a hard landing at HeathrowAirport in January 2008; a simplified version of the fuel temperature profile given in theAAIB final report13 was adopted to find out if anomalous icing occurred under suchconditions. The lowest recorded fuel temperature in the aircraft was -34°C; this was reducedto -47°C for the laboratory tests.
Table 6 Heating and cooling regimes used in the microscopy studies
Thermal regime DetailsFast heat/cool cycle Cool at 10°C/min from 25°C to -44°C
Hold at -44°C for 30 minHeat at 10°C/min from -44°C to 25°C
Slow heat/cool cycle Cool at 1°C/min from 25°C to -44°CHold at -44°C for 30 minHeat at 1°C/min from -44°C to 25°C
AAIB report13 cooling regime Cool at 1°C/min from 25°C to -2°CHold at -2°C for 40 minCool at 0.15°C/min from -2°C to -20°CCool at 0.05°C/min from -20°C to -47°CHold at -47°C for 80 minHeat at 2°C/min from -47°C to 25°C
5.3 Microscopy Results – Model Hydrocarbons
‘Conditioned’ samples of all three model hydrocarbons were cooled to -44°C using the fastand slow heating/cooling cycles shown in Table 6. Microscopy observations are summarisedin Table 7.
Water droplets were observed to precipitate out of the hydrocarbons as the temperaturedecreased. Droplet size was measured at intervals and droplets were observed, using phasecontrast, for changes in shape or optical appearance which might indicate the formation of icecrystals. Images were captured at pre-programmed intervals.
For the fast cooling rate tests, significant turbulence was observed within the samples;convection currents could be seen with water/ice particles swirling around within thecrucible. The water/ice particles observed were 5µm or less in size. As the temperaturedecreased, some of the white water droplets adopted a pink/blue hue. It was not clearwhether the water droplets had indeed frozen, but in a spherical form, or were still in asupercooled state. On heating, the droplets began to disappear and all re-dissolved by 25°C.
For the slow cooling rate tests, there were no visible convection currents; water/ice particlesof 2 to 3µm developed at the bottom of the crucible and not within the body of the sample fornoctane and methylcyclohexane. As noted for the fast cooling rate tests, it was not clearwhether the water droplets actually froze. As the samples were heated from -44°C to 25°C,the droplets began to re-dissolve and by 25°C they had all disappeared back into solution.

13
Toluene behaved differently to the alkane and cyclic hydrocarbon under slow coolingconditions. On cooling, identifiable ice crystals formed on the bottom of the crucible. Theexact temperature of the appearance of the first ice crystals still has to be determined, butwater droplets and crystals were in co-existence at -35°C. On cooling further to -44°C, theice crystals grew and the surrounding water droplets decreased in number. On reheating thetoluene, the water droplets began to disappear, leaving the ice crystals intact; the ice crystalsfinally melted at around 0°C.
Plate 1 Toluene on slow cooling to -35°C, showing ice crystals and 2 to 12µm droplets onthe bottom of the crucible. Note that toluene was the only sample tested that showed icecrystal structures.

14
Plate 2 Toluene on slow cooling to -44°C, showing ice crystals and 2 to 12µm droplets onthe bottom of the crucible. Note that compared with Plate 1, the ice crystals have grown atthe expense of the droplets.
Table 7 Water/ice particle sizes for model hydrocarbons experiencing slow and fast coolingregimes
‘Conditioned’Sample
Water/Ice Particle Size µm Appearance of IceCrystals
Slow cool Fast coolN-octane 2 to 3
crucible bottommainly
4 to 5crucible middlemainly
None observed.Blue/white droplets
Methylcyclohexane 3crucible bottommainly
2 to 3crucible middlemainly
None observed.Blue/white droplets
Toluene 2 to 12crucible bottommainly
2 to 3crucible middlemainly
Crystals noted.White droplets
5.4 Microscopy Results – Fuels
‘Conditioned’ samples of all three jet fuels were cooled to -44°C using the cooling regimesgiven in Table 6.

15
For all three fuels, the size of the water droplets observed was 5µm or less as noted in Table8; the cooling rate appeared to have little effect on the droplet size. Optical microscopy couldnot quantify differences in the number of water particles with changes in temperature orcooling rate.
There was no hard evidence of the water droplets changing to crystalline ice formations.However, as the temperature was lowered some of the white water droplets adopted apink/blue colour. On holding the temperature at -44°C, a few clusters of water droplets wereobserved. On heating, the droplets began to disappear and all had vanished by 25°C.
Table 8 Water/ice particle sizes for fuels experiencing different cooling regimes
‘Conditioned’Sample
Water/Ice Particle Size µm Appearance of Particles
Slow cool Fast cool AAIB regimeAirfield fuel 1 to 2 2 to 5 2 to 5Hydroprocessedfuel
2 to 3 2 to 3 -
Merox fuel 1 to 3 ≤ 2 -
White water droplets,changing to pink/blue dropsat lower temperatures.Appearance of a few stringsand clusters of droplets atlow temperatures
5.5 Discussion of Microscopy Results
Visual observations confirmed that for all the samples tested, dissolved water came out ofsolution in the form of small droplets of size 5µm and below, as the fuel or hydrocarbon wascooled; droplets disappeared back into solution when it was heated. The size of the waterdroplets did not appear to be affected by the rate of cooling or the composition of thefuel/hydrocarbon.
There was no visual evidence of ice crystal formation in any of the three fuels when cooled to44°C under either fast or slow cooling regimes. Some droplets adopted a pink/blue hue atlower temperatures, but it was uncertain if this was due to freezing (as spherical droplets),supercooling of the water in the droplets or just an optical effect. Some strings of waterdroplets were observed suggesting that the droplets had clustered and/or frozen together. Thealkane and cycloalkane model solvents showed the same low temperature behaviour as thethree fuels. Toluene, the aromatic model solvent, behaved very differently to the fuels andother hydrocarbons at low temperatures; ice crystals and water droplets formed at lowtemperatures. As the toluene was reheated from 44°C, the water droplets began to disappearabove -15°C and the ice crystals melted at around 0°C. An explanation for the formation ofice crystals in toluene is that toluene has an ability to dissolve a much higher concentration ofdissolved water at 25°C compared with the other hydrocarbons, as shown in Table 2.3. Theinteraction and interchange of water between the dissolved state, supercooled water dropletsand ice crystals is complex and requires further investigation.
Until recently, it was assumed that water freezing in fuel adopted the hexagonal icecrystalline structure, Ih, the only form considered to be stable under the conditionsexperienced by fuel in an aircraft. This assumption was recently challenged in work byMurray et al14 where it was suggested that supercooled water droplets below 10µm cancrystallise to ice in the cubic Ic form.
16
Ice Ic is metastable and can convert readily to ice Ih; ice Ih has never been found to convertto ice Ic.
Murray et al studied the formation of ice in supercooled water droplets suspended in an oilmatrix. By surrounding the droplets in an oil matrix, mass transfer via the vapour phase wasblocked which simplified the study of the solid-state transformation from Ic to Ih. Theirresults showed that, typically, water droplets of diameter 5µm and below froze predominantlyto cubic ice. As the size of the water droplet increased from 5µm to 17µm, the formation ofthe stable phase of ice Ih was favoured. This suggests that the water droplets of 5µm andbelow formed in the fuels and model hydrocarbons could freeze to the metastable ice formand then undergo a phase transition to ice Ih as the temperature increases.
The final proportion of Ic in a particular frozen droplet is dependent on the relative rates ofheat dissipation and heat production in an individual droplet during the freezing process15. Ifthe droplet heats up sufficiently, the ice Ic of the initial crystal nucleus and the initialcrystalline form, will subsequently be transformed to ice Ih. Heat transfer therefore appearsto play a significant role in this process; it can explain the relationship between droplet sizeand the presence of ice Ic, and also the effect thermal conductivity of the environmentsurrounding the droplet has on the formation of ice Ic.
Vapour pressure has also been predicted to play a role in the transformation of Ic to Ih. Thevapour pressure of Ic has been measured to be approximately 11% higher than that of Ih attemperatures of -93 to -83°C. This means that where the two crystalline forms exist in closeproximity, the water will diffuse from the Ic to the Ih crystal and the Ih crystals will grow atthe expense of the Ic crystals, which consequently decrease in size. This could explain theobservation in toluene that the ice crystals grew and the surrounding droplets decreased innumber as shown by comparison of Plates 1 and 2.
6. Conclusions
Studies of water uptake in model hydrocarbons suggest that the aromatic component of thefuel will have the most influence on the uptake and release of water; the studies showed thatan aromatic hydrocarbon could contain up to seven times more dissolved water than an n-alkane or cycloalkane with a similar number of carbon atoms. However, there is not a clear-cut relationship between aromatics content and the affinity for water of a fuel, and the effectsof aromatics are likely to be masked by natural surfactants in the fuel. The role of fuelcomposition is further complicated by the presence of static dissipator additive which isknown to affect water shedding in fuels.
Tests to examine the behaviour of water in aviation fuel, showed that water which wasdissolved in jet fuel precipitated out of solution in the form of small droplets of size 5µm andbelow as the fuel was cooled. These droplets disappeared back into solution in the fuel whenit was re-heated. The initial studies indicate that the droplet size is not affected by coolingrate. The droplets remained as spherical particles when cooled to the freezing temperature ofthe fuel and there was no indication of ice crystals being nucleated. From visual observationsit was assumed that the droplets either contained supercooled water or water frozen asspheres.

17
However, DSC studies indicated that the water actually froze between -26°C and -41°C. Icecrystals were formed in toluene (the model aromatic hydrocarbon) on cooling to 44°C butidentifiable ice crystals were not observed in the other fuels or hydrocarbons. The reason forice crystal formation in toluene is believed to be associated with its higher affinity for water.Further investigation is required, especially as the crystalline form of the ice formed fromsmall droplets is uncertain.
Acknowledgements
The authors would like to record their appreciation for the generous financial support givenby EADS Innovation Works in funding the research programme from which this paper wasderived. The authors would also like to thank Shell Global Solutions (UK) for their help inthe supply of two aviation fuels used for this research.
References
1. J I Hetherington, M D Carpenter, Water Management in Aviation Fuels, A LiteratureReview, Cranfield report DASSR/JIH/MDC/1486/09, November 2009
2. B J Neely, J Wagner, R L Robinson, K A M Gasem, Mutual Solubility Measurements ofHydrocarbon-Water Systems Containing Benzene, Toluene, and 3-Methylpentane, J ChemEng Data, 2008, 53, 165-174
3. C Marche, C Ferronato, J-C de Hemptinne, J Jose, Apparatus for the Determination ofWater Solubility in Hydrocarbon: Toluene and Alkylcyclohexanes (C6 to C8) from 30°C to180°C, J Chem Eng Data, 2006, 51, 355-359
4. C Marche, H Delépine, C Ferronato, J Jose, Apparatus for the On-line GC Determinationof Hydrocarbon Solubility in Water: Benzene and Cyclohexane for 70°C to 150°C, J ChemEng Data, 2003, 48, 398-401
5. C Marche, C Ferronato, J Jose, Solubilities of Alkylcyclohexanes in Water from 30°C to180°C, J Chem Eng Data, 2004, 49, 937-940
6. C Marche, C Ferronato, J Jose, Solubilities of n-Alkanes (C6 to C8) in Water from 30°C to180°C, J Chem Eng Data, 2003, 48, 967-971
7. CRC Report No 635, 2004, Handbook of Aviation Fuel Properties
8. A B Crampton, R F Finn, J J Kolfenbach, What Happens to the Dissolved Water inAviation Fuels?, SAE Summer Meeting, New Jersey, June 1953
9. J I Hetherington, L Copson, The Combined Effects of Static Dissipator Additive and FuelImpurities on the Separation of Water from Aviation Fuel, 9th International Conference onStability, Handling and Use of Liquid Fuels, Sitges, Spain, September 2005
18
10. G Rickard, The Quality of Aviation Fuel Available in the United Kingdom, AnnualSurvey 2007, Report Qinetiq/08/01656, June 2008
11. P V Hobbs, Ice Physics, 1974, Oxford, Clarendon
12. S Zabarnick, N Widmor, Studies of Jet Fuel Freezing by Differential ScanningCalorimetry, Energy Fuels, 2001,15 (6), 1447-1453
13. AAIB, Report on Accident to Boeing 777-236ER, G-YMMM at London HeathrowAirport on 17 January 2008, Aircraft Accident Report 1/2010, EW/C2008/01/10
14. B J Murray, A K Bertram, Formation and Stability of Cubic Ice in Water Droplets, PhysChem Chem Phys, 2006, 8, 186-192
15. B J Murray, D A Knopf, A K Bertram, The Formation of Cubic Ice Under ConditionsRelevant to Earth’s Atmosphere, Nature, 2005, 434, 202-205