Embed Size (px)
Citation preview
8/3/2019 Paper c05 Ace2004
http://slidepdf.com/reader/full/paper-c05-ace2004 1/10
Sixth International Congress on Advances in Civil Engineering, 6-8 October 2004
Bogazici University, Istanbul, Turkey
Structural Assessment of a Historical Masonry Structure:Urla Kamanlõ Mosque
E. Teomete, E. Aktaş
Department of Civil Engineering, Izmir Institute of Technology, Urla, Izmir,Turkey
Abstract
Structural assessment of historical structures is a complex, interdisciplinary process. Inthis paper, a sample study on structural assessment of a historical structure is presented.The study covers the history investigation, measurement survey, nondestructive anddestructive tests on materials of the structure. The results obtained for dead load,dynamic load and support settlement analyses using the finite element model created onthe basis of the gathered data are presented.
Introduction
Historical masonry structures suffer from damage because of material degradations,differential settlements, seismic actions and other environmental effects. These damagesand actions accumulate by time and cause complex behavior in the response of thestructure. For that reason, in order to make a structural assessment; measurement survey,material tests, soil survey, long term observations and structural tests and analysesshould be applied (Ersoy, 1989).Extensive work has been published in the literature for structural assessment procedures.Destructive and nondestructive tests are conducted in order to characterize the materialsof the structure (Binda et al., 2000). By using the data gathered from the tests, finite
element model of the structure is developed and structural analyses are conducted(Koçak, 1999). In order to calibrate the models, system identification techniques such asambient vibration tests are performed (Çakmak et al., 1992).Understanding the behavior of the masonry structures has always been an urge for centuries. Several practical structural analyses techniques such as force polygon, thechain rule have been used to determine the reasons for structural damage in variousmasonry structures (Heyman, 1982). By the development of high computationcapabilities of computers, approaches like generalized matrix formulations (Roca, 2001)and finite element method are adopted to analyze masonry structures.
793
8/3/2019 Paper c05 Ace2004
http://slidepdf.com/reader/full/paper-c05-ace2004 2/10
Even for a better understanding of the behavior of masonry structures, constitutivemodels are proposed for nonlinear analyses (Lourenço, 1996). Finite element analysesare performed by using various element types for modeling masonry structures(Giordano et al., 2002).In this paper a comprehensive research on the assessment of a historical masonrystructure is presented. Urla Kamanli Mosque in Urla, Izmir is a member of a group of
structures named Yahşi Bey Külliyesi, which contains a Turkish Bath, a tomb, twofountains and a primary school (sibyan mektebi). Altough there is not any writtendocument kept about the construction date and constructors, by using comparativemethods of architectural elements in light of art history it is concluded that the structuresdate back to an era between the early 14th century to mid 15th century (Erim, 1995).History investigation, measurement survey, nondestructive and destructive tests,longterm observations have been conducted for the Kamanli Mosque. On the basis of the data gathered, a 3D finite element model of the structure was developed by usingLUSAS, a commercial finite element analysis software. Linear elastic analyses for deadload, response spectrum and settlement loadings have been conducted in order todetermine the structural behaviour and the causes of existing damage of the structure.
Description of the Structure
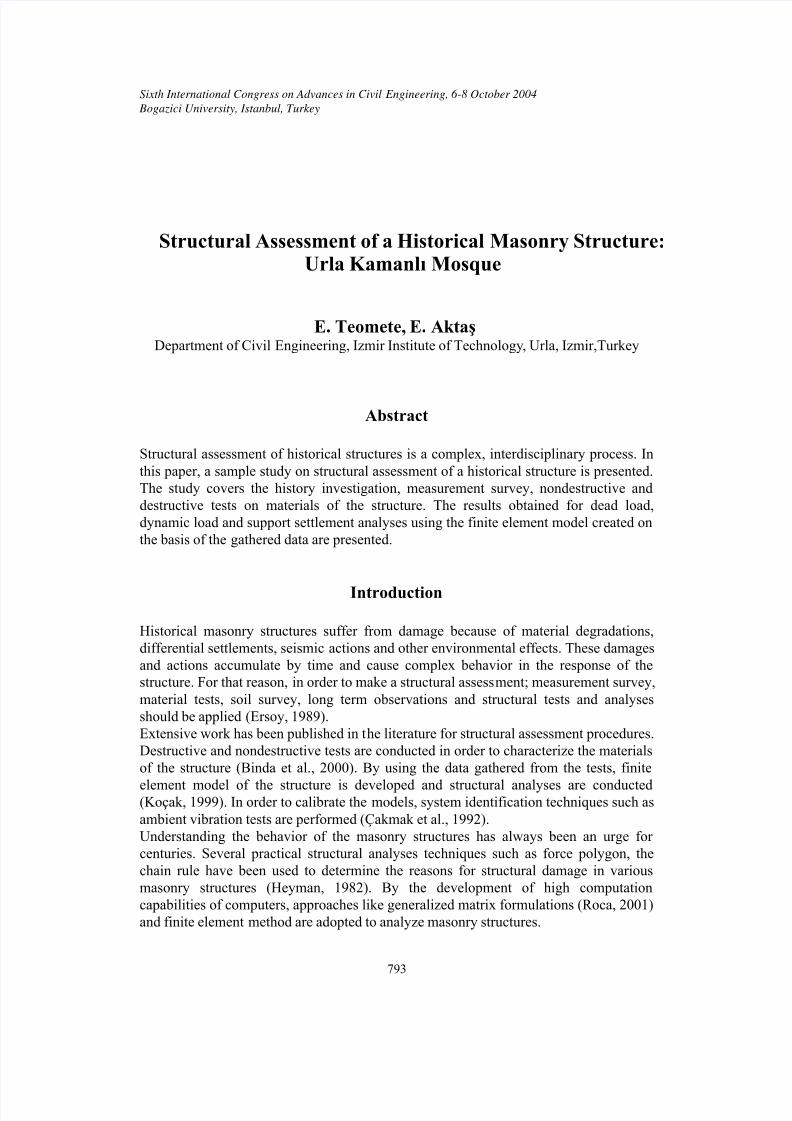
The structure has a square plan of 10 m×10 m with a wall thickness of 110 cm and theheight of the structure is 12.66 m. The walls of the structure are stone masonry withlimestone and thick mortar joints. The window arches and the dome are brick masonrywith thick mortar joints. The transition from walls to dome on the corners is achieved byuse of trompes which are also brick masonry (Fig.1).The structure has not been used for a long time and open to all environmental effectssince the windows and the door of the structure do not exist. Especially in the first 1 mabove the ground level, there is an extensive material degradation because of moisture.The wooden lintels which should surround the walls (along the inner and outer
perimeters) at two levels, do not exist, as can be seen in Fig.1. Because of that the crosssections of the walls at the wooden lintel levels decrease considerably which weaken thestructure.On the east and west walls, extensive cracks follow the path way of the windows and
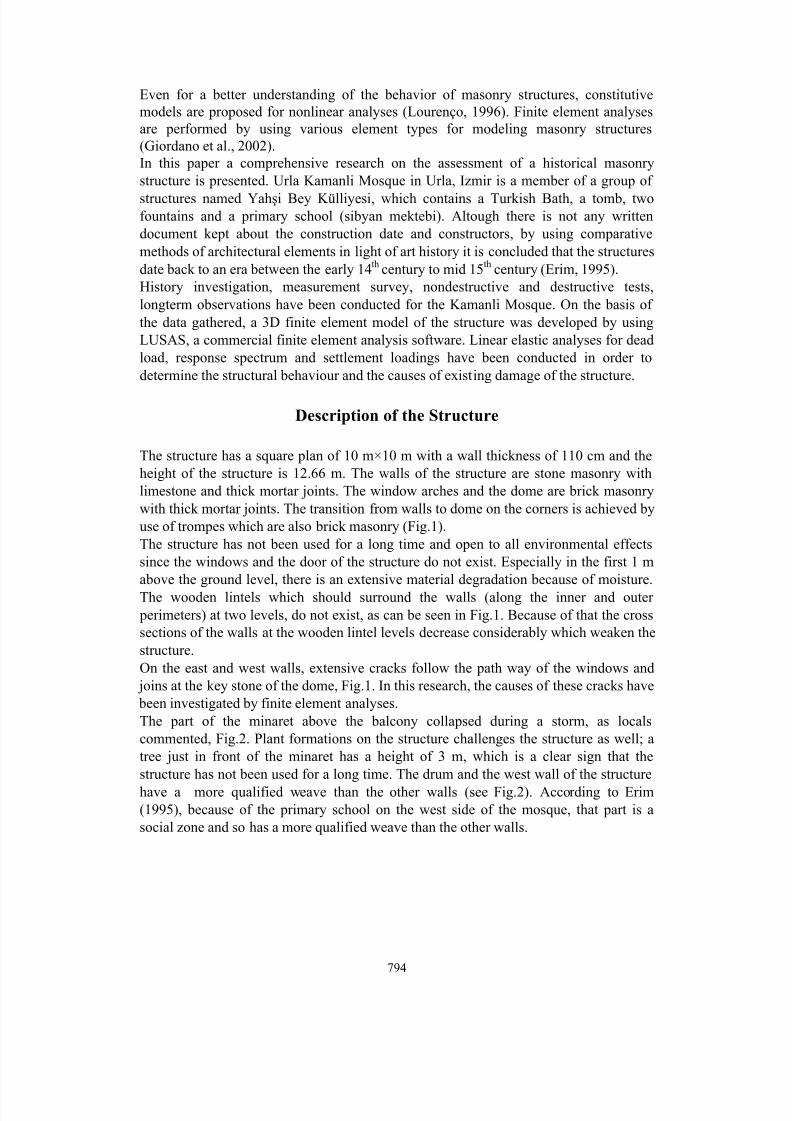
joins at the key stone of the dome, Fig.1. In this research, the causes of these cracks have been investigated by finite element analyses.The part of the minaret above the balcony collapsed during a storm, as localscommented, Fig.2. Plant formations on the structure challenges the structure as well; atree just in front of the minaret has a height of 3 m, which is a clear sign that thestructure has not been used for a long time. The drum and the west wall of the structure
have a more qualified weave than the other walls (see Fig.2). According to Erim(1995), because of the primary school on the west side of the mosque, that part is asocial zone and so has a more qualified weave than the other walls.
794
8/3/2019 Paper c05 Ace2004
http://slidepdf.com/reader/full/paper-c05-ace2004 3/10
Fig.1. The east section Fig.2. The south elevation
Material Tests and Longterm Observations
In order to characterize the materials of the structure, nondestructive and destructivetests are applied on stone, brick and mortar samples of the structure. Schmidt hammer test on stone and density-porosity test on stone, brick and mortar samples are performed.
Table 1. Material test results.
Stone S1
(South 1)37 30.8 3291 2498 64.17 5.72 9221.51 15.66
Stone S2(South 2)
26 31.7 3456 2531 65.44 7.41 9247.54 11.08
Stone
W1
(West 1)
14 39.7 5187 2596 127.8 8.49 30895.2 2.202
Stone
W2
(West 2)
12 38 5536 2515 105.9 9.88 27245.1 0.786
Brick 75 NA 1398 1800 11.68 1.867 866.5 29.45
Mortar S
(Stone
masonry)
1 NA NA 1690 4.19 0.73 110.5 32.796
Mortar B
(Brick
masonry)
1 NA NA 1400 8.75 0.95 264.38 43.458
N u m b e r o f C o r e s
S c h m i d t H a m m e r
( R )
P u l s e V e l o c i t y
( m / s e c )
P o r o s i t y ( % )
D e n s i t y ( k g / m 3 )
C o m p r e s s i v e
S t r e n g t h ( M P a )
T e n s i l e S t r e n g t h
( M P a )
E l a s t i c i t y M o d u l u s
( M P a )
795
8/3/2019 Paper c05 Ace2004
http://slidepdf.com/reader/full/paper-c05-ace2004 4/10
Ultrasonic pulse velocity test, uniaxial compression and indirect tension tests are appliedon brick and stone samples collected from the structure. Uniaxial compression andindirect tension tests are conducted on mortar of the Kamanli Turkish Bath by theDepartment of Architectural Restoration. The properties of mortar are assumed to beidentical for both the bath and the mosque since they belong to the same group of structures. The results of the tests are given in Table1. Because of the limited space,
details of the tests are not given here. The compressive strengths of the stones takenfrom the west section are approximately two times the stones from the south section.Also the modulus of elasticity values of the stones taken from the west section areapproximately three times the stones from the south section. The porosity of the stonestaken from the south section is at least five times the porosity of the stones taken fromthe west section which causes extensive differences in strength of stone samples. This
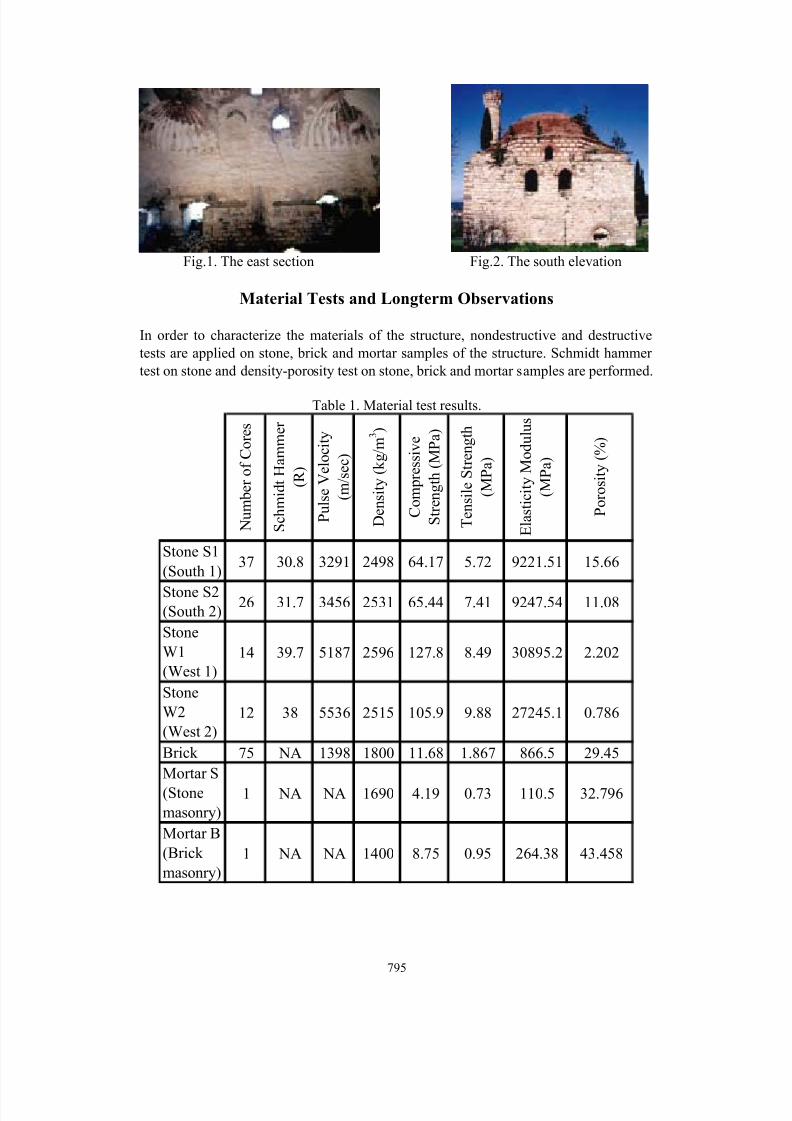
porosity difference might be because of the fossils in the stone samples of the southsection which were detected by scanning electron microscope, (see Fig.3 a-b). Thesefossils cause impurities which decrease the strength of the material. Fossils could not beobserved in the stone samples taken from the west section. By considering the weave of the west wall to be more qualified then the other walls, and the strength and fossil
containment, it is highly probable that the stones of the west wall could belong to adifferent source than the stones of other walls.
Fig.3.a-b Fossils in stone samples S1 and S2 respectively, from south section (SEM).
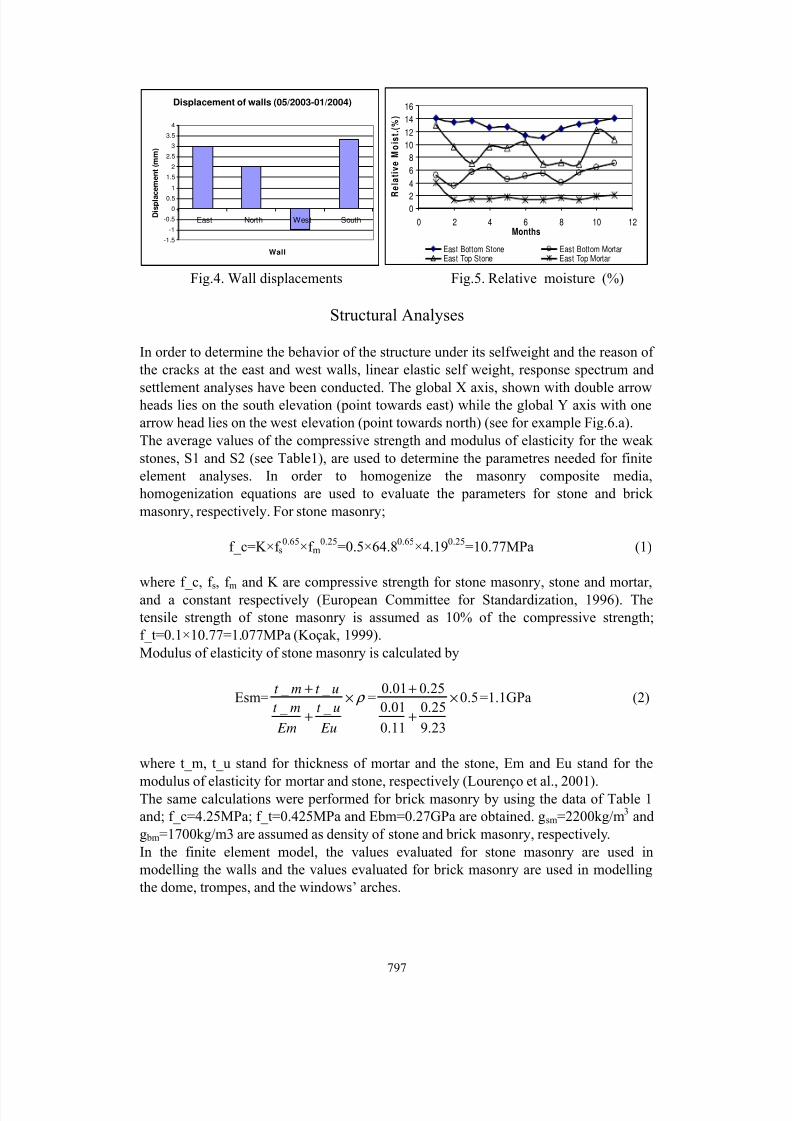
Long term observations have been conducted by measuring the length between twostuds stuck on opposite corners of each wall once in every three months. The difference
between the last measurements and the previous ones gives us the motion of the walls.As can be seen in Fig.4., in 7 month period the sides of the east, north and south wallsmove apart 3mm, 2mm and 3.3 mm, respectively. On the other hand the sides of thewest wall move inward 1mm.The relative moisture of the stone and mortar have been measured monthly, at all of the
inner sections, at first one metre and at above two metres. In Fig.5., the relative moisturevalues of the east section is given. The moisture at the bottom for stone is higher thanthe moisture of the stone at the top, and the same thing is valid for mortar. At lower levels, due to moisture a considerable degradation of materials is observed.
796
8/3/2019 Paper c05 Ace2004
http://slidepdf.com/reader/full/paper-c05-ace2004 5/10
Displacement of walls (05/2003-01/2004)
-1.5
-1
-0.5
0
0.5
1
1.5
2
2.5
3
3.5
4
East North West South
Wall
D i s p l a c e m e n t ( m m )
02
4
6
8
10
12
14
16
0 2 4 6 8 10 12Months
R
e l a t i v e M o i s t . ( %
)
East Bottom Stone East Bottom MortarEast Top Stone East Top Mortar
Fig.4. Wall displacements Fig.5. Relative moisture (%)
Structural Analyses
In order to determine the behavior of the structure under its selfweight and the reason of the cracks at the east and west walls, linear elastic self weight, response spectrum and
settlement analyses have been conducted. The global X axis, shown with double arrowheads lies on the south elevation (point towards east) while the global Y axis with onearrow head lies on the west elevation (point towards north) (see for example Fig.6.a).The average values of the compressive strength and modulus of elasticity for the weak stones, S1 and S2 (see Table1), are used to determine the parametres needed for finiteelement analyses. In order to homogenize the masonry composite media,homogenization equations are used to evaluate the parameters for stone and brick masonry, respectively. For stone masonry;
f_c=K×f s0.65×f m
0.25=0.5×64.80.65×4.190.25=10.77MPa (1)
where f_c, f s, f m and K are compressive strength for stone masonry, stone and mortar,and a constant respectively (European Committee for Standardization, 1996). Thetensile strength of stone masonry is assumed as 10% of the compressive strength;f_t=0.1×10.77=1.077MPa (Koçak, 1999).Modulus of elasticity of stone masonry is calculated by
Esm= ρ ×
+
+
Eu
ut
Em
mt
ut mt
_ _ _ _
= 5.0
23.9
25.0
11.0
01.025.001.0
×
+
+=1.1GPa (2)
where t_m, t_u stand for thickness of mortar and the stone, Em and Eu stand for the
modulus of elasticity for mortar and stone, respectively (Lourenço et al., 2001).The same calculations were performed for brick masonry by using the data of Table 1and; f_c=4.25MPa; f_t=0.425MPa and Ebm=0.27GPa are obtained. gsm=2200kg/m3 andg bm=1700kg/m3 are assumed as density of stone and brick masonry, respectively.In the finite element model, the values evaluated for stone masonry are used inmodelling the walls and the values evaluated for brick masonry are used in modellingthe dome, trompes, and the windows’ arches.
797
8/3/2019 Paper c05 Ace2004
http://slidepdf.com/reader/full/paper-c05-ace2004 6/10
Self Weight Analyses
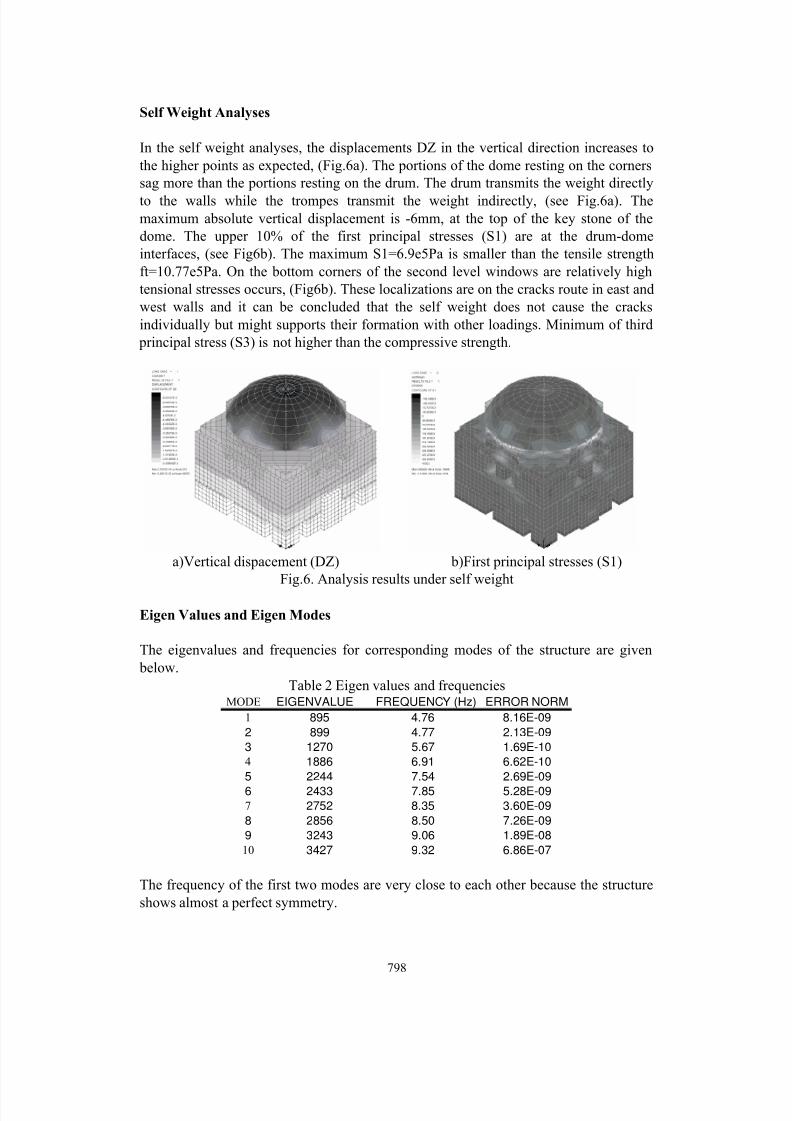
In the self weight analyses, the displacements DZ in the vertical direction increases tothe higher points as expected, (Fig.6a). The portions of the dome resting on the cornerssag more than the portions resting on the drum. The drum transmits the weight directly
to the walls while the trompes transmit the weight indirectly, (see Fig.6a). Themaximum absolute vertical displacement is -6mm, at the top of the key stone of thedome. The upper 10% of the first principal stresses (S1) are at the drum-domeinterfaces, (see Fig6b). The maximum S1=6.9e5Pa is smaller than the tensile strengthft=10.77e5Pa. On the bottom corners of the second level windows are relatively hightensional stresses occurs, (Fig6b). These localizations are on the cracks route in east andwest walls and it can be concluded that the self weight does not cause the cracksindividually but might supports their formation with other loadings. Minimum of third
principal stress (S3) is not higher than the compressive strength.
a)Vertical dispacement (DZ) b)First principal stresses (S1)Fig.6. Analysis results under self weight
Eigen Values and Eigen Modes
The eigenvalues and frequencies for corresponding modes of the structure are given below.
Table 2 Eigen values and frequenciesMODE EIGENVALUE FREQUENCY (Hz) ERROR NORM
1 895 4.76 8.16E-09
2 899 4.77 2.13E-09
3 1270 5.67 1.69E-10
4 1886 6.91 6.62E-10
5 2244 7.54 2.69E-09
6 2433 7.85 5.28E-09
7 2752 8.35 3.60E-09
8 2856 8.50 7.26E-09
9 3243 9.06 1.89E-08
10 3427 9.32 6.86E-07
The frequency of the first two modes are very close to each other because the structureshows almost a perfect symmetry.
798
8/3/2019 Paper c05 Ace2004
http://slidepdf.com/reader/full/paper-c05-ace2004 7/10
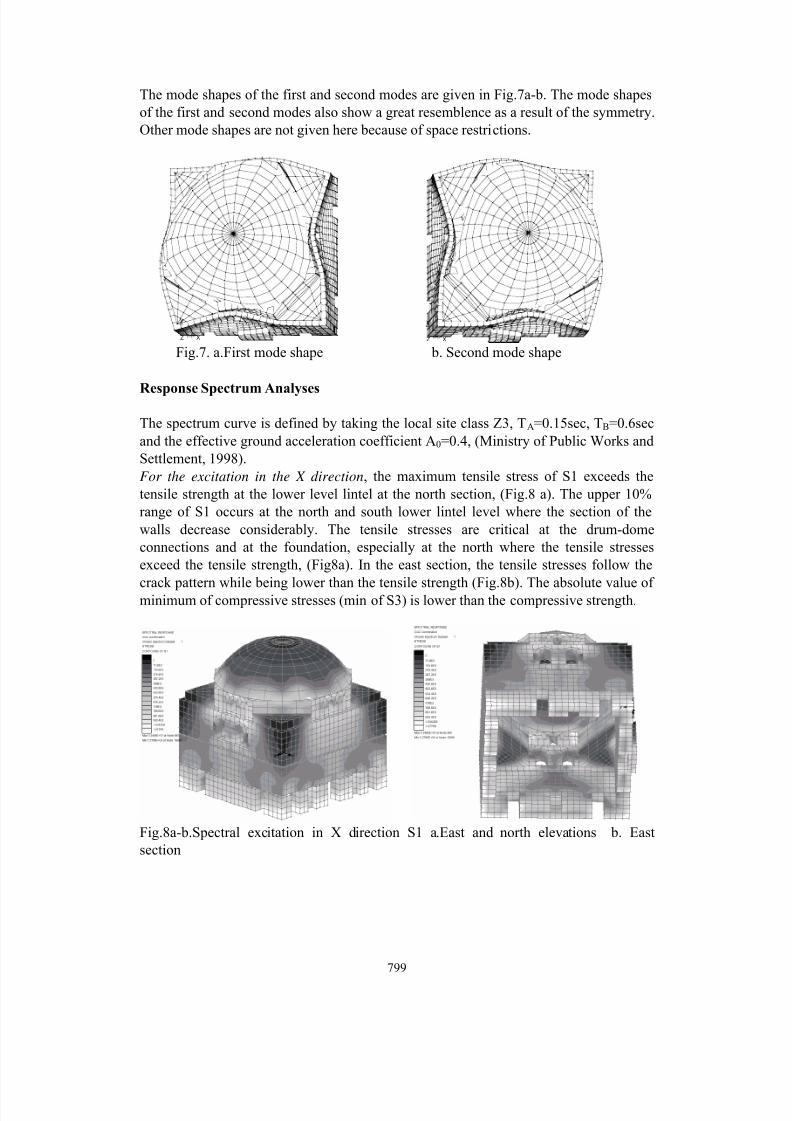
The mode shapes of the first and second modes are given in Fig.7a-b. The mode shapesof the first and second modes also show a great resemblence as a result of the symmetry.Other mode shapes are not given here because of space restrictions.
X
Y
Z X
Y
Z Fig.7. a.First mode shape b. Second mode shape
Response Spectrum Analyses
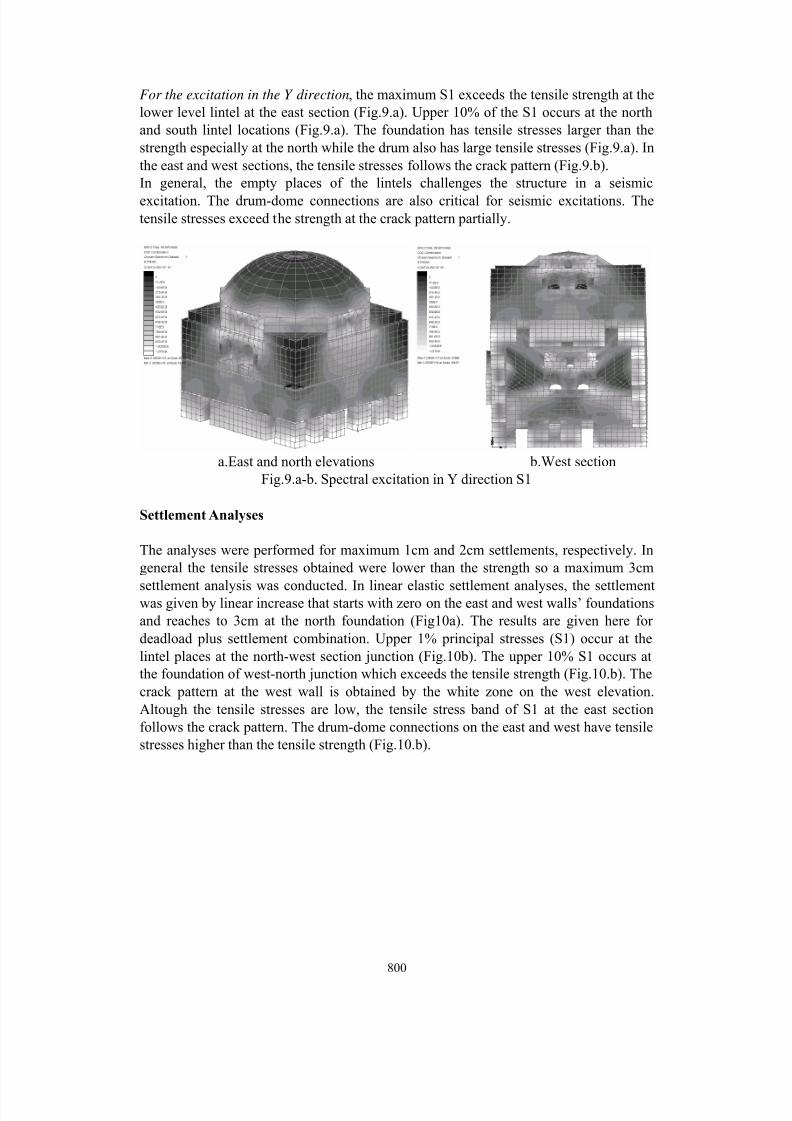
The spectrum curve is defined by taking the local site class Z3, TA=0.15sec, TB=0.6secand the effective ground acceleration coefficient A0=0.4, (Ministry of Public Works andSettlement, 1998).For the excitation in the X direction, the maximum tensile stress of S1 exceeds thetensile strength at the lower level lintel at the north section, (Fig.8 a). The upper 10%range of S1 occurs at the north and south lower lintel level where the section of thewalls decrease considerably. The tensile stresses are critical at the drum-domeconnections and at the foundation, especially at the north where the tensile stressesexceed the tensile strength, (Fig8a). In the east section, the tensile stresses follow the
crack pattern while being lower than the tensile strength (Fig.8b). The absolute value of minimum of compressive stresses (min of S3) is lower than the compressive strength.
Fig.8a-b.Spectral excitation in X direction S1 a.East and north elevations b. Eastsection
799
8/3/2019 Paper c05 Ace2004
http://slidepdf.com/reader/full/paper-c05-ace2004 8/10
For the excitation in the Y direction, the maximum S1 exceeds the tensile strength at thelower level lintel at the east section (Fig.9.a). Upper 10% of the S1 occurs at the northand south lintel locations (Fig.9.a). The foundation has tensile stresses larger than thestrength especially at the north while the drum also has large tensile stresses (Fig.9.a). Inthe east and west sections, the tensile stresses follows the crack pattern (Fig.9.b).In general, the empty places of the lintels challenges the structure in a seismic
excitation. The drum-dome connections are also critical for seismic excitations. Thetensile stresses exceed the strength at the crack pattern partially.
a.East and north elevations b.West sectionFig.9.a-b. Spectral excitation in Y direction S1
Settlement Analyses
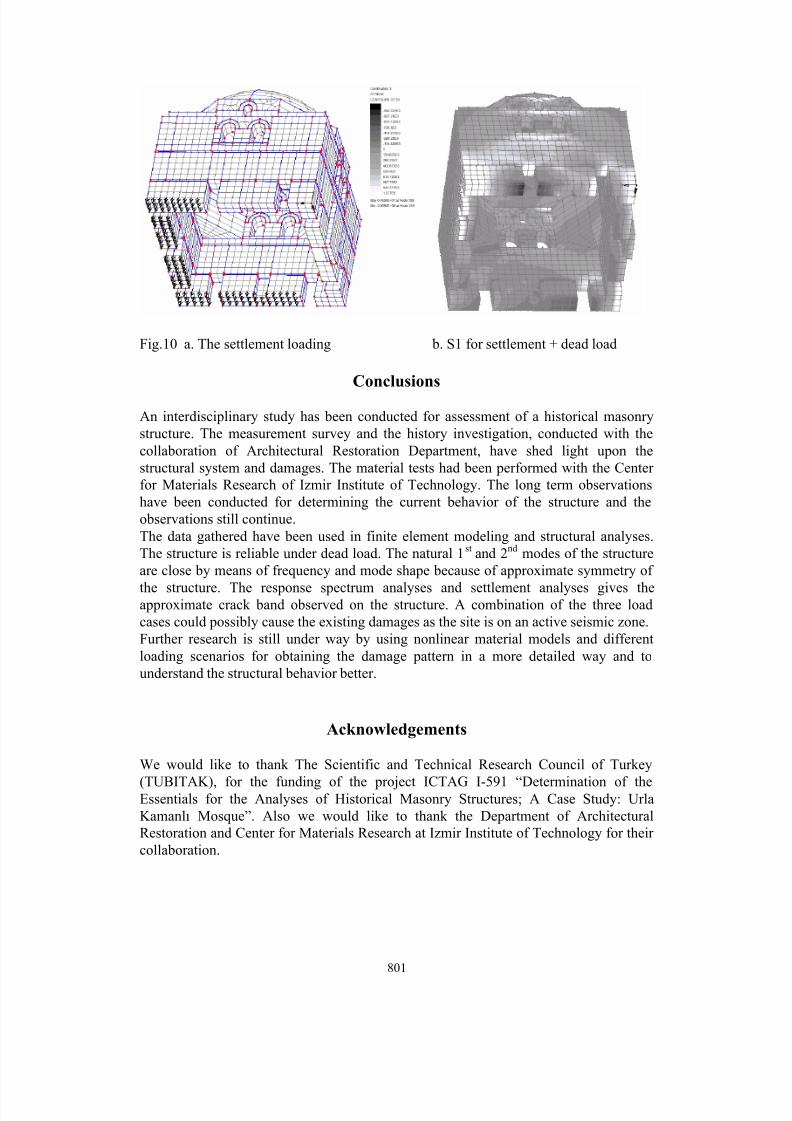
The analyses were performed for maximum 1cm and 2cm settlements, respectively. Ingeneral the tensile stresses obtained were lower than the strength so a maximum 3cm
settlement analysis was conducted. In linear elastic settlement analyses, the settlementwas given by linear increase that starts with zero on the east and west walls’ foundationsand reaches to 3cm at the north foundation (Fig10a). The results are given here for deadload plus settlement combination. Upper 1% principal stresses (S1) occur at thelintel places at the north-west section junction (Fig.10b). The upper 10% S1 occurs atthe foundation of west-north junction which exceeds the tensile strength (Fig.10.b). Thecrack pattern at the west wall is obtained by the white zone on the west elevation.Altough the tensile stresses are low, the tensile stress band of S1 at the east sectionfollows the crack pattern. The drum-dome connections on the east and west have tensilestresses higher than the tensile strength (Fig.10.b).
800
8/3/2019 Paper c05 Ace2004
http://slidepdf.com/reader/full/paper-c05-ace2004 9/10
Fig.10 a. The settlement loading b. S1 for settlement + dead load
Conclusions
An interdisciplinary study has been conducted for assessment of a historical masonrystructure. The measurement survey and the history investigation, conducted with thecollaboration of Architectural Restoration Department, have shed light upon thestructural system and damages. The material tests had been performed with the Center for Materials Research of Izmir Institute of Technology. The long term observationshave been conducted for determining the current behavior of the structure and theobservations still continue.The data gathered have been used in finite element modeling and structural analyses.The structure is reliable under dead load. The natural 1st and 2nd modes of the structureare close by means of frequency and mode shape because of approximate symmetry of
the structure. The response spectrum analyses and settlement analyses gives theapproximate crack band observed on the structure. A combination of the three loadcases could possibly cause the existing damages as the site is on an active seismic zone.Further research is still under way by using nonlinear material models and differentloading scenarios for obtaining the damage pattern in a more detailed way and tounderstand the structural behavior better.
Acknowledgements
We would like to thank The Scientific and Technical Research Council of Turkey
(TUBITAK), for the funding of the project ICTAG I-591 “Determination of theEssentials for the Analyses of Historical Masonry Structures; A Case Study: UrlaKamanlõ Mosque”. Also we would like to thank the Department of ArchitecturalRestoration and Center for Materials Research at Izmir Institute of Technology for their collaboration.
801
8/3/2019 Paper c05 Ace2004
http://slidepdf.com/reader/full/paper-c05-ace2004 10/10
References
Binda, L. Saisi, A. Tiraboschi C. (2000). Investigation Procedures for the Diagnosis of Historic Masonries. Construction and Building Materials, Volume 14, Issue 4, Pages199-233.
Çakmak, A.Ş. Davidson, R. Mullen, C.L. Erdik, M. (1992). Dynamic Analysis andEarthquake Response of Hagia Sophia. Seminar on Protection of Architectural HeritageAgainst Earthquake, Istanbul-Ankara, pp.19-35.
Erim, F. (1995). Urla’da Türk Devri Yapõlar õ-1. Ege Üniversitesi Edebiyat Fak.Arkeoloji ve Sanat Tarihi Bölümü, Türk-İslam Sanatlar õ A.B.D. Lisans Bitirme Tezi,Izmir.
Ersoy, U. (1989). Diagnosis, Assessment and Emergency Interventions for the HistoricMasonry Structures. Structural Conservation of Stone Masonry, International Technical
Conference, Athens.
European Committee for Standardization. (1996). Design of Masonry Structures.Eurocode6, Brussel.
Giordano, A. Mele, E. Luca, A. (2002). Modelling of Historical Masonry Structures:Comparison of Different Approaches Through a Case Study . Engineering Structures,Vol.24, pp.1057-1069.
Heyman, J. (1982). The Masonry Arch. Ellis Horwood Limited, Chichester.
Koçak, A. (1999). The linear and non-linear analysis of the historical buildings under static and dynamic loading: The study of Küçük Ayasofya Mosque. Yõldõz TechnicalUniversity, Institute of Science, PhD Thesis , İstanbul. (In Turkish)
Lourenço, P.B. (1996). Computational Strategies for Masonry Structures. DelftUniversity Press, Delft.
Lourenço, P.B. Vasconcelos, G. Ramos, L. (2001). Assessment of the StabilityConditions of a Cistercian Cloister. 2nd International Congress on Studies in AncientStructures, Yõldõz Technical University, İstanbul.
Ministry of Public Works and Settlement, Government of Republic of Turkey. (1998).Specification for Structures to be Built in Disaster Areas, Turkey.
Roca, P. (2001). Analysis of Gothic Structure. 2nd International Congress on Studies inAncient Structures. Yõldõz Technical University Faculty of Architecture, Istanbul.
802


![[Curs Android] C05 - Emulator (IPW 2011)](https://img.pdfslide.us/doc/110x75/54655568af795939528b5456/curs-android-c05-emulator-ipw-2011.jpg)


![C05 [Autosaved]](https://img.pdfslide.us/doc/110x75/563db87d550346aa9a942da3/c05-autosaved.jpg)