Embed Size (px)
Citation preview
Answer to MTP_Final_Syllabus 2012_Jun2017_Set 2
Academics Department, The Institute of Cost Accountants of India (Statutory Body under an Act of Parliament) Page 1
Paper 20 – Financial Analysis & Business Valuation

Answer to MTP_Final_Syllabus 2012_Jun2017_Set 2
Academics Department, The Institute of Cost Accountants of India (Statutory Body under an Act of Parliament) Page 2
Paper 20 – Financial Analysis & Business Valuation
Full Marks: 100 Time allowed: 3 hours
Question No. 1 which is compulsory and carries 20 marks and answer any five questions from
Question No. 2 to Question No. 8
1. (a) State whether the following statements are true or false: [1×8=8]
(i) Realistic, error free and flexible are not the attributes of a good financial model.
(ii) If EPS of a company is ` 15 and the PE ratio is 10, then market value of the share of
the company is ` 1.5.
(iii) In case of Deep Discount Bond, the issue price is always the face value.
(iv) Cash realized from sale of scrap is grouped under the category of cash from
investing activities in Cash flow statement.
(v) A brand is nothing but a glorified product name; hence it has no value.
(vi) The CAPM assumes perfect market competition.
(vii) In a synergistic merger, the post-merger value exceeds the sum of the separate
companies’ pre-merger values.
(viii) One of the consequences of Efficient Market Hypothesis (EMH) is that the market will
always have equilibrium price of a company’s share as determined by its
fundamentals.
Answer:
(i) False
(ii) False
(iii) False
(iv) False
(v) False
(vi) True
(vii) True
(viii) False
(b) The operating and cost data of ABC Ltd. are:
Sales ` 20,00,000
Variable Costs ` 14,00,000
Fixed Costs ` 4,00,000 (including 15% interest on ` 10,00,000)
You are required to:
(i) Calculate its operating, financial and combined leverage and
(ii) Determine the additional sales to double its EBIT. [6]
Answer:
(i) EBIT = Sales-VC-Operative fixed cost
= ` (20,00,000 -14,00,000 -2,50,000) = `3,50,000.
Answer to MTP_Final_Syllabus 2012_Jun2017_Set 2
Academics Department, The Institute of Cost Accountants of India (Statutory Body under an Act of Parliament) Page 3
Net earnings before taxes = EBIT-Interest
= ` 3,50,000 - ` 1,50,000 = ` 2,00,000
Operating leverage = (Sales - VC)/EBIT
= ` 6,00,000 ÷ ` 3,50,000 = 1.71
Financial leverage = EBIT/(EBIT -Interest)
= ` 3,50,000 ÷ ` 2,00,000 = 1.75
Combined leverage
= operating leverage × financial leverage =1.71×1.75 =2.99
(ii) Desired sales revenue to earn double EBIT:
The P/V ratio will be —
Contribution/Sales
= (` 20,00,000 - ` 14,00,000)/ ` 20,00,000
= ` 6,00,000/ ` 20,00,000 = 0.30
Now, the desired sales revenue will be —
(` 2,50,000 + ` 3,50,000 + ` 3,50,000)/ 0.30
= ` 31,66,667
Additional sales required = ` (31,66,667-20,00,000) = ` 11,66,667.
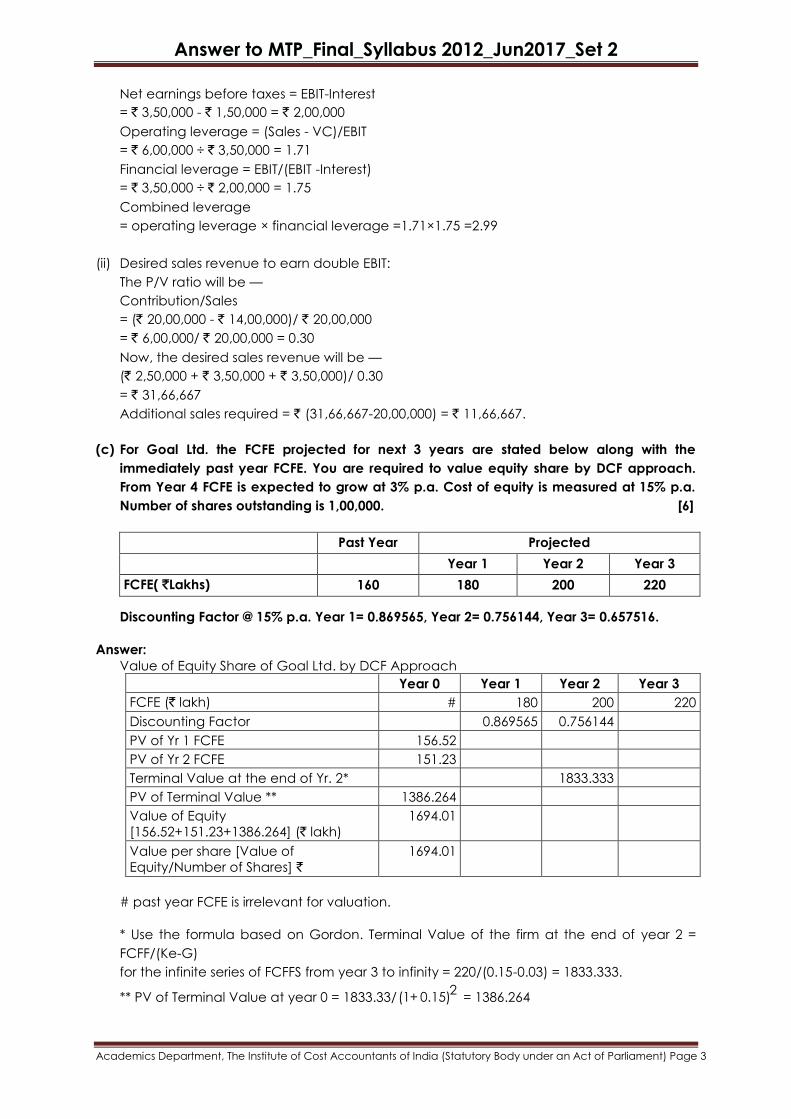
(c) For Goal Ltd. the FCFE projected for next 3 years are stated below along with the
immediately past year FCFE. You are required to value equity share by DCF approach.
From Year 4 FCFE is expected to grow at 3% p.a. Cost of equity is measured at 15% p.a.
Number of shares outstanding is 1,00,000. [6]
Past Year Projected
Year 1 Year 2 Year 3
FCFE( `Lakhs) 160 180 200 220
Discounting Factor @ 15% p.a. Year 1= 0.869565, Year 2= 0.756144, Year 3= 0.657516.
Answer:
Value of Equity Share of Goal Ltd. by DCF Approach
Year 0 Year 1 Year 2 Year 3
FCFE (` lakh) # 180 200 220
Discounting Factor 0.869565 0.756144
PV of Yr 1 FCFE 156.52
PV of Yr 2 FCFE 151.23
Terminal Value at the end of Yr. 2* 1833.333
PV of Terminal Value ** 1386.264
Value of Equity
[156.52+151.23+1386.264] (` lakh)
1694.01
Value per share [Value of
Equity/Number of Shares] `
1694.01
# past year FCFE is irrelevant for valuation.
* Use the formula based on Gordon. Terminal Value of the firm at the end of year 2 =
FCFF/(Ke-G)
for the infinite series of FCFFS from year 3 to infinity = 220/(0.15-0.03) = 1833.333.
** PV of Terminal Value at year 0 = 1833.33/2
(1+ 0.15) = 1386.264

Answer to MTP_Final_Syllabus 2012_Jun2017_Set 2
Academics Department, The Institute of Cost Accountants of India (Statutory Body under an Act of Parliament) Page 4
Note: the long term growth rate is applicable on the subsequent FCFE and not on the first
FCFE of the series. Hence the series starts with Year 3 FCFE and the PV for the infinite series
by application of Gordon formula is obtained at the end of Year 2(always 1 year before
the starting cash flow.)
Alternative solution:
Yr 0 Yr 1 Yr 2 Yr 3 Yr 4
FCFE (` lakh) 180 200 220 226.6
Discounting Factor 0.869565 0.756144 0.657516
PV of Yr 1 FCFE 156.52
PV of Yr 2 FCFE 151.23
PV of Yr 3 FCFE 144.6535
Terminal Value at the end of
Yr 3
1888.333
PV of Terminal Value 1241.61
Value of Equity DCF (`
lakh)
1694.01
Value per share ` 1694.01
Note: Terminal Value at end of Year 3 = 226.6 ÷ (0.15-0.03) =1888.333
PV of Terminal Value at year 0 = 1888.333 ÷ 3
(1+ 0.15) = 1241.61
2. The Balance Sheets of Maras Ltd. for the years ended on 31.03.2016 and 31.03.2017 are as
follows:
(Amount in ` Lakh)
As at 31.03.16 As at 31.03.17
Equity & Liabilities
Shareholder's Fund:
Share capital 696.60 726.70
Equity Share suspense 30.07 ------
Equity Share warrants ----- 841.20
Reserve & Surplus 31,256.89 39,156.40
Non-Current Liabilities:
Secured Loans 4,784.56 3,300.09
Unsecured Loans 9,128.31 14,939.75
Deferred Tax liabilities 3,491.00 3,936.27
Current Liabilities:
Other current liabilities 8,432.77 10,522.73
Provisions 856.44 1,496.31
58,676.64 74,919.45
Assets
Non-current assets ------- ------
Fixed Assets (Net) 31,830.23 30,941.81
Capital work in progress 3,764.07 11,502.92
Non-Current Investment:
Investment 8,125.67 11,031.80
Current Assets:
Inventories 6,068.25 7,123.77
Trade receivables 1,866.21 3,113.79

Answer to MTP_Final_Syllabus 2012_Jun2017_Set 2
Academics Department, The Institute of Cost Accountants of India (Statutory Body under an Act of Parliament) Page 5
Cash and bank balance 917.68 2,140.03
Other current assets 1.53 36.27
Loans and advances 6,103.00 9,029.06
58,676.64 74,919.45
Required:
(i) Prepare the Common-Size Balance Sheet of Maras Ltd.
(ii) Present and interpret your observations on the common-size Balance Sheet. [6+10=16]
Answer:
(i) Common Size Balance Sheet of Maras Ltd. (` in lakhs)
As at
31.03.2016
%
of Total
As at
31.03.2017
%
of Total
EQUITY & LIABILITIES
Shareholders' Fund:
Share Capital 696.60 1.187 726.70 0.970
Equity share suspense 30.07 0.051 - -
Equity share warrants - - 841.20 1.123
Reserve and surplus 31,256.89 53.270 39,156.40 52.265
Non-current liabilities:
Secured loans 4,784.56 8.154 3,300.09 4.405
Unsecured loans 9,128.31 15.557 14,939.75 19.941
Deferred tax l iabil i t ies 3,491.00 5.950 3,936.27 5.254
Current Liabilities:
Other current l iabi l i t ies 8,432.77 14.372 10,522.73 14.045
Provisions 856.44 1.460 1,496.31 1.997
58,676.64 100.00 74,919.45 100.00
ASSETS:
Non-current Assets:
Fixed assets (Net) 31,830.23 54.247 30,941.81 41.300
Capital work in progress 3,764.07 6.415 11,502.92 15.354
Investments 8,125.67 13.848 11,031.80 14.725
Current assets:
Inventories 6,068.25 10.342 7,123.77 9.509
Trade Receivables 1,866.21 3.180 3,113.79 4.156
Cash and bank balance 917.68 1.564 2,140.03 2.856
Other current assets 1.53 0.003 36.27 0.048
Loan and advances 6,103.00 10.401 9,029.06 12.052
58,676.64 100.00 74,919.45 100.00
(ii) Analysis and presentation of observations:
1. The proportion of unsecured loans to total of balance sheet has increased from
15.56% to 19.94%
2. The proportion of secured loans to total of balance sheet has fallen from 8.15% to
4.41% due to redemption of non-convertible debentures and repayment of term
loans.
3. The reserves and surplus have stayed nearly flat having marginally reduced from
53.27% at the end of year 31/03/2016 to 52.27% at end of year 31/03/2017.
4. Although the proportion of other current l iabi l i t ies in total share capital and liabilities
has decreased from 14.37% to 14.05% but provisions have s l ight ly increased from
1.46% to 2.00%

Answer to MTP_Final_Syllabus 2012_Jun2017_Set 2
Academics Department, The Institute of Cost Accountants of India (Statutory Body under an Act of Parliament) Page 6
5. The deferred tax l iabil it ies have decreased from 5.95% to 5.25%
6. The proportion of net fixed assets have fallen from 54.25% to 41.3%
7. The capital work-in-progress has increased from 6.42% to 15.35%.
8. The investments have increased by nearly 1% over the previous accounting year.
9. The current assets other than loans and advances, have increased from 15.09% to
16.57%
10. The loans and advances have increased from 10.4% to 12.05%.
3. (a) As credit manager of the bank, you have been approached by two companies for a
loan of ` 1,00,000 for six months, with no collateral offered. Since the bank has almost
exhausted its quota for loans of this type, only one of these requests can be granted. The
relevant information supplied to you by the two companies is presented below:
Particulars Company X (`) Company Y (`)
Assets
Cash
Sundry Debtors
Stock
1,70,000
2,74,000
9,00,000
3,00,000
4,24,000
13,50,000
Total Current Assets
Other Assets
13,44,000
10,00,000
20,74,000
10,20,000
23,44,000 30,94,000
Liabilities & Capital
Current Liabilities
Long-term Loans
Equity Share Capital
Retained Earnings
5,00,000
8,00,000
8,00,000
2,44,000
6,40,000
10,00,000
12,00,000
2,54,000
23,44,000 30,94,000
Considering the above data specify the company which should be granted the credit.
Explain your answer with reasons. [10]
Answer:
Liquidity ratios are relevant to assess the loan applications received by the bank:
Current Ratio = 13,44,000/5,00,000 = 2.69 : 1 (Company X)
= 20,74,000/6,40,000 = 3.24 : 1 (Company Y)
Quick Ratio or Acid Test Ratio = 4,44,000/5,00,000 = 0.89: 1 (Company X)
= 7,24,000/6,40,000 = 1.13: 1 (Company Y)
Company Y is therefore recommended for being granted the loan as its liquidity ratios are
better than those of Company X. This is relevant as the loan is for a short period of six months
without any collateral hence the acid test ratio assumes greater significance with acid test
ratio of 0.89:1 i.e. less than 1 Company X will not be able to meet its short term liabilities in the
six months period which position may further decline due to further borrowings, hence
Company Y should be selected for grant of loan.
The gross profit rate of Company Y is 40%, which is more than the gross profit rate of
Company X which is 30%. Hence the additional sales arising due to the bank finance is also
likely to yield higher profit for Company Y.
(b) Following figures have been extracted from the records of Agni Ltd.
Year 2015-16 2016-17
Sales (`) 2,60,000 3,60,000
Cost of Goods Sold (`) 2,00,000 3,30,000
Gross Profit (`) 60,000 30,000
It is learnt that cost price for the year 2016-17 has increased by 10% over the year 2015-
16. Account for changes in gross profit in the year 2016-17. [6]

Answer to MTP_Final_Syllabus 2012_Jun2017_Set 2
Academics Department, The Institute of Cost Accountants of India (Statutory Body under an Act of Parliament) Page 7
Answer:
Let the cost price per unit in 2015-16 be ` 100.
Then, the cost price per unit in 2016-17 = ` 100 + 10% of ` 100 = ` 110
Particulars 2015-16 2016-17 Changes
(i) Sales (`) 2,60,000 3,60,000 (+) 1,00,000
(ii) Cost of Goods Sold (`) 2,00,000 3,30,000 (+) 1,30,000
Gross Profit (`) (i-ii) 60,000 30,000 (-) 30,000
(iii) Cost Price Per Unit (`) 100 110 (+) 10
(iv) Units Sold (ii/iii) 2,000 3,000 (+) 1,000
(v) Selling Price per unit (`) (i/iv) 130 120 (-) 10
Statement showing changes in Gross Profit:
Particulars ` `
Changes in Profit due to Changes in sales:
1. Increase in profit due to increase in quantity (Change in
quantity x Base year’s unit selling price = (3,000 - 2,000) x `
130)
1,30,000
2. Decrease in profit due to decrease in unit selling price
(Change in unit selling price x Base years quantity = ((` 120 -
`130) × 2,000)
(20,000)
3. Decrease in profit due to change in price and quantity
(Changes in unit selling price x Change in quantity = (`120 -
`130) x (3,000 - 2,000))
(10,000)
Changes in Profit due to changes in cost:
1. Decrease in profit due to increase in quantity (Change in
quantity x Base year’s unit cost price = (3,000 - 2,000) x ` 100)
(1,00,000)
2. Decrease in profit due to increase in unit cost price
(Change in unit cost price x Base year’s quantity = ((` 110 - `
100) x 2,000)
(20,000)
3. Decrease in profit due to change in price and quantity
(Change in unit cost price x Change in quantity = (` 110 -
`100) x (3,000 - 2,000)
(10,000)
(1,30,000)
Net increase (decrease) in Gross Profit (30,000)
Note: Here, the base year is 2015-16.
4. (a) What kind of conditions of a company are represented by the following pattern of cash
flows? You are requested to provide your analysis of each case separately:
I. Net cash flows from Operating Activities are positive, net cash flows used in
Investing Activities are negative and net cash flows from Financing Activities are
positive.
II. Net cash flows from Operating Activities are negative, net cash flows used in
Investing Activities are positive and net cash flows from Financing Activities are
negative.
III. Net cash flows from Operating Activities are negative, net cash flows used in
Investing Activities are negative and net cash flows from Financing Activities are
positive.
IV. Net cash flows from Operating Activities are positive, net cash flows used in
Investing Activities are negative and net cash flows from Financing Activities are
negative.
V. Net cash flows from Operating Activities are negative, net cash flows used in
Investing Activities are positive and net cash flows from Financing Activities are
positive. [2×5=10]

Answer to MTP_Final_Syllabus 2012_Jun2017_Set 2
Academics Department, The Institute of Cost Accountants of India (Statutory Body under an Act of Parliament) Page 8
Answer:
I. A firm with positive net cash flows from Operating Activities, negative net cash flows
used in Investing Activities and positive net cash flows from Financing Activities is a
growing firm as it is raising funds through various financing activities and also using
funds generated through operating activities and using them for investment so that it
can grow at a higher rate.
II. A firm with negative net cash flows from Operation Activities, positive net cash flows
used in Investing Activities and negative net cash flows from Financing Activities is in
bad financial position as it is not able to generate funds through operating activities;
instead selling its investments to generate funds to meet their financial obligations
(that is why it has negative cash flows from financing activities).
III. A firm with negative net cash flows from Operating Activities, negative net cash flows
used in Investing Activities and positive net cash flows from Financing Activities is a
start-up firm or in its initial stages. It is using funds raised through financing activities
and is using these for operations and investment purposes.
IV. A firm with positive net cash flows from Operating Activities, negative net cash flows
used in Investing Activities and negative net cash flows from Financing Activities is a
cash-cow firm as it is generating huge amount of funds through operation and not
only using them to meet its investment requirement, but also using them to pay-off its
financial liabilities as cash flows from financing activities are negative.
V. A firm with negative net cash flows from Operating Activities, positive net cash flows
used in Investing Activities and positive net cash flows from Financing Activities is a
firm which is not going to sustain in future. Its operations are in losses and to meet
them the firm is selling its investments and also, raising funds from financing activities.
(b) The following figures relate to two companies:
(` lakhs)
Particulars T Ltd. V Ltd.
Sales 500 1,000
Variable costs 200 275
Contribution 300 725
Fixed cost 150 425
Profit before Interest & Taxes (PBIT) 150 300
Interest 50 100
Profit before tax (PBT) 100 200
You are required to calculate - (A) operating, financial and combined leverages of the
two companies, and (B) comment on the relative position of the companies in respect of
the risk. [3+3=6]
Answer:
(` lakhs)
Particulars T Ltd. V Ltd.
Operating Leverage Contribution
EBIT 300
2150
7252.42
300
Financial Leverage EBIT
EBT 150
1.5100
3001.5
200
Combined Leverage Contribution
EBT 300
3100
725
3.63200
Comment:

Answer to MTP_Final_Syllabus 2012_Jun2017_Set 2
Academics Department, The Institute of Cost Accountants of India (Statutory Body under an Act of Parliament) Page 9
1. The operating leverage is higher for V Ltd. and therefore it is subject to greater degree of
business risk than T Ltd. The EBIT will tend to vary more with sales in V Ltd.
2. The financial leverage of both the companies stand at 1.5 times. It conveys that interest
burden is proportionately same, and also financial risk is similar for both the companies.
3. The combined leverage of V Ltd. is higher and its overall risk is more as compared to T Ltd.
5. Super Garments Ltd. is a company which produces and sells to retailers certain range of
fashion clothing. They have made the following estimates of prudential cash flows for the
next 10 years.
` in lakhs
Yr. 1 2 3 4 5 6 7 8 9 10
Cash
flow
3,750 4,250 5,000 6,250 7,500 8,500 9,500 11,250 12,500 15,000
SONA Ltd. is a company which owns a series of boutiques in a certain locality. The
boutiques buy clothes from various suppliers and retail them. Each boutique has a
manager and an assistant but all purchasing and policy decisions are taken centrally. An
independent cash flow estimate of SONA Ltd. was as follows:
` in lakhs
Yr. 1 2 3 4 5 6 7 8 9 10
Cash
flow
300 400 500 700 850 1,150 1,300 1,500 1,650 2,000
SUPER Garments Ltd. is interested in acquiring SONA Ltd. in order to get some additional
retail outlets. They make the following cost-benefit calculation;
i) Net Value of assets of SONA Ltd.
` in lakhs
Sundry fixed assets 2,000
Investments 500
Stock 1,000
Total 3,500
Less: Sundry creditors 1,000
Net Assets 2,500
ii) Sundry fixed assets amounting to `1,25,00,000 cannot be used and their net realizable
value is `1,12,50,000
iii) Stock can be realized immediately at `1,175 lakh
iv) Investments can be disposed off for `530 lakhs
v) Some workers of SONA Ltd. are to be retrenched for which estimated compensation is
`325 lakh.
vi) Sundry creditors are to be discharged immediately
vii) Liabilities on account of retirement benefits not accounted for in the balance sheet by
SONA Ld. Is `120 lakhs.
viii) Expected cash flows of the combined business will be as follows:
` in lakhs
Yr. 1 2 3 4 5 6 7 8 9 10
Cash
flow
4,500 4,750 5,750 7,375 8,750 10,000 11,250 13,250 14,500 17,250
Find out the maximum value of SONA Ltd. which SUPER Garments Ltd. can quote. Also
show the difference in valuation had there been no merger. Use 20% as discount factor.
Year 1 2 3 4 5 6 7 8 9 10 Discounting 0.8333 0.6944 0.5787 0.4823 0.4019 0.3349 0.2791 0.2326 0.1938 0.1615

Answer to MTP_Final_Syllabus 2012_Jun2017_Set 2
Academics Department, The Institute of Cost Accountants of India (Statutory Body under an Act of Parliament) Page 10
factor @20%
[16]
Answer:
(i) Calculation of operational synergy expected to arise out of merger
Year 1 2 3 4 5 6 7 8 9 10
Projected
cash flow of
Super
Garment
Ltd. After
merger with
Sona Ltd.
4500 4750 5750 7375 8750 10000 11250 13250 14500 17250
Less:
Projected
cash flows
of Super
Garment
Ltd. Without
merger
3750 4250 5000 6250 7500 8500 9500 11250 12500 15000
Projected
Cash flows
of Sona Ltd
individually
post merger
750 500 750 1125 1250 1500 1750 2000 2000 2250
(ii) Valuation of Sona Ltd. Ignoring merger
Year Cash flows (` in lakhs) Discount factor Discount cash flow (` in lakhs)
1 300 0.8333 249.990
2 400 0.6944 277.760
3 500 0.5787 289.350
4 700 .4823 337.610
5 850 .4019 341.615
6 1150 .3349 385.135
7 1300 .2791 362.830
8 1500 .2326 348.900
9 1650 .1938 319.770
10 2000 .1615 323.000
3235.960
(iii) Valuation of Sona Ltd. Individually in case of merger.
Year Cash flows (` in lakhs) Discount Factor Discounted Cash Flow (` in lakhs)
1 750 0.8333 624.975
2 500 .6944 347.200
3 750 .5787 434.025
4 1125 .4823 542.588
5 1250 .4019 502.375
6 1500 .3349 502.350
7 1750 .2791 488.425
8 2000 .2326 465.200
9 2000 .1938 387.600
10 2250 .1615 363.375
4658.113
(iv) Maximum value to be quoted

Answer to MTP_Final_Syllabus 2012_Jun2017_Set 2
Academics Department, The Institute of Cost Accountants of India (Statutory Body under an Act of Parliament) Page 11
` in lakhs ` in lakhs
Value as per discounted cash flows from operation 4,658.113
Add: Cash to be collected immediately by disposal of assets:
Sundry Fixed Assets 112.500
Investments 530.000
Stock 1175.000 1817.500
6,475.613
Less: Sundry Creditors 1000.000
Provision for retirement benefits 120.000
Retrenchment Compensation 325.000 1445.000
5,030.613
So, Super Garments Ltd. Can quote as high as `50,30,61,300 for taking over the business
of Sona Ltd. In this case value arrived at in isolation `32,35,96,000 is not providing
reasonable value estimate.
6. (a) Soft Solution is a small software firm with high growth rate. It has existing assets in which it
has capital invested of `100 lakh. The other information about Soft solution is as follows:
The after tax operating Income on assets in place is `15 lakh. This return on capital of 15%
is expected to be sustained in the future. Cost of capital of Soft Solution is 10%.
At the beginning of each of the next five years Soft Solution is expected to make new
investments of `10 lakh each. These investments are also expected to earn 15% as a
return on capital, and the cost of capital is expected to remain 10%.
After the year 5, Soft Solution will continue to make Investments, and earnings will grow
5% a year, but the new investments will have a return on capital of only 10%, which is also
the cost of capital.
All assets and investments are expected to have infinite lives. The assets in place and the
investments made in the first five years will make 15% a year in perpetuity, with no
growth.
Based on the information given estimate the value of Soft Solution, How much of this value
comes from the EVA and how much from capital invested? [8]
Answer:
(` in lakhs)
Capital invested in assets in place 100
+ EVA from assets in place [(0.15 – 0.10)/ 0.10] x 100 50
+ PV of EVA from new investments in year 1 (0.15 – 0.10) x 100 5
+ PV of EVA from new investments in year 2 through 5
0.15 - 0.10 × 100
2 3 41.1 + 1.1 + 1.1 + 1.1
15.85
Value of Soft Solution 170.85
The value of existing assets is therefore `150 lakhs and the value of future opportunities is
`20.85 lakhs.
(b) Reliable Industries Ltd. (RIL) is considering a takeover of Sunflower Industries Ltd. (SIL). The
particulars of two companies are given below
RIL SIL
Earnings After Tax (`) 20,00,000 10,00,000
Equity shares (No.) 10,00,000 10,00,000
EPS (`) 2 1

Answer to MTP_Final_Syllabus 2012_Jun2017_Set 2
Academics Department, The Institute of Cost Accountants of India (Statutory Body under an Act of Parliament) Page 12
P/E Ratio (Times) 10 5
Required:
(i) What is the market value of each company before merger?
(ii) Assuming that the management of RIL estimates that the shareholders of SIL will
accept an offer of one share of RIL for four shares of SIL. If there are no synergic
effects, what is the market value of the post-merger RIL? What is the new price for
share? Are the shareholders of RIL better or worse off than they were before the
merger?
(iii) Due to synergic effects, the management of RIL estimates that the earnings will
increase by 20%. What is the new post-merger EPS and price per share? Will the
shareholders be better off or worse off than before the merger? [8]
Answer:
(i) Market value of companies before merger
Particulars RIL SIL
EPS (`) 2 1 P/E ratio 10 5 Market price per share (`) (EPS × P/E ratio) 20 5 Equity shares (No.) 10,00,000 10,00,000
Total market value (MPS × No. of Eq. Shared) 2,00,00,000 50,00,000
(ii) Post merger effect on RIL
Particulars `
Post merger earnings ` (20,00,000 + 10,00,000) 30,00,000
Equity shares 1
10,00,000 10,00,0004
As exchange ratio is 1 : 4
12,50,000
EPS : (30,00,000/ 12,50,000) 2.4 P/E ratio 10.00 Market price per share (`) (EPS × P/E
ratio) i.e., 10 × 2.4 24
Total Market Value (MPS × No. of EqShares) i.e., (12,50,000 × 24) 3,00,00,000
Gains from Merger
Post Merger Market value of the firm = ` 3,00,00,000 Less : Pre-Merger market value
RIL 2,00,00,000
SIl 50,00,000
= ` 2,50,00,000 = `50,00,000
Apportionment of Gains between shareholders
Particulars RIL SIL
Post merger market value
10,00,000 × 24 2,40,00,000
2,50,000 × 24 60,00,000
Less : Pre merged market value 2,00,00,000 50,00,000
Gain 40,00,000 10,00,000
Thus the shareholders of both the Co. have gained from merger
(iii) Post Merger Earnings
Increase in earning by 20%

Answer to MTP_Final_Syllabus 2012_Jun2017_Set 2
Academics Department, The Institute of Cost Accountants of India (Statutory Body under an Act of Parliament) Page 13
New earnings: ` 30,00,000 × 120% = 36,00,000
No. of equity share = 12,50,000
EPS = ` 36,00,000 ÷ 12,50,000 = ` 2.88
P/E ratio = 10
Market price per share = ` 2.88 × 10 = ` 28.80
Total market value (12,50,000 x 28.80) = `3,60,00,000
Gains from Merger
Post Merger Market Value of the firm `3,60,00,000
Less: Pre-Merger market value
RIL = `2,00,00,000
SIL = `50,00,000
`2,50,00,000
` 1,10,00,000
Apportionment of Gains between Shareholders
Particulars RIL SIL
Post merger market value
RIL = (10,00,000 x 28.80)
SIL = (2,50,000 x 28.80)
2,88,00,000
72,00,000
Less: Pre merged market value 2,00,00,000 50,00,000
Gain 88,00,000 22,00,000
∴ Hence, shareholders will be better off than before the merger situation.
7. (a) Following are the information of two companies for the year ended 31st March, 2016:
Particulars Company X Company Y
Equity Shares of `10 each 20,00,000 25,00,000
10% Pref. Share of `10 each 15,00,000 10,00,000
Profit after tax 7,50,000 7,50,000
Assume the Market expectation is 18% and 80% of the Profits are distributed.
(i) What is the rate you would pay to the Equity Shares of each company?
a) If you are buying a small lot.
b) If you are buying controlling interest shares
(ii) If you plan to invest only in preference shares which company’s preference shares
would you prefer?
(iii) Would your rates be different for buying small lot, if the company ‘X’ retains 30% and
company ‘Y’ 10% of the profits? [8]
Answer:
(i) Buying a small lot of equity share: If the purpose of valuation is to provide data base to
aid a decision of buying a small (non-controlling) position of the equity of the companies,
dividend capitalisation method is most appropriate. Under this method, value of equity
share is given by:

Answer to MTP_Final_Syllabus 2012_Jun2017_Set 2
Academics Department, The Institute of Cost Accountants of India (Statutory Body under an Act of Parliament) Page 14
Dividend per share × 100
Market capitalisation rate
2.4Campany X : × 100 = 13.33
18
2.08Company Y : × 100 = 11.56
18
` `
` `
(ii) Buying controlling Interest equity shares: If the purpose of valuation is to provide data
base to aid a decision of buying controlling interest in the company, EPS capitalisation
method is most appropriate, Under this method, Value of equity is given by:
Earning per share (EPS) × 100
Market capitalisation
3Campany X : × 100 = 16.67
18
2.6Company Y : × 100 = 14.44
18
` `
` `
(iii) Preference Dividend coverage ratios of both companies are to be compared to make
such decision.
Preference dividend coverage ratio is given by:
Profit aftertax × 100
preference dividend
7,50,000Campany X : = 5 times
1,50,000
7,50,000Company Y : = 7.5 times
1,00,000
`
`
If we are planning to invest only in preference shares, we would prefer shares of Y
Company as there is more coverage for preference dividend.
(iv) Yes, the rates will be different for buying a small lot of equity shares, if the company ‘X’
retains 30% and company ‘Y’ 10% of profits.
The new rates will be calculated as follows:
Company X: ` (2.1/ 18) x 100 = `11.67
Company Y: ` (2.34/ 18) x 100 = `13.00
Working Notes:
1. Computation of earnings per share and dividend per share (companies distribute 80% of
profits)
Company X Company Y
Profit after tax 7,50,000 7,50,000
Less: Preference dividend 1,50,000 1,00,000
Earnings available to equity shareholders (A) 6,00,000 6,50,000
Number of Equity Shares (B) 2,00,000 2,50,000
Earnings per share (A/B) 3.0 2.60
Retained earnings 20% 1,20,000 1,30,000

Answer to MTP_Final_Syllabus 2012_Jun2017_Set 2
Academics Department, The Institute of Cost Accountants of India (Statutory Body under an Act of Parliament) Page 15
Dividend declared 80% (C) 4,80,000 5,20,000
Dividend per share (C /B) 2.40 2.08
2. Computation of dividend per share (Company X retains 30% and Company Y 10% of
profits)
Earnings available for equity shareholders 6,00,000 6,50,000
Number of equity shares 2,00,000 2,50,000
Retained Earnings 1,80,000 65,000
Dividend Distribution 4,20,000 5,85,000
Dividend per share 2.10 2.34
(b) ABC Ltd Company currently sells for `32.50 per share. In an attempt to determine if ABC
Ltd is fairly priced, an analyst has assembled the following information.
• The before-tax required rates of return on ABC Ltd debt, preferred stock, and
common stock are 7.0 percent, 6.8 percent, and 11.0 percent, respectively.
• The company’s target capital structure is 30 percent debt, 20 percent preferred
stock, and 50 percent common stock.
• The market value of the company’s debt is 1̀45 million and its preferred stock is
valued at `65 million.
• ABC Ltd’s FCFF for the year just ended is ` 28 million. FCFF is expected to grow at a
constant rate of 4 percent for the foreseeable future.
• The tax rate is 35 percent.
• ABC Ltd has 8 million outstanding common shares.
What is ABC Ltd’s estimated value per share? Is ABC Ltd’s stock under priced? [8]
Answer:
The weighted-average cost of capital for XYZ Ltd Company is:
WACC = 0.30(7.0%) (1 - 0.35) + 0.20(6.8%) + 0.50(11.0%) = 8.225%
The firm value is:
Firm value = FCFF0 (1 + g) / (WACC - g)
Firm value = 28(1.04) / (0.08225 - 0.04) = 29.12/0.04225 = `689.23 million
The value of equity is the firm value minus the value of debt minus the value of preferred
stock: Equity
= 689.23 - 145 - 65 = `479.23 million.
Dividing this by the number of shares gives the estimated value per share of `479.23
million/8 million shares = `59.90.
The estimated value for the stock is greater than the market price of `32.50, so the stock
appears to be undervalued.
8. Write a short note on any four of the following:
[4×4=16]
(a) Financial Modeling
(b) Distress Prediction
(c) Different Methods Of Valuing Self-Generated Brands
(d) Efficient Market Hypothesis
(e) Who are the participants in the Merger and Acquisition Process?

Answer to MTP_Final_Syllabus 2012_Jun2017_Set 2
Academics Department, The Institute of Cost Accountants of India (Statutory Body under an Act of Parliament) Page 16
Answer:
(a) Financial Modeling:
Financial modeling is the task of building an abstract representation of a real world
financial situation. This is a mathematical model designed to represent the
performance of a financial asset or portfolio of a business, project or any other
investment. This is the process by which a firm constructs a financial representation of
some, or all, aspects of the firm or given security. The model is usually characterized by
performing calculations, and makes recommendations based on that information. The
model may also summarise particular events for the end user and provide direction
regarding possible actions or alternative.
Financial modeling is the task of building a financial model, or the process of using a
financial model for financial decision making and analysis. It is an abstract
representation of a financial decision making situation. Financial models are not limited
to profit making entities. Nonprofits, governments, personal finances, all can be
represented by financial models.
Uses of Financial Modeling:
Financial modeling is used to do historical analysis of a company's performance, and to
do projections of its financial performance into the future. Project finance is another
area that lends itself to financial models. A project (such as a real estate investment or
a new factory) can be analyzed using a financial model. It does not have to be
complete business.
Financial Modeling is not just for the Accountant or Financial Consultant, who are called
upon to develop financial projections, but also for business owners and managers with
improved user interfaces and heavy use of graphics, it is now feasible for non-technical
people to use a financial model to test option and make decisions based on the projected
impact on profits and cash flow.
(b) Distress Prediction:
Distress Prediction is an essential issue in the field of finance. It is a very important tool
used for the purpose of prediction of future probable financial condition of a
corporate entity so that any financial crisis-that may crop up in the near future can
be predicted in advance. Using various models of Distress Prediction, the
management of a company comes to know about its future probable financial
condition beforehand and accordingly, it may adopt appropriate remedial measures
to avoid the financial crisis as predicted through the various models of Distress
Prediction. Distress Prediction is considered a very significant tool for sustainment of a
company in the long-run. As a company can have a predicted notion about
occurrence of its financial hardship in future, it gets a scope to avoid such a situation
by taking proper preventive measures in advance. Therefore, Distress Prediction plays
a very significant role in the survival of a company in the long-run.
Following are the two types of models generally used for prediction of Corporate
Distress/Sickness:
i. Univariate Model: In th is model, a single variable is used for Corporate Distress
Prediction.
ii. Multivariate Model: In this model, a number of variables are used for Corporate
Distress Prediction.

Answer to MTP_Final_Syllabus 2012_Jun2017_Set 2
Academics Department, The Institute of Cost Accountants of India (Statutory Body under an Act of Parliament) Page 17
(c) Different Methods Of Valuing Self-Generated Brands:
Important methods in valuation of self generated brands are discussed below:
Historical cost method: Here Brand value is the sum total of Brand Development
cost + Brand Marketing and Distribution Cost + Brand Promotion cost including
advertising and other cost.
Replacement Price Model: It is the opportunity cost of investment made for
replacement of brand, Brand Value = Replacement Brand Cost.
Market Price Model: Here Brand value is net realizable value on sale in the market.
Current Cost Model: According to this approach the current corporate brands are
valued at the current value to the group which is reviewed annually and not
subject to amortization.
Potential Earning Model: The potential Earning model is based on the estimated
potential earning that would be generated by a brand and their capitalization by
using appropriate discount rate. The volume of revenues raised by a brand in the
market determines its value.
Total market value of brand = Net brand revenue / capitalization rate
Net - Brand revenue = (Brand units x Unit brand price) - (Brand units x Unit brand cost)
-(Marketing cost + R & D cost + tax costs)
(d) Efficient Market Hypothesis
The purpose of any stock market of the world is to bring together those people who
have funds to invest with those who need funds to undertake investments. Entities
which seek to raise equity are asking investor for a permanent investment. Investors
may not be incorrect to invest unless they are convinced that they would be able to
realize their investments at a fair price at any time in the future.
For these to happen stock market must price shares efficiently. Efficient pricing
means incorporating into the share price, determined and or decided for trading,
impacts of all factors that could possibly effect. In an efficient market, investors can
buy and sell share at a fair price and entities can raise funds at a cost that reflects the
risk of the investment they are seeking to undertake.
A considerable body of financial theory has been building a hypothesis that in an
efficient market, prices fully and instantaneously reflect all available information. The
efficient market hypothesis is, therefore, concerned with information and pricing
efficiency.
Three levels or forms of efficiency have been defined. These are depended on the
amount of information available to the participants in the market.
(e) Participants in the Merger and Acquisition Process
There are many professionals who play an essential role in the successful completion
of a deal.
Investment Bankers: Investment bankers are always at the forefront of the
acquisition process. They offer strategic and tactical advice, screen potential
buyers and sellers, make initial contact with a seller and buyer and provide
negotiation support, valuation and deal structuring.
Lawyers: The legal framework surrounding a typical transaction has become so
complicated that no one individual can have sufficient expertise to address all
the issues. So, legal teams consist of more than a dozen lawyers each of whom
represents a specialised aspect of the law.
Answer to MTP_Final_Syllabus 2012_Jun2017_Set 2
Academics Department, The Institute of Cost Accountants of India (Statutory Body under an Act of Parliament) Page 18
Accountants: Accountants perform the role of auditors by reviewing the target’s
financial statements and operations through a series of interviews with senior and
middle level managers.
Valuation Experts: They build models that incorporate various assumptions such as
costs or revenues growth rate.
Institutional Investors: Institutional investors can announce how they intend to vote
on a matter and advertise their position in order to seek support and have more
influence.
Arbitrageurs: Arbitrageurs provide market liquidity during transactions. With the
number of merger arbitrageurs increasing, they are becoming more proactive in
trying to anticipate takeover situations. Their objective is to identify the target
before the potential acquirer is required by law to announce its intentions