Embed Size (px)
Citation preview

PAPAN LANDFILL LEACHATE TREATMENT USING A
SEQUENCING BATCH REACTOR AND COAGULATION
YONG ZI JUN
A project report submitted in partial fulfilment of the requirements for the
award of Bachelor of Engineering (Hons) Environmental Engineering
Faculty of Engineering and Green Technology
Universiti Tunku Abdul Rahman
May 2017

ii
DECLARATION
I hereby declare that this project report is based on my original work except for
citations and quotations which have been duly acknowledged. I also declare that it has
not been previously and concurrently submitted for any other degree or award at
UTAR or other institutions.
Signature : ________________________
Name : Yong Zi Jun______________
ID No. : 13AGB05484____________
Date : _______________________

iii
APPROVAL FOR SUBMISSION
I certify that this project ENTITLED “PAPAN LANDFILL LEACHATE
TREATMENT USING A SEQUENCING BATCH REACTOR AND
COAGULATION” was prepared by YONG ZI JUN has met the required standard
for submission in partial fulfilment of the requirements for the award of Bachelor of
engineering (Hons) Environmental Engineering at Universiti Tunku Abdul Rahman.
Approved by,
Signature :______________________
Supervisor : Dr. Mohammed JK Bashir
Date : ______________________

iv
The copyright of this report belongs to the author under the terms of copyright
Act 1987 as qualified by Intellectual Property Policy of Universiti Tunku Abdul
Rahman. Due acknowledgement shall always be made of the use of any material
contained in, or derived from, this report.
© 2017, Yong Zi Jun. All right reserved.

v
ACKNOWLEDGEMENTS
First and foremost, though only my name appears on the cover of this project
report, to make this dissertation to be possible, a number of people have contributed
to its production. I would like to express my deepest gratitude to my research
supervisor, Dr. Mohammed J.K. Bashir, my research advisors, Dr. Ng Choon Aun and
Mr. Wong Ling Yong. I have been very fortunate to have them to guide me and who
gave me the freedom to explore on my own, their patients, advice and guidance
throughout the development of this research project as my final year report. I would
like to thank my moderator, Dr. Leong Kah Hon for his patients and effort in
evaluating my research project.
I would like to thank my parents and my family members for supporting my
effort to this stage of my completion of this project report. Without their sincere
support and encouragement, I will be not able to even start my research programme in
UTAR.
Besides, I appreciate the help and assistance given by UTAR lab officers and
would like to thank Ms Ng Suk Ting, Mr. Voon Kah Loon, Cik Noor Hazreena Binti
Noor Izahar, Ms Mirohsha a/p Mohan and Mr. Chin Kah Seng.
Furthermore, I am thankful to SELEKTA SPEKTRA SDN BHD and Mr.
Zulfadli Alias for allowing me to conduct on-site sample collection and field test at
the Papan Landfill in Papan district Ipoh, Perak. I would like to thank Tian Siang Oil
Mill (Air Kuning) Sdn. Bhd. and Mr Dollah for allowing me to conduct on-site sludge
sample collection.

vi
Apart from that, I would like to use this opportunity to thank Tan Kin Hong,
Kee Ming Wei and Tai Jun Yan who assisted and encourage me in this research.
Lastly, I would like to thank and appreciate everyone whom helped me directly
or indirectly in completion of this project.

vii
PAPAN LANDFILL LEACHATE TREATMENT USING A
SEQUENCING BATCH REACTOR AND COAGULATION
ABSTRACT
Landfill leachate generation has been increasing dramatically over the past few
decades due to the increase of solid waste or municipal solid waste (MSW) as global
development continues and people having higher standard of living lead to more
material consumption and production of waste. There were many cases in which the
treatment of leachate and domestic wastewater involve a two-stage treatment process.
Both the sequencing batch reactor (SBR) and coagulation are well-known biological
and physiochemical methods which has high efficiency in treating domestic
wastewater and landfill leachate for the past few decades. The Papan Landfill in Perak
currently has no proper leachate treatment system, therefore SBR will be investigated
to treat the Papan landfill leachate. The needs of post treatment after the primary
treatment by SBR is a new trend of two-stage treatment technique employed which
can greatly improve the treatment effectiveness. The optimum aeration rate, L/min of
the SBR, optimal pH and dosage (g/L) of Aluminium Sulphate (ALUM) for
coagulation as post-treatment of Papan landfill leachate had been investigated to
compare the treatment efficiency of the treated effluent by SBR and after post
treatment by ALUM. Firstly, the two-step sequential treatment by SBR followed by
coagulation using ALUM had achieved a removal efficiency of 71.03 %, 87.24 %,
91.82 % and 85.59 % for COD, NH3-N, TSS and colour respectively. Moreover, the
two-stage treatment process achieved removal efficiency of heavy metals for
Cadmium at 95.00 %, Lead at 95.09 %, Copper at 95.39 %, Selenium at 100.00 %
removal and Barium at 87.27 %. Hence, the two-step sequential treatment in this
research is an effective treatment method for Papan landfill leachate.

viii
TABLE OF CONTENTS
DECLARATION ii
APPROVAL FOR SUBMISSION iii
ACKNOWLEDGEMENT v
ABSTRACT vii
TABLE OF CONTENT viii
LIST OF TABLE xii
LIST OF FIGURES xiii
LIST OF APPENDICES xvi
LIST OF SYMBOLS / ABBREVIATIONS xvii
CHAPTER
1. Introduction 1
1.1 Background of Study 1
1.2 Problem Statement 3
1.3 Objectives 5
1.4 Project Outline 5
2. Literature Review 7
2.1 Solid Waste 7
2.1.1 Quantity of Solid Waste 8
2.1.2 Composition of Solid Waste 9
2.1.3 Solid Waste Management 13
2.2 Landfill in Malaysia 14
2.3 Landfill Leachate 18
2.4 Factor Affecting Leachate Quality 19

ix
2.5 Impacts of Landfill Leachate and Discharge Limit 21
2.5.1 Environmental Impacts 21
2.5.2 Human Health Impacts 21
2.5.3 Standard Discharge Limit for Landfill Leachate 23
2.6 Leachate Treatment 24
2.6.1 Leachate Transfer 25
2.6.1.1 Combined Treatment with
Domestic Sewage
26
2.6.1.2 Recycling of Leachate 26
2.6.2 Physical / Chemical Treatment 26
2.6.2.1 Coagulation-flocculation 27
2.6.2.2 Chemical Precipitation 30
2.6.2.3 Adsorption 30
2.6.2.4 Chemical Oxidation 32
2.6.2.5 Air Stripping 33
2.6.3 Biological Treatment 32
2.6.3.1 Activated Sludge Process (AS) 35
2.6.3.2 Sequencing Batch Reactor (SBR) 36
2.6.3.3 Sequencing Batch Reactor added
with Adsorbent
38
2.6.3.4 Rotating Biological Contractor (RBC) 38
2.6.3.5 Leachate Phytoremediation 39
3. Research Methodology 39
3.1 Leachate Collection and Site Location 41
3.2 Palm Oil Mill Effluent (POME) Sludge Collection
and Site Location
44
3.3 Leachate Characteristics and Palm Oil Mill Effluent
(POME) Sludge Analytical Methods
46
3.3.1 pH 47
3.3.2 Chemical Oxygen Demand, COD 49
3.3.3 Biological Oxygen Demand, BOD 49
3.3.4 Ammoniacal Nitrogen, NH3-N 51

x
3.3.5 Colour 51
3.3.6 Turbidity 51
3.3.7 Suspended Solid
3.3.8 Heavy Metals
52
52
3.3.9 Mixed Liquor Suspended Solids and
Mixed Liquor Volatile Suspended Solids
53
3.3.10 Temperature 56
3.3.11 On-Site Parameter Analysis 57
3.4 Experimental Set-Up 58
3.5 Experimental Run 60
3.5.1 Food-To-Microorganism Ration (F/M) 61
3.5.2 Sludge Retention Time (SRT) 62
3.5.3 Hydraulic Retention Time (HRT) 62
3.6 Post Treatment – Coagulation of Leachate 62
4. Results and Discussion 64
4.1 Leachate Characteristics 64
4.2 Field and Laboratory Characterization of Leachate 65
4.3 Palm Oil Mill Effluent (POME) Sludge Characteristics 68
4.4 Microorganisms growth-curve based on MLSS
and MLVSS
69
4.5 Sequencing Batch Reactor, SBRs Treatment Efficiency 78
4.5.1 Ammonical Nitrogen (NH3-N) Removal
Efficiency
79
4.5.2 Chemical Oxygen Demand (COD) Removal
Efficiency
82
4.5.3 Total Suspended Solids (TSS) Removal
Efficiency
83
4.5.4 Colour Removal Efficiency 83
4.6 Optimal Aeration Rate of SBR 84
4.7 Post Treatment of Leachate by Coagulation Process
(ALUM)
85
4.7.1 pH Optimization 86

xi
4.7.2 Dosage Optimization 88
4.8 Overall Treatment Efficiency of Leachate by SBR
and Post Treatment by Coagulation Process
91
4.9 Heavy Metals Removal 92
4.10 Operational Cost Estimation 94
4.10.1 SBR Operational Cost 94
4.10.2 Coagulation Operational Cost 97
4.10.3 Total Operational Cost Estimation 97
5. Conclusion and Recommendations 98
5.1 Conclusion 98
5.2 Recommendations for Future Research
99
REFERENCES 100
APPENDICES 108

xii
LIST OF TABLES
TABLE TITLE PAGE
2.1 Source and Types of Municipal Solid Waste
9
2.2 Average Composition (%) Of MSW in KL Malaysia
11
2.3 Types and Number of Disposal Site in Malaysia
15
2.4 Sanitary Landfills in Malaysia Respective to Status
and Location
17
2.5 Landfill Leachate Classification
20
2.6 Health Effects of Leachate on Humans
22
2.7 Acceptable Conditions for Discharge of Leachate,
Second Schedule (Regulation 13)
23
2.8 List of Typical Advance Oxidation Systems (AOP)
31
4.1 Raw Leachate Samples Characterization
64
4.2 On-Site and Off-Site Leachate Sample
Characteristics Test Comparison
66
4.3 Nitrification Process Related to Temperature
67
4.4 Palm Oil Mill Sludge Sample Characterization
68
4.5 The daily operational conditions in SBRs
77
4.6 Effects of Dosage On Particles in Wastewater
Respective to The Different Zones
89
4.7 TNB’s Supply Voltage Respective to Voltage Level
Category
93
4.8 The Electrical Pricing and Tariff Rates for
Commercial Users
93

xiii
LIST OF FIGURES
FIGURE TITLE PAGE
2.1 Daily Waste Generation in States of Malaysia from
1996 to 2008
9
2.2 Average Composition of MSW Generated in Malaysia
12
2.3 Typical Solid Waste Management in Asian Countries
14
2.4 Quantity (Fraction) of mono-nucleus aluminum
species (monomers) as a function of pH
28
2.5 A flow diagram describing the process and interaction
of initially negatively charged impurities or particles
(right-hand side) and the type of hydrolyzed
aluminium species including the Al(OH)3
29
2.6 The Five Stages of Operations in a Sequencing Batch
Reactor
(SBR)
36
2.7 The Main Features of a Sub-Surface Constructed
Wetland (SSCW)
38
3.1 Methodology Flowchart
40
3.2 Papan Sanitary Landfill Location from University
Tunku Abdul Rahman, UTAR Perak Kampar
41
3.3 Leachate Sample Collection Using A 6.0 L
Polypropylene (PET) Bottle
43
3.4 Leachate Sample On-Site Parameter Analysis Using
EUTECH CyberScan PCD 650 Multi-Parameter,
Singapore
43
3.5 Tian Siang Oil Mill (Air Kuning) Sdn Bhd Site
Location from Universiti Tunku Abdul Rahman,
UTAR Perak Kampus
44

xiv
3.6 Sedimentation Tank No.4 at Tian Siang (Air Kuning)
Sdn Bhd
45
3.7 Collection of POME Sludge with A 5.5 L
Polypropylrene (PET) Bottle
46
3.8 pH Meter (Hanna HI 2550, Romania)
47
3.9 COD Heat Reactor (DRB 200, Germany)
48
3.10 Spectrophotometer (DR 6000, USA)
49
3.11 DO 6+ Dissolved Oxygen Meter (EUTECH,
Singapore)
50
3.12 BOD Incubator (FOC 225E, VELP SCIENTIFICA,
ITALY)
50
3.13 Turbidity Meter (Hanna HI 98703, Romania)
52
3.14 Inductive Coupled Plasma Mass Spectrometry (ICP-
MS PERKIN ELMER NEXIONTM 300Q, USA)
53
3.15 21mm, 1.22µm pore size 261 Glass Micro-fibre Filter
(Filtres Fioroni, France)
55
3.16 Entris 124-1S Analytical Balance (Sartorius,
Germany)
55
3.17 Electric Muffle Furnace (LEF-P Type, LabTech,
India)
56
3.18 Heating and Drying Universal Oven (Memmert,
Germany)
56
3.19 AR300+ Infrared Thermometer (SMART SENSOR,
Intell InstrumentsTM Plus, Houston, Texas)
57
3.20 CyberScan PCD 650 Multi-Parameter (EUTECH
Instruments, SINGAPORE)
58
3.21 Sequencing Batch Reactor (SBR) Experimental Setup
59
3.22 A Complete Cycle of SBR 60
3.23 KS 4000 I control Orbital Shaker (IKA@ Werke
Staufen, Germany)
63
4.1 Concentration of MLSS (mg/L) inside SBR
70

xv
4.2 Concentration of MVLSS (mg/L) inside SBR
71
4.3 The Suspended POME Sludge and Other Solids
Adhere On the Wall and The Cap of the Reactor.
72
4.4 A Typical Growth Curve for A Bacterial Population in
A Batch Reactor
72
4.5 Oxidation of Organic Matters Ion Wastewater Under
Aerobic Condition by Activated Sludge System
74
4.6 Treatment Efficiency of the Four Parameters (COD,
NH3-N, TSS and Colour)
78
4.7 Nitrite Ions Are Waste Product from Nitrosomonas
Upon Oxidation of Ammonium Ions. The NO2- Waste
Is the Food for Nitrobacter to Oxidize into Nitrite Ions
in Which NO3- Will Be Later Used by Denitrifying
Bacteria
80
4.8 The Effects of Different pH onto COD, NH3-N, TSS
and Colour Removal Efficiency
86
4.9 The Effects of Different ALUM Dosage at pH 7.0
Onto COD, NH3-N, TSS and Colour Removal
Efficiency
88
4.10 Showing Charge Neutralization (Left-Hand Side) and
Charge Reversal (Right-Hand Side) if Overdose of
Coagulant of the Deposition of Metal Hydroxide
Species, Al(OH)3(Am) at Around Neutral pH
89
4.11 The Overall Treatment Efficiency, % by SBR and
Coagulation Vs Parameters (COD, NH3-N, TSS and
Colour)
91
4.12 Removal Efficiency, % vs Heavy Metals 92

xvi
LIST OF APPENDICES
APPENDIX TITLE PAGE
A1 Results for MLSS in The SBRs Respective to Days
106
A2 Results for MLVSS in The SBRs Respective to Days
106
A3 Results for SBR Treatment for COD, NH3-N, TSS and
Colour
107
A4 Results for pH Optimisation of Coagulation Process
by ALUM Respective to COD, NH3-N, TSS and
Colour
107
A5 Results for Dosage Optimisation of Coagulation
Process by ALUM Respective to COD, NH3-N, TSS
and Colour
107
A6 Results for Total Treatment Combining SBR and
Coagulation Process Respective to COD, NH3-N, TSS
and Colour
108
A7 Results for Heavy Metal Concentrations in Raw
Leachate and in Final Treated Leachate Respective to
The Removal Efficiency, %
110

xvii
LIST OF SYMBOLS / ABBREVIATIONS
ALUM Aluminium Sulphate
Anammox Anaerobic Ammonium Oxidation
AOP (s) Advance Oxidation Processes
AS Activated Sludge
ATP Adenosine Triphosphate
BOD5 Biological Oxygen Demand
COD Chemical Oxygen Demand
DO Dissolved Oxygen
DOE Department of Environment
F:M Food-to-Microorganism Ratio
GDP Gross Domestic Product
GHGs Green House Gases
HRT Hydraulic Retention Time
MLSS Mixed Liquor Suspended Solids
MLVSS Mixed Liquor Volatile Suspended
Solids
MOH Ministry of Health
MSW Municipal Solid Waste
NA Not Available
ORP Oxidation Reduction Potential
PAC Powdered Activated Carbon
PCB Polychlorinated Biphenyl
PET Polypropylrene
POME Palm Oil Mill Effluent
RBC Rotating Biological Contactor
SBR Sequencing Batch Reactor
SRT Sludge Retention Time
SS Suspended Solids
TDS Total Dissolve Solids
TKN Total Kjeldahl Nitrogen
TOC Total Organic Carbon
TSS Total Suspended Solids
UNEP United Nations Environment
Programme
VFA Volatile Fatty Acids

xviii
VS Volatile Solids
XOCs Xenobiotic Organic Compounds
Al
Al(OH)3
Aluminium
Aluminium Hydroxide
C5H7NO2 Glutarimide or New Organic Cells
CO2 Carbon Dioxide
Fe Iron
H+ Hydrogen ion
H2O Water Molecule
N2 Nitrogen Gas
NH3 Ammonia
NH3-N Ammonical-Nitrogen
NH4+ Ammonium
NO2- Nitrite
NO3- Nitrate
O2 Oxygen Gas
OH- Hydroxide ion
P Phosphorus
ADMI American Dye Manufactures Institute
g Grams
g/L Grams per Liter
hr / h Hour (s)
kg Kilogram (s)
kWh Kilowatt Hour
L Liter
L/min Liters per Minutes
m3 Meter Cube
mg/L Milligram per Liter
mV Millivolt
NTU Nephelometric Turbidity Units oC Degree Celsius
ppT Parts Per Trillion
PtCo Platinum Cobalt
RM Ringgit Malaysia
RPM Revolutions per Minute
tons Tonnes
V Volt
W Watt
Ω ohm
1
CHAPTER 1
INTRODUCTION
1.1 Background of Study
Waste, rubbish, junk or garbage is of the same meaning of unwanted or undesired
material or substance by the human concept. The existence of waste or unwanted
material is due to the limitations of present technology to turn and treat waste into
other useful means like new source of raw material and energy. In nature there is no
waste as the waste can be transform back into raw material by natural processes
namely bio-degradation, fermentation as well as photosynthesis and can be reused as
an energy source. Unfortunately, every product which is produced by the industry
during the very end of its life cycle will conceptually turn into waste as current
technology cannot afford to transform the waste back to raw material and other useful
means. Only a handful of waste can be turned back into new raw material which our
current technology can afford is the recycling of paper, plastics, glass and aluminium
or metal.
It is inevitable that the increase of the world’s population has resulted in the ever
increasing generation of solid waste per person. In 2000, 318 million tonnes of waste
generated was estimated globally. With an annual increase of 6% of the global solid
waste generation (Periathamby et al., 2009). At present, approximately 1.3 billion
tonnes per year of Municipal Solid Waste (MSW) is generated and is expected to
increase to 2.2 billion tonnes per year by 2025 (Hoornweg and Bhada-Tata, 2012).

2
Therefore, the generation of solid waste which will be disposed mainly to landfill
around the world cause adverse impacts on the population and to the environment.
Sustainable landfill is needed to preserve the well-being of the environment (Agamutu
et al., 2011). Sanitary landfill is one of the properly designed engineering landfill
which makes the landfill sustainable and can be defined as “a method of disposing of
refuse into land without creating hazards or nuisance to both the health and well-being
of the environment and the people, by means of confining the refuse to a smaller area,
to cover it with a layer of earth at the end of each day operation and to reduce it to the
smallest practical volume as possible to provide more frequent intervals as may be
necessary” (Raghab et al., 2013). To deal with this amount of waste generated globally
and to keep urban centres clean, a proper solid waste management is one of the basic
essential services needed provided by the municipal authorities in each country
(Asnani, 2006).
Malaysia with a gross domestic product (GDP) of $14,400 is made up of the
Peninsular of Malaysia and the Borneo island of Sabah and Sarawak states which
contributes to an area of 329,750 km2 with a population of approximately 24.8 million
by the year of 2008 (Periathamby et al., 2009). As a country with the aim of to achieve
2020 with the industrialized country status, it is inevitable that Malaysia has to face
problems and challenges of solid waste management like other developing countries
namely China, India, Indonesia and Taiwan. Landfilling remains the main disposal
method of solid waste and there are 290 landfills in Malaysia in which 176 are still in
operation and 114 were closed (Noor et al., 2013). In Malaysia, over 80% of the
collected MSW is landfilled and others are unsanitary, open dumpsite and over-loaded
in capacity (Fazeli et al., 2016). In developing countries, the main challenges for waste
management which include waste treatment are the ever increasing per capita waste
generation and the complexity of waste composition. In Malaysia alone, 28,500 tonnes
of municipal solid waste was daily generated (Agamuthu and Fauziah, 2011).
According to Periathamby et al. (2009), the estimated generation of waste in 1996 was
13,000 tonnes and the waste generated escalated to 19,100 tonnes in 2006 was
disposed daily into landfill and this is due to Malaysia is a rapid developing country.
Over the past 10 years, the generation of municipal solid waste (MSW) has increased
more than 91% since the last 10 years due to change in consumption behaviour,

3
increase per capita income, migration of rural to urban and rapid development of urban
areas like Kuala Lumpur and Ipoh.
1.2 Problem Statement
The generation and burial of municipal solid waste (MSW) in Malaysia landfills not
only cause landfill leachate to be generated when excess precipitation infiltrate
through the many layers of the landfill (Kjeldsen, 2002), it also contributed to the
generation of greenhouse gas (GHGs) like carbon dioxide and methane gas into the
atmosphere.
Landfill leachate which is generated of biochemical processes in the inherent
water content of wastes and in the waste’s cells through the intrusion or infiltration of
groundwater and surface run-off due to precipitation. After the closure of the landfill,
the landfill will continue to generate hazardous leachate and the generation of leachate
will last for 30-50 years (Ngo et al., 2008). In general, landfill leachate contains mostly
of organic matter both biodegradable and refractory to biodegradation (refractory
compounds such as humic and fulvic acids) (Peng, 2013), as well as heavy metals,
ammonia-nitrogen, and chlorinated organic which if infiltrates and flows into nearby
water bodies and into groundwater will poses adverse health effect to the surrounding
soil and affecting the entire ecological system including human health (Renou et al.,
2008). There are four groups of landfill leachate pollutants that can be categorized into
heavy metals, dissolved organic matter, inorganic macro-components and xenobiotic
organic compounds. According to Fazeli et al. (2016), the large portion of municipal
solid waste are in the form of organic matter which contributes 54.4% of the total
municipal solid waste in 1980 and 44.8% in 2005.
In 2005 and 2010, organic wastes contribute 47.5% and 43.5% respectively of
material composition of municipal solid waste in Malaysia (Johari et al., 2014). The
decrease in the number of organic waste is due to the higher in purchasing power
which enables the society to consume various new products (mainly electronic and
other plastic or oil based products) which leads to the more complex and highly

4
heterogeneous composition of waste generated in the landfill upon disposal
(Agamuthu and Fauziah, 2011).
At present, Papan landfill in Perak does not have a proper leachate treatment
system and the landfill is surrounding by streams and rivers. Hence, a proper treatment
system is needed to treat the leachate before severely polluting the environment.
Biological treatment method is the most worldwide used method for treating landfill
leachate. (Liu, 2013) This is because biological treatment (suspended or attached
growth) is the most environmentally friendly treatment with a cost-effective, simple
and reliable treatment method to remove multiple contaminants in landfill leachate.
Moreover, biological treatment is a very effective method in the removal of organic
(BOD5), inorganic and nitrogenous matter from young landfill where the BOD5/COD
ratio has a high value of more than 0.5 (Peng, 2013). The main processes and basic
principles for biological removal of nitrogen from landfill leachate are nitrification
and denitrification (Liu, 2013). The nitrification process has high treatment efficiency
for Total Kjeldahl Nitrogen (TKN) conversion ranging from 85% to 98%. (Baig et al.,
1996). There are various kinds of biological treatment methods for aerobic treatment
such as aerobic sequencing batch reactors (SBR), activated sludge, nitrification-
denitrification, membrane bio-reactors, aerated lagoons and biological aerated filters
in which usually having combination with coagulation.
Therefore, the aim of this study is to evaluate the performance and applicability
of aerobic sequencing batch reactor (SBR) in treating Papan landfill leachate followed
by coagulation using Aluminium Sulphate (ALUM) for post treatment in treating
effluent from SBR as at the moment there is no biological or physiochemical treatment
for treating leachate at Papan landfill. Biological treatment is chosen as the treatment
method for Papan as the leachate from Papan landfill is classified as Young leachate
(<5 years in operation) as the Papan landfill only began its operation on March 2012
(Thestar, 2011).

5
1.3 Objectives
i. To determine the characteristics of leachate generated from fresh
waste cell in Papan landfill.
ii. To evaluate the treatment efficiency of Papan landfill leachate by sequencing
batch reactor (SBR).
iii. To evaluate the post treatment efficiency of Papan landfill leachate by
coagulation method using Aluminium Sulphate (ALUM).
1.4 Project Outline
This research focuses on the sizing, setting up and to operate the sequencing batch
reactor (SBR) and post treatment in further treating the effluent from SBR using
ALUM as coagulation in UTAR in the effort to treat leachate generated from Papan
Landfill. The efficiency of using Palm Oil Mill sludge from Tian Siang (Air Kuning)
Sdn Bhd as activated sludge and ALUM as coagulant for post treatment were studied
on the removal on chemical oxygen demand (COD), ammonia-nitrogen (NH3-N), total
suspended solids (TSS) and colour as well as the effect of the two-stage treatment
system on heavy metals. Biological treatment method, SBR was chosen as currently
there is no treatment for Papan landfill leachate. Moreover, the leachate from Papan
landfill is classified to be young leachate as biological treatment is suitable for young
leachate. Papan landfill begin its operation since March 2012 which is within 5 years
from the current year 2016 and 2017 during this research period. The performance of
the SBR and coagulation was determined from the difference quality of the treated
effluent compared to the influent (Papan raw leachate). To meet the objectives, this
research will be focused on the effect of aeration rate (L / min) of the conventional
SBR with specified contact time (hr), sludge retention time (SRT), hydraulic retention
time (HRT), pH and constant cycle mixing time, settling time, decanting time and
feeding time of the SBR. While for the post treatment using ALUM, the study will
focus on the optimal pH and dosage (g/L) of ALUM.

6
There are five chapters in this report. First chapter reveals the background of
study, problem statement and objectives of this research. Chapter two is literature
review from solid waste management in Malaysia, landfill leachate properties of
Malaysia and Papan landfill and some crucial research on biological treatment using
SBR in treating landfill leachate process. Chapter three will be the methodology which
includes sample collection, sample analysis, experimental set-up and design,
analytical of effluent as well as studies. Chapter four which is the results and
discussion include the key findings in this research outcome. Lastly, chapter five
provides the conclusion for this research and the recommendation of this project for
further study in future.

7
CHAPTER 2
LITERATURE REVIEW
2.1 Solid Waste
The natural environment is deteriorating rapidly in many developing countries,
especially in urban areas. The ever increase in production of solid waste and
inadequate municipal solid waste management are the major factors which lead to the
degradation of environmental quality (Badgie et al., 2012) and is the main challenges
for solid waste management for the local authorities in many countries. Since the
industrial evolution, the generation of waste increased. Municipal solid waste (MSW)
which usually generated from residential and commercial areas comprise around
twenty different categories namely wood waste, food waste, fruit waste, green waste,
paper (mixed), paper (high grade and fine grade), plastic (rigid, film and foam),
cardboard, textile, metals (ferrous or non-ferrous), diapers, new print, batteries, glass
and construction waste. These categories of MSW can be classified into organic and
inorganic waste which around 80% of the total MSW will be ended up in landfill
(Kalanatarifard and Yang, 2012).

8
2.1.1 Quantity of Solid Waste
Many Asian countries have experienced urbanization over the past 50 years.
Advancement in economic development, faster rate of industrialization and public
practices of the region directly influences the level of MSW generation. Currently, 50%
of the world’s population lives in urban areas and the number will keep on increasing
down the century (Fazeli et al., 2016).
The quantity of waste generation is also proportion to the increase of
population in Malaysia. In Malaysia, the rural population generates 0.8 kg/cap/day of
waste which is twice as less compared to the urban middle-class population which
generates 1.9 kg/cap/day of waste (Kalanatarifard and Yang, 2012). The main problem
comes from urban areas as people tends to generate more waste as their standard of
living is higher hence giving them to have a greater purchasing power. The Ministry
of Housing and Local Government (MHLG) reported that for the year 1991 to 1993,
the national average rate of MSW production was 0.711 kg/person/day. The number
increased to 0.8 kg/person/day for 1994 to 1999 (Sakawi, 2011). The nation MSW
generation will keep on increasing and according to Agamuthu et al. (2009) it was
reported that in 2003 the nation’s MSW generation was 1.3 kg/person/day and in 2007
was at 1.5 kg/person/day. MSW generation reaches at 2.5 kg/person/day in recent past
especially in major cities like Kuala Lumpur and Petaling Jaya (Johari et al, 2014).
Since 1994, the population in Malaysia has been increasing at a rate of 2.4% or about
600,000 per annum. In 2003, the average generation of municipal solid waste had
increased from 0.5-0.8 kg/person/day to 1.7 kg/person/day in many of the major cities
especially in Kuala Lumpur and Johor. The quantity of MSW is estimated to increase
to 31,000 tons by the year 2020 (Manaf et al, 2009).
Figure 2.1 shows the increase in the amount of waste generated which is
correlated to the population respective to each of the states in Malaysia throughout the
year from 1996 to 2008 which are summarized by Noor et al. (2013).

9
Figure 2.1: Daily Waste Generation in States of Malaysia from 1996 to 2008
(Noor et al., 2013)
2.1.2 Composition of Solid Waste
Waste comes from many different areas in cities from public areas, private institutions,
residential population and commercial establishments. The composition of solid waste
differs from area to area depending on the type of culture, living style and economical
condition in that particular area. Basically, the types of solid waste are generated
respectively to the source of generators which is shown in Table 2.1 below.
Table 2.1: Source and Types of Municipal Solid Waste (Shekdar, 2009)
Sources Typical waste generators Types of solid waste
Residential Single and multifamily
dwellings
Food wastes, paper, cardboard,
plastics, textiles, glass, metals,
ashes, special wastes (bulky
items,
consumer electronics, batteries,
oil and tires) and household
hazardous wastes

10
Commercial Stores, hotels, restaurants,
markets, office
buildings
Paper, cardboard, plastics, wood,
food wastes, glass, metals,
special wastes, hazardous wastes
Institutional Schools, government centre,
hospitals,
prisons
Paper, cardboard, plastics, wood,
food wastes, glass, metals,
special wastes, hazardous wastes
Municipal
services
Street cleaning, landscaping,
parks, beaches,
recreational areas
Street sweepings, landscape and
tree trimmings, general wastes
from parks, beaches and other
recreational areas
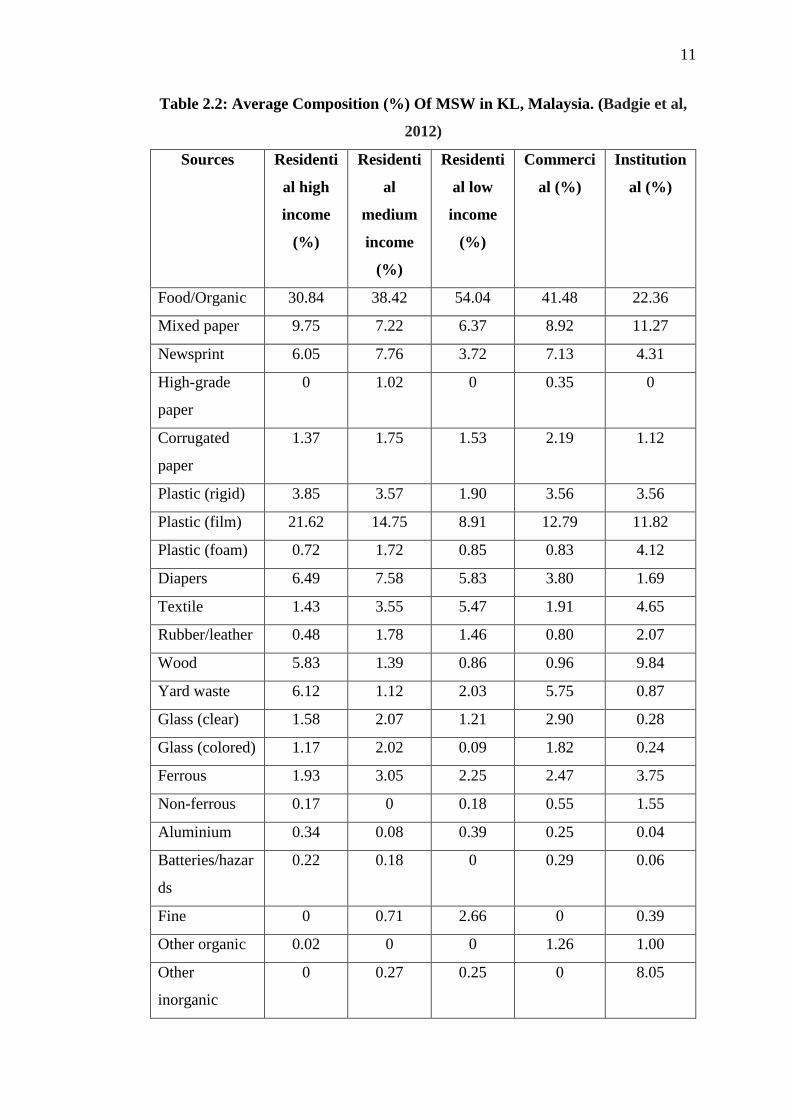
Table 2.2 shows the composition of municipal waste in percentage generated
respective to residential with high income, residential with medium income,
residential with low income, commercial and institutional just in Kuala Lumpur which
was summarized by Badgie et al. (2012). The outcome of the table shows that the
organic waste generated from residential area is obviously more than compared to
commercial and institutional sectors. This trend is also similar and agreed with the
researched done by Noor et al. (2013) which summaries the average composition of
MSW generated in Malaysia where food waste (organic waste) stands the most at 41%
of the total generation of municipal solid waste.
11
Table 2.2: Average Composition (%) Of MSW in KL, Malaysia. (Badgie et al,
2012)
Sources Residenti
al high
income
(%)
Residenti
al
medium
income
(%)
Residenti
al low
income
(%)
Commerci
al (%)
Institution
al (%)
Food/Organic 30.84 38.42 54.04 41.48 22.36
Mixed paper 9.75 7.22 6.37 8.92 11.27
Newsprint 6.05 7.76 3.72 7.13 4.31
High-grade
paper
0 1.02 0 0.35 0
Corrugated
paper
1.37 1.75 1.53 2.19 1.12
Plastic (rigid) 3.85 3.57 1.90 3.56 3.56
Plastic (film) 21.62 14.75 8.91 12.79 11.82
Plastic (foam) 0.72 1.72 0.85 0.83 4.12
Diapers 6.49 7.58 5.83 3.80 1.69
Textile 1.43 3.55 5.47 1.91 4.65
Rubber/leather 0.48 1.78 1.46 0.80 2.07
Wood 5.83 1.39 0.86 0.96 9.84
Yard waste 6.12 1.12 2.03 5.75 0.87
Glass (clear) 1.58 2.07 1.21 2.90 0.28
Glass (colored) 1.17 2.02 0.09 1.82 0.24
Ferrous 1.93 3.05 2.25 2.47 3.75
Non-ferrous 0.17 0 0.18 0.55 1.55
Aluminium 0.34 0.08 0.39 0.25 0.04
Batteries/hazar
ds
0.22 0.18 0 0.29 0.06
Fine 0 0.71 2.66 0 0.39
Other organic 0.02 0 0 1.26 1.00
Other
inorganic
0 0.27 0.25 0 8.05

12
Other 0 0 0 0 6.97
Total 100.00 100.00 100.00 100.00 100.00
Figure 2.2: Average Composition of MSW Generated in Malaysia (Noor et al.,
2013)
The composition of MSW in Malaysia in Figure 2.2 has the same trend with
Average Composition of MSW in KL in Table 2.2 with the highest organic waste as
food waste at 41 %. The second largest percentage of composition in MSW in
Malaysia is plastics and non-metal waste both contributes 8 % follow by garden waste
and rigid plastics contribute 6 % to the overall composition of MSW. Other types of
waste namely glass, paper, wood, metals and so on contributes to Malaysia MSW.
Some of the waste that should not enter into the landfill like hazardous waste materials,
electronic wastes and other universal waste unfortunately still being collected and
dump into Malaysia’s landfill until today. Due to this factor, landfill leachate is
naturally very hazardous and toxic to the environment and other living organisms
which might contact or interact with landfill leachate.

13
2.1.3 Solid Waste Management (SWM)
The main purpose of SWM is to ensure the safety of the public and to protect the
environment. Solid waste management is directly link to landfill as landfill is a
technique to manage solid waste in a more proper way (Masirin et al., 2008). The
system of SWM in Asia is reflected based for its climate, topography, economic, food
and mixed culture. MSW in Asia has becoming crucial as the concentration of the
population in cities is increasing, legal interventions, and rising in public awareness
about hygiene and sanitation as well as the availability of newer technology in waste
treatment (Shekdar, 2009).
SWM was privatized in Malaysia since 1996 and currently there are three solid
waste concessionaries which operate at their own respective zones: southern regions
is taken care by Southern Waste management, northern regions is taken care by
Idaman Bersih Sdn Bhd and central regions is taken care by Alam Flora Sdn Bhd.
(Manaf et al., 2009) The government of Malaysia still has the role in municipal solid
waste management as stipulated in Section 72 of the Local Government Act 1976 in
under the responsibility of the local authority. Solid waste in Malaysia are generally
categorized into three major categories namely:
i. Municipal solid waste
ii. Hazardous waste or schedule waste
iii. Clinical waste
Different government department has their own responsible towards each
category of the waste. Ministry of Housing and Local Government is responsible for
municipal solid waste, hazardous is under the responsible of Department of
Environment (DOE) and clinical waste is under the responsibility of Ministry of
Health (MOH) (Manaf et al., 2009). According to Shekdar (2009), the author
summarized the typical solid waste management system in Asian countries as shown
in Figure 2.3 and Malaysia is having the same SWM system which is similar among
Asian countries.

14
Figure 2.3: Typical Solid Waste Management in Asia Countries (Shekdar, 2009)
2.2 Landfill in Malaysia
Landfill is the last option that can deal with all material in the waste stream
and is the physical facility used for the disposal of refuse and other residuals on the
earth’s surface (Badgie et al., 2012). Due to this factor, landfill is the main disposal
method of solid waste in Malaysia.
The Ministry of Housing and Local Government are in the supervision of
Malaysia’s landfill sites. There are 4 levels or stages of improvement of landfill which
is listed in the Action Plan 1988 of Malaysia: (Fazeli et al., 2016; Adnan et al., 2013)
Level 0: Open dumpsite.
Level 1: Controlled dumping.
Level 2: Sanitary landfill with daily cover.
Level 3: Sanitary landfill with leachate circulation.
Level 4: Sanitary landfill with leachate treatment.
Solid Waste
Generated from:
Residential areas.
Commercial
establishments
including hotels
and markets
Other
establishments
Collection System
(House to House
and / or Fixed
Station)
Transportation Landfilling
Processing Systems for
material, energy
recovery and/or
volume reduction

15
According to Manaf (2009), there are 73 open dumping sites, 71 comtrolled
dumping sites and 11 sanitary landfill operating in Malaysia. Table 2.3 summarises
the numbers and types of disposal site according to states where the site is operating
in Malaysia.
Table 2.3: Types and Number of Disposal Site in Malaysia (Manaf et al., 2009)
State Open
dumping
Controlled
dumping
Sanitary
landfill
Total
Johor 12 14 1 27
Kedah 9 5 1 15
Kelantan 12 2 0 14
Melaka 2 3 0 5
Negeri
Sembilan
8 6 0 14
Pahang 7 5 3 15
Perak 15 11 4 30
Perlis 0 1 0 1
Pulau Pinang 1 1 1 3
Selangor 5 15 0 20
Terengganu 2 8 1 11
Total 73 71 11 155
Level 0: Open Dump Site
Open dumping is the most common method used for the discard of municipal solid
waste in Malaysia. As shown in the Table 2.4 above by Manaf et al. (2009) open
dumping stands the most in total by 75/155 compared to controlled dumping and
sanitary landfill. This is due to the method is the most cost effective for many years
compared to other solid waste disposal methods. Open dumping is still in operation in
mostly all municipalities until today where the waste is dumped in an uncontrolled
manner which can cause severe environmental issues (Tarmudi et al., 2012).

16
According to UNEP. (2015), open dump sites are unplanned and operating in
hazardous conditions where the located areas are not feasible due to the absence of
facilities such as biogas collection systems, leachate collection and treatment systems,
proper daily soil cover and landfill liner which can help to control and to protect the
both environment as well as the wellbeing of humans. Besides that, open dumpsites
do not control the quantity and the quality of waste input where toxic, hazardous and
medical waste which are not supposed to be landfilled are permitted for site disposal.
Level 1: Controlled Dump Site
Controlled dumpsite is similar to open dumpsite as both of the sites are non-engineered
disposal site. Controlled dumping is introduced due to need of the closure of open
dumpsites with the addition of some disposal facilities (UNEP, 2015). Controlled
dumps is also known as secure landfills which can provide a more effective disposal
of solid waste within the environmental protection regulations and standards. This is
due to the fact that controlled dumpsite has a planned capacity and the disposal is only
allowed at certain designated areas (USAID, 2016). For controlled dumping, there
may be gas management systems depending on the project needs and there are only
partial leachate management systems. Another main difference of open dump and
controlled dump is that open dump does not imply compaction while controlled dump
does employ compaction in cases. A controlled dump site has fencing where to control
the amount of dump at the end of operation of the site. Moreover, there are basic
records for keeping, picking and trading of controlled waste in controlled dumpsite
(UNEP, 2015).

17
Level 2 – 4: Sanitary Landfills
Sanitary landfill is different from open dumpsite and controlled dumpsite in terms of
planning and facilities. Sanitary landfill is an engineered disposal facility in which the
design, construction and operations manner in a sanitary landfill can minimizes and
protects the impacts to the environment and public health. Sanitary landfills go through
proper and careful planning from the selection of the disposing site down to the closure
of the landfill. Sanitary landfill has all the facilities needed to control the hazards and
pollutants from the landfill namely gas monitoring probe, landfill liner system,
groundwater monitoring well, leachate collection and treatment systems, biogas
management system and daily cover operations with waste (UNEP, 2015).
In Malaysia, there are only 12 sanitary landfills in which 11 of them are still
operating and 1 is closed based on Table 2.4. The number of sanitary landfill is small
as compared to open dumpsite and controlled dumpsite as the construction of sanitary
landfill depends on many factors such as the socio-political constrains, the strength of
economics and the physical conditions of the selected site. High initial investment
needed for the planning, construction, operation and closure of the sanitary landfill as
proper liner system, biogas management system, leachate management system and
monitoring systems are all needed for sanitary landfill.
Table 2.4: Sanitary Landfills in Malaysia Respective to Status and Location
(Fauziah and Agamuthu, 2012)
Name of landfill Status of
disposal facilities
In operation Location (state)
Bukit Tagar sanitary
landfill
Operating 2006 Selangor
Air Hitam sanitary
landfill
Closed 1995 Selangor
Jeram sanitary landfill Operating 2008 Selangor
Seelong sanitary
landfill
Operating 2004 Johor

18
Pulau Burong sanitary
landfill
Operating 2001 Penang
Mambong sanitary
landfill
Operating 2000 Sarawak
Bintulu sanitary
landfill
Operating 2002 Sarawak
Sibu sanitary
landfill
Operating 2002 Sarawak
Kota Kinabalu
sanitary landfill
Operating 2001 Sabah
Tanjung Langsat
sanitary landfill
Operating 2005 Johor
Tanjung 12 sanitary
landfill
Operating 2010 Selangor
Miri sanitary
landfill
Operating 2006 Sarawak
2.3 Landfill Leachate
In Malaysia, sanitary landfilling is the most general urban method as to dispose solid
waste as the method has such advantages as low initial cost, simplicity, and landscape-
restoration of holes from mining work like tin mining and gold mining (Aziz et al.,
2011). The formation of leachate from landfill is due to when rainwater water
penetrates through the waste in the layers of the landfill and carries pollutants from
the landfill (Mojiri et al., 2014). Once the garbage was dumped into the landfill, the
garbage will go through the four stages or phases of decay in the landfill which are the
initial aerobic phase, the anaerobic acidic phase, the initial methanogenic phase and
finally the stabilising methanogenic phase. The different phase of the garbage decay
can occur simultaneously in different layers of the landfill (Kuusik et al., 2014).

19
According to Renou et al. (2008), landfill leachate can be defined as the
aqueous effluent as a result of rainwater percolation through waste, the inherent water
content of waste and biochemical processes in waste’s cells. Landfill leachate is a toxic
waste water which has high values of suspended solids, biochemical oxygen demand
(BOD5), chemical oxygen demand (COD), turbidity, color, heavy metals, ammonia
nitrogen (NH3-N), pH and bad odor. If the leachate which contains large amounts of
organic and inorganic pollutants generated in municipal landfills are not properly
controlled, this will cause servere environmental impact (Raghab et al., 2013). In
general, landfill leachate can be represented by the basic parameters BOD, COD, pH,
suspended solids (SS), ratio of BOD/COD, ammonium nitrogen, total Kjeldahl
nitrogen (TKN) and heavy metals (Renou et al., 2008).
2.4 Factor Affecting Leachate Quality
The pollutant present in the content of the landfill leachate is directly dependent on
the intensity of rainfall and the on-going activities near or on the territory of landfill
like use of depositing site, garbage sorting and tipping technology. The different
decaying phase of the waste in the landfill will affect the composition of the leachate
(Kuusik et al., 2014). According to Renou et al. (2008), there are mainly two factors
which affects the characteristics of leachate which are the volumetric flow rate and the
composition of the solid waste. The composition and the quality of leachate which
collected from the transfer station can vary depending on the waste composition of
that area, climate condition, moisture content in the waste and the degree of
compaction of the waste in the landfill. Not only that, the quality of leachate can be
varied by the biodegradable matter present in the leachate and the volume of leachate
produced over time (Raghab et al., 2013).
The other factor which affects the quality of the leachate is the age of the
landfill which is classified into generally three categories namely young, intermediate
and old or stabilized landfill leachate. According to Liu. (2013), as the age of landfill
increase, the degrading compounds by microorganisms in landfill converts organic
matter into methane and CO2. Due to this degradation process, the pH will increase as

20
the landfill ages from less than pH 6.5 to more than pH 7.5 in stabilized landfill as due
to the reduction of CO2 with hydrogen. As moving from intermediate to stabilized
leachate, the leachate organic compounds are less biodegradable as most of the organic
matter had been converted hence the BOD to COD ratio will decrease as the landfill
leachate ages over time.
The age of landfill leachate can be identified through several parameters shown
in Table 2.5. In common, landfill leachate is classified based on the age (counted from
the date start to receive MSW) of the landfill. Basically, leachate is classified to be
young, intermediate and stabilized (matured) when the age of the landfill are 5 years,
5-10 years and more than 10 years respectively. The BOD to COD ratio is the
significant parameter which determines the age of the leachate. Other parameters such
as pH, ammoniacal-nitrogen, organic matter and etc. are relevant for the leachate age
determination.
Table 2.5: Landfill Leachate Classification (Baig et al., 1996; Liu, 2013)
Type of leachate Young Intermediate Stabilized
Age of landfill
(years)
<5 5 - 10 >10
pH <6.5 6.5-7.5 >7.5
BOD/COD >0.3 0.1-0.3 <0.1
COD (g/L) >15 3-15 <3
NH4+-N (mg/L) <400 NA >400
TOC/COD <0.3 0.3-0.5 >0.5
Organic matter
(VFA-Volatile
Fatty Acids)
70 – 90% 20 – 30% HWM
Kjeldahl nitrogen
(g/L)
0.1-2.0 NA NA
Heavy metals
(mg/L)
>2 <2 <2

21
2.5 Impacts of Landfill Leachate and Discharge Limit
2.5.1 Environmental Impacts
Initially, landfill was introduced as a need to protect the environment and society from
various adverse impacts of other more harmful disposal method of solid waste like
open-burning, ocean and river dumping. Landfilling produces hazardous leachate and
gas which besides has adverse effect on health, and also possess environmental issues
like explosion, fire, unpleasant odours, air pollution and global warming (El-Fadel et
al., 1997). Most of the landfill leachate contain xenobiotic organic compounds (XOCs)
and various heavy metal which makes leachate hazardous as XOCs and heavy metals
may react with themselves and substances in the surrounding environment which can
be carcinogenic, mutagenic, eco-toxic, reactive, flammable and may be bio-
accumulative or persistent (Slack et al., 2005). Due to the hazardous and toxicity
characteristic of the leachate, the infiltration and run-off of leachate has the potential
to cause adverse harm to groundwater to near-by surface water and vegetation which
surrounds the landfill.
The disposal of containers into sanitary landfill may contains residual of
hazardous chemicals like solvents, polychlorinated biphenyl (PCB), insecticides,
unused pharmaceuticals and pesticides hence producing highly complex carcinogenic
chemicals (Clarke et al., 2015).
Ground water pollution is due to when the leachate breached or seep through
the bottom of the landfill or an impermeable layer (liner) of the landfill which the
leachate discharge to the ground’s surface and reaching to the water table further
contaminate the groundwater (El-Fadel et al., 1997).
2.5.2 Human Health Impacts
Leachate is a potential polluting waste liquid from landfill that poses potential health
risk to the surrounding ecosystems and human populations. The biodegradation in
landfill yield leachate with high concentration of ammonia-nitrogen and toxic heavy
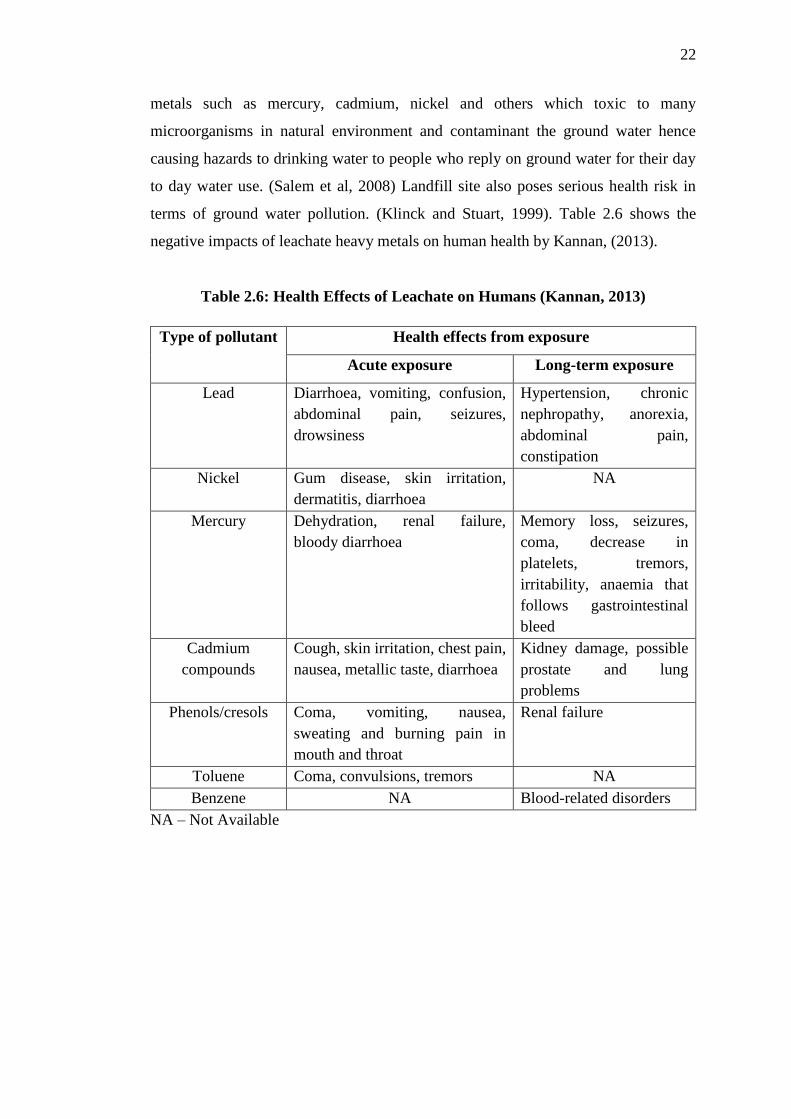
22
metals such as mercury, cadmium, nickel and others which toxic to many
microorganisms in natural environment and contaminant the ground water hence
causing hazards to drinking water to people who reply on ground water for their day
to day water use. (Salem et al, 2008) Landfill site also poses serious health risk in
terms of ground water pollution. (Klinck and Stuart, 1999). Table 2.6 shows the
negative impacts of leachate heavy metals on human health by Kannan, (2013).
Table 2.6: Health Effects of Leachate on Humans (Kannan, 2013)
Type of pollutant Health effects from exposure
Acute exposure Long-term exposure
Lead Diarrhoea, vomiting, confusion,
abdominal pain, seizures,
drowsiness
Hypertension, chronic
nephropathy, anorexia,
abdominal pain,
constipation
Nickel Gum disease, skin irritation,
dermatitis, diarrhoea
NA
Mercury Dehydration, renal failure,
bloody diarrhoea
Memory loss, seizures,
coma, decrease in
platelets, tremors,
irritability, anaemia that
follows gastrointestinal
bleed
Cadmium
compounds
Cough, skin irritation, chest pain,
nausea, metallic taste, diarrhoea
Kidney damage, possible
prostate and lung
problems
Phenols/cresols Coma, vomiting, nausea,
sweating and burning pain in
mouth and throat
Renal failure
Toluene Coma, convulsions, tremors NA
Benzene NA Blood-related disorders
NA – Not Available
23
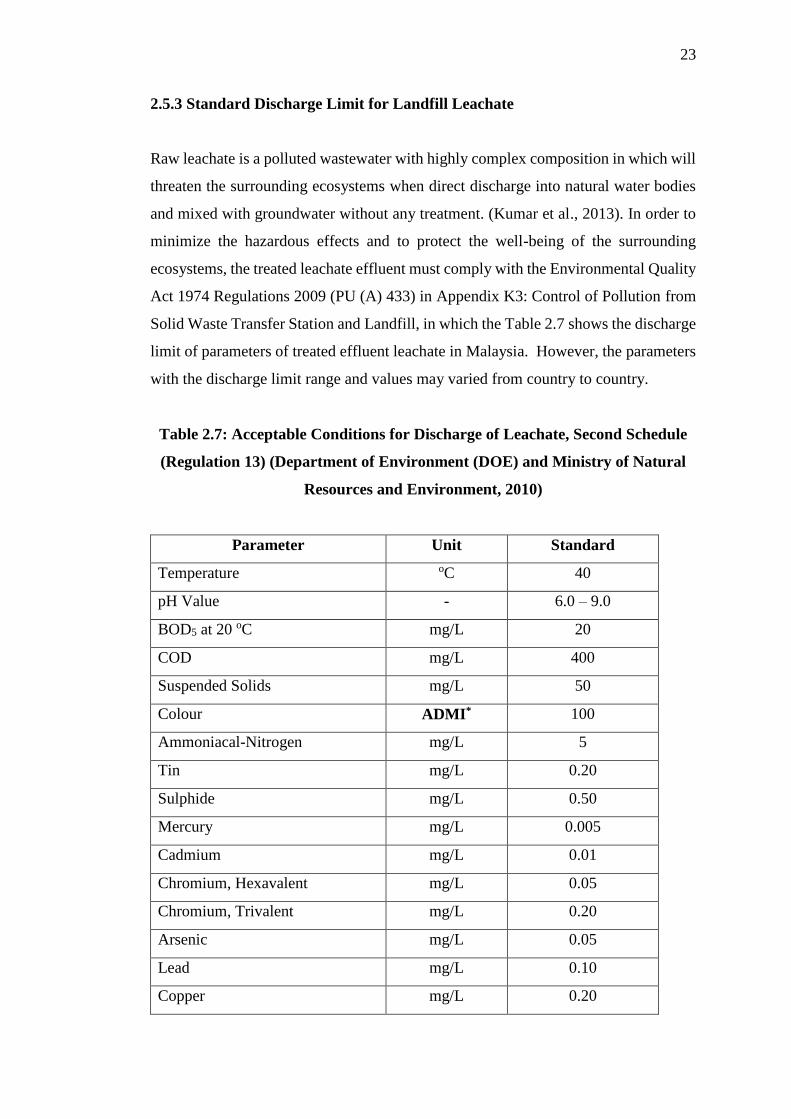
2.5.3 Standard Discharge Limit for Landfill Leachate
Raw leachate is a polluted wastewater with highly complex composition in which will
threaten the surrounding ecosystems when direct discharge into natural water bodies
and mixed with groundwater without any treatment. (Kumar et al., 2013). In order to
minimize the hazardous effects and to protect the well-being of the surrounding
ecosystems, the treated leachate effluent must comply with the Environmental Quality
Act 1974 Regulations 2009 (PU (A) 433) in Appendix K3: Control of Pollution from
Solid Waste Transfer Station and Landfill, in which the Table 2.7 shows the discharge
limit of parameters of treated effluent leachate in Malaysia. However, the parameters
with the discharge limit range and values may varied from country to country.
Table 2.7: Acceptable Conditions for Discharge of Leachate, Second Schedule
(Regulation 13) (Department of Environment (DOE) and Ministry of Natural
Resources and Environment, 2010)
Parameter Unit Standard
Temperature oC 40
pH Value - 6.0 – 9.0
BOD5 at 20 oC mg/L 20
COD mg/L 400
Suspended Solids mg/L 50
Colour ADMI* 100
Ammoniacal-Nitrogen mg/L 5
Tin mg/L 0.20
Sulphide mg/L 0.50
Mercury mg/L 0.005
Cadmium mg/L 0.01
Chromium, Hexavalent mg/L 0.05
Chromium, Trivalent mg/L 0.20
Arsenic mg/L 0.05
Lead mg/L 0.10
Copper mg/L 0.20
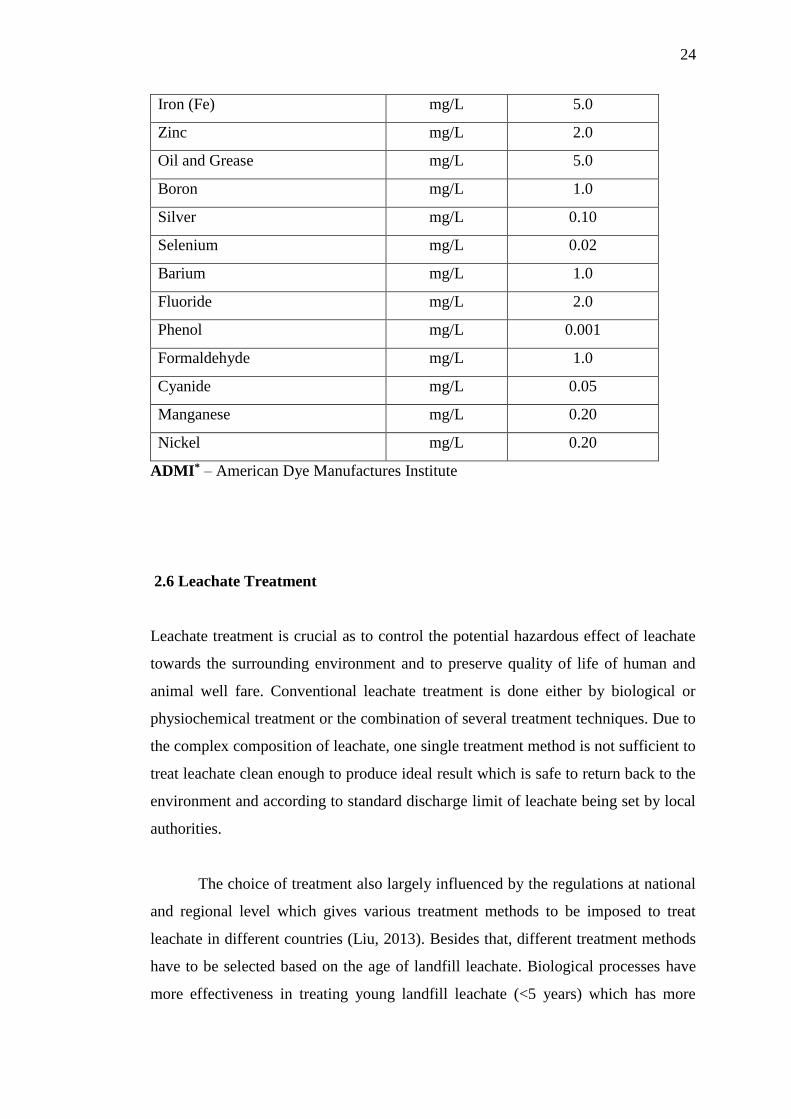
24
Iron (Fe) mg/L 5.0
Zinc mg/L 2.0
Oil and Grease mg/L 5.0
Boron mg/L 1.0
Silver mg/L 0.10
Selenium mg/L 0.02
Barium mg/L 1.0
Fluoride mg/L 2.0
Phenol mg/L 0.001
Formaldehyde mg/L 1.0
Cyanide mg/L 0.05
Manganese mg/L 0.20
Nickel mg/L 0.20
ADMI* – American Dye Manufactures Institute
2.6 Leachate Treatment
Leachate treatment is crucial as to control the potential hazardous effect of leachate
towards the surrounding environment and to preserve quality of life of human and
animal well fare. Conventional leachate treatment is done either by biological or
physiochemical treatment or the combination of several treatment techniques. Due to
the complex composition of leachate, one single treatment method is not sufficient to
treat leachate clean enough to produce ideal result which is safe to return back to the
environment and according to standard discharge limit of leachate being set by local
authorities.
The choice of treatment also largely influenced by the regulations at national
and regional level which gives various treatment methods to be imposed to treat
leachate in different countries (Liu, 2013). Besides that, different treatment methods
have to be selected based on the age of landfill leachate. Biological processes have
more effectiveness in treating young landfill leachate (<5 years) which has more

25
composition of organic matter and physiochemical processes is more suitable in
treating older leachate (>5 years) (Baig et al., 1996). In general, conventional leachate
treatments are classified into three major categories namely i) leachate transfer within
the landfill which includes the recycling of leachate and combined treatment with
domestic sewage, ii) chemical and physical treatment which include chemical
adsorption, chemical precipitation, coagulation/flocculation, chemical oxidation and
air stripping and iii) biodegradation which uses aerobic, anoxic and anaerobic process
to treat leachate (Renou et al., 2008).
Nowadays, newer technology has been introduced to leachate treatment in the
world like membrane processes, and anaerobic ammonium oxidation (Anammox)
process. Moreover, some new methods have also been added in the procedure in
treating leachate as to remove both organic and inorganic compounds more effectively.
One example is to add powered activated carbon (Liu, 2013). Leachate
phytoremediation is a relatively new method which uses plants and wet lands to treat
wastewater and leachate. This method is considered to be one of the latest biological
treatment for leachate and wastewater (Madera and Valencia-Zuluaga, 2009).
2.6.1 Leachate Transfer
2.6.1.1 Combined Treatment with Domestic Sewage
In some cases, leachate is dispose into the sea through piping into the sewer system or,
preferably the leachate collected will be combined with domestic sewage for treatment
at conventional municipal sewage plant. This method is being used as the operational
cost is relatively low (Renou et al., 2008). This method has been doubt as leachate
often contains high amount of heavy metals and organic inhibitory compounds which
may affect or reduce the treatment efficiency and increase the effluent concentration
from the domestic municipal sewage treatment plant.
However, some research has been done to enhance this method as some authors
tried to optimise the volumetric ratio of sewage wastewater to leachate. It is reported
that by using sequencing batch reactor (SBR) with ratio 9:1 of sewage to leachate, the

26
removal rate of BOD and nitrogen are 95% and 50% respectively at the end of each
cycle daily. (Renou et al, 2008). According to Renou et al. (2008), adding Powdered
Activated Carbon (PAC) may improve the effluent quality if the leachate input exceeds
10%.
2.6.1.2 Recycling of Leachate
The landfill itself is an anaerobic biological rector which the leachate can be
recirculate back to the landfill hence giving microorganisms to react and treat (Liu,
2013). Recycling or recirculation of leachate back through the tip into the landfill is a
widespread technique which has been commonly used for the past decade as is one of
the cheapest option available in treating leachate (Renou et al., 2008). This treatment
method is also simple to operate, effective in reducing the volume of organic
concentration in leachate and just only need pH buffering to recondition the leachate
back into the landfill (Liu, 2013). Some research had been done to support this method
as it is reported that leachate recirculation increased the moisture content and improve
the distribution of nutrients and enzymes between methanogens and solid-liquid in a
controlled reactor system. This method had also give significant in lowering the
production of methane production and COD. Moreover, the recirculation shortens the
time for leachate to reach stabilized leachate from several decades to 2 to 3 years
(Renou et al., 2008).
2.6.2 Physical / Chemical treatment
2.6.2.1 Coagulation-Flocculation
In treating intermediate and stabilized leachate, coagulation-flocculation is the best
choice. This method is coupled with biological treatments as to improve the
degradation of bio-refractory or non-biodegradable materials like humic and fulvic
acids. (Wiszniowski et al., 2006) Coagulation-flocculation has been used widely in
many wastewater and leachate treatment plant as a pre or post treatment before

27
secondary and final treatment like biological treatment, final polishing treatment and
reverse osmosis as to remove non-biodegradable organic matter. Common coagulant
like ferric chloride, ferric chloro-sulfate, ferrous sulfate and aluminium sulphate
(ALUM) are added during the coagulation process (Renou et al., 2008).
Undesirable compounds in landfill leachate namely heavy metals, AOXs,
PCBs and others are effectively being removed using this method. Coagulation-
flocculation is more efficient in treating stabilized or matured leachate (COD removal
up to 75%) compared to young leachate (COD removal up to 25 – 38%) (Wiszniowski
et al., 2006). Since most of the colloidal particles are negatively charged, adding
coagulant is the first step in coagulation-flocculation process in order to reduce and
neutralize the negative-negative repulsive forces between the particles. Polymers are
added to kick start the flocculation process as to form larger flocs after the coagulation
process. In some researches, it is reported that COD and heavy metals removal rate
are ranged from 30% - 86% and 74% - 98% respectively (Liu, 2013).
The main working mechanism of coagulation is to hydrolyse metal ions from
aluminium-based coagulants like aluminium sulphate or aluminium chloride to form
aluminium hydroxide floc and other hydrogen, H+ ions which both are highly
positively charged. According to Saukkoriipi, (2010), the coagulation process can be
divided into two main mechanisms namely: (1) neutralization of particle charges and
(2) sweep coagulation and flocculation. The hydrogen ion will decrease the pH of
wastewater slightly as it reacts with the alkalinity of the wastewater during hydrolyse
reaction. The equations 2.1 and 2.2 show the general reaction of coagulant with
wastewater (Gebbie, 2006).
Al2(SO4)3.18H2O 2Al3+ + 3SO42- + 18H2O
(2.1)
2Al3+ + 3SO42- + 18H2O 2Al(OH)3 + 6H+ + 3SO4
2- + 12H2O
(2.2)
According to Gebbie, (2006) depending on the type of coagulant used, “sweep-
floc coagulation” will occur if hydrolysis reaction take place at pH 5.8 to 7.5. The
“sweep-floc coagulation” refers to the removal of both colloidal matter and colour by

28
adsorption either onto or within the formed metal hydroxide hydrolysis products. Duan
and Gregory, (2003) also gives the definition of “sweep flocculation” as the action of
particles are enmeshed and being “sweep out” or removed by the increase number of
amorphous hydroxide precipitate at pH 7.0.
The hydrolysis reaction of ALUM forms multiple species of dissolve Al
species and other Al-hydroxide precipitates. The expected ALUM cations are
Al(OH)41-, Al(OH)2+, Al3+, Al(OH)2
1+ and Al(OH)3(am) which is the amorphous
precipitate of ALUM (Pernitsky et al., 2006). Both Al (III) and Fe (III) have limited
solubility when pH is close to neutral as amorphous hydroxide precipitate starts to
form and dominate at pH 7.0 theoretically. Hossain, (1996) present a graph in figure
2.4 in relating different hydrolyzing ALUM species at different pH and the dominant
species of Al(OH)3 amorphous hydroxide formed at pH 7.0 in any types of wastewater
including sewage, industrial wastewater and landfill leachate.
Figure 2.4: Quantity (Fraction) of mono-nucleus aluminium species (monomers)
as a function of pH (Hossain, M.D., 1996)
Duan and Gregory, (2003) had presented a schematic diagram showing the
interaction of different hydrolyzed aluminum species with negatively charged particles
in water including the “Sweep Flocculation” process in the Figure 2.5 below.

29
Figure 2.5: A flow diagram describing the process and interaction of initially
negatively charged impurities or particles (right-hand side) and the type of
hydrolyzed aluminium species including the Al(OH)3 (left-hand side) (Duan and
Gregory, 2003)
2.6.2.2 Chemical Precipitation
Chemical precipitation is widely used as pre-treatment in effort to treat leachate as to
remove high concentration of ammonium nitrogen (NH4+) and to lower COD from 95%
to 79%. Chemical precipitation process which place before conventional activated
sludge process could prevent high strength of ammonium nitrogen significantly
affecting the biological sludge process in treating organic matter in leachate. Some
authors reported that this method effectively remove ammonium concentration from
5600 mg/L down to 110 mg/L within 15 minutes by adding Na2HPO4.12H2O and
MgCl2.6H2O at pH 8.5 to 9.0 with a ratio of 1:1:1 for Mg/NH4/PO4 (Renou et al.,
2008). According to Liu. (2013), by the addition of precipitation reagents, chemical
precipitation is effective to precipitate non-biodegradable organic compounds and
heavy metals, to further remove the particles from mixture, filtration process can be
used after chemical precipitation. Chemical precipitation can remove fluoride,
phosphorus and ferro-cynide in leachate and the removal efficiency is largely

30
influenced by the presence of metals, the concentration of reagents and metals.
Moreover, lime is used in treating raw medium aged leachate and also for pre-treated
biological leachates with a BOD to COD ration of 0.1 – 0.5 which provide the best
effectiveness of lime precipitation for removing metals, colour and to reduce COD as
well. Lime is used due to its availability and low cost with regard to high dosage
needed for lime precipitation (Baig et al., 1996).
2.6.2.3 Adsorption
Adsorption is where dissolved compounds in leachate or in wastewater are adsorbed
to the surface of an adsorbing medium. To increase the effectiveness of the adsorption
effect, very high specific external and internal surface area of the adsorbing medium
is needed therefore Powdered Activated Carbon (PAC) or granular activated carbon
(GAC) is the most commonly used adsorbing mediums as the attractive forces of the
carbon surface is stronger than the attractive forces of the liquid hence the adsorption
process is possible (Liu, 2013). The adsorption of inorganic pollutants onto powder or
columns form of activated carbon provides better reduction in COD levels compared
to chemicals methods (Renou et al., 2008).
The capacities of activated carbon adsorption increase with the decrease
fraction of volatile fatty acid therefore is an alternative treatment method for raw and
young biologically pre-treated landfill leachate to chemical precipitation. Chemical
adsorption uses PAC can act as polishing treatment for stabilised leachate if combined
with coagulation-flocculation (Baig et al., 1996). In many cases, the combine use of
powdered activated carbon (PAC) along with biological treatment has been effective
in treating landfill leachate as PAC helps to reduce inert COD, non-biodegradable
compounds and colour to acceptable levels which can the treated leachate can be
returned back into the environment or use for irrigation purposes (Renou et al., 2008).

31
2.6.2.4 Chemical Oxidation
Chemical oxidation is a method mainly to treat pollutants where biological and
physical methods cannot treat effectively such as toxic and hazardous substances, non-
biodegradable toxic substance and soluble organic compounds in leachate. Chemical
oxidation or advance oxidation process (AOP) uses strong oxidising agent like ozone
(O3-selective), chlorine gas, calcium hydrochloride and potassium permanganate
which generates hydroxyl radicals (-OH) to oxidize or to destroy compounds in
leachate. By using chemical oxidation, COD can be removed around 20% to 50%. The
famous Photo-Fenton process is one of example of chemical oxidation or AOP which
uses combination of light and metal ions which has a reduction rate of 64% and 48%
in the removal of COD and TOC respectively which are organics in leachate (Liu,
2013). According to Renau et al. (2008), it is confirmed that AOP is adapted to treat
well-stabilized or matured landfill where the left over organics substances can be
oxidised completely or to reach complete mineralization into carbon dioxide and water.
Table 2.8 shows the two main types of AOP system with examples namely
homogeneous and heterogeneous systems.
Table 2.8: List of Typical Advance Oxidation Systems (AOP) (Renou et al.,
2008)
Type of system Examples
Homogeneous
system
With irradiation Ultrasound (US)
O3/ ultraviolet (UV)
Electron beam
UV/US
H2O2/UV or US
H2O2/Fe2+/UV (photo-
Fenton’s)
Without irradiation H2O2/Fe2+ (Fenton’s)
O3/OH-
O3/ H2O2
With irradiation TiO2/O2/UV
32
Heterogeneous
system
TiO2/ H2O2/UV
Without irradiation Electron-Fenton
2.6.2.5 Air stripping
Ammonia stripping or air stripping is a method to remove high concentration of
ammonium in wastewater and in leachate. In treating high strength ammonium, pH
plays a crucial role as the ammonia will be soluble ammonium if pH is below 7. The
dissolved ammonia gas will be present if the pH of the leachate or wastewater is
reaching 11. The optimal pH during air stripping shall be adjusted from 11 to 12 by
the addition of NaOH (Liu, 2013).
The equilibrium reaction for ammonia stripping:
NH4+ + OH- NH3 + H2O
(2.3)
During treatment, the contaminated ammonia gas will be treated with strong
acids like H2SO4 or HCl to oxidize the ammonia gas. The author reported that high
initial concentration of ammonia striping under condition of 20oC, pH = 11 and
retention time of 24 hours, has reduction rate reaches 89% at peak. The ammonia gas
striping method has one major environmental concern as the by-product is the release
of NH3 into the atmosphere hence causing adverse impact on air pollution due to some
percentage of ammonia couldn’t be properly adsorbed with H2SO4 or HCl (Renou et.
al, 2008).
2.6.3 Biological Treatment
Biological treatment is the most common worldwide practice method in treating
leachate (Kumar et al., 2013). In general, biological treatment processes are classified

33
into aerobic (oxygen presence) and anaerobic (oxygen absence) in which depends on
whether or not the medium of the biological treatment requires oxygen, O2 supply
from the atmosphere or from oxygen tanks (Renou et al., 2008). Due to the fact that
biological treatment method is a reliable, simple and low-cost in operation and
maintenance, many of the wastewater plant in domestic areas and on-site landfill
leachate treatment facilities uses this method in treating bulk liquid containing high
strength of organic matter or BOD. Microorganism and groups of bacteria which are
suspended or attached growth in a biological reactor carries out biodegradation to
degrade organic compounds in leachate into carbon dioxide, biogas (methane) under
anaerobic conditions and biomass (sludge) under aerobic conditions. It is reported that
biological processes are very effective in removing nitrogenous pollutants and organic
matters from young (<5 years) leachate where the ratio of BOD to COD has a high
value of more than 0.5 (Peng, 2013). Biological treatment is suitable to remove
ammonia nitrogen and very efficient nitrification process can help to remove high
strength TKN, Total Kjeldahl Nitrogen from 85% to 98% (Baig et al., 1996).
There are many examples of aerobic processes namely activated sludge plant
(AS), aerated lagoons, rotating biological contactors (RBC), sequencing batch plant
and trickling filter. For anaerobic processes, mainly consist of anaerobic filter and
anaerobic sludge bed reactor (UASB). As aerobic processes need oxygen supply,
therefore one advantages of anaerobic processes are low energy requirement as it does
not need artificial supply of oxygen by using pump and irrigation of water surface to
increase the dissolve oxygen in water (Kumar et al., 2013).
However, biological treatment has its own limitations as no single treatment
method is 100% perfect and efficient in treating all pollutants in leachate. Biological
treatment’s efficiency is limited by the presence of major refractory compounds
mainly humic and fulvic acids. Moreover, if compared to physical/chemical treatment,
biological treatment is considered to be slower in treating specific pollutants in
leachate as microorganism and metabolism processes need time to degrade pollutants.
Partial abatement of biodegradable organic compounds and the nitrification of
ammonium nitrogen is responsible by aerobic treatment. Conventional activated
sludge system, aerated lagoons and sequencing batch reactors (SBR) are based on

34
suspended-growth biomass where microorganisms and groups of bacteria are
suspended in the medium of the reactor, lives and degrade (eat) pollutants from the
influent (Renou et al., 2008). Attached-growth systems like moving-bed reactor
(MBBR) and bio-filters has gained much interest in recent years. Membrane
bioreactors is a term which indicates the combination of aerobic bioreactors and
membrane separation technology.
Anaerobic process is a biological metabolite which operates without oxygen to
transfer organic matters into CO2 and CH4 (Liu, 2013). Anaerobic treatment is
particularly suitable for dealing with high concentration of organic effluents in which
it allows the complete end process of leachate streams from young tips. Anaerobic
process has several advantages compared to aerobic process in which anaerobic
digestion has low yielding in sludge, lower energy consumption (no aeration is needed)
however the biological reaction is slower than aerobic. Therefore, anaerobic treatment
are chosen to treat concentrated leachate as this method operates at lower cost and
produce usable biogas. The end product from anaerobic process mostly yield methane
gas, CH4 which the gas can be harvest for electric generation (Renou et al., 2008).
2.6.3.1 Activated Sludge Process (AS)
According to Liu. (2013), activated sludge is an active microbial floc where bacteria
are supplied with oxygen in the tank. Activated sludge process is a suspended-growth
biological treatment which employs aerobic micro-organisms to degrade organic
matters in leachate and also in wastewater. Activated sludge process consists of an
open tank basin, diffusers or mechanical aerators to provide aeration together with
leachate or wastewater as medium. After the aeration stage, the mixture of treated
water and microorganisms (mixed liquor) is transferred into the clarifier where gravity
play the role of settling microorganisms and a high percentage of these settled solids
are recycled back to the aeration basin (Yu, 2007). Activated sludge process has been
employed largely in treating domestic wastewater but has been shown to be inadequate
in handling leachate although the process is efficient in removing nutrients, ammonia
content and organic carbon. The reason of this system to be inadequate for leachate is

35
that the sludge settle ability is bad and longer time for aeration is needed in treating
leachate. Moreover, activated sludge produces high amount of sludge and requires a
lot of energy in aeration. Due to heavy metals and high concentrations in raw leachate,
this may inhibit microorganisms to treat leachate (Renou et al., 2008).
2.6.3.2 Sequencing Batch Reactor (SBR)
Sequencing batch reactor (SBR) has been applied as an efficient technology in treating
wastewater in recent years especially in treating domestic wastewater. Several full-
scale fill-and draw batch systems has been operating from 1914 to 1920. Until late
1950’s and early 1960’s, this system gained interest of many researches in the field of
wastewater treatment. New technology and equipment are developed to assist the
control and aeration which allows SBR to function and to treat wastewater more
effectively which can be compared to conventional activated sludge systems (Mahvi,
2008).
Sequencing batch reactor (SBR) is one of many biological treatment methods
used to remove several contaminants (Mojiri et al., 2014). This treatment method is
ideal for nitrification-denitrification processes as the operation provides pathway for
organic carbon nitrification and oxidation. Many authors reported that the SBR system
have COD removal of up to 75% and with an excellent ammonia-nitrogen, NH4-N of
99% where the system has 20-40 days of residence time in treating domestic leachate
(Renou et al., 2008). SBR is suitable to remove total suspended solids (TSS), BOD,
nitrification, denitrification and biological phosphorus. Never the less, full-scale SBR
size can range from 3,000 gpd up to 5 MGD. SBR is chosen rather than using activated
sludge system due to SBR’s smaller footprint as the essential conventional activated
sludge processes of filling, mixing with aeration, settling, extraction and idling
happened in just one tank as shown in Figure 2.6. Not only that, the cycles or processes
in the SBR can be easily modified to suit different raw influent from different places
(Mahvi, 2008).
The five basic processes in a SBR are essential, and is explained according to Yu.
(2007),

36
Filling is the process where raw influent either domestic leachate or wastewater
is fed into the SBR in which contains an acclimated biomass from previous
cycle.
React or mixing with aeration is happened after the filling stage where the
medium in the reactor are actively mixed with a mixer and aerated by pumping
air into the reactor. This process is crucial as to provide enough oxygen for
microorganisms to aerobically degrade organic compounds in the leachate or
wastewater.
Settling is happened after the react stage where mixing and aeration stop
completely. This process assists heavy and large solids to settle under
quiescent conditions under the influence of gravity.
Draw or extraction is happened after the settling stage where supernatant near
the top of the medium is extracted from the reactor for further treatment or is
allowed to be discarded if complied with regulations.
Idling is the end cycle of the SBR process where the settled solids or sludge
are remained in the reactor for the next cycle. In most cases, this stage is not
used as is not crucial and there may be a portion of sludge being washed out
during this stage.
Figure 2.6: The Five Stages of Operations in a Sequencing Batch Reactor (SBR)
(Yu, 2007)
SBR has its own limitations although it has a lot of advantages over the
conventional activated sludge system (AS). One of the major downside of using SBR
as treatment method is large energy consumption for aeration phase as the aeration
systems must be sized properly to provide sufficient air during the react phase and
sometimes even for the fill phase. Another drawback of the SBR system is where the
system requires an oversize effluent space due to the extraction of daily wastewater is
needed. In the past decades, SBR systems faced some major issues in terms of
maintenance problems for the decanting mechanism but have been resolved with
present day technology and research (Mahvi, 2008).

37
2.6.3.3 Sequencing Batch Reactor (SBR) Addition with Adsorbent
This method was developed to treat matured leachate with low biodegradability.
According to Aziz et al. (2011), low biodegradable leachate collected from Kulim
landfill, Malaysia with low BOD5 to COD ratio of 0.22 which is less than 0.50 shows
that sequencing batch reactor added with Powered Activated Carbon (SBR-PAC) is
more efficient in treating matured leachate than employing traditional SBR system.
In the paper, the author reported that SBR-PAC has removal rates of 1.3%,
64.1%, 71.2% and 81.4% for Total dissolve solids (TDS), COD, colour and ammonia-
nitrogen, NH4-N while traditional SBR has removal rates of 1.7%, 25.1%, 51.6% and
82.5% for TDS, COD, colour and ammonia-nitrogen, NH4-N.
2.6.3.4 Rotating Biological Contactor (RBC)
One example of aerobic attached-growth biological treatment is the RBC which
consists basically closely spaced plastic disks placed horizontally on a slowly spinning
shaft. Around 40% of the disks are submerged and 2 to 4mm thick of slime layer
develops and envelopes the disks in which the alternately contact with atmosphere for
oxygen adsorption and to contact with organic matters in the wastewater (Mahvi,
2008). According to Kumar. (2013), it is reported that the disks on the RBC has a basis
of excellent COD removal of 65% and biological stability. This type of treatment
method is more suitable in developing countries like India as the operational cost is
low however it requires energy for the disks to rotate by using an electrical motor
which is housed to the shaft of the disks.

38
2.6.3.2 Leachate Phytoremediation
Using plants and constructed wetlands in natural system as to treat leachate is a
relatively new method. This method is known as phytoremediation and is being
defined as the use of potential from natural or actively managed soil-pant system to
degrade, detoxify and inhibit toxic element which could be present in leachate.
Constructed wetland basically consist mixture of gravel, soil and sandy beds as a
media for plants growth. As leachate or wastewater flows through the constructed
wetland, the root of the plants together with the bacteria which attached to the root of
the plants and in the soil together purify and adsorb pollutants in leachate as nutrient
source for biological growth. The use of phytoremediation is getting more popular in
leachate and wastewater treatment as constructed wetlands are low cost in operation
and maintenance, good adaptability and very stable in tropical climate.
Some authors have shown phytoremediation can reduce the concentration of
several pollutants like heavy metals however the process of plant roots in eliminating
pollutants in leachate is yet to be discovered and discussed. Figure 2.7 below shows
the set-up of typical phytoremediation system or constructed wetland (Madera and
Valencia-Zuluaga, 2009).
Figure 2.7: The Main Features of a Sub-Surface Constructed Wetland (SSCW)
(Madera and Valencia-Zuluaga, 2009)

39
CHAPTER 3
RESEARCH METHODOLOGY
Figure 3.1 shows the methodology flowchart. Initially, the leachate sample was
collected from Papan Landfill (Papan district) and the sludge used to treat Papan
leachate was collected at the sedimentation tank No.4, from Tian Siang Oil Mill (Air
Kuning) Sdn. Bhd a palm oil mill in Perak. Leachate and POME sludge samples were
tested for initial characteristics. For leachate, the measured characteristics include pH,
COD, BOD, colour, turbidity, total suspended solids (TSS), Ammoniacal Nitrogen
(NH3-N), volatile solids (VS). The characteristics for POME sludge were pH, COD,
BOD, Mixed Liquor Suspended Solids (MLSS) and Mixed Liquor Volatile Suspended
Solids (MLVSS). The SBRs was set up and a test run was conducted to ensure the
SBRs is working and as an effort to cultivate the activated sludge. Later, post treatment
involving coagulation by using ALUM was conducted to further treat the leachate by
using the “Jar Test” method to determine the optimal pH and dosage of coagulation.

40
Leachate Collection and
Characterization
POME Sludge Collection
and Characterization
The flow chart summarized the procedure of experimental as shown in Figure 3.1
Figure 3.1: Methodology Flowchart
Fix Contact Time Varied Aeration
Rate
Experimental Set-Up (SBR)
Experimental Run –
Sludge Acclimation in
SBR
Experimental Run –
Leachate Treatment in
SBR
Data Analysis and Discussion
Post Treatment –
Coagulation of Leachate
Optimal pH Optimal Dosage
Cost Estimation
Report Writing

41
3.1 Leachate Collection and Site Location
The leachate samples were collected from “Tapak Pelupusan Sisa Pepejal, Wilayah
Ulu Johan Papan” (Papan Sanitary landfill) at Papan district, Perak, Malaysia. The
landfill site location is shown in Figure 3.2.
Figure 3.2: Papan Sanitary Landfill Site Location from Universiti Tunku Abdul
Rahman, UTAR Perak Kampus (extracted from Google Maps, Accessed on 10th
July 2016)
The distance between UTAR Kampar to Papan Sanitary Landfill is 36.4 km
following the shortest path provided. Papan Sanitary Landfill is a level 4 sanitary
landfill which will be equipped with proper leachate collection and treatment systems,
landfill bio-gas collection and electric generation systems and material recovery

42
facility (MRF) upon completion of the project. Since July 2015, Papan landfill has
been operating with 10 acres of land and has a larger area of 560.24 acres or 226.73
hectares compared to the older landfill which has only 96 acres in size. Papan landfill
serves more capacity to receive dumps at a rate of 800 tonnes a day as the new site has
53,516 residents and 34 housing estates within a 5 km radius which include. Besides
that, the lifespan of the landfill is projected to last for 35 years (Negeri Perak, 2013).
The collection of leachate sample based on the weather before one week of the
collection date is important as any heavy or persistent precipitation will largely affect
the quality of the freshly collected leachate. The week before 1st batch leachate
collection on the 11th July 2016 was sunny with minimal precipitation to ensure the
best possible quality of undiluted leachate from Papan landfill site. Subsequent landfill
leachate samples collection was done on the 11th August and 28th November 2016
respectively. The Figure 3.4 shows leachate sample was collected by using a 6.0 L
polypropylrene bottle (PET) from the leachate collection stream beside the covered
landfill cell while figure 3.4 shows the on-site parameter analysis of the fresh leachate
in Papan landfill using the CyberScan PCD 650 Multi-Parameter, Singapore. After the
collection of the sample, the sample was immediately transported back to UTAR
Faculty of Engineering and Green Technology Environmental Laboratory (EV-Lab)
and stored at a temperature of 4 oC as to minimize any possible means on any chemical
reactions and the biodegradation of the leachate sample (APHA, 2005).

43
Figure 3.3: Leachate Sample Collection Using A 6.0 L Polypropylrene (PET)
Bottle
Figure 3.4: Leachate Sample On-Site Parameter Analysis Using EUTECH
CyberScan PCD 650 Multi-Parameter, Singapore

44
3.2 Sludge Collection at Palm Oil Mill and Site Location
The sludge sample from palm oil mill wastewater treatment facility was collected from
Tian Siang Oil Mill (Air Kuning) Sdn. Bhd. on 15th July 2016 which locates in the
District of Batang Padang, Perak, Malaysia. The site collection is shown in the Figure
3.5.
Figure 3.5: Tian Siang Oil Mill (Air Kuning) Sdn Bhd Site Location from
Universiti Tunku Abdul Rahman, UTAR Perak Kampus (Extracted from
Google Maps, Accessed On 18th July 2016)
Tian Siang Sdn Bhd is a palm oil manufacturer in which the company group
owned five palm oil mills in Malaysia namely Tian Siang Oil Mill Sdn Bhd (1995),

45
Tian Siang Oil Mill (Perak) Sdn Bhd (1997), Tiang Sian Oil Mill (Air Kuning) Sdn
Bhd (2000), Pujaan Makmur Oil Mill Sdn Bhd (2002) and Tian Siang Oil Mill (Pahang)
Sdn Bhd (2005). Tian Siang Oil Mill (Air Kuning) division is located 23.8 km from
UTAR Kampar. The mill was commissioned in 2000 with FFB (Fresh Fruit Bunches)
with production capacity of 60 tons/hr and up to 120 tons/hr of palm oil upon
expansion of the plant. The plant is well equipped with bio-gas anaerobic digester
facilities which capture the methane rich biogas from POME and use the gas as energy
source for heat and electrical energy production. The POME plant has its own
treatment facilities as shown in Figure 3.6 and the (POME) active sludge is freshly
collected from sedimentation tank No.4 and Figure 3.7 shows the POME sludge was
collected with a 5.5 L polypropylrene (PET) bottle at the POME sludge sedimentation
tank sampling-out pipe from sedimentation tank no.4.
Figure 3.6: Sedimentation Tank No.4 at Tian Siang (Air Kuning) Sdn Bhd

46
Figure 3.7: Collection of POME Sludge with A 5.5 L Polypropylrene (PET)
Bottle
3.3 Leachate Characteristics and Palm Oil Mill Effluent (POME) Sludge
Analytical Methods
The generation and composition of leachate are largely influenced by local climate
condition (rainfall and temperature), site topography (flat land or hill), site hydrology,
availability of oxygen, age of landfill and the rate biological and chemical degradation
of waste in the landfill (Yu, 2007). In general, there are several representations that
can characterise landfill leachate which need to be determined to test the toxicity of
the leachate namely pH, chemical oxygen demand (COD), biochemical oxygen
demand (BOD), ammoniacal nitrogen (NH3-N), colour, turbidity and suspended solids
(SS) using the standard method (APHA, 2005).
In general, the testing and characterisation for sludge and activated sludge are
pH, chemical oxygen demand (COD), ammoniacal nitrogen (NH3-N), suspended solid
(SS), mixed liquor suspended solids (MLSS) and mixed liquor volatile suspended
solids (MLVSS). Both leachate and POME sludge information are crucial for the types
and design of the treatment operations.

47
3.3.1 pH
The pH in both samples was measured using the pH meter, Hanna HI 2550, Romania
as shown in Figure 3.8. 100mL of sample was transferred into a 100 mL beaker. Before
each sample was tested, the pH meter was calibrated using the three buffer solutions
at pH 4.0, pH 7.0 and pH 10.0 to ensure higher degree of accuracy of the meter. Before
the reading was taken, the sample was stirred to ensure homogeneity in sample, then
the pH probe was rinsed with distilled water and was inserted into the sample to obtain
a stable reading. Each of the pH reading was taken by repeating the stirring of sample
and rinsed the pH probe with distilled water.
Figure 3.8: pH Meter (Hanna HI 2550, Romania)

48
3.3.2 Chemical Oxygen Demand (COD)
The Chemical Oxygen Demand was tested according to the HACH Reactor Digestion
Method 8000 in the HACH Water Analysis Handbook (Hach, 2005). The COD heat
reactor DRB 200, Germany as shown in Figure 3.8 was switched on and preheated to
250oC before the samples together with the HR COD Digestion Reagent Vial was
placed into the reactor. For samples preparation, 2 ml of deionized water was added
into the HR COD Digestion Vial using pipette as blank sample. 2 ml of samples with
different dilution ratio of 1:1 (Raw), 1: 10, 1: 50 for leachate and 1: 10, 1:50 and 1:
100 for POME sludge was pipetted into different HR COD Digestion Vial and mixed
gently before placing into the COD reactor. The Vials were allowed to heat at 250 oC
for 2 hours. After heating, the vials were taken out from the COD reactor and were
cooled down to room temperature for 20 minutes. After cooling, the vials were then
proceed for COD testing using the spectrophotometer, DR 6000, Germany as shown
in Figure 3.9. The removal efficiency in percentage, % can be calculated by the
following below equation 3.1:
Percentage of COD removal efficiency, % = 𝐼𝑛𝑖𝑡𝑖𝑎𝑙 𝐶𝑂𝐷−𝐹𝑖𝑛𝑎𝑙 𝐶𝑂𝐷
𝐼𝑛𝑖𝑡𝑖𝑎𝑙 𝐶𝑂𝐷 × 100%
(3.1)
Figure 3.9: COD Heat Reactor (DRB 200, Germany)

49
Figure 3.10: Spectrophotometer (DR 6000, USA)
3.3.3 Biochemical Oxygen Demand (BOD5)
The Biochemical Oxygen Demand, BOD5 measurement of leachate sample is crucial
to identify the age of the landfill leachate. Young landfill leachate in general results in
higher value of BOD5 level compared to old landfill leachate which gives lower value
of BOD5. The BOD5 level. The BOD5 for leachate samples were diluted and tested
with different dilution ratio of 1: 100, 1:500 and 1:1000 with duplicate samples using
dilution method (APHA, 2005). The diluted samples were transferred and allowed to
over flow into 300 ml BOD bottles. The initial dissolved oxygen (DO0) of each sample
was measured by DO 6+ Dissolved Oxygen Meter, EUTECH, Singapore as shown in
Figure 3.11. The bottles were then immediately sealed tightly with parafilm to prevent
air disturbance and aluminium foil to prevent growth of photoautotrophs. The bottles
were then placed into the BOD incubator FOC 225E, Europe as shown in Figure 3.12
for 5 days at 20 oC. The final dissolved oxygen, DO5 was measured after the 5 days
incubation period. The BOD5 was calculated based on the below Equation 3.2:
BOD5 = 𝐷𝑂0−𝐷𝑂5
𝐷𝑖𝑙𝑢𝑡𝑖𝑜𝑛 𝐹𝑟𝑎𝑐𝑡𝑖𝑜𝑛 (3.2)
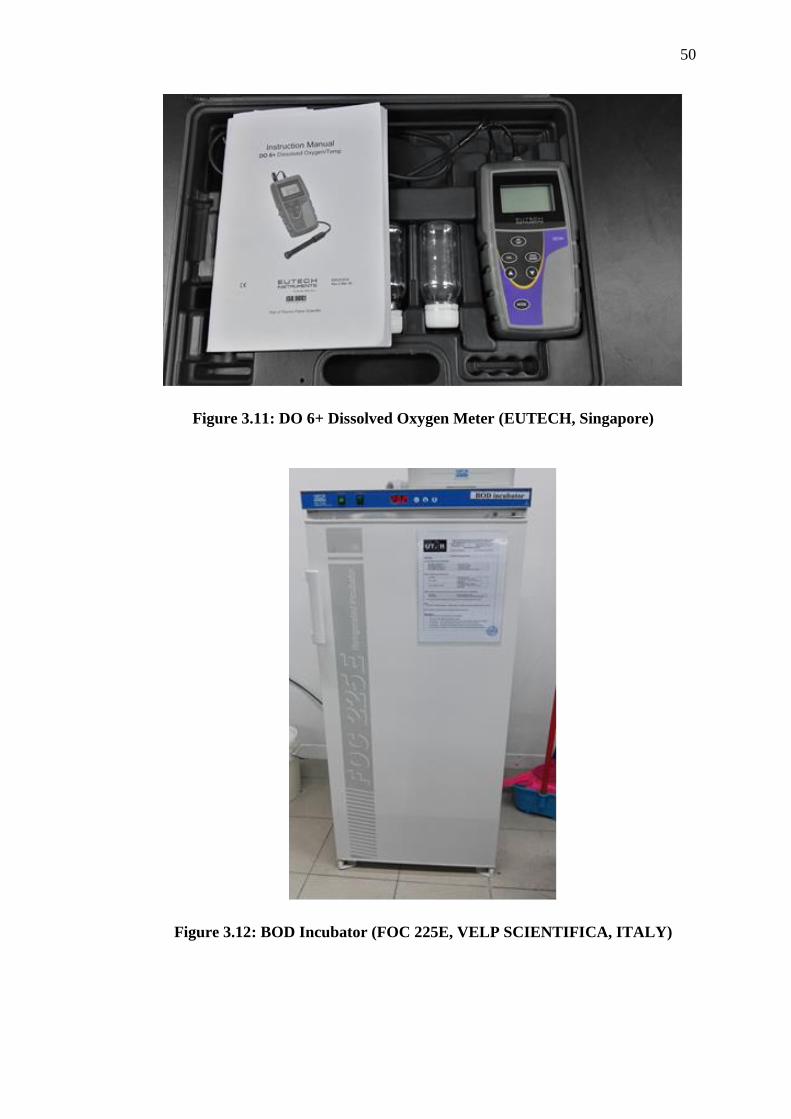
50
Figure 3.11: DO 6+ Dissolved Oxygen Meter (EUTECH, Singapore)
Figure 3.12: BOD Incubator (FOC 225E, VELP SCIENTIFICA, ITALY)

51
3.3.4 Ammoniacal Nitrogen (NH3-N)
The ammoniacal-nitrogen as nutrient indicator in leachate and POME sludge samples
were measured by Nessler Method (APHA, 2005). The samples were then shaken
several times after each time adding the reagents to ensure homogeneous mixing
before measured. The blank sample and other samples were filled in an empty cuvette.
The cuvette containing the blank sample was placed to set as zero in the UV
spectrophotometer DR 6000, Germany, subsequently press read on the screen to take
measurements of each samples in the cuvette of NH3-N in mg/L.
3.3.5 Colour
The colour of both leachate and POME sludge samples were measured according to
the standard method of Platinum-Cobalt (PtCo) provided by Hach Company. Cleaned
empty glass COD HR vials were filled with the diluted samples and one blank vial
which contains distilled water only was prepared as blank for the test. The blank
sample was first placed in position as zero in the spectrophotometer, DR 6000,
Germany by selecting the program “Colour 465nm” at 465nm wavelength. The colour
value of each samples tested was obtained in Platinum-Cobalt scale, PtCo.
3.3.6 Turbidity
The turbidity measurement of leachate and POME sludge samples was done by using
the turbidity meter, Hanna HI 98703, Romania as shown in Figure 3.13. Before each
sample was tested, the meter was calibrated to ensure higher degree of accuracy of the
test results. After the calibration, the diluted samples were filled until the marked line
in the 10 ml sample cells provided together with the meter. Before the cells were
placed into the meter, the cells were wiped clean with a towel. The turbidity
measurement value was in Nephelometric Turbidity Units, NTU.

52
Figure 3.13: Turbidity Meter (Hanna HI 98703, Romania)
3.3.7 Suspended Solid
The suspended solids measurement was done using The Photometric Method, method
8006 according provided by Hach Company. The equipment used was the
spectrophotometer, DR 6000, Germany. 5 ml of distilled water as blank and the diluted
samples were transferred into clean empty glass vials. The program “Suspended Solids
750mg/L” was chosen and the blank glass vials first was placed into the
spectrophotometer, DR 6000, Germany to set as zero. The results were measured in
mg/L.
3.3.8 Heavy Metals
The Papan landfill leachate sample containing heavy metals are analysed by the
Inductively Coupled Plasma Mass Spectrometry (ICP-MS PERKIN ELMER
NEXIONTM 300Q, USA) as shown in Figure 3.14. Heavy metals like Manganese (Mn),
Iron (Fe), Nickel (Ni), Copper (Cu), Silver (Ag), Lead (Pb), Zinc (Zn), Arsenic (As),
Selenium (Se), Cadnium (Cd) and Barium (Ba) were tested using the ICP-MS. Before

53
analysis, standard stock solutions of 10 ppb, 500 ppb and 1000 ppb together with a
blank solution (Ultrapure water) were prepared for calibration of the ICP-MS. The
leachate sample was filtered by 0.45μm filter syringe paper and diluted with a dilution
factor of 100 and 1000 to ensure all readings fall within the ICP-MS’s measurable
range and lastly by adding 1% of nitric acid (HNO3). After labelling and preparing all
standard stock solutions and diluted leachate samples, the samples was keyed into the
computer which connects to the ICP-MS. The samples were tested and all data were
saved in the computer database.
Figure 3.14: Inductively Coupled Plasma Mass Spectrometry (ICP-MS
PERKIN ELMER NEXIONTM 300Q, USA)
3.3.9 Mixed Liquor Suspended Solids, MLSS and Mixed Liquor Volatile
Suspended Solids, MLVSS
The MLSS and MLVSS were measured by Standard Methods (APHA, 2005). This
test is solely for POME sludge sample as to determine the amount of food and the
amount of microorganism present in the sample. The MLSS is the weight of the total
suspended solids in the mixed liquor which consist of organic matter (microorganisms
mass) and non-organic, non-biodegradable matter. In general, the MLVSS value
composed of 70 – 80% of the MLSS and both parameters can have used to figure out

54
the Food to Mass, F:M ratio to ensure sufficient supply of substrate to the
microorganisms in the reactor.
A small 25 ml crucible together with 21mm, 1.2µm pore size 261 Glass
Microfibre Filter, France (The filter was placed into the crucible) as shown in Figure
3.15 were placed into the furnace at 550 oC as shown in Figure 3.17 for 15 minutes.
After furnace, the crucible with filter paper were allowed to cool down in the oven as
shown in Figure 3.18 for 15 minutes at 105 oC and then is transferred into a desiccator
for 20 minutes to cool down to room temperature and subsequently the initial mass (a)
of crucible with the filter were weighted using the analytical balance, Sartorius,
Germany and recorded in grams, g shown in Figure 3.16.
After weighing, the filter paper is filtered with distilled water by using a filter
funnel together with a suction pump and 1 ml of sludge sample was transferred to the
filter paper for filtering. After filtering, both the crucible and the filter was placed into
the Heating and Drying Universal Oven, Germany for 2 hours. Then, the crucible with
the filter was allowed to cool down to room temperature in the desiccator for 15
minutes and the mass (b) was obtained by weighing the crucible with the filter. The
crucible with the filter is then furnace at 550 oC in the Electric Muffle Furnace,
LabTech, India for 15 minutes and were allowed to cool down to room temperature in
the desiccator for 20 minutes. The last weight (c) was weighted and recorded.
The value in mg / L of MLSS and MLVSS are calculated based on the below equation
3.3 and 3.4:
Weight (a) = weight of crucible + filter paper
Weight (b) = Weight of crucible + filter paper + 1 mL of sludge, after heated at 105
oC
Weight (c) = Weight of crucible + filter paper + 1 mL of sludge, after heated at 550
oC

55
MLSS, amount of microorganisms = (b) – (a) in grams, g/mL ×1,000 𝑚𝑔
1 𝑔 ×
1,000 𝑚𝑙
1 𝑙
MLSS = mg / L (3.3)
MLVSS, amount of food = (c) – (b) in grams, g/mL ×1,000 𝑚𝑔
1 𝑔 ×
1,000 𝑚𝑙
1 𝑙
MLVSS = mg / L (3.4)
Figure 3.15: 21mm, 1.2µm pore size 261 Glass Micro-fibre Filter (Filtres
Fioroni, France)
Figure 3.16: Entris 124-1S Analytical Balance (Sartorius, Germany)

56
Figure 3.17: Electric Muffle Furnace (LEF-P type, LabTech, India)
Figure 3.18: Heating and Drying Universal Oven (Memmert, Germany)
3.3.10 Temperature
The temperature of the reactor was measured using the Infrared Thermometer by Intell
Instruments Plus, Houston, Texas as shown in the Figure 3.19 below. The temperature
of the feed (leachate) and other solutions or samples in this research were measured
using the integrated temperature probe in the pH meter by Hanna HI 2550, Romania
in figure 3.8.

57
Figure 3.19: AR300+ Infrared Thermometer (SMART SENSOR, Intell
InstrumentsTM Plus, Houston, Texas)
3.3.11 On-Site Parameter Analysis
The CyberScan PCD 650 Multi-Parameter, EUTECH Singapore as shown in Figure
3.20 was brought together with other necessary equipment to Papan landfill to conduct
the On-Site Parameter test for the fresh leachate sample. This test in important as to
measure the basic changes of the fresh leachate collected on the landfill site compared
to the stored leachate samples in the lab refrigerator. The Multi-Parameter was well
calibrated using standard stock solutions which were present in the box as well as other
standard stock solutions present in the laboratory. After calibration, 4 double A size
(AA) batteries were installed into the Multi-Parameter before the day going to the
landfill to conduct On-Site testing while collecting fresh leachate samples. Leachate
parameter namely pH, temperature, conductivity, resistivity, dissolved oxygen (DO),
oxidation reduction potential (ORP), total dissolved solids (TDS), salinity and ion
were tested both On-Site and Off-Site using the Multi-Parameter. The Multi-Parameter
was calibrated each time before each test to ensure a more accurate reading acquired.

58
Figure 3.21: CyberScan PCD 650 Multi-Parameter (EUTECH Instruments,
SINGAPORE)
3.4 Experimental Set-Up
In this research, there were six 1.5 L mineral plastic bottle bio-reactors made from
Polypropylrene (PET) in which being held firmly by clamp attached to a retort stand.
There were 3 sets of plastic tubes with different purpose which were inserted into the
reactor at different lengths for aeration, feeding / withdrawing and sludge collection
respectively. The plastic tubes were secure and held tightly by a modified plastic cap
which was placed on top of the opening of the reactor and there were valves attached
to the tubes. To provide proper mixing and sufficient DO in the reactor, each SBR
employed a set of pump with a flow meter connected between the pump and the reactor
to control the air-flow rate as well as to provide constant aeration and mixing during
the reacting period. The reactors were divided into 3 groups comprising each 2 SBR
with flow-rate of 1 L/min, 3 L/min and 5 L/min respectively.
Figure 3.21 shows the set-up of equipment and apparatus for a complete set of
a SBR. There were 6 sets of SBR in this experiment; each of the one pair operating for
a specific air flowrate of 1 L/min, 3 L/min and 5 L/min respectively.
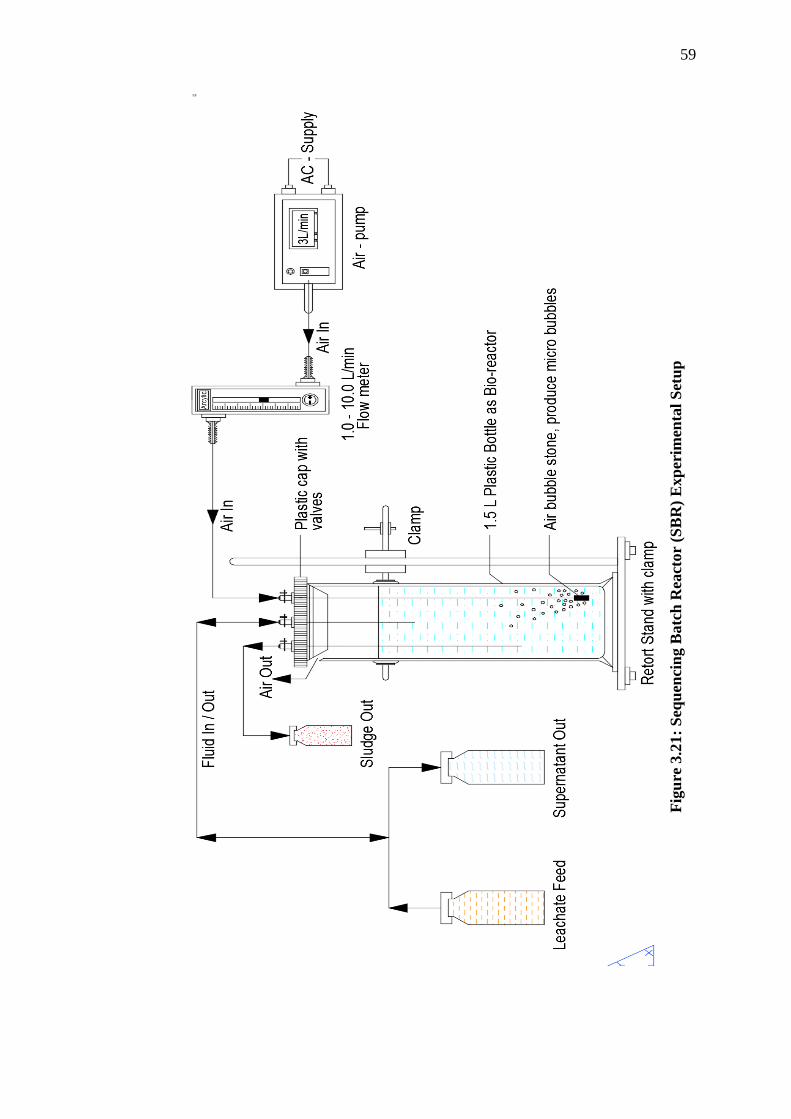
59
Fig
ure
3.2
1:
Seq
uen
cin
g B
atc
h R
eact
or
(SB
R)
Exp
erim
enta
l S
etu
p

60
3.5 Experimental Run
The experiment run was conducted as an effort to study the cultivation process of
bacteria in the SBR. The cultivation was done by a 10-15 days period as to allow the
sludge to adapt to the environment. Each of the 1.5 L plastic bottle was filled with 720
ml of POME sludge and 80 ml of Papan landfill leachate which gives a mixing ration
of 1:10 of landfill leachate to palm oil mill sludge and has a working volume of 800
mL. During the sludge cultivation period, the sequential operation of the reactor
comprises filling and mixing (20 minutes), react and aeration (22 hours), settling (90
minutes) and drawing (10 minutes) which the complete cycle of the SBR was a 24
hours cycle. Figure 3.22 illustrates the sequential stage of a complete 24 hours cycle
of SBR in this research.
Figure 3.22: A Complete Cycle of SBR
During the cultivation period, 480 mL of leachate was allowed to warm up to
room temperature and the pH of leachate was adjusted to 7.50 as the initial pH of the
leachate was at 8.44 which is not suitable for bacteria acclimation. The contact time
was set to be 22 hours and the aeration rate was set to be at 1.0 L/min, 3.0 L/min and
5.0 L/min for the respective groups of the SBR. An aquarium bubble stone was
attached to each end of the aeration tube in the SBR to produce micro bubbles to
enhance the dissolve oxygen (DO) and to improve the even mixing of sludge with the
medium in the reactor. The SBR was operating at room temperature condition (23 oC
– 26 oC). The 1 L/min air was supplied by an air pump. The air flow rate was manually
controlled by an air flow meter (SHLLJ ACRYLC Flow meter, Model: LZM-6, Range:
0 – 10 L/min).
3 mL of sludge sample was extracted from each SBR using a pipette right after
the aeration was stopped. The sludge samples were collected into cleaned empty COD
vial once every two days during the 10 days cultivation period and were immediately
stored in the fridge at 4 0C for future analysis. The top effluent was taken from each
22 hrs 1.5 hr 0.5 hr 0.5 hr
Feeding +
Mixing Aeration + Reacting Settling
Decanting +
Sampling

61
SBR after 90 minutes of settling through a thin plastic tube into a sampling bottle (180
mL) once per day and was immediately stored in the fridge at 4 0C for further analysis.
Daily desludging of 25 mL of fresh sludge right after the aeration for each SBR was
conducted and fresh sludge sample was continued to be collected once every two or
three days after the 10 days’ cultivation period.
3.5.1 Food-To-Microorganism Ratio (F/M Ratio)
F/M ratio or Food-to-Microorganism ratio affects the growth of microbes in SBRs. In
this terminology, Food (the “F” in F/M) is the availability of readily biodegradable
organic matters or BOD5 or partially COD concentrations in the wastewater per day
per quantity of Microorganisms (the “M” in F/M) (Gerardi, M.H., 2002). The amount
of bacteria in an activated sludge system is very dependent to the amount of food in
the infeed of the system. If the amount of food increases per day, the amount of
bacterial within the system will increase. The general formula for calculating amount
of Food, Microorganisms and F/M ratio are presented in equations 3.5, 3.6 and 3.7
respectively:
Food = Infeed concentration of COD or BOD5 (mg/L) × Influent Volume per day (L)
(3.5)
Microorganisms = MVLSS concentration (mg/L) × Reactor Working Volume (L)
(3.6)
F/M = 𝐵𝑂𝐷5 (
𝑚𝑔
𝐿) ×Influent Volume per day (L)
𝑀𝑉𝐿𝑆𝑆 (𝑚𝑔
𝐿) × Reactor Working Volume (L)
(3.7)
62
3.5.2 Sludge Retention Time (SRT)
SRT, Sludge retention time or solid retention time is the exchange ratio of solids mass
in a reactor divided by the solids exiting the activated sludge system per day. Adequate
SRT is crucial for SBR as is one of the design factor for nutrient-removal process and
the SRT should be based on the aeration time during a complete cycle of the SBR
(Poltak, R.F., 2005) (Davies, P.S., 2005) The SRT formula:
SRT = 𝑅𝑒𝑎𝑐𝑡𝑜𝑟 𝑊𝑜𝑟𝑘𝑖𝑛𝑔 𝑉𝑜𝑙𝑢𝑚𝑒 (𝐿)
Desuldge or Volume of sludge leaving per day (L/day) (3.8)
3.5.3 Hydraulic Retention Time (HRT)
HRT also known as hydraulic residence time is the exchange ratio of liquid volume in
a reactor divided by the liquid (effluent) exiting the activated sludge system per day.
(NPTEL.ac.in., 2013) The HRT formula is as below (Davies., 2005):
HRT = 𝑅𝑒𝑎𝑐𝑡𝑜𝑟 𝑊𝑜𝑟𝑘𝑖𝑛𝑔 𝑉𝑜𝑙𝑢𝑚𝑒 (𝐿)
Decant or Volume of effluent leaving per day (L/day) (3.9)
3.6 Post Treatment – Coagulation of Leachate
The purpose of post treatment is to further treat the effluent from the SBR as to
increase the treatment efficiency of the sequencing batch reactor. Aluminium Sulphate,
ALUM with chemical formula: Al2 (SO4)3.16H2O and molecular weight of 630.39
g/mole was used as coagulant for post treatment of the effluent by SBR. Effluent
samples from SBR were transferred into 50 mL beakers and were placed in the KS
4000 I control orbital shaker as shown in Figure 3.23 to run the post treatment. Jar test
method was used to determine the optimum pH and dosage of the leachate sample and
ALUM respectively. During the jar test, each of the sample in a 50 mL beakers were
placed into the orbital shaker with rapid mixing: 120 RPM for 3 minutes, slow mixing:
20 RPM for 20 minutes and settling time of 60 minutes.

63
Figure 3.23: KS 4000 I control Orbital Shaker (IKA@ Werke Staufen,
Germany)

64
CHAPTER 4
RESULTS AND DISCUSSION
4.1 Leachate Characteristics
The raw leachate samples were collected three times from Papan landfill site on 11th
July, 11th August and 28th November of 2016. Before characterization, the leachate
sample was taken out from the laboratory refrigerator and placed into a water bath at
26.0 oC for 20 minutes to ensure the sample was heated to room temperature in order
to get the most relevant results. Table 4.1 summarizes the characteristics of the raw
leachate.
Based on Table 4.1, the raw leachate sample collected from Papan landfill were
significantly high in COD, BOD5, NH3-N, Colour, Turbidity, Suspended Solids and
other heavy metals like Lead, Copper, Zinc, Iron, Silver, and Selenium. Based on the
main parameter of BOD5/COD, the raw leachate sample is classified to be intermediate
leachate. The values range indicates the minimum and maximum concentration of
each parameter for the three samples collected at different period.
Table 4.1 Raw Leachate Samples Characterization
Parameter Unit Value Range Malaysia Discharge
Standards
pH - 8.34 - 8.44 6.0 – 9.0
Temperature oC 25.3 -26.1 40
COD mg/L 3,530 – 6,420 400
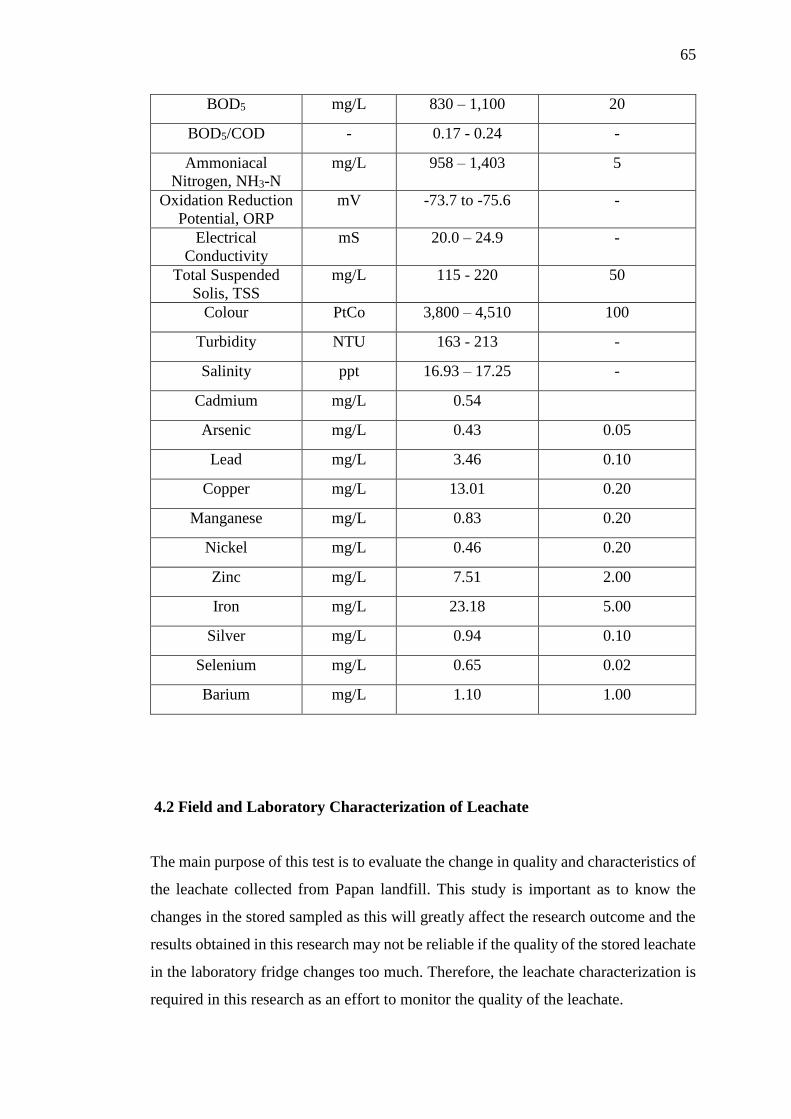
65
BOD5 mg/L 830 – 1,100 20
BOD5/COD - 0.17 - 0.24 -
Ammoniacal
Nitrogen, NH3-N
mg/L 958 – 1,403 5
Oxidation Reduction
Potential, ORP
mV -73.7 to -75.6 -
Electrical
Conductivity
mS 20.0 – 24.9 -
Total Suspended
Solis, TSS
mg/L 115 - 220 50
Colour PtCo 3,800 – 4,510 100
Turbidity NTU 163 - 213 -
Salinity ppt 16.93 – 17.25 -
Cadmium mg/L 0.54
Arsenic mg/L 0.43 0.05
Lead mg/L 3.46 0.10
Copper mg/L 13.01 0.20
Manganese mg/L 0.83 0.20
Nickel mg/L 0.46 0.20
Zinc mg/L 7.51 2.00
Iron mg/L 23.18 5.00
Silver mg/L 0.94 0.10
Selenium mg/L 0.65 0.02
Barium mg/L 1.10 1.00
4.2 Field and Laboratory Characterization of Leachate
The main purpose of this test is to evaluate the change in quality and characteristics of
the leachate collected from Papan landfill. This study is important as to know the
changes in the stored sampled as this will greatly affect the research outcome and the
results obtained in this research may not be reliable if the quality of the stored leachate
in the laboratory fridge changes too much. Therefore, the leachate characterization is
required in this research as an effort to monitor the quality of the leachate.

66
Table 4.2: Field and Laboratory Leachate Sample Characteristics Test
Comparison
Parameter Unit Value Changes, %
On-Site Off-Site
pH - 8.05 8.29 2.98
Temperature oC 35.3 25.3 28.33
Electrical
Conductivity
mS 23.88 23.50 1.59
Resistivity Ω 22.66 22.98 1.41
Dissolved
Oxygen, DO
mg/L 2.69 1.00 62.83
Oxidation
Reduction
Potential, ORP
mV -66.5 -76.2 14.59
Total Dissolved
Solis, TDS
ppT 22.11 21.77 1.54
Salinity ppT 17.34 16.98 2.08
Ion - 0 0 0
Table 4.2 shows that the quality of the leachate slightly changes after 2 week
of storage in a 4 oC laboratory fridge. The changes are shown in the leachate
characteristics value for on-site and off-site parameters in the table. However, there
are four parameters with significant changes which are taken into consideration
namely pH, temperature, DO and ORP which changes at 2.98 %, 28.33 %, 62.83 %
and 14.59 % after two weeks of storage. Bakar et al. (2012) stated that the nitrification
and denitrification are able to take place at very low temperature even at 4 oC which
is near to the cease of nitrification process however the author reported that
nitrification can occurred up to 40 oC. Nitrification process at 4 oC will be extremely
low. According to Gerardi (2002), the effect of temperature related to nitrification as
shown in the below Table 4.3. No growth of Nitrosomonas or Nitrobacter occurs
below 4 oC (Gerardi, 2002); which is the reason that very small percentage of
nitrifying bacteria are still active in the leachate which is stored in the laboratory fridge
at 4 oC.

67
Table 4.3: Nitrification Process Related to Temperature (Gerardi, 2002)
Temperature Effect upon Nitrification
< 5 oC Nitrification ceases
10 oC Significant reduction in rate, approx. 20% of rate at 30 oC
16 oC Approx. 50% of nitrification rate at 30 oC
28 - 32 oC Range of optimal temperature
> 45 oC Nitrification ceases
The pH of the stored leachate increases from 8.05 to 8.29 after 2 weeks of
storage is mainly due to the denitrification process which produces OH- base during
the reduction of nitrate, NO3- as shown in the general equation below:
NO3- + bCOD N2 + CO2 + H2O + OH- + New Cells
(4.1)
Wiszniowski et al. (2006) reported that 3.57 g of alkalinity and 0.45 g of new
cell were produce upon the reduction of per gram of NO3 – N in wastewater under
anoxic or anaerobic condition. Therefore, the overall pH of the leachate sample will
increase with time in the 4 oC storage.
The DO in the stored leachate sample greatly reduced from 2.69 mg/L to 1.00
mg/L as this is due to the consumption of dissolved O2 during the activity of bio-
degradation of organic waste in the stored leachate over time. In general, they are many
natural occurring aerobic microorganisms in the leachate to degrade organic waste and
in other sources of wastewater. The below equation shows the general equation of the
degradation of organic matters in water:
Organic matter + O2 + Nutrients CO2 + H2O + C5H7NO2 + other products
(4.2)
Where C5H7NO2 represents the newly produced cells (Strande et al, 2014).
Denitrifiers

68
The ORP, oxidation-reduction potential value indicates the amount of readily
oxidized or reduced compounds in wastewater. The negative value of the ORP
indicates the water medium has more compound to be reduced and vice versa for the
positive value in the ORP readings. Denitrification process promotes more negative
ORP as the process reduces nitrate, NO3- into nitrogen gas (Mark Prein, 2012). The
increase in the negativity of the ORP value after 2 weeks in the leachate indicates the
denitrification process is active.
4.3 Palm Oil Mill Sludge Characteristics
The palm oil mill sludge was collected twice from Tian Siang (Air Kuning)
Sdn Bhd Oil Mill at sedimentation tank No.4 after the anaerobic digester tank on the
15th July and 31st October of 2016 respectively. The first collection was used for the
characterization of the POME sludge and testing the SBR bio-reactor while the second
collection was used to cultivate and undergo acclimation process of the sludge to treat
leachate. The Table 4.3 below summarized the measured characteristics of the POME
sludge from Tian Siang Oil Mill. The value range indicates the minimum and
maximum concentration of each parameter for the two samples collected at different
period.
Table 4.4: Palm Oil Mill Sludge Sample Characterization
Parameter Unit Value
pH - 7.40 - 7.44
Temperature oC 26.1
COD mg/L 10,870 - 13,600
Mixed Liquor Suspended
Solids, MLSS
mg/L 9,500 - 12,500
Mixed Liquor Volatile
Suspended Solids, MLVSS
mg/L 8,350 - 9,700
MLVSS/MLSS - 0.78 - 0.88
Ammoniacal Nitrogen, NH3-
N
mg/L 161-190
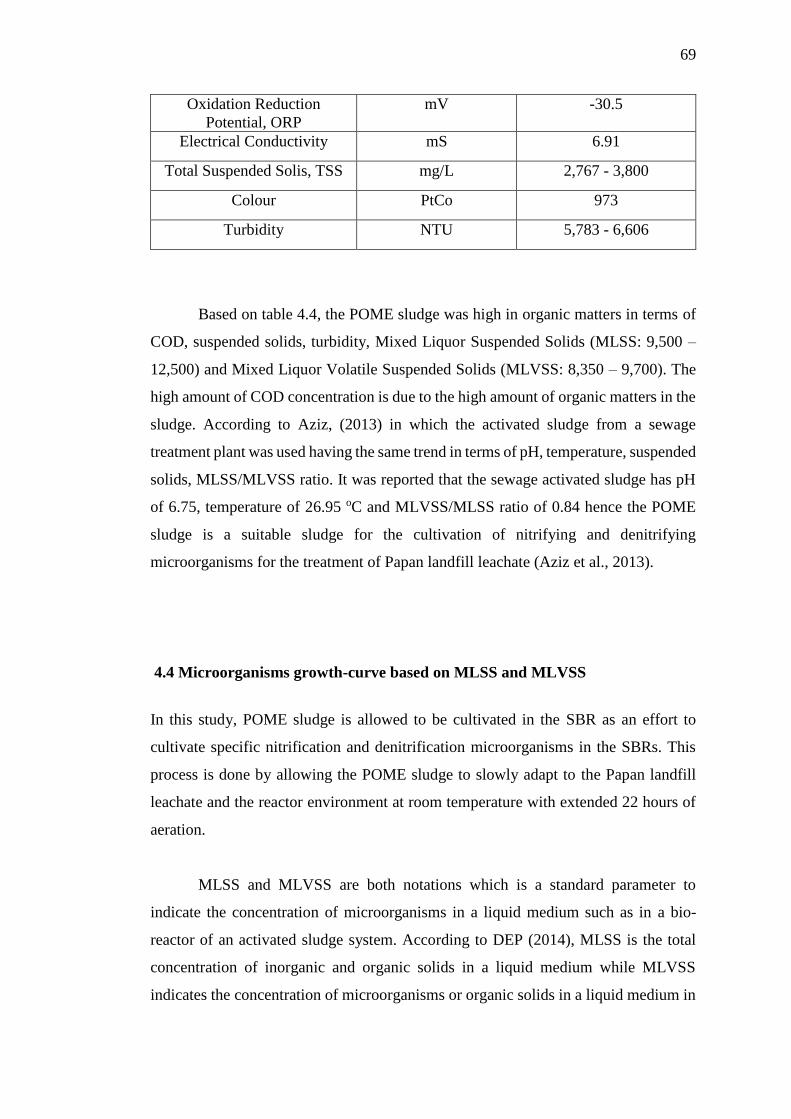
69
Oxidation Reduction
Potential, ORP
mV -30.5
Electrical Conductivity mS 6.91
Total Suspended Solis, TSS mg/L 2,767 - 3,800
Colour PtCo 973
Turbidity NTU 5,783 - 6,606
Based on table 4.4, the POME sludge was high in organic matters in terms of
COD, suspended solids, turbidity, Mixed Liquor Suspended Solids (MLSS: 9,500 –
12,500) and Mixed Liquor Volatile Suspended Solids (MLVSS: 8,350 – 9,700). The
high amount of COD concentration is due to the high amount of organic matters in the
sludge. According to Aziz, (2013) in which the activated sludge from a sewage
treatment plant was used having the same trend in terms of pH, temperature, suspended
solids, MLSS/MLVSS ratio. It was reported that the sewage activated sludge has pH
of 6.75, temperature of 26.95 oC and MLVSS/MLSS ratio of 0.84 hence the POME
sludge is a suitable sludge for the cultivation of nitrifying and denitrifying
microorganisms for the treatment of Papan landfill leachate (Aziz et al., 2013).
4.4 Microorganisms growth-curve based on MLSS and MLVSS
In this study, POME sludge is allowed to be cultivated in the SBR as an effort to
cultivate specific nitrification and denitrification microorganisms in the SBRs. This
process is done by allowing the POME sludge to slowly adapt to the Papan landfill
leachate and the reactor environment at room temperature with extended 22 hours of
aeration.
MLSS and MLVSS are both notations which is a standard parameter to
indicate the concentration of microorganisms in a liquid medium such as in a bio-
reactor of an activated sludge system. According to DEP (2014), MLSS is the total
concentration of inorganic and organic solids in a liquid medium while MLVSS
indicates the concentration of microorganisms or organic solids in a liquid medium in

70
which MLVSS is about 70% or 80% of MLSS. The MLSS concentration in a typical
conventional activated sludge system ranges between 2,000 mg/L to 4,000 mg/L. The
fresh POME sludge have initial MLSS and MLVSS concentrations at 9,500 - 12,500
mg/L and 8,350 - 9,700 mg/L respectively in which these abnormally high values of
biomass and solids will drop to a suitable range over time.
Activated sludge process can be found in domestic wastewater treatment plant,
leachate treatment plant and even in sedimentation tank of POME wastewater
treatment facility. The process employs microscopic organisms in aeration tank and
clarifier to remove or biodegradable wastes (Gerardi, 2005). Activated sludge
comprises of different kinds of complex active biological lifeforms which they interact
with one another upon receiving incoming waste (food). These active biological
microorganisms mainly are yeast, fungi, bacteria, protozoa and possible higher
organism like rotifers (Wiszniowski et al., 2006). According to Davies (2005), the
composition of activated sludge varies from source to source; the bacteria remains the
most dominant organisms of which may comprises 300 species or more with each
bacteria having the size between 0.5 – 2.0 µm. Under aerobic conditions, these
microorganisms use readily available dissolved oxygen, DO in the wastewater to
oxidize soluble, suspended or colloidal organic matters which are present in
wastewater like leachate (Wiszniowski et al., 2006).
Figure 4.1: Concentration of MLSS (mg/L) inside SBRs
01,0002,0003,0004,0005,0006,0007,0008,0009,000
10,00011,000
0 2 4 6 8 10 12 14 16 18 20 22 24 26 28 30 32 34 36 38 40 42 44 46 48
MLS
S (m
g/L)
Days
MLSS (SBR) vs Days
SBR-1(1L/min)
SBR-2(3L/min)
SBR-3(5L/min)

71
Figure 4.2: Concentration of MLVSS (mg/L) inside SBRs
Figures 4.1 and 4.2 show the trend for MLSS and MLVSS concentrations in
the SBRs during the research period respectively. As shown in Figure 4.2, the overall
microbial concentration of MLVSS value in the 3 reactors dropped to the second
lowest at day 21 and to the lowest at day 37 with values of 2,400 mg/L, 2,400 mg/L,
2,700 mg/L for SBR-1, SBR-2 and SBR-3 and 2,100 mg/L, 2,500 mg/L and 2,200
mg/L for SBR-1, SBR-2 and SBR-3 respectively. The main reason for the continual
dropped of MLVSS is due to most of the suspended solids from the sludge were carried
up and adhered to the surrounding cylindrical wall and the plastic cap of the reactor
by micro bubbles produced from aeration as shown in Figure 4.3; this is also the reason
for the fluctuation in SBR 1 in MLVSS at day 39 which had a sudden decrease in value
to 1,400 mg/L. Furthermore, the POME sludge in the SBRs may experience a “Lag”
phase in a bacteria growth curve in a batch system as shown in Figure 4.4.
0
1,000
2,000
3,000
4,000
5,000
6,000
7,000
8,000
0 2 4 6 8 10 12 14 16 18 20 22 24 26 28 30 32 34 36 38 40 42 44 46 48
MLV
SS (
mg/
L)
Days
MLVSS (SBR) vs Days
SBR-1(1L/min)
SBR-2(3L/min)
SBR-3(5L/min)

72
Figure 4.3: The Suspended POME Sludge and Other Solids Adhere On
the Wall and The Cap of the Reactor.
Figure 4.4: A Typical Growth Curve for A Bacterial Population in A
Batch Reactor (Maier, 2000)
According to Maier (2000), when a fresh inoculum or sludge was placed into
a fresh medium or to a new environment, the growth rate of these bacteria will be zero.
The “Lag” phase is due to the physiological adaptation of the cells to the new
environment and may involve more time to adapt to the new environment. A portion

73
of the bacterial population may die off and another portion will survive in this process
hence decrease in bacterial population or concentration. The continual drop of
microbial concentration in the reactors resulted in an acceptable MLVSS
concentration range from 2,000 mg/L to 4,000 mg/L as mentioned by DEP. (2014).
There was an increase of MLVSS concentration after day 39 of the suspended
activated sludge in the reactor and at day 44 the MLVSS concentrations in SBR-1,
SBR-2 and SBR-3 are 2,000 mg/L, 3,600 mg/L and 2,900 mg/L respectively. This
may due to the fact that the bacterial population inside the SBRs has adapted to the
environment and start to enter to the second phase which is the “Exponential” phase
based on figure 4.4. In this phase, the bacterial population start to double at a rate of
increase of cells which is proportional to the number of cells present in a given time
(Maier, 2000).
New cells or microbial biomass are synthesized together with other end
products like H2O, CO2 and other minerals during the biodegradation of the organic
matters present in wastewater. These organic matters can be represented parameters
like COD, BOD5, TOC and with other nutrients like Ammoniacal nitrogen, NH3+-N
and TKN which are present in wastewater in a concentrated amount. In this research,
organic matters are in terms of BOD5 and COD while nutrient is in term of NH3-N.
The below general equation 4.3 shows the mineralization of organic matters (CHONS)
through biodegradation (oxidation) and cell synthesis by microbes in wastewater
(Wiszniowski et al., 2006).
CHONS + O2 + Nutrients CO2 + NH3 + C5H7NO2
(4.3)
EPA. (1997) and Strande et al. (2014) present a more specific equation for the
conversion of fats, protein and carbohydrates organic materials by heterotrophic
bacteria in wastewater are presented in the equations 4.4 and 4.5:
i) Organic matter + O2 CO2 + H2O + Energy (ATP)
(4.4)
(Organic matter) (New bacterial cells)
Bacteria + enzymes

74
ii) Organic matter + P + NH3 + O2 + Energy (ATP)
New cell material
(4.5)
Where P represents phosphorus and ATP represents Adenosine Triphosphate is an
energy rich molecule which were synthesize within the microbes (bacteria) and will
be used for regeneration of new cells.
According to the above equations 4.4 and 4.5, this is the main reason that both
MLSS and MLVSS concentration start to increase after day 39 for the three SBRs as
the starts to double up after fully adapting to the environment in the SBRs. Bakar et al.
(2012) mentioned that in the aerobic pathway of biological oxidation of organic
matters, a portion of the organic wastes is used by microorganisms to synthesize and
to grow new organisms. Figure 4.5 below shows the schematic path way of the
biological oxidation of organic wastes.
Figure 4.5: Oxidation of Organic Matters Ion Wastewater Under Aerobic
Condition by Activated Sludge System (Bakar Et Al., 2012)
There are many factors affecting the performance of activated sludge in a SBR
system. These factors are crucial in controlling the performance of SBR for short-term
and long-term results. Factors such as F/M ratio, HRT (Hydraulic retention time), SRT
(Sludge retention time or sludge age), temperature, pH, and DO. F/M ratio or Food-
to-Microorganism ratio affects the growth of microbes in SBRs.
CO2 + H2O (End Products)
Organic matter
(Glucose etc.)
New microorganism
cell
Bacteria + enzymes
Non-biodegradable
residue
Energy
Synthesis
Endogenuous
Reaction
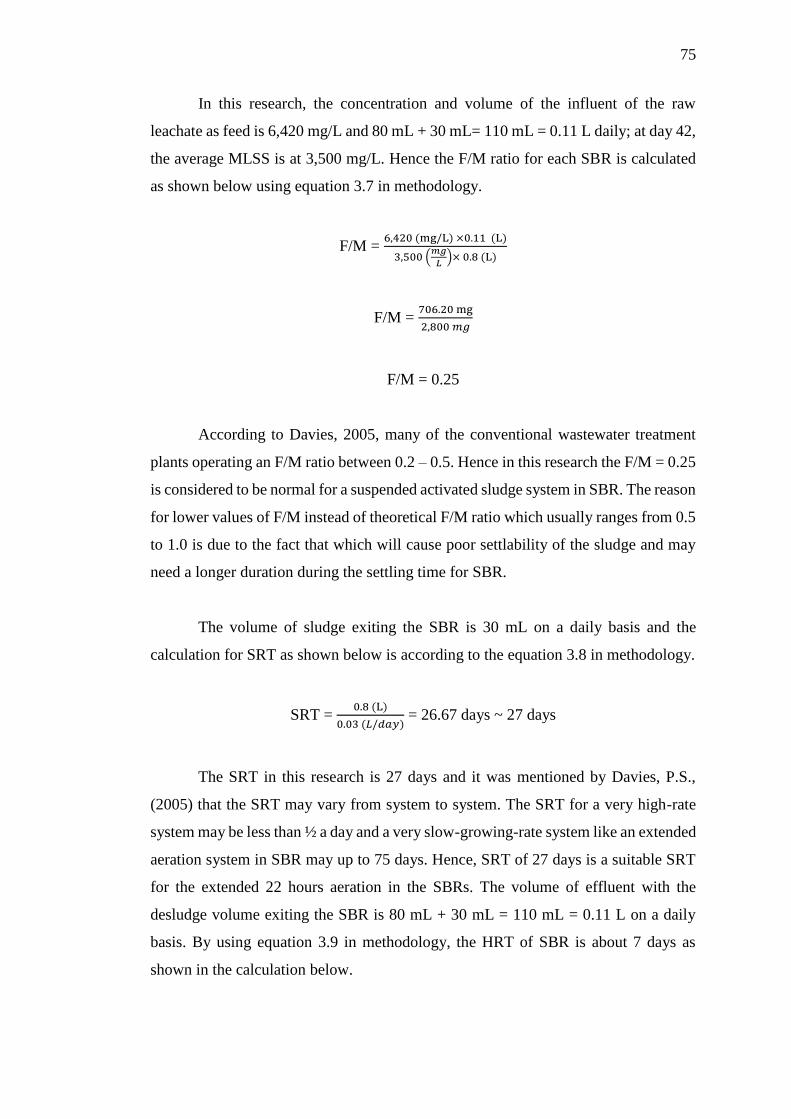
75
In this research, the concentration and volume of the influent of the raw
leachate as feed is 6,420 mg/L and 80 mL + 30 mL= 110 mL = 0.11 L daily; at day 42,
the average MLSS is at 3,500 mg/L. Hence the F/M ratio for each SBR is calculated
as shown below using equation 3.7 in methodology.
F/M = 6,420 (mg/L) ×0.11 (L)
3,500 (𝑚𝑔
𝐿)× 0.8 (L)
F/M = 706.20 mg
2,800 𝑚𝑔
F/M = 0.25
According to Davies, 2005, many of the conventional wastewater treatment
plants operating an F/M ratio between 0.2 – 0.5. Hence in this research the F/M = 0.25
is considered to be normal for a suspended activated sludge system in SBR. The reason
for lower values of F/M instead of theoretical F/M ratio which usually ranges from 0.5
to 1.0 is due to the fact that which will cause poor settlability of the sludge and may
need a longer duration during the settling time for SBR.
The volume of sludge exiting the SBR is 30 mL on a daily basis and the
calculation for SRT as shown below is according to the equation 3.8 in methodology.
SRT = 0.8 (L)
0.03 (𝐿/𝑑𝑎𝑦) = 26.67 days ~ 27 days
The SRT in this research is 27 days and it was mentioned by Davies, P.S.,
(2005) that the SRT may vary from system to system. The SRT for a very high-rate
system may be less than ½ a day and a very slow-growing-rate system like an extended
aeration system in SBR may up to 75 days. Hence, SRT of 27 days is a suitable SRT
for the extended 22 hours aeration in the SBRs. The volume of effluent with the
desludge volume exiting the SBR is 80 mL + 30 mL = 110 mL = 0.11 L on a daily
basis. By using equation 3.9 in methodology, the HRT of SBR is about 7 days as
shown in the calculation below.

76
HRT = 0.8 (𝐿)
0.11 (L/day)
HRT = 7.27 days ~ 7 days
The HRT in this research is longer compare to other research which treats
domestic wastewater as Papan landfill leachate containing high amount of COD at
6,420 mg/L (highest record) and BOD at 1,100 mg/L (highest record) hence the
suspended activated sludge or bacteria need more time to oxidize the high
concentration yet complex of the organic matters in the reactor. The growth condition
in terms of temperature, pH and DO of both nitrification and denitrification bacteria
are shown below (Wiszniowski et al., 2006) (Bakar et al., 2012). The requirements for
the growth of nitrifiers (AOB and NOD) in nitrification are summarized as follow:
- Temperature range between 5 oC to 40 oC (mesophilic microorganisms),
optimal temperature = 30 oC to 37 oC
- Acceptable pH range between 5.5 – 9.0 and optimal pH = 7.5
- DO more than 1.0 mg/L, optimal DO > 2.0 mg/L
According to Peng and Zhu. (2006), the optimal temperature for nitrification
process is at 35 oC to 38 oC which gives the maximum activity for nitrification as
temperature raise can expand and promote the specific growth rate of the nitrifying
bacterial groups. The requirements for growth of denitrifiers in denitrification are
summarized as follow:
- Temperature range between 5 oC to 60 oC (mesophilic microorganisms),
optimal temperature = 30 oC to 37 oC
- Acceptable pH range between 6.0 – 8.0 and optimal pH = 7.0 – 7.5
- DO to be close to 0 mg/L or DO < 0.5 mg/L
In this research, the temperature, pH and DO of the reactor fulfill the
requirements for both nitrification and denitrification processes. The temperature and
pH of the SBRs were monitored daily using the Intell Instruments Plus infrared
thermometer and submerging the pH probe of the Hanna HI 2550 pH meter. DO is to

77
be monitored once a week by taking out 50 mL of sample right after aeration and right
after 1.5 hours of settling time. The DO was taken once a week as to reduce the
disturbance to the reactor. The Table 4.5 below shows the operating condition of the
reactor on daily basis.
Table 4.5: The daily operational conditions in SBRs
Operational Parameters Units Aerobic Phase
(During Aeration)
Anaerobic Phase
(During Settling)
Temperature oC 22.8 23.2
pH - 7.50 8.44
DO mg / L 5.65 0.00

78
4.5 Sequencing Batch Reactor, SBRs Treatment Efficiency
Figure 4.6 show the best treatment efficiency for COD, NH3-N, TSS and colour from
Papan landfill leachate by aerobic SBRs at different aeration rates at 1.0 L/min, 3.0
L/min and 5.0 L/min. The SBRs has a complete cycle of 24 hours which has a
sequential operation of 0.5 hour for feeding and mixing, followed by 22 hours of
extended aeration, 1.5 hours of settling and lastly 0.5 hour of decanting and sample
extraction and collection.
Figure 4.6: Treatment Efficiency of the Four Parameters (COD, NH3-N, TSS
and Colour)
Overall, the aerobic SBRs in treating raw Papan landfill leachate has the
greatest removal efficiency for NH3-N of more than 90 %, medium removal strength
for COD and TSS at around 50 % and about 30 % for removing colour.
54.95
92.36
54.55
26.96
50.17
94.77
53.64
29.32
49.49
97.07
54.55
37.70
05
101520253035404550556065707580859095
100
COD NH3-N TSS COLOUR
Trea
tmen
t Ef
fici
ency
, %
Parameters
Treatment efficiency, % vs Parameters for Each SBRs
SBR 1 (1L/min)
SBR 2 (3L/min)
SBR 3 (5L/min)

79
4.5.1 Ammonical Nitrogen (NH3-N) Removal Efficiency
The above graph shows that NH3-N having the highest removal efficiency at 92.36 %,
94.77 % and 97.07 % for SBR having aeration rates of 1 L/min, 3 L/min and 5 L/min
respectively compared to other parameters.
In biological nitrogen removal, the process mainly can be categorized into two
separate steps namely nitrification involves the conversion of ammonium to nitrate
under aerobic condition and denitrification involves the conversion of nitrate to
nitrogen gas, N2 using readily biodegradable organics as electron acceptor under
anoxic or anaerobic condition (Wei et al., 2012). According to Wiszniowski et al.
(2006), aerobic autotrophic bacteria is responsible for the complete nitrification
process in which two sequential processes take place which the AOB (Ammonia –
Oxidizing Bacteria) oxidize ammonia into nitrite and the nitrite is further oxidized by
NOB (Nitrite – Oxidizing Bacteria). The equations below are the chemical oxidation
of ammonia to nitrite and nitrite to nitrate (Wiszniowski et al., 2006).
Stoichiometry of Biological Nitrification:
NH4+ + 1.5 O2 NO2
- + H2O + 2H+ + Energy
[ ΔGʹ0 = - 275 KJ/mol ]
(4.11)
After the AOB oxidize ammonia into nitrite, the nitrite is further oxidized by NOB
(Nitrite – oxidizing bacteria) hence producing nitrate in the following equation 4.12:
NO2- + 0.5 O2 NO3
- + Energy
[ ΔGʹ0 = - 75 KJ/mol ]
(4.12)
The two energy-yielding processes leads to the below overall reaction for a complete
nitrification,
NH4+ + 2O2 NO3
- + 2H+ + H2O
[ ΔGʹ0 = - 305 KJ/mol ]
(4.13)
Where ΔGʹ0 is Gibbs Free Energy
Nitrobacter
Nitrifying bacteria
Nitrosomonas

80
The below diagram prepared by Gerardi, M.H. (2002) illustrate the interaction
and the complete process of nitrification in wastewater by nitrosomonas and
nitrobacter.
Figure 4.7: Nitrite Ions Are Waste Product from Nitrosomonas Upon Oxidation
of Ammonium Ions. The NO2- Waste Is the Food for Nitrobacter to Oxidize into
Nitrite Ions in Which NO3- Will Be Later Used by Denitrifying Bacteria
(Gerardi, 2002)
Denitrification is the second step to complete the nitrogen cycle. In nitrification,
the process does not remove nitrogen from wastewater as it simply converts
ammonium ions into nitrate ions. Denitrification removes nitrogen from wastewater
by converting nitrate into soluble N2 gas which can be released back to the
environment safely by heterotrophic bacteria (Metcalf & Eddy., 2014) In this process,
nitrate, NO3- function as an electron acceptor and the organic matters, BOD5 or COD
function as electron donor to complete the denitrification under anoxic or anaerobic
condition with DO less than 0.5 mg/L (Wiszniowski et al., 2006). Denitrification is
also known as “dissimilatory” or “Anoxic respiration” as both nitrite and nitrate ions

81
are reduced to form molecular nitrogen, N2 (Gerardi, 2002). The below equations show
the denitrification path performed by denitrifiers.
Stoichiometry of Biological Denitrification:
5 C6H12O6 + 24 NO3- +H+ 12 N2 + 30 CO2 + 42 H2O
[ ΔGʹ0 = - 13.5 MJ/mol ]
(4.14)
Where C6H12O6 is a six-carbon sugar example glucose in wastewater that are available
for denitrifiers to consume.
NO3- + bCOD N2 + CO2 + H2O + OH- + New Cells (4.15)
There are several groups of facultative denitrifying microorganisms as they are
facultative because they can survive in aerobic condition hence not strict anaerobic
microbes. Denitrifiers consists mostly out of facultative anaerobic bacteria. They can
be named into organotrophs, heterotrops and dentrifiers. It is reported that the genera
of denitrifying bacteria Pseudomonas, Alcaligenes and Basillus are the largest
wastewater activated sludge (Gerardi, M.H., 2002).
The ΔGʹ0 representing Gibbs Free Energy which is the amount of energy
capable of doing work during a process at constant pressure and temperature. ΔGʹ0
values are obtained under standard condition of T = 25 oC and pH = 7.0 (Metcalf &
Eddy, Aecom., 2014). This terminology applies to all biological activity and the
conversion from one form of chemical into another by microbes. The negative value
of ΔGʹ0 means the process is spontaneous and is an exergonic process which releases
energy to its surrounding (heat); while the positive value of ΔGʹ0 means the process is
non-spontaneous and is an endergonic process which consumes energy from its
surrounding (Miles, 2013) Therefore, the nitrogen removal process in SBRs is very
spontaneous and this is the reason for the high removal efficiency of NH3-N in which
SBR-3 achieved 97.07 %.

82
4.5.2 Chemical Oxygen Demand (COD) Removal Efficiency
Both the COD and TSS removal efficiencies are sharing the same removal efficiency
at around 50.00 %. As shown in the Figure 4.6, the removal of COD for SBR 1 is
54.95 %, SBR 2 is 50.17 %, SBR 3 is 49.49 %. The overall removal for the three SBRs
is around 50 % in this research and is considered to be not very efficient. The main
reason for this is the design of the SBRs cycle in which extended aeration which
involve high concentration of DO in the reactor maybe the factor that inhibit the
denitrification activity. Besides, only 2 hours of non-aeration time is allowed in this
research for each cycle of the SBRs during the settling phase and the decand with
sampling phase which causes the duration for anoxic or anaerobic phase in the SBRs
to be short if compared to other researches. According to Breisha and Winter. (2010),
high DO plays an important role in nitrification but has a negative effect on
denitrification. This is due to the fact that denitrification bacterial are facultative in
which the denitrifiers energetically prefer dissolved oxygen over nitrate, NO3- as
electron acceptor if the DO is more than 0.5 mg/L. Hence, the inhibition of
denitrification process at high concentration of DO and short non-aeration duration
will lead to the inhibition of degradation of organic matter in terms of COD or BOD5.
In Figure 4.6, the removal efficiency of COD dropped with increase in aeration
from 1.0 L/min to 5.0 L/min from 54.95 % in SBR 1 down to 49.49 % in SBR 3. This
is due to the inhibition of denitrification process at higher DO concentration as
denitrification is the main process in removing organic matters in leachate according
to the stoichiometry of biological denitrification in Equation 4.14.
The presence of high concentrations of refractory organic compounds like FA
(Fulvic acids), HS (Humic substances) which is very hard to degrade by bacterial is
one of the factor that inhibit the degradation of COD (Gotvain et al., 2015). Not only
that, the presence of xenobiotic compounds (XOCs) which are not natural occurring
in nature but man-made substances are very hard to degrade by biological method
(Slack et al., 2005). As COD is defined as the sum of inorganic and organic carbon,
hence the available of readily biodegradable organic matters may not be high as the
BOD5 is 1/6 of that of COD hence the removal efficiency of COD in this research is
limited by using biological treatment methods.

83
4.5.3 Total Suspended Solids (TSS) Removal Efficiency
The removal of TSS for SBR 1 is 54.55 %, SBR 2 is 53.64 %, SBR 3 is 54.55 %. The
removal of TSS is mainly dependant to the settling time of the SBR after the aeration
and mixing is switch off. According to Aslam, (2013) the removal of colloidal and
suspended solids from wastewater is greatly influence by gravity separation. The terms
“settling” means the action of separation of suspended solids which are heavier than
water by the force of gravity (Metcalf & Eddy, 2014). The total suspended solids in
raw leachate ranges from 115 – 220 mg/L and can be gravitational settled in the SBR.
In general, suspended solids in wastewater can be categories into four groups namely
settleable, supra-colloidal, colloidal and dissolved with each category having the
particle size of 100 µm – 1000 µm, 1 µm – 100 µm, 0.001 µm – 1 µm and less than
0.001 µm respectively (Ebeling and Vinci, 2012). Only the first two categories namely
settleable and supra-colloidal of waste solids can be separated by using gravitational
settling.
The removal of suspended solids can be performed by microorganisms in the
SBR as some form of suspended solids are organic matters hence the microorganisms
can break-down and dissolve the organic solids into cell masses. Poor bacteria floc
formation in the reactor may lead to a non-settleable and dispersed solids which has a
negative influence on the removal of suspended solids (Richard, 2003).
4.5.4 Colour Removal Efficiency
The SBR system in this research does not perform well in treating colour from Papan
landfill leachate as the yellow, brown and black colour in the leachate indicates high
concentration of humic acids. As mentioned by Bakar et al. (2012), the decomposition
of humic acids and other organic matters will results in such colours in wastewater
especially in leachate as it is usual for high concentration of humic and fulvic acids in
landfill leachate. As observed in the table 4.6 above, the highest colour removal
efficiency was achieved by SBR 3 while the colour removal efficiency decreases with
decreasing aeration rate at 29.32 % for SBR 2 and 26.96 % for SBR 1. As, mentioned

84
by the Bakar et al. (2012), the main cause of the brownish in leachate is mainly due to
the presence of organic matters. The higher aeration rate promotes more DO or free
molecular oxygen in the reactor hence promoting a more vigorous bio-degradation of
the organic matters during the extended aeration period. However, the removal of
colour in this research is considered to be not effective by biological treatment hence
a second treatment using coagulation to further treat the leachate is required.
4.6 Optimal Aeration Rate of SBR
In this research, the optimal aeration for the treatment of Papan landfill leachate in
SBR is 3.0 L/min. The 5.0 L/min aeration will be considered over aerated although the
treatment efficiencies for the parameters (except for COD) are slightly better
compared to SBR 2 having aeration rate at 3.0 L/min. Hence, aeration rate at 5.0 L/min
is not considered to be the optimal aeration for SBR as the operational cost may be
very high if compared to the 3.0 L/min aeration.

85
4.7 Post Treatment of Leachate by Coagulation Process (ALUM)
The coagulation process is chosen to be post treatment after the biological treatment
by SBR is due to the fact that high levels of aluminium may inhibit and has a toxic
effect to bacteria especially for nitrifiers and denitrifiers in an activated sludge system
(Maranon et al., 2008). Furthermore, the pH of the treated medium by ALUM during
coagulation will become more acidic in nature and therefore have to recondition the
treated medium by adding base or alkalinity to reach about neutral pH as biological
treatment in SBRs are sensitive to pH if coagulation process is chosen as pre-treatment
for Papan landfill leachate before SBRs.
The main reason for ALUM chosen to be the coagulant in coagulation as post
treatment in this research is to mainly promote better treatment efficiency for COD,
TSS and Colour as a compensation for the ineffective treatment in SBR for the
parameters respectively. Furthermore, ALUM is a well-known commercial coagulant
in treating domestic wastewater and leachate, therefore is easily available if
coagulation employ using ALUM as coagulant in treating Papan landfill leachate. In
the research reported by Samadi et al. (2010), by using 1.0 g/L of ALUM at pH 12,
the removal efficiency for COD is 62.33 %; 1.5 g/L of ALUM at pH 2, the removal
efficiency for TSS is 58.73 %. In another research done by Ghafari et la. (2010), the
COD, turbidity, colour and TSS removal efficiency in leachate from Pulau Burung
Landfill Site by using 9.4 g/L of ALUM at pH 7.0 is 56.76 %, 94.82 %, 92.23 % and
95.92 % respectively. Hence, ALUM is a promising coagulant which can increase the
treatment effectiveness of the SBR in treating COD, TSS and colour. In this research,
Aluminum Sulphate (ALUM) with chemical formula Al2(SO4)3.16H2O and Molar
concentration of 630.39 g/mol was used as coagulant for post treatment in this section.
The effect of different pH of the coagulation medium and different dosage in terms of
g/L of Alum were the two major parameters which taken into account for this post
treatment study.

86
4.7.1 pH Optimization
In this section, constant ALUM dosage of 1.0 g/L was used to study the effect of
different pH with constant mixing speed (RPM) and settling time (minutes) after
mixing on COD, Ammonical Nitrogen NH3-N, Total Suspended Solids TSS and
Colour removal efficiency. The treated leachate samples were allocated into six 50 mL
beaker and the pH value of 4.0, 5.0, 6.0, 7.0, 8.0 and 9.0 of the samples were adjusted
with 1 M sulphuric acid (H2SO4) and 1 M sodium hydroxide (NaOH).
Figure 4.8: The Effects of Different pH onto COD, NH3-N, TSS and Colour
Removal Efficiency (Rapid Mixing: 120 Rpm, 3 Minutes; Slow Mixing: 20 Rpm,
20 Minutes; Settling Time: 60 Minutes)
Figure 4.8, pH 7.0 was chosen to be the optimal pH for coagulation using
ALUM in this study as it achieved an overall most efficient removal in terms of COD,
TSS and colour compared to other pH ranges. At pH 7.0, 24.91 % of COD, 41.59 %
of TSS and 31.16 % of colour removal efficiencies had been achieved. The surface of
the particles in common wastewater are nearly always negatively charged therefore
they repel one another (Saukkoriipi, 2010) The main mechanism for coagulation is the
hydrolyzing of metal salts into highly charged cations Al 3+ and Fe 3+ which will be
very effective in destabilizing the negatively charged particles in leachate. It was
mentioned that pH is the most influencing factor for the coagulation process in
wastewater (Samadi et al., 2010; Saukkoriipi, 2010).
0
10
20
30
40
50
60
70
80
90
100
3.0 3.5 4.0 4.5 5.0 5.5 6.0 6.5 7.0 7.5 8.0 8.5 9.0 9.5 10.0
Trea
men
t Ef
fici
ency
, %
pH
Treatment Efficiency, % vs pH
COD
NH3-N
TSS
Colour

87
As ALUM was added into the treated leachate by SBR, hydrolysis of the
ALUM rapidly (< 1 second) take place to form highly positively charged cations. At
pH 7.0, the formation of ALUM in the leachate medium is mostly hydroxide
precipitates of the Al species according to Figure 4.9 which was being discussed in
chapter 2. The positively charged amorphous hydroxide plays a crucial role in
coagulation as it deposits on the negatively charged impurities and other NOM (natural
organic matter) hence destabilization and neutralization of these stable impurities
(Duan and Gregory.,2003).
According to Saukkoriipi, (2010), sweep coagulation involve in the formation
of amorphous metal hydroxide precipitate where the aluminum hydroxide flocs trap
the impurities by a ‘swept down” action or by sinking flocs as the adsorption of
polyaluminum ion or the adsorption of aluminum triggers on the surface of the
impurities. This may be the main reason for ALUM to perform most optimally at pH
7 in this research rather than in other pH in treating the leachate. According to Duan
and Gregory, (2003) that charged neutralization with aluminum salts at neutral pH (pH
7.0) occurs at a very low metal concentration typically a few µM.

88
4.7.2 Dosage Optimization
In this section, different ALUM dosage of 0.2 g/L, 0.5 g/L, 1.0 g/L, 1.5 g/L, 2.0 g/L,
3.0 g/L, 4.0 g/L ,5.0 g/L and 6.0 g/L at constant pH 7.0 were used to study the effect
of different ALUM dosage on the removal efficiencies of COD, Ammoniacal Nitrogen
NH3-N, Total Suspended Solids TSS and Colour. The test was carried out with
constant mixing speed (RPM) and settling time (minutes). The treated leachate
samples were allocated into six 50 mL beaker and the pH value of the samples were
adjusted to pH 7.0 with 1 M sulphuric acid (H2SO4) as the pH value of the post treated
leachate is 7.56.
Figure 4.9: The Effects of Different ALUM Dosage at pH 7.0 Onto COD, NH3-
N, TSS and Colour Removal Efficiency (rapid mixing: 120 rpm, 3 minutes; slow
mixing: 20 rpm, 20 minutes; settling time: 60 minutes)
Based on Figure 4.9, the optimal dosage of ALUM was chosen at 5.0 g/L as it
achieved the overall highest removal efficiency for COD at 70.61 %, 84.07 % for TSS
and 80.00% for colour. As shown in the figure above, higher dosage of ALUM at pH
7.0 gives a better treatment results for the post-treated leachate by SBR.
In this research, the optimal dosage of ALUM at 5.0 g/L was consider to be in
the medium strength dosage of ALUM as it was reported that 9.4 g/L of ALUM at pH
7.0 by Ghafari et al. (2010) and 9.5 g/l at pH 7.0 by Ghafari et al. (2009) were the
0102030405060708090
100
0.0 0.5 1.0 1.5 2.0 2.5 3.0 3.5 4.0 4.5 5.0 5.5 6.0 6.5
Trea
men
t Ef
fici
ency
, %
ALUM Dosage, g/L
Treatment Efficiency, % vs ALUM Dosage, g/L
COD
NH3-N
TSS
Colour

89
optimal dosage in treating landfill leachate from Pulau Burung Landfill Site which the
COD in the raw leachate was reported to be at 1,794 mg/L – 2,094 mg/L while the
treated leachate COD of this research is at 4,100 mg/L which is higher. According to
Duan and Gregory, (2003), in general the optimal ALUM dosage will increase with
increasing pH value due to the decrease of positively charged absorbed species and
the proportional relationship between the particles concentration with coagulant
concentration. Therefore, in this research at higher ALUM dosage of 2.5 g/L and above
in treating treated leachate at pH 7.0 was observed to be more efficient.
Figure 4.10: Showing Charge Neutralization (Left-Hand Side) and Charge
Reversal (Right-Hand Side) if Overdose of Coagulant of the Deposition of Metal
Hydroxide Species, Al(OH)3(Am) at Around Neutral pH (Duan and Gregory.,
2003)
In coagulation, there are four different zones at different coagulant dosage
starting from the lower to the higher coagulant dosage. The Table 4.6 below shows the
different zones with different effects on negatively charged particles:
Table 4.6: Effects of Dosage On Particles in Wastewater Respective to The
Different Zones
Zone Effects of dosage with particle charge
Zone 1 Insufficient dosage; particles still stable due to no charged
neutralisation hence particles are still negatively charged.

90
Zone 2 Sufficient dosage; particles are being charge neutralised by
coagulant hence coagulation.
Zone 3 Higher dosage; particles are first being charge neutralise and further
re-stabilisation of particles occurred.
Zone 4 Overdose; formation of hydroxide precipitation and sweep
flocculation starts to occur.
Due to the above reason, overdose of coagulant will not further improve the
removal efficiency of particles in the leachate and the performance will slightly drop
as observed in the above Figure 4.10 in this research. This can be observed at 6.0 g/L
of ALUM where the COD removal is lower than in 5.0 g/L of ALUM at 69.06 % with
the same removal for TSS.

91
4.8 Overall Treatment Efficiency of Leachate by SBR and Coagulation Process
Papan landfill leachate requires a two-step treatment system to effectively treat the
leachate as to return back safely to the environment with minimal impact. The research
done in this period shows a promising treatment results for Papan landfill leachate
treatment by combining biological and physiochemical treatment techniques in the
treating the leachate. The biological treatment by employing SBR bio-reactor method
treats ammonical nitrogen, NH3-N very effectively and a moderate treatment
efficiency for COD and TSS. While the following treatment performed by coagulation
using ALUM as coagulant enhance the treatment for COD, TSS and colour by further
treating the leachate.
Figure 4.11: The Overall Treatment Efficiency, % by SBR and Coagulation Vs
Parameters (COD, NH3-N, TSS and Colour)
The above Figure 4.11 shows the overall combined treatment results by SBRs
and Coagulation using ALUM to treat Papan landfill leachate. The two-step biological
first and physiochemical leachate treatment system achieved a total removal efficiency
of 84.89 %, 94.25 %, 91.82 % and 85.81 % for COD, NH3-N, TSS and colour
respectively.
COD, 48.60
NH3-N, 93.51
TSS, 48.64
Colour, 29.05
COD, 36.29
NH3-N, 0.74
TSS, 43.18
Colour, 56.76
05
101520253035404550556065707580859095
100
COD NH3-N TSS Colour
Tota
l Tre
atm
ent
Effi
cien
cy, %
Parameters
Total Treatment Efficiency, % vs Parameters
Coagulation(Post Treatment)
SBR (MainTreatment)
84.89
91.8285.81
94.25

92
4.9 Heavy Metal Removal
There are 11 types of heavy metals namely Cadmium, Arsenic, Lead, Copper,
Manganese, Nickel, Zinc, Iron, Silver, Selenium and Barium which are present in the
leachate according to Table 4.1 above. The relative abundance and concentration,
mg/L of the 11 types of heavy metals in fresh Papan landfill leachate sample followed
the order: Iron > Copper > Zinc > Lead > Barium > Silver > Manganese > Selenium >
Cadmium > Nickel > Arsenic. All of the heavy metals concentration in the raw
leachate sample exceeded the leachate discard standard in Malaysia. Figure 4.12 below
shows the removal efficiency, % of the heavy metals after the two-stage treatment by
SBR and coagulation.
Figure 4.12: Removal Efficiency, % vs Types of Heavy Metals
The two-stage treatment system by SBR followed by Coagulation to treat
Papan landfill leachate is very effective in treating Cadmium, Lead, Copper, Selenium
and Barium which had the removal efficiency of 95.00 %, 95.09 %, 95.39 %, 100.00 %
and 87.27 % respectively.
95.00
34.88
95.09 95.39
22.89
41.30 41.28
62.90
50.00
100.00
87.27
0
10
20
30
40
50
60
70
80
90
100
Rem
ova
l Eff
icie
ncy
, %
Heavy Metals
Removal Efficiency, % vs Heavy Metals
RemovalEfficiency, %

93
According to Abd-Rahman et al. (2013), the main mechanism in removing
heavy metals in SBR is biosorption and bio-accumulation where-by the removal of
heavy metals in leachate is through a series of complex interaction of microorganisms
in the reactor. Effective heavy metals removal is performed by various groups of
microorganisms through biosorption and bio-accumulation namely bacterial, algal or
fungal biomass and cyanobacterial under a range of conditions. Microorganisms are
able to concentrate metals in their cells higher than in the surrounding environment
through either active metal uptake which needs energy from the cells to move metals
into the cells or passive metal uptake which the surrounding metals are in higher
concentration hence diffuse into the cells which follows the concentration gradient.
Biosorption and bio-accumulation include actions like ion exchange, entrapment,
chelation and adsorption of heavy metals which take place during the metabolism of
the microbial in the reactor (Kosolapov et al., 2004). Certain microorganisms have
strong biosorbent behaviour towards metallic ions such as copper which make-up the
cells of the microbial (Ahalya et al., 2003).
According to Pang et al. (2009), coagulation using Aluminium Sulphate,
ALUM is a common method used to remove heavy metals through the formation of
hydroxide precipitate in which during the post treatment in this research the dominant
species at pH 7.0 is the amorphous hydroxide precipitate, Al(OH)3 as shown in Figure
2.4 in Chapter 2. Effective removal of particulates and impurities during coagulation
by enmeshment of impurities on the formed amorphous metal hydroxide precipitates
and by neutralisation of particle charges (Fu and Wang, 2011). Koc-Jurczyk and
Jurczyk, (2007) mentioned that sorption and precipitation are the main mechanisms in
removing heavy metals in leachate. The amorphous hydroxide precipitate enmeshes
or traps the heavy metals ions together with other dissolved colloidal organics to form
a larger flocs and settle down or precipitate by gravitational force. Hence, the “sweep-
floc coagulation” as discussed in Chapter 2 is the mechanism in removing heavy
metals during the post treatment of this research.

94
4.10 Operational Cost Estimation
4.10.1 SBR Operational Cost
This cost estimation is to evaluate the operational cost and to compare the cost
difference mainly between SBR 3 and SBR 5 having 3 L/min and 5 L/min of aeration.
The AC electric air pumps used in this research were powered at 5.6 W for 3.0 L/min
and 8.0 W for 5.0 L/min. It was noted that these aquarium pumps can support a larger
volume of a 10.0 L aquarium with effective DO circulating the liquid instead of a 1.0
L SBR. Hence, the operational cost comparison between 3.0 L/min and 5.0 L/min
aeration rate was to be determined. The cost of electrical energy consumption was
determined.
According to Pondsolutions.com (2017), the general formula for calculating
the operating cost for an electric pumps and aerators is show below:
a) Electricity consumption (kWh) = watts, W (power of the pump) × running time
in hours per day of pump, h ÷ 1000 (4.16)
b) Operational cost = Electricity consumption (kWh) × cost per kilowatt hour
(4.17)
Where kWh = kilowatt hour, W = Watts and h = hours.
Table 4.7 shows three categories of voltage level and according to The United
Nation (2014), a typical wastewater treatment plant with all equipment and facilities
requires voltage supply of up to 11,000 V. Hence, wastewater treatment plants are
considered to be in the medium voltage category. Table 4.8 indicates the commercial
tariff respective to the price of the electricity. The operational cost of wastewater
treatment plant will be categories under Tariff C 1 and Tariff C 2 in which both Tariffs
having the same rate at 23.40 sens / kWh.

95
Table 4.7: TNB’s Supply Voltage Respective to Voltage Level Category (Tenaga
National Berhad, TNB., 2017)
Voltage Level Supply Voltage
Low Voltage – Single Phase 240 V
Low Voltage – Three Phase 415 V
Medium Voltage 6,600 V – 66,000 V
High Voltage 132,000 V – 275,000 V
Table 4.8: The Electrical Pricing and Tariff Rates for Commercial Users
(Tenaga National Berhad, TNB., 2017)
Tariff
Category
Tariff Description Unit Current
Rate
Tariff B Low Voltage Commercial Tariff sen /
kWh
32.30
Tariff C 1 Medium Voltage General Commercial Tariff sen /
kWh
23.40
Tariff C 2 Medium Voltage Peak Commercial Tariff sen /
kWh
23.40
Medium Voltage Off-Peak Commercial
Tariff
sen /
kWh
14.40
i) For SBR 2 having operation of aeration at 3 L/min for 22 hours per day,
Electricity consumption per L of leachate = 5.6 W × 22 hours ÷ 1000
Electricity consumption = 0.1232 kWh / L of leachate
Operational cost = 0.1232 kWh / L of leachate × 23.40 sen / kWh
Operational cost = 2.88 sens or RM 0.028 per L of leachate
ii) For SBR 3 having operation of aeration at 5 L/min for 22 hours per day,

96
Electricity consumption per L of leachate = 8.0 W × 22 hours ÷ 1000
Electricity consumption = 0.176 kWh / L of leachate
Operational cost = 0.176 kWh / L of leachate × 23.40 sen / kWh
Operational cost = 4.12 sens or RM 0.041 / L of leachate
Comparison in percentage difference between aeration cost for SBR 2 and SBR
3 at 3 L/min and 5 L/min aeration rates.
Cost saving = (RM 0.041 - RM 0.028) / L of leachate
Cost saving = RM 0.013 / L of leachate
Percentage of cost saving if employ 3 L/min aeration as optimal aeration rate
for the treatment of leachate by SBR.
Cost saving = 𝑅𝑀 0.041 −𝑅𝑀 0.028
𝑅𝑀 0.028× 100 %
Cost saving = 46.43 %
The operational cost can be saved up to 46.43 % theoretically if 3.0 L/min of
aeration is employed in treating the Papan leachate in SBR. Hence, the operational
cost in treating per m3 of leachate at 3.0 L/min of aeration is calculated as below:
Aeration Operational Cost = RM 0.028 / L of leachate × 1,000 𝐿
1 𝑚3
Aeration Operational Cost = RM 28.00 / m3 of leachate

97
4.10.2 Coagulation Operational Cost
The optimal quantity of ALUM used in treating Papan leachate is evaluated as an
operational cost in this session. Optimal dosage of 5.0 g/L of ALUM was determined
in treating Papan landfill leachate as post treatment after SBR.
The average price of ALUM according to Made-in-China.com (2017) is RM
770 per ton of ALUM. Hence, the cost for ALUM in terms of 5.0 g/L is calculated as
below:
Cost of ALUM treating per m3 of leachate = 5.0 g/L × 𝑅𝑀 770
1,000 𝑘𝑔 ×
1 𝑘𝑔
1,000 𝑔 ×
1,000 𝐿
1 𝑚3
= RM 3.85 / m3 Leachate
The operational cost for coagulation as post treatment requires RM 3.85 of
ALUM to treat per m3 of leachate.
4.10.3 Total Operational Cost Estimation
The total operational cost for sequential treatment of Papan landfill leachate by SBR
follow by coagulation using ALUM is calculated as below:
Total Operational Cost = Aeration Cost + Coagulation Cost
Total Operational Cost = RM 28.00 / m3 of leachate + RM 3.85 / m3 of leachate
Total Operational Cost = RM 31.85 / m3 of leachate
Thus, the total operational cost combining first SBR at aeration rate 3.0 L/min
followed by coagulation using optimal dosage at 5.0 g/L of ALUM in this research is
RM 31.85 to treat per m3 of Papan landfill leachate. The higher operational cost for
SBR 2 at 3.0 L/min in treating leachate is mainly due to the long running time of
aeration which had been earlier design to be 22 hours of aeration per day.

98
CHAPTER 5
CONCLUSION
5.1 Conclusion
The Papan leachate is considered to reached intermediate stage as the BOD5/COD in
this research is found to be 0.17 to 0.24 in which is in the range of 0.10 to 0.30 to be
classified as intermediate leachate (Baig et al., 1996; Liu, S., 2013; Yu, D., 2007). The
selection of treatment methods varies according to the leachate characteristics. Hence,
biological treatment combined with physiochemical treatment is a more suitable as a
two-step treatment process for the Papan landfill leachate. Biological treatment
employs aerobic SBR and was found that SBR 2 with aeration rate at 3.0 L/min with
fixed contact time and SBR cycle is the optimal biological treatment which achieved
an effective maximum removal rate at 94.77 % of NH3-N, 50.17 % of COD, 50.00 %
of TSS and 29.32 % of colour. It was found that 5.0 L/min of aeration was over aerated
as the DO concentration is same as in 3.0 L/min hence it the optimal aeration rate in
SBR is 3.0 L/min. The high removal rate of NH3-N is due to the active metabolisms
of nitrification and denitrification bacterial which consume NH3-N as their nutrient
together with COD as their carbon source. The effluent from the SBR 2 was collected
daily from day 12 to day 35 and the collected effluent was characterized. The effluent
was then allowed for coagulation process as post-treatment as to improve the COD,
TSS and colour removal efficiencies. Optimal pH at 7.0 and dosage at 5.0 g/L of
ALUM, aluminum sulphate were determined by the jar test for coagulation. The
coagulation using ALUM, aluminum sulphate as coagulant showed a great
improvement for removing COD, TSS and colour up to 71.03 %, 91.82 % and 85.59 %
respectively at the end of the coagulation process. Coagulation is known to treat

99
various kinds of impurities in wastewater as the process hydrolyzed aluminum metals
into highly positively charged cations which can interact vigorously with the negative
colloids in wastewater (Duan and Gregory, 2002). Operational cost saving of up to
46.43 % can be achieved if aeration of 3.0 L/min for the SBR is selected instead of 5.0
L/min.
5.2 Recommendations for Future Research
The aerobic SBR has a great potential in treating leachate hence a more comprehensive
study need to be performed on the contact time as well as the aeration rate at a smaller
scale to determine the optimal contact time and aeration rate. The decrease in the
contact time after successful cultivation of activated sludge in the reactor can greatly
improve the removal of COD as well as reducing operational cost for aeration in SBR.
Furthermore, the SBR can be enhance by placing plastic media into the reactor as to
increase the specific surface area of the reactor by allowing bacterial to attach on the
surface of the plastic media. As reported by Koupaie et al. (2011), the moving bed
SBR is more effective in bacterial accumulation hence improving the MLSS and
MLVSS in the reactor hence the system can remove waste from the wastewater more
effectively as increase in the amount of bacterial population.
Anaerobic SBR is the future trend of wastewater treatment as the anaerobic
system is a more sustainable approach in treating wastewater. This is due to the fact
that the end product of anaerobic biological treatment in wastewater is methane gas,
CH4 which can be captured and used as a source of alternative energy to generic
electricity.
100
REFERENCES
Abd-Rahman, R., Hasani, H., Wasmi, B.A., Al-amiery, A.A. and Mohamad, A.B.,
2013. Heavy metal biosorption efficiencies of expanded bed biofilm reactor and
sequencing batch biofilm reactor. Asian Journal of Chemistry, 25(13), p.7193.
Adnan, S.N.S.M., Yusoff, S. and Chua, Y.P., 2013. Soil chemistry and pollution study
of a closed landfill site at Ampar Tenang, Selangor, Malaysia. Waste Management
& Research, 31, 6, pp.599-612.
Agamuthu, P. and Fauziah, S.H., 2011. Challenges and issues in moving towards
sustainable landfilling in a transitory country-Malaysia. Waste Management &
Research, 29(1), 13-19.
Ahalya, N., Ramachandra, T.V. and Kanamadi, R.D., 2003. Biosorption of heavy
metals. Res. J. Chem. Environ, 7(4), pp.71-79.
Al-Rekabi, W.S., Qiang, H. and Qiang, W.W., 2007. Review on sequencing batch
reactors. Pakistan Journal of nutrition, 6(1), pp.11-19.
American Public Health Association (APHA), 2005. Standard Methods for the
Examination of Water and Wastewater, 21st sd. Washington, DC: APHA.
Aslam, M, T., 2013. Settling of Solids in Raw Wastewater – Primary Settling Tanks
and Storm Water Tanks. Technische Universität Graz. pp. 67 – 149.
Asnani, P.U., 2006. Solid waste management. India infrastructure report, pp.570.
Aziz, S.Q., Aziz, H.A., Mojiri, A., Bashir, M.J. and Amr, S.S.A., 2013. Landfill
Leachate Treatment Using Sequencing Batch Reactor (SBR) Process: Limitation
of Operational Parameters and Performance. Int. J. Sci. Res. Knowl, 1, pp.34-43.
Aziz, S.Q., Aziz, H.A., Yusoff, M.S. and Bashir, M.J., 2011. Landfill leachate
treatment using powdered activated carbon augmented sequencing batch reactor
(SBR) process: Optimization by response surface methodology. Journal of
Hazardous Materials, 189(1), pp.404-413.

101
Badgie, D., Samah, M.A., Manaf, L.A. and Muda, A.B., 2012. Assessment of
municipal solid waste composition in Malaysia: Management, practice and
challenges. Polish Journal of Environmental Studies, 21(3), pp.539-547.
Baig, S., Thiéblin, E., Zuliani, F., Jenny, R., Coste, C., DEGREMONT, S. and Bern,
O.Z.O.N.I.A., 1996. Landfill Leachate Treatment: Case Studies. Water
Research, 30(1), pp.21.
Bakar, A.A., Daud, Z., Ahmad, Z. and Othman, M.A.R., 2012. Treatment of Leachate
Using Sequencing Batch Reactor (SBR). In: The International Conference on Civil
and Environmental Engineering Sustainability (IConCEES 2011), Johor Bahru,
Malaysia.
Breisha, G.Z. and Winter, J., 2010. Bio-removal of nitrogen from wastewaters-A
review. Journal of American Science, 6(12), pp.508-528.
Budhiarta, I., Siwar, C. and Basri, H., 2012. Current status of municipal solid waste
generation in Malaysia. International Journal on Advanced Science, Engineering
and Information Technology, 2(2), pp.129-134.
Clarke, B.O., Anumol, T., Barlaz, M. and Snyder, S.A., 2015. Investigating landfill
leachate as a source of trace organic pollutants. Chemosphere, 127, pp.269-275.
Davies, P.S., 2005. The biological basis of wastewater treatment. Strathkelvin
Instruments Ltd, 3.
Department of Environment (DOE) and Ministry of Natural Resources and
Environment, October 2010. Environmental Requirements: A Guide for Investors.
(Eleventh Edition) [Online].Available at: http://www.doe.gov.my/eia/wp-
content/uploads/2012/03/A-Guide-For-Investors1.pdf [Accessed on 28th Jun 2016]
Duan, J. and Gregory, J., 2003. Coagulation by hydrolyzing metal salts. Advances in
colloid and interface science, 100, pp.475-502.
Ebeling, J, M., and Vinci, B., 2012. Recirculating Aquaculture System Short Course -
Solids Capture. [online] Available at:
https://cals.arizona.edu/azaqua/ista/ISTA7/RecircWorkshop/Workshop%20PP%2
0%20&%20Misc%20Papers%20Adobe%202006/5%20Solids%20Capture/Solids
%20Control.pdf [Accessed on 29th March 2017].
El-Fadel, M., Findikakis, A.N. and Leckie, J.O., 1997. Environmental impacts of solid
waste landfilling. Journal of environmental management, 50(1), pp.1-25.
EPA., 1997. WASTE WATER TREATMENT MANUALS PRIMARY,
SECONDARY and TERTIARY TREATMENT. 1st ed Manual. Ardcavan,
Wexford: Environmental Protection Agency, Ireland., 1997. Print.
EPA, U., 1999. Wastewater technology fact sheet—sequencing batch reactors. EPA
832-F-99-073.

102
Fauziah, S.H. and Agamuthu, P., 2010. Landfills in Malaysia: Past, present and future.
Fauziah, S.H. and Agamuthu, P., 2012. Trends in sustainable landfilling in Malaysia,
a developing country. Waste Management & Research, pp.656-663.
Fazeli, A., Bakhtvar, F., Jahanshaloo, L., Sidik, N.A.C. and Bayat, A.E., 2016.
Malaysia׳ s stand on municipal solid waste conversion to energy: A
review. Renewable and Sustainable Energy Reviews, 58, pp.1007-1016.
Fu, F. and Wang, Q., 2011. Removal of heavy metal ions from wastewaters: a review.
Journal of environmental management, 92(3), pp.407-418.
Gebbie, Peter., 2006. AN OPERATOR’S GUIDE TO WATER TREATMENT
COAGULANTS. 31st Annaul Water Industry Workshop – Operations Skills. pp.
14 – 20.
Gerardi, M.H., 2002. Nitrification and Denitrification in the activated sludge process.
John Wiley & Sons, Inc.
Ghafari, S., Aziz, H.A. and Bashir, M.J., 2010. The use of poly-aluminum chloride
and alum for the treatment of partially stabilized leachate: A comparative study.
Desalination, 257(1), pp.110-116.
Gotvajn, A.Z., and Pavko, A., 2015. Perspectives on Biological Treatment of Sanitaty
Landfill Leachate. Book of Wastewater Treatment Engineering, Chapter 5, pp. 115-
151.
Hach, 2005. Water Analysis Handbook, 5th ed. US: Hach Company.
Hassan, M.N., Chong, T.L., Rahman, M., Salleh, M.N., Zakaria, Z. and Awang, M.,
2001, October. Solid waste management in Southeast Asian countries with special
attention to Malaysia. In Proceedings Sardinia, 8th International Waste
Management and Landfill Symposium, Italy pp. 1-5.
Hoornweg, D. and Bhada-Tata, P., 2012, March. WHAT A WASTE: A Global Review
of Solid Waste Management. The World Bank: Urban Development Series
Knowledge Papers, No.15 pp. 1-95.
Hossain, M.D., 1996. Mechanism of coagulation of coloured water with aluminium
sulphate. J. Civil Eng.-Inst. Eng. Bangladesh, 24(2), pp.213-220.
Ibrahim, T.N.T., Mahmood, N.Z. and Othman, F., 2017. Estimation of Leachate
Generation from MSW Landfills in Selangor. Environmental Science, Vol 19, No.
(1) 43-48.
Idris, A., Inanc, B. and Hassan, M.N., 2004. Overview of waste disposal and
landfills/dumps in Asian countries. Journal of material cycles and waste
management, 6(2), pp.104-110.

103
Johari, A., Alkali, H., Hashim, H., Ahmed, S.I. and Mat, R., 2014. Municipal solid
waste management and potential revenue from recycling in Malaysia. Modern
Applied Science, 8(4), pp. 37-49.
Kalanatarifard, A. and Yang, G.S., 2012. Identification of the municipal solid waste
characteristics and potential of plastic recovery at Bakri Landfill, Muar,
Malaysia. Journal of Sustainable Development, 5(7), pp.11.
Kannan, R., 2013. What contaminated ground water can do to your health? [Online]
The Hindu. Available at: http://www.thehindu.com/news/cities/chennai/what-
contaminated-ground-water-can-do-to-your-health/article5019514.ece [Accessed
on 11 Jul 2016]
Kjeldsen, P., Barlaz, M.A., Rooker, A.P., Baun, A., Ledin, A. and Christensen, T.H.,
2002. Present and long-term composition of MSW landfill leachate: a
review. Critical reviews in environmental science and technology, 32(4), pp.297-
336.
Klinck, B.A. and Stuart, M.E., 1999. Human health risk in relation to landfill leachate
quality. British Geological Survey, Technical report WC/99/17.
Koc-Jurczyk, J. and Jurczyk, L., 2007. Efficiency of removal of heavy metals from
municipal landfill leachate. Journal of Elementology, 12(4), pp.327-334.
Kosolapov, D.B., Kuschk, P., Vainshtein, M.B., Vatsourina, A.V., Wiessner, A.,
Kästner, M. and Müller, R.A., 2004. Microbial processes of heavy metal removal
from carbon‐deficient effluents in constructed wetlands. Engineering in Life
Sciences, 4(5), pp.403-411.
Koupaie, E.H., Moghaddam, M.A. and Hashemi, H., 2011. Comparison of overall
performance between moving-bed and conventional sequencing batch reactor.
Iranian Journal of Environmental Health Science & Engineering, 8(3), p.235.
Kumar, S., Katoria, D. and Singh, G., 2013. Leachate Treatment Technologies.
International Journal of Environmental Engineering and Management, 4, Number,
439-444.
Kuusik, A., Pachel, K., Kuusik, A. and Loigu, E., 2014, January. Landfill runoff water
and landfill leachate discharge and treatment. In Environmental Engineering.
Proceedings of the International Conference on Environmental Engineering.
ICEE (Vol. 9, p. 1). Vilnius Gediminas Technical University, Department of
Construction Economics & Property.
Lim, P.E., Lim, S.P., Seng, C.E. and Noor, A.M., 2010. Treatment of landfill leachate
in sequencing batch reactor supplemented with activated rice husk as
adsorbent. Chemical Engineering Journal, 159(1), pp.123-128.
Liu, S., 2013. Landfill leachate treatment methods and evolution of Hedeskoga and
Masalycke landfills (Doctoral dissertation, Thesis, Sweden: Luden University)

104
[Online]. Available at: http://www.vateknik.lth.se/exjobbR/E709.pdf [Accessed on
4th Jun 2016]
Liu, X., Chen, Y., Zhang, X., Jiang, X., Wu, S., Shen, J., Sun, X., Li, J., Lu, L. and
Wang, L., 2015. Aerobic granulation strategy for bioaugmentation of a sequencing
batch reactor (SBR) treating high strength pyridine wastewater, Journal of
Hazardous Materials, 295, pp.153-160.
Made-in-China.com, 2017. [Hot Item] Aluminum Sulphate for Water Treatment.
[online] Available at: http: //yuyinchem.en.made-in-
china.com/product/tBkJUoGuajWz/China-Aluminum-Sulphate-for-Water-
Treatment.html [Accessed 25th March 2017].
Madera, C. and Valencia-Zuluaga, V., 2009, October. Landfill leachate treatment: one
of the bigger and underestimated problems of the urban water management in
developing countries. In 9th World Wide Workshop for Young Environmental
Scientists WWW-YES-Brazil-2009: Urban waters: resource or risks? (No. 12).
Mahvi, A.H., 2008. Sequencing batch reactor: a promising technology in wastewater
treatment. Journal of Environmental Health Science & Engineering, 5(2), pp.79-
90.
Maier, R.M., 2000. Bacterial growth. In: Maier, R.M., Pepper, I.L., Gebra, C.P. (Eds.),
Environmental Microbiology. Academic Press, UK, pp. 43–59.
Manaf, L.A., Samah, M.A.A. and Zukki, N.I.M., 2009. Municipal solid waste
management in Malaysia: Practices and challenges. Waste management, 29(11),
pp.2902-2906.
Mark Prein, P.E., 2012. ORP Improves Operational Efficiency. MWEA Annual
Conference. Prein & Newhof.
Masirin, M., Idrus, M., Ridzuan, M.B. and Mustapha, S., 2008. An overview of landfill
management and technologies: A Malaysian case study at Ampar Tenang. pp.157-
165.
Metcalf & Eddy, Aecom. (2014) WASTEWATER ENGINEERING: Treatment and
Resource Recovery. 5th ed. (International), Vol 1 & Vol 2, Mc Graw-Hill Book
Company.
Miles, B., 2013. Bioenergetics [online] Available at:
http://files.dep.state.pa.us/Water/BSDW/OperatorCertification/TrainingModules/
ww16_sludge_2_wb.pdf [Accessed on 26th February 2017].
Mojiri, A., Aziz, H.A., Zaman, N.Q., Aziz, S.Q. and Zahed, M.A., 2014. Powdered
ZELIAC augmented sequencing batch reactors (SBR) process for co-treatment of
landfill leachate and domestic wastewater, Journal of Environmental Management,
139, pp.1-14.

105
Mor, S., Ravindra, K., Dahiya, R.P. and Chandra, A., 2006. Leachate characterization
and assessment of groundwater pollution near municipal solid waste landfill
site. Environmental monitoring and assessment, 118(1-3), pp.435-456.
Negeri Perak, 2013. Maklumat Asas: Pihak Berkuasa Tempatan. (NEGERI PERAK
DARUL RIDZUAN) [Online]. Available at:
https://www.perak.gov.my/images/menu_utama/ms/rakyat/dataasaspbt2013.pdf
[Accessed on 10th July 2016]
Ngo, H.H., Guo, W. and Xing, W., 2008. Applied technologies in municipal solid
waste landfill leachate treatment. Encyclopedia of life support systems
(EOLSS), pp.17.
Noor, Z.Z., Yusuf, R.O., Abba, A.H., Hassan, M.A.A. and Din, M.F.M., 2013. An
overview for energy recovery from municipal solid wastes (MSW) in Malaysia
scenario. Renewable and Sustainable Energy Reviews, 20, pp.378-384.
NPTEL.ac.in., 2013. Lecture 5 Sequening batch Reactor [online] Available at:
http://nptel.ac.in/courses/103107084/module4/lecture5/lecture5.pdf [Accessed on
26th February 2017].
Pa. DEP., 2014. Module 16: The Activated Sludge Process Part II (Wastewater
Treatment Plant Operator Certification Training). [online] Available at:
http://files.dep.state.pa.us/Water/BSDW/OperatorCertification/TrainingModules/
ww16_sludge_2_wb.pdf [Accessed on 22nd February 2017].
Peng, Y., 2013. Perspectives on technology for landfill leachate treatment. Arabian
Journal of Chemistry.
Periathamby, A., Hamid, F. and Khidzir, K., 2009. Evolution of solid waste
management in Malaysia: impacts and implications of the solid waste bill,
2007. Journal of Material Cycles and Waste Management, 2(11), pp.96-103.
Pernitsky, D.J. and Edzwald, J.K., 2006. Selection of alum and polyaluminum
coagulants: principles and applications. Journal of Water Supply: Research and
Technology-AQUA, 55(2), pp.121-141.
Poltak, R, F., 2005. SEQUENCING BATCH REACTOR DESIGN AND
OPERATIONAL CONSIDERATIONS. New england interstate water pollution
control commission.
Pondsolutions.com., 2017. "How to Determine Electric Cost, Operating Electricity
Cost" [online] Available at: https://www.pondsolutions.com/determine-electric-
cost/ [Accessed on 26th February 2017].
Raghab, S.M., Meguid, A.M.A.EI., Hegazi, H.A., 2013. Treatment of leachate from
municipal solid waste landfill, HBRC Journal, 9, 2, 187-192.

106
Renou, S., Givaudan, J.G., Poulain, S., Dirassouyan, F. and Moulin, P., 2008. Landfill
leachate treatment: review and opportunity. Journal of hazardous materials, 150(3),
pp.468-493.
Richard, M., 2003. ACTIVATED SLUDGE MICROBIOLOGY PROBLEMS AND
THEIR CONTROL. 20th Annual USEPA National Operator Trainers Conference
Buffalo. pp 1- 21.
Rittman, B.E. and McCarty, P.L., 2001. Environmental Biotechnology: Principles and
Applications. International edition, Mc Graw-Hill Book Company.
Sakawi, Z., 2011. Municipal solid waste management in Malaysia: solution for
sustainable waste management. Journal of Applied Sciences in Environmental
Sanitation, 6(1), 29-38.
Salem, Z., Hamouri, K., Djemaa, R. and Allia, K., 2008. Evaluation of landfill leachate
pollution and treatment. Desalination, 220(1), 108-114.
Samadi, M.T., Saghi, M.H., Rahmani, A., Hasanvand, J., Rahimi, S. and Syboney,
M.S., 2010. Hamadan landfill leachate treatment by coagulation-flocculation
process. Iranian Journal of Environmental Health Science & Engineering, 7(3),
p.253.
Saukkoriipi, J., 2010. THEORETICAL STUDY OF THE HYDROLYSIS OF
ALUMINIUM COMPLEXES. ACTA University of Oulu, A scientiae Rerum
Naturalium. A 554.
Shekdar, A.V., 2009. Sustainable solid waste management: an integrated approach for
Asian countries. Waste management, 29(4), pp.1438-1448.
Singh, M. and Srivastava, R.K., 2011. Sequencing batch reactor technology for
biological wastewater treatment: a review. Asia‐Pacific Journal of Chemical
Engineering, 6(1), pp.3-13.
Slack, R.J., Gronow, J.R. and Voulvoulis, N., 2005. Household hazardous waste in
municipal landfills: contaminants in leachate. Science of the total
environment, 337(1), pp.119-137.
Strande, L., Ronteltap, M. and Brdjanovic, D., 2014. Faecal Sludge Management:
System Approach for Implementation and Operation. IWA Publishing
Tarmudi, Z., Abdullah, M.L. and Tap, A.O.M., 2012. A Review of Municipal Solid
Waste Management in Malaysia. Jurnal Teknologi, 57(1), pp.41-56.
Tenaga Nasional Berhad, TNB., 2017. Electricity Pricing And Tariffs Rates [online]
Available at: https://www.tnb.com.my/residential/pricing-tariffs [Accessed on 26th
February 2017].
Thestar.com.my., 2011. New RM19mil centralised sanitary landfill in Papan on a
224ha area by March – Community: The Star Online. [online] Available at:

107
http://www.thestar.com.my/news/community/2011/12/01/new-rm19mil-
centralised-sanitary-landfill-in-papan-on-a-224ha-area-by-march/ [Accessed on 7
Aug. 2016].
The United Nations, 2014. SECTION 1: REQUIREMENTS FOR WATER
TREATMENT PLANT AND WATER NETWORK [online] Available at:
http://www.un.org/Depts/oip/dp/dp10/03-01.pdf [Accessed on 25th February 2017].
Tiansiang.com., 2016. Overview: Tian Siang Group. [online] Available at:
http://www.tiansiang.com/?page_id=177 [Accessed on 23rd July 2016].
UNITED NATIONS ENVIRONMENT PROGRAMME (UNEP), 2005. Training
Module: Closing of an Open Dumpsite and Shifting from Open Dumping to
Controlled Dumping and to Sanitary Land Filling. Department of Environment and
Natural Resources. Republic of the Philippines.
USAID, 2016. Chapter 6: Landfilling and Open Dump Closure. (Solid Waste
Management Privatization Procedure Manual, Egyptian Environmental Policy
Program) Available at: http://pdf.usaid.gov/pdf_docs/Pnacy344.pdf [Accessed on
10th July 2016]
Wei, Y., Ji, M., Li, R. and Qin, F., 2012. Organic and nitrogen removal from landfill
leachate in aerobic granular sludge sequencing batch reactors. Waste Management,
32(3), pp.448-455.
Wisonsin Department of Natural Resources., 2012. Advance Activated Sludge Study
Guide [online] Available at:
http://dnr.wi.gov/regulations/opcert/documents/wwsgactsludgeadv.pdf [Accessed
on 19th February 2017].
Wiszniowski, J., Robert, D., Surmacz-Gorska, J., Miksch, K. and Weber, J.V., 2006.
Landfill leachate treatment methods: A review. Environmental Chemistry Letters,
4(1), pp.51-61.
Yabroudi, S.C., Morita, D.M. and Alem, P., 2013. Landfill leachate treatment over
nitritation/denitritation in an activated sludge sequencing batch reactor. APCBEE
Procedia, 5, pp.163-168.
Yu, D., 2007. Landfill Leachate Treatment Case Study, SRV Atervinning, Sweden.

108
APPENDICES
APPENDIX A TABLES OF EXPERIMENTAL RESULTS
Table A1: Results for MLSS in The SBRs Respective to Days
Days (Date) Mixed Liquor Suspended Solids, MLSS (mg/L)
SBR (Aeration Rate)
SBR 1 (1 L/min) SBR 2 (3 L/min) SBR 3 (5 L/min)
1 (9/11/2016) 9,300 9,300 10,300
6 (14/11/2016) 8,400 7,800 7,300
9 (17/11/2016) 8,200 6,100 6,800
13(21/11/2016) 5,300 5,700 4,900
16 (24/11/2016) 4,100 4,500 4,400
21(29/11/2016) 3,200 4,300 3,700
23(1/12/2016) 3,800 3,700 4,000
26(4/12/2016) 3,200 3,200 3,300
35(13/12/2016) 4,500 2,800 3,300
37(15/12/2016) 3,100 3,500 3,400
39(17/12/2016) 2,600 3,500 3,400
42(20/12/2016) 2,600 4,200 3,700
44(22/12/2016) 2,700 4,100 3,700
Table A2: Results for MLVSS in The SBRs Respective to Days
Days (Date) Mixed Liquor Volatile Suspended Solids, MLVSS (mg/L)
SBR (Aeration Rate)
SBR 1 (1 L/min) SBR 2 (3 L/min) SBR 3 (5 L/min)
1 (9/11/2016) 6,200 6,300 7,000
6 (14/11/2016) 6,900 5,800 5,400
9 (17/11/2016) 5,700 4,400 3,900
13(21/11/2016) 3,300 3,900 3,400
16 (24/11/2016) 2,900 3,200 3,200
21(29/11/2016) 2,400 2,400 2,700
23(1/12/2016) 2,800 2,500 3,000
26(4/12/2016) 2,600 2,600 2,200
35(13/12/2016) 3,100 2,000 3,100
37(15/12/2016) 2,100 2,500 2,200
39(17/12/2016) 1,400 2,500 2,400

109
42(20/12/2016) 2,000 2,500 2,400
44(22/12/2016) 2,000 3,600 2,900
Table A3: Results for SBR Treatment for COD, NH3-N, TSS and Colour
Parameter SBR 1 (1
L/min)
SBR 2 (3
L/min)
SBR 3 (5
L/min)
Raw
Leachate
mg/L % mg/L % mg/L % mg/L
COD 2,640 54.95 2,920 50.17 2,960 49.49 6,420
NH3-N 73 92.36 50 94.77 28 97.07 956
TSS 100 54.55 102 53.64 100 54.55 220
Colour
(PtCo)
3,294 26.96 3,188 29.32 2,810 37.70 4,510
Table A4: Results for pH Optimisation of Coagulation Process by ALUM
Respective to COD, NH3-N, TSS and Colour
pH COD NH3-N TSS Colour
mg/L % mg/L % mg/L % PtCo %
4.0 3,284 0.48 64 -3.23 122 -7.96 1,463 54.28
5.0 2,528 23.39 65 -4.84 95 15.93 1,866 41.69
6.0 2,736 17.09 68 -9.68 64 43.36 2,498 21.94
7.0 2,478 24.91 66 -6.45 66 41.59 2,203 31.16
8.0 2,801 15.12 60 3.23 71 37.17 2,520 21.25
9.0 2,978 9.76 61 1.61 70 38.05 3,445 -7.66
Table A5: Results for Dosage Optimisation of Coagulation Process by ALUM
Respective to COD, NH3-N, TSS and Colour
Dosage
(mg/L)
COD NH3-N TSS Colour
mg/L % mg/L % mg/L % PtCo %
0.2 2,980 9.70 81 -30.65 65 42.48 3,342 -4.44
0.5 2,892 12.36 82 -32.26 66 41.59 3,102 3.06
1.0 2,628 20.36 80 -29.03 63 44.25 2,490 22.19
1.5 2,290 30.61 78 -25.81 67 40.71 2,100 34.38
2.0 2,107 36.15 70 -12.90 64 43.36 978 69.44
3.0 1,467 55.55 61 1.61 31 72.57 560 82.50
4.0 1,189 63.97 58 6.45 21 81.42 630 80.31
5.0 970 70.61 55 11.29 18 84.07 640 80.00
6.0 1,020 69.09 55 11.29 18 84.07 645 79.84

110
Table A6: Results for Total Treatment Combining SBR and Coagulation
Process Respective to COD, NH3-N, TSS and Colour
Parameter Raw Leachate After SBR (3 L/min) After Coagulation
mg/L % mg/L % mg/L %
COD 6,420 0 3,300 48.60 970 84.89
NH3-N 956 0 62 93.51 55 94.25
TSS 220 0 113 48.64 18 91.82
Colour 4,510 0 3,200 29.05 640 85.81
Table A7: Results for Heavy Metal Concentrations in Raw Leachate and in
Final Treated Leachate Respective to The Removal Efficiency, %
Heavy Metal Concentration, mg/L Removal, %
Raw Leachate Treated Leachate
Cadmium 0.54 0.027 95.00
Arsenic 0.43 0.28 34.88
Lead 3.46 0.17 95.09
Copper 13.01 0.60 95.39
Manganese 0.83 0.64 22.89
Nickel 0.46 0.27 41.30
Zinc 7.51 4.41 41.28
Iron 23.18 8.60 62.90
Silver 0.94 0.47 50.00
Selenium 0.65 0.00 100.00
Barium 1.10 0.14 87.27