Embed Size (px)
Citation preview
PANPA Print Cost Technical Workshop
Nigel FinchDirector, Centre for Managerial FinanceMacquarie Graduate School of Management (MGSM)
Agenda
– Industry Challenges & Profit Trends
– Cost Behaviour & Type
– Cost Allocation Methods & Limitations
– Activity Based Costing (ABC)
– The Cost of Capacity & Pricing
– Recommendations
Industry challenges
A daunting array of challenges...
The print industry is a mature industry and as such will likely grow at a slower rate than the overall economy.
The industry still remains highly fragmented, and suffers from chronic overcapacity, and intense competition.
Rapid technological improvements demand larger and more frequent capital investments.
New media and communications platforms are challenging the primacy of commercially printed materials.
A daunting array of challenges...
Coupled with other economic factors, these challenges converge to place print industry profits under constant pressure.
To remain competitive in this environment, and maintain profitability, it is crucial to have a clear picture of the real economic cost for producing print jobs, providing other ancillary services, and servicing individual customers needs.
Profitability trends
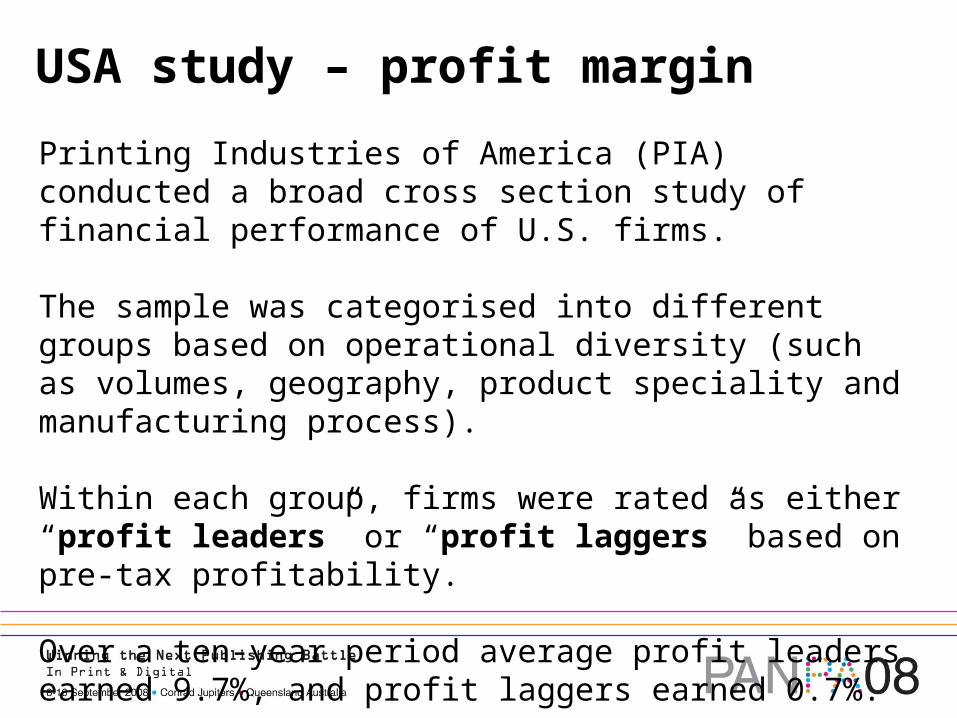
USA study – profit margin
Printing Industries of America (PIA) conducted a broad cross section study of financial performance of U.S. firms.
The sample was categorised into different groups based on operational diversity (such as volumes, geography, product speciality and manufacturing process).
Within each group, firms were rated as either “profit leaders” or “profit laggers” based on pre-tax profitability.
Over a ten-year period average profit leaders earned 9.7%, and profit laggers earned 0.7%.
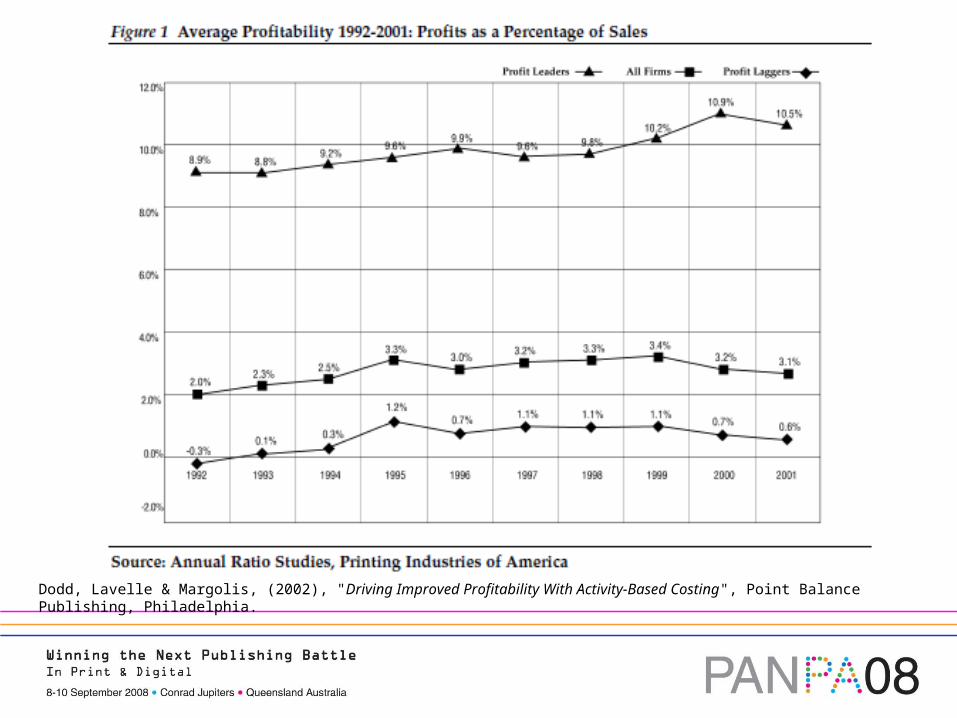
Dodd, Lavelle & Margolis, (2002), "Driving Improved Profitability With Activity-Based Costing", Point Balance Publishing, Philadelphia.
Profit leaders vs. profit laggers
So what distinguishes a profit leader from a profit lagger?
One significant financial characteristic is that, on average, they spend fewer dollars on support expenses for each dollar of revenue.
Support expenses include overheads but exclude direct production costs, interest and depreciation.
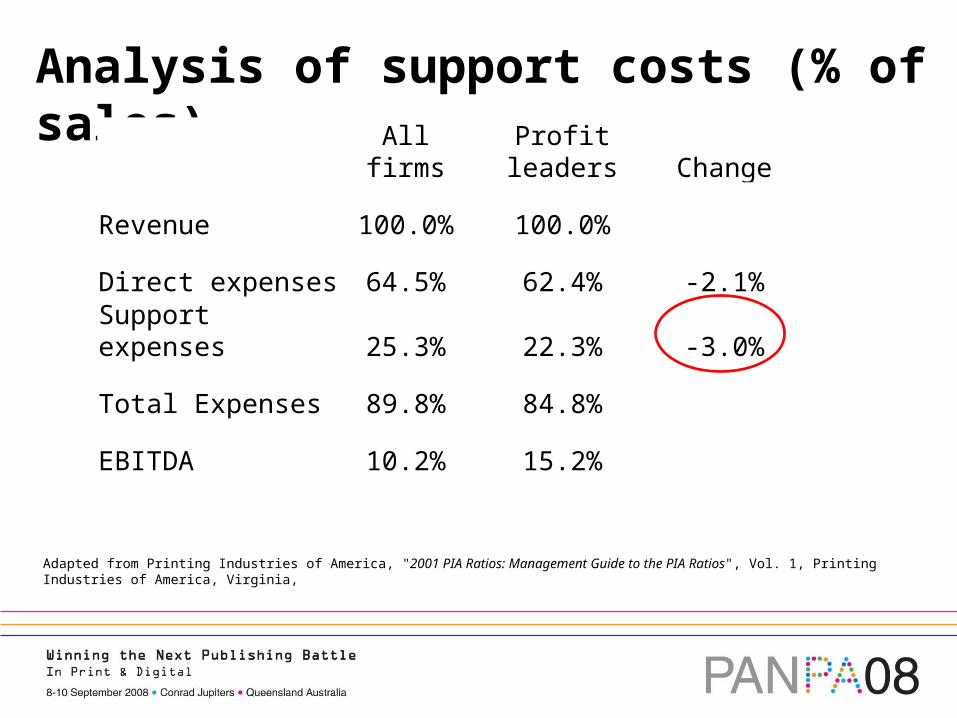
Analysis of support costs (% of sales)
All firms Profit leaders Change
Revenue 100.0% 100.0%
Direct expenses 64.5% 62.4% -2.1%
Support expenses 25.3% 22.3% -3.0%
Total Expenses 89.8% 84.8%
EBITDA 10.2% 15.2%
Adapted from Printing Industries of America, "2001 PIA Ratios: Management Guide to the PIA Ratios", Vol. 1, Printing Industries of America, Virginia,
Questioning support expensesHow do profit leaders gain control of support expenses to achieve superior financial performance?
Are some support expenses more important than others?
What activities and processes are responsible for generating and consuming support expenses?
How much does it cost to perform each of these activities and processes?
Gaining visibility into support expenses is therefore critical to managing and improving profitability.
Cost Behaviour
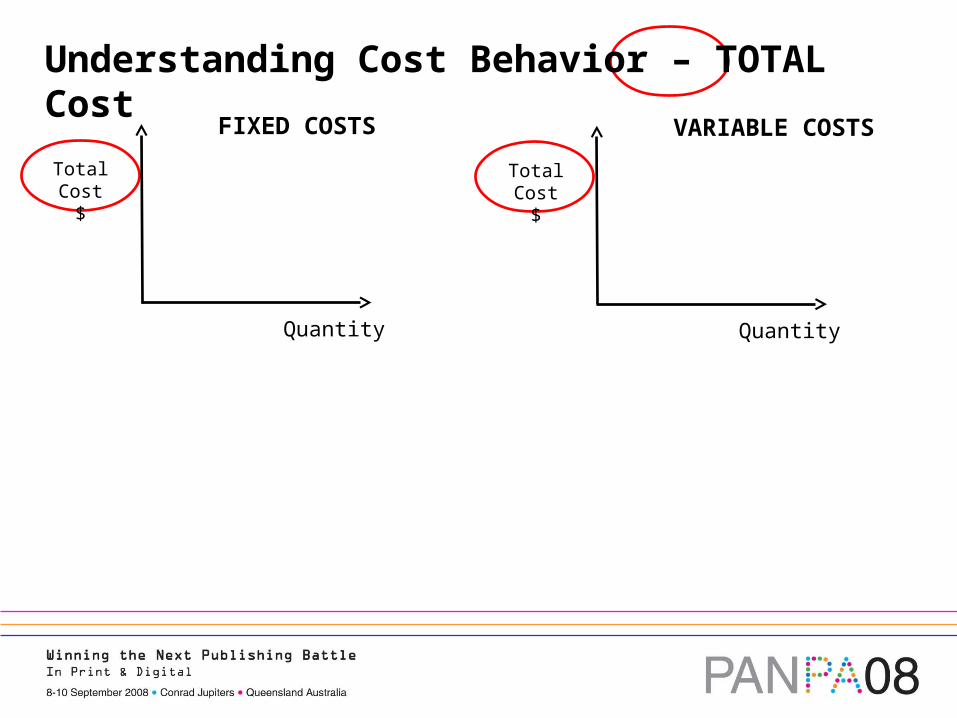
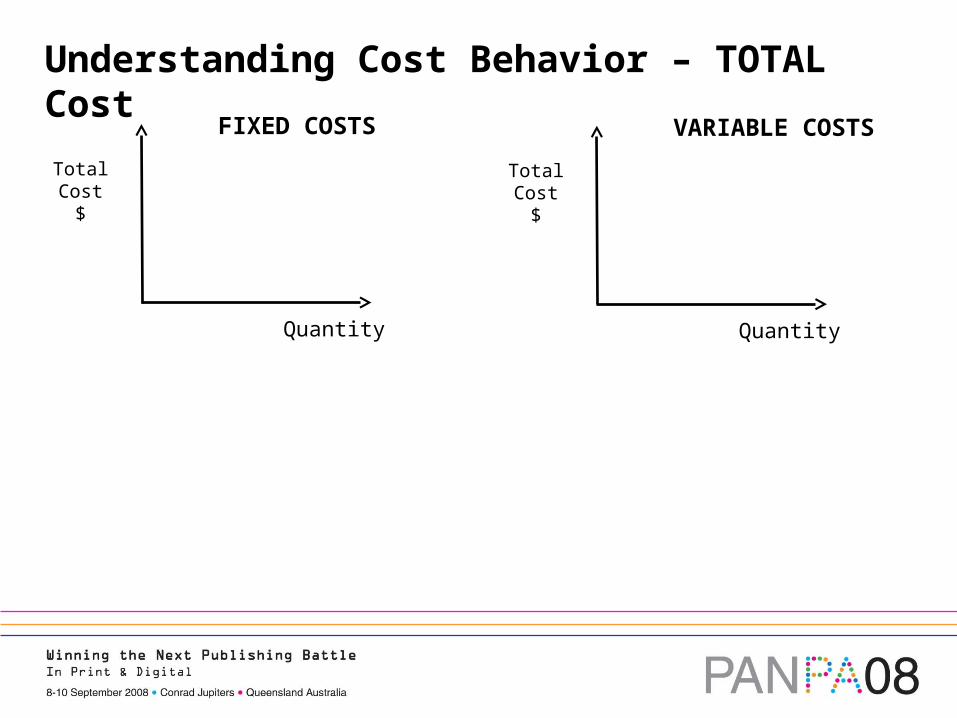
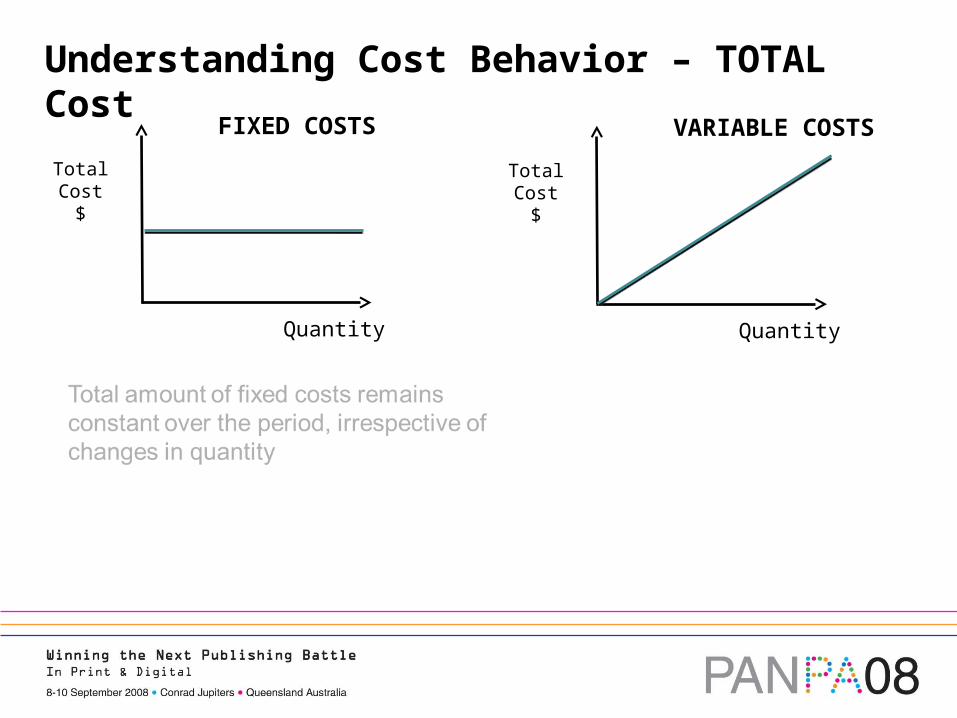
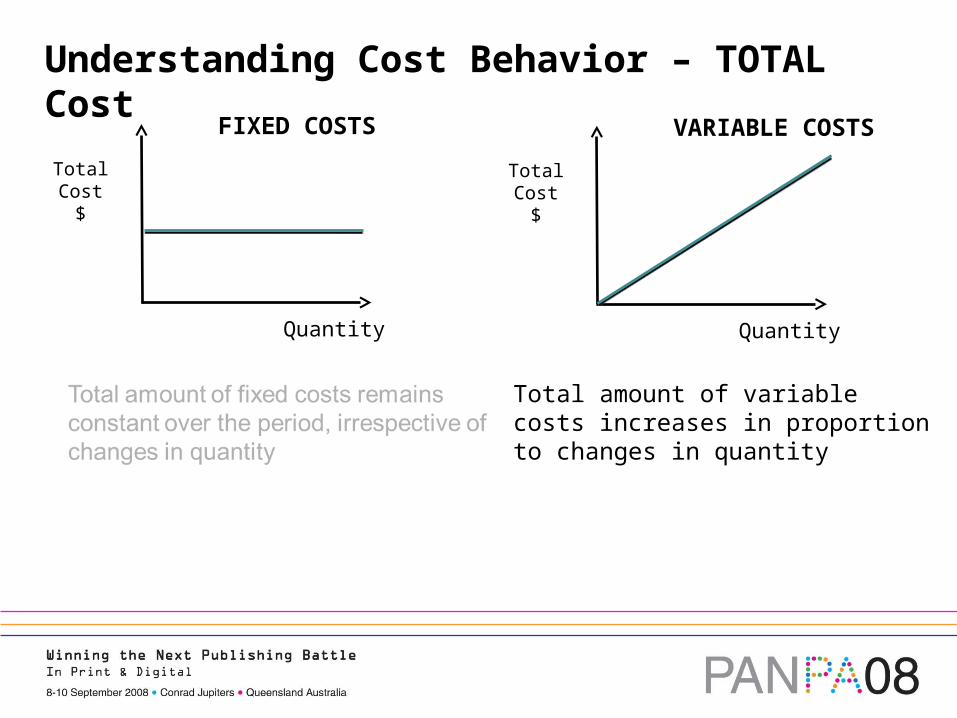
Understanding Cost Behavior – TOTAL Cost
Total Cost
$
Quantity
FIXED COSTS
Total Cost
$
Quantity
VARIABLE COSTS
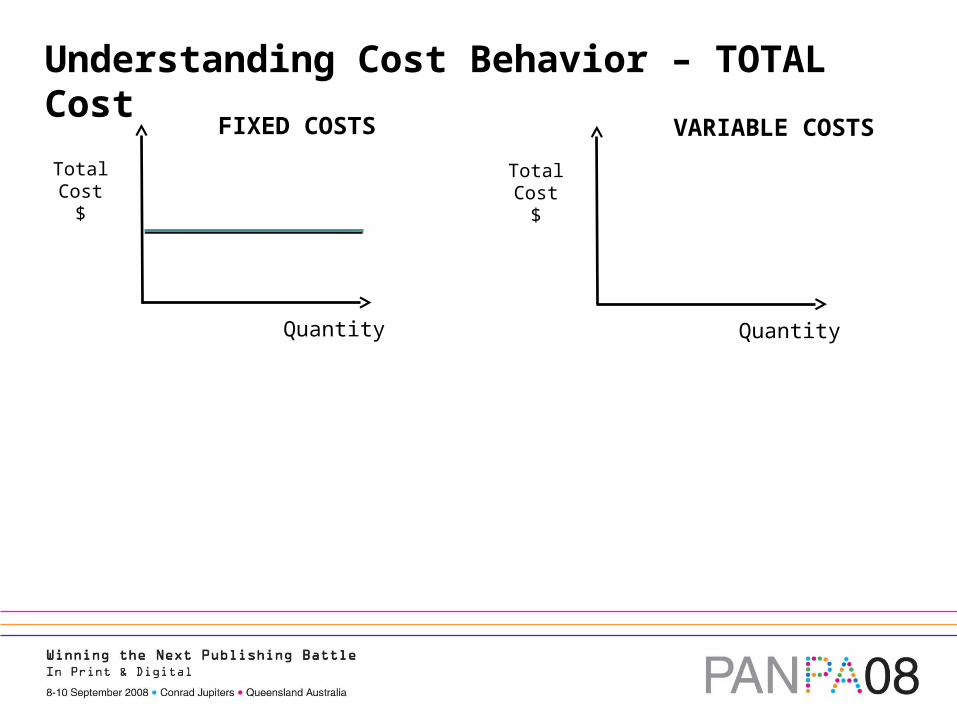
Understanding Cost Behavior – TOTAL Cost
Total Cost
$
Quantity
FIXED COSTS
Total Cost
$
Quantity
VARIABLE COSTS
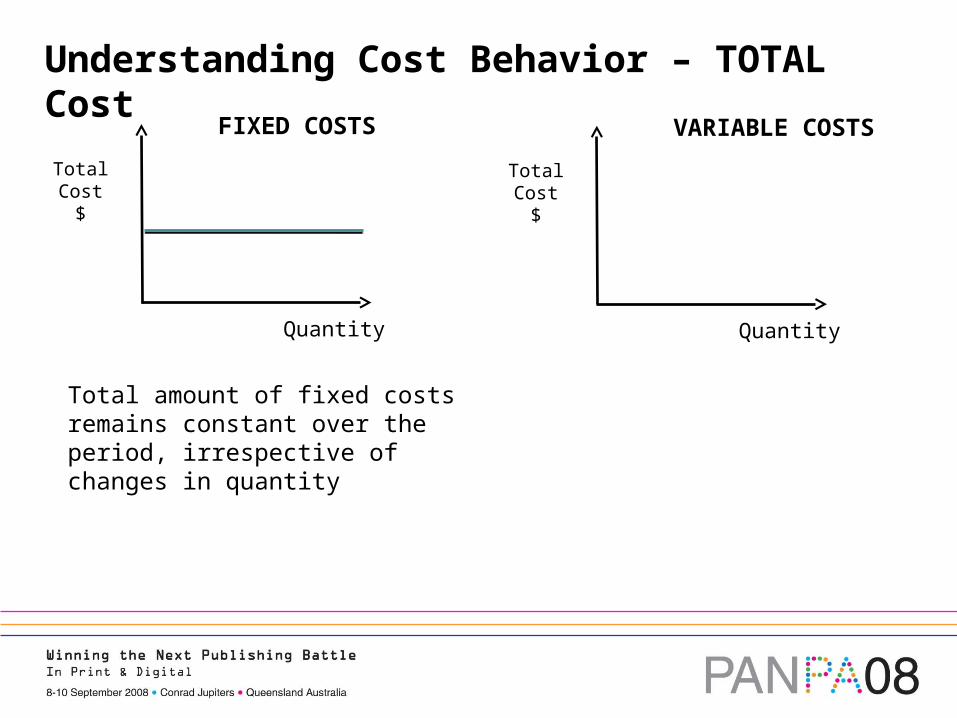
Understanding Cost Behavior – TOTAL Cost
Total Cost
$
Quantity
FIXED COSTS
Total Cost
$
Quantity
VARIABLE COSTS
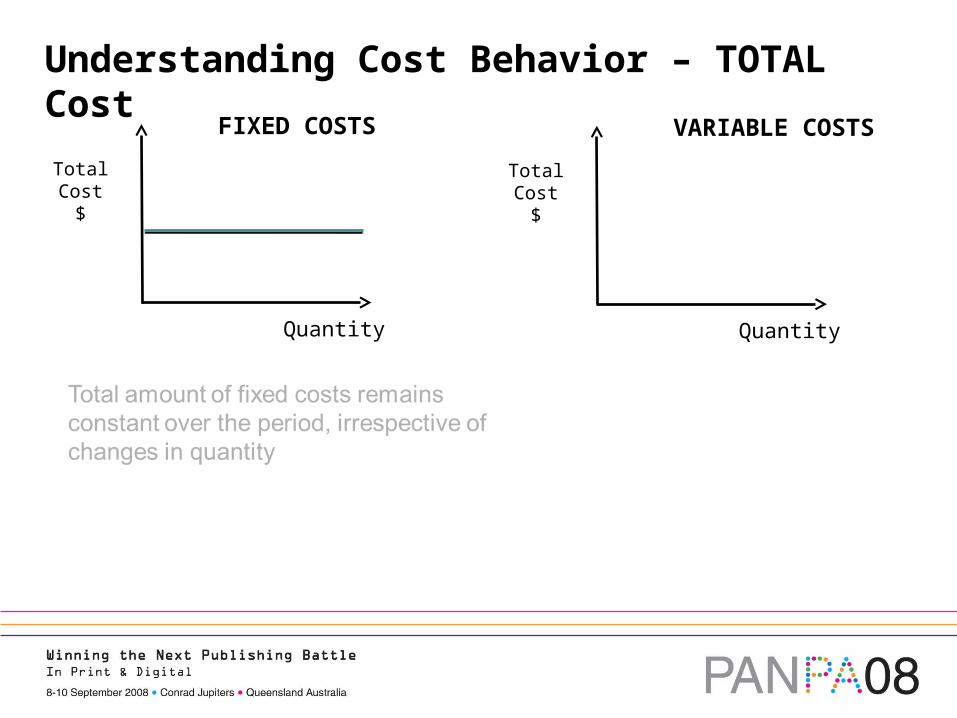
Understanding Cost Behavior – TOTAL Cost
Total Cost
$
Quantity
FIXED COSTS
Total Cost
$
Quantity
VARIABLE COSTS
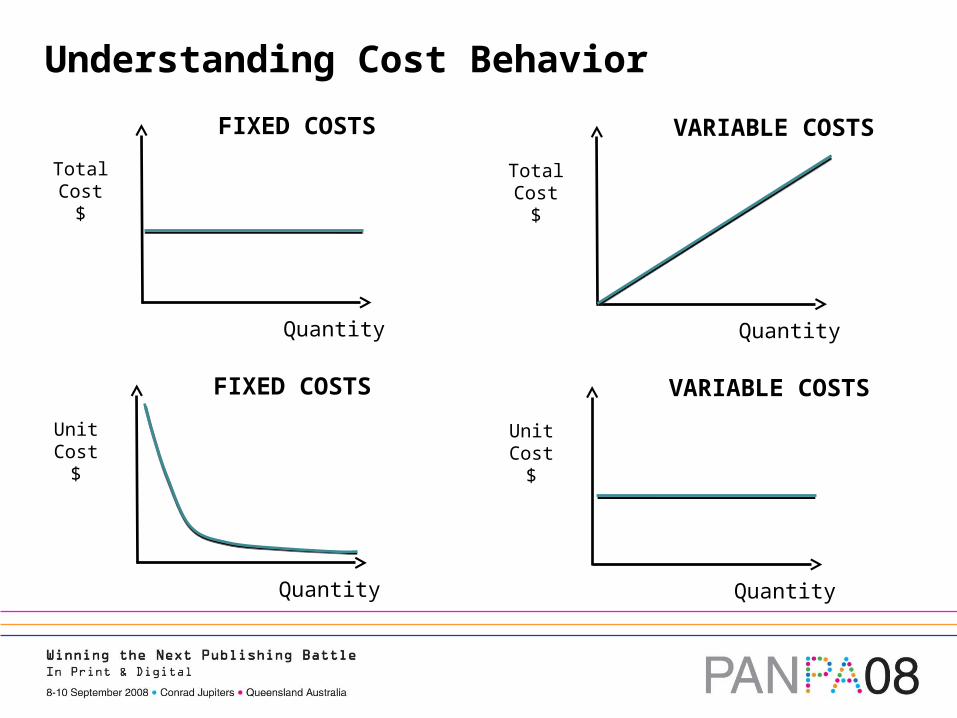
Total amount of fixed costs remains constant over the period, irrespective of changes in quantity
Understanding Cost Behavior – TOTAL Cost
Total Cost
$
Quantity
FIXED COSTS
Total Cost
$
Quantity
VARIABLE COSTS
Understanding Cost Behavior – TOTAL Cost
Total Cost
$
Quantity
FIXED COSTS
Total Cost
$
Quantity
VARIABLE COSTS
Understanding Cost Behavior – TOTAL Cost
Total Cost
$
Quantity
FIXED COSTS
Total Cost
$
Quantity
VARIABLE COSTS
Total amount of variable costs increases in proportion to changes in quantity
Unit Cost$
Quantity
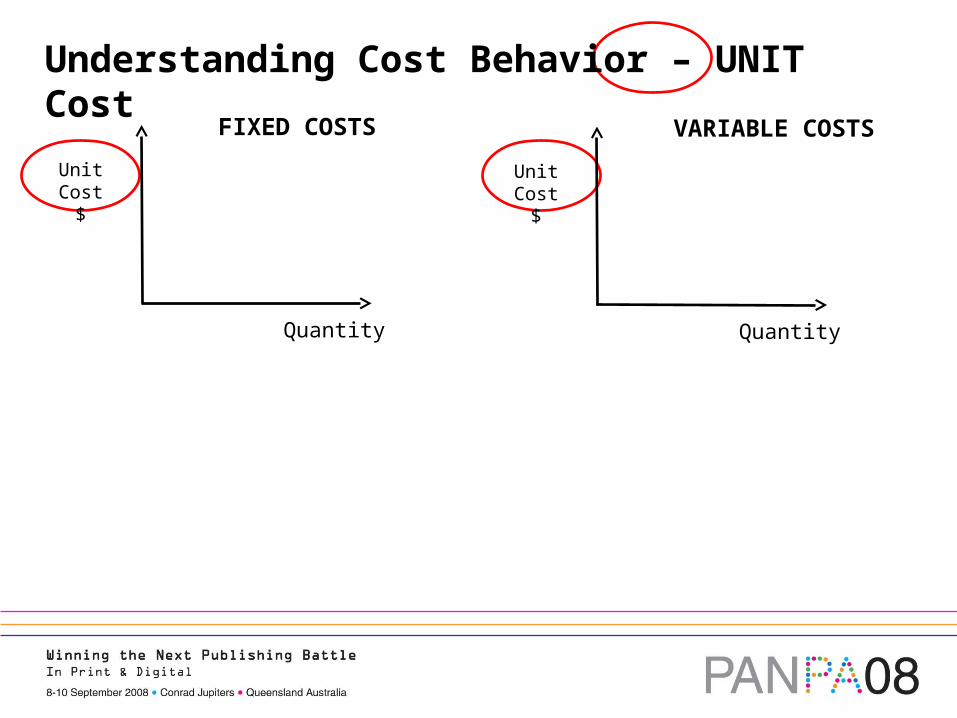
VARIABLE COSTS
Unit Cost$
Quantity
FIXED COSTS
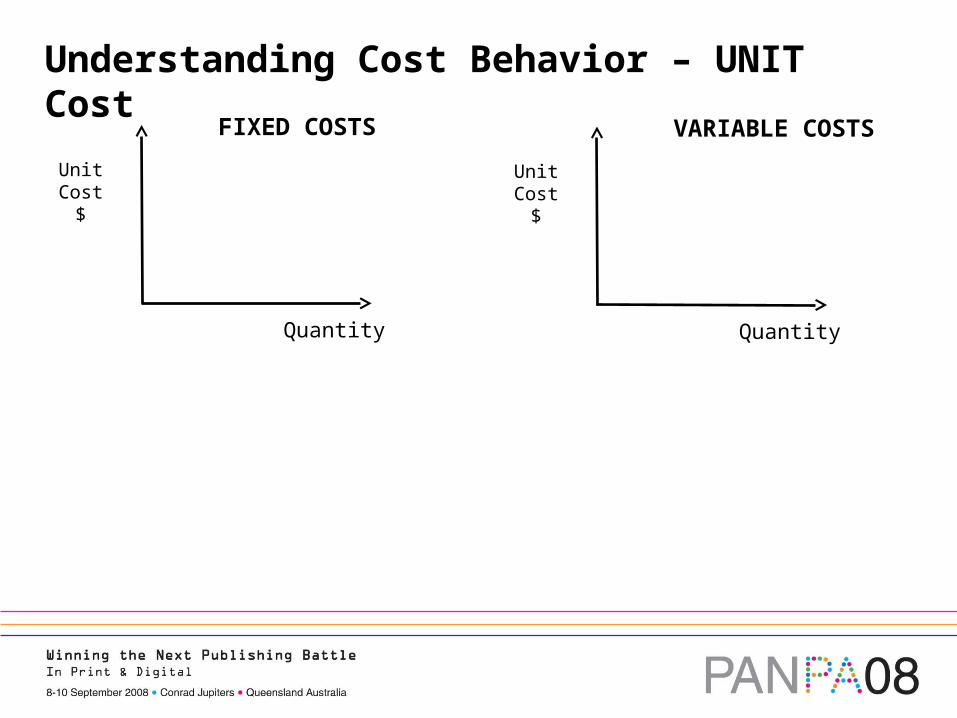
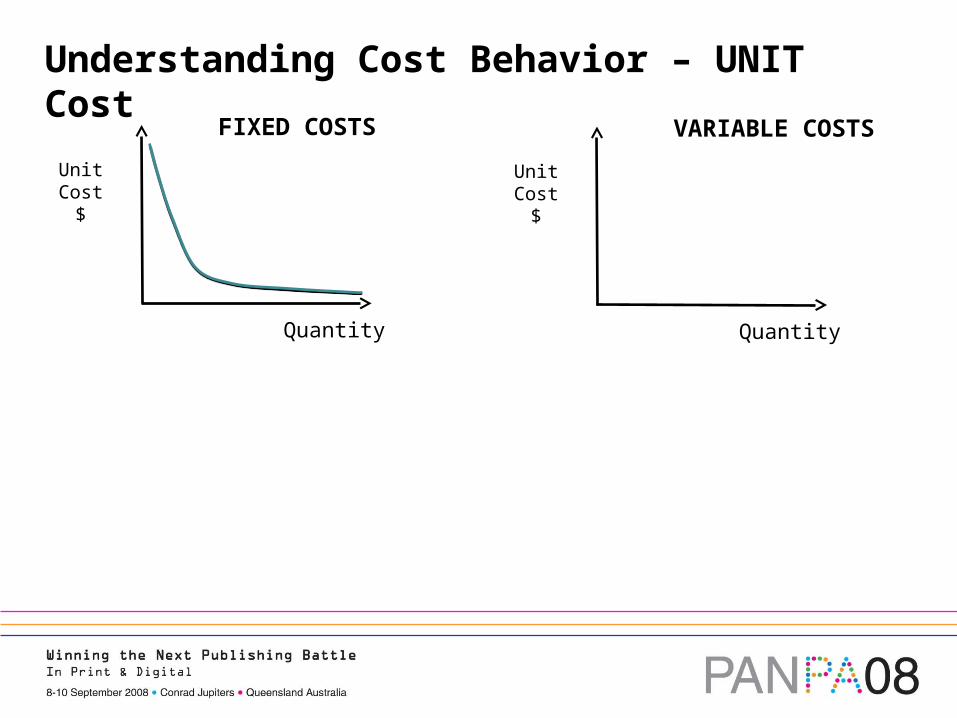
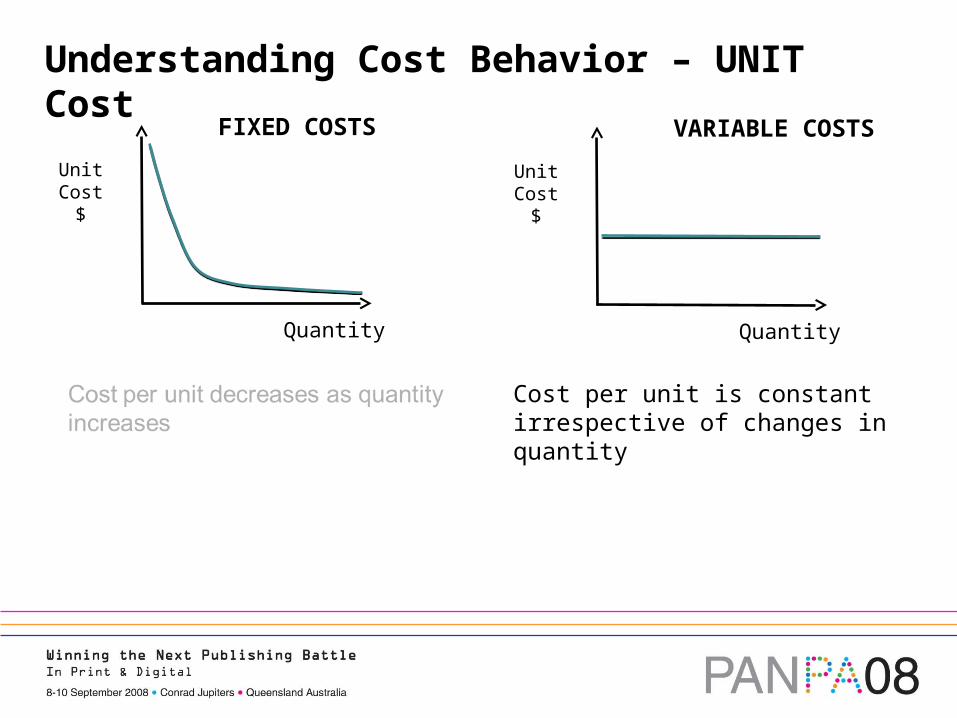
Understanding Cost Behavior – UNIT Cost
Unit Cost$
Quantity
VARIABLE COSTS
Unit Cost$
Quantity
FIXED COSTS
Understanding Cost Behavior – UNIT Cost
Unit Cost$
Quantity
VARIABLE COSTS
Unit Cost$
Quantity
FIXED COSTS
Understanding Cost Behavior – UNIT Cost
Unit Cost$
Quantity
VARIABLE COSTS
Unit Cost$
Quantity
FIXED COSTS
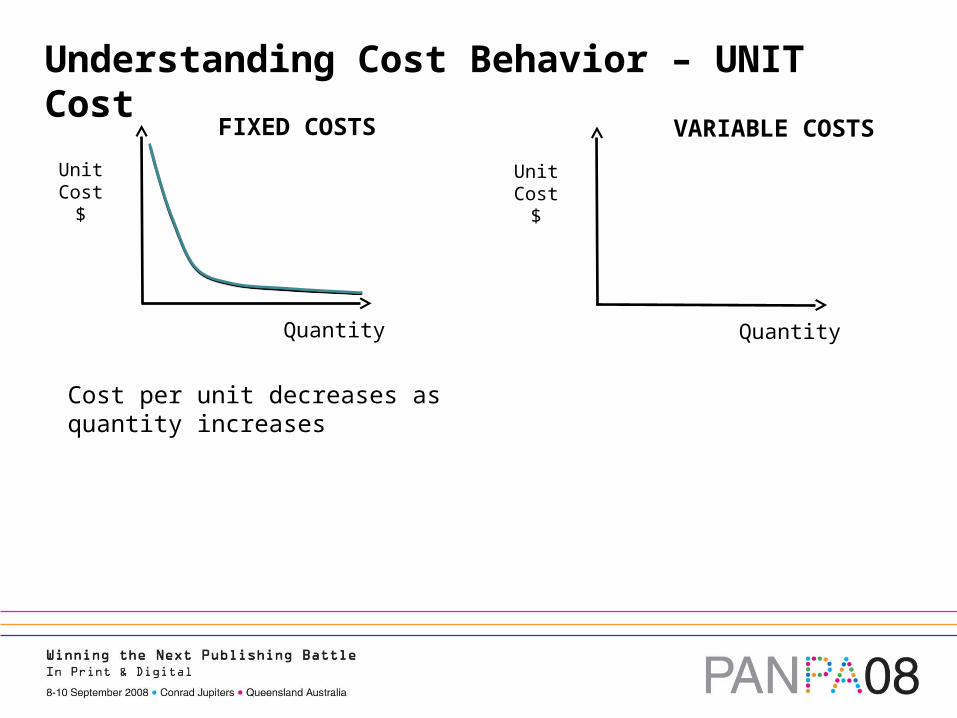
Understanding Cost Behavior – UNIT Cost
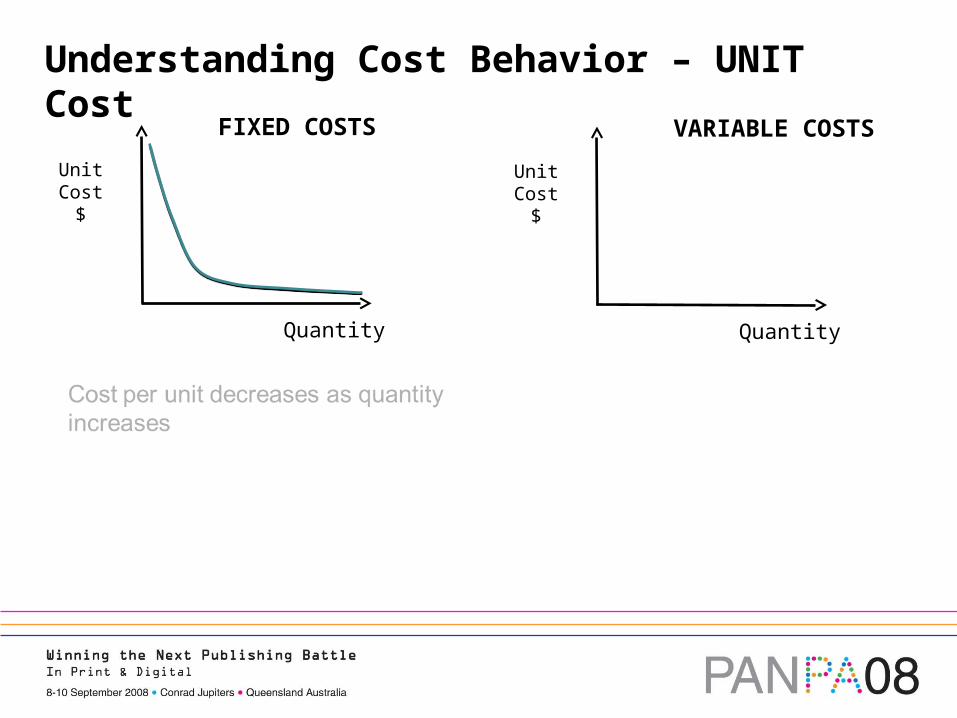
Cost per unit decreases as quantity increases
Unit Cost$
Quantity
VARIABLE COSTS
Unit Cost$
Quantity
FIXED COSTS
Understanding Cost Behavior – UNIT Cost
Unit Cost$
Quantity
VARIABLE COSTS
Unit Cost$
Quantity
FIXED COSTS
Understanding Cost Behavior – UNIT Cost
Unit Cost$
Quantity
VARIABLE COSTS
Unit Cost$
Quantity
FIXED COSTS
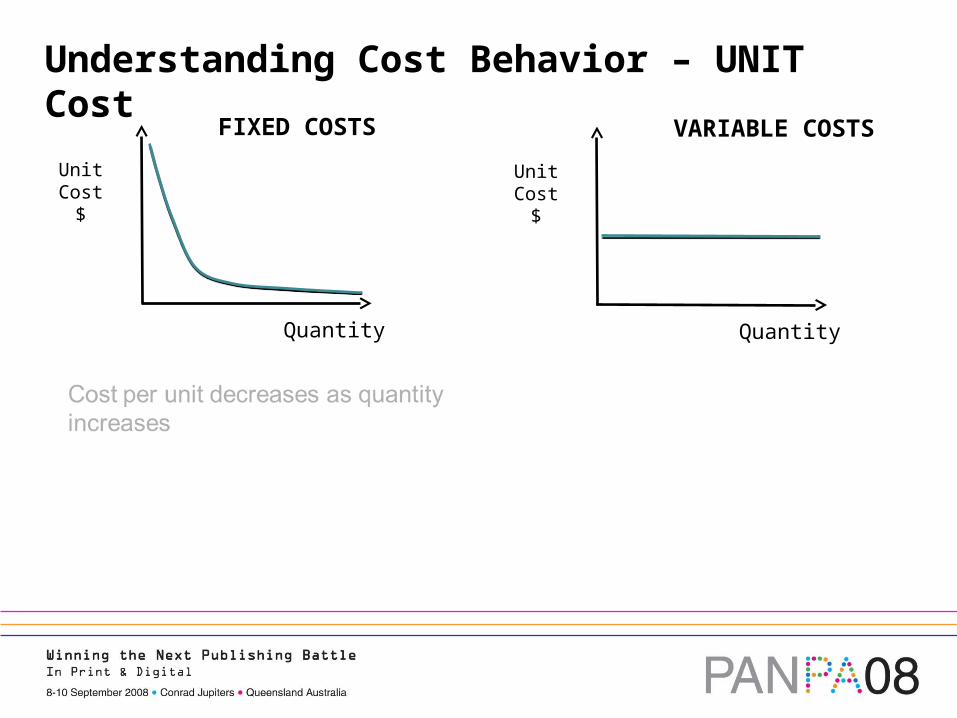
Understanding Cost Behavior – UNIT Cost
Cost per unit is constant irrespective of changes in quantity
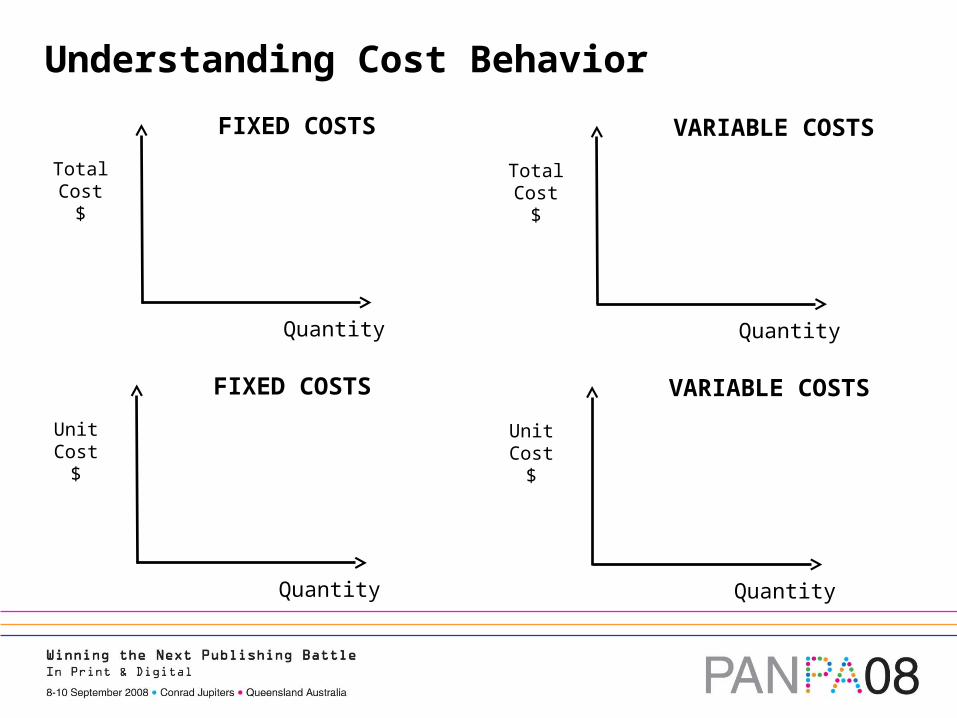
Understanding Cost Behavior
Total Cost
$
Quantity
FIXED COSTS
Total Cost
$
Quantity
VARIABLE COSTS
Unit Cost$
Quantity
FIXED COSTS
Unit Cost$
Quantity
VARIABLE COSTS
Understanding Cost Behavior
Total Cost
$
Quantity
FIXED COSTS
Total Cost
$
Quantity
VARIABLE COSTS
Unit Cost$
Quantity
FIXED COSTS
Unit Cost$
Quantity
VARIABLE COSTS
Direct vs. Indirect Cost
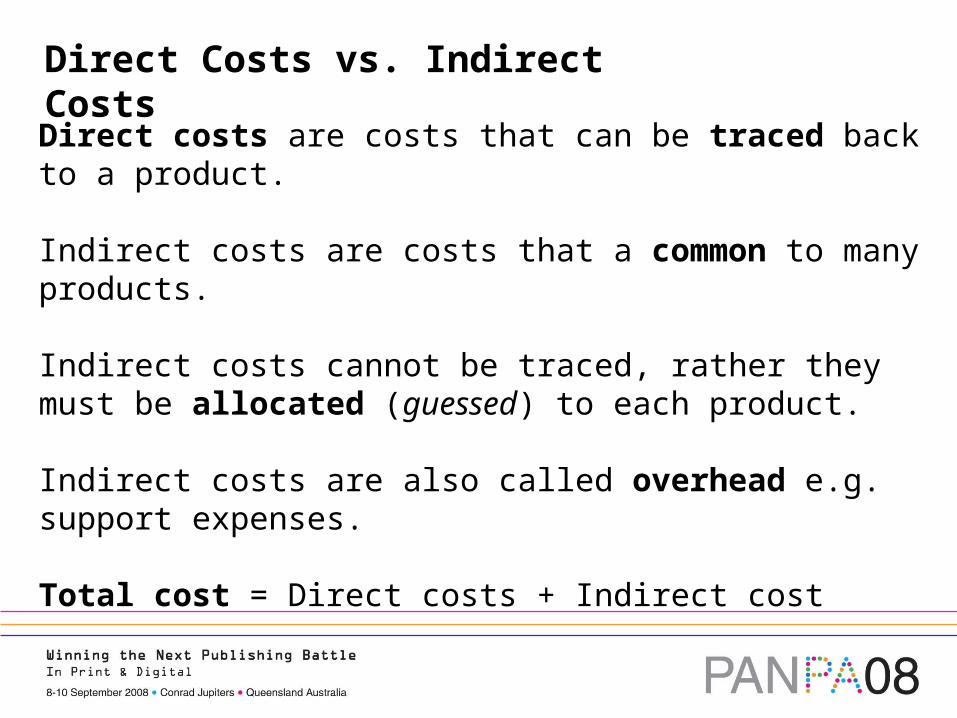
Direct Costs vs. Indirect Costs
Direct costs are costs that can be traced back to a product.
Indirect costs are costs that a common to many products.
Indirect costs cannot be traced, rather they must be allocated (guessed) to each product.
Indirect costs are also called overhead e.g. support expenses.
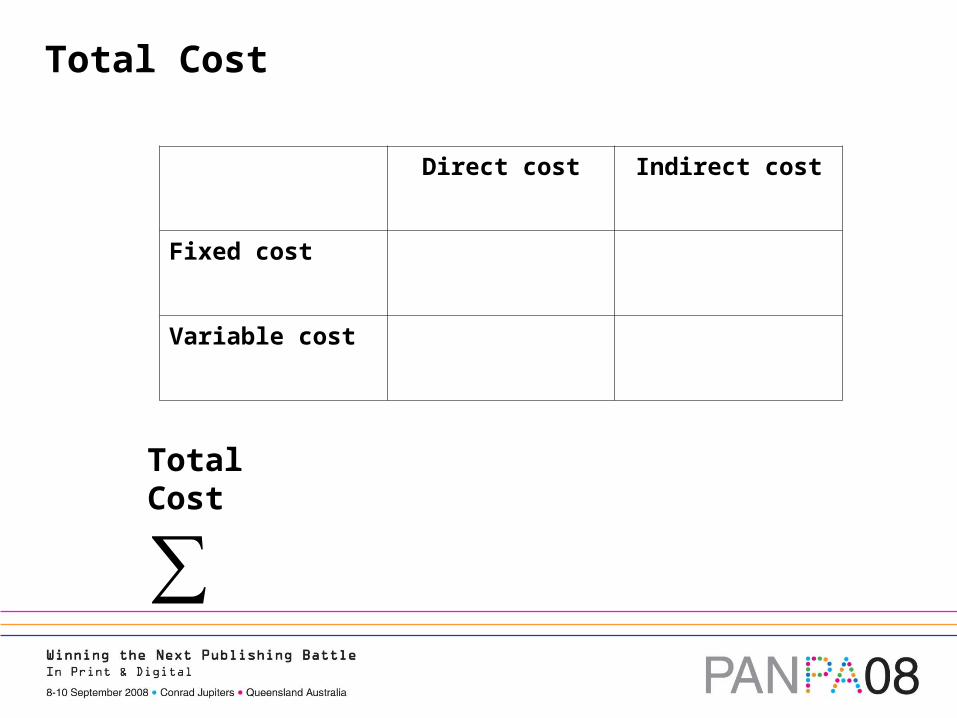
Total cost = Direct costs + Indirect cost
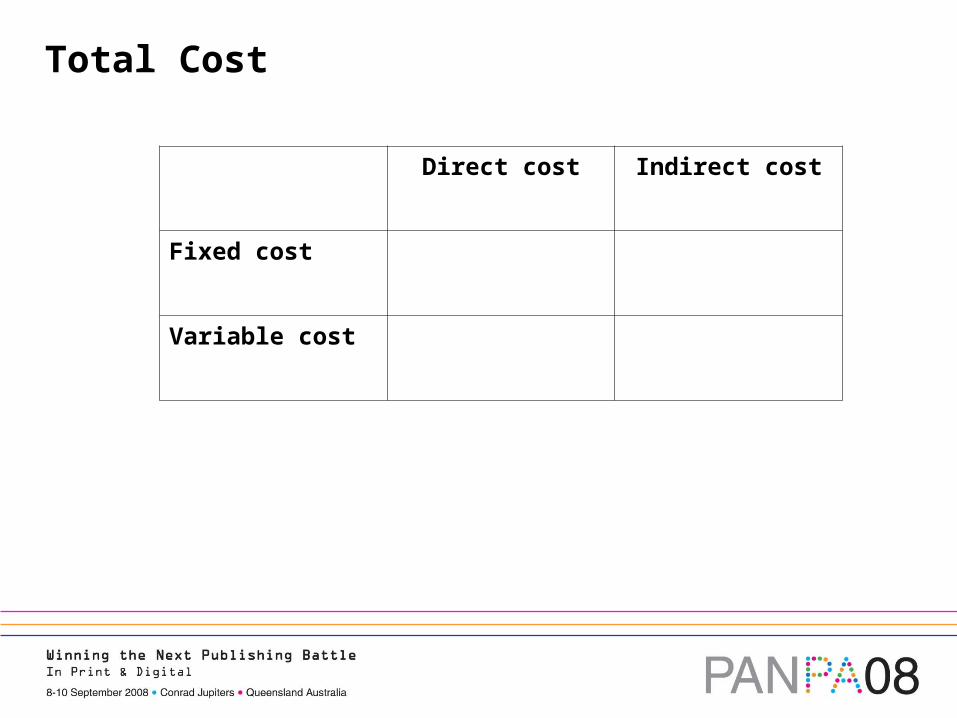
Total Cost
Direct cost Indirect cost
Fixed cost
Variable cost

Total Cost
Direct cost Indirect cost
Fixed cost
Variable cost
Total Cost
∑
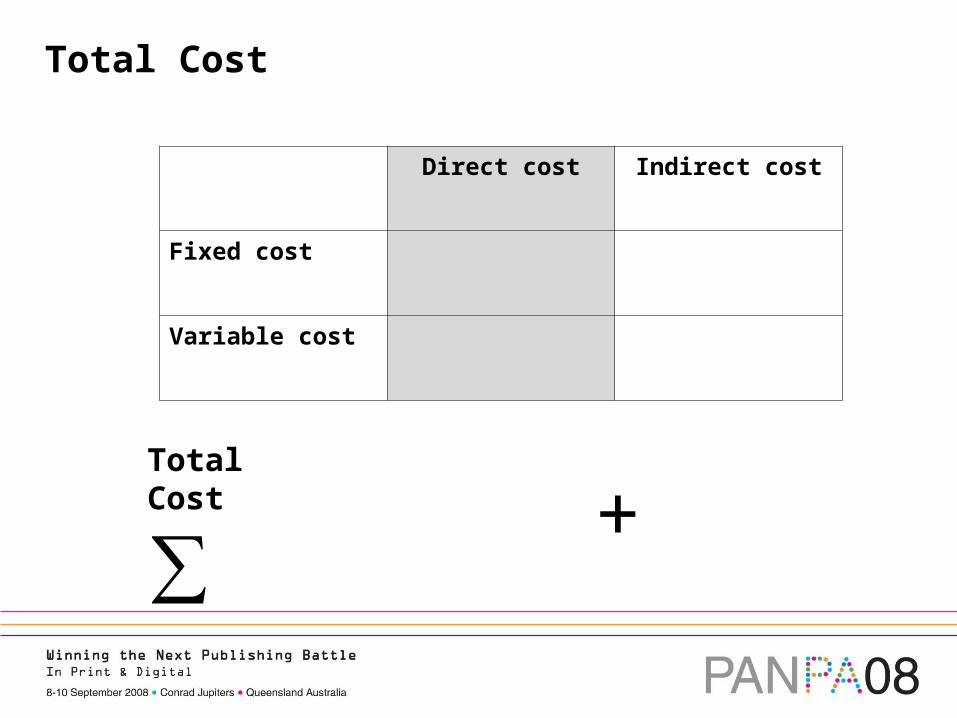
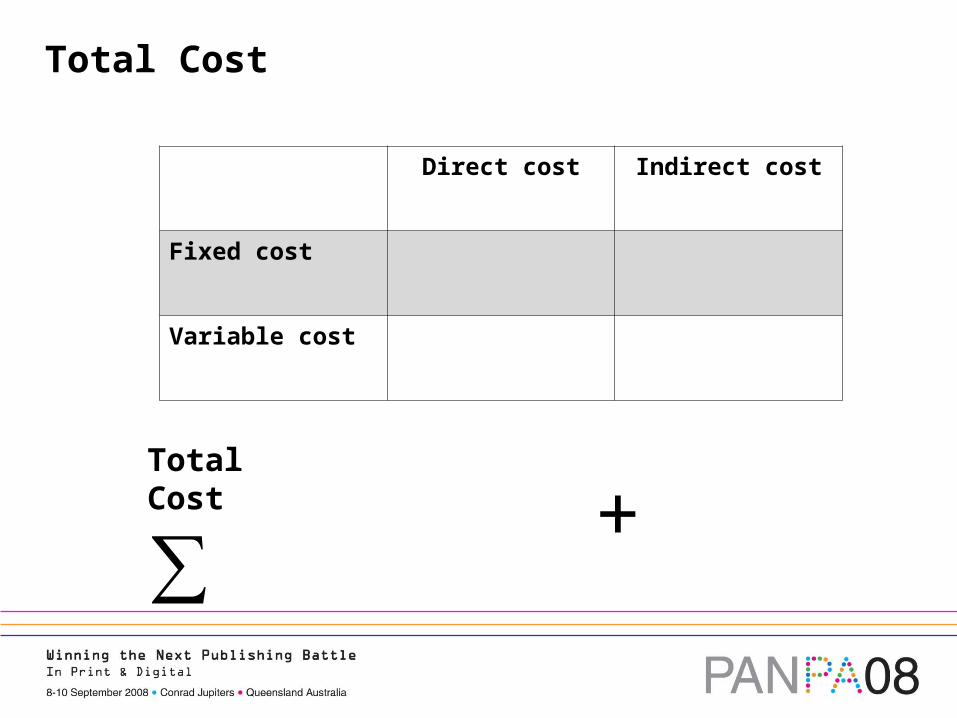
Total Cost
Direct cost Indirect cost
Fixed cost
Variable cost
+Total Cost
∑
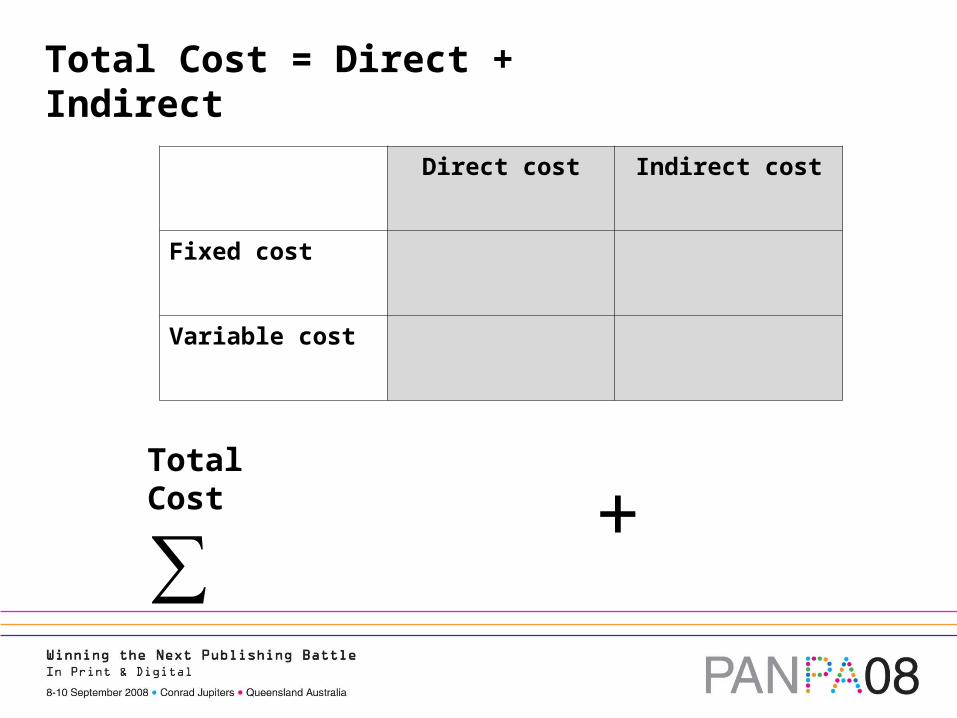
Total Cost = Direct + Indirect
Direct cost Indirect cost
Fixed cost
Variable cost
+Total Cost
∑
Total Cost
Direct cost Indirect cost
Fixed cost
Variable cost
Total Cost
∑
Total Cost
Direct cost Indirect cost
Fixed cost
Variable cost
+Total Cost
∑
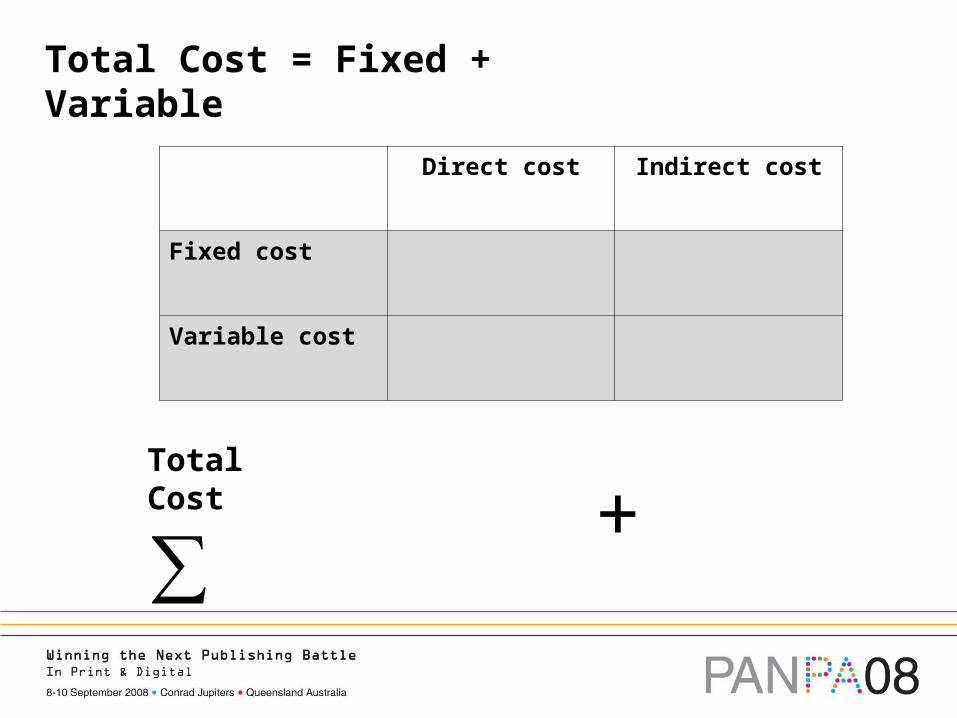
Total Cost = Fixed + Variable
Direct cost Indirect cost
Fixed cost
Variable cost
+Total Cost
∑
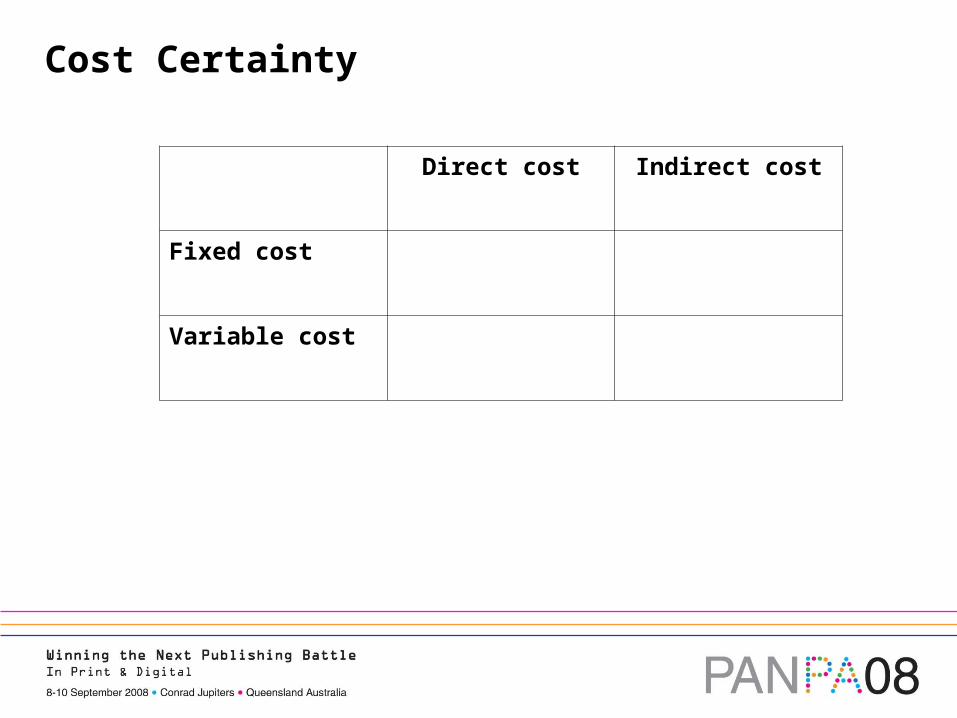
Cost Certainty
Direct cost Indirect cost
Fixed cost
Variable cost
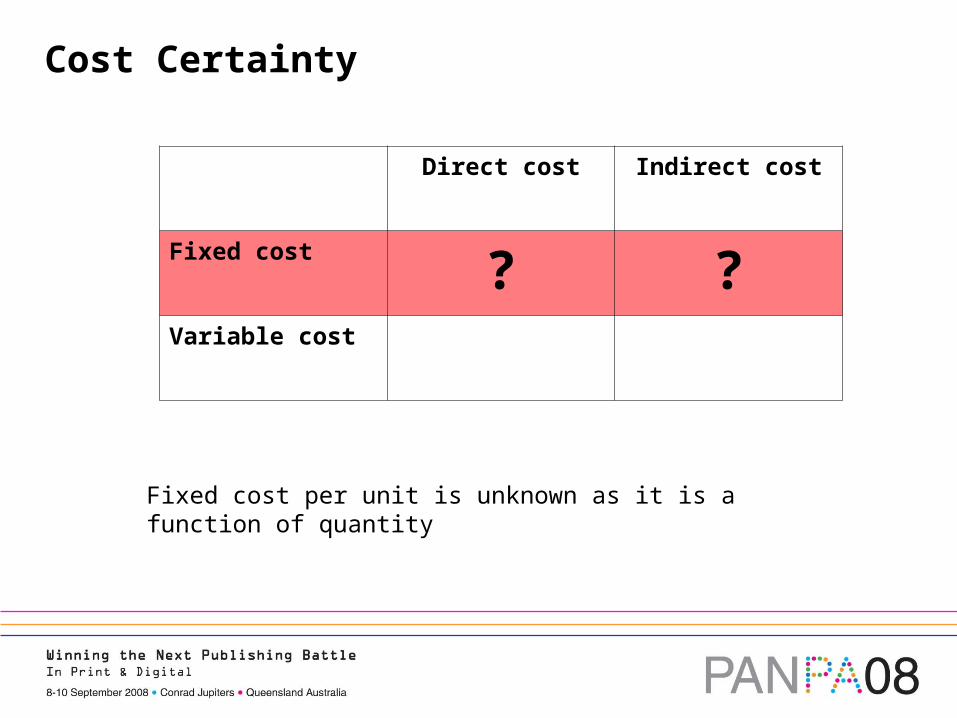
Cost Certainty
Direct cost Indirect cost
Fixed cost ? ?Variable cost
Fixed cost per unit is unknown as it is a function of quantity
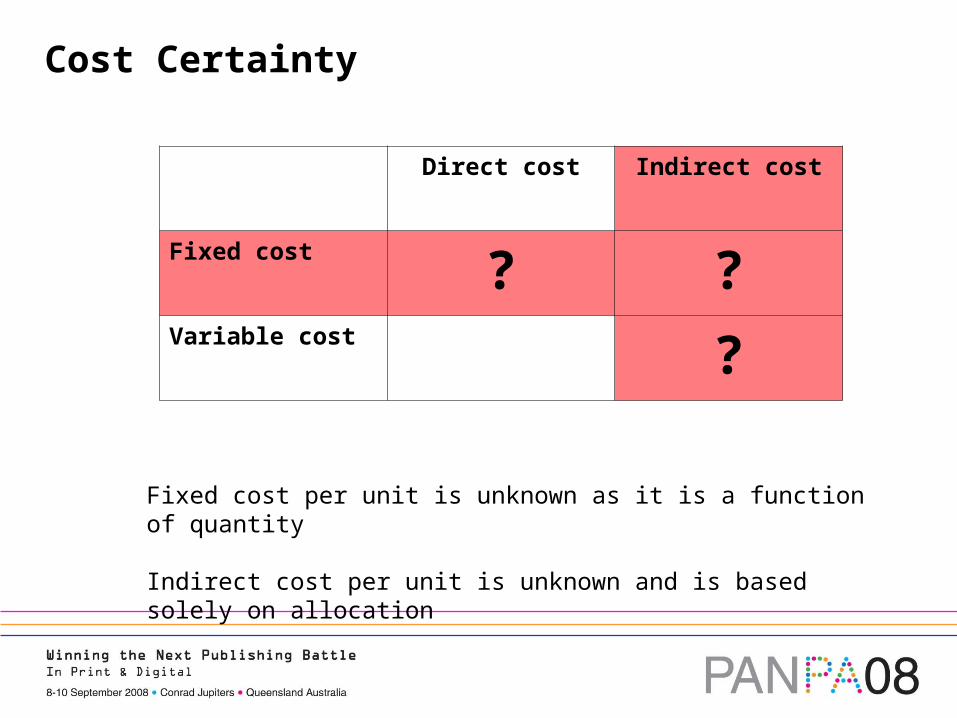
Cost Certainty
Direct cost Indirect cost
Fixed cost ? ?Variable cost ?
Fixed cost per unit is unknown as it is a function of quantity
Indirect cost per unit is unknown and is based solely on allocation

Cost Certainty
Direct cost Indirect cost
Fixed cost ? ?Variable cost ?
In determining cost per unit, direct variable cost is the only cost type that can be known with certainty.
Cost Allocation Methods
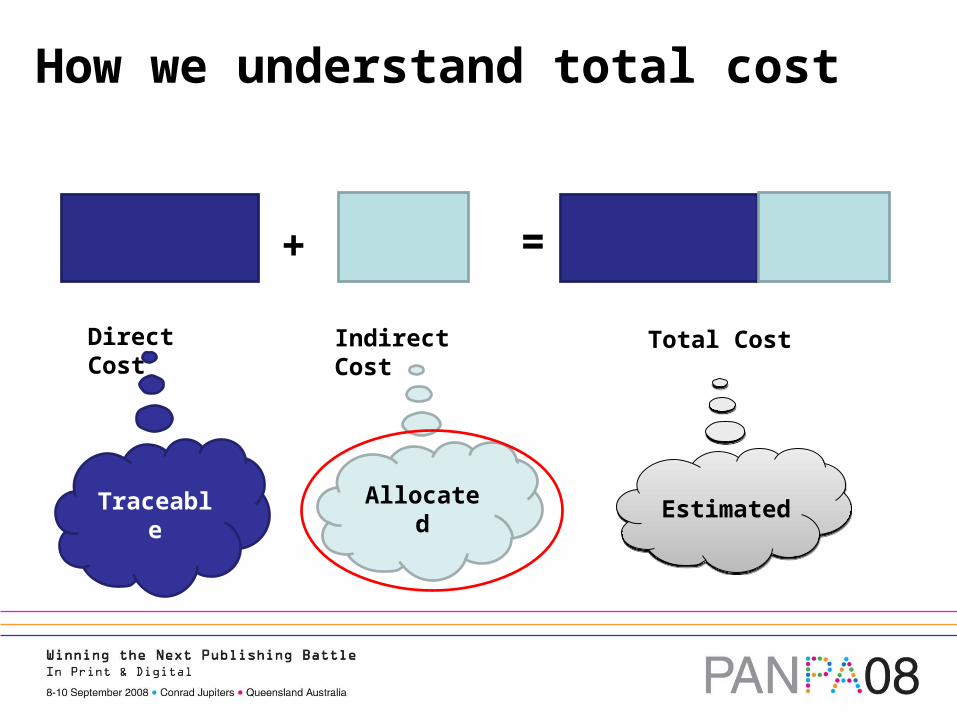
How we understand total cost
+ =
Direct Cost Indirect Cost Total Cost
Traceable Allocated EstimatedEstimated
Cost allocation methodology
Most of the features seen in today’s cost accounting systems were established in the 1930s.
While the business environment has undergone dramatic change since the 1970s, very little change has occurred in the fundamental principles used in estimating cost (and price).
The basic premise in business is to sell at a price above cost.
To determine cost (and hence set price), two approaches are generally used – direct cost and absorption cost.
Lockamy A., (2003), "A constraint-based framework for strategic cost management", Industrial Management & Data Systems, 103(8), pp. 591 – 599.
Direct cost vs. Absorption cost
Under direct costing, direct cost margins will accumulate to build up the necessary contribution to pay overheads before taking account of profit.
For example in setting price we might approach it using the adage “people, paper and profit”.
However, this assumes that jobs with a high proportion of direct costs consume an equally high proportional amount of indirect costs.
Q: Does printing on thicker stock consume more rent?
Direct cost vs. Absorption cost
Under absorption costing, an allocation of indirect costs is added to the direct costs for each job.
A mark up is then added to the total cost to arrive at a price, say cost plus 30%.
Absorption costing relies upon an allocation methodology to apportion an amount of indirect cost to each job.
In principle this is a “user-pays” system.
Understanding this methodology is critical to understanding the reliability of the cost estimate.
Cost allocation methodology
Under absorption costing, the proportion of indirect costs added to each job is based on the formula:
Estimated cost / Estimated activity
Estimated activity is generally defined as the planned activity of the cost driver.
A cost driver is an event associated with an activity that results in the consumption of the firm’s resources, for example labour hours.
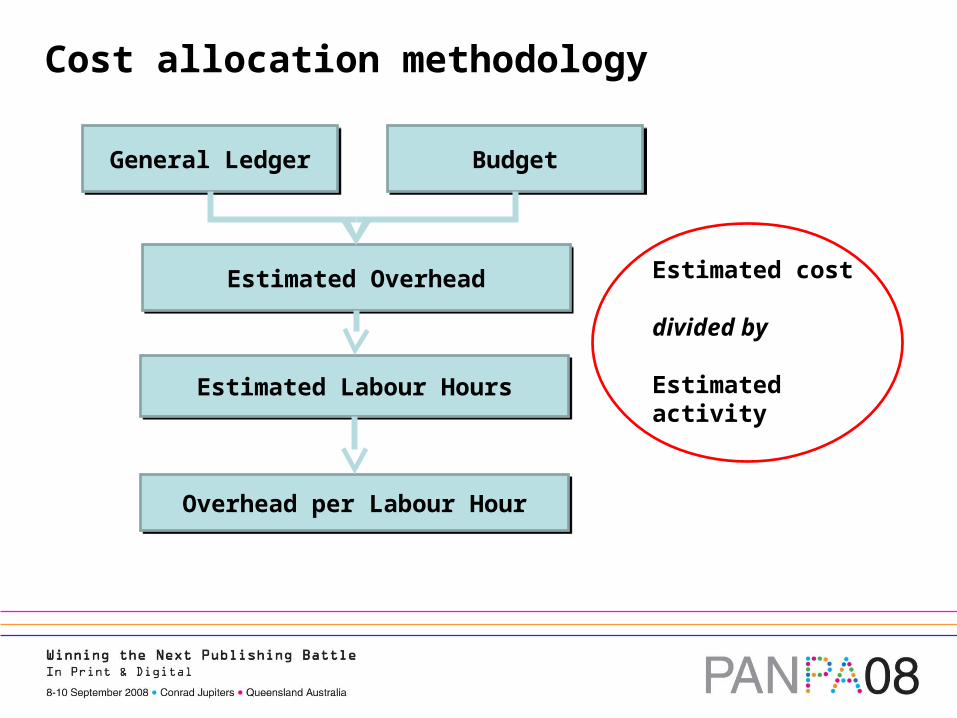
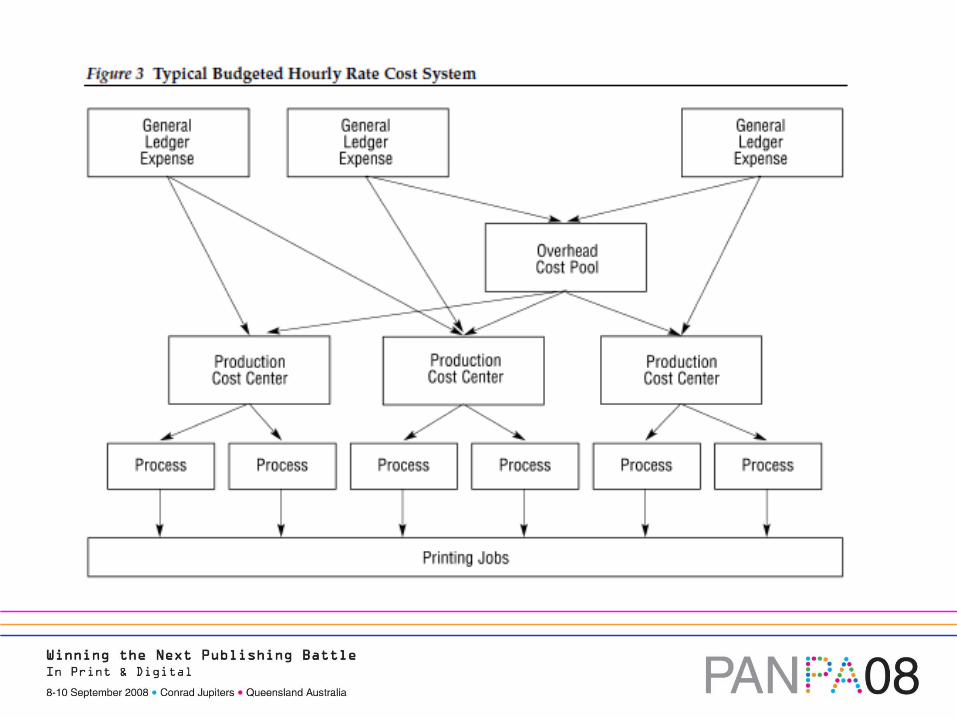
Cost allocation methodology
Estimated OverheadEstimated Overhead
General LedgerGeneral Ledger BudgetBudget
Estimated Labour HoursEstimated Labour Hours
Overhead per Labour HourOverhead per Labour Hour
Estimated cost
divided by
Estimated activity
Limitations in cost estimates

Why budgeted hourly rates are inadequate
Most firms use a Budgeted Hourly Rate (BHR) model to estimate costs, however BHR has 3 major limitations.
Firstly, there is no attempt to identify or define support activities, nor does it trace or assign costs to support activities.
By ignoring these support activities BHR systems make it impossible to see what activities and processes are causing support expenses to exist.
Without visibility into cost, there is no way to prioritise initiatives aimed at process improvement.
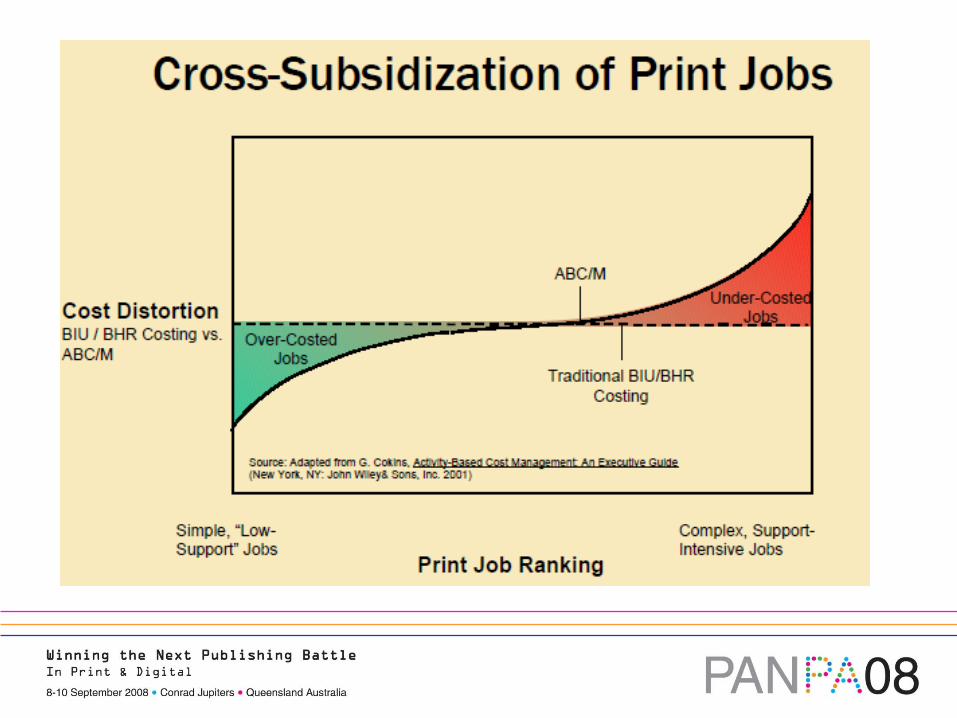
Why budgeted hourly rates are inadequate
Secondly, BHR systems force all support cost to be allocated to only one cost object – the individual print job.
Not all print jobs will consume all support costs. For example the salary of the manager has no causal relationship with the cost of any print job.
This process distorts the real economic cost of producing that job – especially problematic with transfer pricing.
This process assumes that all print jobs consume the support activities on the same proportion.
Why budgeted hourly rates are inadequate
Thirdly, by using estimated activity rates in calculating BHR values, this process not only fails to measure the costs of unused capacity, but actually conceals such costs.
Given the high levels of overcapacity, this makes it challenging to tackle the critical task of managing capacity and making capacity related decisions.
Without information on excess capacity and how much that excess is costing, managers cannot make capacity decisions on an economically rational basis.
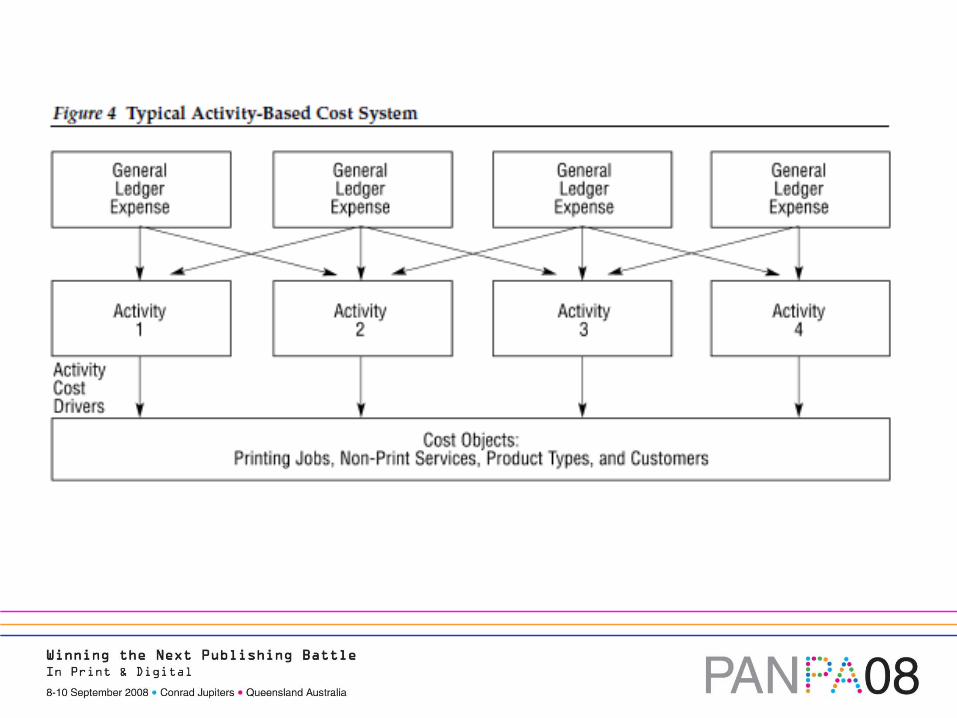
Activity Based Costing (ABC)
Introducing ABC
The primary purpose of ABC is to provide accurate information about the cost of resources consumed by individual products, services, customers, processes, and channels...
...not just print jobs.
ABC allows support expenses such as indirect plant expenses, administration expenses, sales expenses, to be traced back to the activities that consume them.
Introducing ABC
ABC systems provide information to more reliably answer questions such as:
What activities are being performed by the company’s resources?
How much does it cost to perform these activities?
Why does the company need to perform these activities?
How much of each activity is required to produce individual print jobs, deliver non-print services, or to serve specific customers?
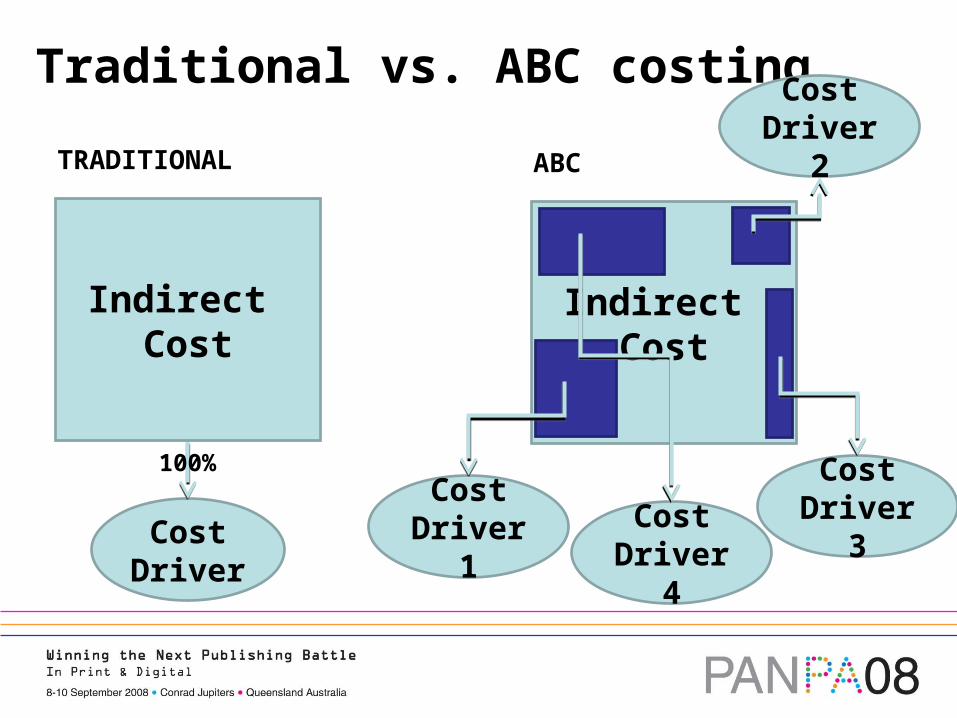
Traditional vs. ABC costing
Cost Driver
Indirect Cost
TRADITIONAL
Indirect Cost
ABC
Cost Driver 1
Cost Driver 2
Cost Driver 3Cost
Driver 4
100%
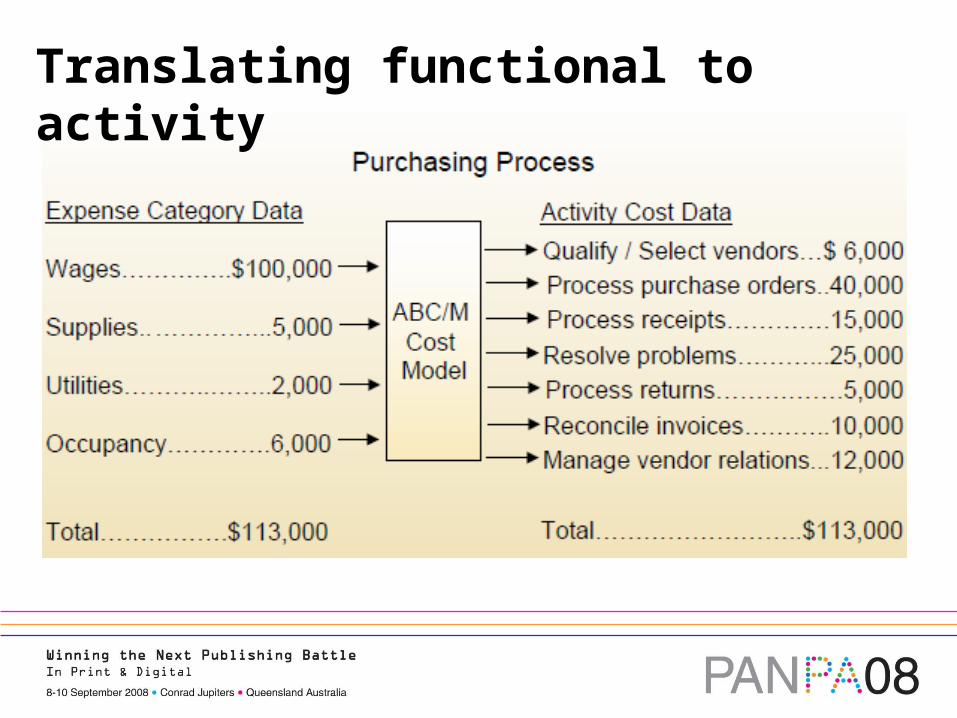
Translating functional to activity
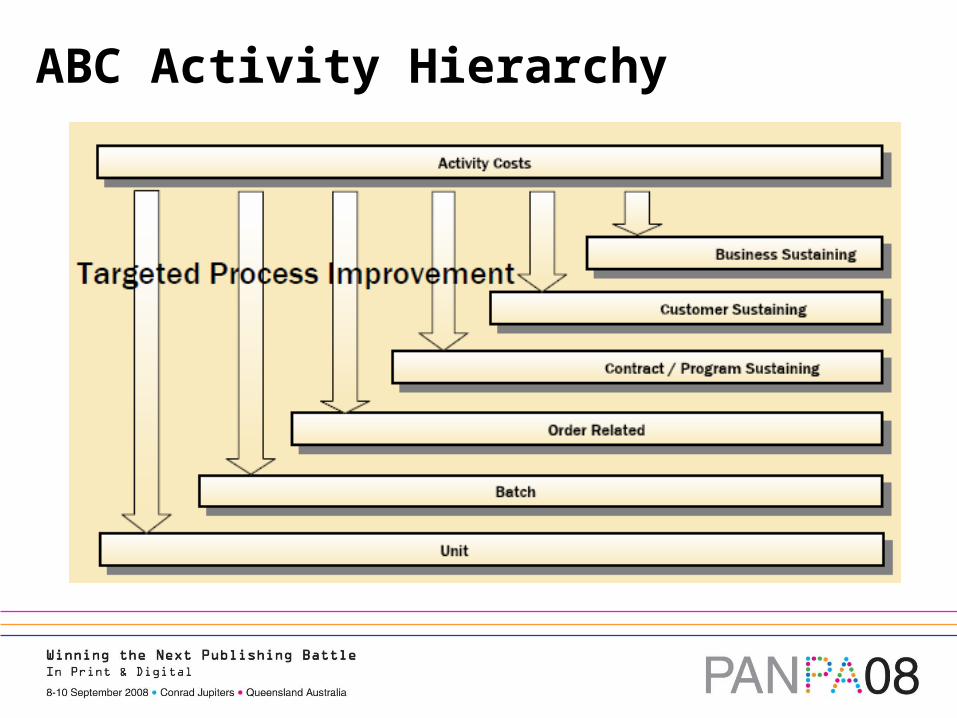
ABC Activity Hierarchy
The Cost of Capacity
Costing for Capacity Management
Organisations have little insight and understanding about the location and cost of unused (non-productive) capacity.
BHR costing loads all costs onto products delivered so it hides these costs, losing the opportunity to decrease them.
ABC systems help understand the link between increasing shareholders wealth and minimising unused capacity.
Targets continuous improvement by focusing on most constrained activity (i.e. activity with no unused capacity).
Assists with long term decisions, e.g. acquiring or disposing.
What about pricing?
Pricing and the relationship with cost
Estimating cost and pricing are distinctly different concepts.
Estimating is a science, pricing is an art.
Pricing should be customer specific not job specific.
One price doesn’t fit all customers. Should a dozen roses on January 14 be priced the same as on February 14?
Consider treating estimating and pricing as separate activities, involve senior management in pricing, and becoming more active in the logic of the estimating process.
Recommendations
5 Key Recommendations…
Many factors are threatening print industry profits.
To remain competitive it is critical to have a clear picture of the real economic cost for the activities you are investing in.
Long term studies indicate that profit leaders, on average, spend fewer dollars on support expenses.
One objective to build improved profitability is to focus on better understanding (and therefore controlling) these indirect support expenses, by...
1. Costing based on capacity
Cost allocation should be based on available capacity not planned activity.
Spare capacity foregone should be shown as an expense in the management reports and developed to manage this cost line.
This ensures spare capacity has visibility and is not hidden.
It ensures that the true economic cost is being used and avoids penalising internal users in transfer pricing.
2. Introduce a capital allocation charge
Traditional asset holding costs (depreciation and interest) can distort the true economic cost.
E.g. older equipment has a lower depreciation expense, hence a lower allocated cost.
E.g. a decision to fund an expansion with equity (rather than debt) also lowers the allocated cost.
To avoid these errors a capital allocation charge should be used to reflect the risks and cost of capital for holding fixed assets, intangible assets and working capital.
3. Focus efforts on cost discovery
Develop a culture that promotes greater cost awareness.
Build an activity dictionary for each new activity undertaken.
Invest time in cost discovery for each activity.
Start process mapping activities to assist in communicating cost consumption and identifying opportunities for continuous improvement.
4. Move closer towards an ABC system
Move away from the traditional BHR cost allocation method and closer to an ABC style system.
Prioritise cost pools based on their relative size (the larger the indirect cost the higher priority).
Start with a periodic survey of activity and a simplified modelling technique to reduce the burden of data collection.
Keep investing in the ABC system, remembering cost consumption by activity is not static, but evolves as the business changes.
5. Develop a targeted pricing strategy
Knowing the cost of an item doesn’t change the selling price – the market sets that.
Move away from cost plus pricing towards value-based pricing.
Pricing should be opportunistic, not prescriptive.
Pricing is a strategic role and should be separated from estimating.
Pricing is a key opportunity to generate a rate of return on shareholders funds.
5 Key Recommendations
1. Costing based on capacity
2. Introduce a capital allocation charge
3. Focus efforts on cost discovery
4. Move closer towards an ABC system
5. Develop a targeted pricing strategy
Questions

Nigel FinchDirector, Centre for Managerial FinanceMacquarie Graduate School of Management (MGSM)
[email protected]: (02) 9850 9030
Researchhttp://ssrn.com/author=438461