Embed Size (px)
Citation preview

Panorama Mundial de FTTH / Fibra Hasta El HogarTecnologías extrapolables entre
Redes de Acceso Residencial y LANs
Ing. Gilberto A. GuitarteFTTH COUNCIL AMÉRICAS- LATAM Chapter
Presidente
A quick tour on FTTH around the World
• US and CANADA
• EUROPE
• ASIA PAC
• MENA
• AFRICA
• LATAM

FTTH AROUND THE WORLD
• NORTH AMERICA (US and CANADA)
0
5
10
15
20
25
30
Sep
'01
Mar '0
2
Sep
'02
Mar '0
3
Sep
'03
Mar '0
4
Sep
'04
Mar '0
5
Sep
'05
Mar '0
6
Sep
'06
Mar '0
7
Sep
'07
Mar '0
8
Sep
'08
Mar '0
9
Sep
'09
Mar '1
0
Sep
'10
Mar '1
1
Sep
'11
Mar '1
2
Sep
'12
Mar '1
3
Sep
' 13
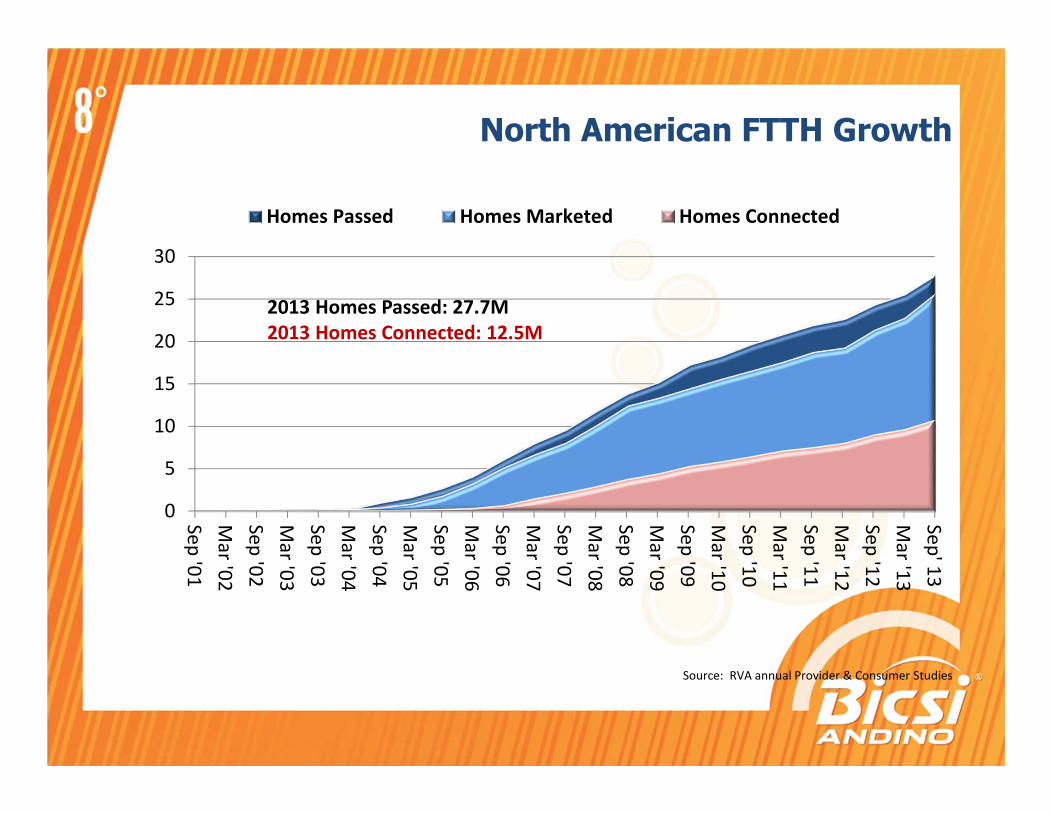
Homes Passed Homes Marketed Homes Connected
2013 Homes Passed: 27.7M
2013 Homes Connected: 12.5M
North American FTTH Growth
Source: RVA annual Provider & Consumer Studies
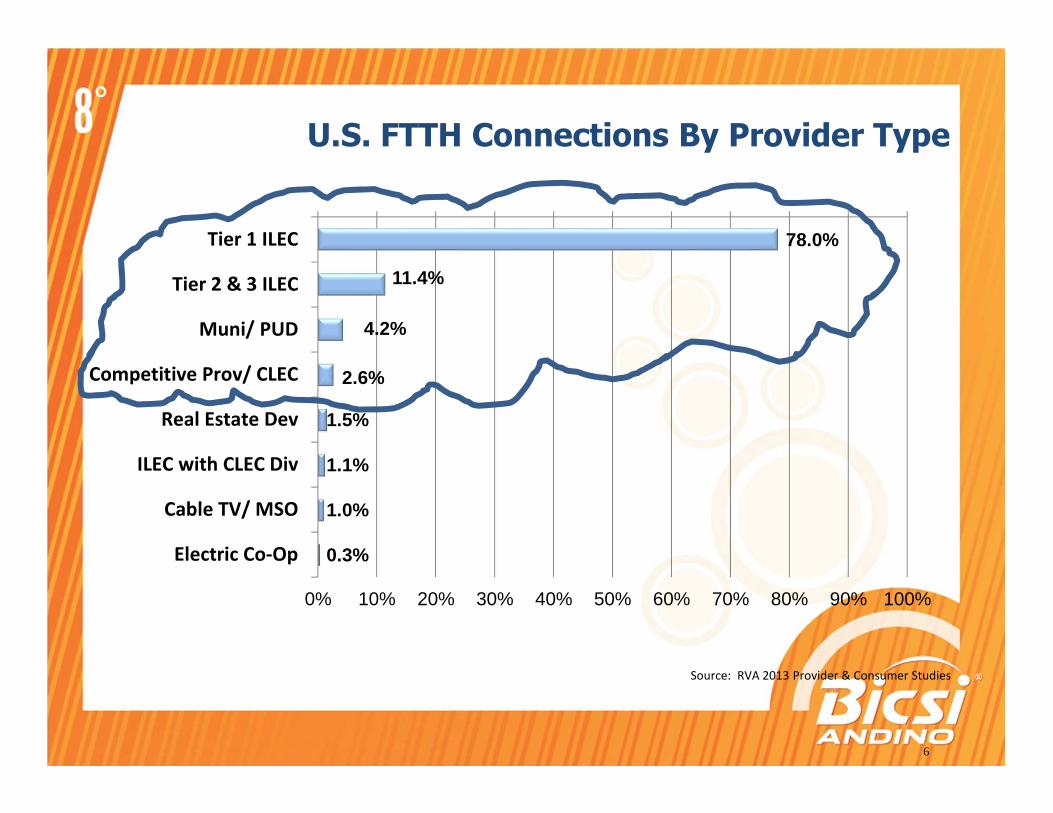
78.0%
11.4%
4.2%
2.6%
1.5%
1.1%
1.0%
0.3%
0% 10% 20% 30% 40% 50% 60% 70% 80% 90% 100%
Tier 1 ILEC
Tier 2 & 3 ILEC
Muni/ PUD
Competitive Prov/ CLEC
Real Estate Dev
ILEC with CLEC Div
Cable TV/ MSO
Electric Co-Op
6
U.S. FTTH Connections By Provider Type
Source: RVA 2013 Provider & Consumer Studies
0%
5%
10%
15%
20%
25%
30%
35%
40%
45%
50%
Sep
'01
Mar '0
2
Sep
'02
Mar '0
3
Sep
'03
Mar '0
4
Sep
'04
Mar '0
5
Sep
'05
Mar '0
6
Sep
'06
Mar '0
7
Sep
'07
Mar '0
8
Sep
'08
Mar '0
9
Sep
'09
Mar '1
0
Sep
'10
Mar '1
1
Sep
'11
Mar '1
2
Sep
'12
Mar '1
3
Sep
'13
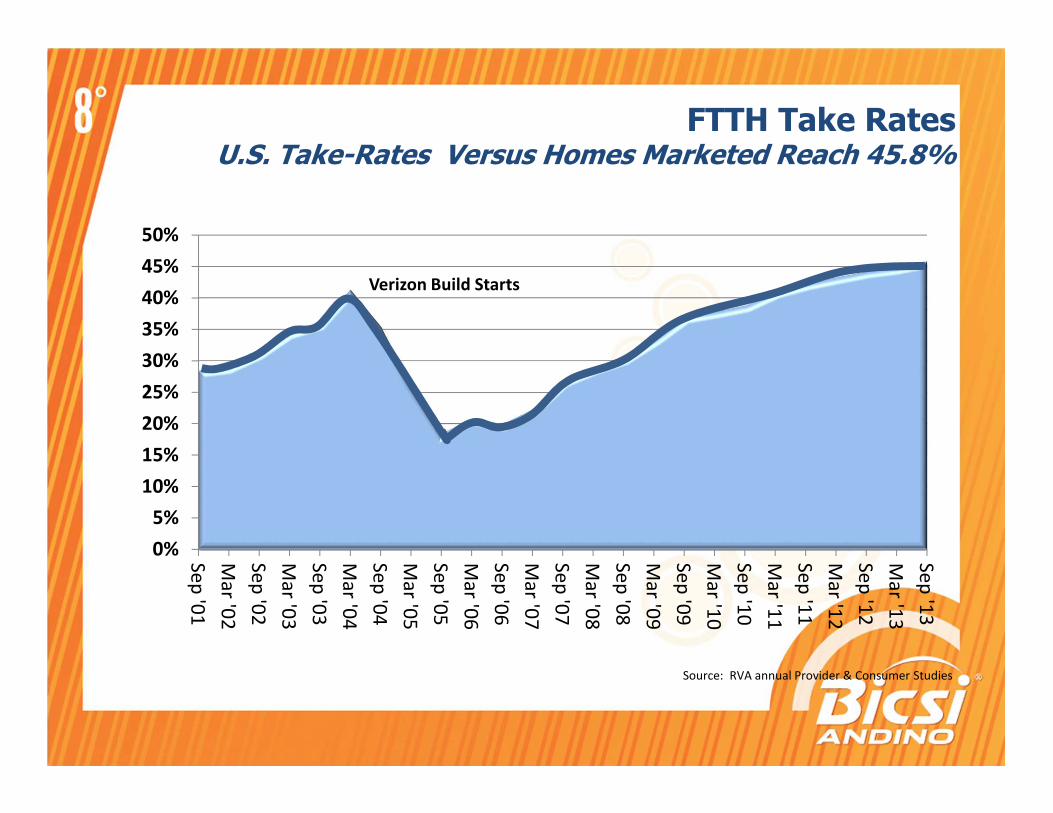
FTTH Take RatesU.S. Take-Rates Versus Homes Marketed Reach 45.8%
Verizon Build Starts
Source: RVA annual Provider & Consumer Studies
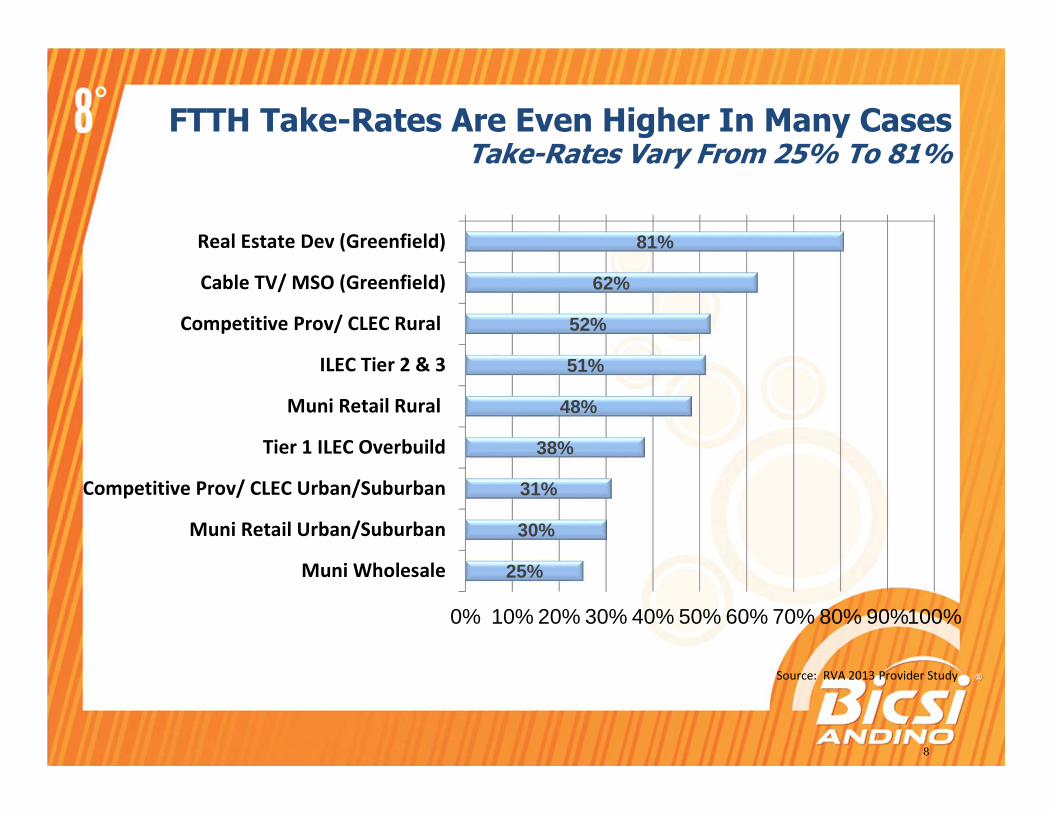
81%
62%
52%
51%
48%
38%
31%
30%
25%
0% 10% 20% 30% 40% 50% 60% 70% 80% 90%100%
Real Estate Dev (Greenfield)
Cable TV/ MSO (Greenfield)
Competitive Prov/ CLEC Rural
ILEC Tier 2 & 3
Muni Retail Rural
Tier 1 ILEC Overbuild
Competitive Prov/ CLEC Urban/Suburban
Muni Retail Urban/Suburban
Muni Wholesale
8
FTTH Take-Rates Are Even Higher In Many CasesTake-Rates Vary From 25% To 81%
Source: RVA 2013 Provider Study

FTTH AROUND THE WORLD
• EUROPE
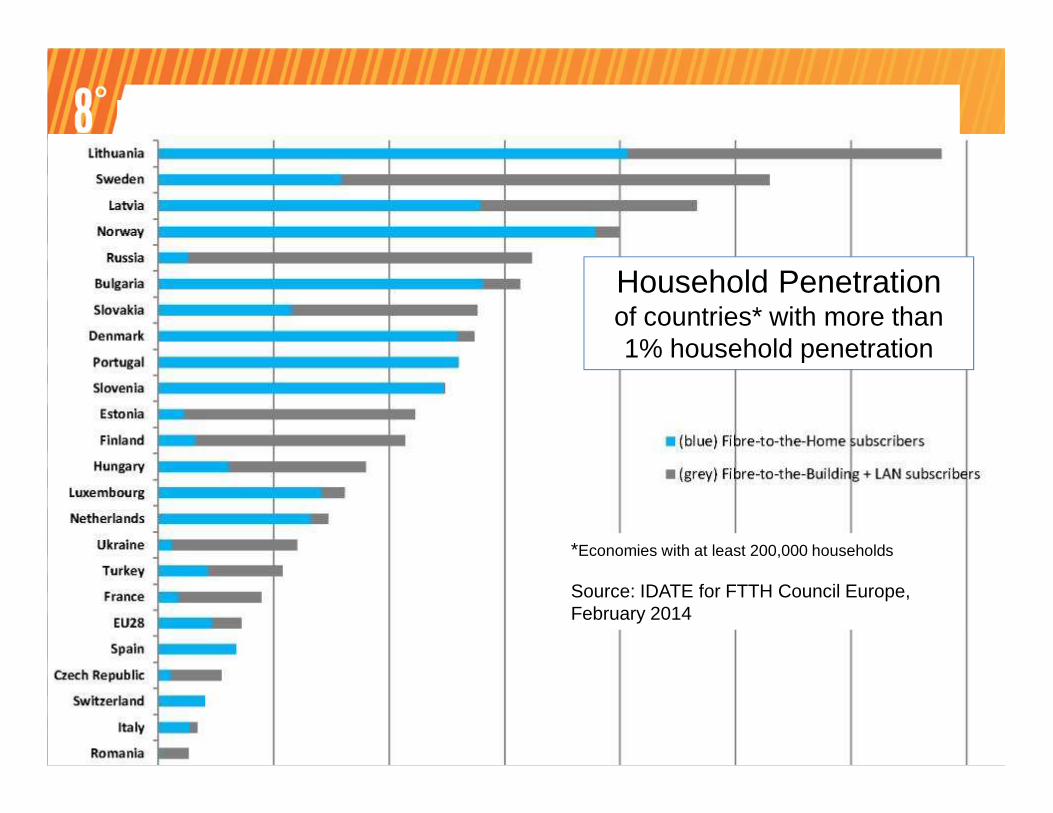
FTTH/B European Ranking – end 2013
Household Penetrationof countries* with more than 1% household penetration
*Economies with at least 200,000 households
Source: IDATE for FTTH Council Europe, February 2014
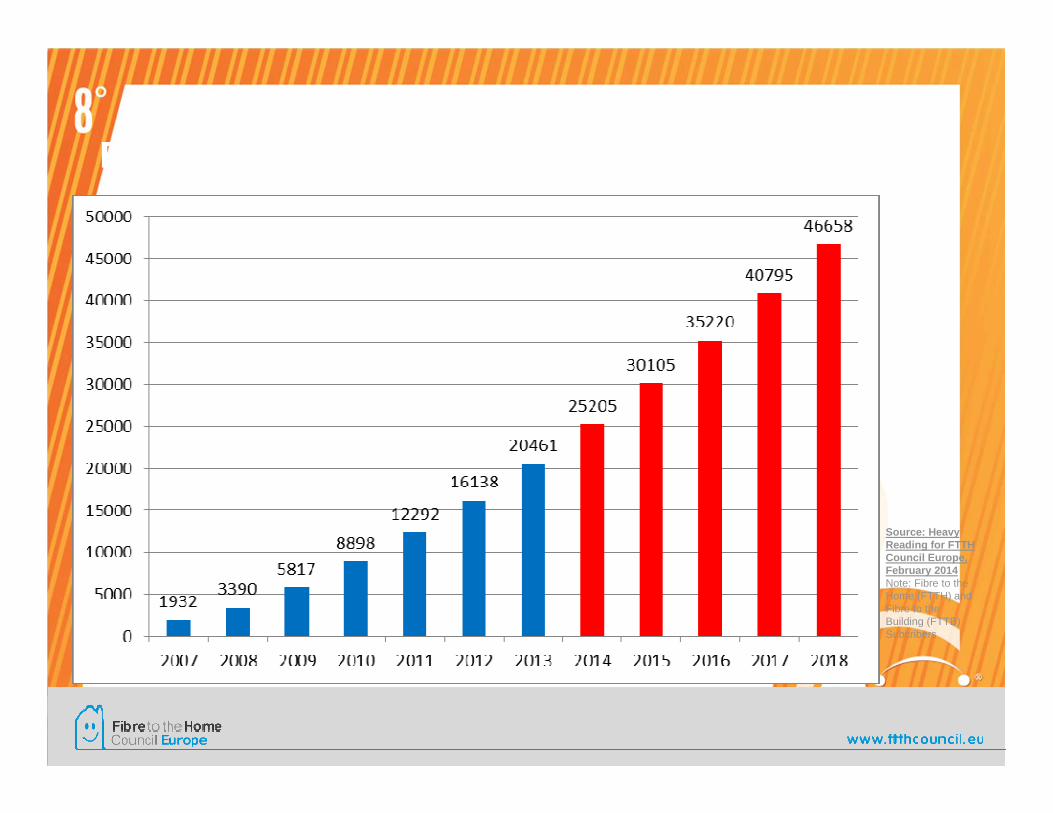
European Region FTTH/B Forecast – end 2013
Source: Heavy Reading for FTTH Council Europe, February 2014Note: Fibre to the Home (FTTH) and Fibre to the Building (FTTB) Subcribers


www.gimmefibre.eu

4/11/2014 14
FTTH Conference 2015Warsaw 10-12 February 2015

www.ftthcouncil.eu

FTTH AROUND THE WORLD
• ASIA PACIFIC

� Established in March 2005
� Currently has 75 members
� BoD, GM & 7 working committees
*Source : Ovum
Monique Morrow
(President)
Technology
&
Standards
Bernard Lee
Membership
Yoshihiro
Ishibashi
Education
&
Training
Xingfu He
Market
Intelligence
Anil Pande
Application
&
Solutions
Alexis
Bernadino
Emblem
H. Munasir
Choudhury
Planning,
Comms. &
Events
Zony Chen
1563New Users/Hour
US $60BWorth Projects in APAC
CHINA>100m FTTH users by 2017
17%CAGR 2011~2017
159.5MFTTH users by 2017
92.7MFTTH subscribers
Year-end 2013
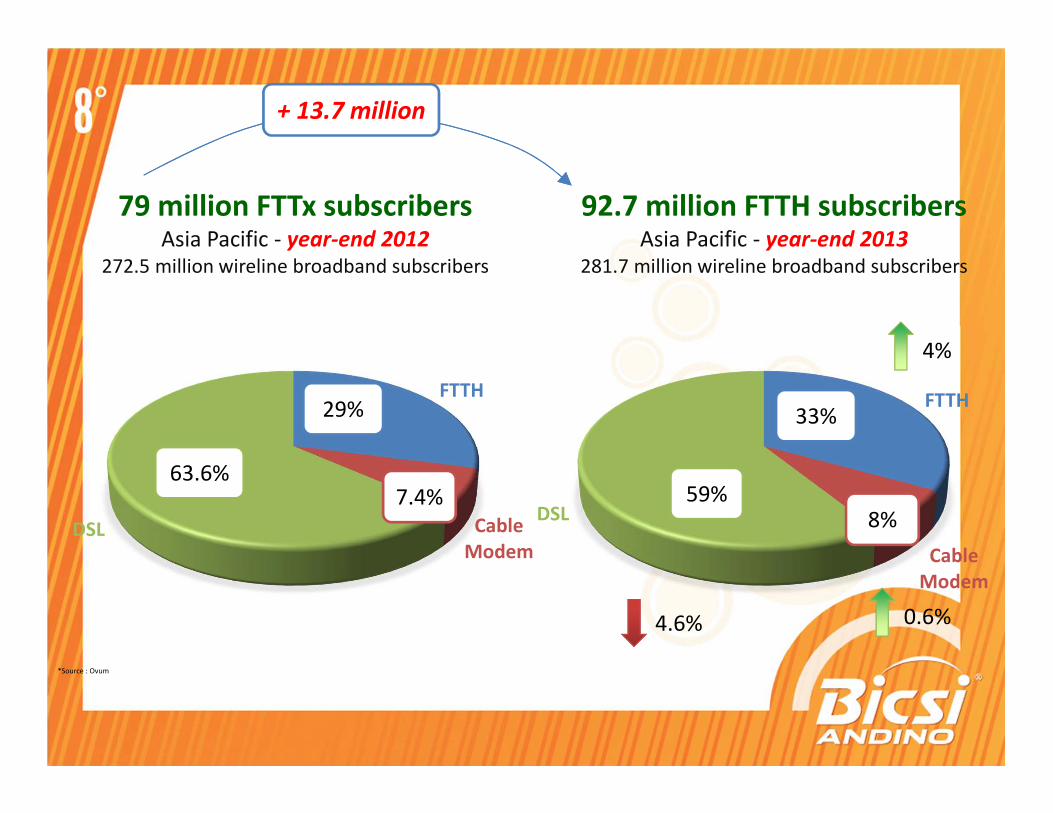
*Source : Ovum
92.7 million FTTH subscribersAsia Pacific - year-end 2013
281.7 million wireline broadband subscribers
79 million FTTx subscribersAsia Pacific - year-end 2012
272.5 million wireline broadband subscribers
FTTH
Cable
ModemDSL
FTTH
Cable
Modem
DSL
29% 33%
63.6%59%
8%7.4%
+ 13.7 million
4%
0.6%4.6%
*Source : Ovum
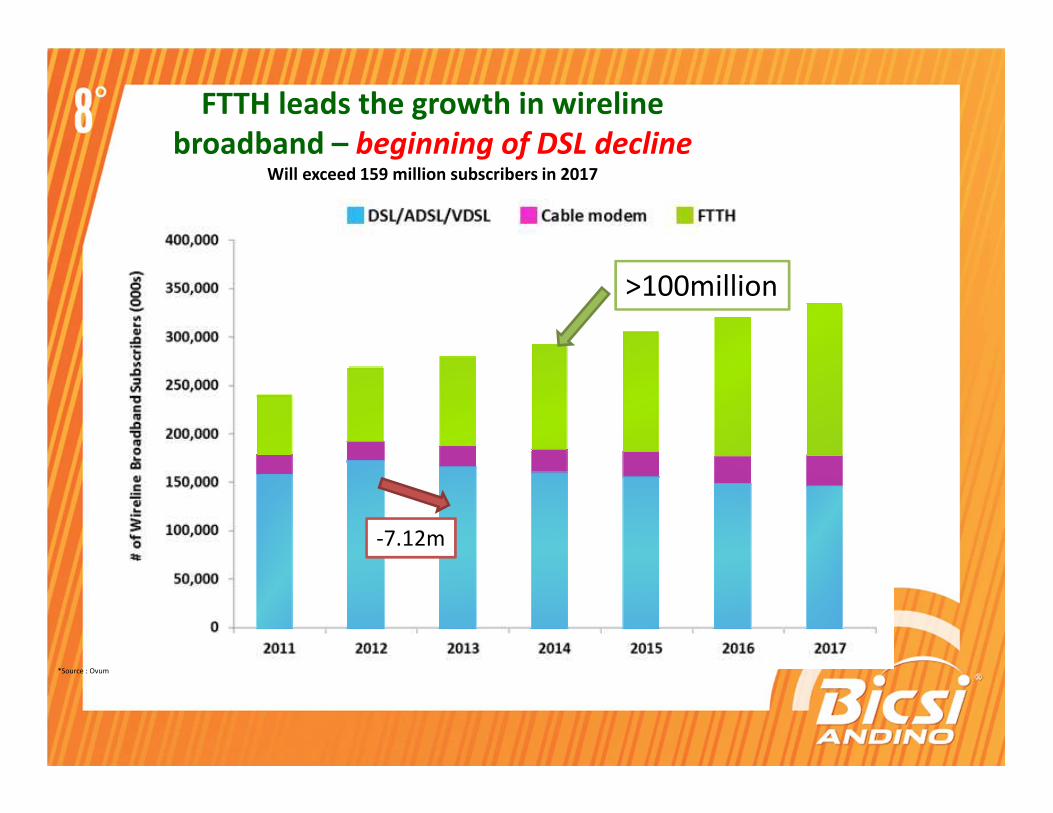
FTTH leads the growth in wireline
broadband – beginning of DSL declineWill exceed 159 million subscribers in 2017
-7.12m
>100million
*Source : Ovum
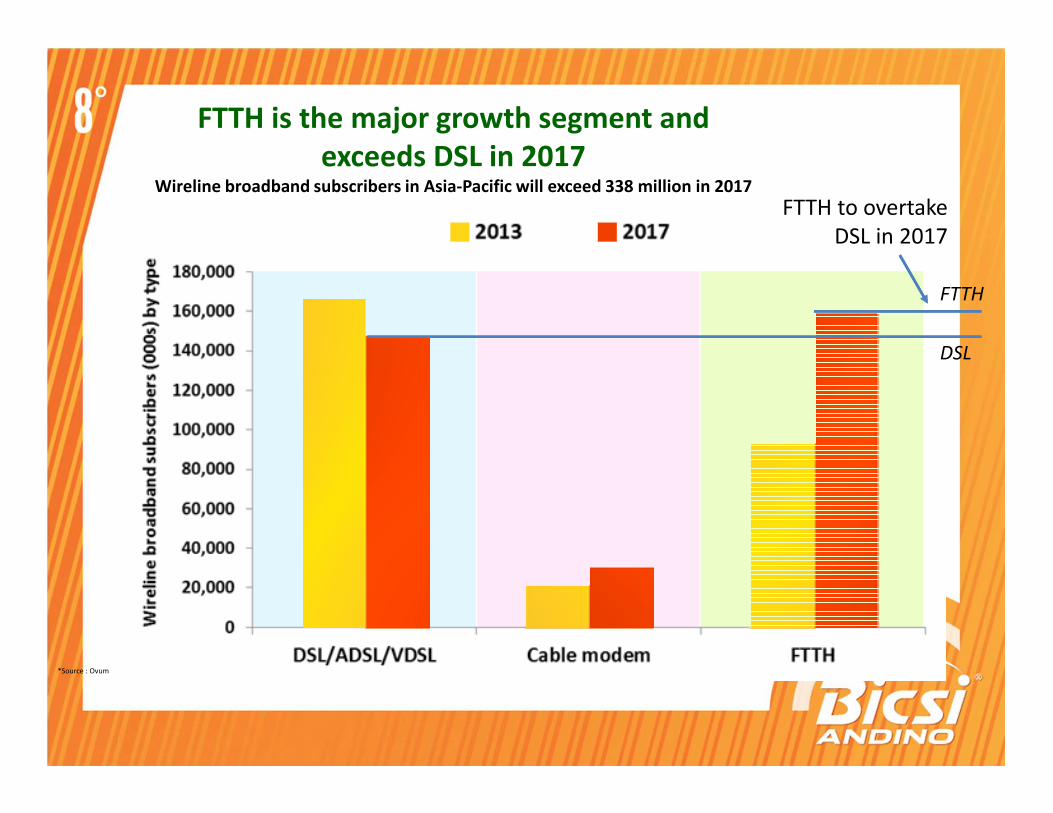
FTTH is the major growth segment and
exceeds DSL in 2017Wireline broadband subscribers in Asia-Pacific will exceed 338 million in 2017
FTTH to overtake DSL in 2017
FTTH
DSL
*Source : Ovum
0
10,000
20,000
30,000
40,000
50,000
60,000
0.0%
10.0%
20.0%
30.0%
40.0%
50.0%
60.0%
70.0%
FT
TH
sub
scrib
ers
(000
s)
FT
TH
hou
seho
ld p
enet
ratio
n (%
)
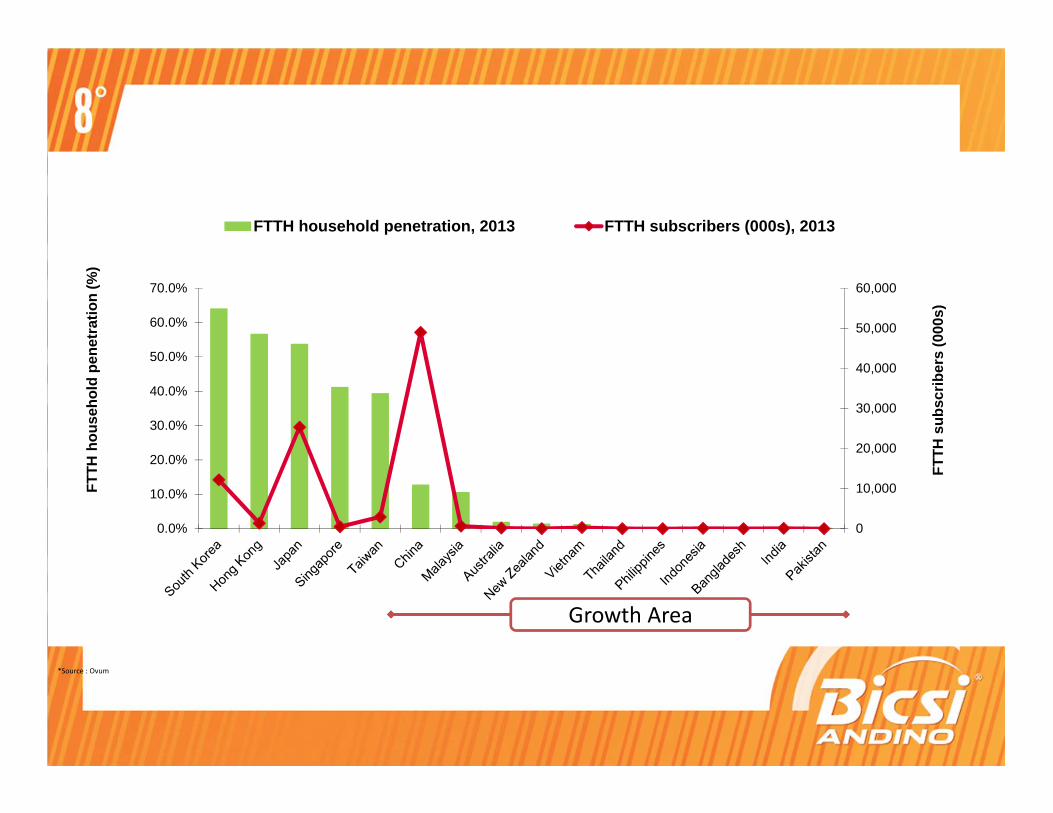
FTTH household penetration, 2013 FTTH subscribers (000s), 2013
Growth Area
*Source : Ovum
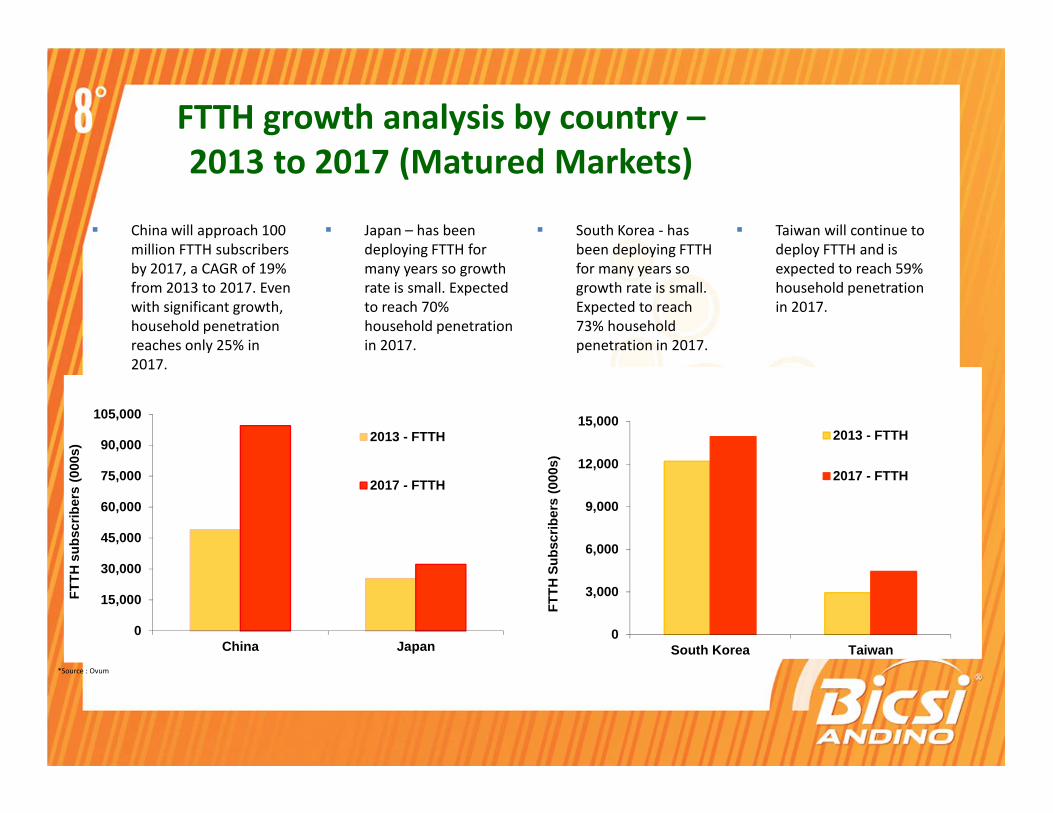
FTTH growth analysis by country –
2013 to 2017 (Matured Markets)
� China will approach 100 million FTTH subscribers by 2017, a CAGR of 19% from 2013 to 2017. Even with significant growth, household penetration reaches only 25% in 2017.
� Japan – has been deploying FTTH for many years so growth rate is small. Expected to reach 70% household penetration in 2017.
� South Korea - has been deploying FTTH for many years so growth rate is small. Expected to reach 73% household penetration in 2017.
0
15,000
30,000
45,000
60,000
75,000
90,000
105,000
China Japan
FT
TH
sub
scrib
ers
(000
s)
2013 - FTTH
2017 - FTTH
0
3,000
6,000
9,000
12,000
15,000
South Korea Taiwan
FT
TH
Sub
scrib
ers
(000
s)
2013 - FTTH
2017 - FTTH
� Taiwan will continue to deploy FTTH and is expected to reach 59% household penetration in 2017.
0
500
1,000
1,500
2,000
2,500
Hong Kong India Malaysia Singapore Indonesia
FT
TH
Sub
scrib
ers
(000
s)
2013 - FTTH 2017 - FTTH
*Source : Ovum
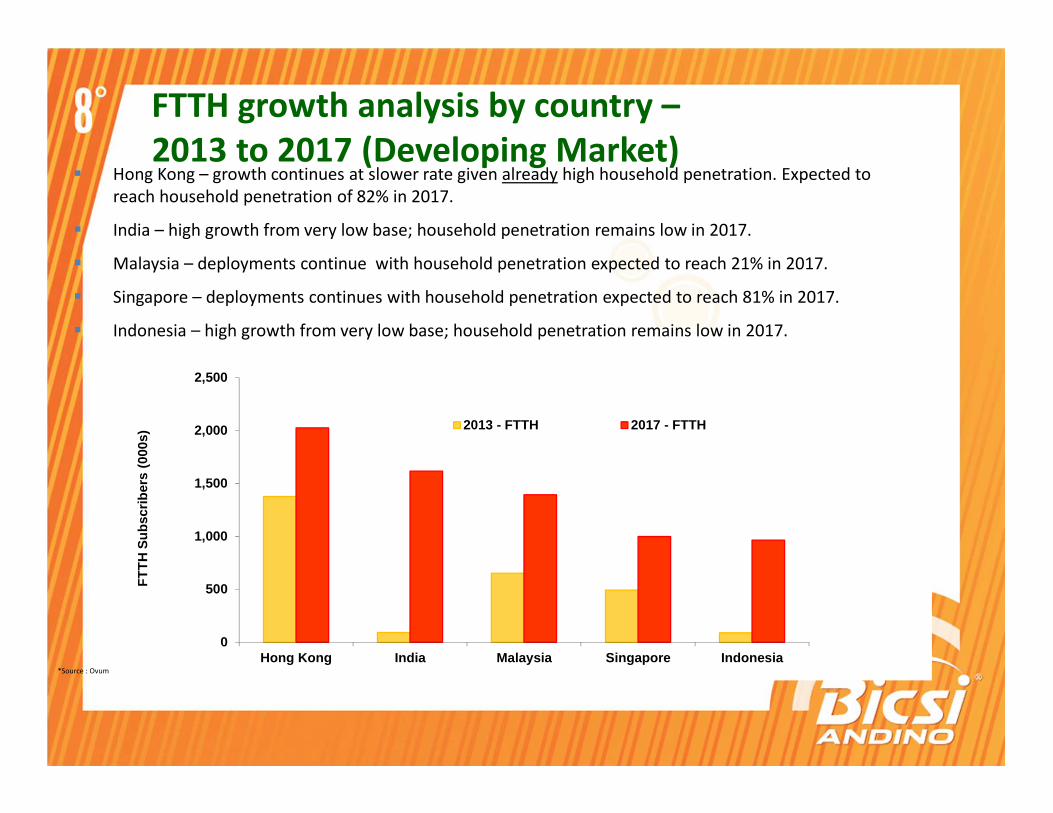
� Hong Kong – growth continues at slower rate given already high household penetration. Expected to reach household penetration of 82% in 2017.
� India – high growth from very low base; household penetration remains low in 2017.
� Malaysia – deployments continue with household penetration expected to reach 21% in 2017.
� Singapore – deployments continues with household penetration expected to reach 81% in 2017.
� Indonesia – high growth from very low base; household penetration remains low in 2017.
FTTH growth analysis by country –
2013 to 2017 (Developing Market)
*Source : Ovum
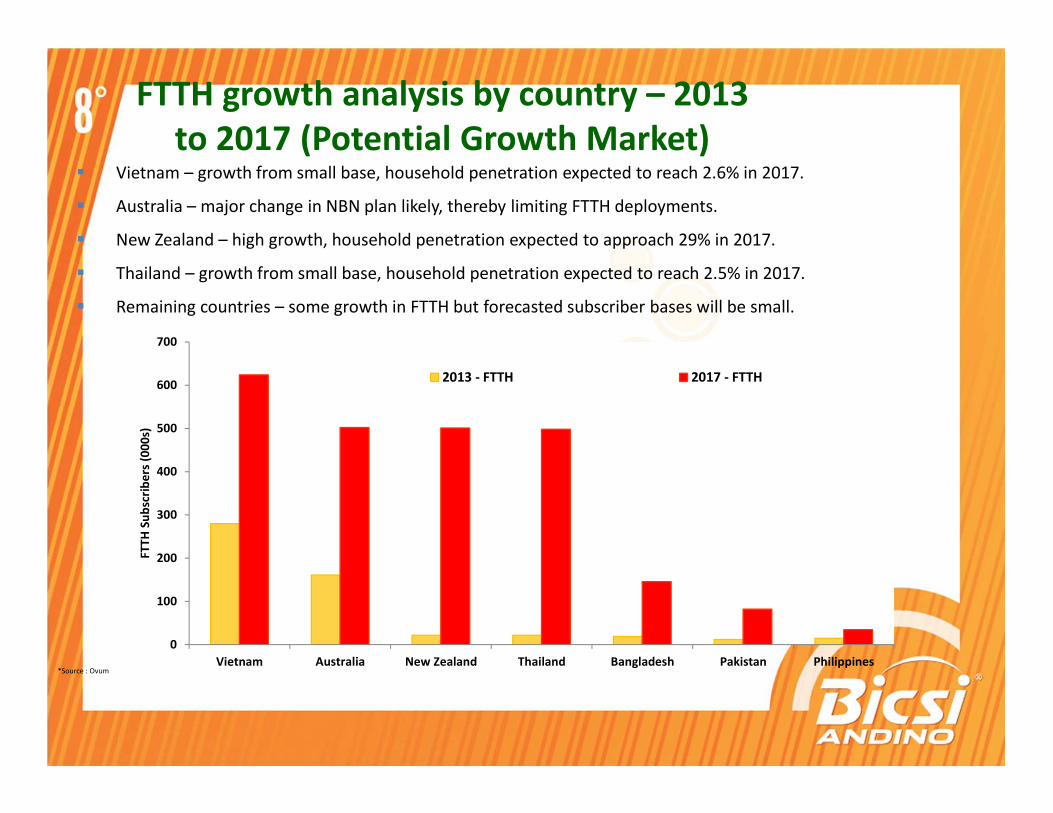
� Vietnam – growth from small base, household penetration expected to reach 2.6% in 2017.
� Australia – major change in NBN plan likely, thereby limiting FTTH deployments.
� New Zealand – high growth, household penetration expected to approach 29% in 2017.
� Thailand – growth from small base, household penetration expected to reach 2.5% in 2017.
� Remaining countries – some growth in FTTH but forecasted subscriber bases will be small.
0
100
200
300
400
500
600
700
Vietnam Australia New Zealand Thailand Bangladesh Pakistan Philippines
FTT
H S
ub
scri
be
rs (
00
0s)
2013 - FTTH 2017 - FTTH
FTTH growth analysis by country – 2013
to 2017 (Potential Growth Market)
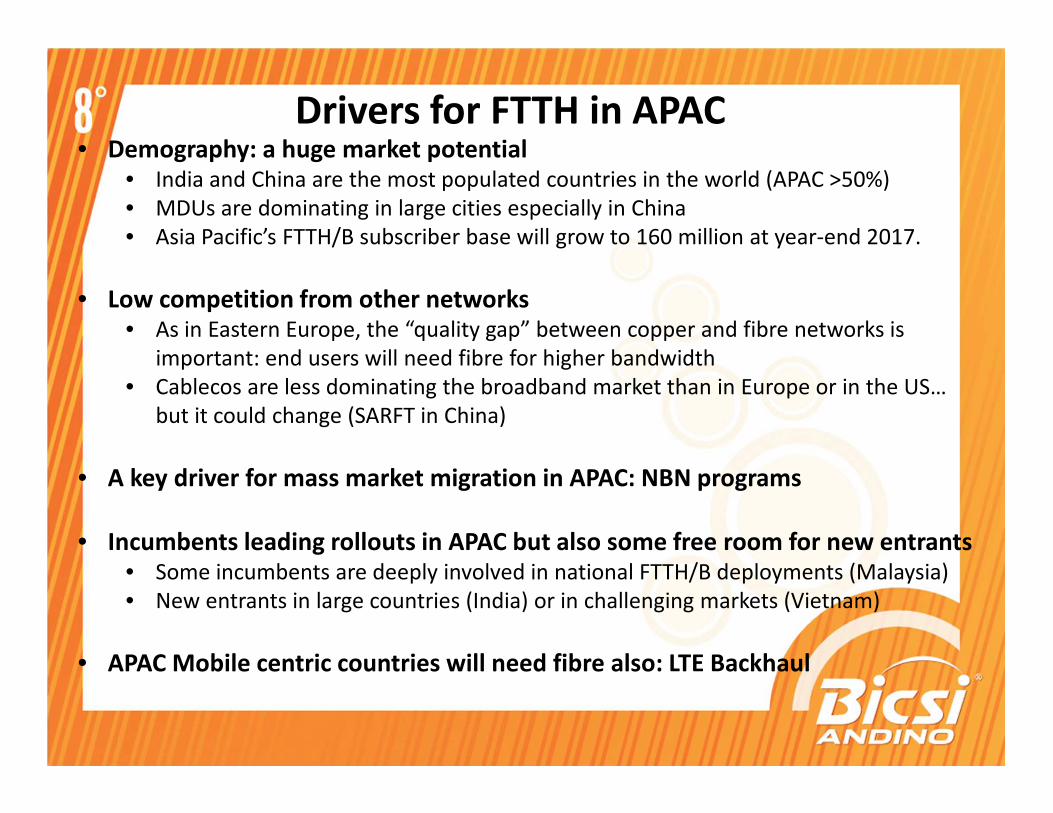
Drivers for FTTH in APAC• Demography: a huge market potential
• India and China are the most populated countries in the world (APAC >50%)• MDUs are dominating in large cities especially in China• Asia Pacific’s FTTH/B subscriber base will grow to 160 million at year-end 2017.
• Low competition from other networks• As in Eastern Europe, the “quality gap” between copper and fibre networks is
important: end users will need fibre for higher bandwidth• Cablecos are less dominating the broadband market than in Europe or in the US…
but it could change (SARFT in China)
• A key driver for mass market migration in APAC: NBN programs
• Incumbents leading rollouts in APAC but also some free room for new entrants• Some incumbents are deeply involved in national FTTH/B deployments (Malaysia)• New entrants in large countries (India) or in challenging markets (Vietnam)
• APAC Mobile centric countries will need fibre also: LTE Backhaul

FTTH Council Asia-Pacific Annual Conference 3-5 June 2014, Penang, Malaysia
www.ftthcouncilapevents.com

www.ftthcouncilap.org

FTTH AROUND THE WORLD
• MENA and AFRICA

FTTH in the MENA region
Christine BeylouniDirector General, FTTH Council MENA
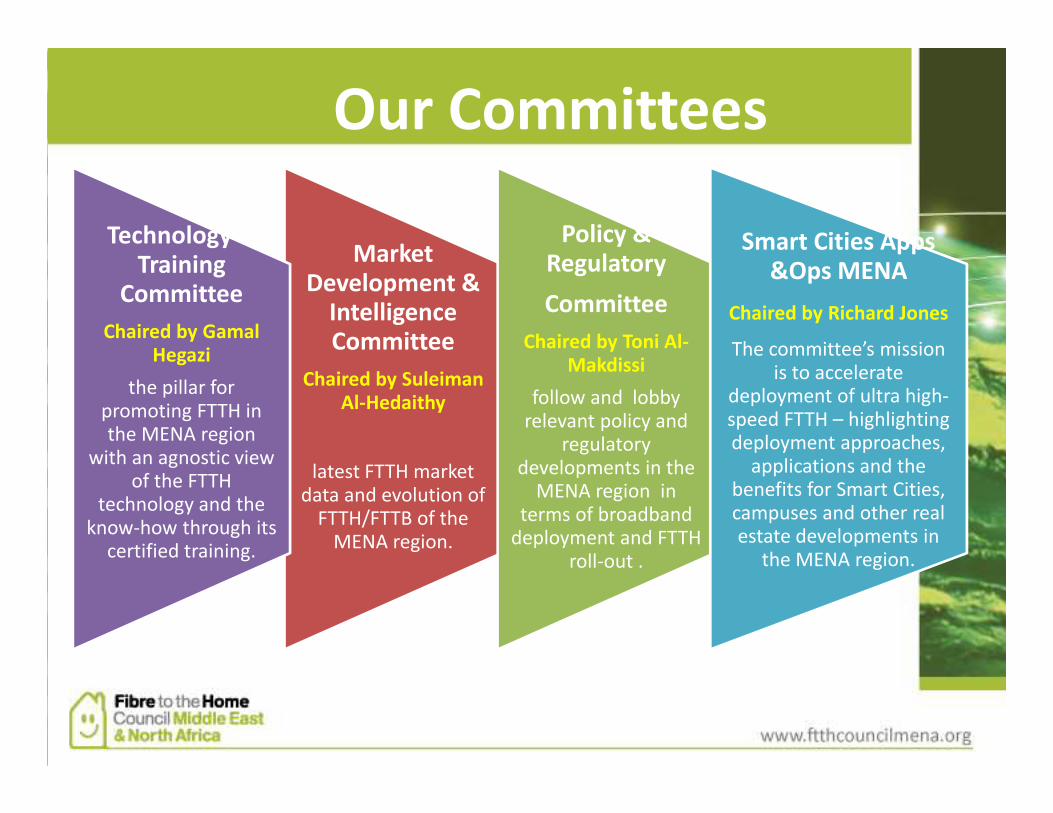
Our Committees
Market Development &
Intelligence Committee
Chaired by Suleiman Al-Hedaithy
latest FTTH market data and evolution of
FTTH/FTTB of the MENA region.
Policy & Regulatory
Committee
Chaired by Toni Al-Makdissi
follow and lobby relevant policy and
regulatory developments in the
MENA region in terms of broadband
deployment and FTTH roll-out .
Technology & Training
Committee
Chaired by Gamal Hegazi
the pillar for promoting FTTH in the MENA region
with an agnostic view of the FTTH
technology and the know-how through its
certified training.
Smart Cities Apps &Ops MENA
Chaired by Richard Jones
The committee’s mission is to accelerate
deployment of ultra high-speed FTTH – highlighting deployment approaches,
applications and the benefits for Smart Cities, campuses and other real estate developments in
the MENA region.
Our Partners and Advisors
The FTTH Market in MENA
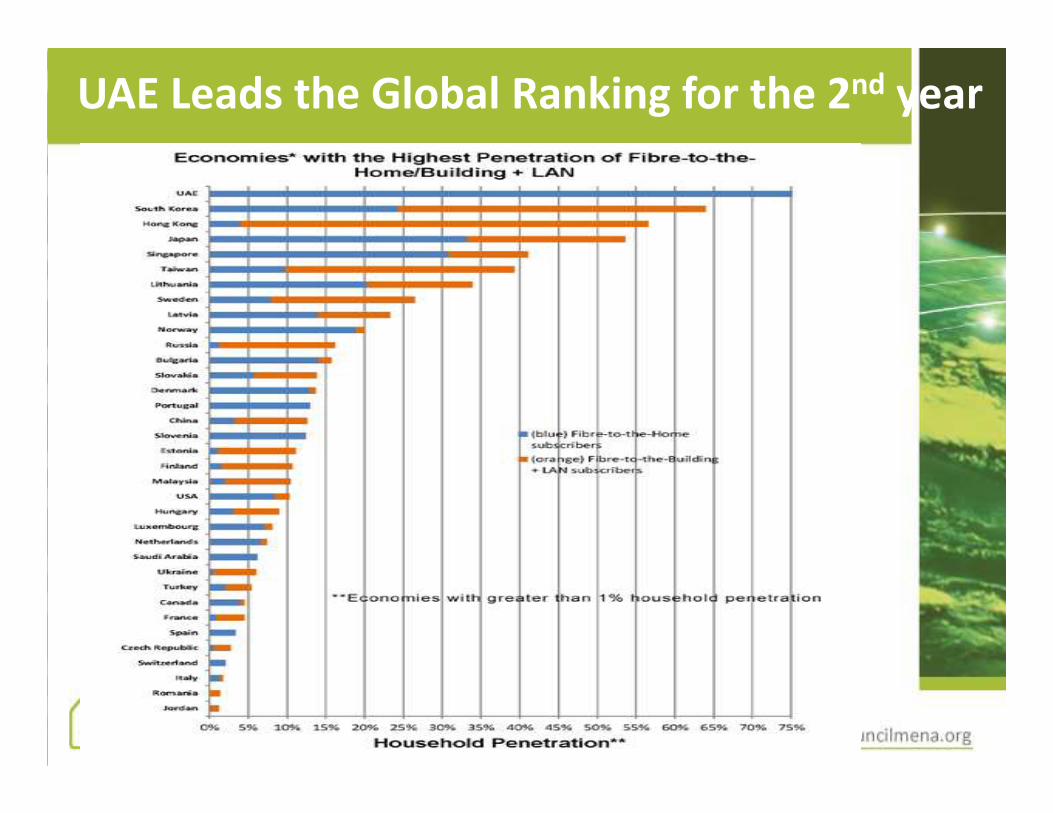
UAE Leads the Global Ranking for the 2nd year
33
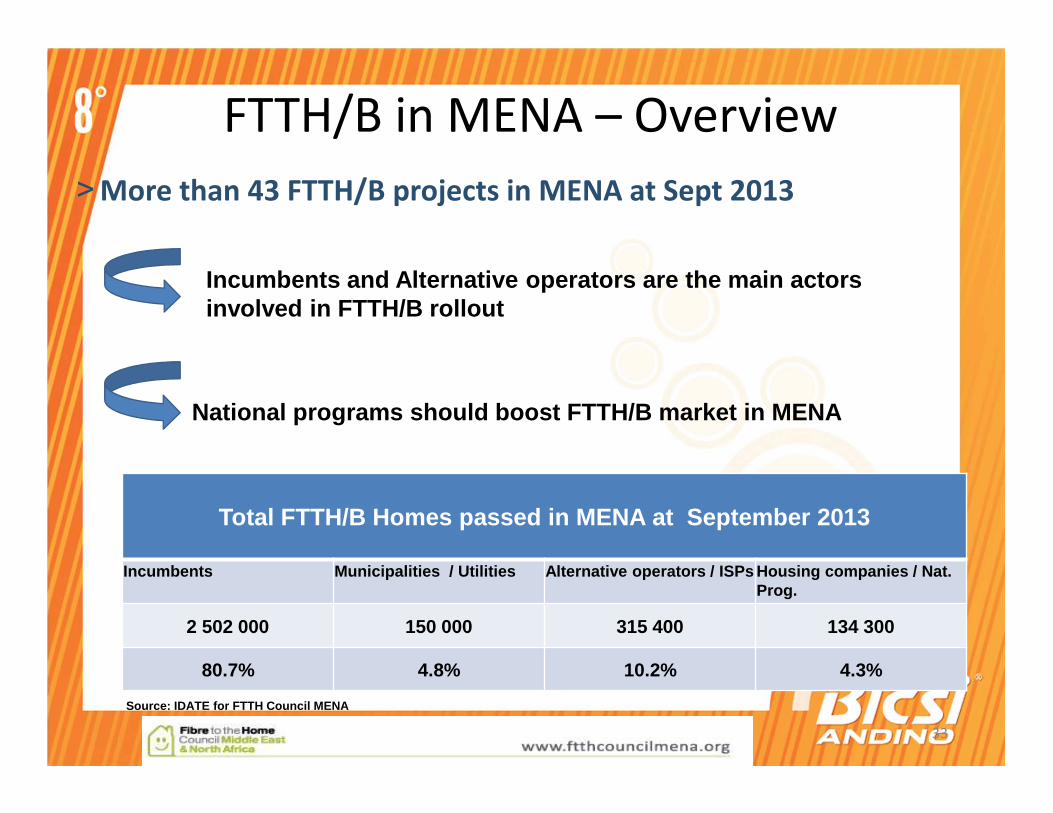
˃More than 43 FTTH/B projects in MENA at Sept 2013
FTTH/B in MENA – Overview
Source: IDATE for FTTH Council MENA
Total FTTH/B Homes passed in MENA at September 201 3
Incumbents Municipalities / Utilities Alternative op erators / ISPs Housing companies / Nat. Prog.
2 502 000 150 000 315 400 134 300
80.7% 4.8% 10.2% 4.3%
Incumbents and Alternative operators are the main a ctors involved in FTTH/B rollout
National programs should boost FTTH/B market in MEN A
34
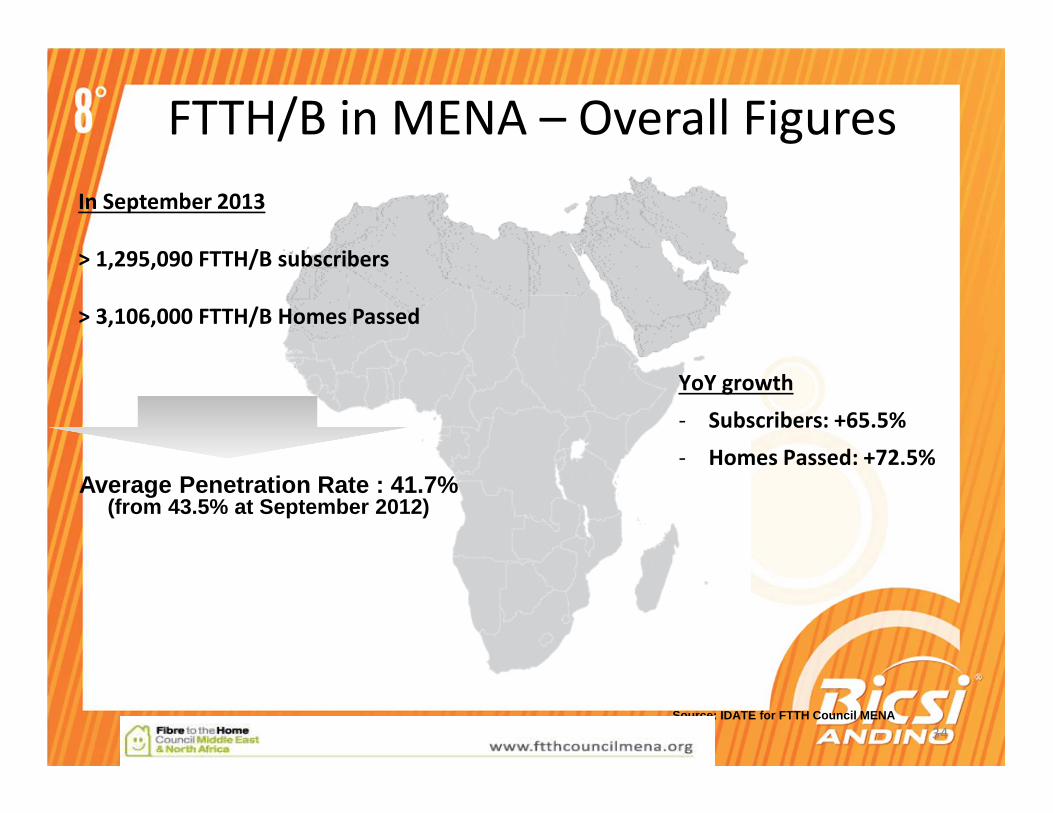
FTTH/B in MENA – Overall Figures
In September 2013
> 1,295,090 FTTH/B subscribers
> 3,106,000 FTTH/B Homes Passed
Source: IDATE for FTTH Council MENA
Average Penetration Rate : 41.7%(from 43.5% at September 2012)
YoY growth
- Subscribers: +65.5%
- Homes Passed: +72.5%
35
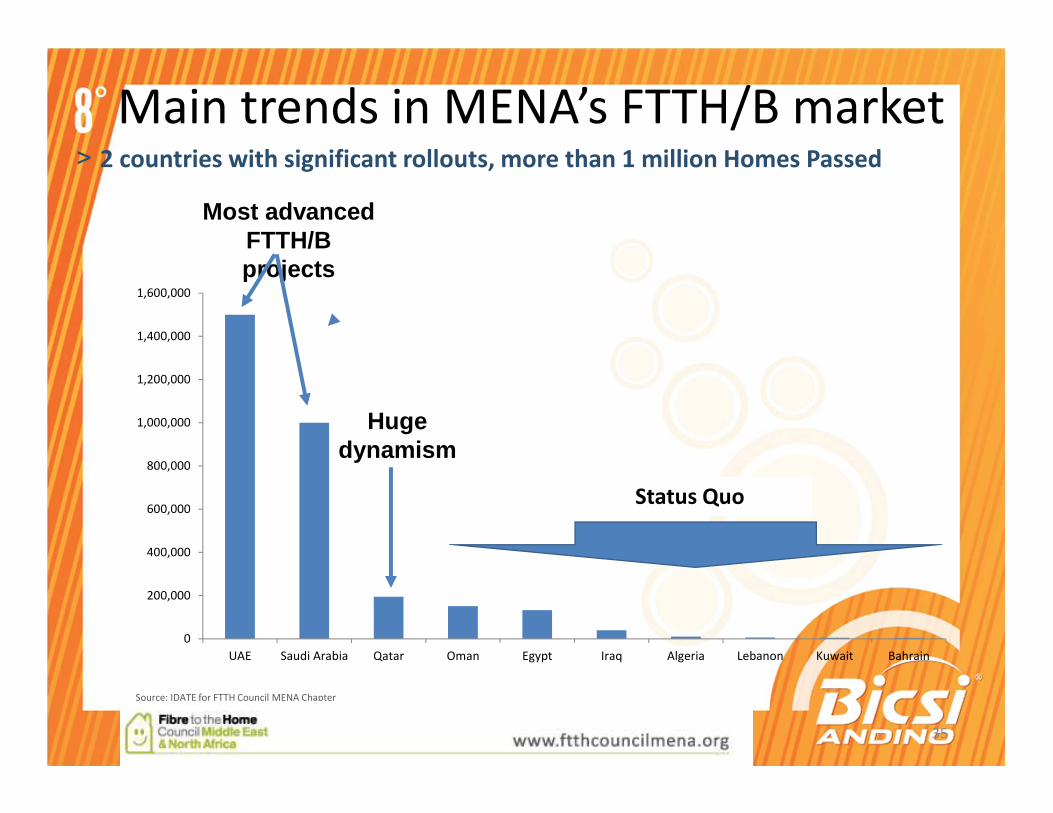
˃ 2 countries with significant rollouts, more than 1 million Homes Passed
Source: IDATE for FTTH Council MENA Chapter
0
200,000
400,000
600,000
800,000
1,000,000
1,200,000
1,400,000
1,600,000
UAE Saudi Arabia Qatar Oman Egypt Iraq Algeria Lebanon Kuwait Bahrain
Most advanced FTTH/B projects
Hugedynamism
Status Quo
Main trends in MENA’s FTTH/B market

Next – Dubai 2014
www.ftthcouncilmena.org
DUBAI, 18 -20 November 2014


October 29-292014
Turbine Hall,Newtown, Jozi
(Johannesburg)South Africa

FTTH COUNCIL AFRICA
FTTH AROUND THE WORLD
LATAM
42
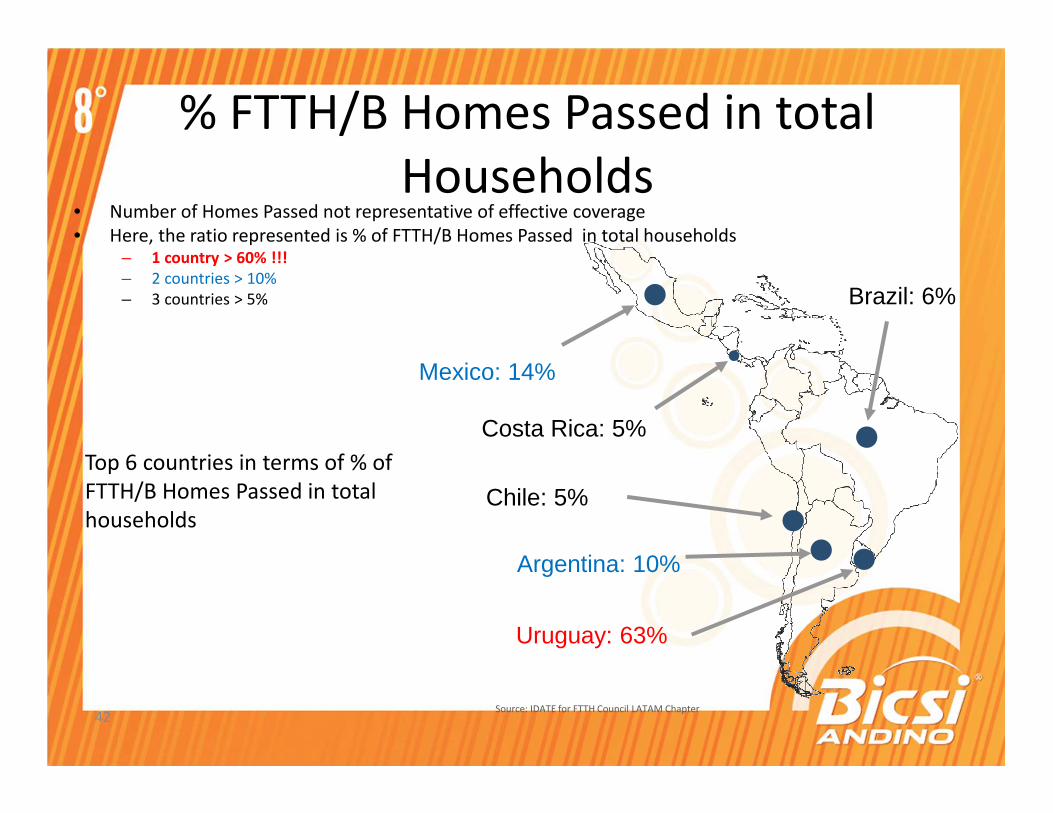
% FTTH/B Homes Passed in total Households
• Number of Homes Passed not representative of effective coverage • Here, the ratio represented is % of FTTH/B Homes Passed in total households
– 1 country > 60% !!!
– 2 countries > 10%– 3 countries > 5% Brazil: 6%
Argentina: 10%
Mexico: 14%
Uruguay: 63%
Chile: 5%
Top 6 countries in terms of % of FTTH/B Homes Passed in total households
Source: IDATE for FTTH Council LATAM Chapter
Costa Rica: 5%
43
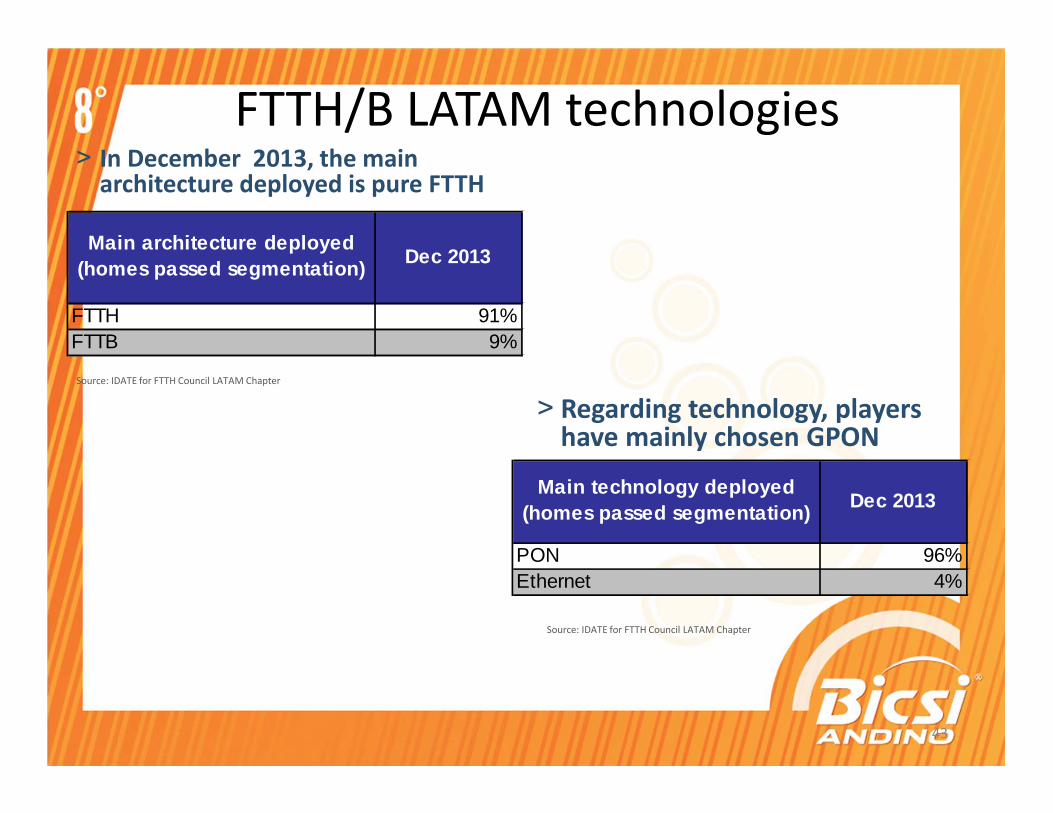
˃ Regarding technology, players have mainly chosen GPON
˃ In December 2013, the main architecture deployed is pure FTTH
Source: IDATE for FTTH Council LATAM Chapter
FTTH/B LATAM technologies
Source: IDATE for FTTH Council LATAM Chapter
FTTH 91%FTTB 9%
Dec 2013Main architecture deployed
(homes passed segmentation)
PON 96%Ethernet 4%
Dec 2013Main technology deployed
(homes passed segmentation)
44
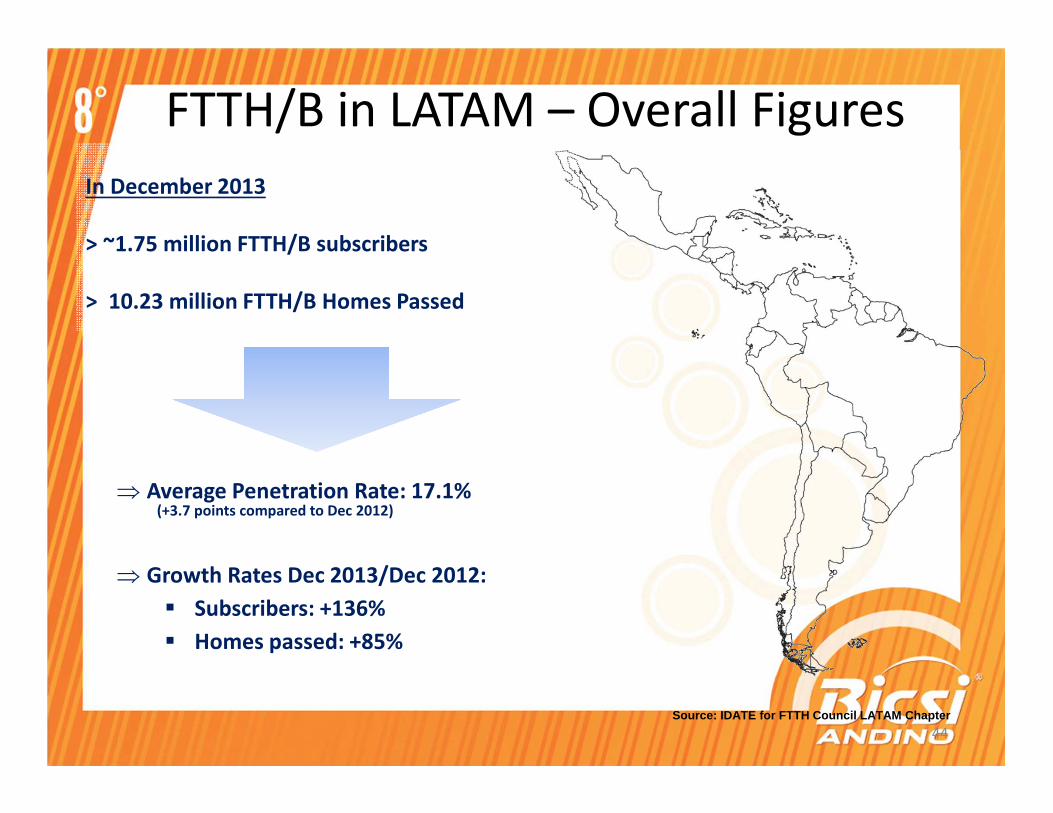
FTTH/B in LATAM – Overall Figures
In December 2013
> ~1.75 million FTTH/B subscribers
> 10.23 million FTTH/B Homes Passed
Source: IDATE for FTTH Council LATAM Chapter
⇒ Average Penetration Rate: 17.1%(+3.7 points compared to Dec 2012)
⇒ Growth Rates Dec 2013/Dec 2012:
� Subscribers: +136%
� Homes passed: +85%
45
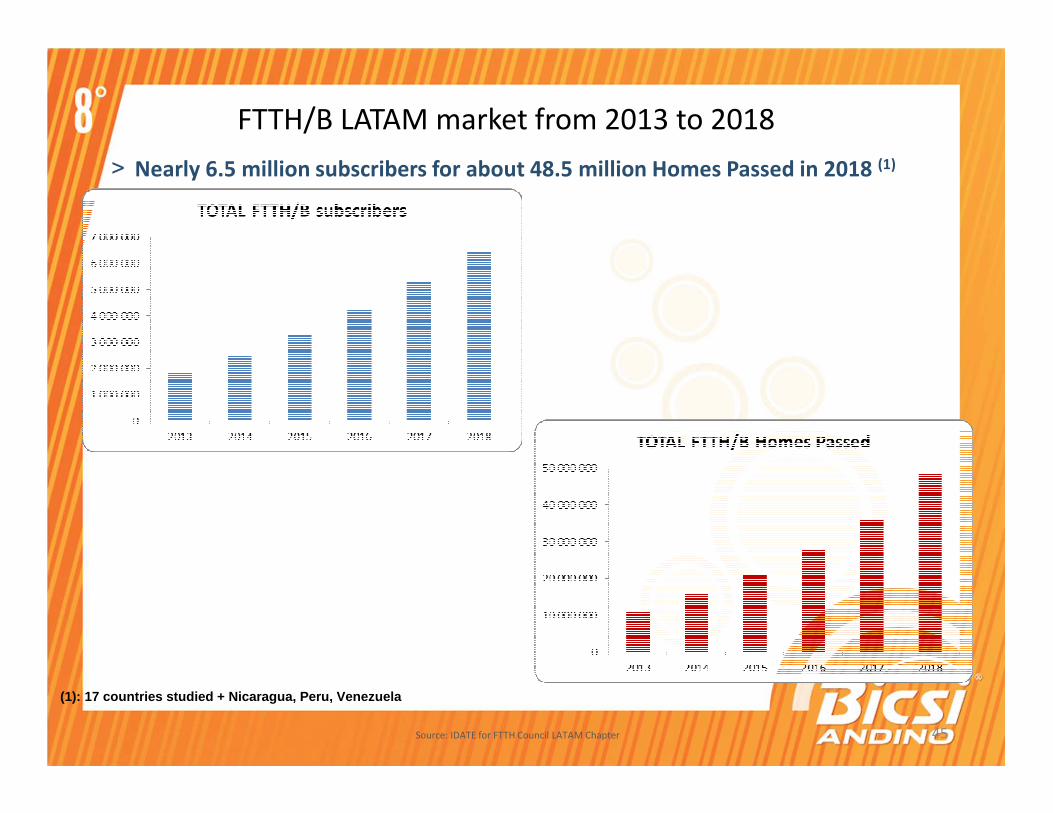
˃ Nearly 6.5 million subscribers for about 48.5 million Homes Passed in 2018 (1)
Source: IDATE for FTTH Council LATAM Chapter
FTTH/B LATAM market from 2013 to 2018
(1): 17 countries studied + Nicaragua, Peru, Venezuela
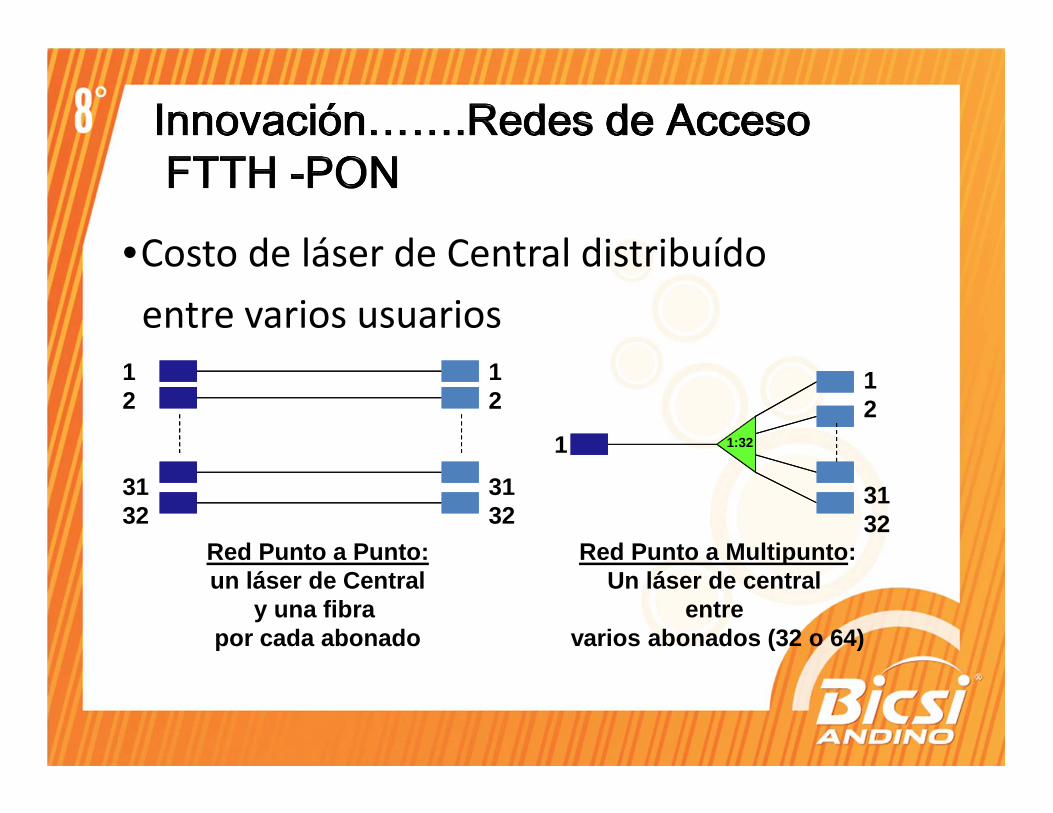
•Costo de láser de Central distribuído
entre varios usuarios
Red Punto a Punto:un láser de Central
y una fibra por cada abonado
Red Punto a Multipunto:Un láser de central
entre varios abonados (32 o 64)
12
3132
12
3132
12
3132
1 1:32
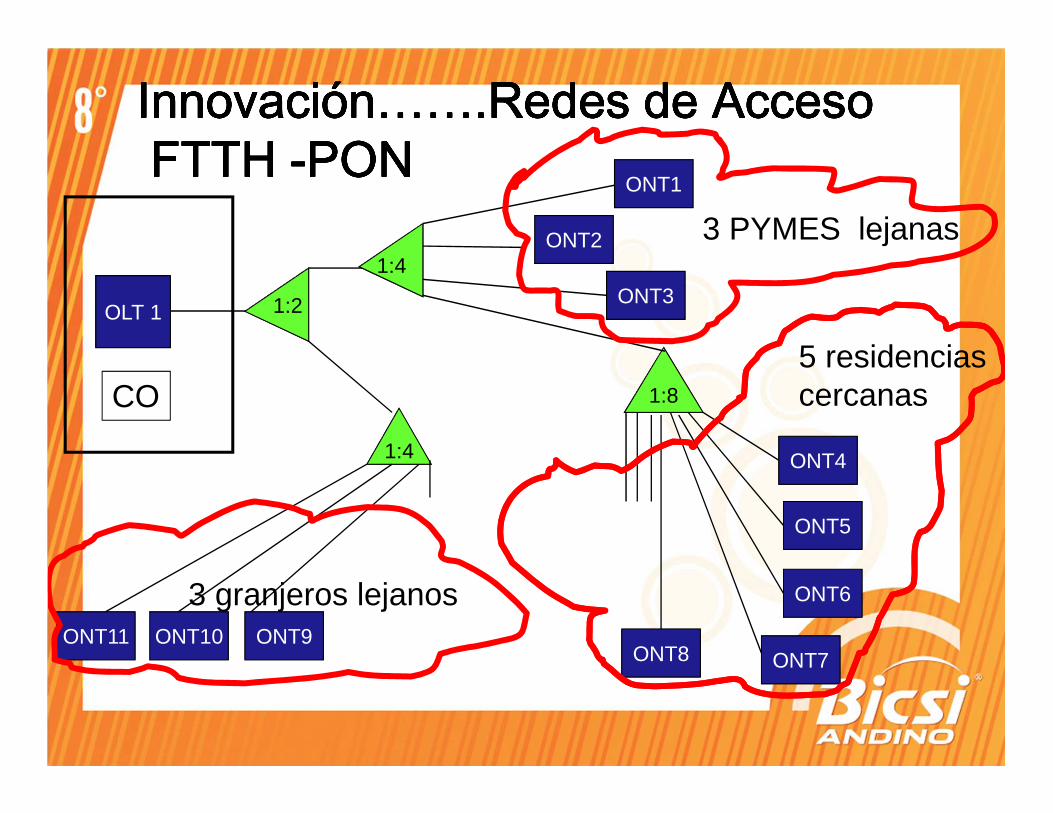
OLT 1
1:8
1:2
1:4ONT3
ONT1
ONT2
ONT4
ONT5
ONT6
ONT7ONT8
1:4
ONT9ONT10ONT11
CO
3 granjeros lejanos
3 PYMES lejanas
5 residenciascercanas
InnovaciónInnovaciónInnovaciónInnovación…….…….…….…….RedesRedesRedesRedes de de de de AccesoAccesoAccesoAccesoFTTH FTTH FTTH FTTH ----PON PON PON PON InnovaciónInnovaciónInnovaciónInnovación…….…….…….…….RedesRedesRedesRedes de de de de AccesoAccesoAccesoAccesoFTTH FTTH FTTH FTTH ----PON PON PON PON
48
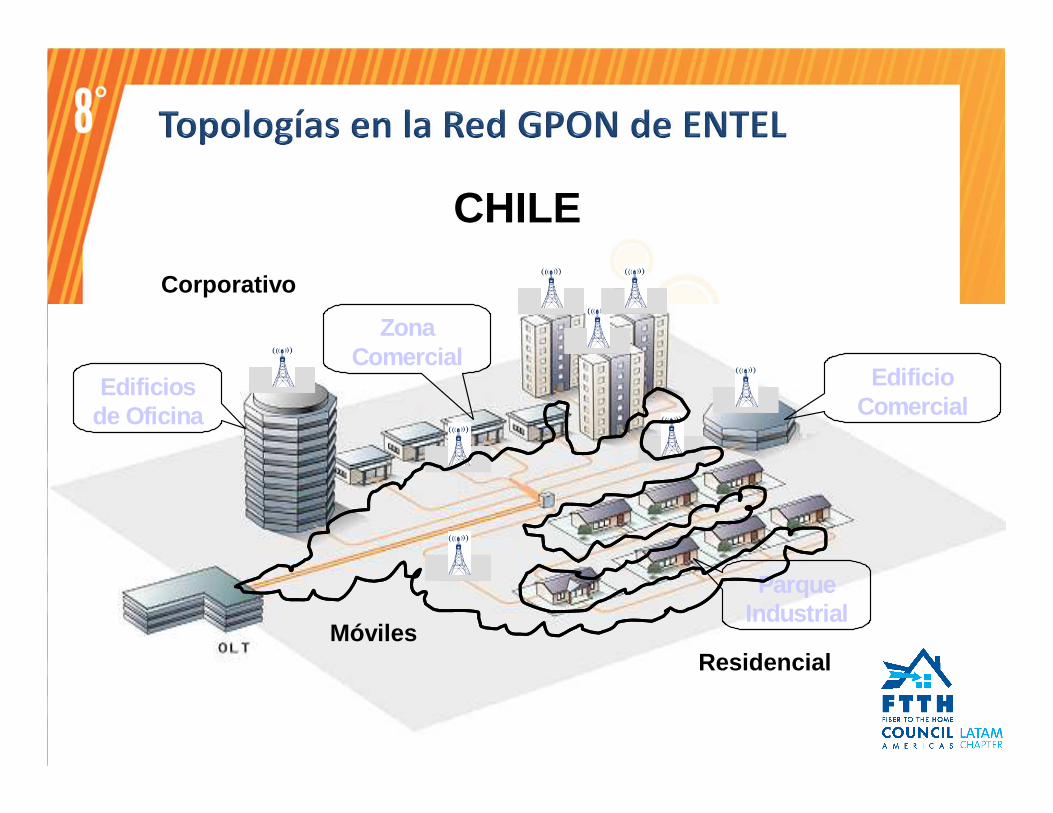
Parque Industrial
Edificio Comercial
Zona Comercial
Edificios de Oficina
Residencial
Corporativo
Móviles
CHILE
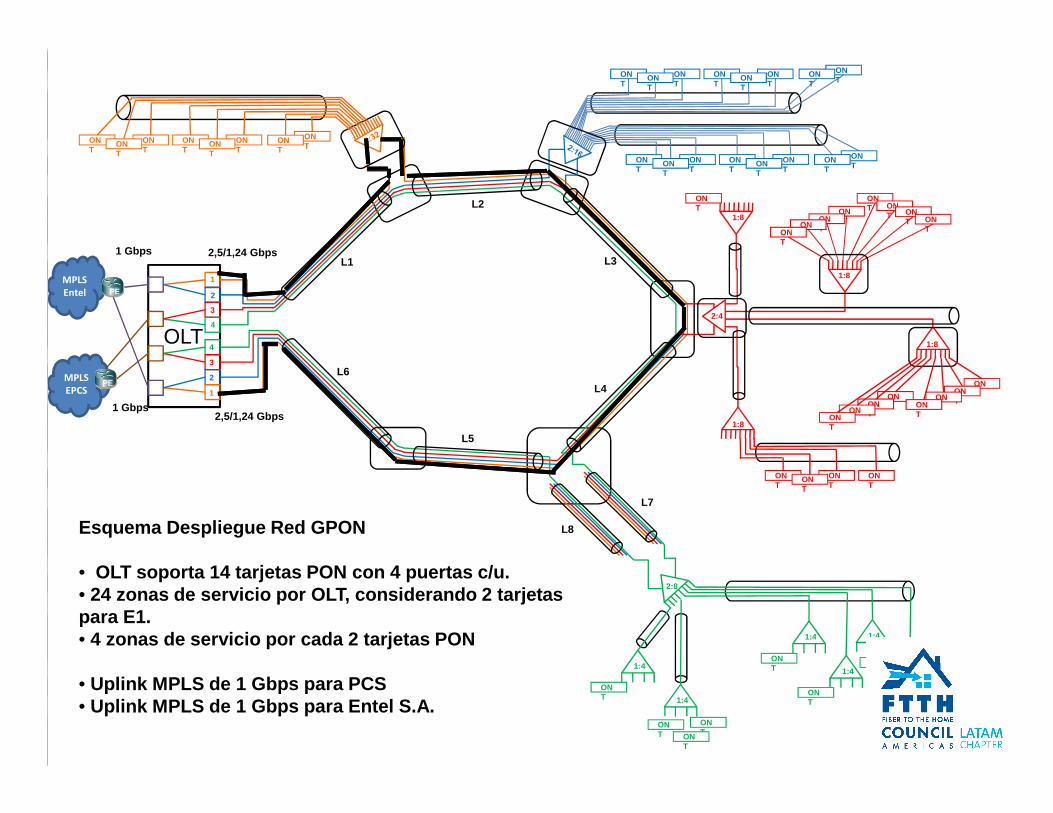
ONTON
TONT
ONT
2:8
2:4
1:8
1:8
1:8
1:8
ONT
ONT
ONT
ONT
ONT
ONT
ONT
ONT
ONT
ONT
ONT
ONT
ONT
ONT
ONT
ONT
ONT ON
T ONT ON
T
ONTON
TONTON
T
ONTON
TONTON
T
ONT
ONT
ONT
ONT
ONT
1:4
1:4
1:4
1:41:4
1:4ONTON
T
ONT
ONT
ONT
ONTON
T
ONT
ONT
ONT
ONT
ONT
ONT
ONT
ONT
ONT
ONT
1
2
3
4
1
2
3
4OLT
MPLS
EPCS
MPLS
Entel PE
PE
Esquema Despliegue Red GPON
• OLT soporta 14 tarjetas PON con 4 puertas c/u.• 24 zonas de servicio por OLT, considerando 2 tarjet as para E1.• 4 zonas de servicio por cada 2 tarjetas PON
• Uplink MPLS de 1 Gbps para PCS• Uplink MPLS de 1 Gbps para Entel S.A.
1 Gbps
1 Gbps
2,5/1,24 Gbps
2,5/1,24 Gbps
L1
L2
L3
L4
L5
L6
L7
L8
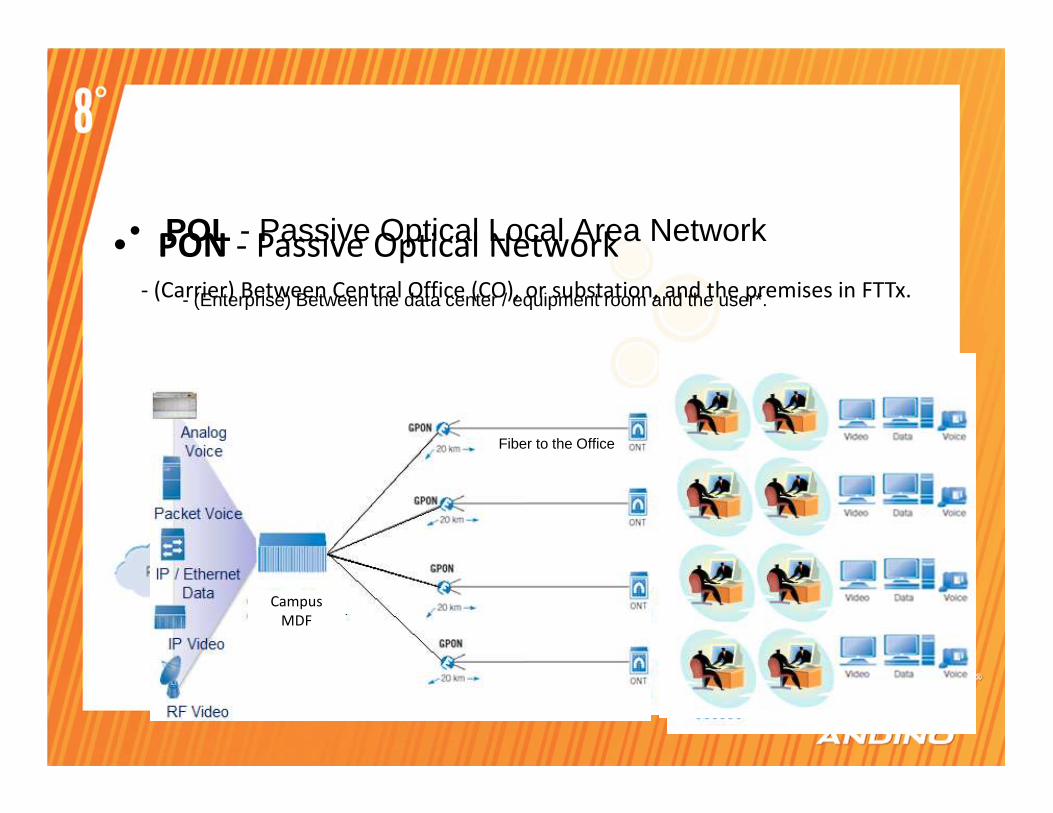
Fiber to the Office
Key Terms
• PON - Passive Optical Network- (Carrier) Between Central Office (CO), or substation, and the premises in FTTx.
Campus MDF
• POL - Passive Optical Local Area Network
- (Enterprise) Between the data center / equipment room and the user*.
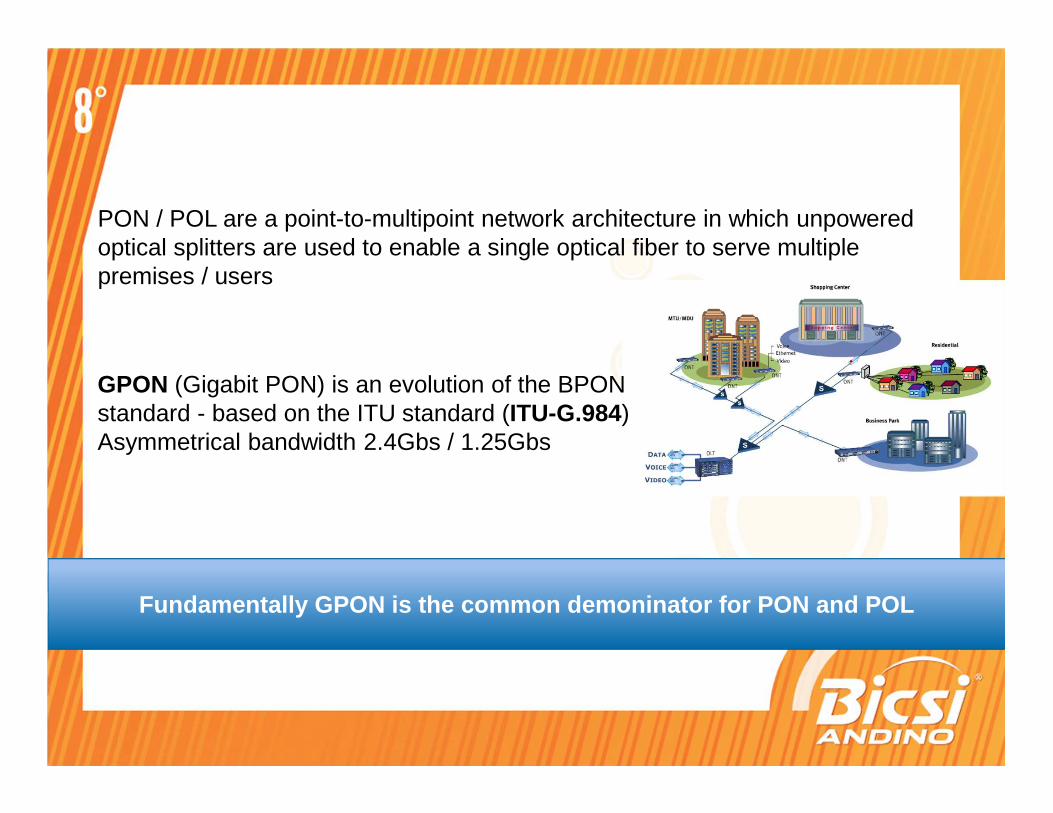
PON / POL are a point-to-multipoint network architecture in which unpowered optical splitters are used to enable a single optical fiber to serve multiple premises / users
GPON (Gigabit PON) is an evolution of the BPON standard - based on the ITU standard (ITU-G.984)Asymmetrical bandwidth 2.4Gbs / 1.25Gbs
Fundamentally GPON is the common demoninator for PO N and POL
Overarching technology

A thought to begin with…
“If you always do what you always did, you will always get what you always got.”
Keeping pace with the many changes in ITKeeping pace with the many changes in IT
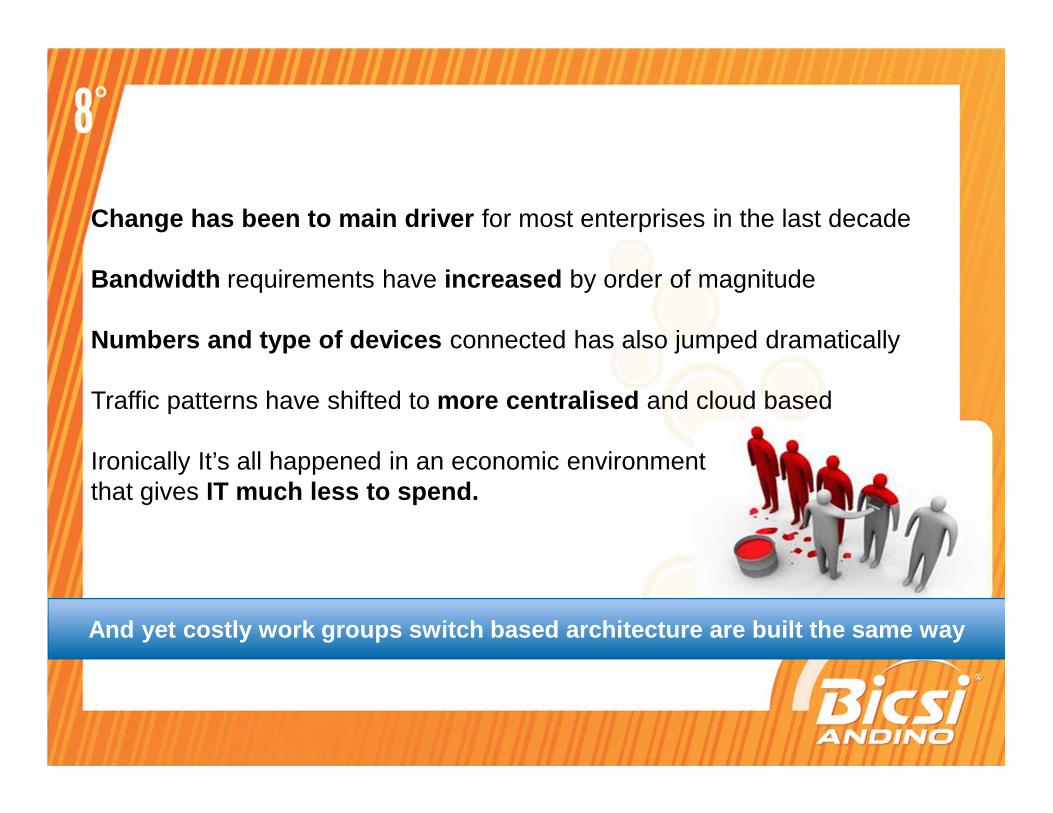
Change has been to main driver for most enterprises in the last decade
Bandwidth requirements have increased by order of magnitude
Numbers and type of devices connected has also jumped dramatically
Traffic patterns have shifted to more centralised and cloud based
Ironically It’s all happened in an economic environment that gives IT much less to spend.
And yet costly work groups switch based architectur e are built the same way
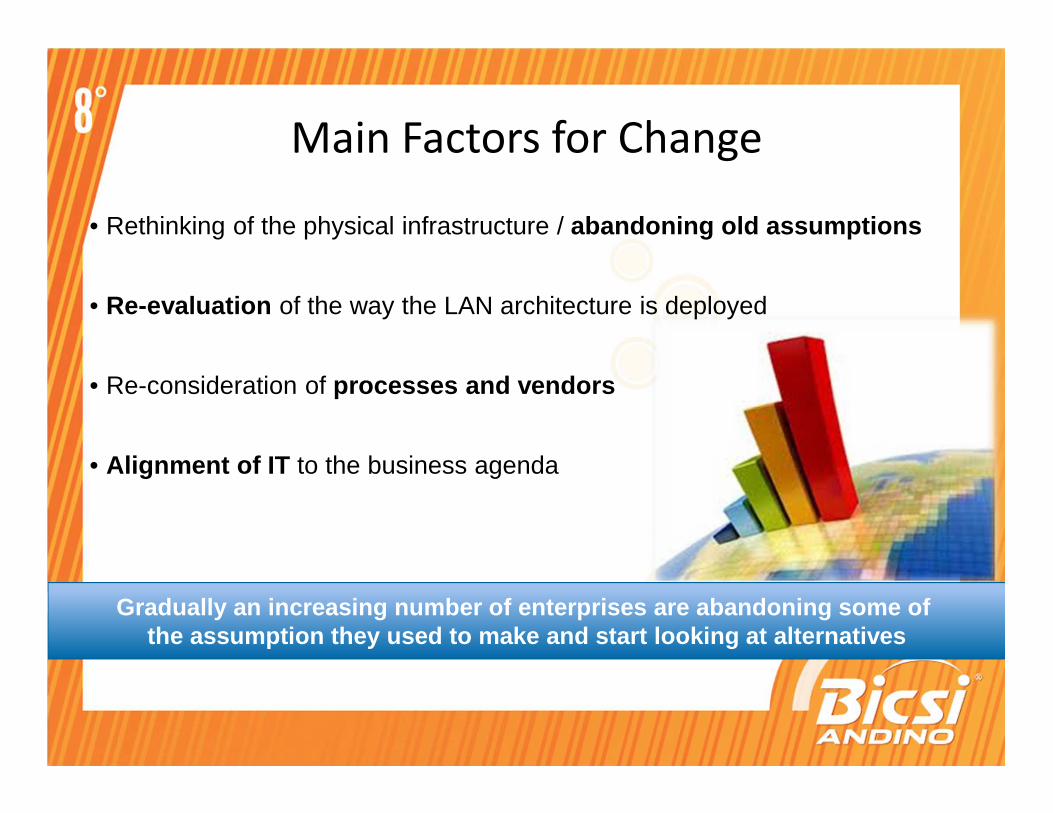
Main Factors for Change
• Rethinking of the physical infrastructure / abandoning old assumptions
• Re-evaluation of the way the LAN architecture is deployed
• Re-consideration of processes and vendors
• Alignment of IT to the business agenda
Gradually an increasing number of enterprises are a bandoning some of the assumption they used to make and start looking at alternatives
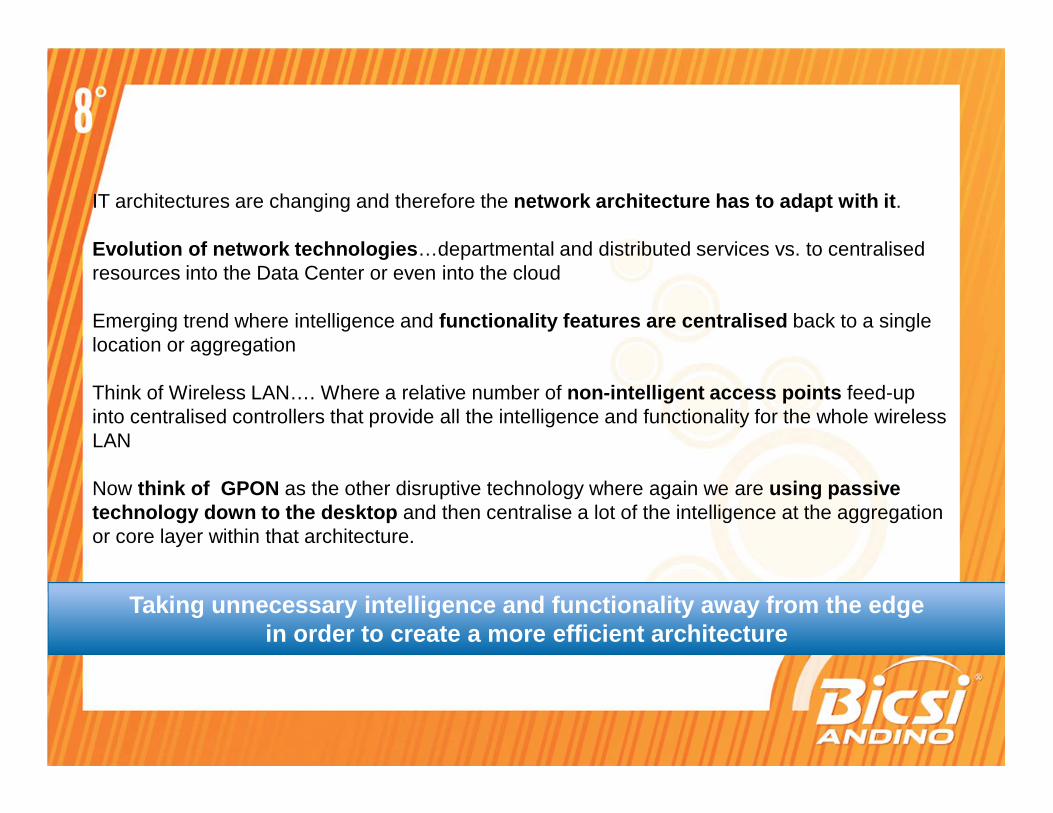
IT architectures are changing and therefore the network architecture has to adapt with it .
Evolution of network technologies …departmental and distributed services vs. to centralised resources into the Data Center or even into the cloud
Emerging trend where intelligence and functionality features are centralised back to a single location or aggregation
Think of Wireless LAN…. Where a relative number of non-intelligent access points feed-up into centralised controllers that provide all the intelligence and functionality for the whole wireless LAN
Now think of GPON as the other disruptive technology where again we are using passive technology down to the desktop and then centralise a lot of the intelligence at the aggregation or core layer within that architecture.
Game changer & Disruptive Technology
Taking unnecessary intelligence and functionality a way from the edgein order to create a more efficient architecture
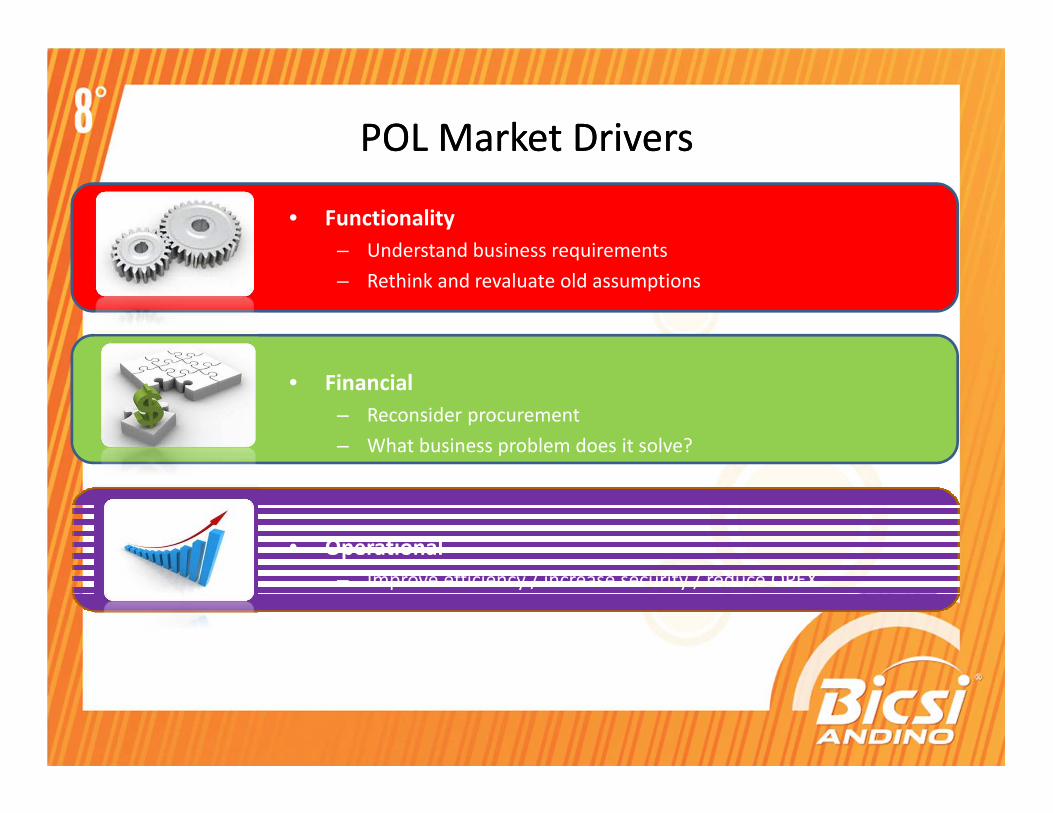
POL Market DriversPOL Market Drivers
• Functionality
– Understand business requirements
– Rethink and revaluate old assumptions
• Financial
– Reconsider procurement
– What business problem does it solve?
• Operational
– Improve efficiency / increase security / reduce OPEX
GPON Evolution
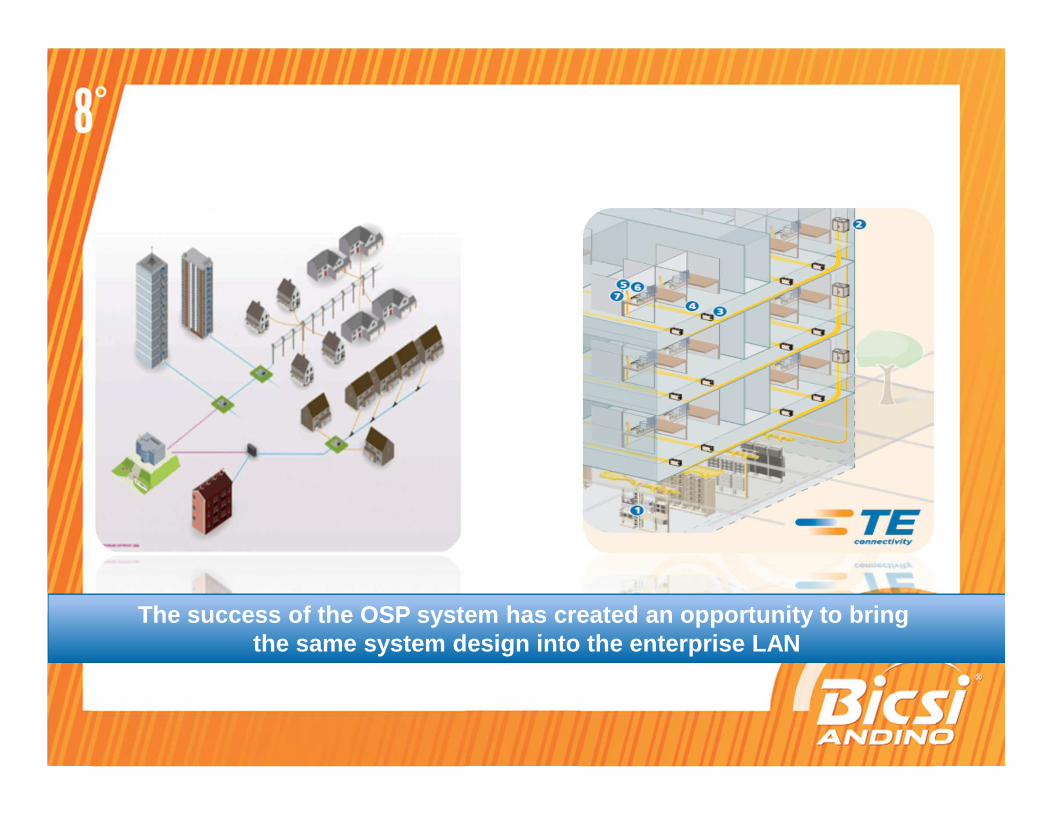
The success of the OSP system has created an opport unity to bring the same system design into the enterprise LAN
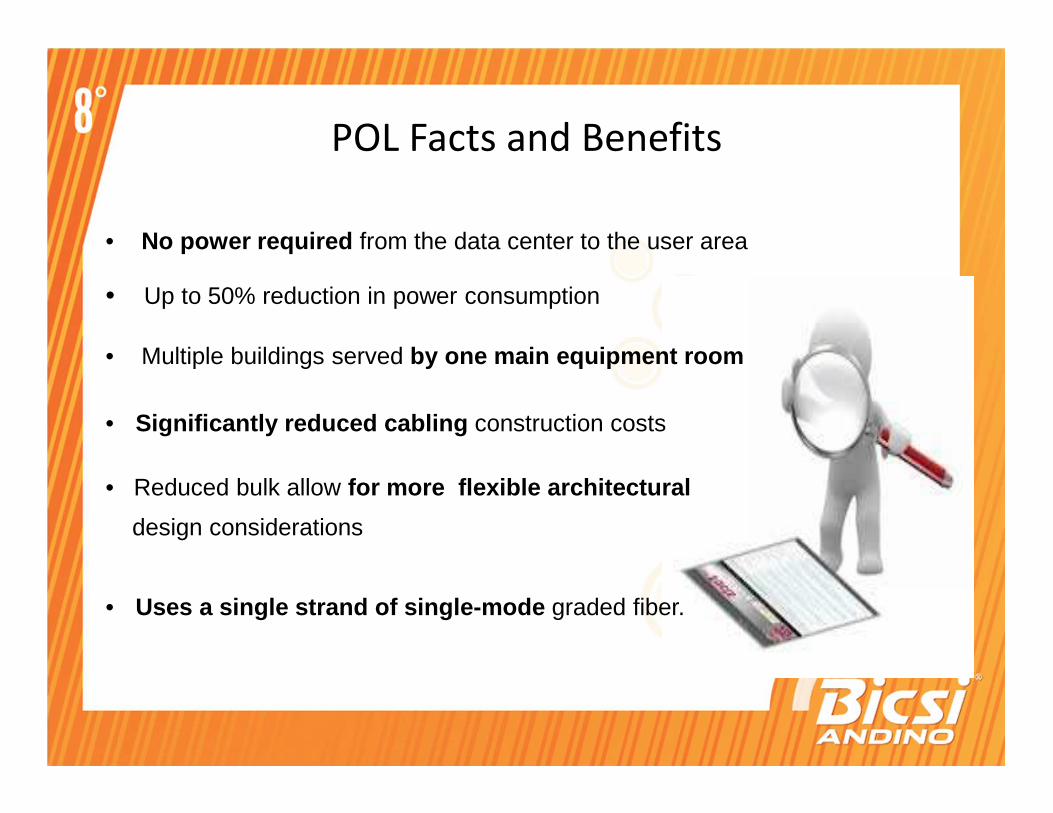
POL Facts and Benefits
• No power required from the data center to the user area
• Multiple buildings served by one main equipment room
• Up to 50% reduction in power consumption
• Significantly reduced cabling construction costs
• Reduced bulk allow for more flexible architectural
design considerations
• Uses a single strand of single-mode graded fiber.
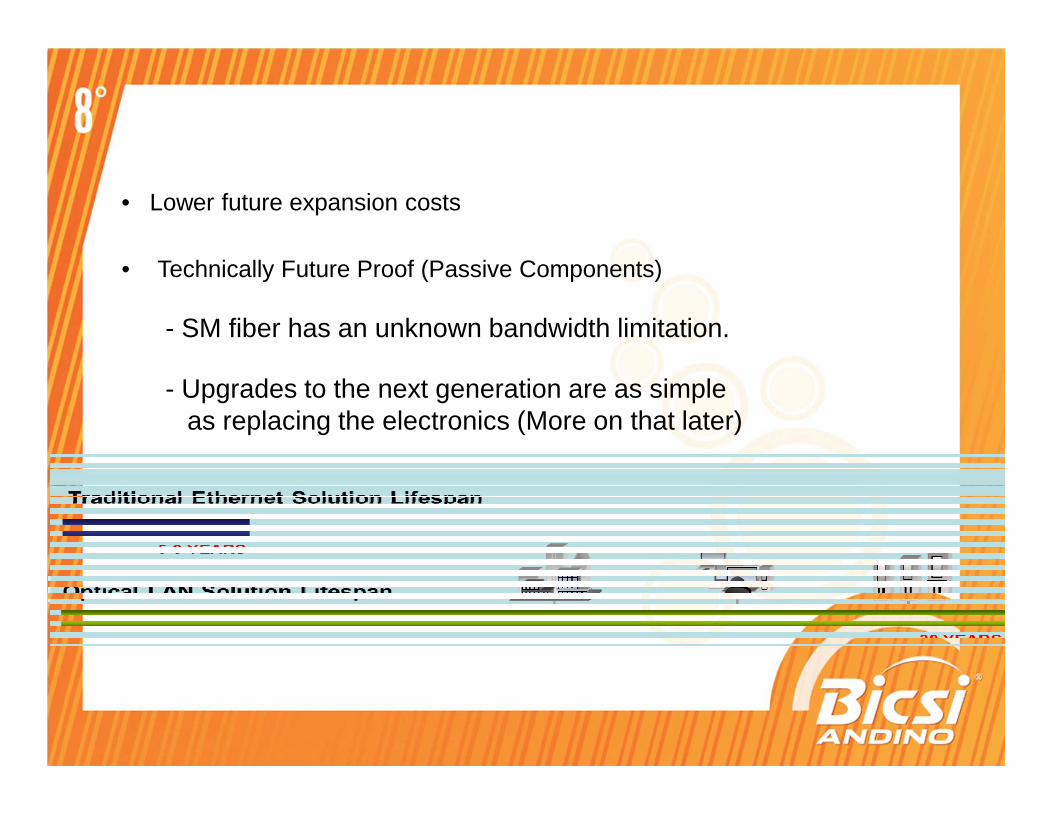
• Technically Future Proof (Passive Components)
- SM fiber has an unknown bandwidth limitation.
- Upgrades to the next generation are as simple as replacing the electronics (More on that later)
• Lower future expansion costs
POL Facts and Benefits
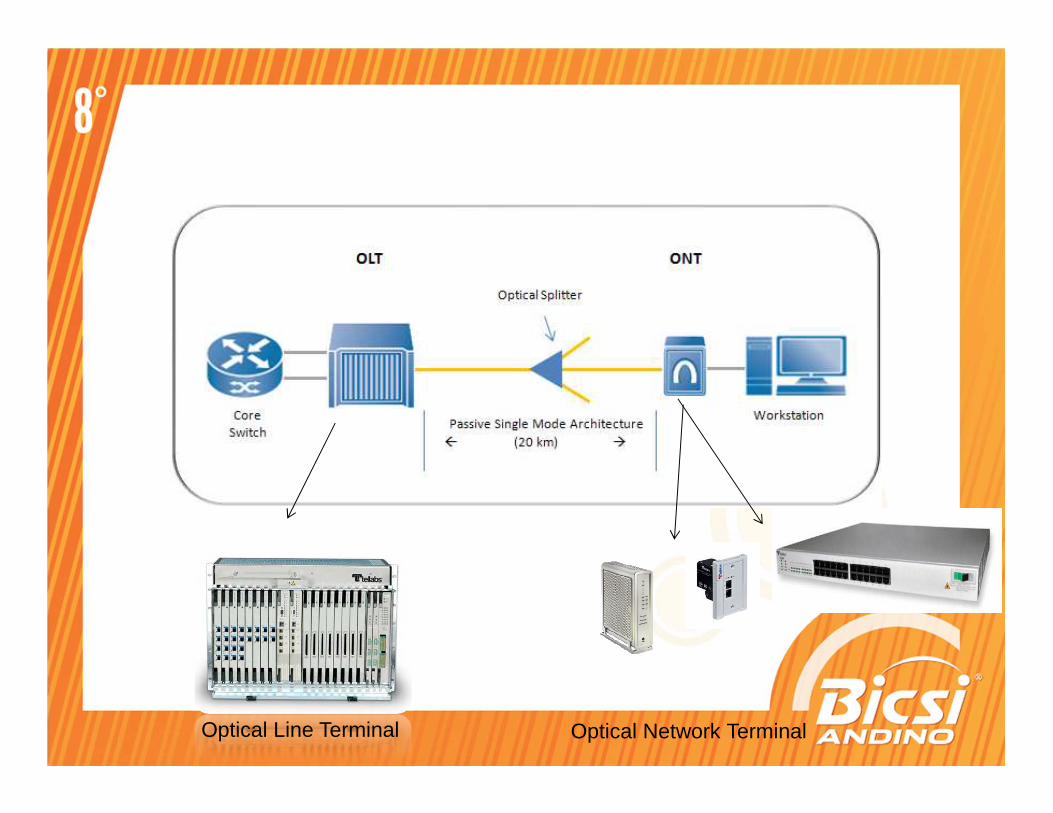
Optical Line Terminal Optical Network Terminal
Traditional POL Architecture
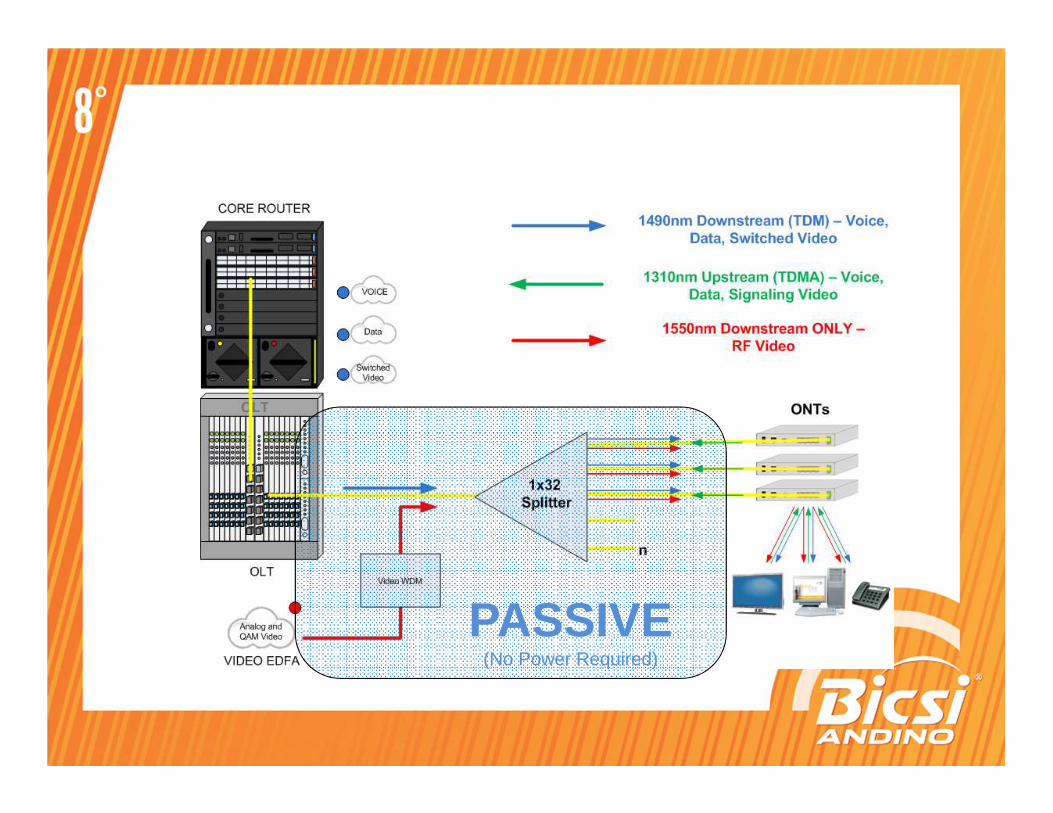
PASSIVE(No Power Required)
GPON details
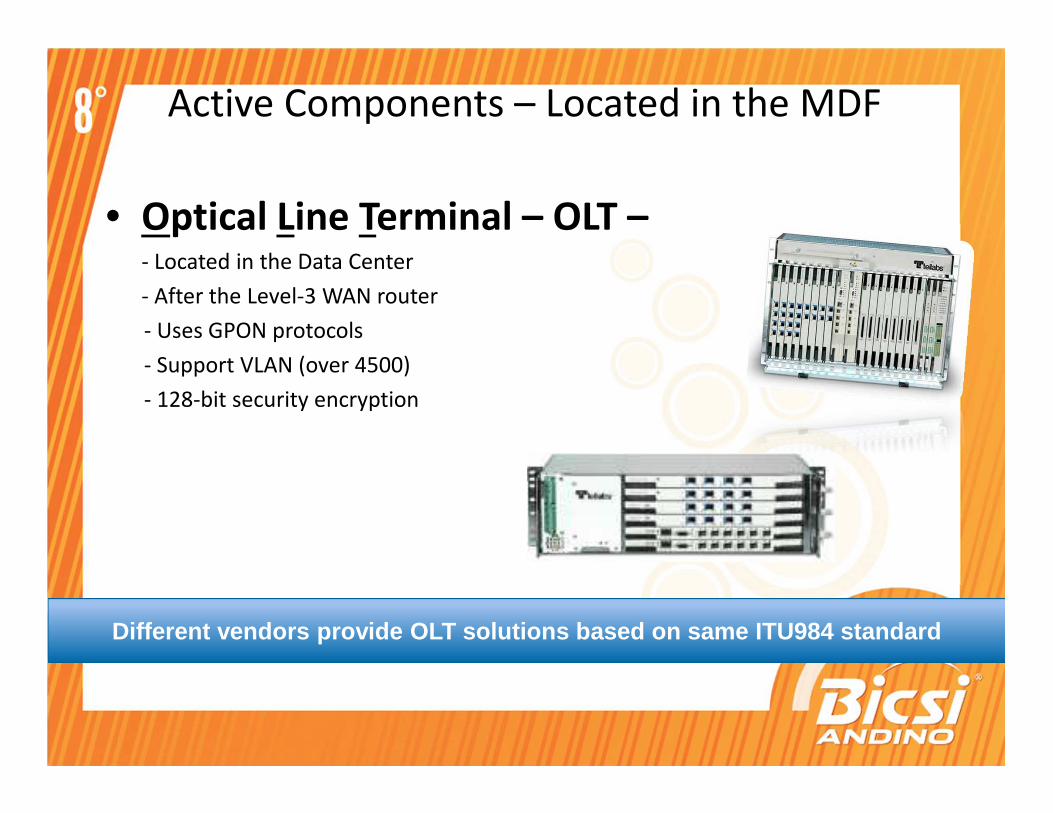
Active Components – Located in the MDF
• Optical Line Terminal – OLT –- Located in the Data Center
- After the Level-3 WAN router
- Uses GPON protocols
- Support VLAN (over 4500)
- 128-bit security encryption
Different vendors provide OLT solutions based on sa me ITU984 standard
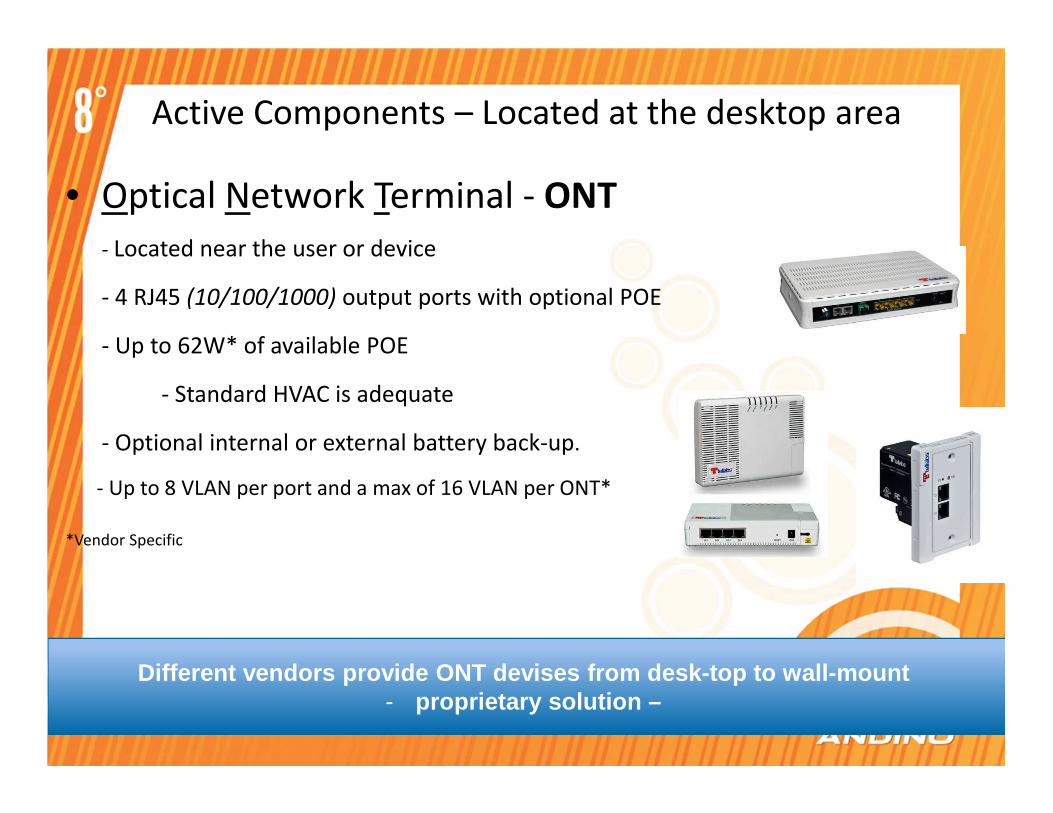
Active Components – Located at the desktop area
• Optical Network Terminal - ONT
- Located near the user or device
- 4 RJ45 (10/100/1000) output ports with optional POE
- Up to 62W* of available POE
- Standard HVAC is adequate
- Optional internal or external battery back-up.
- Up to 8 VLAN per port and a max of 16 VLAN per ONT*
*Vendor Specific
Different vendors provide ONT devises from desk-top to wall-mount - proprietary solution –
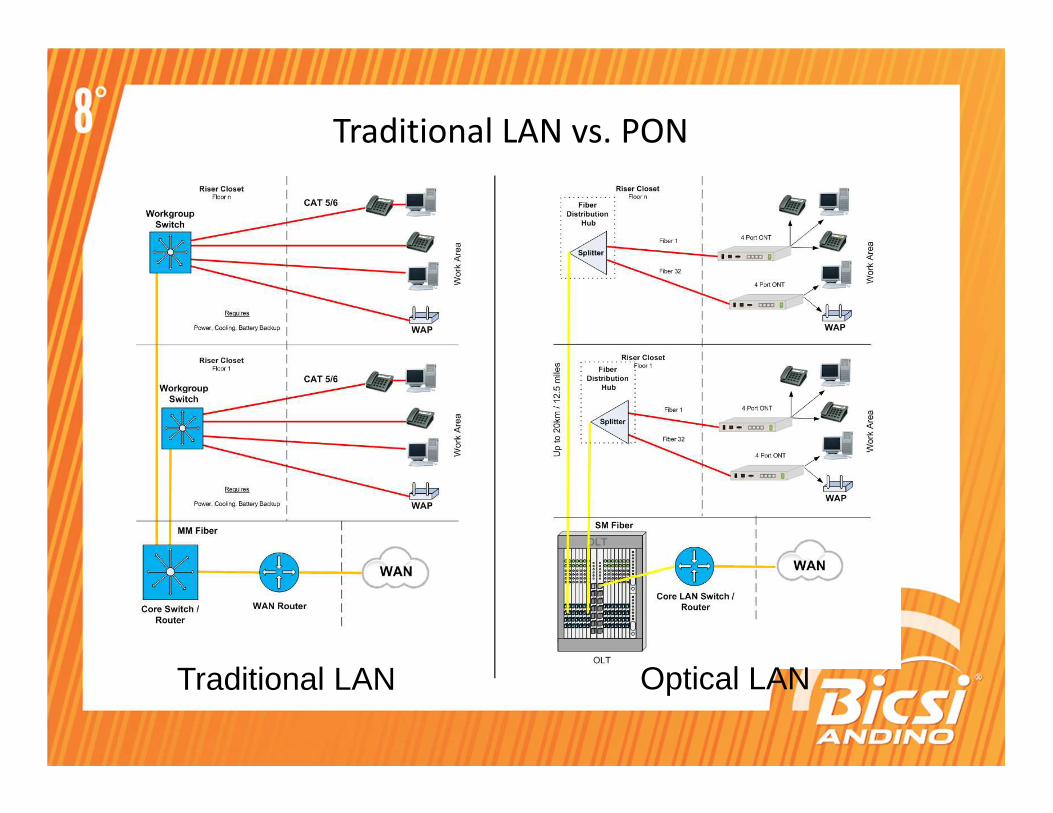
Traditional LAN vs. PON
Traditional LAN Optical LAN
IDF Office SpaceMDF
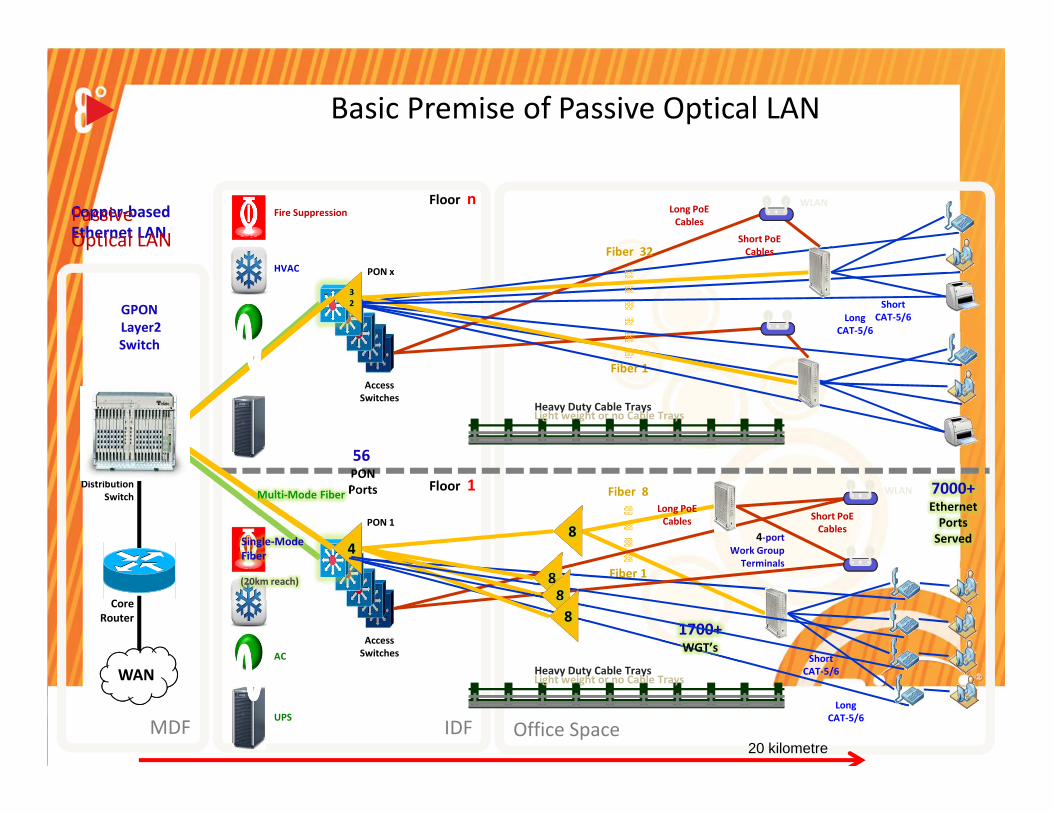
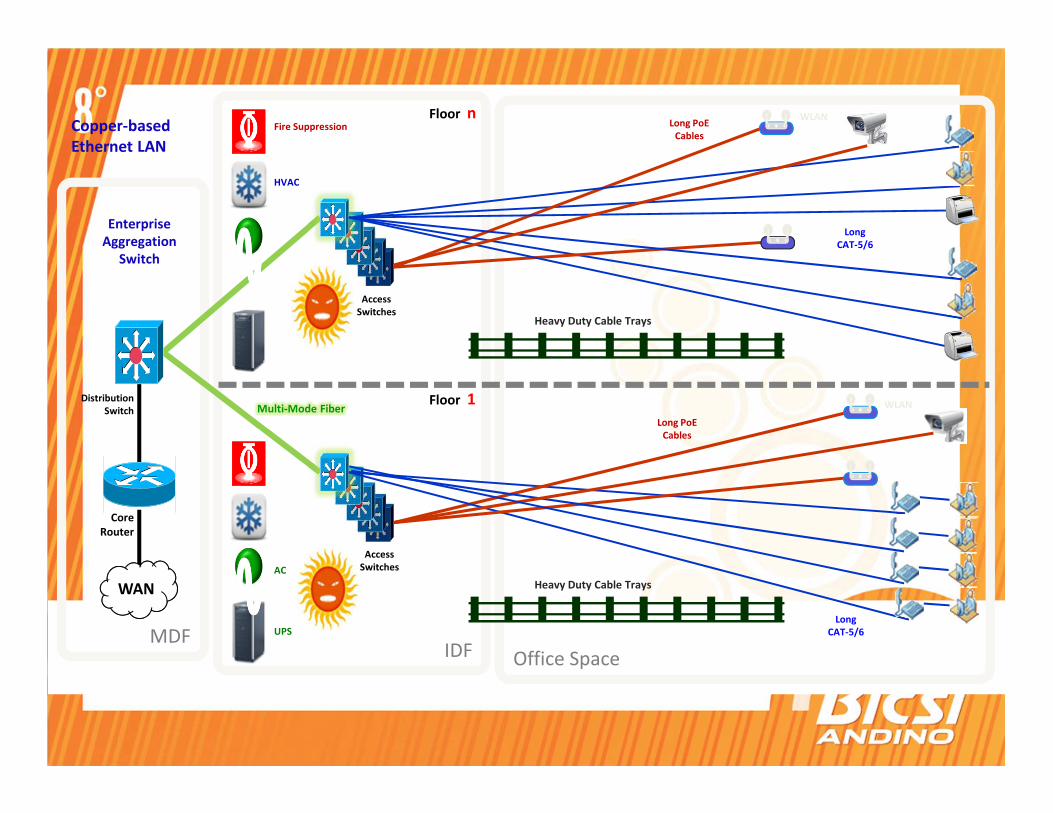
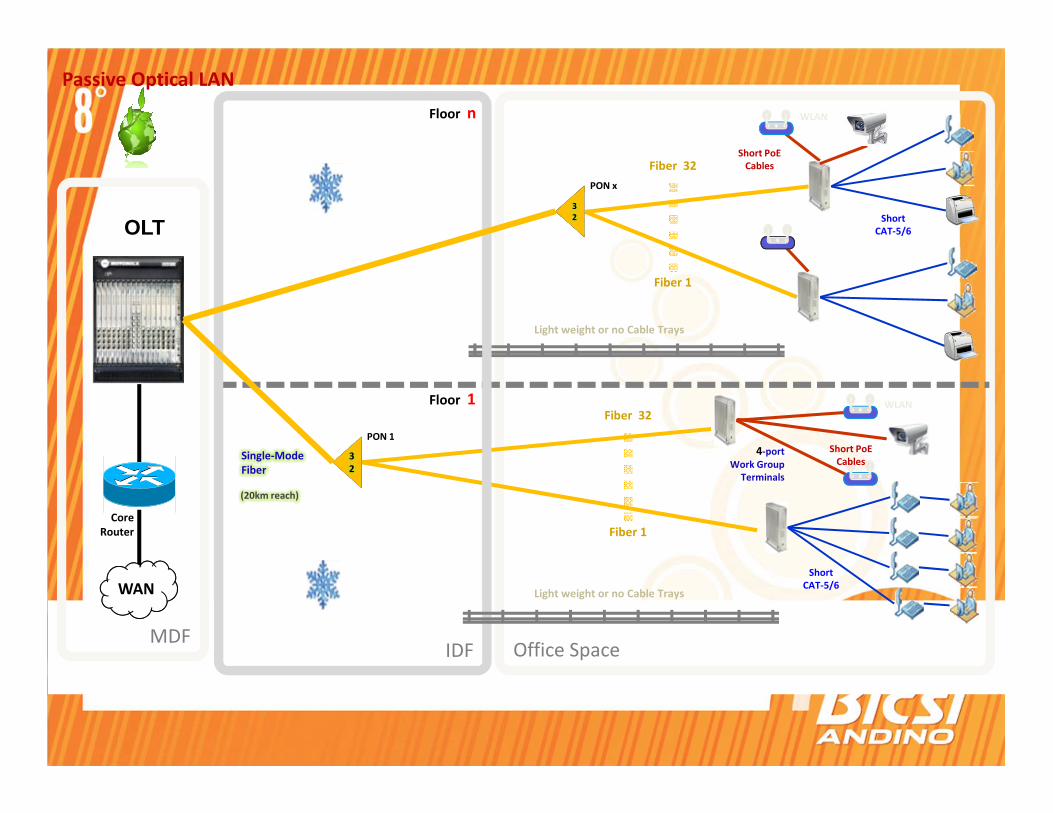
Basic Premise of Passive Optical LAN
Floor n
Access
Switches
WLAN
Short
CAT-5/6
Core
Router
Distribution
Switch
Copper-based
Ethernet LAN
56PON
Ports
4-port
Work Group
Terminals
Fiber 8
Fiber 1
PON 1
PON x
GPON
Layer2
Switch
WAN
Floor 1
Access
SwitchesShort
CAT-5/6
PassiveOptical LAN
Long
CAT-5/6
Long
CAT-5/6
Fiber 32
Fiber 1
WLAN
7000+Ethernet
Ports
Served4
8
1700+WGT’s
Fire Suppression
3
2
Heavy Duty Cable Trays
Heavy Duty Cable Trays
UPS
AC
HVAC
Multi-Mode Fiber
Single-Mode
Fiber
(20km reach)
Light weight or no Cable Trays
Light weight or no Cable Trays
Long PoE
Cables
Long PoE
Cables
Short PoE
Cables
Short PoE
Cables
88
8
20 kilometre
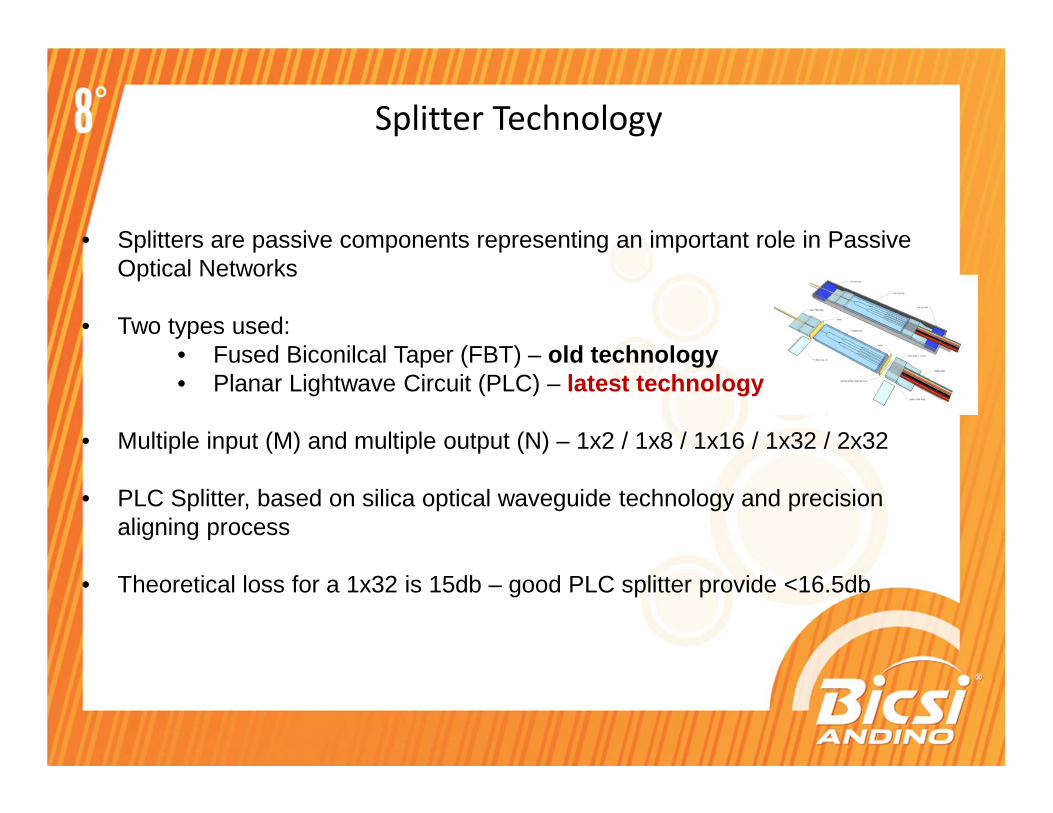
Splitter Technology
• Splitters are passive components representing an important role in Passive Optical Networks
• Two types used:• Fused Biconilcal Taper (FBT) – old technology• Planar Lightwave Circuit (PLC) – latest technology
• Multiple input (M) and multiple output (N) – 1x2 / 1x8 / 1x16 / 1x32 / 2x32
• PLC Splitter, based on silica optical waveguide technology and precision aligning process
• Theoretical loss for a 1x32 is 15db – good PLC splitter provide <16.5db
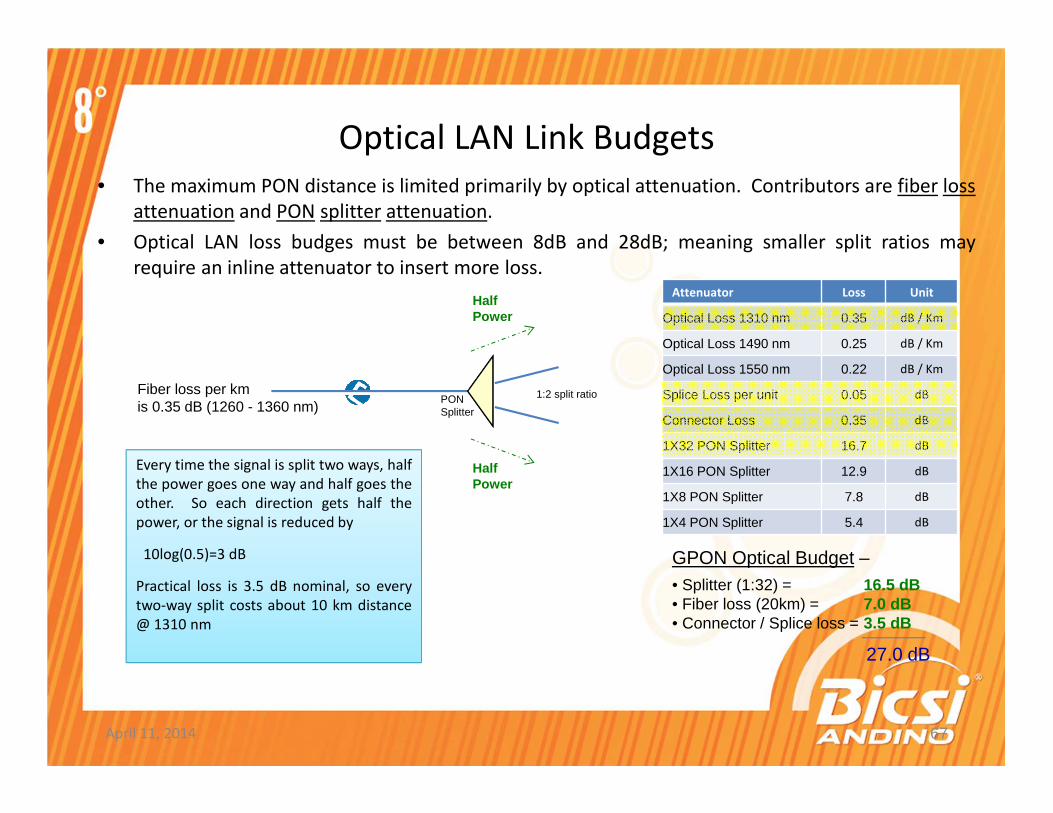
Optical LAN Link Budgets
April 11, 2014 67
• The maximum PON distance is limited primarily by optical attenuation. Contributors are fiber lossattenuation and PON splitter attenuation.
• Optical LAN loss budges must be between 8dB and 28dB; meaning smaller split ratios mayrequire an inline attenuator to insert more loss.
PONSplitter
Fiber loss per km is 0.35 dB (1260 - 1360 nm)
Every time the signal is split two ways, halfthe power goes one way and half goes theother. So each direction gets half thepower, or the signal is reduced by
10log(0.5)=3 dB
Practical loss is 3.5 dB nominal, so everytwo-way split costs about 10 km distance@ 1310 nm
HalfPower
HalfPower
Attenuator Loss Unit
Optical Loss 1310 nm 0.35 dB / Km
Optical Loss 1490 nm 0.25 dB / Km
Optical Loss 1550 nm 0.22 dB / Km
Splice Loss per unit 0.05 dB
Connector Loss 0.35 dB
1X32 PON Splitter 16.7 dB
1X16 PON Splitter 12.9 dB
1X8 PON Splitter 7.8 dB
1X4 PON Splitter 5.4 dB
1:2 split ratio
GPON Optical Budget –• Splitter (1:32) = 16.5 dB• Fiber loss (20km) = 7.0 dB• Connector / Splice loss = 3.5 dB
27.0 dB
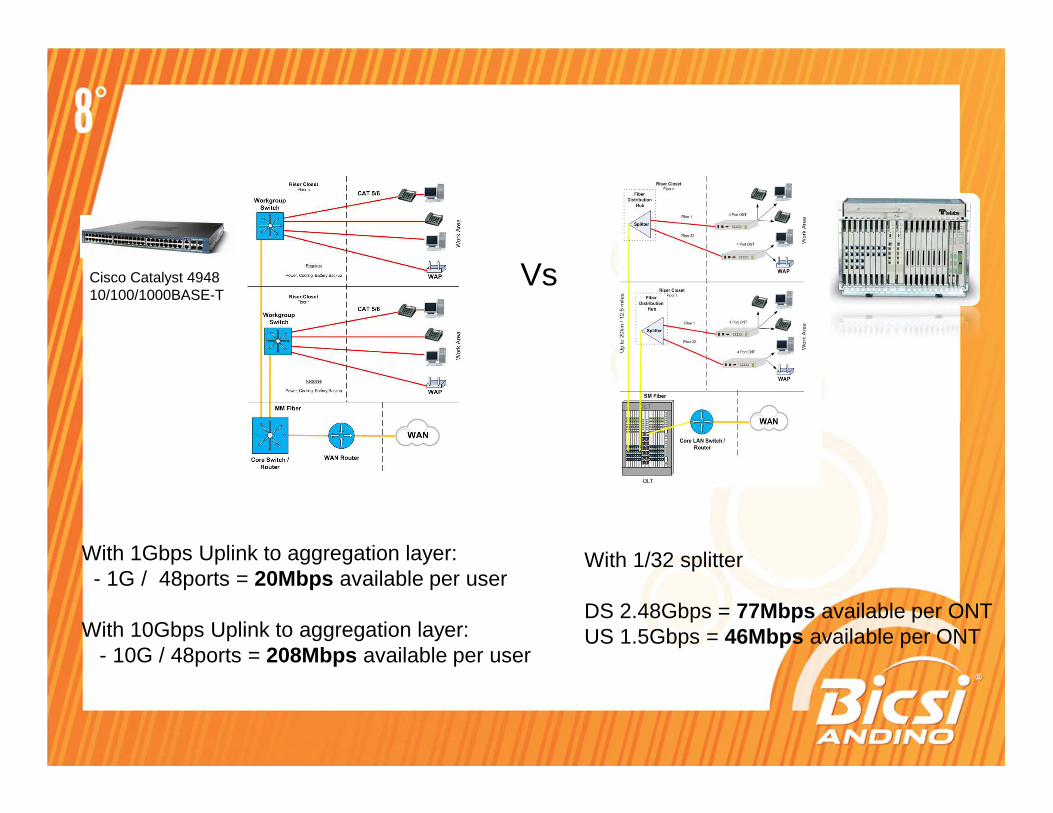
Bandwidth Comparison GPON vs Copper LANBandwidth Comparison GPON vs Copper LAN
Cisco Catalyst 4948 10/100/1000BASE-T
Vs
With 1Gbps Uplink to aggregation layer:- 1G / 48ports = 20Mbps available per user
With 10Gbps Uplink to aggregation layer:- 10G / 48ports = 208Mbps available per user
With 1/32 splitter
DS 2.48Gbps = 77Mbps available per ONTUS 1.5Gbps = 46Mbps available per ONT
0
20
40
60
80
100
120
140
160
180
200
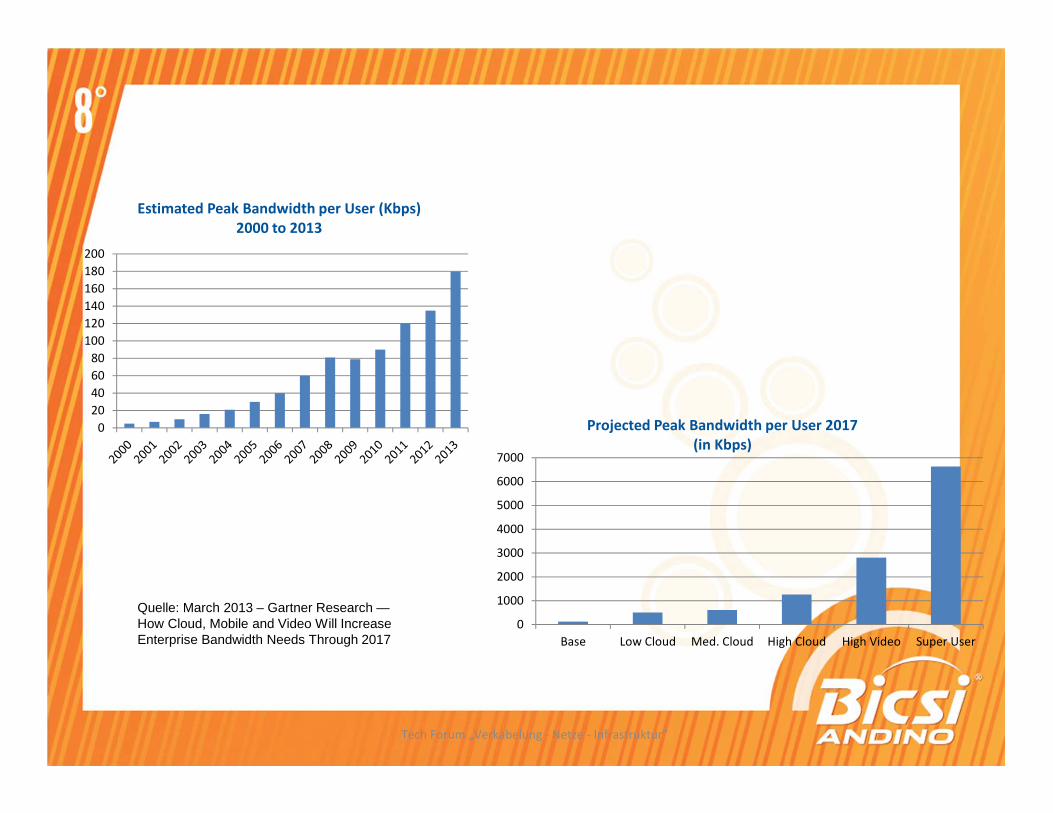
Estimated Peak Bandwidth per User (Kbps)
2000 to 2013
Quelle: March 2013 – Gartner Research —How Cloud, Mobile and Video Will Increase Enterprise Bandwidth Needs Through 2017
Tech Forum „Verkabelung - Netze - Infrastruktur”
0
1000
2000
3000
4000
5000
6000
7000
Base Low Cloud Med. Cloud High Cloud High Video Super User
Projected Peak Bandwidth per User 2017
(in Kbps)
Bandwidth Usage Projections in the LANBandwidth Usage Projections in the LAN
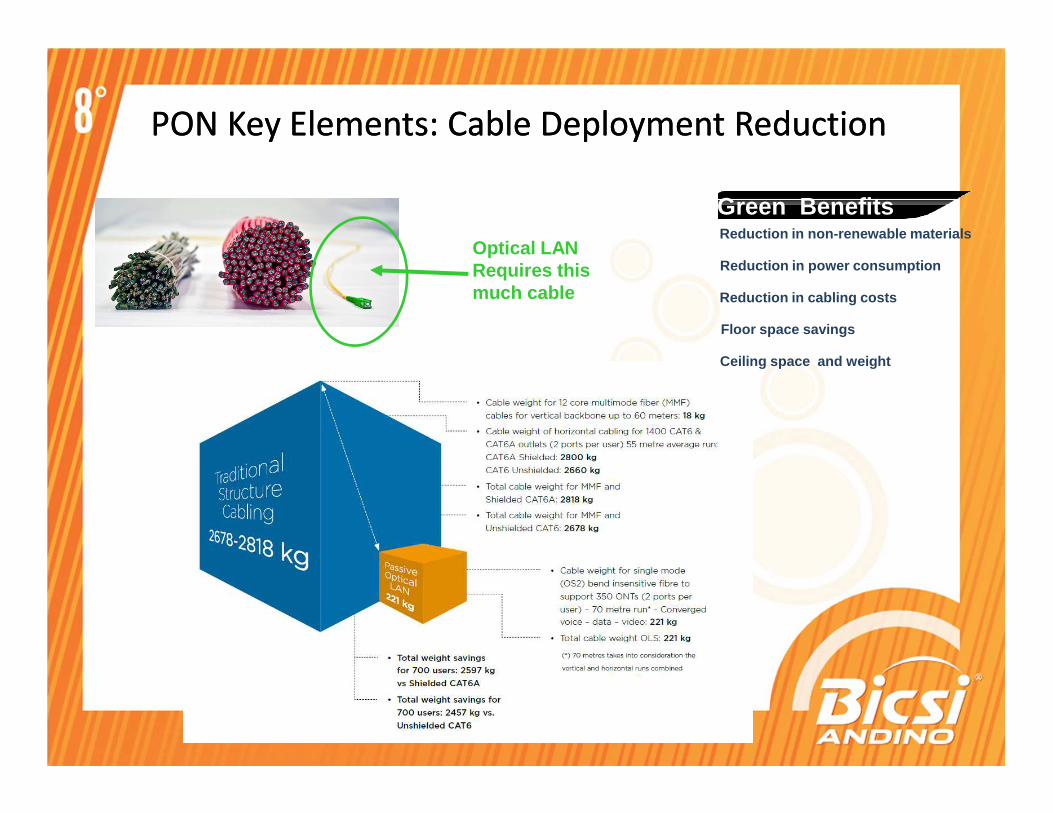
PON Key Elements: Cable Deployment ReductionPON Key Elements: Cable Deployment Reduction
Optical LAN Requires this much cable
Green Benefits Reduction in non-renewable materials
Reduction in cabling costs
Reduction in power consumption
Floor space savings
Ceiling space and weight
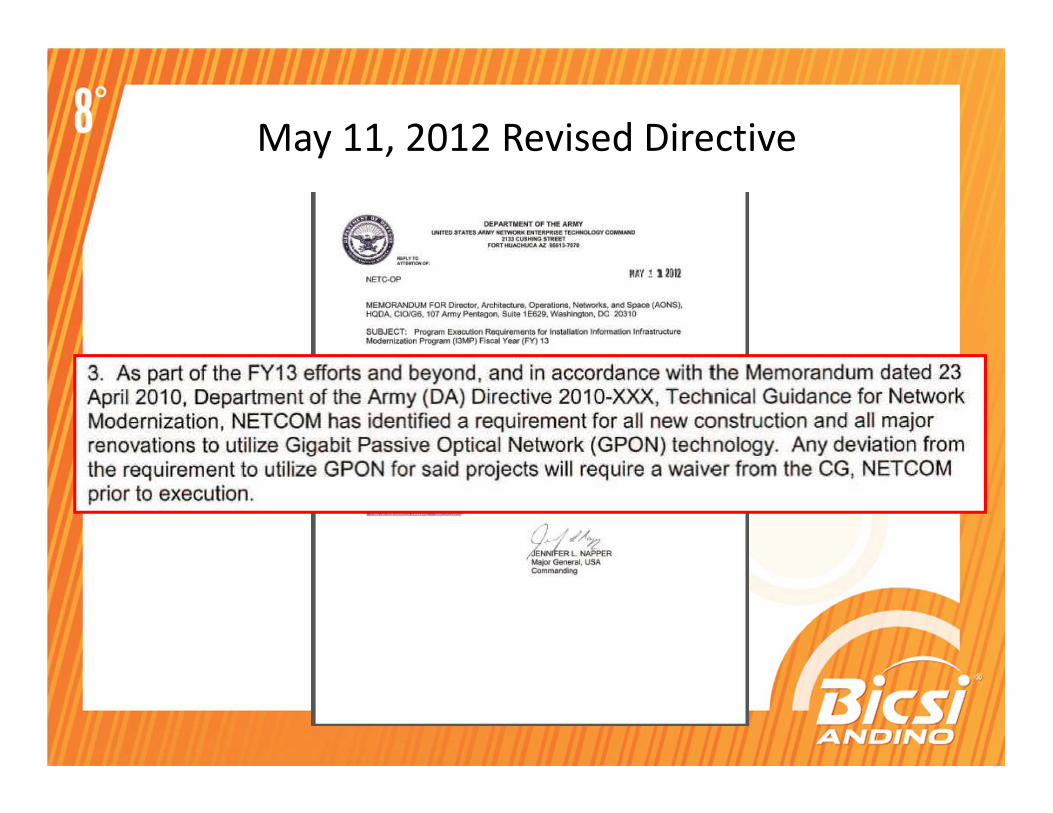
May 11, 2012 Revised Directive
POL Users Today
Hospitals
Campuses
Universities
Cruise Ships
Hotels (Large)
Government and Military
High Occupancy Buildings (Call Centers)
Multi-Tenant Units (Commercial and Residential)
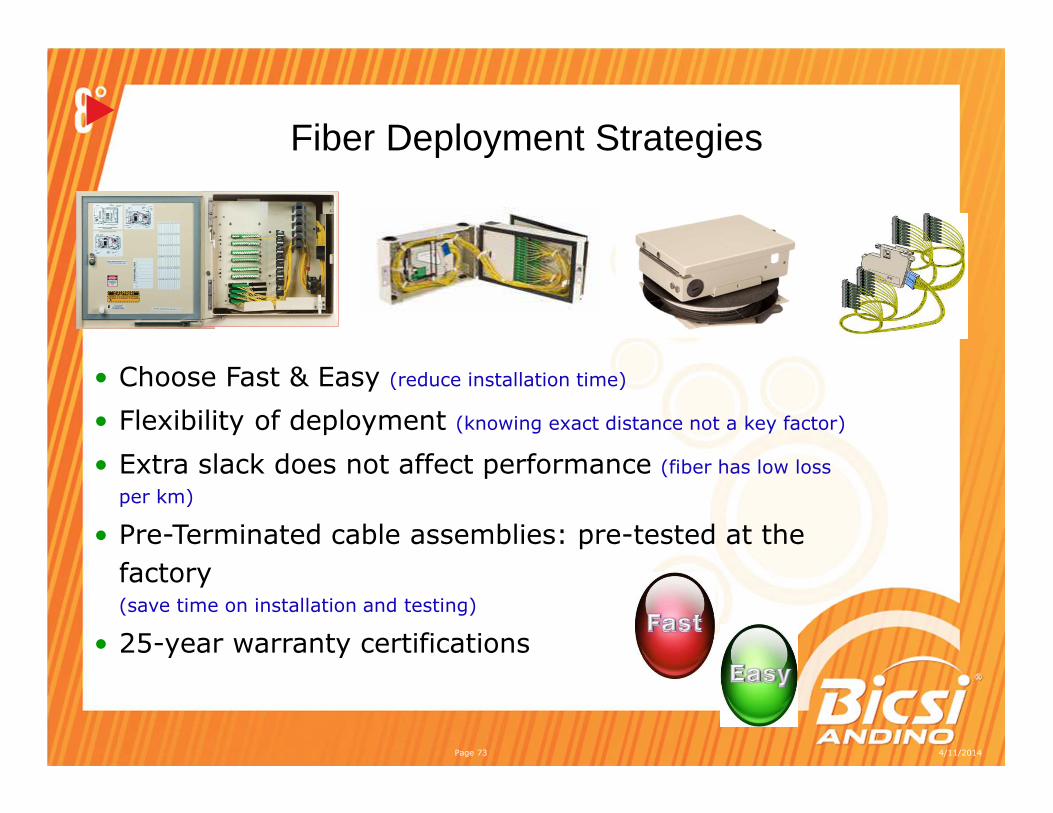
• Choose Fast & Easy (reduce installation time)
• Flexibility of deployment (knowing exact distance not a key factor)
• Extra slack does not affect performance (fiber has low loss
per km)
• Pre-Terminated cable assemblies: pre-tested at the
factory(save time on installation and testing)
• 25-year warranty certifications
Fiber Deployment Strategies
4/11/2014Page 73
Standard Bodies UpdateStandard Bodies Update
In February 2009, the Telecommunications Industry Association TR-42 Engineering Committee published TIA-568-C.1, which was the first revision to recognize duplex single-mode fiber for use in the horizontal.
On August 14, 2012, TR-42 issued an addendum to the TIA-568-C.0 Generic Telecommunications Cabling for Customer Premises standard that adds POL technology standards as supported single-mode fiber applications for the LAN.
Note : POL added to 13th Edition of TDMM – Chapter 5 Horizontal Cabling
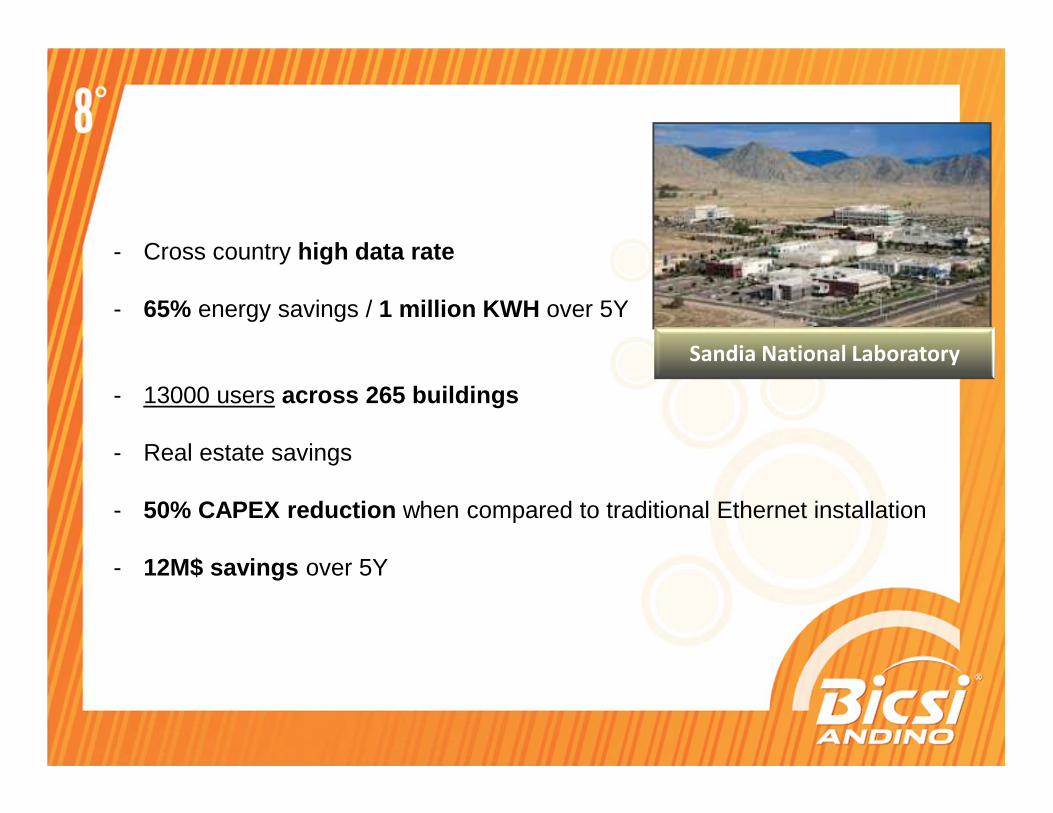
Sandia National Laboratory
Case StudyCase Study
- Cross country high data rate
- 65% energy savings / 1 million KWH over 5Y
- 13000 users across 265 buildings
- Real estate savings
- 50% CAPEX reduction when compared to traditional Ethernet installation
- 12M$ savings over 5Y
IDF Office SpaceMDF
Floor n
Access
Switches
WLAN
Core
Router
Distribution
Switch
Copper-based
Ethernet LAN
Enterprise
Aggregation
Switch
WAN
Floor 1
Access
Switches
Long
CAT-5/6
Long
CAT-5/6
WLANFire Suppression
Heavy Duty Cable Trays
Heavy Duty Cable Trays
UPS
AC
HVAC
Multi-Mode Fiber
Long PoE
Cables
Long PoE
Cables
IDF
Passive Optical LAN
Office SpaceMDF
Floor n
WLAN
Short
CAT-5/6
Core
Router
4-port
Work Group
Terminals
PON 1
PON x
WAN
Floor 1
Short
CAT-5/6
Fiber 32
Fiber 1
WLAN
3
2
3
2
Single-Mode
Fiber
(20km reach)
Light weight or no Cable Trays
IDF
Light weight or no Cable Trays
Short PoE
Cables
Short PoE
Cables
OLT
Fiber 32
Fiber 1
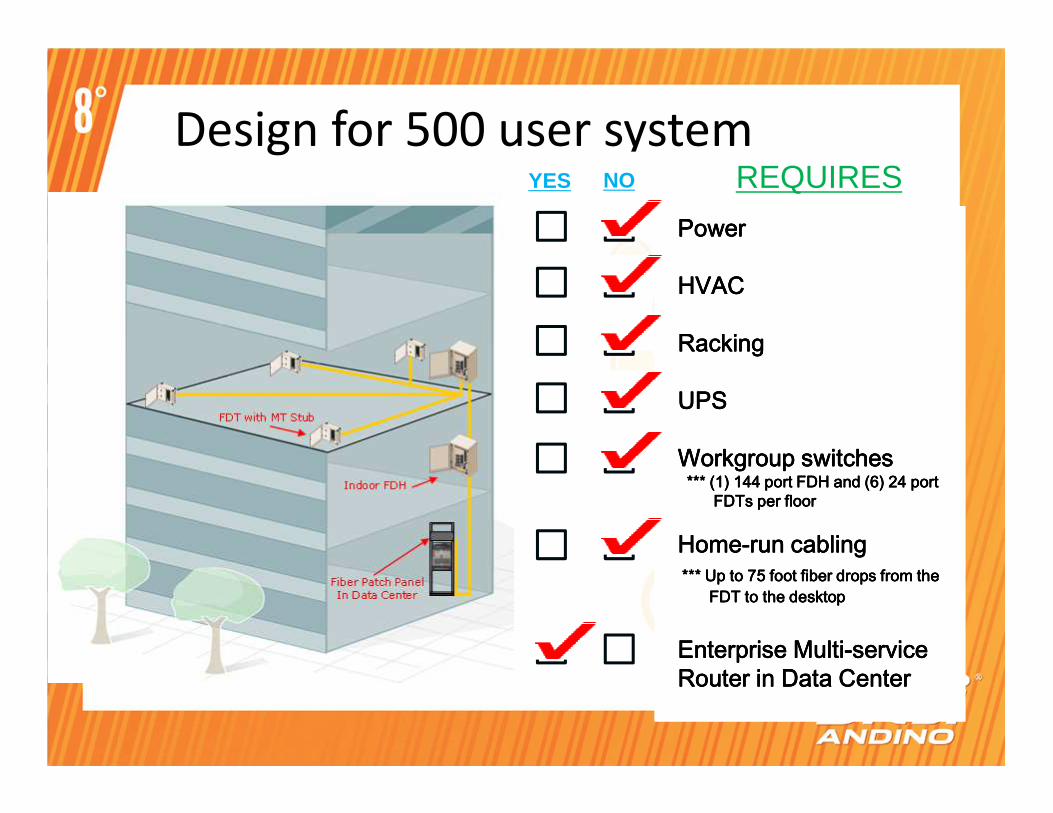
Design for 500 user system
PowerPowerPowerPower
HVACHVACHVACHVAC
RackingRackingRackingRacking
UPSUPSUPSUPS
Workgroup switchesWorkgroup switchesWorkgroup switchesWorkgroup switches*** (1) 144 port FDH and (6) 24 port *** (1) 144 port FDH and (6) 24 port *** (1) 144 port FDH and (6) 24 port *** (1) 144 port FDH and (6) 24 port
FDTs per floorFDTs per floorFDTs per floorFDTs per floor
HomeHomeHomeHome----run cabling run cabling run cabling run cabling *** Up to 75 foot fiber drops from the *** Up to 75 foot fiber drops from the *** Up to 75 foot fiber drops from the *** Up to 75 foot fiber drops from the
FDT to the desktopFDT to the desktopFDT to the desktopFDT to the desktop
Enterprise MultiEnterprise MultiEnterprise MultiEnterprise Multi----service service service service Router in Data CenterRouter in Data CenterRouter in Data CenterRouter in Data Center
REQUIRESYES NO
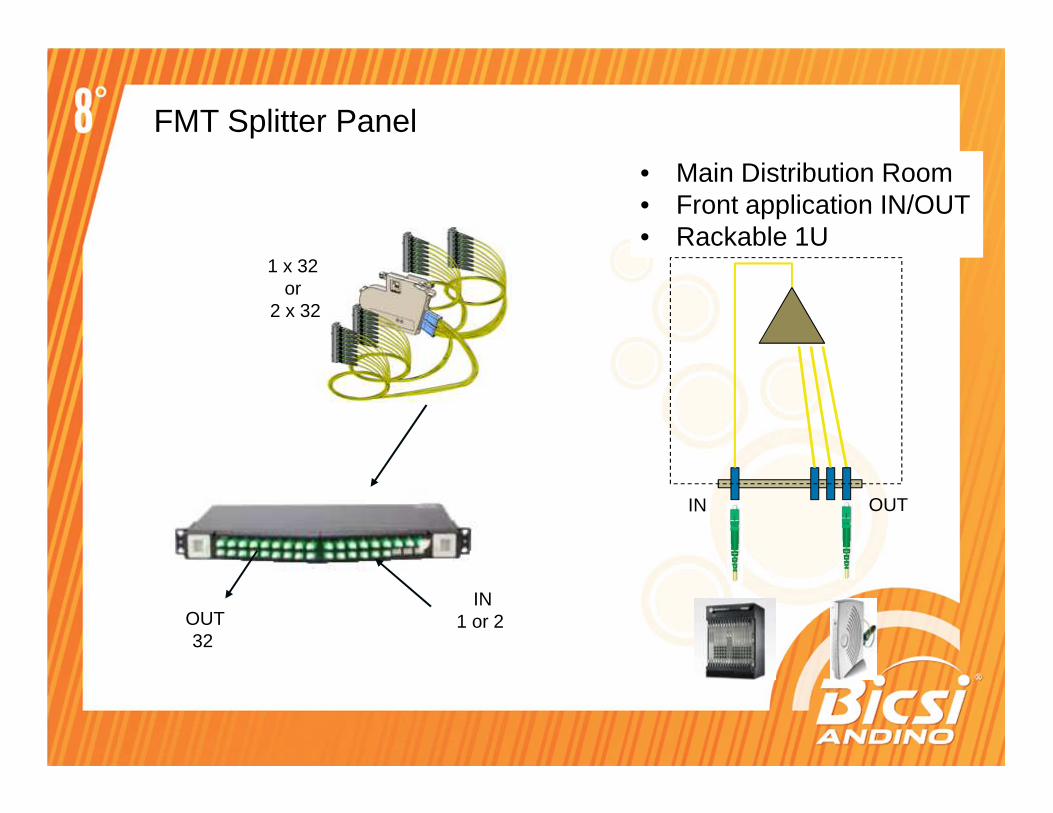
IN1 or 2 OUT
32
1 x 32 or
2 x 32
FMT Splitter Panel
• Main Distribution Room• Front application IN/OUT• Rackable 1U
IN OUT
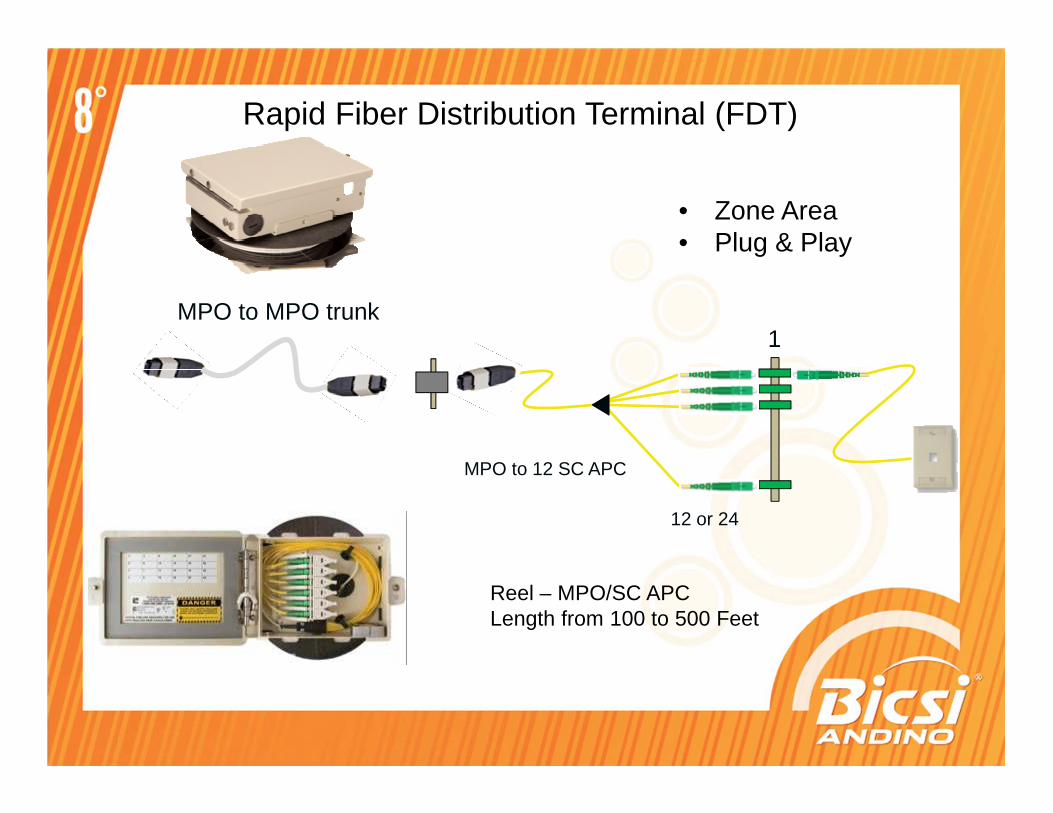
Rapid Fiber Distribution Terminal (FDT)
Reel – MPO/SC APCLength from 100 to 500 Feet
• Zone Area• Plug & Play
1
12 or 24
MPO to 12 SC APC
MPO to MPO trunk
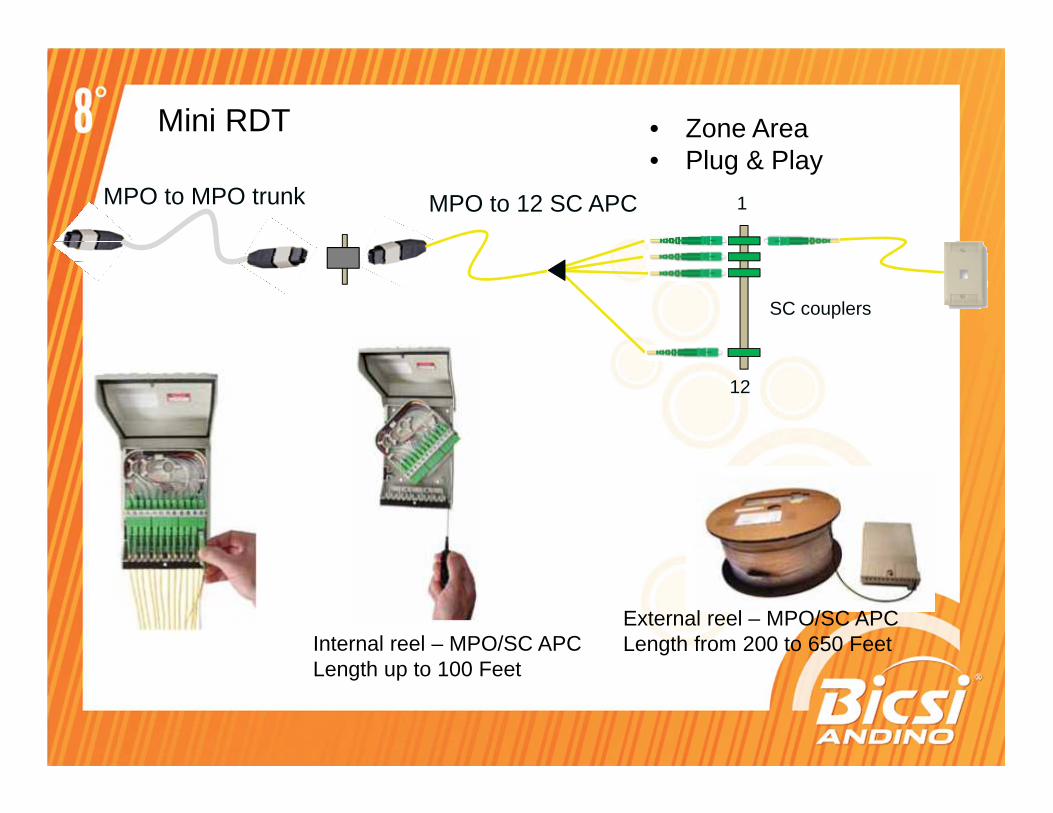
Mini RDT
External reel – MPO/SC APCLength from 200 to 650 FeetInternal reel – MPO/SC APC
Length up to 100 Feet
• Zone Area• Plug & Play
1
12
MPO to 12 SC APC
SC couplers
MPO to MPO trunk
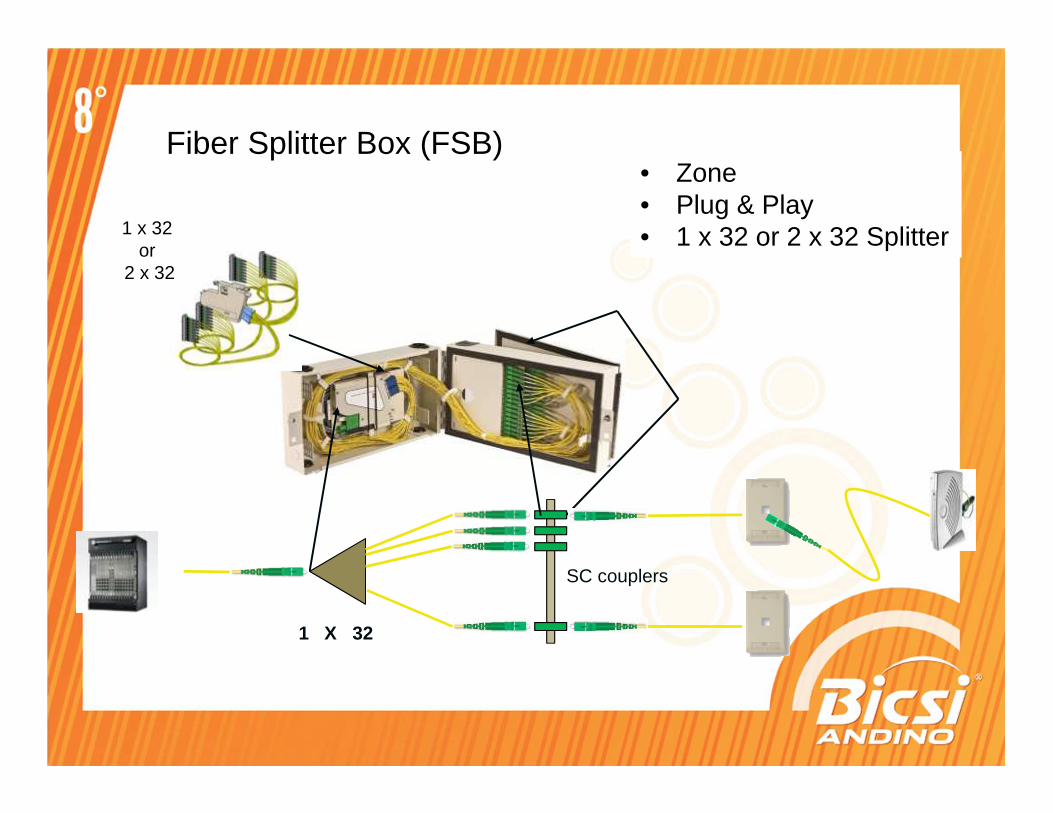
Fiber Splitter Box (FSB)• Zone • Plug & Play• 1 x 32 or 2 x 32 Splitter1 x 32
or 2 x 32
1 X 32
SC couplers
83
CONCLUSIONES:
• La Tecnología PON, es Madura en redes de acceso a nivel mundial,y es disruptiva en LANs
• Presenta ventajas importantes desde el punto de vista CAPEX/OPEX
• Presenta ventajas importantes para el medio ambiente por su bajo perfil energético
• Sencillo de diseñar por ser una red pasiva
• Simple de construir con sistemas de despliegue modulares ultra-rápidos

….ya es hora de un Nuevo Cambio!!!
“Locura: hacer lo mismo una y otra vez, en forma repetitiva, y esperar resultadosdiferentes”
Un pensamiento para el cierre…

¡GRACIAS!