Embed Size (px)
Citation preview
Panoptic Capacity PlanningPresented by
"Scotty, I need warp speed in 3 minutes or we're all dead!”
(William Shatner - Star Trek II ‘The Wrath of Khan’)
Setting the Scene• Our business’ demand bigger, faster, more agile and more
efficient services from their IT resources • Companies can no longer afford to just build new
datacentres, or expand existing ones, but most are now full or filling
• How are we going to install new services, or upgrade existing ones, with parallel running, without the lights going off?
• How can we migrate services and data when everything is full? Where will that “swing space” come from?
• How can I prove that Capacity Management is a worthwhile expenditure?
The problems we face• Who is responsible for Datacentre capacity?• Who has seen an explosion in Wintel Servers?• Who has managed to consolidate their Wintel estate?• Who has tried to use Virtualisation to resolve the Wintel
problem?• Who has filled up their Datacentre(s)?• Who knows the %age of Datacentre resources used by
Storage?• Who has found Virtualisation to be cost effective?• Who thinks they can plan an entire infrastructure?
What do we get asked to do?
• Take all of the business constants and variables to predict, plan and manage the IT infrastructure costs, report on GreenIT issues and manage the datacentre facilities.
• We have to show the effect on the network of adding more users• We have to cater for changes – Planned and unplanned• We need to predict when we will need more storage and of what
type• We have to help plan and control licence costs
What do you need to know?
• How many servers do I need and of what specification?• How much storage is required of what type?• How many network switches and ports?• How many SAN Fabric switches and ports?• How much site to site WAN capacity is required?• How much tape backup capacity do I need?• How much data replication capacity is required on the WAN?• How many racks do I need?• How much Power and Cooling capacity is required?• Will it all fit in my datacentre, or do I need a bigger one?

What inputs do we need to get you there?
• A baseline of the existing infrastructure and services• All new user rollout volumes and schedules• All new applications/services being developed and schedules• All tech. Refresh options• Understanding of new technologies being examined• Understanding of current expenditure/maintenance• Locations of all datacentres and comms between them• User site locations and comms between them• Details of each change being proposed to live service

Our methodology• We take a baseline of the existing infrastructure
and services or we can build from scratch if a greenfield project.
• We examine the original designs and the current usage
• We model storage (Fast, Slow, backup, tape, fabric etc.)
• We calculate the server farms including ancillary servers
• We calculate network bandwidth
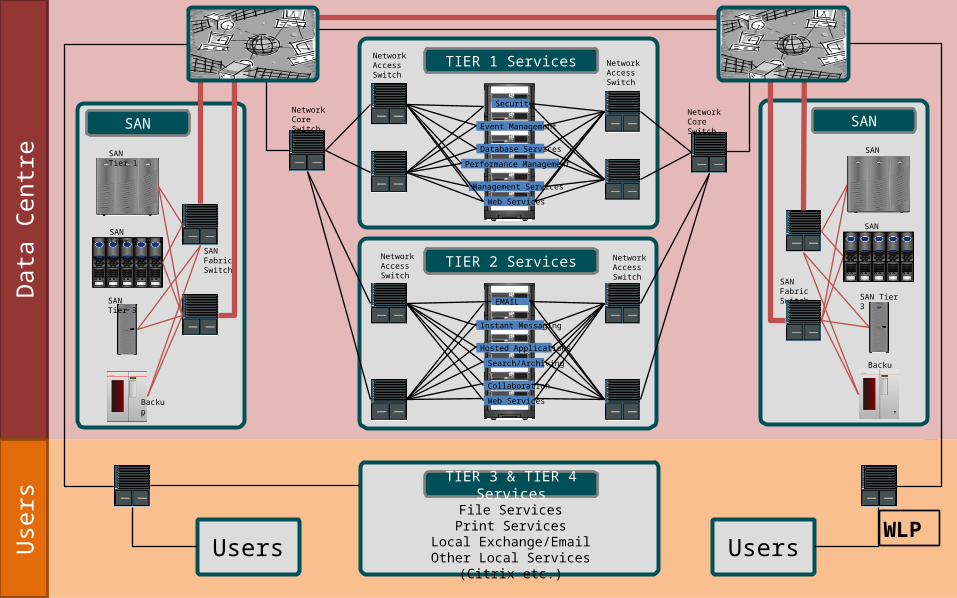
SANSecurity
Event Management
Database Services
Performance Management
Management Services
Web Services
Instant Messaging
Hosted Applications
Search/Archiving
Collaboration
Web Services
Network Core Switch
Network Access Switch
Network Access Switch
Network Core Switch
SAN Fabric Switch
SAN Fabric Switch
SAN Tier 1
SAN Tier 2
SAN Tier 3
SAN Tier 1
SAN Tier 2
SAN Tier 3
Backup
Backup
WLP
Network Access Switch
Network Access Switch
TIER 2 Services
TIER 1 Services
TIER 3 & TIER 4 Services
File ServicesPrint Services
Local Exchange/EmailOther Local Services (Citrix
etc.)
Dat
a Ce
ntre
Use
rs
Users Users
SAN
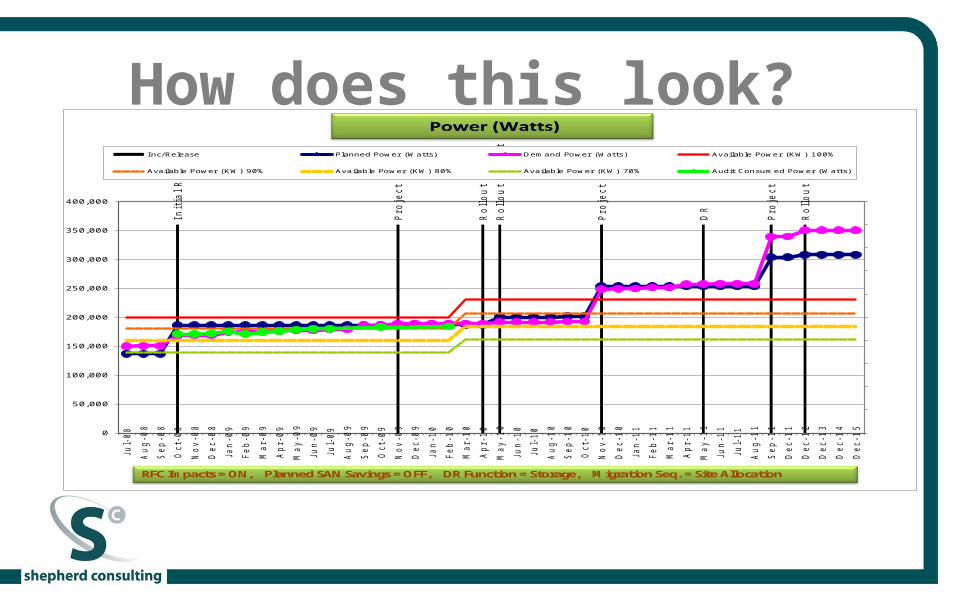
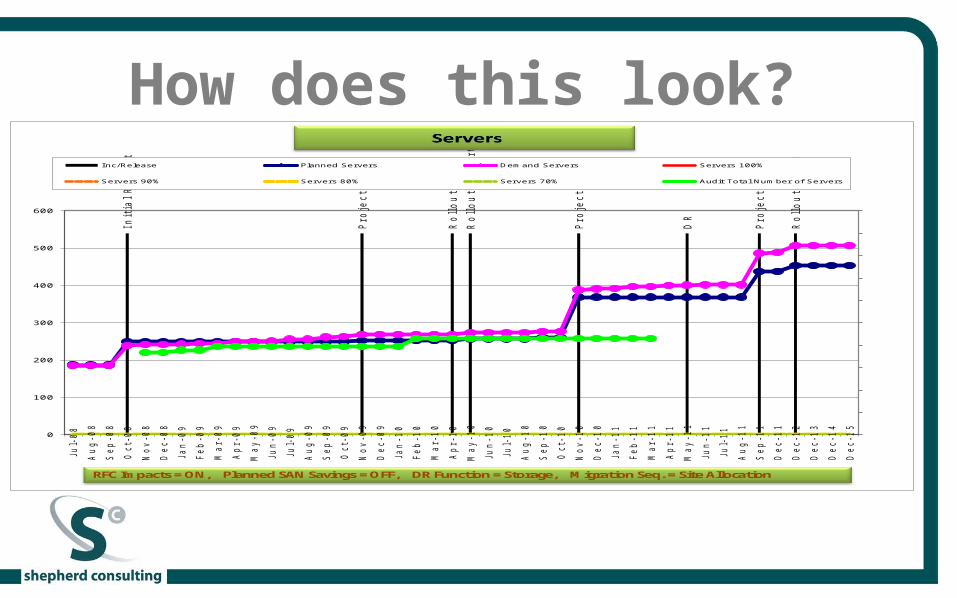
How does this look?Init
ial R
ollout
Proje
ct 1
Rollout 1
end
Rollout 2
Start
Proje
ct 2
DR
Proje
ct 3
Rollout 2
End
0
10000
20000
30000
40000
50000
60000
70000
80000
90000
100000
0
50,000
100,000
150,000
200,000
250,000
300,000
350,000
400,000
Ju
l-08
Aug-08
Sep-0
8
Oct-08
Nov-08
Dec-0
8
Jan
-09
Feb-09
Mar-09
Apr-09
May-09
Ju
n-09
Ju
l-09
Aug-09
Sep-0
9
Oct-09
Nov-09
Dec-0
9
Jan
-10
Feb-10
Mar-10
Apr-10
May-10
Ju
n-10
Ju
l-10
Aug-10
Sep-1
0
Oct-10
Nov-10
Dec-1
0
Jan
-11
Feb-11
Mar-11
Apr-11
May-11
Ju
n-11
Ju
l-11
Aug-11
Sep-1
1
Dec-1
1
Dec-1
2
Dec-1
3
Dec-1
4
Dec-1
5
Inc/Release Planned Power (Watts) Demand Power (Watts) Available Power (KW) 100%
Available Power (KW) 90% Available Power (KW) 80% Available Power (KW) 70% Audit Consumed Power (Watts)
RFC Impacts = ON, Planned SAN Savings = OFF, DR Function = Storage, Migration Seq. = Site Allocation
How does this look?Init
ial R
ollout
Project 1
Rollout 1
end
Rollout 2
S
tart
Project 2
DR
Project 3
Rollout 2
End
0
10000
20000
30000
40000
50000
60000
70000
80000
90000
100000
0
100
200
300
400
500
600
Ju
l-08
Aug-08
Sep-0
8
Oct-08
Nov-08
Dec-0
8
Jan
-09
Feb-09
Mar-09
Apr-09
May-09
Ju
n-09
Ju
l-09
Aug-09
Sep-0
9
Oct-09
Nov-09
Dec-0
9
Jan
-10
Feb-10
Mar-10
Apr-10
May-10
Ju
n-10
Ju
l-10
Aug-10
Sep-1
0
Oct-10
Nov-10
Dec-1
0
Jan
-11
Feb-11
Mar-11
Apr-11
May-11
Ju
n-11
Ju
l-11
Aug-11
Sep-1
1
Dec-1
1
Dec-1
2
Dec-1
3
Dec-1
4
Dec-1
5
Inc/Release Planned Servers Demand Servers Servers 100%
Servers 90% Servers 80% Servers 70% Audit Total Number of Servers
RFC Impacts = ON, Planned SAN Savings = OFF, DR Function = Storage, Migration Seq. = Site Allocation
How does this look?In
itia
l R
oll
ou
t
Pro
ject
1
Ro
llo
ut
1 e
nd
Ro
llo
ut
2 S
tart
Pro
ject
2
DR
Pro
ject
3
Ro
llo
ut
2 E
nd
0
20000
40000
60000
80000
100000
0
200
400
600
800
1,000
1,200
1,400
1,600
1,800
Jul-
08
Se
p-0
8
No
v-0
8
Jan
-09
Ma
r-0
9
Ma
y-0
9
Jul-
09
Se
p-0
9
No
v-0
9
Jan
-10
Ma
r-1
0
Ma
y-1
0
Jul-
10
Se
p-1
0
No
v-1
0
Jan
-11
Ma
r-1
1
Ma
y-1
1
Jul-
11
Se
p-1
1
No
v-1
1
Jan
-12
Ma
r-1
2
Ma
y-1
2
Jul-
12
Se
p-1
2
No
v-1
2
Jan
-13
Ma
r-1
3
Ma
y-1
3
Jul-
13
Se
p-1
3
No
v-1
3
Jan
-14
Ma
r-1
4
Ma
y-1
4
Jul-
14
Se
p-1
4
No
v-1
4
Jan
-15
Ma
r-1
5
Ma
y-1
5
Jul-
15
Se
p-1
5
No
v-1
5
Ne
two
rk P
ort
s R
eq
uir
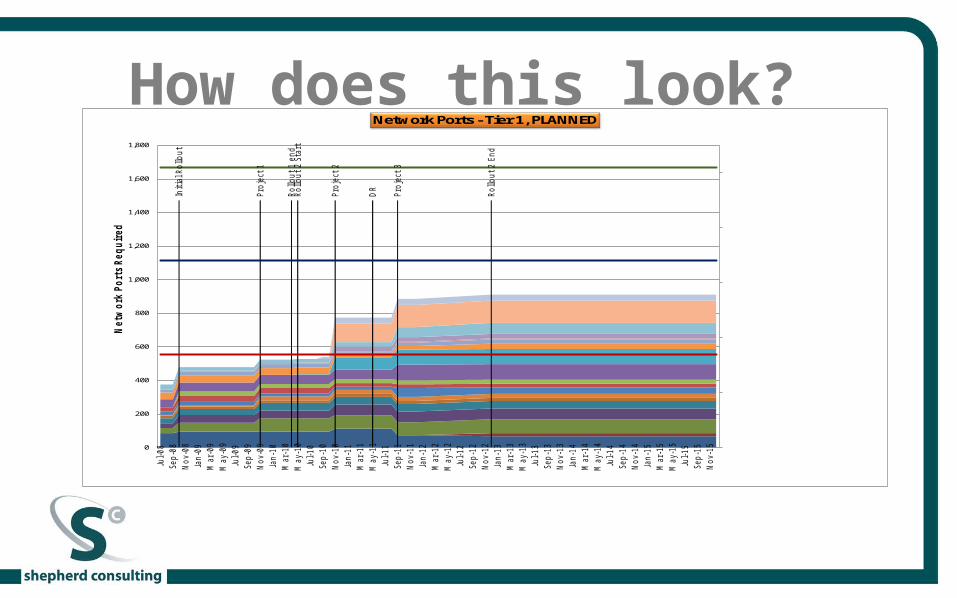
edNetwork Ports - Tier 1, PLANNED
How does this look?
0
20000
40000
60000
80000
100000
0
100,000
200,000
300,000
400,000
500,000
600,000
Jul-0
8
Sep-
08
Nov
-08
Jan-
09
Mar
-09
May
-09
Jul-0
9
Sep-
09
Nov
-09
Jan-
10
Mar
-10
May
-10
Jul-1
0
Sep-
10
Nov
-10
Jan-
11
Mar
-11
May
-11
Jul-1
1
Sep-
11
Nov
-11
Jan-
12
Mar
-12
May
-12
Jul-1
2
Sep-
12
Nov
-12
Jan-
13
Mar
-13
May
-13
Jul-1
3
Sep-
13
Nov
-13
Jan-
14
Mar
-14
May
-14
Jul-1
4
Sep-
14
Nov
-14
Jan-
15
Mar
-15
May
-15
Jul-1
5
Sep-
15
Nov
-15
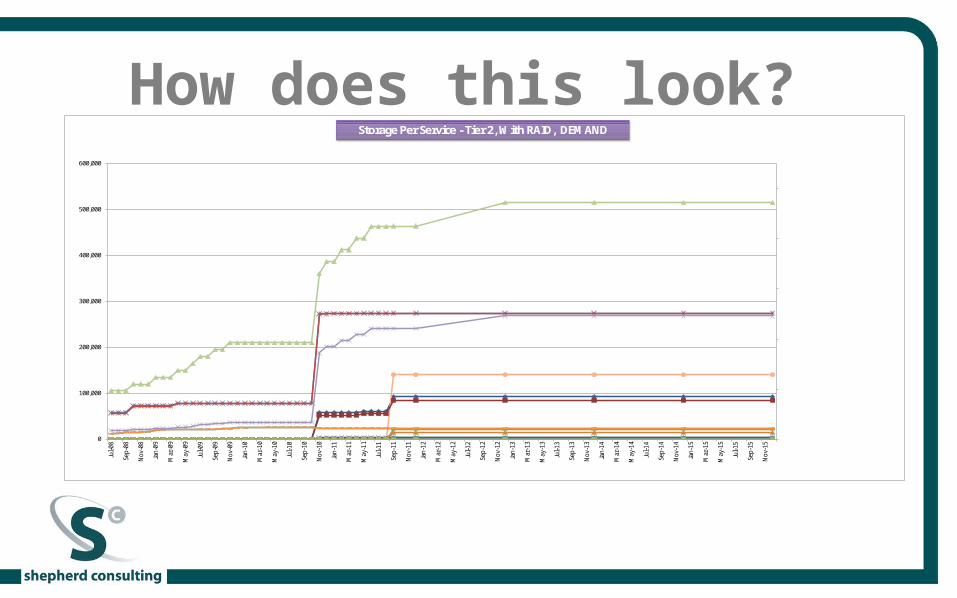
Storage Per Service - Tier 2, With RAID, DEMAND
What does this mean?• In basic terms, this will allow us to calculate how the datacentre
will look: How much power is required into the site How big the backup generators need to be What the switchgear should look like How big the UPS’ need to be How many in-room PDUs are required and how big How much cooling is required How much floorspace and how many racks are required
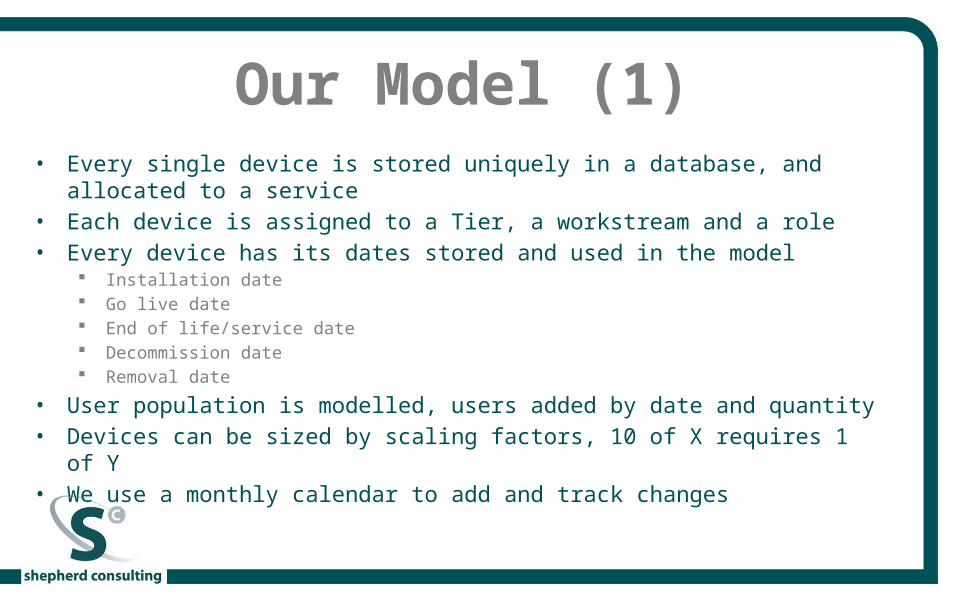
Our Model (1)• Every single device is stored uniquely in a database, and allocated
to a service• Each device is assigned to a Tier, a workstream and a role• Every device has its dates stored and used in the model
Installation date Go live date End of life/service date Decommission date Removal date
• User population is modelled, users added by date and quantity• Devices can be sized by scaling factors, 10 of X requires 1 of Y• We use a monthly calendar to add and track changes
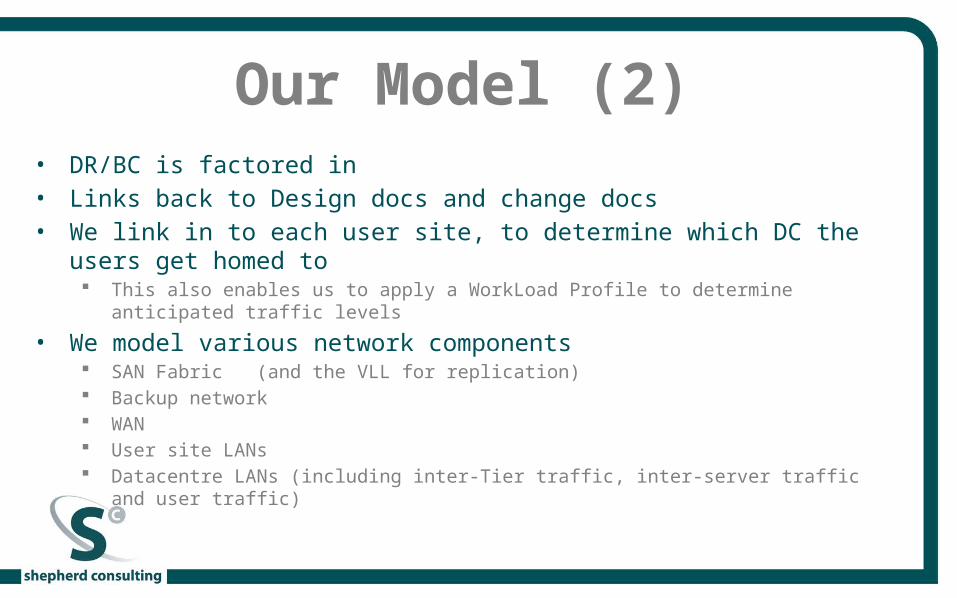
Our Model (2)• DR/BC is factored in• Links back to Design docs and change docs• We link in to each user site, to determine which DC the users get
homed to This also enables us to apply a WorkLoad Profile to determine anticipated traffic
levels
• We model various network components SAN Fabric (and the VLL for replication) Backup network WAN User site LANs Datacentre LANs (including inter-Tier traffic, inter-server traffic and user traffic)
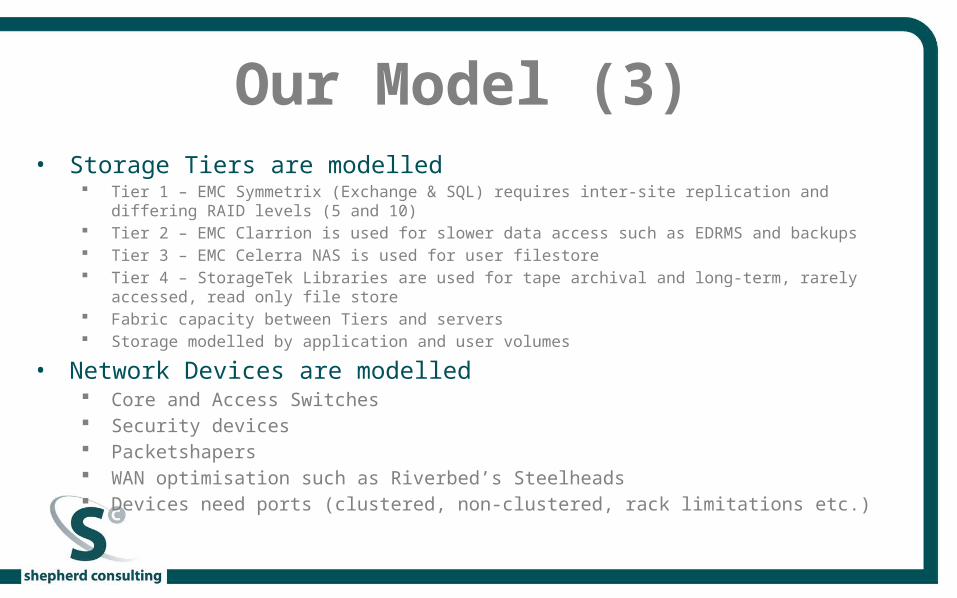
Our Model (3)• Storage Tiers are modelled
Tier 1 – EMC Symmetrix (Exchange & SQL) requires inter-site replication and differing RAID levels (5 and 10)
Tier 2 – EMC Clarrion is used for slower data access such as EDRMS and backups Tier 3 – EMC Celerra NAS is used for user filestore Tier 4 – StorageTek Libraries are used for tape archival and long-term, rarely accessed, read
only file store Fabric capacity between Tiers and servers Storage modelled by application and user volumes
• Network Devices are modelled Core and Access Switches Security devices Packetshapers WAN optimisation such as Riverbed’s Steelheads Devices need ports (clustered, non-clustered, rack limitations etc.)