Embed Size (px)
Citation preview
i
Pangani Basin:A Situation Analysis
IUCN Eastern Africa Programme
2003
ii
1
23 4
5
96
7 810
Published by:
Copyright: © 2003 International Union for Conservation of Nature and NaturalResources
This publication may be produced in whole or part and in any form foreducation or non-profit uses, without special permission from thecopyright holder, provided acknowledgement of the source is made.IUCN would appreciate receiving a copy of any publication which usesthis publication as a source.
No use of this publication may be made for resale or other commercialpurpose without the prior written permission of IUCN.
Citation: IUCN Eastern Africa Programme, 2003. The Pangani River Basin:A Situation Analysis, xvi + 104pp.
ISBN: 2-8317-0760-9
Design and layout: Gordon O. Arara
Printed by: ScanHouse Press Ltd.
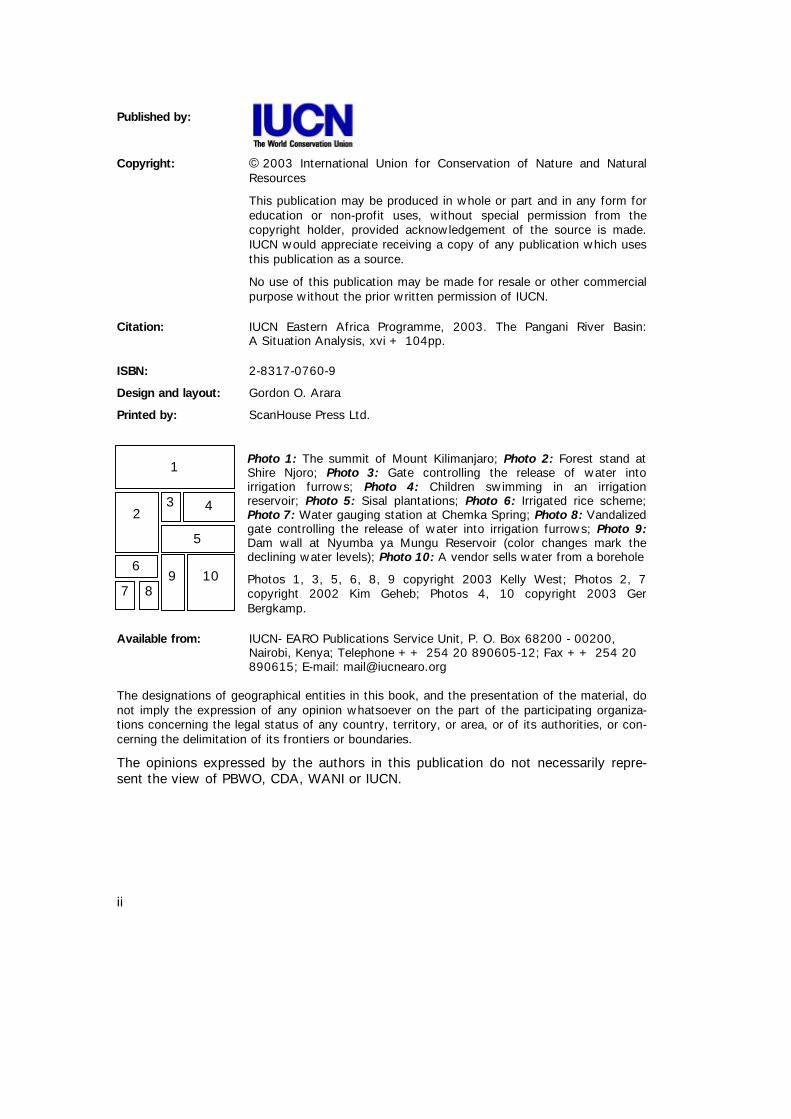
Photo 1: The summit of Mount Kilimanjaro; Photo 2: Forest stand atShire Njoro; Photo 3: Gate controlling the release of water intoirrigation furrows; Photo 4: Children swimming in an irrigationreservoir; Photo 5: Sisal plantations; Photo 6: Irrigated rice scheme;Photo 7: Water gauging station at Chemka Spring; Photo 8: Vandalizedgate controlling the release of water into irrigation furrows; Photo 9:Dam wall at Nyumba ya Mungu Reservoir (color changes mark thedeclining water levels); Photo 10: A vendor sells water from a borehole
Photos 1, 3, 5, 6, 8, 9 copyright 2003 Kelly West; Photos 2, 7copyright 2002 Kim Geheb; Photos 4, 10 copyright 2003 GerBergkamp.
Available from: IUCN- EARO Publications Service Unit, P. O. Box 68200 - 00200,Nairobi, Kenya; Telephone ++ 254 20 890605-12; Fax ++ 254 20890615; E-mail: [email protected]
The designations of geographical entities in this book, and the presentation of the material, donot imply the expression of any opinion whatsoever on the part of the participating organiza-tions concerning the legal status of any country, territory, or area, or of its authorities, or con-cerning the delimitation of its frontiers or boundaries.
The opinions expressed by the authors in this publication do not necessarily repre-sent the view of PBWO, CDA, WANI or IUCN.
iii
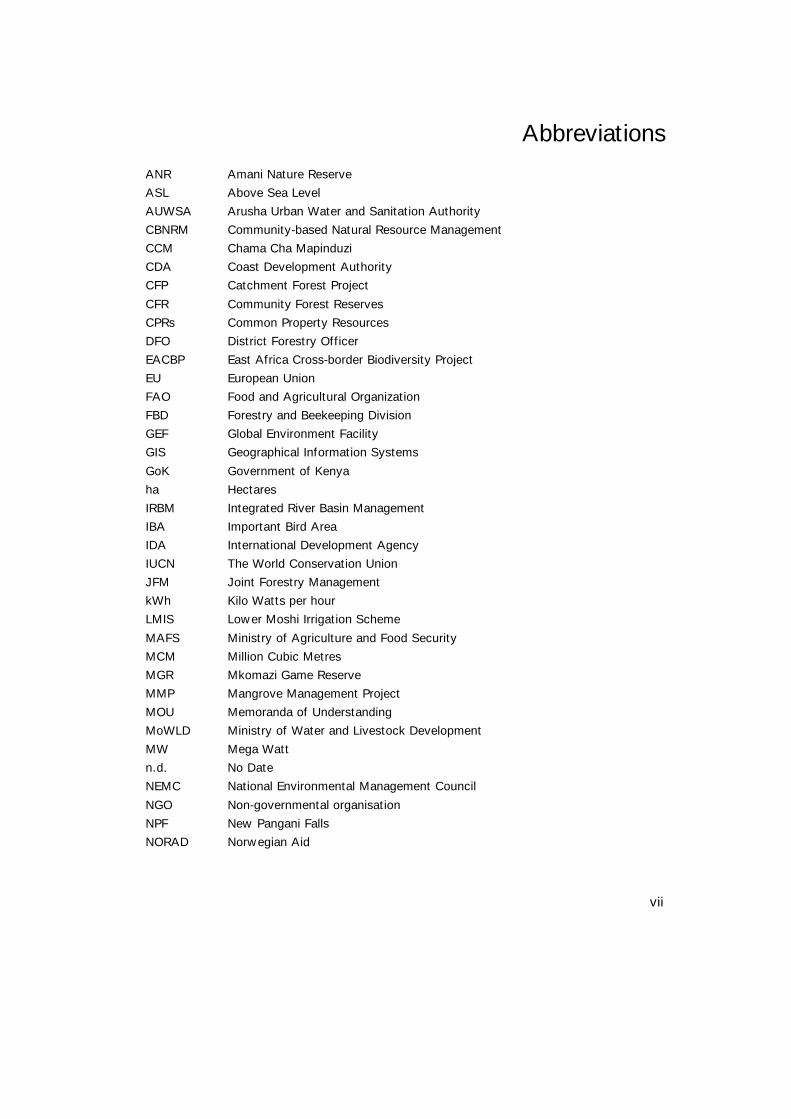
ContentsAbbreviations ...........................................................................................................vii
Preface ................................................................................................................... ix
Executive summary .................................................................................................... x
A Introduction to the Pangani River Basin Situation Analysis ..........................................1A.1 An overview of the Pangani River Basin.............................................................1A.2 Integrated River Basin Management (IRBM)........................................................6A.3 The Water and Nature Initiative (WANI).............................................................7A.4 Situation Analysis: objectives and outputs .........................................................9A.5 Data sources ................................................................................................9A.6 Situation Analysis Structure ..........................................................................10
B The Pangani River Basin’s natural resources ...........................................................11B.1 Introduction ...............................................................................................11B.2 Basin forests ..............................................................................................11B.3 Water and wetlands.....................................................................................19B.4 Protected areas...........................................................................................23B.5 Biodiversity and conservation ........................................................................25B.6 Fisheries....................................................................................................28B.7 Soils .........................................................................................................28B.8 Summary of points ......................................................................................28
C The socio-economy of the Pangani River Basin .......................................................30C.1 Overview...................................................................................................30C.2 Industrial interests.......................................................................................32C.3 Farming interests ........................................................................................32C.4 Pastoralist interests .....................................................................................37C.5 Urban interests ...........................................................................................38C.6 Interventions by NGOs and international organisations in the PRB ........................38C.7 Conflict .....................................................................................................41C.8 Summary of points ......................................................................................54
D Natural Resource Management in the Pangani River Basin .........................................56D.1 Introduction ...............................................................................................56D.2 Government management, Legislation and policy ..............................................56D.3 Community-level administration .....................................................................63D.4 Transboundary basin management .................................................................68D.5 Data collection and monitoring.......................................................................68D.6 Summary of points ......................................................................................69
E Pangani River Basin problems and issues................................................................71E.1 Introduction ...............................................................................................71E.2 Problems and issues of the PRB .....................................................................71E.3 Priority areas for Action................................................................................77
iv
F Conclusions ..................................................................................................... 79F.1 Synthesis of findings................................................................................... 79F.2 The Pangani River Basin and the WANI criteria ................................................. 83
G References....................................................................................................... 85
H Appendix 1: Smaller basins included in theadministrative Pangani Basin............................................................................... 94H.1 Introduction............................................................................................... 94H.2 The Umba River Catchment: ......................................................................... 94H.3 The Zigi River Catchment ............................................................................. 99H.4 The Msangazi River Catchment ..................................................................... 97H.5 The Coastal River Catchment (Mkulumuzi)......................................................103
List of TablesTable 1: Tanzanian forest types, uses and legal status ................................................... 11Table 2: Eastern Arc Mountain forest cover loss in the Pangani River Basin ........................ 17Table 3: Estimated water demand in 1995 and anticipated water demand in 2015 .............. 22Table 4: Tanzanian and Kenyan socio-economic basics 2001 .......................................... 31Table 5: Livestock population in selected areas of the Pangani River Basin (2002) ............... 37Table 6: Water rights (WR) in the Pangani River Basin (Tanzania), May, 2003..................... 58Table 7: Forest area under Joint Forest Management by region ........................................ 66
List of FiguresFigure 1: The Pangani River Basin, spanning Tanzania and Kenya ....................................... 2Figure 2: The Pangani River Basin................................................................................. 3Figure 3: Forestry Administration in Tanzania................................................................ 62Figure 4: The Administrative Pangani River Basin........................................................... 95
List of PlatesPlate 1: The Pangani River Basin map.......................................................................... 43Plate 2: The Administrative Pangani River Basin map...................................................... 44Plate 3: Kilimanjaro's famous snowcap in 1993 and 2000 .............................................. 45Plate 4: The River Karanga at Moshi............................................................................ 46Plate 5: Mount Kilimanjaro ........................................................................................ 46Plate 6: An Irrigation furrow in Moshi District ............................................................... 47Plate 7: The capped spring at Shiri - Njoro.................................................................... 48Plate 8: Forested slopes on Mt. Meru .......................................................................... 48
List of BoxesBox 1: Water Demand Management ............................................................................ 7Box 2: Pangani River Basin forest basics .................................................................... 12Box 3: The Taita Hills ............................................................................................. 14Box 4: Threats to the PRB's forests........................................................................... 18Box 5: Pangani River Basin water and wetland basics ................................................... 19Box 6: Threats to the PRB's water and wetland resources............................................. 20Box 7: Pangani River Basin Protected Area threats ....................................................... 24Box 8: Biodiversity hotspots .................................................................................... 25Box 9: Category 1 Globally threatened bird species of the Usambara Mountains ................ 26Box 10: Traditional furrow design flaws....................................................................... 34

v
Box 11: Sodicity and salinity......................................................................................36Box 12: Kenyan Water Administration .........................................................................61Box 13: The development of community-based management in
Duru - Haitemba Forest, Arusha Region ............................................................64Box 14: An example of a Water User's Association........................................................67

vi
vii
Abbreviations
ANR Amani Nature Reserve
ASL Above Sea Level
AUWSA Arusha Urban Water and Sanitation Authority
CBNRM Community-based Natural Resource Management
CCM Chama Cha Mapinduzi
CDA Coast Development Authority
CFP Catchment Forest Project
CFR Community Forest Reserves
CPRs Common Property Resources
DFO District Forestry Officer
EACBP East Africa Cross-border Biodiversity Project
EU European Union
FAO Food and Agricultural Organization
FBD Forestry and Beekeeping Division
GEF Global Environment Facility
GIS Geographical Information Systems
GoK Government of Kenya
ha Hectares
IRBM Integrated River Basin Management
IBA Important Bird Area
IDA International Development Agency
IUCN The World Conservation Union
JFM Joint Forestry Management
kWh Kilo Watts per hour
LMIS Lower Moshi Irrigation Scheme
MAFS Ministry of Agriculture and Food Security
MCM Million Cubic Metres
MGR Mkomazi Game Reserve
MMP Mangrove Management Project
MOU Memoranda of Understanding
MoWLD Ministry of Water and Livestock Development
MW Mega Watt
n.d. No Date
NEMC National Environmental Management Council
NGO Non-governmental organisation
NPF New Pangani Falls
NORAD Norwegian Aid
viii
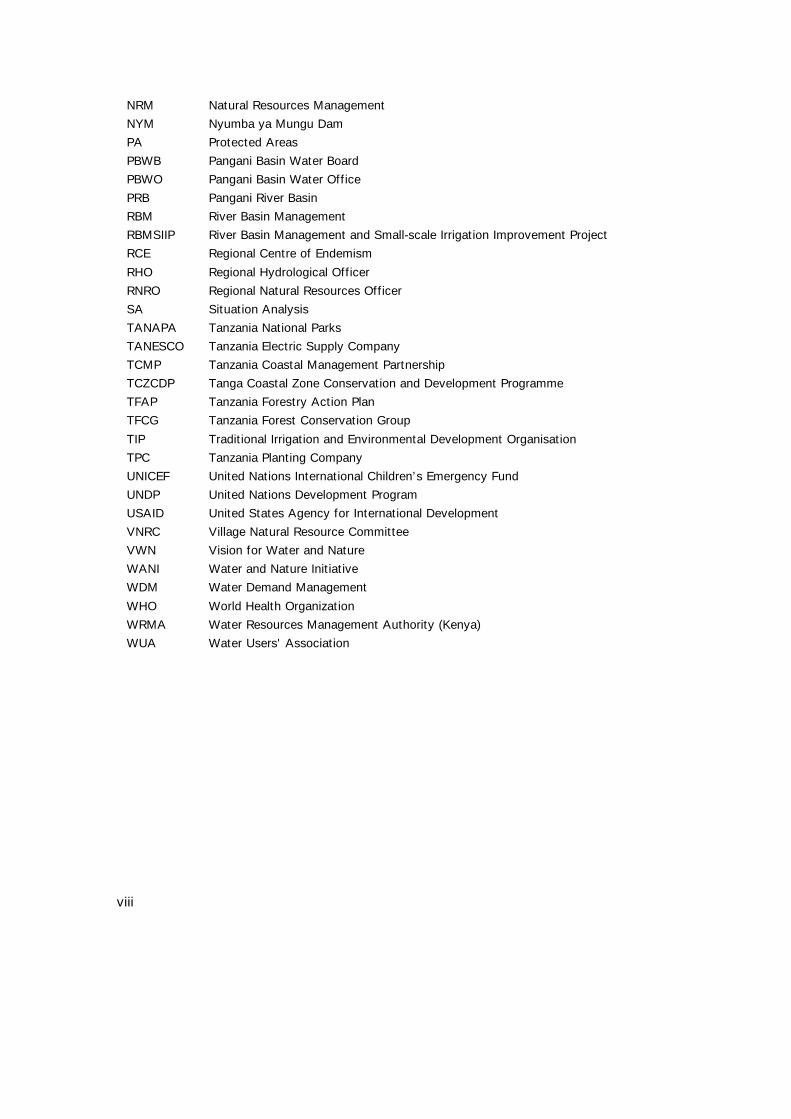
NRM Natural Resources Management
NYM Nyumba ya Mungu Dam
PA Protected Areas
PBWB Pangani Basin Water Board
PBWO Pangani Basin Water Office
PRB Pangani River Basin
RBM River Basin Management
RBMSIIP River Basin Management and Small-scale Irrigation Improvement Project
RCE Regional Centre of Endemism
RHO Regional Hydrological Officer
RNRO Regional Natural Resources Officer
SA Situation Analysis
TANAPA Tanzania National Parks
TANESCO Tanzania Electric Supply Company
TCMP Tanzania Coastal Management Partnership
TCZCDP Tanga Coastal Zone Conservation and Development Programme
TFAP Tanzania Forestry Action Plan
TFCG Tanzania Forest Conservation Group
TIP Traditional Irrigation and Environmental Development Organisation
TPC Tanzania Planting Company
UNICEF United Nations International Children’s Emergency Fund
UNDP United Nations Development Program
USAID United States Agency for International Development
VNRC Village Natural Resource Committee
VWN Vision for Water and Nature
WANI Water and Nature Initiative
WDM Water Demand Management
WHO World Health Organization
WRMA Water Resources Management Authority (Kenya)
WUA Water Users' Association
ix
PrefaceThe IUCN Water and Nature Initiative (WANI) is a collaborative effort to address theworld’s water crisis. WANI builds on the Water and Nature Vision and Frameworkfor Action and is a response to the call for action expressed before, during and afterthe 2nd World Water Forum in The Hague (March 2000).
The goal of WANI is to mainstream the ecosystem approach into river basin policies,planning and management. In selected demonstration site basins around the world,WANI strives to: demonstrate ecosystem management, empower people to partici-pate in sustainable water management, support wise governance of water resourcesand wetlands, develop and apply economic tools and incentives, improve knowledgeto support decision making and learn lessons and raise awareness about wise wateruse.
Following consultations with stakeholders in the basin and culminating in a workshophosted by Pangani Basin Water Office (PBWO) and IUCN – The World ConservationUnion in Moshi, Tanzania from 8-10 May 2002, the Pangani River Basin in Tanzaniaand Kenya was selected as a WANI demonstration site.
As part of its project development activities for the Pangani River Basin, IUCN com-missioned a consultant, Dr. Kim Geheb, to develop a Situation Analysis of this basin.The fieldwork for the Situation Analysis was carried out in November 2002, and in-volved interviews with a wide variety of stakeholders within the basin. Additionalsources of information included published sources and the proceedings of the above-mentioned workshop, entitled, 'The Pangani River Basin: Options for Integrated Man-agement.'
The objectives of the Situation Analysis are as follows:
• To identify the resources that occupy the Pangani River Basin (PRB) and theprocesses and events that affect them.
• To identify a series of broad action areas wherein interventions may feasiblybe delivered.
• To identify other organisations, interests or institutions with which IUCN maydevelop partnerships as it seeks to develop the WANI initiative in the PRB.
A first draft of the Situation Analysis was completed in late 2002 and distributed tostakeholders for review and comment. At a workshop hosted by PBWO and IUCN inMoshi in March, 2003, stakeholders gathered to comment on the Situation Analysisand suggest amendments. Additional comments and contributions have subsequentlybeen received from both the PBWO and the Coastal Development Authority (CDA -Kenya) at a meeting held in Nairobi in May 2003 between IUCN, PBWO and CDA.
Felix Peter, Helen Lema, Fatuma Omar and Renalda Mukaja of the River Basin Man-agement Project in the Ministry of Water & Livestock Development of Tanzaniakindly provided the maps and area estimates in this document.
x
Executive summaryThe Pangani River Basin (PRB) covers an area of about 43,650 km2, mostly in Tanza-nia with approximately 5% in Kenya. In Tanzania, the Basin is spread over four ad-ministrative regions: Kilimanjaro, Arusha, Manyara and Tanga. Most of the Kenyanportion of the Basin falls within the Taita – Taveta District. The Pangani River hastwo main tributaries, the Kikuletwa and the Ruvu, which join at Nyumba ya Mungu, areservoir of some 140 km2. The effluent of the reservoir is known as the PanganiRiver, which flows for 432 km before emptying into the Indian Ocean.
The Basin contains a wide array of resources. For its 3.7 million Tanzanian inhabi-tants, water and arable land are arguably the most important. The Basin’s highlandsreceive substantially more rainfall than its lowlands. Nevertheless, highland farmingintensities and the competition for land have meant that farmers have had to startirrigating their farms in order to maximise outputs. Those unable to obtain highlandland have been forced to seek farmland in lowland areas, where rainfall is substan-tially less, and where irrigation is of paramount importance. This difficulty has beenexacerbated by general rainfall declines within the Basin.
The competition for land has ensured that other land uses within the Basin, such asforestry, have come into direct competition with agriculture. In some cases, forestsare protected by their national park status, such as that in the Mt. Kilimanjaro Na-tional Park, which falls under the purview of Tanzania National Parks (TANAPA).Other forests are ostensibly protected by the Kenyan and Tanzanian forestry depart-ments. Through a combination of low staffing levels and difficult financial circum-stances, however, these often do not enjoy the same standards of protection asthose lying within TANAPA territory. The pressure on the PRB’s coastal and EasternArc forests is of particular concern, given the high levels of biotic endemism withinthem.
Other resources within the Basin are its mineral deposits, which include tanzanite, tinand gemstones, its fisheries, wetlands and its numerous tourist attractions.
A host of different actors exploit these resources, and this Situation Analysis groupsthem as follows:
• Industrial interests, which include the Basin’s important hydropower contributionsto the national grid, mining and agro-industries such as sugar refineries and sisalprocessing plants.
• Farming interests: much traditional farming in the Basin is supported by irrigation.Traditional irrigation furrows are highly inefficient, and may loose as much as85% of water between the point of abstraction and its destination. There arealso several large-scale farming interests in the Basin, including sugar cane, sisaland flowers. Between 29,000 and 40,000 ha of the Tanzanian part of the PRBare irrigated, consuming between 400 and 480 million cubic metres of water an-nually.
xi
• Pastoralist interests: present livestock population levels in the Basin are un-known. It is thought that, by 2015, pastoralism will consume 36,400 m3 of wa-ter a day.
• Urban interests: the Basin contains two major Tanzanian urban conurbations:Moshi and Arusha. As they grow, their demand for water has also escalated ontwo fronts: for industrial and domestic use, and as a means of disposing ofwaste. It is expected that, by 2015, urban water demand in the Basin will reach163,600 m3/day.
There are, therefore, a diversity of interests in the Basin, and these are able to wieldvarious degrees of power as they seek to lay claim to its resources. These differ-ences in power underlie the many conflicts that characterise natural resource exploi-tation within the Basin. This Situation Analysis classifies these different types of con-flict as follows:
• Conflicts of scale: the relationship between water users of different sizes andpower in the PRB is often described in dichotomous terms. Hence, large-scaleplantations using hundreds of litres of water a second and employing highly effi-cient irrigation systems, differ starkly from small-scale users using far less waterand employing very inefficient irrigation systems. The extremes involved in theseregards are fertile grounds for conflict. This Situation Analysis provides empiricalexamples of such scale conflicts between urban and rural users, and betweenlarge and small-scale mining interests.
• Conflicts of tenure: this document refers to tenure as the right to manage a re-source. Throughout Tanzania, Community-based Natural Resources Management(CBNRM) has been seen as an attractive way of increasing the efficiency of thenation’s Natural Resources Management (NRM) systems. This trend has beenless marked in Kenya. The contention with these systems relates to the mannerof their application and design. Here, communities may not be involved in the de-sign of the management strategy, its implementation or even its justice systems.This may ensure that these institutions do not fulfil the management tasks thatthey were created to perform. Examples are provided of conflicts between com-munity-level and government forestry management initiatives; between resourceusers of different kinds; and conflict over different management perspectives.
• Conflicts of location: users located in upstream areas are placed more favourablyvis-à-vis water abstraction than are downstream users. At its most basic, theseproblems can be seen along irrigation furrows where users close to the watersource are able to grow crops with high water demands (such as irrigated rice)and those located at the end of the furrow obliged to plant low water demandcrops. The serious problems faced by downstream hydropower plants are anotherexample. Examples of such conflicts are those between upstream and down-stream water users, and conflicts between hydropower interests and small-scaleirrigators.
xii
Conflict over resources is just one manifestation of the very high levels of competi-tion that exist between the Basin’s resource users. The impact of a growing popula-tion, the Basin’s variable resource distribution and the finite nature of its resourcesmean that exploitation patterns are often deleterious. Examples of resource damageare as follows:
• The Basin’s forests are threatened by logging, encroachment along their periph-eries, demands for land, charcoal manufacture and fuelwood collection. Esti-mates suggest that up to 77% of the Eastern Arc Mountains’ forest has beenlost over the past 2,000 years due to human activities, while 41 km2 of Kiliman-jaro’s natural forest was lost between 1952 and 1982.
• The Basin’s water supplies are threatened by extremely high demands that haveensured that its water resources are considered ‘stressed’. The main sources ofdemand are inefficient furrow-based irrigation systems. The Basin’s swamps arethreatened by the regulation of water by damming.
• The Basin’s Protected Areas are threatened by poaching, and by threats similar tothose faced by forest resources.
• Most of the Basin’s biodiversity has been gained as a result of its unique array offorest habitat types. Threats to biodiversity, as a result, arise because of threatsto habitat.
• The fisheries of the PRB are threatened by excessive fishing pressure, and weedgrowth occasioned by high nutrient loads. Indeed, 24 tonnes of soil per hectareof catchment flows into the Nyumba ya Mungu (NYM) reservoir every year. In1970, 28,509 tonnes of fish were landed from the NYM reservoir. Catches havedeclined substantially since then, and in 1983, 2,430 tonnes of fish were landed.
A large number of governmental and non-governmental organisations exist within theBasin seeking to curb these trends and trying to improve the livelihoods of resourceusers. In recent years, perhaps the most important large-scale initiatives in the Basinare those of the World Bank-funded River Basin Management and Small-scale Irriga-tion Improvement Project (RBMSIIP), and the UNDP-GEF East Africa Cross-borderBiodiversity Project (EACBP). The former project has been particularly important instrengthening the Pangani Basin Water Office (PBWO), as well as improving water-monitoring capabilities within the Basin.
NGO initiatives in the Basin include those concerned with the integrated managementof Tanzania’s coastline and its mangrove forests, and, in the north of the Basin,those concerned with the improvement of traditional irrigation practises, and facili-tating lines of communication between local level resource users and the Basin’sformal administration. Additional initiatives have concentrated on the conservation ofthe Basin’s forests and wildlife resources.
xiii
The formal administration of the Basin is complex. In Tanzania, typically two sourcesof management occur for any one resource: that provided by central government,and that provided by regional government. At the same time, the Pangani Basin Wa-ter Office (PBWO) has been introduced to the Basin with a view to providing a Basin-wide approach to the management of its water resources. This means that, in manyinstances, the lines of authority between the management of a resource and man-agement providers may be ambiguous and/or confused. This type of confusion isreplicated at the local level. As mentioned earlier, Tanzania has turned increasingly toCommunity-based Natural Resources Management (CBNRM) as a way of improvingits NRM. However, this has meant that committees or other community-level organi-sations have been created to deal with specific resources, and not natural resourcesgenerally. Hence, there are Village Natural Resource Committees (VNRCs), Water Us-ers’ Associations (WUAs), Village Governments and others, complicating the deliveryof management and augmenting transaction costs considerably.
In Kenya, water resources have recently been placed under a Water Resources Man-agement Authority (WRMA), which uses the river basin as its focus, and which ischarged with the responsibility of integrating the management of such basins, andincluding stakeholder groups in the management structure. This is a relatively newinitiative, and is likely to facing teething problems with respect to includingstakeholders in the management structure, and difficulty integrating the various sec-tors of basins’ administration.
Such a ‘sectoral’ approach to management is, therefore, present on both sides of theborder, and refers to situations where departments are involved with the manage-ment of forests, water, irrigation, wildlife and other resources. This may ensure thatmanagement objectives and approaches run parallel to one another, and complicatesthe possibilities for integrated approaches to the Basin’s management. The PBWOhas, however, sought to at least ensure that the various departments communicatewith one another by sending representatives to the Pangani Basin Water Board(PBWB).
This Situation Analysis summarises the above problems and difficulties by identifyinga series of issues that, it suggests, warrant significant managerial attention. Argua-bly, environmental problems are social ones. For convenience, and for the sake ofhighlighting the state of the PRB environment, these are divided between environ-mental and social issues as follows:
Environmental issues:
• Deforestation – causing water retention problems, increases runoff and hencepromoting erosion, flooding and increased silt loads.
• Demands for land – many forests are located in prime agricultural areas that re-ceive high levels of rainfall. This is a significant threat to the Basin’s forest re-serves.
xiv
• Farming practises: many of the basin’s farming techniques were developed at atime when populations were far smaller, and access to resources much better. Aspopulations have increased, however, these same techniques may seriouslythreaten the Basin’s environmental integrity. The systems are not water efficient,and repeated irrigation may prompt salinity and/or sodicity.
• Livestock increases: these are unknown, but are suspected to be considerable.With farming on the increase in the Basin’s lowland areas, pastoralist land hasbeen taken out of production, exacerbating the potential for over-stocking.
• Development: unmanaged development in the Basin is a concern given the poten-tial for pollution and inadequate waste disposal that it represents.
• Water quality: this is threatened by pollution, but also damaged by localisedgeological characteristics that may give rise to fluoride contamination.
• Over-fishing: fishing pressures on the NYM appear to be excessive. Fishing isalso threatened by the growth of waterweed on rivers and lakes, itself promptedby the increased nutrient loads of the Basin.
• Mining: uncontrolled mining activities in the Basin threaten its landscape and thefuture productivity of its land. It also has serious pollution potential. Sand miningalong rivers undermines the stability of riverbanks.
• Lack of environmental awareness amongst the Basin’s inhabitants.
Socio-economic and political issues
• Poverty: because secondary and tertiary forms of employment are typically un-available in the Basin’s commercial and industrial sectors, many of its inhabitantsseek livelihoods in primary activities such as agriculture, the harvest of forestproducts, fishing etc.
• Conflict: because so many are involved in primary activities, the potential forconflict arises between small-scale users, and between small and large-scale us-ers.
• Political expediency: politicians, eager to obtain votes from their constituentsmay sometimes encourage the wholesale exploitation of vulnerable resources.
Issues of management and administration
• Inadequate policies: policies that appear perfectly reasonable and carefully devel-oped may be rendered impotent because their implementation cannot be moni-tored, and offenders are not sanctioned.
• Funding problems: these arise at virtually every point of the Basin’s administra-tion and range from difficulties in providing adequate remuneration to the pur-chase of technology to assist with Basin monitoring.
xv
• Lack of management integration: the divisions between regional and nationallevel administration coupled with ‘sectoral’ management approaches, ensuresthat much of the Natural Resources Management (NRM) in the Basin is not inte-grated, with one sector or level of administration pursuing objectives and man-agement styles different to the other levels or sectors of the Basin. This difficultyalso occurs across international frontiers: no mechanism exists for Kenya andTanzania to co-ordinate their management of the Pangani River Basin.
• Problems with community administration: this relates, firstly, to the poor contri-butions communities make to the design, implementation and enforcement of theNRM systems that they are encumbered with. Second, many of these ap-proaches, imposed from outside the community, seek the establishment of NRMcommittees of various types, resulting in a confusing plethora of local-level or-ganisations and prompting the sectoral difficulties described above, conflicts ofauthority and limited managerial success.
On the basis of the issues defined above, the Situation Analysis identifies a series ofpriority areas for action. These are:
The development of integrated management strategies for the PRB along with atten-dant forums There appears to be little doubt that the Pangani River Basin (PRB) ur-gently needs integrated management strategies that can cope with its diverse andcomplicated issues. Possible options that could be considered include the develop-ment of water demand strategies, assessing downstream water requirements forpeople and the environment, water incremental approaches to management, stream-lining management and increasing the role played by communities in the design andimplementation of integrated NRM.
The development of effective strategies to facilitate dialogue amongst and betweenresource users and managers of different types and involved in different sectors witha view to improving awareness at all levels of management Mechanisms are neededto ensure that dialogue opportunities between and amongst stakeholders and manag-ers are maximised, so as to ensure that two-way exchanges of information may oc-cur, dissemination improved and the knowledge of how stakeholders all play a part inthe well-being of the Basin delivered. It is necessary that awareness is created aboutall aspects of the condition and management of the Basin and its stakeholders at alllevels of management and its co-ordination. Additional components of this priorityarea are the development of forums capable of assuming this task, as well as servingas a mechanism to remedy conflict, and to bridge gaps between different levels ofadministration.
The identification and development of an adequate data collection and monitoringsystem. This action area is not restricted to the development of data collection sys-tems for hydrological data. A satellite and GIS assessment of land use, exploitationrates and geographical change is a pre-requisite for the development of land-useplanning and monitoring. The development of methodologies to assess and gauge theunderlying social and economic causes of environmental degradation and resource

xvi
over-exploitation also needs to be identified. Such systems should also be capable ofidentifying water demands within the Basin. The data and monitoring systems rec-ommended must match local funding and maintenance capabilities.
1
A Introduction to the Pangani River BasinSituation Analysis
A.1 An overview of the Pangani River Basin
The Water Utilization (Control and Regulation) Act No. 42 of Tanzania was amendedin 1981 (Amendment No. 10) to devolve the responsibility for water management tothe basin level and nine basins, including the Pangani Basin, were gazetted. ThePangani Basin covers an area of about 58,800 km2,1 administratively and includes themain Pangani River Basin and the smaller river basins of Umba, Msangazi, Zigi2, andCoastal Rivers, including Mukulumuzi. This Situation Analysis concentrates on themain Pangani River Basin. However, details of the smaller river basins governed byPangani Basin Water Office are provided in Annex 1.
The Pangani River Basin covers an area of 43,650 km2,1, out of which 3,914 km2,1
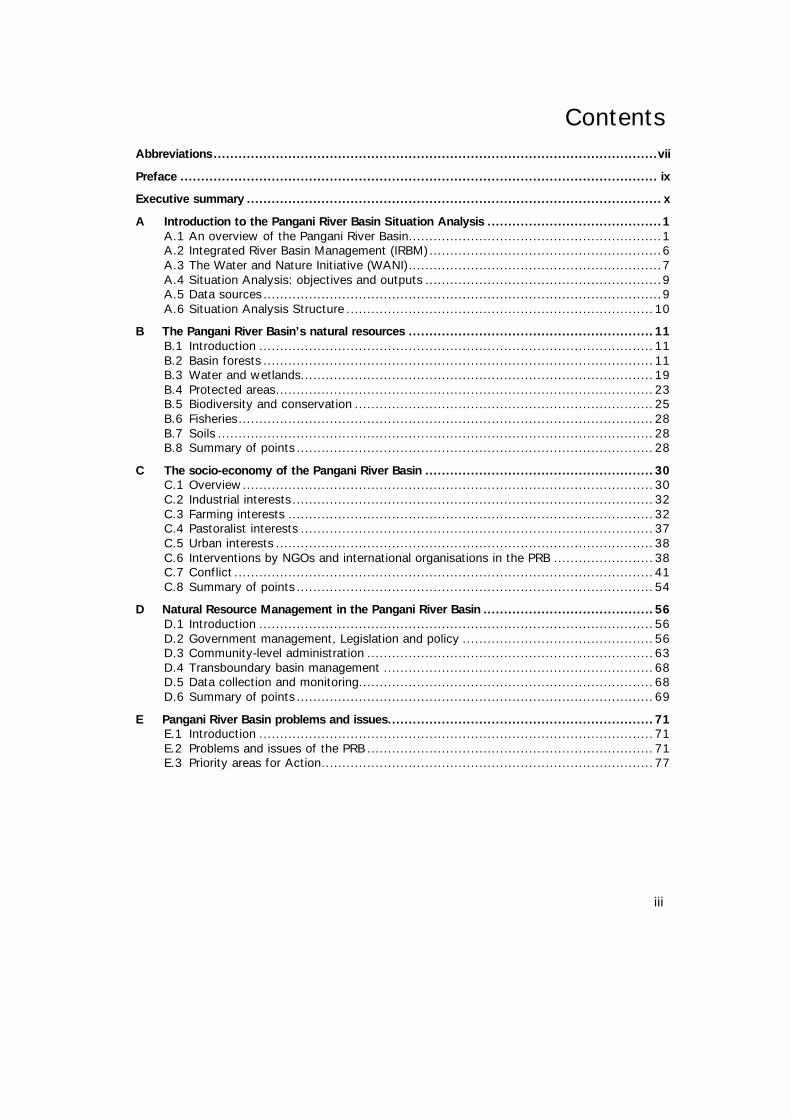
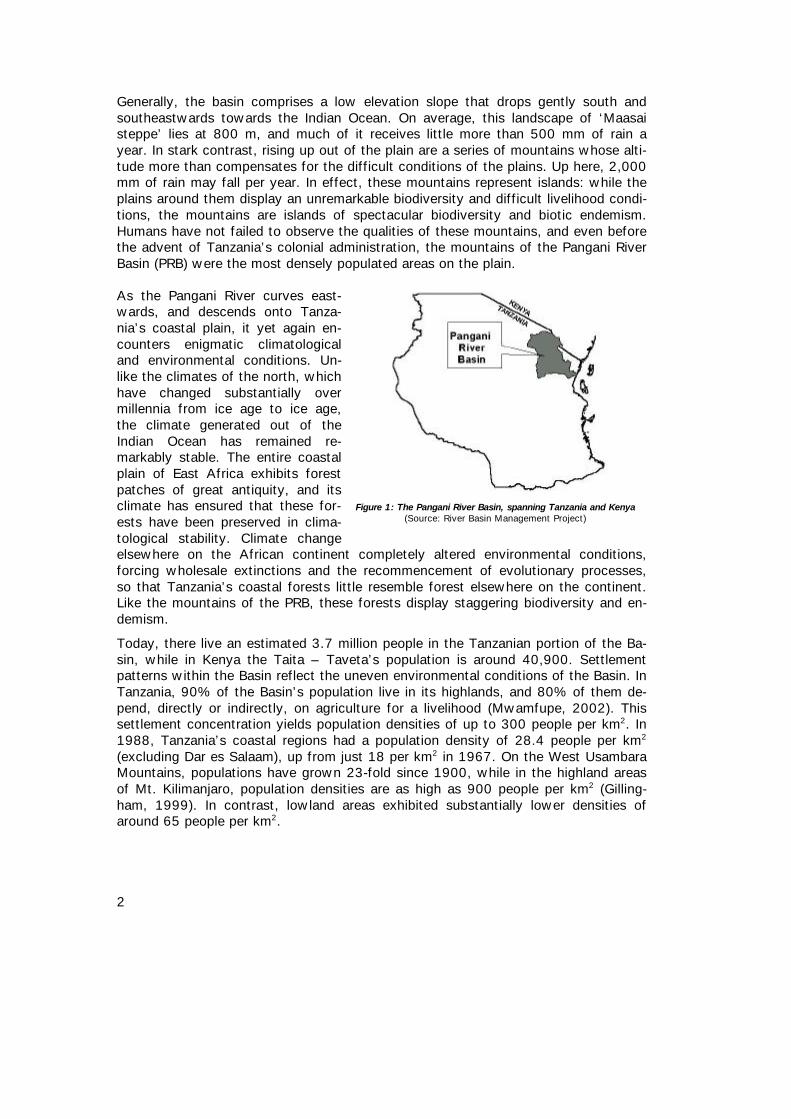
lies in Kenya (Figure 1). In Tanzania, the Basin in distributed amongst the Kilimanjaro,Manyara, Arusha, and Tanga administrative regions of. The Kenyan portion of theBasin falls almost entirely within the district of Taita – Taveta.
The Pangani River itself has two main tributaries, both of which rise in the basin’snorthernmost portions. The first of these, the Kikuletwa, rises on the slopes ofMount Meru and the southern slopes of Mount Kilimanjaro, while the second, theRuvu, rises on the eastern slopes of Mt. Kilimanjaro and Lake Jipe. These rivers joinat Nyumba ya Mungu, a reservoir of some 140 km2 (Røhr and Killingtveit, 2002). ThePangani River3 drains the reservoir, flowing for 432 km before emptying into the In-dian Ocean.
1 Many previous studies cite the catchment area of the administrative Pangani Basin in Tanzania as56,300 km2, and the area of the main Pangani River Basin in Tanzania and Kenya as 42,200 km2 based onplanimeter estimates made by S. Kamugisha (1992). Subsequently two different institutions (TANRIC atUniversity of Dar es Salaam and the River Basin Management Project in the Ministry of Water & LivestockDevelopment) have estimated these areas using GIS. These recent estimates are larger than the previousplanimeter estimates. These discrepancies are probably a result of different interpretations of the basinboundaries, especially on the west side and differences between planimeter and GIS methods (Kamugisha& Mwakalinga pers. com., 2003).
2 Some authors use 'Sigi' spelling, 'Zigi' is the preferred spelling of the catchment's residents (pers.comm., 2003)
3 Some maps and studies refer to the effluent of Nyumba ya Mungu reservoir as the Ruvu River until itjoins with the Mkomazi River, at which point it becomes the Pangani River. This study will refer to theentire stretch, from Nyumba ya Mungu to the estuary, as the Pangani River.
2
Generally, the basin comprises a low elevation slope that drops gently south andsoutheastwards towards the Indian Ocean. On average, this landscape of ‘Maasaisteppe’ lies at 800 m, and much of it receives little more than 500 mm of rain ayear. In stark contrast, rising up out of the plain are a series of mountains whose alti-tude more than compensates for the difficult conditions of the plains. Up here, 2,000mm of rain may fall per year. In effect, these mountains represent islands: while theplains around them display an unremarkable biodiversity and difficult livelihood condi-tions, the mountains are islands of spectacular biodiversity and biotic endemism.Humans have not failed to observe the qualities of these mountains, and even beforethe advent of Tanzania’s colonial administration, the mountains of the Pangani RiverBasin (PRB) were the most densely populated areas on the plain.
As the Pangani River curves east-wards, and descends onto Tanza-nia’s coastal plain, it yet again en-counters enigmatic climatologicaland environmental conditions. Un-like the climates of the north, whichhave changed substantially overmillennia from ice age to ice age,the climate generated out of theIndian Ocean has remained re-markably stable. The entire coastalplain of East Africa exhibits forestpatches of great antiquity, and itsclimate has ensured that these for-ests have been preserved in clima-tological stability. Climate changeelsewhere on the African continent completely altered environmental conditions,forcing wholesale extinctions and the recommencement of evolutionary processes,so that Tanzania’s coastal forests little resemble forest elsewhere on the continent.Like the mountains of the PRB, these forests display staggering biodiversity and en-demism.
Today, there live an estimated 3.7 million people in the Tanzanian portion of the Ba-sin, while in Kenya the Taita – Taveta’s population is around 40,900. Settlementpatterns within the Basin reflect the uneven environmental conditions of the Basin. InTanzania, 90% of the Basin’s population live in its highlands, and 80% of them de-pend, directly or indirectly, on agriculture for a livelihood (Mwamfupe, 2002). Thissettlement concentration yields population densities of up to 300 people per km2. In1988, Tanzania’s coastal regions had a population density of 28.4 people per km2
(excluding Dar es Salaam), up from just 18 per km2 in 1967. On the West UsambaraMountains, populations have grown 23-fold since 1900, while in the highland areasof Mt. Kilimanjaro, population densities are as high as 900 people per km2 (Gilling-ham, 1999). In contrast, lowland areas exhibited substantially lower densities ofaround 65 people per km2.
Figure 1: The Pangani River Basin, spanning Tanzania and Kenya(Source: River Basin Management Project)
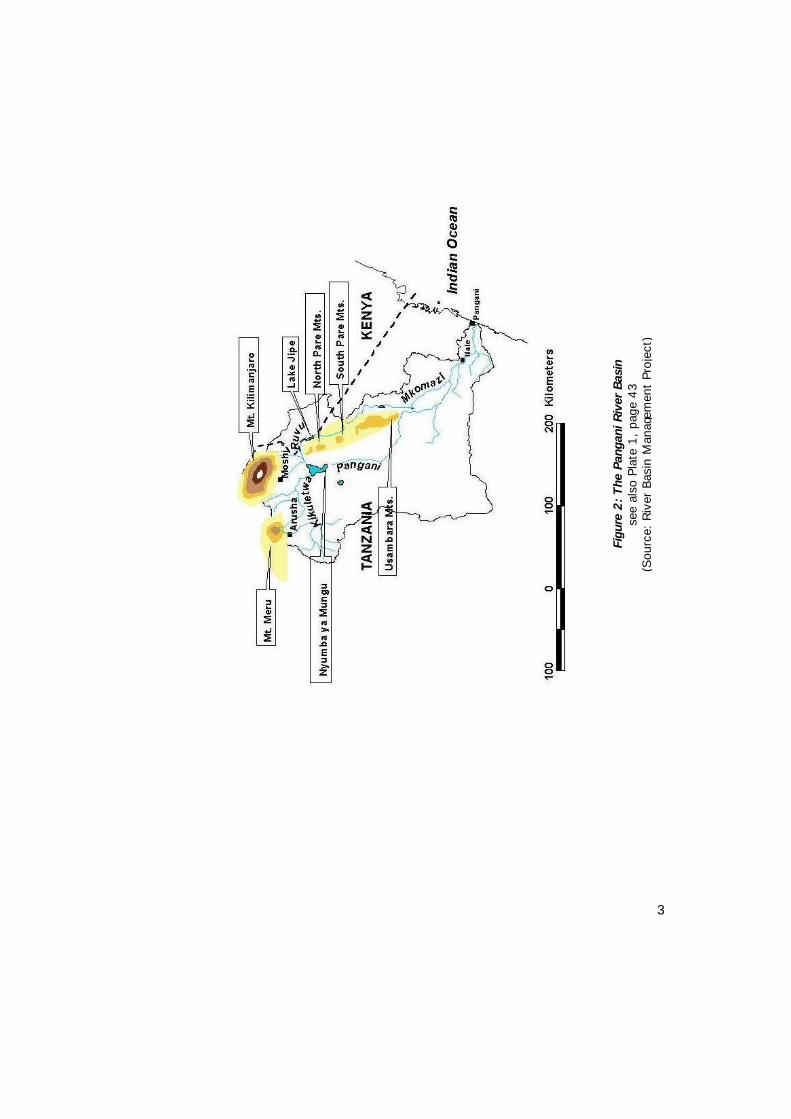
3
Figu
re 2
: The
Pan
gani
Riv
er B
asin
see
also
Pla
te 1
, pa
ge 4
3(S
ourc
e: R
iver
Bas
in M
anag
emen
t Pr
ojec
t)
4
Historically, the Basin’s occupants have practised economies that have reflected thedivergent environmental conditions of the Basin. The lowlands supported pastoralists,while the highlands have supported agriculturalists. With the advent of European co-lonialists, great swathes of farming land were ‘alienated’ for plantation farming. InKenya’s Taita – Taveta District, virtually all land was set aside for sisal cultivation.This ensured that farming intensities magnified. Johnston (1946) claims that, in1943, landholdings in the Kilimanjaro highlands were, on average, 1.2 ha apiece. In1946, they were just 2.5 m2.
Average holding sizes in the Kilimanjaro highlands have, apparently, grown sincethen, and Lein (2002) claims holding sizes to be an average of 0.6 ha per household.Lowland households farm an average area of 10.4 ha.
The latter average is likely to decline. As plot sizes in the highlands become smallerand smaller, plots less able to provide a livelihood, and soils exhausted from exces-sive cropping and irrigation, people have been forced to seek land in the lowland ar-eas. Naturally, population has concentrated along the Pangani River Basin’s (PRB’s)rivers, and irrigation is extremely widespread. As a result, the biodiverse islands thatpepper the Basin floor are under unrelenting pressure.
At its core, therefore, the problems of the PRB relate to population density and thetwo key farming and pastoralist ingredients: land and water. The interaction of thesevariables, and the claims that people make on the Basin’s resources, has yielded aseries of different conflict types:
Conflicts of scale
The relationship between water users of different sizes in the Pangani River Basin isoften described in dichotomous terms. Hence, large-scale plantations using hundredsof litres of water a second and employing highly efficient irrigation systems differstarkly from small-scale users using far lower water volumes and employing very in-efficient irrigation systems. These scale differences are not restricted to technolo-gies, but to land. Large-scale users nearly always use more land than small-scale us-ers. One important exception is hydropower interests along the river. The land actu-ally occupied by these interests is (relatively) not that large, but their water demandsare very high. This water, of course, is returned to the river, so that, arguably, powergeneration interests leave in as much water as they use. Their interests, however,are national in scope. The PRB generates up to 17% of Tanzania’s electricity, andmany of its hydropower units are designed with very specific water flows in mind. Ifwater abstractions between the water source and the hydropower plant are exces-sive, the plants have to operate at less than optimal capacity. The conflict herebrings to bear national interests against small-scale concerns.
5
Conflicts of tenure
This document refers to tenure as the right to manage a resource. Like in most partsof the world, the notion of community-based management in Tanzania and Kenya isnew. In countries where state-based management systems have, after more than halfa century of operation, yielded lacklustre results, and the gravity of the countries’environmental problems increases, community-based natural resources management(CBNRM) can seem a remarkably attractive management option. Hence, in Tanzania,there are a plethora of such community-based management institutions. Community-based NRM remains very nascent in Kenya. The contention with these systems re-lates to the manner of their application and design. Here, communities may not beinvolved in the design of the management system, its implementation or even its jus-tice systems.
Conflicts of location
The location of up-stream water users favours their resource exploitation over thelocation of downstream users. At its most basic, these problems can be seen alongirrigation furrows where users close to the water source are able to grow crops withvery high water demands (such as irrigated rice) and those located at the end of thefurrow obliged to plant low water demand crops. The serious problems faced bydownstream hydropower plants are another example.
Two main institutions administer the water resources of the Pangani River Basin. InTanzania, it is the Pangani Basin Water Office (PBWO), while in Kenya it is the WaterResources Management Authority (WRMA). Under recent Tanzanian legislation, all ofTanzania’s basins have (or will be) placed under similar offices. However, some Ba-sins are too small to merit the creation of an independent office to manage them.Four such basins surround the PRB (the Umba, the Zigi, the Msangazi and a collec-tion of tiny catchments referred to as the ‘Coastal River Catchment’). These fallwithin the administrative jurisdiction of the PBWO, and are not considered in themain body of this document. Summary information about these basins is, however,assigned to Appendix 1.
The PRB faces a number of serious management problems. In view of the extremelydisparate natural resources of the Basin, along with its multitude of different interestsand hopes, the need for an integrated approach to its management cannot be under-estimated. In the past, the very ‘sectoral’ approach to the PRB’s management meantthat wildlife resources were managed in isolation of forestry concerns, in turn largelyignorant of water management priorities. The problem is also articulated in terms ofpriorities, with the water sector arguing that water is the strand that links all of theBasin’s resources, but foresters complaining that most of the Basin’s waters issuefrom forests in their jurisdiction.
6
A.2 Integrated River Basin Management (IRBM)
In many respects, river basins are extremely convenient Natural Resources Manage-ment (NRM) units. River basins comprise all the sources and processes that ulti-mately ensure that water is delivered to a river’s terminus. Hence, a river basin willinclude a river’s primary channel, secondary streams and its drainage basin. It willalso include any delta associated with the river, and sub-surface water, wetlands andany impoundments.
The combination of processes that ensure that water is delivered from a river’ssource to its terminus is complicated and multidimensional. Additional resources,such as forests and wetlands, play integral roles in this process. The amount of wa-ter that ultimately emerges at a river’s terminus will also depend on the number ofabstractions that occur along its course, as well as evapotranspiration rates in wet-lands and from aquatic and riparian vegetation. Finally, the quality of the water at ariver’s terminus will also reflect processes within the basin, such as farming tech-niques that increase or reduce erosion, industrial and urban development etc.
River Basin Management (RBM) recognises that a river’s management cannot be im-plemented in isolation of the multifarious processes and conditions that impinge onthe river’s flow and the quality of its water. RBM considers the river basin as themanagement unit and involves consideration of the utilisation and conservation of (a)sub-ecosystems (sub-catchments, forests, wetlands, montane areas, drylands, etc.);and (b) human use systems within the watershed (agriculture, irrigation, fisheries,transport, mining, industry, etc.). RBM is usually based on the principle that waterconnects the ecosystems within the river basin (Howard, 2002).
Integrated River Basin Management (IRBM) attempts to balance the interests of allriver basin users, while optimising the use of resources and promoting thesustainability of the water upon which the systems depend (Howard, 2002). It maybe defined as follows:
“…a process that promotes the coordinated development and management of water,land and related resources in order to maximise the resultant economic and socialwelfare in an equitable manner without compromising the sustainability of vital eco-systems” (GWP, 2002: 1).
IRBM deals with resources in the widest possible manner. It has to look at water re-sources in the context of the entire social, economic and ecological systems of a re-gion or country. Operationally, this means that policies and programmes in other re-source areas have to be carefully analysed to see how they influence the demandsplaced upon the water sector (GWP, 2002). IRBM regards environmental interests asequally important as peoples’ needs for water resources. IRBM should work towardsthe objectives agreed upon by a majority of river basin stakeholders and include theprinciples of water resources management, ecosystem management, biodiversityconservation, sustainable natural resources management and ecosystem restoration(Howard, 2002).
7
An important part of integrated river basin management (IRBM) is land-use planning.Because so much of what happens to water concerns developments on land, it isimportant that land use is managed in such a way that water supply can be assuredand that hydrological processes are not interrupted. Urban growth, for example, of-ten has a serious impact on water resources through the massive increases in wasteeffluent that it represents. In the same way, forestry and agriculture can have reper-cussions for both the quantity and quality of water supplies.
Examples of land use management options include (a) zoning – here, specified areasare identified in which certain types of land use are prohibited. For example, drinkingwater zones, or areas where construction is banned because of flooding fears. (b)Soil protection and erosion control measures, such as ploughing parallel to contourlines, or the prescribed planting of trees. (c) Waste disposal regulations, such aswhere to locate waste disposal sites (Source: GWP, 2002).
A.3 The Water and Nature Initiative (WANI)
The World Conservation Union (IUCN) has developed one way in which the ideals ofIntegrated River Basin Management (IRBM) may be achieved. The approach is builtupon the ‘Vision for Water and Nature’ (VWN), which envisages:
Box 1: Water Demand Management
Water Demand Management (WDM) has developed from the recognition that (a) demandfor water is increasing without any concomitant increase to water supplies; (b) as a result,the cost of increasing water supplies escalates as new sources become more difficult toabstract. Costs associated with the development of new abstraction technologies or meth-ods may be prohibitive. WDM, then, seeks to save water abstracted from present watersupplies, yielding both economic and environmental advantages. WDM may be defined as astrategy to improve the efficiency and sustainable use of water resources taking into ac-count economic, social and environmental considerations (Wegelin-Schuringa, 1998). Themain objective of WDM is to contribute to more efficient and equitable provision of waterand sanitation services. IUCN believes that this may be attained via the application of se-lective, economic incentives, to promote efficient and equitable use of water as well as anumber of water conservation measures aimed at raising awareness on the scarcity andfinite nature of the resource. WDM embraces a wide range of measures leading to sustain-able management. These include:
• the protection of water quality• the reduction of wastage• the improved allocation of water amongst competing users• appropriate pricing mechanisms• water conservation measures
8
“a world in which the benefits of freshwater and related ecosystems to hu-mankind are optimized while the intrinsic values of these systems are re-spected and preserved. In this world, the mutual dependence of people andecosystems is accepted and unavoidable loss of ecosystem functions andbiodiversity is compensated through restoration”.
The VWN seeks a balance between the use and conservation of freshwater ecosys-tems. It recognises that freshwater resources may be needed to: produce food, fordomestic purposes, electricity generation etc., and that these need to be balancedagainst the intrinsic value of freshwater resources, and their contributions to the sus-tenance of nature and ecosystems.
In order to implement the Vision, the World Conservation Union (IUCN) has devel-oped the Water and Nature Initiative (WANI), which it launched in July 2001. WANIpromotes six goals:
• To demonstrate ecosystem management in river or lake basins.
• To empower people to plan for, and manage, their environment.
• To promote wise governance of environmental resources.
• To develop and apply economic tools and incentives for environmental con-servation.
• To create and share knowledge about the ecosystem.
• To create awareness about environmental issues and to learn from our expe-riences.
WANI aims to address these objectives in a participatory, strategic, transparent, andcatalytic way. It seeks to meet these objectives through a series of projects aroundthe world that demonstrate ecosystem management, empowered people managingtheir environment, promoting wise governance etc. WANI Projects have certain crite-ria. They comprise ecosystems where:
• considerable pressure on water and environmental resources exists;• biodiversity and ecosystem goods and services are threatened;• there may be inequality in the distribution of benefits in the catchment;• people are willing to act;• capacity exists to implement a project;• chances of success exist; and• opportunities for funding such a project exist.
WANI demonstration projects have been formulated in several river basins around theworld, including the Huong River Basin (Vietnam), Lake Guija Basin (El Salvador) andthe Tacana River Basin (Mexico, Guatemala). This Situation Analysis will, in largemeasure, demonstrate that the Pangani River Basin (PRB) does, in large measure,meet virtually all of these criteria.
9
A.4 Situation Analysis: objectives and outputs
A Situation Analysis (SA) comprises an integral part of the IUCN’s project cycle. It is‘an analysis of the status, conditions, trends and key issues affecting ecosystems,people and institutions in a given geographic context at any level (local, national, re-gional, international)’ (IUCN, 1999: 1). The purpose of an SA is to provide an as-sessment sufficiently adequate for priority themes or areas for action to be devel-oped.
Within this remit, this SA’s objectives are as follows:
• To identify the resources that occupy the Pangani River Basin (PRB) and theprocesses and events that affect them. The SA will highlight those specificareas that require remedial interventions, based on evidence to suggest thatthe balance between obtaining adequate livelihoods for the Basin’s inhabi-tants and the sustainability of the Basin’s resources has been disrupted.
• To identify a series of broad action areas wherein interventions may feasiblybe delivered. The SA recognises that many of these interventions may not bewithin the IUCN’s expertise. It will therefore seek to identify other organisa-tions, interests or institutions with which the IUCN may develop partnershipsas it seeks to develop the WANI initiative in the PRB.
A.5 Data sources
This Situation Analysis (SA) is based on data derived from two main sources:
• Published information. Of particular importance are outputs from the researchon Water Resources Management in the Pangani River Basin, a collaborativeeffort between the University of Dar es Salaam and the Norwegian Universityof Technology and Science. In addition, the SA also draws on the Report on aworkshop called the ‘The Pangani River Basin: Options for Integrated Man-agement’, and held at the Kilimanjaro Crane Hotel, Moshi, Tanzania, 8 – 10May, 2002.
• Semi-structured interviews carried out by the author with PRB stakeholders.These included water administrators, forestry interests, farming communities,wildlife and conservation interests and private water users. Interviews wereheld in Arusha, Moshi, Hale, Tanga and Dar es Salaam between November 12and 22, 2002. The interviews, respondents and their institutional affiliationare provided as part of this document’s references.
This Situation Analysis has been reviewed by a large number of the Pangani RiverBasin's stakeholders. During a workshop held in Moshi, Tanzania, between the 10th
and 12th March, 2003, the Situation Analysis was presented to stakeholders for re-view and comment. In May, 2003, additional comments were received from the Pan-gani Basin Water Office (PBWO) and the Coast Development Authority (CDA –Kenya). Suggested amendments have subsequently been noted and incorporated.
10
A.6 Situation Analysis Structure
This Situation Analysis commences with an overview of the Basin’s resources andthe difficulties facing them. It then considers the activities of the Basin’s human re-sources, their economies, problems and resource access constraints. The SA thengoes on to consider the problems and issues that various stakeholders perceive toexist in the Basin as a basis upon which to discuss the Natural Resource Manage-ment (NRM) structure of the Basin. In most chapters, the SA summarises relevantpoints that the reader should be aware of and which s/he should bear in mind as s/heproceeds to subsequent sections of the analysis. These summaries are brought to-gether in the document’s conclusion, where the discussion will return to its objec-tives, and consider how the problems that have been identified, the management ini-tiatives that have been embarked upon and the options that have been considered inthe text may all serve as a viable basis for WANI intervention and collaboration.
11
B The Pangani River Basin’snatural resources
B.1 Introduction
The introduction to this Situation Analysis (SA) has already provided some insightinto the diversity of resources contained within the Pangani River Basin (PRB). In thisChapter, we commence by taking a look at the PRB’s forests, the role they play inthe basin and the conservation threats that challenge them. Much the same format isthen used to consider additional resources within the Basin, including water andwetlands, protected areas and biodiversity. The chapter concludes with a summaryof important points. This chapter is concerned primarily with the Basin’s water andbiotic resources. Attention is not given to the PRB’s mineral deposits for lack of data.
B.2 Basin forests
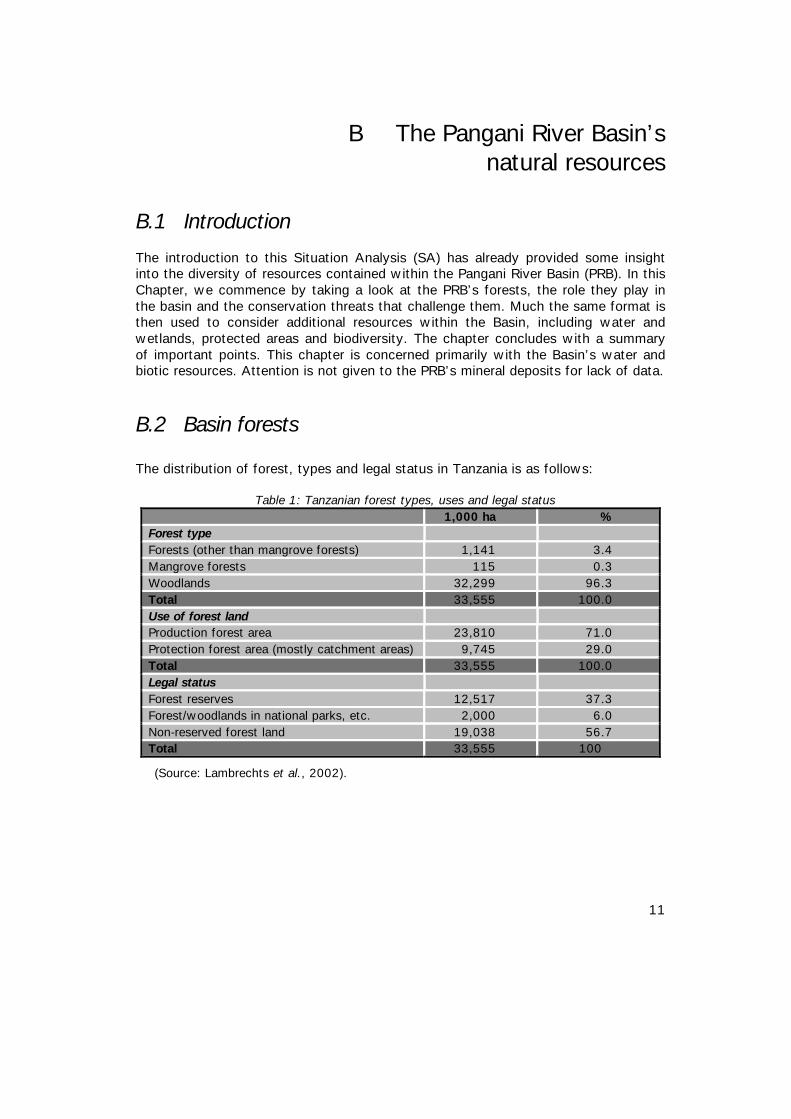
The distribution of forest, types and legal status in Tanzania is as follows:
Table 1: Tanzanian forest types, uses and legal status1,000 ha %
Forest typeForests (other than mangrove forests) 1,141 3.4Mangrove forests 115 0.3Woodlands 32,299 96.3Total 33,555 100.0Use of forest landProduction forest area 23,810 71.0Protection forest area (mostly catchment areas) 9,745 29.0Total 33,555 100.0Legal statusForest reserves 12,517 37.3Forest/woodlands in national parks, etc. 2,000 6.0Non-reserved forest land 19,038 56.7Total 33,555 100
(Source: Lambrechts et al., 2002).
12
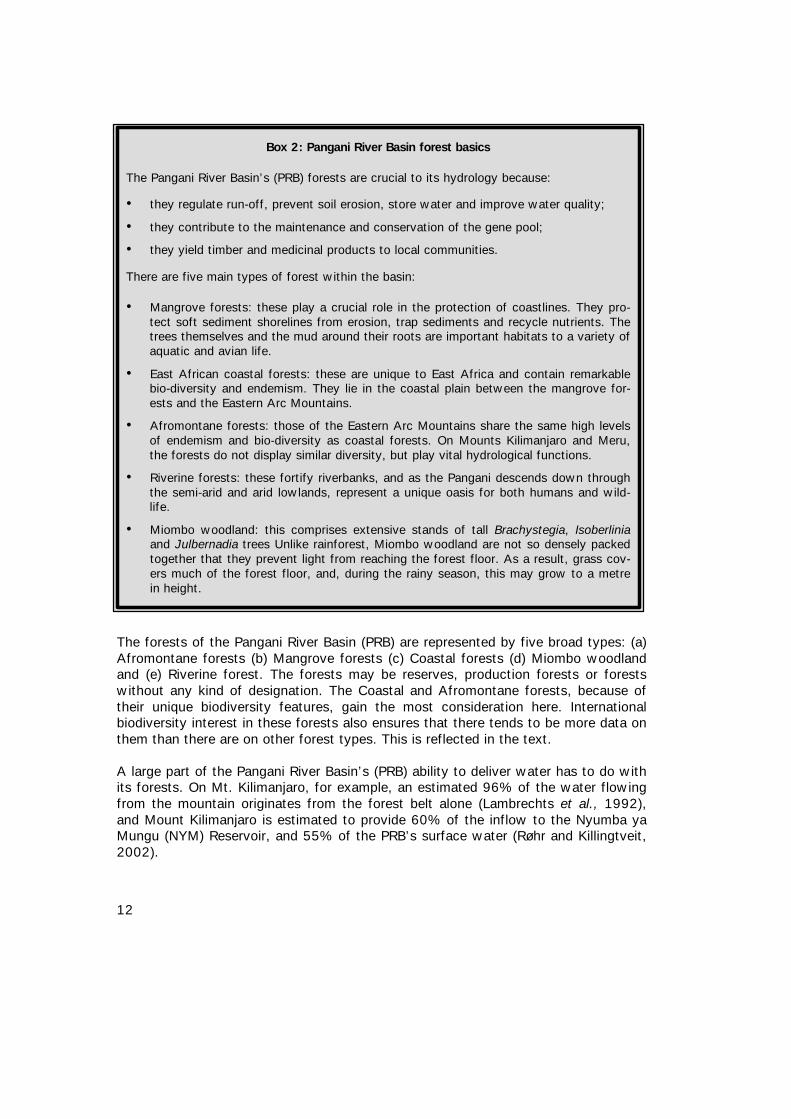
The forests of the Pangani River Basin (PRB) are represented by five broad types: (a)Afromontane forests (b) Mangrove forests (c) Coastal forests (d) Miombo woodlandand (e) Riverine forest. The forests may be reserves, production forests or forestswithout any kind of designation. The Coastal and Afromontane forests, because oftheir unique biodiversity features, gain the most consideration here. Internationalbiodiversity interest in these forests also ensures that there tends to be more data onthem than there are on other forest types. This is reflected in the text.
A large part of the Pangani River Basin’s (PRB) ability to deliver water has to do withits forests. On Mt. Kilimanjaro, for example, an estimated 96% of the water flowingfrom the mountain originates from the forest belt alone (Lambrechts et al., 1992),and Mount Kilimanjaro is estimated to provide 60% of the inflow to the Nyumba yaMungu (NYM) Reservoir, and 55% of the PRB’s surface water (Røhr and Killingtveit,2002).
Box 2: Pangani River Basin forest basics
The Pangani River Basin’s (PRB) forests are crucial to its hydrology because:
• they regulate run-off, prevent soil erosion, store water and improve water quality;
• they contribute to the maintenance and conservation of the gene pool;
• they yield timber and medicinal products to local communities.
There are five main types of forest within the basin:
• Mangrove forests: these play a crucial role in the protection of coastlines. They pro-tect soft sediment shorelines from erosion, trap sediments and recycle nutrients. Thetrees themselves and the mud around their roots are important habitats to a variety ofaquatic and avian life.
• East African coastal forests: these are unique to East Africa and contain remarkablebio-diversity and endemism. They lie in the coastal plain between the mangrove for-ests and the Eastern Arc Mountains.
• Afromontane forests: those of the Eastern Arc Mountains share the same high levelsof endemism and bio-diversity as coastal forests. On Mounts Kilimanjaro and Meru,the forests do not display similar diversity, but play vital hydrological functions.
• Riverine forests: these fortify riverbanks, and as the Pangani descends down throughthe semi-arid and arid lowlands, represent a unique oasis for both humans and wild-life.
• Miombo woodland: this comprises extensive stands of tall Brachystegia, Isoberliniaand Julbernadia trees Unlike rainforest, Miombo woodland are not so densely packedtogether that they prevent light from reaching the forest floor. As a result, grass cov-ers much of the forest floor, and, during the rainy season, this may grow to a metrein height.
13
Catchment forests perform three important functions (Akitanda, 2002):
• Forests contribute to water conservation by regulating run-off, preventing soilerosion, storing water and improving water quality.
• Gene-pool conservation: forests, such as tropical moist forests, display very highlevels of biodiversity, and contribute to the maintenance of the global gene pool.
• Forests yield products for local communities such as timber and medicinal plants.
Mangrove forests
Mangrove forests play a crucial role in the protection of coastlines. They protect softsediment shorelines from erosion, trap sediments and recycle nutrients. The treesthemselves and the mud around their roots are important habitats to a variety ofaquatic and avian life. At high tide, hundreds of fish species move into the mangroveforests to feed or breed. Many fish and prawns rely on mangroves as nurserygrounds for their young. Mangrove wood is very dense, and can therefore resist ter-mites and fungi. They are used for a variety of purposes. The trunks of Rhizophora,Ceriops and Bruguiera are long and straight, and are therefore used almost exclu-sively as building poles, although they are also used as masts, in the construction offish traps and in furniture construction. In recent years, mangroves are also beingused to make charcoal and collected as fuelwood. Mangrove forest close to urbanareas is heavily exploited for these purposes. Mangroves can be coppiced to increasebranch growth, and replanting is relatively straightforward. Neither activity is com-monly practised along the Tanzanian coast, however (Richmond, 1997).
Virtually all of Tanzania’s coastline is fringed by mangrove forest. In the PRB, theyare restricted to the Tanga Region, where almost 11% of Tanzania’s mangroves areto be found (Bwathondi and Mwamsojo, 1993). This includes the 753 ha of man-grove forest clustered around the mouth of the Pangani River (Kijazi, 2002).
East African Coastal Forests
East African coastal forests are found on the coastal plain between the Eastern ArcMountains and the mangroves of the coast. The forests are extremely scattered, andforest patches are separated by stretches of semi-arid ecosystems. They range frombetween 500 and 1,000 m ASL. An important characteristic of coastal forest (whichthey share with the Eastern Arc Mountain forests) is their dependence on the IndianOcean’s climate and the historical stability this has provided. Restricted to the EastAfrican coastal plain, the forests’ isolation from other African forest systems has re-sulted in high levels of species endemism (see below) (Burgess et al., 1996). Thereare believed to be 76 coastal forests in Tanzania (Burgess et al., 1996). They arevery numerous in the swathe of coastal plain between the Pangani River’s mouth andthe foothills of the Usambara Mountains (see Baker and Baker, 2001).
14
Afromontane forests
The Eastern Arc Mountains range from Tanzania’s border with Zambia through to theTaita- Hills in Kenya. They comprise ancient crystalline mountains located in easternTanzania and southeastern Kenya under the direct climatic influence of the IndianOcean. Within the PRB, they comprise the North and South Pare Mountains, the Eastand West Usambara Mountains and the Taita Hills. The mountains are of great age,and the most recent period of tectonic uplift to affect them occurred 7 million yearsago. In comparison, the oldest lavas on Mt. Kilimanjaro are just 1 million years old.(Burgess et al., 1996).
The proximity of these moun-tains to the sea has also ensuredthat their climate has remainedremarkably stable. During thelast ice age, sea surface tem-peratures in the Indian Ocean didnot change. Thus, while the iceage may have altered climate inother parts of Africa, it did notdo so for the Eastern Arc Moun-tains. The mountains have,therefore, enjoyed very long pe-riods of environmental stability,and have also been isolated fromother forests and, indeed, fromone another (Burgess et al.,1996).
The result of this evolution is that the biotic characteristics of the mountains are re-markably diverse and characterised by high levels of endemism or near endemism(see below). It is probable that the somewhat lower level of species diversity andendemism on Mount Kilimanjaro is a result of its relative youth.
Mt. Kilimanjaro’s forest is classified into a series of vegetation types: the savannahzone, the densely populated agro-forest area, the forest belt, the sub-alpine and al-pine vegetation zones. In terms of ecosystems and biodiversity, the forest belt is themost important on the mountain, and contains almost half of the mountains vegeta-tion species (Lambrechts et al., 2002).
Riverine forest
Riverine forest around the Kirua Swamp may be divided into seven groups as follows(IVO – NORPLAN, 1997):
• Riparian vegetation: this comprises vegetation extending to about 50 m to eitherside of the river channel. On the eastern side, dominant species comprise Cy-
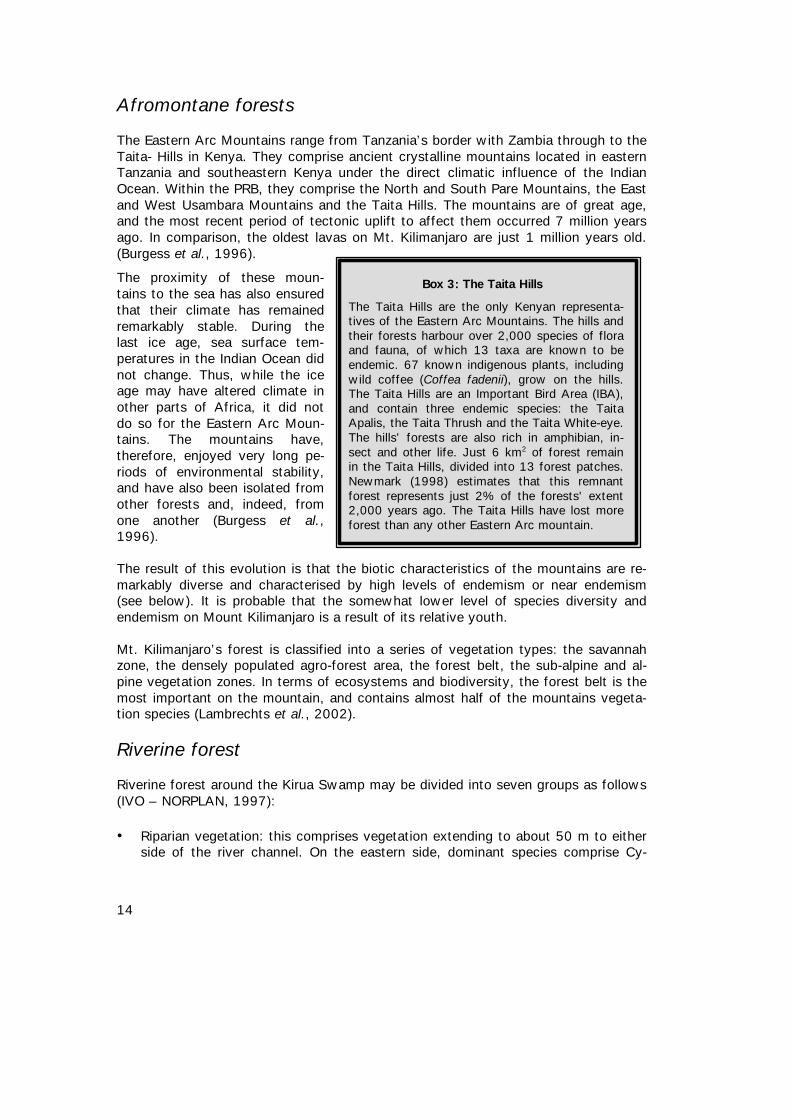
Box 3: The Taita Hills
The Taita Hills are the only Kenyan representa-tives of the Eastern Arc Mountains. The hills andtheir forests harbour over 2,000 species of floraand fauna, of which 13 taxa are known to beendemic. 67 known indigenous plants, includingwild coffee (Coffea fadenii), grow on the hills.The Taita Hills are an Important Bird Area (IBA),and contain three endemic species: the TaitaApalis, the Taita Thrush and the Taita White-eye.The hills' forests are also rich in amphibian, in-sect and other life. Just 6 km2 of forest remainin the Taita Hills, divided into 13 forest patches.Newmark (1998) estimates that this remnantforest represents just 2% of the forests' extent2,000 years ago. The Taita Hills have lost moreforest than any other Eastern Arc mountain.
15
peraceae (e.g. Cyperus alticulatus, C. laevigatus), Gramineae (e.g. Phragmitesmauritianus, Echnochloa colonum) and Typhaceae (e.g. Typha domingensis).Where the riverbank is deep, Ficus sur and Acacia zanzibarica are common. Thewestern bank is dominated by Ficus sur, Trichilia emitica, Elaeis guineense, Al-bizia graberrima, Antidesma venosum and A. zanzibarica. The riparian shrub layeris dominated by species such as Sesbania sesbans and Phyllanthus muellerianus.
• Cyperus and Sesbania marshland: in areas that are permanently waterlogged,species such as Cyperus axaltatus and Typha domingensis predomiate. In thoseareas that are seasonally flooded, Sesbania sesbands, Cyperus laevigatus andAcacia xanthophloea are the only tree species associated with this type of vege-tation. This is the most common vegetation category within the Kirua Swamps,although it is more common on the eastern bank of the river than on the western.On the eastern side, it may extend up to 3 km away from the river, while at itswidest point it is just 700 m from the river on the western side of the river.
• Sporobolus pyramidalis and Cynodon dactylon grassland: Poaceae family mem-bers dominate here, with a few scattered trees and shrubs. In the Kirua Swamps,this vegetation type covers the largest area. It may occur in patches or continu-ous swaths.
• Acacia xanthophloea woodland: this vegetation type sees these Acacia speciesdominating, rising up to 18 m, and with a canopy cover of over 20% of theground area. This vegetation type has high social and economic values to thewetland’s human inhabitants.
• Desert with clumps of Suaeda monoica: a self-explanatory vegetation type, typi-cally found fairly far from the river beyond the grassland vegetation sections.
• Commiphora africana bushland: an extended zone of bushland dominated by C.africana that is found at the foot of the Martin Escarpment. Typically, individualbushes are less than 6 m in height, and their canopy will cover more than 20%of ground area.
• Cultivated land: in 1997, cultivation within the Kirua Swamps was restricted to afairly small area, and dominated by crops with high water demand such as ba-nanas and sugar cane, but also maize.
Miombo woodland
Miombo woodland covers some 50 per cent of Tanzania and is East Africa’s largestsingle vegetation type. East Africa’s miombo woodlands are an impoverished form ofthe more extensive and species rich miombo woodlands of Central Africa (Rogers,1996). They may be described as follows: ‘A deciduous unarmed (having few treespecies with spines or thorns) woodland occurring in the unimodal rainfall areas ongeologically old, acid, sandy soils. It is characterized by trees in the sub-family Cae-salpinoideae, especially species in the genera Brachystegia and Julbenardia. Theshrub layer is variable in density, percent cover and species composition. It is oftendominated by Diplorhynchus and Combretum spp. The ground cover varies from a
16
dense course grass growth to a sparse cover of herbs and small grasses. The struc-ture and species composition is largely maintained by periodic season fires’ (Rogers,1996: 301). Some 3 million km2 of Africa are covered in miombo woodland. In thePangani River Basin (PRB) it is confined mainly to coastal areas, both to the immedi-ate north and south of the Pangani River’s mouth.
Conservation threats and status
On Mt. Kilimanjaro, the forest is increasingly threatened by encroaching agriculture,itself arising from increasing population densities. Additional threats are timber ex-traction, the development of softwood plantations, fire, illegal and excessive timberharvesting, poaching and illegal honey harvesting (Yanda and Shishira, 2001). On allbut its northern slopes, ‘heavy’ illegal logging occurs in forest areas below 2,500 m,concentrating on camphor, cedar and other indigenous trees (Lambrechts et al.,2002). Additional threats comprise the establishment of ‘forest villages’ (of whichthere are 18 covering some 215 ha) within the forest reserve. ‘Shamba’ farms arealso increasingly common within the reserve. In August 2001, there were 125 char-coal kilns observed on the mountains southeastern slopes (Lambrechts et al., 2002).Grazing occurs up to 8 km into the forest, and in August 2001, 814 livestock ani-mals were counted, concentrated on the mountains northern slopes (Lambrechts etal., 2002).
Between 1952 and 1982, Kilimanjaro’s natural forest area declined by 41 km2. Theareas where natural forest once stood have been replaced by cultivation or degradedvegetation. Worst affected are the edges of the forest reserve (Yanda and Shishira,2001), particularly in the so-called ‘half mile strip’. In 1941, the Tanzanian colonialgovernment designated an area of Kilimanjaro’s forest reserve as an agroforestryarea. The strip stretches between the Kikuletwa and Sanya Rivers, and for half a mileuphill from the edge of the reserve. The ‘half mile strip’ was intended for the cultiva-tion of fast growing trees for use by the Chagga communities below the reserve,where land scarcity precluded the planting of forests (Baldwin, 1946). Today, about66% of areas allocated to forest plantation are under agriculture or have been cleared(Lambrechts et al., 2002).
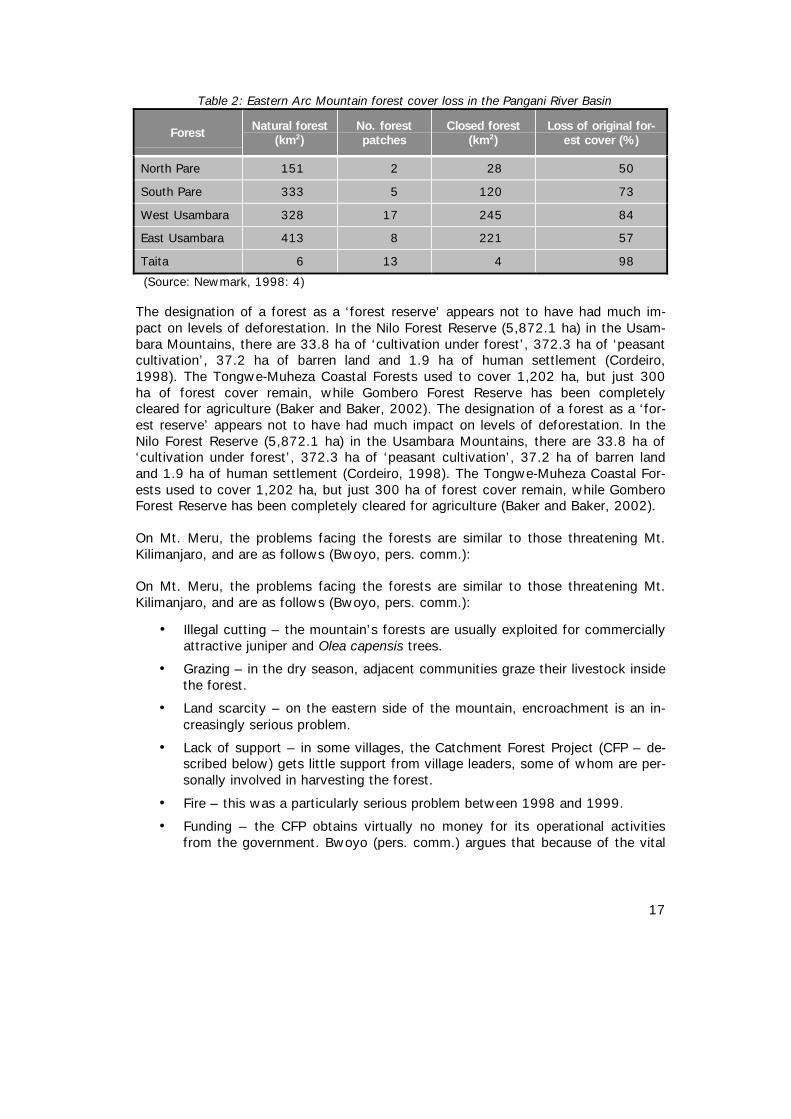
In the PRB, the Eastern Arc Mountains occupy some of the most densely populatedareas of the Basin. On the West Usambara Mountains, for example, populations havegrown 23-fold since 1900 (Newmark, 1998). In a social environment characterisedby poverty, the importance of land to farm is disproportionately high. The pressurethat this represents on the Basin’s remaining forest reserves is formidable. If it is as-sumed that the Eastern Arc Mountains were, prehistorically, more or less continu-ously covered by forest, 77% of this has been lost to human disturbance and/or fireover the past 2,000 years (Newmark, 1998). An additional concern is that many ofthese processes have created forest patches, and animal species are often unwillingto cross over forest gaps. This means that in individual patches, the gene poolshrinks and species survival is threatened by in-breeding. In the Pangani River Basin,this loss is as presented in Table 2.
17
Table 2: Eastern Arc Mountain forest cover loss in the Pangani River Basin
Forest Natural forest(km2)
No. forestpatches
Closed forest(km2)
Loss of original for-est cover (%)
North Pare 151 2 28 50
South Pare 333 5 120 73
West Usambara 328 17 245 84
East Usambara 413 8 221 57
Taita 6 13 4 98
(Source: Newmark, 1998: 4)
The designation of a forest as a ‘forest reserve’ appears not to have had much im-pact on levels of deforestation. In the Nilo Forest Reserve (5,872.1 ha) in the Usam-bara Mountains, there are 33.8 ha of ‘cultivation under forest’, 372.3 ha of ‘peasantcultivation’, 37.2 ha of barren land and 1.9 ha of human settlement (Cordeiro,1998). The Tongwe-Muheza Coastal Forests used to cover 1,202 ha, but just 300ha of forest cover remain, while Gombero Forest Reserve has been completelycleared for agriculture (Baker and Baker, 2002). The designation of a forest as a ‘for-est reserve’ appears not to have had much impact on levels of deforestation. In theNilo Forest Reserve (5,872.1 ha) in the Usambara Mountains, there are 33.8 ha of‘cultivation under forest’, 372.3 ha of ‘peasant cultivation’, 37.2 ha of barren landand 1.9 ha of human settlement (Cordeiro, 1998). The Tongwe-Muheza Coastal For-ests used to cover 1,202 ha, but just 300 ha of forest cover remain, while GomberoForest Reserve has been completely cleared for agriculture (Baker and Baker, 2002).
On Mt. Meru, the problems facing the forests are similar to those threatening Mt.Kilimanjaro, and are as follows (Bwoyo, pers. comm.):
On Mt. Meru, the problems facing the forests are similar to those threatening Mt.Kilimanjaro, and are as follows (Bwoyo, pers. comm.):
• Illegal cutting – the mountain’s forests are usually exploited for commerciallyattractive juniper and Olea capensis trees.
• Grazing – in the dry season, adjacent communities graze their livestock insidethe forest.
• Land scarcity – on the eastern side of the mountain, encroachment is an in-creasingly serious problem.
• Lack of support – in some villages, the Catchment Forest Project (CFP – de-scribed below) gets little support from village leaders, some of whom are per-sonally involved in harvesting the forest.
• Fire – this was a particularly serious problem between 1998 and 1999.
• Funding – the CFP obtains virtually no money for its operational activitiesfrom the government. Bwoyo (pers. comm.) argues that because of the vital
18
role played by forests in the PRB, funds should be invested in the CFP bypower generating interests or the Pangani Basin Water Office (PBWO) (seealso Evans, 1997).
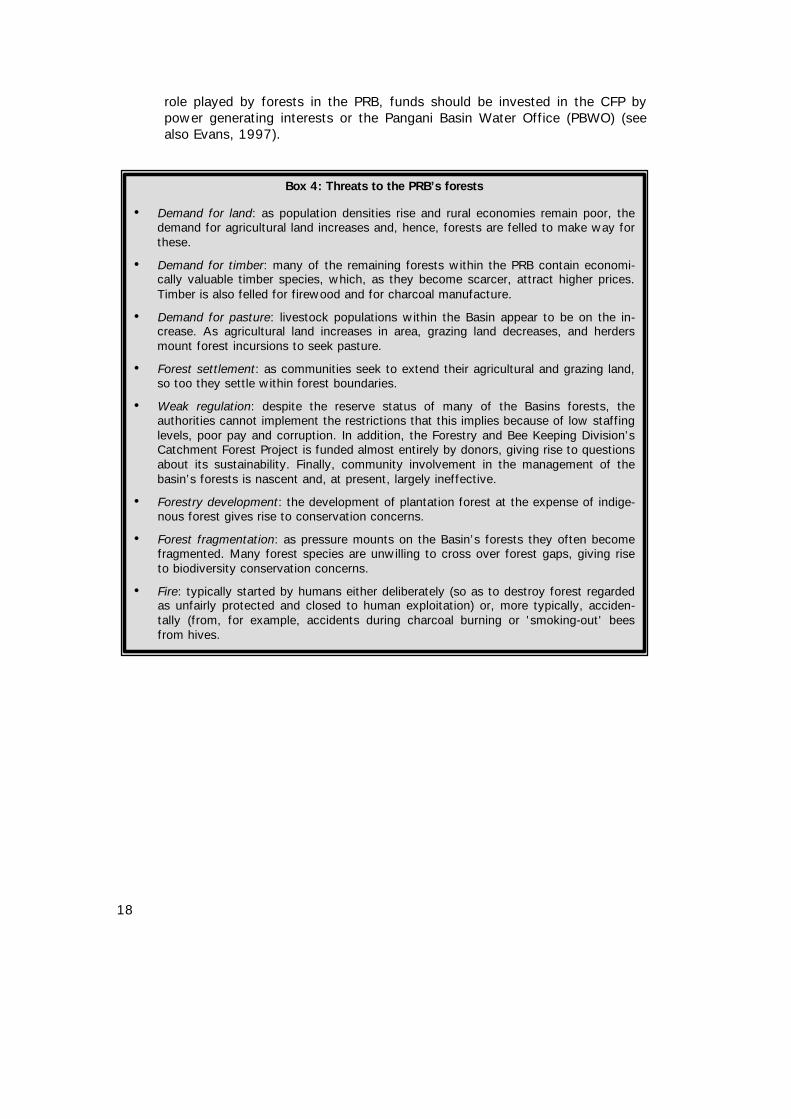
Box 4: Threats to the PRB’s forests
• Demand for land: as population densities rise and rural economies remain poor, thedemand for agricultural land increases and, hence, forests are felled to make way forthese.
• Demand for timber: many of the remaining forests within the PRB contain economi-cally valuable timber species, which, as they become scarcer, attract higher prices.Timber is also felled for firewood and for charcoal manufacture.
• Demand for pasture: livestock populations within the Basin appear to be on the in-crease. As agricultural land increases in area, grazing land decreases, and herdersmount forest incursions to seek pasture.
• Forest settlement: as communities seek to extend their agricultural and grazing land,so too they settle within forest boundaries.
• Weak regulation: despite the reserve status of many of the Basins forests, theauthorities cannot implement the restrictions that this implies because of low staffinglevels, poor pay and corruption. In addition, the Forestry and Bee Keeping Division’sCatchment Forest Project is funded almost entirely by donors, giving rise to questionsabout its sustainability. Finally, community involvement in the management of thebasin’s forests is nascent and, at present, largely ineffective.
• Forestry development: the development of plantation forest at the expense of indige-nous forest gives rise to conservation concerns.
• Forest fragmentation: as pressure mounts on the Basin’s forests they often becomefragmented. Many forest species are unwilling to cross over forest gaps, giving riseto biodiversity conservation concerns.
• Fire: typically started by humans either deliberately (so as to destroy forest regardedas unfairly protected and closed to human exploitation) or, more typically, acciden-tally (from, for example, accidents during charcoal burning or 'smoking-out' beesfrom hives.
19
B.3 Water and wetlands
The Pangani River has two main tributaries: the Ruvu, which rises on the easternslopes of Mt. Kilimanjaro; and the Kikuletwa, which rises on Mt. Meru and the south-ern slopes of Mt. Kilimanjaro. At the confluence of the Ruvu and Kikuletwa Riverslies the Nyumba ya Mungu Dam, whose reservoir covers some 140 km2 (Røhr andKillingtveit, 2002). The flow into the reservoir is thought to be 43.37 m3/s(TANESCO, 1994). As the river leaves the reservoir, it becomes the Pangani, andthereafter flows for 432 km before emptying into the Indian Ocean, where it dis-charges some 0.85 km2 of water annually (Vanden Bossche and Beracsek, 1990).
Within the Pangani River Basin (PRB), Mt. Kilimanjaro is the single most importanthydrological feature (Lambrechts et al., 2002). As mentioned earlier, rainfall on themountain is estimated to provide 60% of the inflow to the Nyumba ya Mungu (NYM)Reservoir, and 55% of the PRB’s surface water (Røhr and Killingtveit, 2002). Also ofimportance - although unquantified - is water derived from melting glaciers on themassif. Melt from the mountain’s glaciers recharge the main spring in Kenya’s fa-mous Amboseli National Park. The melt also recharges springs upon which Kenya’sNol Turesh Water Supply scheme relies, and which supplies water to several majorKenyan towns, including Machakos and Kajiado.
The PRB’s water supply is mainly derived from rainfall, which is very unevenly dis-tributed within the Basin. On average, the Basin receives 34,773.4 m3 annually, andits average yearly potential evapotranspiration is 1,410 mm. Based on rainfall differ-ences within the Basin, the PRB may be divided into two hydrological regimes.
Box 5: Pangani River Basin water and wetland basics
• The highland areas of the Pangani River Basin (PRB) receive markedly more rainfallthan do the lowlands. Hence, agriculture is concentrated in the highlands, while thelowlands are better suited for pastoralism.
• Most of the Pangani River’s water is derived from rainfall and glacial melt.
• Most of the water to flow into the Nyumba ya Mungu (NYM) reservoir is derivedfrom Mt. Kilimanjaro. Virtually all of the rest is derived from Mt. Meru and the NorthPare Mountains.
• The greatest use of water in the Basin is for irrigation. Electricity generation andfishing are important additional uses, as are urban and industrial demands.
• The PRB has large wetland resources, including Lakes Jipe and Chala and the NYMreservoir. All of these support fisheries. The Basin contains considerable swamp re-sources, although little is known about their biodiversity or their hydrological contri-butions.
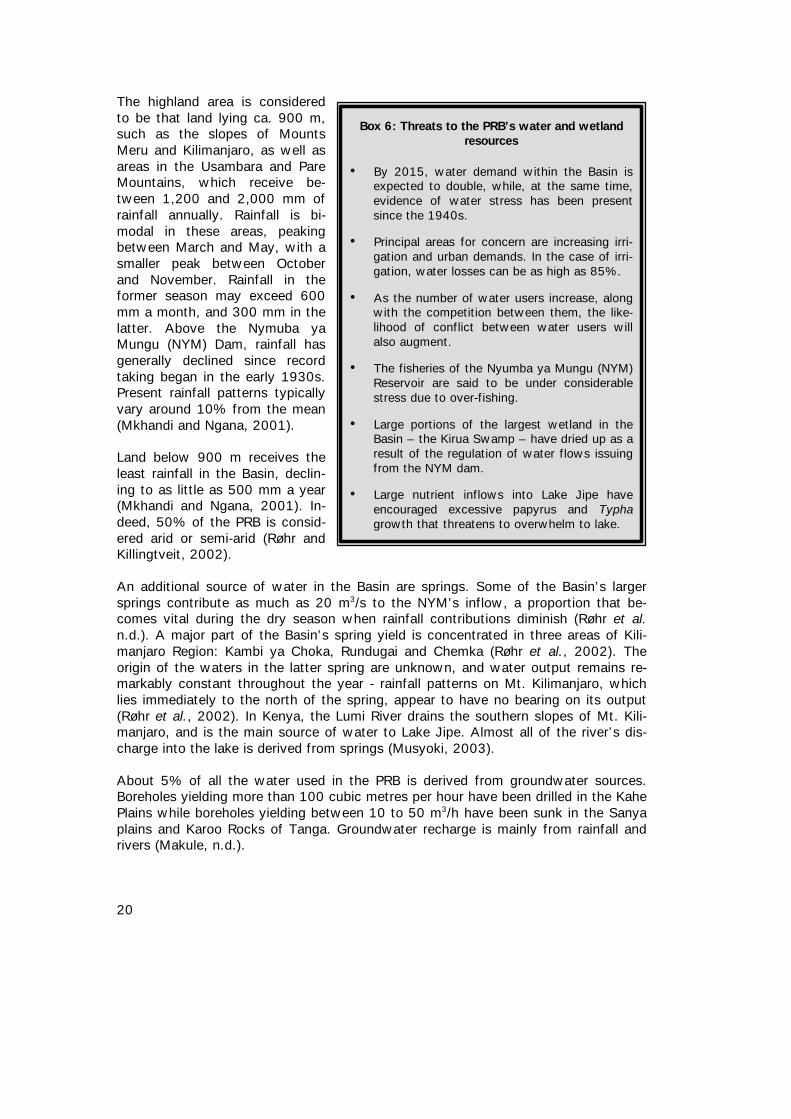
20
The highland area is consideredto be that land lying ca. 900 m,such as the slopes of MountsMeru and Kilimanjaro, as well asareas in the Usambara and PareMountains, which receive be-tween 1,200 and 2,000 mm ofrainfall annually. Rainfall is bi-modal in these areas, peakingbetween March and May, with asmaller peak between Octoberand November. Rainfall in theformer season may exceed 600mm a month, and 300 mm in thelatter. Above the Nymuba yaMungu (NYM) Dam, rainfall hasgenerally declined since recordtaking began in the early 1930s.Present rainfall patterns typicallyvary around 10% from the mean(Mkhandi and Ngana, 2001).
Land below 900 m receives theleast rainfall in the Basin, declin-ing to as little as 500 mm a year(Mkhandi and Ngana, 2001). In-deed, 50% of the PRB is consid-ered arid or semi-arid (Røhr andKillingtveit, 2002).
An additional source of water in the Basin are springs. Some of the Basin’s largersprings contribute as much as 20 m3/s to the NYM’s inflow, a proportion that be-comes vital during the dry season when rainfall contributions diminish (Røhr et al.n.d.). A major part of the Basin’s spring yield is concentrated in three areas of Kili-manjaro Region: Kambi ya Choka, Rundugai and Chemka (Røhr et al., 2002). Theorigin of the waters in the latter spring are unknown, and water output remains re-markably constant throughout the year - rainfall patterns on Mt. Kilimanjaro, whichlies immediately to the north of the spring, appear to have no bearing on its output(Røhr et al., 2002). In Kenya, the Lumi River drains the southern slopes of Mt. Kili-manjaro, and is the main source of water to Lake Jipe. Almost all of the river’s dis-charge into the lake is derived from springs (Musyoki, 2003).
About 5% of all the water used in the PRB is derived from groundwater sources.Boreholes yielding more than 100 cubic metres per hour have been drilled in the KahePlains while boreholes yielding between 10 to 50 m3/h have been sunk in the Sanyaplains and Karoo Rocks of Tanga. Groundwater recharge is mainly from rainfall andrivers (Makule, n.d.).
Box 6: Threats to the PRB’s water and wetlandresources
• By 2015, water demand within the Basin isexpected to double, while, at the same time,evidence of water stress has been presentsince the 1940s.
• Principal areas for concern are increasing irri-gation and urban demands. In the case of irri-gation, water losses can be as high as 85%.
• As the number of water users increase, alongwith the competition between them, the like-lihood of conflict between water users willalso augment.
• The fisheries of the Nyumba ya Mungu (NYM)Reservoir are said to be under considerablestress due to over-fishing.
• Large portions of the largest wetland in theBasin – the Kirua Swamp – have dried up as aresult of the regulation of water flows issuingfrom the NYM dam.
• Large nutrient inflows into Lake Jipe haveencouraged excessive papyrus and Typhagrowth that threatens to overwhelm to lake.
21
As the Pangani leaves the Nyumba ya Mungu Reservoir, the following demands areplaced upon it (Mujwahuzi, 2001):
Firm flow for power production: ....... 24 m3/sIrrigation .......................................... 7m3/sDomestic uses ............................. 1–2 m3/sTotal: ......................................32–33 m3/s
Sarmett (pers. comm.) states, however, that the NYM is rarely able to release morethan 22 m3/s.
The NYM Reservoir is the largest water body in the Basin. There are three others:Lake Ambussel, and, lying on Tanzania’s border with Kenya, Lakes Chala and Jipe.These lakes feature prominently in the irrigation and hydrological planning of Kenya'sTaita-Taveta District, in which they lie. Lake Jipe's water level and surface area varysubstantially with rainfall. Thus, its surface area varies from 18 km2 (1954) to 28km2 (1947), while the amount of water contained within it varies from 20 to 60MCM (Musyoki and Mwandotto, 1999). Within the Kenyan portion of Lake Jipe'scatchment lies part of Tsavo West National Park, 48.5 km2 of swamp, 435 km2 ofsisal estates and 196.5 km2 of what is described as 'public land' set aside for theLake Jipe Settlement Scheme (Musyoki and Mwandotto, 1999). An estimated300,000 tonnes of silt are washed into the lake annually (Musyoki, 2003).
Lake Chala lies in a small volcanic crater on Mt. Kilimanjaro's southern slopes. It isbetween 85 and 90 m. deep, and covers a surface area of about 3.15 km2. It con-tains between 300 - 350 MCM of water (Musyoki and Mwandotto, 1999). Its waterquality is very good, and for this reason is being considered a source for Kenya'sgrowing coastal urban areas. Projected future abstraction rates are for 7 MCM annu-ally (Musyoki, 2003). Its elevated situation means that water may be conveyed bygravity to its destination.
The PRB is thought to have about 90,000 ha of swamp, most of which comprisesthe Kirua Swamps, lying to the south of the Nyumba ya Mungu (NYM) Dam. Thesehave already been severely affected by the Dam’s control of the river’s flow, andlarge areas of the swamp have dried up. Nevertheless, they are still thought to retainlarge amounts of the Pangani River’s water. If the river were ‘trained’ and a canalbuilt through the swamp, an additional 42.4 million m3 would reach downstreamdams annually (IVO – NORPLAN, 1997). The vegetation of these swamplands is de-scribed above as examples of riverine forest.
Other swamplands are the Ruvu Swamp (approx. 35 km2) that lies at the point wherethe Ruvu River exits from Lake Jipe, and a swamp lying in the confluence of theRuvu and Kikuletwa Rivers where they join the NYM. The latter swamp area is saidto cover some 40 km2 (Baker and Baker, 2001).
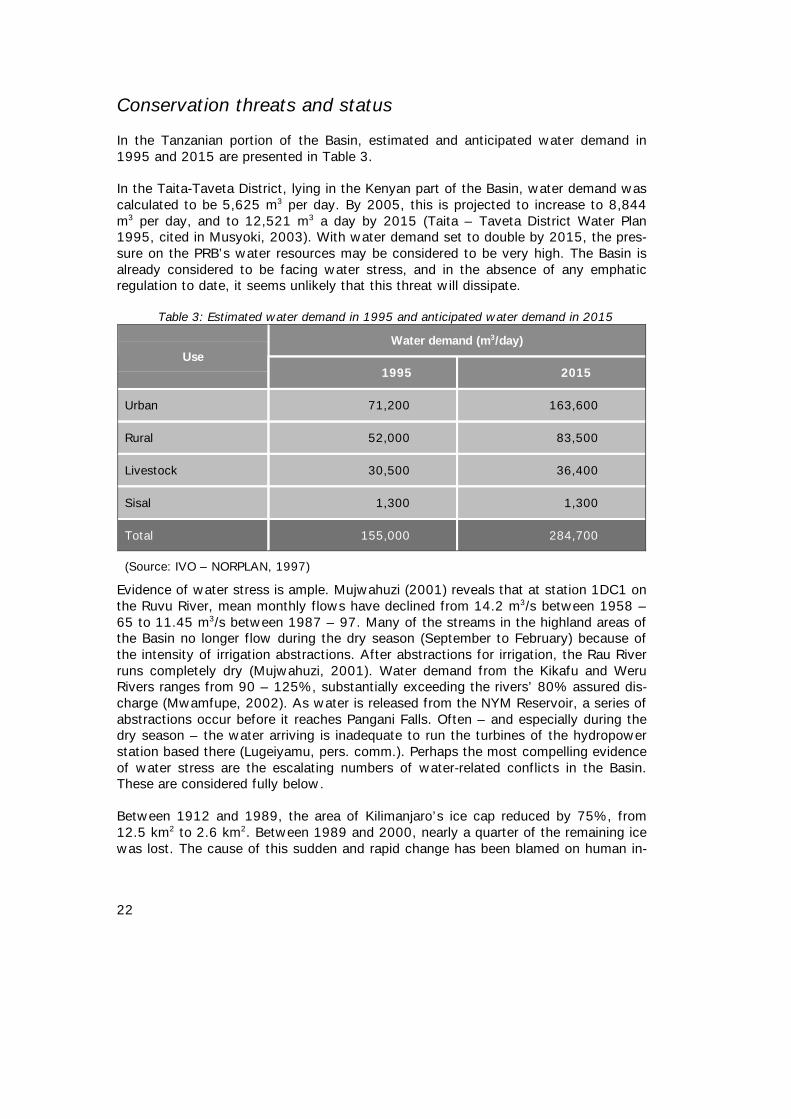
22
Conservation threats and status
In the Tanzanian portion of the Basin, estimated and anticipated water demand in1995 and 2015 are presented in Table 3.
In the Taita-Taveta District, lying in the Kenyan part of the Basin, water demand wascalculated to be 5,625 m3 per day. By 2005, this is projected to increase to 8,844m3 per day, and to 12,521 m3 a day by 2015 (Taita – Taveta District Water Plan1995, cited in Musyoki, 2003). With water demand set to double by 2015, the pres-sure on the PRB’s water resources may be considered to be very high. The Basin isalready considered to be facing water stress, and in the absence of any emphaticregulation to date, it seems unlikely that this threat will dissipate.
Table 3: Estimated water demand in 1995 and anticipated water demand in 2015
Water demand (m3/day)Use
1995 2015
Urban 71,200 163,600
Rural 52,000 83,500
Livestock 30,500 36,400
Sisal 1,300 1,300
Total 155,000 284,700
(Source: IVO – NORPLAN, 1997)
Evidence of water stress is ample. Mujwahuzi (2001) reveals that at station 1DC1 onthe Ruvu River, mean monthly flows have declined from 14.2 m3/s between 1958 –65 to 11.45 m3/s between 1987 – 97. Many of the streams in the highland areas ofthe Basin no longer flow during the dry season (September to February) because ofthe intensity of irrigation abstractions. After abstractions for irrigation, the Rau Riverruns completely dry (Mujwahuzi, 2001). Water demand from the Kikafu and WeruRivers ranges from 90 – 125%, substantially exceeding the rivers’ 80% assured dis-charge (Mwamfupe, 2002). As water is released from the NYM Reservoir, a series ofabstractions occur before it reaches Pangani Falls. Often – and especially during thedry season – the water arriving is inadequate to run the turbines of the hydropowerstation based there (Lugeiyamu, pers. comm.). Perhaps the most compelling evidenceof water stress are the escalating numbers of water-related conflicts in the Basin.These are considered fully below.
Between 1912 and 1989, the area of Kilimanjaro’s ice cap reduced by 75%, from12.5 km2 to 2.6 km2. Between 1989 and 2000, nearly a quarter of the remaining icewas lost. The cause of this sudden and rapid change has been blamed on human in-
23
fluences, although this is by no means clear (Hastenrath and Greischar, 1997). If thisdecline is maintained, the Pangani River Basin’s (PRB’s) will soon receive no morewater from glacial melt.
Lake Jipe’s Typha growth is said to be sufficiently out of control that the waterweed almost completely covers the lake. This trend has apparently arisen as a resultof nutrients and silt washed down off Mt. Kilimanjaro and the North Pare Mountains.Silt has decreased the lake's depth, and occasioned a small water level rise. Nutrientinflows to the lake are thought to have prompted rises in alkalinity and/or sodicty,causing its lilies to disappear. Silting also affects the NYM reservoir, but this is ap-parently not yet a problem given the reservoir’s very large ‘dead storage’ area.
As discussed earlier, the regulation of the Pangani River has reduced flooding in theKirua Swamps, and hence large areas of the swamp have dried out. At a water re-lease rate of 25 m3/s from NYM, the swamp floods, but farmers encroaching upon itthen voice serious complaint (Ngula, pers. comm.).
The NYM reservoir supports a substantial fishery that is heavily exploited, as will bediscussed further below.
B.4 Protected areas
In Tanzania, the Pangani River Basin (PRB) contains one wildlife reserve (Mkomazi -3,276 km2), while parts of the Kilimanjaro (756 km2) and Arusha (137 km2) NationalParks also lie within the Basin. Part of Kenya's Tsavo West National Park (9,065km2) also falls within the Basin, and is contiguous with the Mkomazi Game Reserve.The Sadani National Park partially falls within the Basin, but will not be dealt withhere. Arguably, forest reserves are also protected areas, but these are not dealt withhere (see above). All of these make valuable contributions to Tanzania’s economy byattracting tourists. Kilimanjaro in particular draws some 67,000 visitors annually(WCMC, 1987).
Mt. Kilimanjaro is the world’s highest freestanding mountain and Africa’s tallest. Itrises 5,000 metres above an open undulating plain that averages 800 m ASL (Lam-brechts et al., 2002). The park is the oldest protected area in Africa, having gainedthis status in the early part of the 20th Century. In 1921, the park was gazetted as aforest reserve, and then, in 1973, the area above the 2,700 metre contour was re-classified as a national park. At present, the park covers 75,353 ha and is sur-rounded by a 107,828 ha forest reserve (Lambrechts et al., 2002). In 1987, theKilimanjaro National Park was inscribed on the World Heritage Site list, the seventhTanzanian World Heritage Site (Lambrechts et al., 2002).
The Mkomazi Wildlife Reserve is an extension of Kenya’s Tsavo West National Park.Like Tsavo and Arusha National Parks, Mkomazi lies within the Somali – Maasai Re-gional Centre of Endemism (RCE). It stretches from the Tanzania – Kenya border tothe foothills of the Pare and the West Usambaras. The reserve is characterised bysavannah woodland, and, until 1988, pastoralists of various ethnic origins were al-
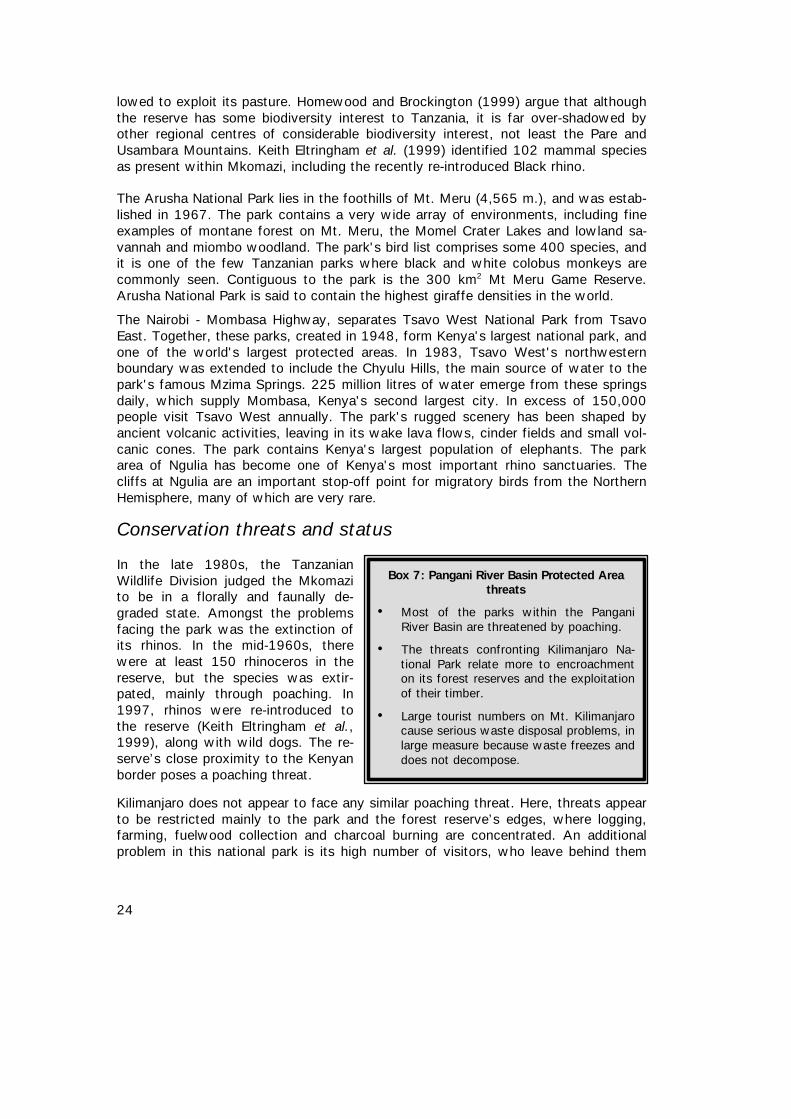
24
lowed to exploit its pasture. Homewood and Brockington (1999) argue that althoughthe reserve has some biodiversity interest to Tanzania, it is far over-shadowed byother regional centres of considerable biodiversity interest, not least the Pare andUsambara Mountains. Keith Eltringham et al. (1999) identified 102 mammal speciesas present within Mkomazi, including the recently re-introduced Black rhino.
The Arusha National Park lies in the foothills of Mt. Meru (4,565 m.), and was estab-lished in 1967. The park contains a very wide array of environments, including fineexamples of montane forest on Mt. Meru, the Momel Crater Lakes and lowland sa-vannah and miombo woodland. The park's bird list comprises some 400 species, andit is one of the few Tanzanian parks where black and white colobus monkeys arecommonly seen. Contiguous to the park is the 300 km2 Mt Meru Game Reserve.Arusha National Park is said to contain the highest giraffe densities in the world.
The Nairobi - Mombasa Highway, separates Tsavo West National Park from TsavoEast. Together, these parks, created in 1948, form Kenya's largest national park, andone of the world's largest protected areas. In 1983, Tsavo West's northwesternboundary was extended to include the Chyulu Hills, the main source of water to thepark's famous Mzima Springs. 225 million litres of water emerge from these springsdaily, which supply Mombasa, Kenya's second largest city. In excess of 150,000people visit Tsavo West annually. The park's rugged scenery has been shaped byancient volcanic activities, leaving in its wake lava flows, cinder fields and small vol-canic cones. The park contains Kenya's largest population of elephants. The parkarea of Ngulia has become one of Kenya's most important rhino sanctuaries. Thecliffs at Ngulia are an important stop-off point for migratory birds from the NorthernHemisphere, many of which are very rare.
Conservation threats and status
In the late 1980s, the TanzanianWildlife Division judged the Mkomazito be in a florally and faunally de-graded state. Amongst the problemsfacing the park was the extinction ofits rhinos. In the mid-1960s, therewere at least 150 rhinoceros in thereserve, but the species was extir-pated, mainly through poaching. In1997, rhinos were re-introduced tothe reserve (Keith Eltringham et al.,1999), along with wild dogs. The re-serve’s close proximity to the Kenyanborder poses a poaching threat.
Kilimanjaro does not appear to face any similar poaching threat. Here, threats appearto be restricted mainly to the park and the forest reserve’s edges, where logging,farming, fuelwood collection and charcoal burning are concentrated. An additionalproblem in this national park is its high number of visitors, who leave behind them
Box 7: Pangani River Basin Protected Areathreats
• Most of the parks within the PanganiRiver Basin are threatened by poaching.
• The threats confronting Kilimanjaro Na-tional Park relate more to encroachmenton its forest reserves and the exploitationof their timber.
• Large tourist numbers on Mt. Kilimanjarocause serious waste disposal problems, inlarge measure because waste freezes anddoes not decompose.
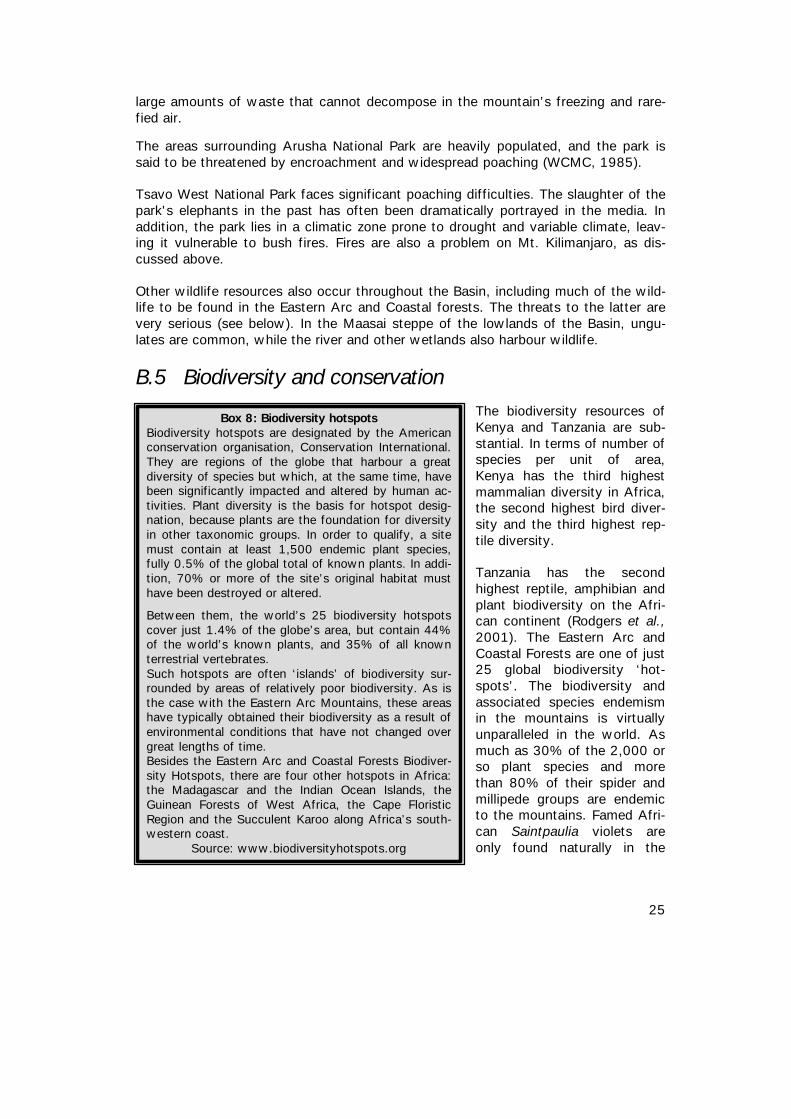
25
large amounts of waste that cannot decompose in the mountain’s freezing and rare-fied air.
The areas surrounding Arusha National Park are heavily populated, and the park issaid to be threatened by encroachment and widespread poaching (WCMC, 1985).
Tsavo West National Park faces significant poaching difficulties. The slaughter of thepark's elephants in the past has often been dramatically portrayed in the media. Inaddition, the park lies in a climatic zone prone to drought and variable climate, leav-ing it vulnerable to bush fires. Fires are also a problem on Mt. Kilimanjaro, as dis-cussed above.
Other wildlife resources also occur throughout the Basin, including much of the wild-life to be found in the Eastern Arc and Coastal forests. The threats to the latter arevery serious (see below). In the Maasai steppe of the lowlands of the Basin, ungu-lates are common, while the river and other wetlands also harbour wildlife.
B.5 Biodiversity and conservationThe biodiversity resources ofKenya and Tanzania are sub-stantial. In terms of number ofspecies per unit of area,Kenya has the third highestmammalian diversity in Africa,the second highest bird diver-sity and the third highest rep-tile diversity.
Tanzania has the secondhighest reptile, amphibian andplant biodiversity on the Afri-can continent (Rodgers et al.,2001). The Eastern Arc andCoastal Forests are one of just25 global biodiversity ‘hot-spots’. The biodiversity andassociated species endemismin the mountains is virtuallyunparalleled in the world. Asmuch as 30% of the 2,000 orso plant species and morethan 80% of their spider andmillipede groups are endemicto the mountains. Famed Afri-can Saintpaulia violets areonly found naturally in the
Box 8: Biodiversity hotspotsBiodiversity hotspots are designated by the Americanconservation organisation, Conservation International.They are regions of the globe that harbour a greatdiversity of species but which, at the same time, havebeen significantly impacted and altered by human ac-tivities. Plant diversity is the basis for hotspot desig-nation, because plants are the foundation for diversityin other taxonomic groups. In order to qualify, a sitemust contain at least 1,500 endemic plant species,fully 0.5% of the global total of known plants. In addi-tion, 70% or more of the site’s original habitat musthave been destroyed or altered.
Between them, the world’s 25 biodiversity hotspotscover just 1.4% of the globe’s area, but contain 44%of the world’s known plants, and 35% of all knownterrestrial vertebrates.Such hotspots are often ‘islands’ of biodiversity sur-rounded by areas of relatively poor biodiversity. As isthe case with the Eastern Arc Mountains, these areashave typically obtained their biodiversity as a result ofenvironmental conditions that have not changed overgreat lengths of time.Besides the Eastern Arc and Coastal Forests Biodiver-sity Hotspots, there are four other hotspots in Africa:the Madagascar and the Indian Ocean Islands, theGuinean Forests of West Africa, the Cape FloristicRegion and the Succulent Karoo along Africa’s south-western coast.
Source: www.biodiversityhotspots.org
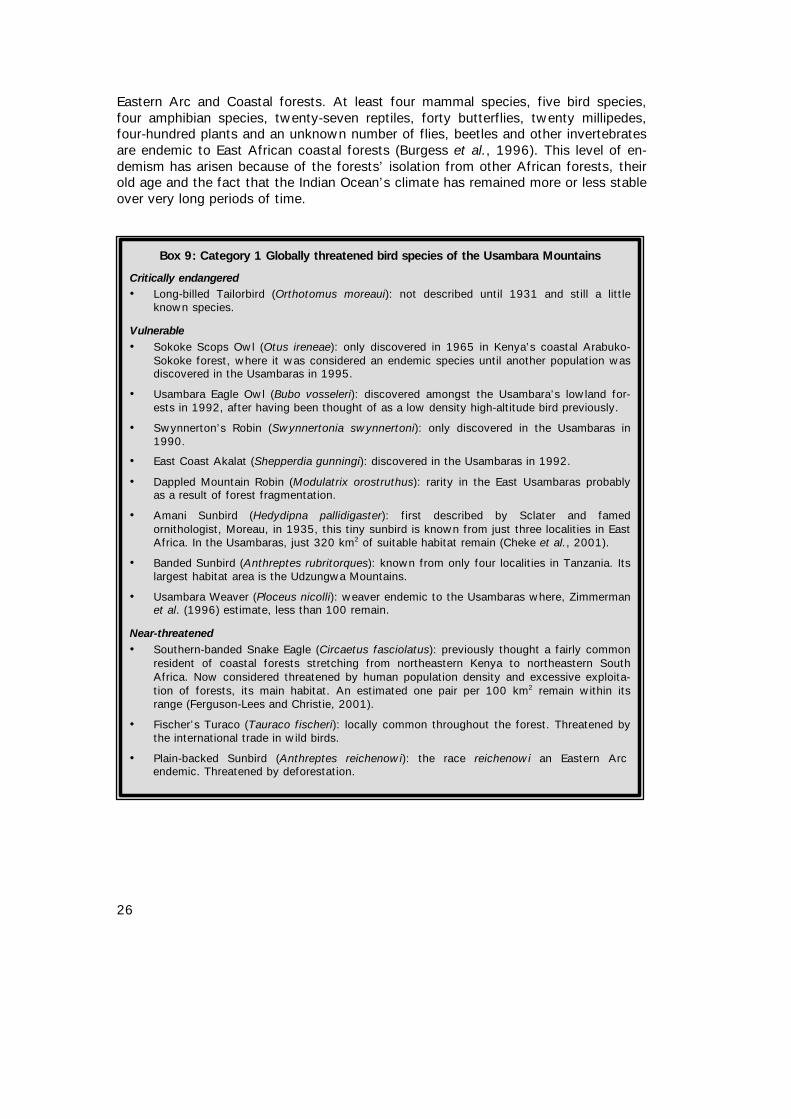
26
Eastern Arc and Coastal forests. At least four mammal species, five bird species,four amphibian species, twenty-seven reptiles, forty butterflies, twenty millipedes,four-hundred plants and an unknown number of flies, beetles and other invertebratesare endemic to East African coastal forests (Burgess et al., 1996). This level of en-demism has arisen because of the forests’ isolation from other African forests, theirold age and the fact that the Indian Ocean’s climate has remained more or less stableover very long periods of time.
Box 9: Category 1 Globally threatened bird species of the Usambara Mountains
Critically endangered• Long-billed Tailorbird (Orthotomus moreaui): not described until 1931 and still a little
known species.
Vulnerable• Sokoke Scops Owl (Otus ireneae): only discovered in 1965 in Kenya’s coastal Arabuko-
Sokoke forest, where it was considered an endemic species until another population wasdiscovered in the Usambaras in 1995.
• Usambara Eagle Owl (Bubo vosseleri): discovered amongst the Usambara’s lowland for-ests in 1992, after having been thought of as a low density high-altitude bird previously.
• Swynnerton’s Robin (Swynnertonia swynnertoni): only discovered in the Usambaras in1990.
• East Coast Akalat (Shepperdia gunningi): discovered in the Usambaras in 1992.
• Dappled Mountain Robin (Modulatrix orostruthus): rarity in the East Usambaras probablyas a result of forest fragmentation.
• Amani Sunbird (Hedydipna pallidigaster): first described by Sclater and famedornithologist, Moreau, in 1935, this tiny sunbird is known from just three localities in EastAfrica. In the Usambaras, just 320 km2 of suitable habitat remain (Cheke et al., 2001).
• Banded Sunbird (Anthreptes rubritorques): known from only four localities in Tanzania. Itslargest habitat area is the Udzungwa Mountains.
• Usambara Weaver (Ploceus nicolli): weaver endemic to the Usambaras where, Zimmermanet al. (1996) estimate, less than 100 remain.
Near-threatened• Southern-banded Snake Eagle (Circaetus fasciolatus): previously thought a fairly common
resident of coastal forests stretching from northeastern Kenya to northeastern SouthAfrica. Now considered threatened by human population density and excessive exploita-tion of forests, its main habitat. An estimated one pair per 100 km2 remain within itsrange (Ferguson-Lees and Christie, 2001).
• Fischer’s Turaco (Tauraco fischeri): locally common throughout the forest. Threatened bythe international trade in wild birds.
• Plain-backed Sunbird (Anthreptes reichenowi): the race reichenowi an Eastern Arcendemic. Threatened by deforestation.
27
As a result, the threats that many of these species face relate to the preservation oftheir environment. Because so much of the Eastern Arc and Coastal Forest is threat-ened, many of their animal species are considered endangered (see box below).
On Mt. Kilimanjaro, 2,500 species of plants have been recorded, including 130 treespecies from 100 genera and 50 families. 170 shrub species have been identifiedfrom the mountain’s forests, and these belong to over 100 genera and 40 families(Lambrechts et al. 2002). Some 140 mammal species are recorded from the moun-tain, including the world’s largest known population of Abbot’s duiker, a globallythreatened species (Lambrechts et al., 2002). The park contains an endemic shrew,four endemic species and subspecies of butterfly, six endemic plants, twelve en-demic mosses and liverworts (Baker and Baker, 2001).
A rare and endangered bull shark (Carcharrhinus leucas) occasionally swims up thePangani River from its delta, and has been seen as far up its course as Jambe(TANESCO, 1994). Besides the shark, however, none of the river’s 41 species offish are thought to be endangered. It does contain several endemics, comprising twocyprinids (Barbus paegnstecheri and Labeo coubie), one characin (Rhabdalestes lele-upi) and three cichlids (Ctenochromis pectoralis, Oreochromis korogwe and O. pan-gani) (TANESCO, 1994).
The tilapia genus, Oreochromis, derives its name from the Latin for ‘mountain chro-mis’, which Gunther gave it in 1889 after discovering Oreochromis hunterti in LakeChala, on the slopes of Mt. Kilimanjaro (Dadzie et al. 1988). In Lake Jipe, an addi-tional two endemic tilapia are to be found: Tilapia jipe and T. girigan. O. esculentus,a Lake Victoria endemic4, has been introduced to the basin and comprises a substan-tial part of the catch in Nyumba ya Mungu Reservoir. An additional exotic, T. rendalii,has been collected from Lake Chala.
Conservation threats and status
The primary threats facing the biodiversity of the Pangani River Basin (PRB) relate tohabitat destruction. The very high levels of endemism typically equate with the highlevels of unique and diverse habitat types in the Basin, particularly its Afromontaneand coastal forests. For example, virtually all of the Basin’s endemic bird species arealso considered restricted range species, making them extremely vulnerable to habi-tat destruction and fragmentation.
Fears for the destruction of these valuable forest habitats have ensured that Tanza-nia’s coastal forests and Eastern Arc Mountains have received international attention.Virtually all of them hold Important Bird Area (IBA) status (Baker and Baker, 2001),serving to focus international conservation attention on these delicate and very vul-nerable ecosystems. Nevertheless, very few of the PRB’s Eastern Arc or Coastal for-ests are anything but forest reserves.
4 In a curious twist of fate, this species is now extinct from Lake Victoria.
28
B.6 FisheriesFisheries are often a vital source of animal protein to rural African communities, In1970, the NYM fishery supported 3,161 fishers, who landed 28,509 tonnes of fishbetween them. By 1983, there were 1,342 fishers, who managed to land just 2,430tonnes of fish (Vanden Bossche and Bernacsek, 1999).
Typha and papyrus cover almost half of Lake Jipe’s surface, and has almost haltedfishing activities on the Tanzanian side of the lake (Sarmett and Kamugisha, 2002).On the Kenyan side of Lake Jipe, some 200 villagers in three villages are said to relyon the lake’s fisheries. Besides problems associated with water weed, the siltation ofthe lake is also a threat to the fishery (Musyoki, 2003).
Villagers around the Kirua Swamp downstream of the NYM dam complain of fish de-clines due to the regulation of water flow from the dam (Sarmett and Kamugisha,2002).
B.7 SoilsMost of the Pangani River Basin comprises a crystalline and limestone geological se-ries, along with patches of lacustrine deposits. Closer to the coast, the geology isone of fluvial and estuarine deposits. Areas close to Mt. Meru and Mt. Kilimanjaro aretypically highly fertile alkaline volcanics (Geological Survey, 1960). This combinationof soils of lacustrine and volcanic origin, as well as areas of high average annual rain-fall mean that parts of the Pangani River Basin have come to be seen as the 'bread-basket' of Tanzania.
The principal concerns regarding the soils of the Pangani River Basin (PRB) are reduc-tion to soil fertility, and soil loss to erosion. Stoorvogel and Smaling (1990) estimatedthat arable Tanzania soils lost 27 kg of N, 9 kg of P2O2 and 21 kg of K2O per hectareper annum in 1983. They predicted that, by 2000, these rates of loss would increaseto 32 kg of N, 12 kg of P2O2 and 25 kg of K2O per hectare per annum if the nutrientlosses observed in 1983 were not reversed. For nitrogen and phosphorous, theserates of loss are equivalent to 251,448 tonnes and 115,112 tonnes per annum re-spectively. Losses, Stoorvogel and Smaling claimed, were due to three factors: first,the normal harvest of the crop, through which most nutrients are lost. Second,through the removal of crop residues. For example, when beans are harvested inArumeru District in the Arusha region, the whole plant is removed from the ground.Third, through erosion, particularly as a result of cultivation of steep slopes (Kaihuraet al. 2001). It should be noted that not all agriculture within the Pangani River Basinis deleterious (Kaihura et al. 2001).
B.8 Summary of pointsThe resources of the Pangani River Basin (PRB) are all heavily exploited. In this sec-tion, we first briefly summarise the important contributions that these resourcesmake to the PRB and, in the second part, summarise the threats to them.
29
PRB resources• Forests play a crucial role in the PRB’s hydrology, serving to regulate water run
off, minimise erosion, store and purify water. In the PRB, they also make a vitalcontribution to global biodiversity. In the PRB’s forests some of the world’s high-est levels of species endemism and biodiversity are to be found.
• Water in the PRB is integral to the Basin’s agricultural economy, its power gen-eration, its urban, industrial and domestic demands and to livestock. Swamps arealso common in the Basin and play a vital role in water retention and regulation.
• The Basin contains four Protected Areas (PAs). Kilimanjaro, in particular, plays animportant role in the nation’s tourism economy, and also harbours a wide array ofplant and animal species.
• The Basin’s biodiversity is almost unparalleled globally, and the centre of a greatdeal of international interest and conservation concerns.
• The PRB’s fisheries make important nutritional and economic contributions to theBasin’s rural communities.
• Soils are at the heart of the Basin's agricultural economy. The area's history ofvolcanic activity and patches of fertile lacustrine deposits, contribute to the Pan-gani River Basin's reputation of being the breadbasket of Tanzania.
Threats to the PRB’s resources• The Basin’s forests are threatened by logging, encroachment along their periph-
eries, demands for land, charcoal manufacture and fuelwood collection.• The Basin’s water supplies are threatened by extremely high demands that have
ensured that its water resources are considered ‘stressed’. The main sources ofdemand are inefficient furrow-based irrigation systems. The Basin’s swamps arethreatened by the regulation of water by damming.
• The Basin’s PAs are threatened, on the one hand, by poaching, and, on the otherhand, by threats similar to those faced by forest resources.
• Most of the Basin’s biodiversity has been gained as a result of its unique array offorest habitat types. Threats to biodiversity, as a result, arise because of threatsto habitat.
• The fisheries of the PRB are threatened by excessive fishing pressure, and weedgrowth occasioned by high nutrient loads.
• Low levels of nutrient return and inputs, as well as high rates of erosion, threatenthe Basin’s soils.
30
C The socio-economy of thePangani River Basin
C.1 Overview
There are an estimated 3.7 million people in the PRB, 80% of whom rely, either di-rectly or indirectly, on agriculture for their livelihoods. 90% of the Basin’s populationlive in its upper parts. This settlement concentration yields population densities of upto 300 people per km2. In the highland areas of Kilimanjaro there are some 900 peo-ple per km2 with average farm holdings of just 0.2 ha per household. In lowland ar-eas at the same time, there were only 65 people per km2, and each householdfarmed an average area of 10.4 ha. (Lein, 2002).
The Basin’s urban and industrial economies are not sufficiently large to absorb thislabour force. As a result, its burgeoning population seeks livelihoods in agriculture, alarge part of which is irrigated. As the number of claims on water increase, so too dothe number of conflicts. Demands for access to water are symptomatic of wider de-mands for access to a whole variety of resources, including land, forest products,pasture, mineral deposits and, ultimately, livelihoods. A livelihood may be describedas follows:
“...a means of securing a living...Encompassed in a livelihood is the totality of re-sources, activities and products which go to securing a living. It relies on owner-ship of, or access to products or income-generating activities. A livelihood ismeasurable in terms of both stocks – that is the reserves and assets – and theflows of food and cash” (Conway and Barbier, 1990: 117).
The notion of access to resources is the most important factor in determiningwhether or not the pursuit of a livelihood is successful (cf. Ellis, 2000). It follows,then, that where a resource on which a community relies becomes scarce, then ac-cess to it is curtailed. As resources become ever more scarce, then the measuresthat people will adopt to try and procure resources may become increasingly moredesperate, and more difficult for the resource concerned to sustain. This trend maythen reach a point where the pursuit of livelihoods actually starts to undermine theability of a resource to regenerate itself.
A factor that serves to amplify the problems associated with livelihood claims is ifthe resources involved are Common Property Resources (CPRs). These are resourcesthat share two fundamental characteristics: (a) they are ‘subtractable’. The subtrac-tion of a unit of water upstream yields a unit less of water downstream. Equally, afisherman landing 100 kg of fish ensures that there is 100 kg less fish for others tocatch. (b) It is difficult or impossible to ‘fence off’ CPRs. ‘Fencing off’ metaphoricallyrefers to the serious problems of policing CPRs. Due to their nature, CPRs (such asoceans, the atmosphere or river courses) cannot be fenced off. They are also re-
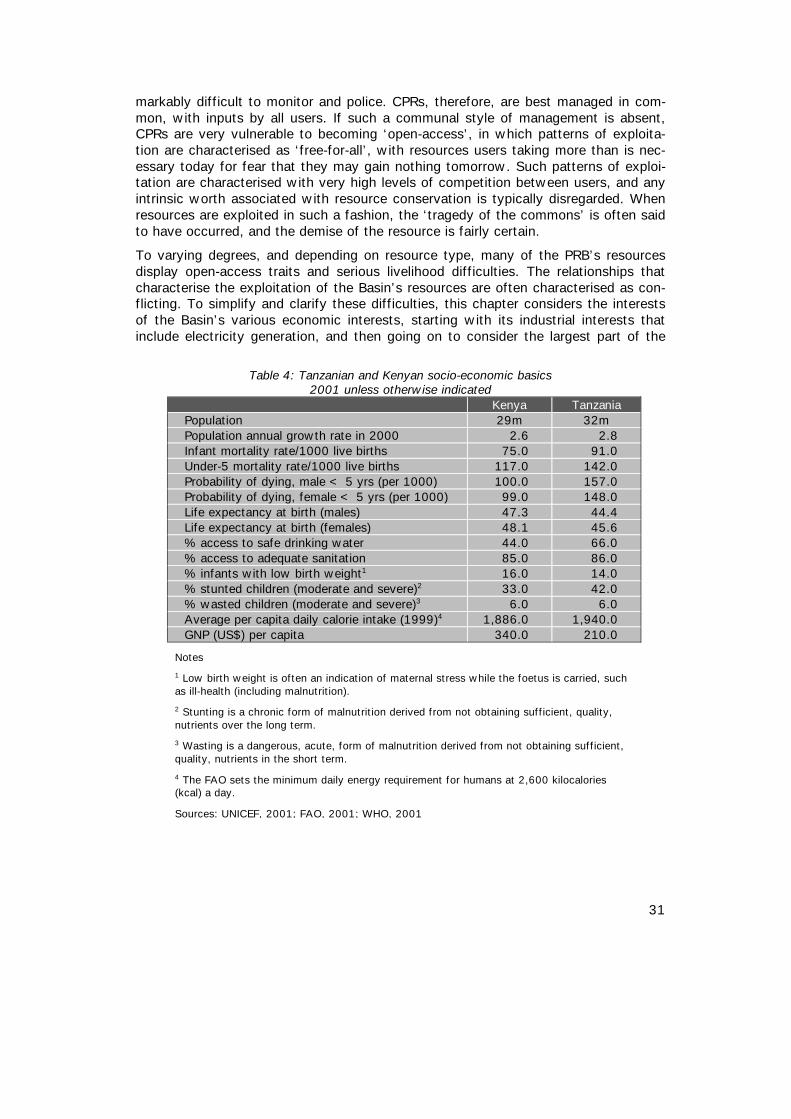
31
markably difficult to monitor and police. CPRs, therefore, are best managed in com-mon, with inputs by all users. If such a communal style of management is absent,CPRs are very vulnerable to becoming ‘open-access’, in which patterns of exploita-tion are characterised as ‘free-for-all’, with resources users taking more than is nec-essary today for fear that they may gain nothing tomorrow. Such patterns of exploi-tation are characterised with very high levels of competition between users, and anyintrinsic worth associated with resource conservation is typically disregarded. Whenresources are exploited in such a fashion, the ‘tragedy of the commons’ is often saidto have occurred, and the demise of the resource is fairly certain.
To varying degrees, and depending on resource type, many of the PRB’s resourcesdisplay open-access traits and serious livelihood difficulties. The relationships thatcharacterise the exploitation of the Basin’s resources are often characterised as con-flicting. To simplify and clarify these difficulties, this chapter considers the interestsof the Basin’s various economic interests, starting with its industrial interests thatinclude electricity generation, and then going on to consider the largest part of the
Table 4: Tanzanian and Kenyan socio-economic basics2001 unless otherwise indicated
Kenya TanzaniaPopulation 29m 32mPopulation annual growth rate in 2000 2.6 2.8Infant mortality rate/1000 live births 75.0 91.0Under-5 mortality rate/1000 live births 117.0 142.0Probability of dying, male < 5 yrs (per 1000) 100.0 157.0Probability of dying, female < 5 yrs (per 1000) 99.0 148.0Life expectancy at birth (males) 47.3 44.4Life expectancy at birth (females) 48.1 45.6% access to safe drinking water 44.0 66.0% access to adequate sanitation 85.0 86.0% infants with low birth weight1 16.0 14.0% stunted children (moderate and severe)2 33.0 42.0% wasted children (moderate and severe)3 6.0 6.0Average per capita daily calorie intake (1999)4 1,886.0 1,940.0GNP (US$) per capita 340.0 210.0
Notes
1 Low birth weight is often an indication of maternal stress while the foetus is carried, suchas ill-health (including malnutrition).
2 Stunting is a chronic form of malnutrition derived from not obtaining sufficient, quality,nutrients over the long term.
3 Wasting is a dangerous, acute, form of malnutrition derived from not obtaining sufficient,quality, nutrients in the short term.
4 The FAO sets the minimum daily energy requirement for humans at 2,600 kilocalories(kcal) a day.
Sources: UNICEF, 2001; FAO, 2001; WHO, 2001
32
Basin’s economy, its agriculture. Other interests are also considered in turn, and theChapter culminates with an assessment of the conflicts that characterise exploitationin this Basin.
C.2 Industrial interests
Probably the largest industrial interest in the Pangani River Basin (PRB) is power gen-eration. The main supplier in this regard is the state-owned Tanzania Electric SupplyCo. [sic.] (TANESCO), which owns four hydropower facilities on the Pangani River.These are Nyumba ya Mungu (NYM) (with an 8 MW capacity), Hale (21 MW), NewPangani Falls (45 MW) and Old Pangani (17.5 MW), a total installed capacity of 91.5MW. All the power plants are connected to the national grid and they contributeabout 17% to the total hydropower production of the country (Ngula, 2002). Thefirm discharge through the power plants is about 24 m3/s, whereas the maximumdesigned discharge is 45 m3/s. Old Pangani operates only occasionally, crippled bylack of adequate water (Lugeiyamu, pers. com.).
In the dry season, water shortages may cause power generation within the basin todrop to as low as 32 MW (Sarmett and Kamugisha, 2002).
There are extensive mining interests in the Pangani River Basin. These include tinmining in Korogwe, tanzanite and phosphate mines in the Arusha Region, and lime-stone mines in the Tanga Region (Mkuula, 1993). Genstones are also an importantquest, and 80% of the world’s known tanzanite reserves are to be found at Merelani,100 km northeast of Arusha. Sand mining for building purposes is common alongriverbanks, and in Kenyan parts of the Basin, ruby mining is carried out.
Other industry within the basin is that associated with farming, such as sugar refin-eries and sisal processing plants. In Kenya’s Taita – Taveta District, sisal productionis the main agricultural activity.
C.3 Farming interests
The Chagga peoples have lived on Mt. Kilimanjaro’s slopes for between 300 – 450years. Their farmland is divided into two types of tenure. The first is 'shamba’, and istypically restricted to the lower slopes of the mountain where rainfall is much lessreliable, and irrigation commensurately more important. The use of shamba land wasoverseen by Chagga chiefs, who would allocate parcels of land to farmers on a sea-sonal basis. While a farmer might exploit the land for a long period of time, it wasnever his to own (Johnston, 1946). The second type of Chagga land tenure is the‘kihamba’, which was set aside for the private use of Chagga denizens. Kihamba was– and still is – farmed with remarkable intensity. Even in the 1940s, at the time ofJohnston’s (1942) writing, there was very little kihamba land left that could be usedas pasture, and most livestock was stall-fed. In those areas where farming intensitiesbecame too high, and no additional kihamba land was available, Chagga chiefs wereobliged to convert shamba land to kihamba. In effect, this gesture served to siphon
33
off excess farming from the upper slopes to the lower slopes of the mountain. TheChagga could not expand up the mountain because this was already set aside as for-est reserve, and they could not expand into the middle slope areas because this was‘alienated’ land for European settlers (Lein, 2002).
Against this background of high farming intensity, the Chagga devised furrow sys-tems to deliver water from natural watercourses to their crops. This system is said tobe one of the oldest (thought to have started in the 18th Century (Gillingham, 1999))and most extensive furrow-based irrigation systems in Africa (Røhr et al. n.d.). Toobtain such furrow water, a Chagga had to be a member of a furrow board, whichwas governed by furrow elders whose instructions farmers had to follow on pain offines or prohibition from using furrow water (Johnston, 1946). Furrow board mem-bers were also expected to play a part in the maintenance of the furrows. Furrowmembers who abstracted water from furrows owned by individuals or claims had topay fees to do so.
Despite the apparent farming intensity and population pressure on kihamba land, tra-ditional institutions of governance and conflict prevention appear to have been effec-tive. Johnston (1942) commented that “…it is remarkable that, with a big and com-plicated furrow system in the kihamba land, so well are matters run by the furrowelders, that the number of cases arising out of disputes over water rights are rela-tively few” (p. 4).
Further to the south, farming intensities in the Usambaras were also proving prob-lematic to colonial observers. “The necessity for the natives to cultivate perpetuallyon hillsides makes soil erosion an acute problem, and large tracts of land…are badlyeroded” (Dobson, 1940: 3). The Sambaa faced similar problems to the Chagga. Themiddle-slope areas of the mountains possessed a climate pleasing to early Germanfarmers, who alienated large tracts of land for sisal farming.
Water amongst the Sambaa was considered communal property, and a person whohad a natural water source upon his land could not prevent outsiders from using it.Landowners could impose fines if livestock damaged their crops, or if the water wasfouled.
Water from furrows, which were in common usage in the early 1940s, belonged tothose who had constructed the furrow (Dobson, 1940). “When the furrow is dug theshamba owners decide amongst themselves who shall have the water and on whichdays” (p. 22). Again, despite apparently heavy farming intensities and populationdensity, water use right disputes appeared to be minimal. “There appear to be sur-prisingly few disputes”, wrote Dobson (1940), “…but in the case of very long fur-rows, the elders generally put in a reliable man to supervise and see that everyonegets their fair share of water and that none is wasted…” (p. 22).
Unlike the Chagga, the Sambaa were very reluctant to descend down the mountainslopes to find alternative sources of farmland. The absence of water user rights dis-putes and the fact that moving into lowland areas was still a matter of choice, sug-
34
gests that farming intensities were not, in 1940, anywhere near as pronounced asthey are today.
The Pangani River Basin (PRB) was, during Tanzania’s colonial period, a core devel-opment area, with large-scale coffee, sisal, wheat and sugar interests becoming es-tablished within the Basin. The demand for labour therefore grew, attracting migrantsfrom all over the country and even as far afield as Rwanda, Burundi and Mozambique(Mbonile, 2002).
It is not clear how much ofthe Pangani River Basin(PRB) is irrigated today. Inthe part of the Basin that liesin Tanzania, Mujwahuzi(2001) estimates that40,000 ha of land are underirrigation, Røhr et al. (n.d.)claim that 29,000 ha areeffectively irrigated, whileNgula (2002) estimates that31,075 ha of the PRB areirrigated (Ngula, 2002).
In the Kenyan portion of thePRB, the single biggest de-mand on Lake Jipe's watersis irrigation. Within the lake'sKenyan watershed, there are10 irrigation schemes cov-ering a combined area of1,717 ha. This area is ex-pected to increase. The LakeJipe Irrigation Scheme will liealong the lake's shoreline, and will cover 77.2 ha. and will require 308 m3 of waterper hour (Musyoki and Mwandotto, 1999). At present, most water is abstracted fromthat portion of the Lumi River that flows through Kenya, along which there are 21water supply schemes. Total abstraction within the Kenyan portion of the lake's ba-sin is 77,274 m3 per day. An additional 54,681 m3 are abstracted during flood peri-ods (Musyoki and Mwandotto, 1999).
According to Ngula (2002) current water demand within the Tanzanian part of theBasin is 807.99 million m3 for 20% irrigation efficiency. Irrigation in the PRB usesbetween 400 and 480 Million Cubic Metres (MCM) of water annually (Mujwahuzi,2001). Distribution of this usage appears to be uneven – with half of the Basin’s wa-ter consumption concentrated around Mt. Kilimanjaro. Here, 500 traditional irrigationfurrows, that, combined, stretch for 1,800 km, draw an estimated 200 MCM annu-ally from the mountain’s rivers (Gillingham, 1999). Røhr et al. (n.d.) refer to workthat indicates that, between 1997 and 2007, for every 1.5% increment to the Ba-
Box 10: Traditional furrow design flaws
According to Mwamfupe (2001), the problems withtraditional furrow design in the PRB are as follows:
• much water is lost at the point of abstraction be-cause of the materials (banana logs) used to divertwater into the irrigation furrows;
• the design of plots is poor – they are not typicallylevelled, causing water to pool, prompting salinisa-tion and low crop yields;
• furrows are poorly constructed with weak banks,causing water to break out.
Additional problems are that farmers often relate theirabstraction size to the amount of land that they have toirrigate, and not to the amount of water that is avail-able. Water abstracted is retained, and in many casesallowed to pool. It is not typical for farmers to con-struct return furrows to the water source. “Tanzanianirrigation systems are just a waste of water” (Nasari,pers. comm.).
35
sin’s population, low season river flow is reduced by 8 m3/s. In the Kilimanjaro Re-gion, 80% of water abstraction is for irrigation (Ngana, 2001). Areas of Hai andMoshi Rural Districts (around Mt. Kilimanjaro) display the highest traditional furrowdensities in Africa (Tagseth, 2002). As a result, erosion rates from Mt. Kilimanjaroare high (Mtalo and Ndomba, 2002). 24 tonnes of soil per hectare of catchmentflows into the Nyumba ya Mungu reservoir every year (Mtalo and Ndomba, 2002).
All of this irrigation is assured by the PRB’s 2,000 traditional furrows (Mujwahuzi,2001), which corresponds, Mwamfupe (2001) says, to 80% of the Basin’s irrigatedarea. This may not be an indication of farming intensity, however. Tagseth (2002),drawing on data for his study area comprising three locations in southern Moshi RuralDistrict, argues that the amount of water abstracted actually declined between 1940and 1993, as did the number of furrows.
The reasons for irrigation are twofold. In the highland areas, average plot sizes arebetween 0.1 and 0.2 ha. Up here, population densities are in the region of 700 –1,000 people per km2 (Mwamfupe, 2001). To compensate for small farm sizes andensure that such land as is available will be as productive as possible, irrigation ispractised. Lower down in the basin, in the traditional ‘shamba’ areas, plot sizes tendto be larger (0.8 – 1.5 ha), and farming less intense (Mwamfupe, 2001). Down here,however, rainfall patterns tend to be irregular, and irrigation is practised to mitigateclimatic vagaries.
It is clear that with such levels of irrigation, upstream water users are more favoura-bly placed than are downstream users. Water shortages are very common within thebasin. Mwamfupe’s (2001) study is drawn from two locations: Makuyuni, on Kili-manjaro’s slopes, and Kahe, lower down in the mountain’s foothills. His respondentssaid that they did not receive enough water for irrigation. The largest proportion ofrespondents – most of whom were from Kahe – blamed this on prolonged drought;followed by those – mainly from Makuyuni – who blamed increased water uses anddemand. Just 7.3% blamed their water supply problems on inefficient furrow design.
It is important to recognise that a large part of the reason why these traditional irriga-tion systems have not changed, despite their inefficiencies, is because of the costsinvolved in obtaining efficient, low-maintenance and durable irrigation alternatives. Itis also important to note that furrow design may yield social and economic benefitsthat outweigh the losses incurred from inefficient water conveyance.
The amount of vegetation cover in the Basin has declined, contributing towards re-duced dry season discharges, and threatening livelihoods. Farmers have responded towater shortages in a number of ways. They have reduced the amount of cotton thatthey grow, preferring to cultivate tomatoes, which have a short growing period and agood market. Mwamfupe (2001) also claims that coffee is being abandoned becauseof fluctuating prices5. Farming households have also, increasingly, sought to diversify
5It should be noted that fluctuations in the global coffee market, as well as markets for other agriculturalgoods, and variable trends in Tanzania's tourist economy, all contribute towards altering the stability ofthe Basin's own economy and influence the ability of its inhabitants to secure adequate livelihoods.
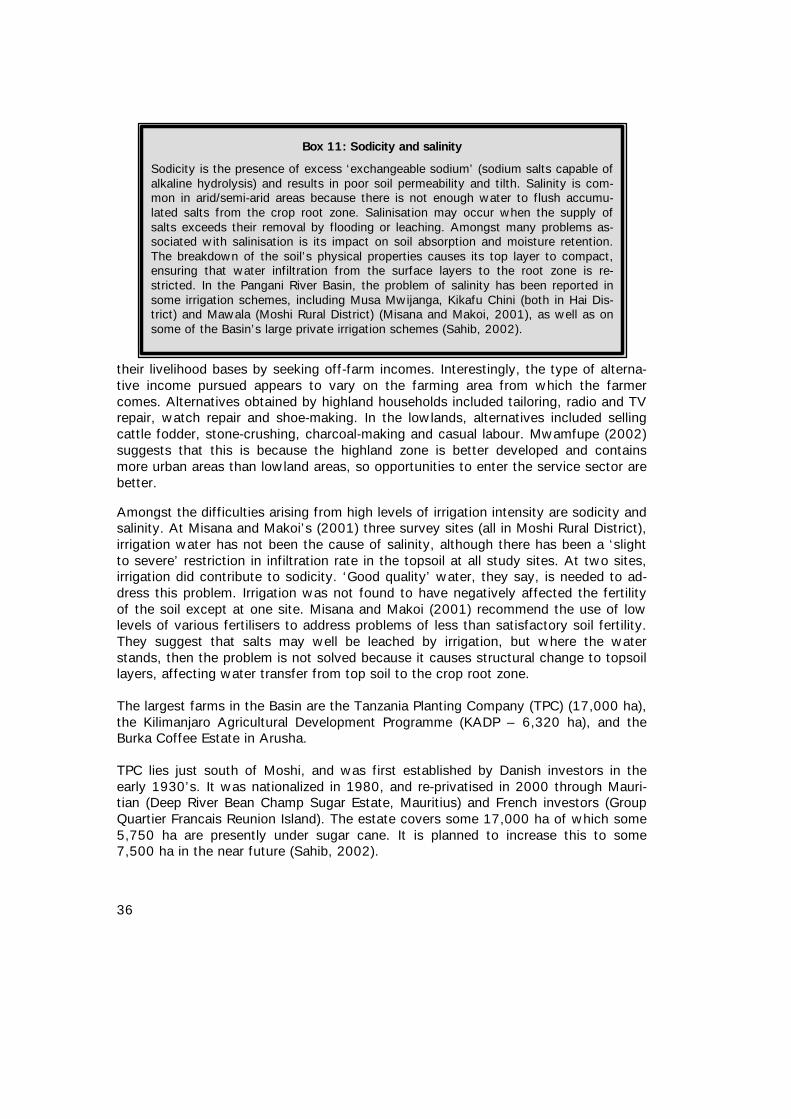
36
their livelihood bases by seeking off-farm incomes. Interestingly, the type of alterna-tive income pursued appears to vary on the farming area from which the farmercomes. Alternatives obtained by highland households included tailoring, radio and TVrepair, watch repair and shoe-making. In the lowlands, alternatives included sellingcattle fodder, stone-crushing, charcoal-making and casual labour. Mwamfupe (2002)suggests that this is because the highland zone is better developed and containsmore urban areas than lowland areas, so opportunities to enter the service sector arebetter.
Amongst the difficulties arising from high levels of irrigation intensity are sodicity andsalinity. At Misana and Makoi’s (2001) three survey sites (all in Moshi Rural District),irrigation water has not been the cause of salinity, although there has been a ‘slightto severe’ restriction in infiltration rate in the topsoil at all study sites. At two sites,irrigation did contribute to sodicity. ‘Good quality’ water, they say, is needed to ad-dress this problem. Irrigation was not found to have negatively affected the fertilityof the soil except at one site. Misana and Makoi (2001) recommend the use of lowlevels of various fertilisers to address problems of less than satisfactory soil fertility.They suggest that salts may well be leached by irrigation, but where the waterstands, then the problem is not solved because it causes structural change to topsoillayers, affecting water transfer from top soil to the crop root zone.
The largest farms in the Basin are the Tanzania Planting Company (TPC) (17,000 ha),the Kilimanjaro Agricultural Development Programme (KADP – 6,320 ha), and theBurka Coffee Estate in Arusha.
TPC lies just south of Moshi, and was first established by Danish investors in theearly 1930’s. It was nationalized in 1980, and re-privatised in 2000 through Mauri-tian (Deep River Bean Champ Sugar Estate, Mauritius) and French investors (GroupQuartier Francais Reunion Island). The estate covers some 17,000 ha of which some5,750 ha are presently under sugar cane. It is planned to increase this to some7,500 ha in the near future (Sahib, 2002).
Box 11: Sodicity and salinity
Sodicity is the presence of excess ‘exchangeable sodium’ (sodium salts capable ofalkaline hydrolysis) and results in poor soil permeability and tilth. Salinity is com-mon in arid/semi-arid areas because there is not enough water to flush accumu-lated salts from the crop root zone. Salinisation may occur when the supply ofsalts exceeds their removal by flooding or leaching. Amongst many problems as-sociated with salinisation is its impact on soil absorption and moisture retention.The breakdown of the soil’s physical properties causes its top layer to compact,ensuring that water infiltration from the surface layers to the root zone is re-stricted. In the Pangani River Basin, the problem of salinity has been reported insome irrigation schemes, including Musa Mwijanga, Kikafu Chini (both in Hai Dis-trict) and Mawala (Moshi Rural District) (Misana and Makoi, 2001), as well as onsome of the Basin’s large private irrigation schemes (Sahib, 2002).
37
Benefiting from only some 450mm rainfall a year, irrigation is a pre-requisite forsugar cane cultivation. The effective crop water deficit has been estimated at aminimum of 1,200 mm/year thus requiring irrigation applications varying between1,500 – 1,900 mm per year depending on the irrigation system and methodology.Roughly half the estate is overhead irrigated, while the remainder is surface furrowirrigated. Rivers lying on the western boundary of the estate provide part of the irri-gation water, the rest being pumped from an underlying aquifer through high deliveryflow boreholes (500 m3/hr) (Sahib, 2002).
In Tanzania, water may only be legally abstracted if users are in possession of a wa-ter right, which, for Pangani Basin, is issued by the Pangani Basin Water Board(PBWB), and priced depending on the use to which the water is to be put. The PBWBhas encountered serious problems implementing the water rights system becausemost small-scale users believe that water is a 'gift from God'. While they wish toabstract water legally, they typically do not believe that they should have to pay todo so. Most large-scale users do, however, pay for water rights (Sarmett, pers.comm.).
C.4 Pastoralist interests
Between 1994 and 1995, livestock contributed some 30% to Tanzania's GDP. Thecountry has an estimated 60 million hectares of land suitable for livestock grazing,and believes it can support some 20 million livestock units. The country has an esti-mated 16 million livestock units at present.
There are few data on the pastoralists of the Pangani River Basin. In 1995, livestockwithin the Basin was estimated to need 30,500 m3 of water a day, while they areexpected to require 36,400 m3/day in 2015 (IVO – NORPLAN, 1997). Current live-stock numbers in the Basin are not known. The most recent figures available to thissurvey come from 2002, and are derived from scattered districts and municipalitiesthroughout the Basin (Table 4).
Table 5: Livestock population in selected areas of the Pangani River Basin (2002)
Region Cattle Shoats* Donkeys
Simanjiro District, Manyara Region 305,075 133,000 11,000
Arusha Municipality & Arumeru District,Arusha Region.
470,000 461,450 21,991
Kilimanjaro Region 568,689 534,420 12,380
Tanga Region 421,261 378,442 Not counted
Taita – Taveta District (Kenya) 37,800 40,277 Not counted
Total 1,765,025 902,972
Source: Various sources. *‘Shoats’ are goats and sheep combined.
38
C.5 Urban interests
The Pangani River Basin (PRB) contains two main urban areas. In the north, and lo-cated relatively close to one another, are Moshi and Arusha. In 1995, urban wateruse from the Basin was estimated to be 71,200 m3/day, and was expected to growto 163,600 m3/day in 2015 (IVO – NORPLAN, 1997). The volumes of water used atpresent, Sarmett and Kamugisha (2002) estimate are low, and no more than 1.1m3/s.
Arusha municipality has a population of between 250,000 and 350,000 (dependingon authority). Although most of the water coming off Mt. Meru is used for irrigationand domestic purposes, the biggest commercial water user is the Arusha Urban Wa-ter and Sanitation Authority (AUWSA). It has 15 boreholes and an average annualcapacity of 7.4 million m3 (Schechambo, 2002). The Authority also taps water fromtwo springs with an average combined annual yield of almost 6.4 million m3
(Schechambo, 2002).
The rivers are also used to dispose of urban waste. Moshi Municipality, Ngana(2001) says disposes sewerage directly into rivers, while Mkuula (1993) claims thatthe rivers Themi (near Arusha), Karanga, Njoro and Rau (near Moshi) are all pollutedby urban-based industrial waste.
C.6 Interventions by NGOs and international organisationsin the PRB
There are large numbers of NGOs operating in the Pangani River Basin (PRB), and farfewer international organisations. In this section, it is understood that these interestsdo not typically make demands upon the PRB’s natural resources, but that their in-terests are often focussed upon Natural Resource Management (NRM), conservationand the development and sustenance of livelihoods. There are far more NGO and in-ternational donor interventions than those considered. Those discussed below mayform the basis for collaborative integrated management activities in the Basin, as willbe discussed in the conclusion.
Non-governmental organisationsPAMOJA is a Tanzanian-based NGO that believes that dialogue is necessary in a con-flict situation. It argues that ‘if the voices of the unofficial and marginalised commu-nity groups are heard and listened to by policy and decision makers, local actors caneffectively contribute to the protection and rehabilitation of water catchments, whilealso increasing the efficiency of economic production and use of water’ (PAMOJA,2002: 3). Mutual agreement, they say, works better than law. Of late, PAMOJA hasincreasingly come under the scrutiny of the Pangani Basin Water Office (PBWO) as apossible route through which dialogue and mutual understanding between the PBWOand the Basin’s water users can be developed.
39
Launched in 1992, the Tanzania Forestry Action Plan (TFAP) Project in the NorthPare Mountains was concerned with a number of serious problems, including highpopulation density, small plot sizes, exhausted soils and alarming levels of forest en-croachment. Using an approach that sought to draw up site-specific managementplans in collaboration with the project area’s communities, it was able to improve soilfertility, reduce surface run-off and stabilise river banks. TFAP also sought to utiliseirrigation systems developed by the Wapare and used by them for centuries. Plotsizes, however, remain small, and the only cash crop cultivated in the area was cof-fee, leading Mndeme (n.d.) to suggest that the development of off-farm income-making opportunities and the diversification of the cash crop base would be neces-sary for the future success of the project (source: Mndeme, n.d.).
The Traditional Irrigation and Environmental Development Organisation (TIP) has beenregistered in Tanzania since 1999. The organisation inherited the assets and tookover the functions of a former 13-year old donor-funded project called the TraditionalIrrigation Programme. As it was with the latter programme, the main focus of TIP isto assist in poverty alleviation and sustaining food security for the small-scale tradi-tional irrigation community in selected areas of Tanzania by improving traditional irri-gation practices. TIP emphasises land use planning as a basis for basin management,and argues that, as an initial starting point, the Basin should be divided into sub-catchments. In each of these, there should be a sub-catchment board comprising rep-resentatives sent by each village within the sub-catchment. Each sub-catchmentboard will send representatives to a Basin water board (Mjata, pers. comm.).
TIP works through Memoranda of Understanding (MOUs) with four Tanzanian dis-tricts: Same and Mwanga in Kilimanjaro Region, Lushoto in Tanga Region and Aru-meru in Arusha Region. It reaches other clients and/or interested partners elsewherethrough contracts and assignments upon request (Mjata, 2002).
The Tanga Coastal Zone Conservation and Development Programme (TCZCDP) haspartnerships with the District Councils of Pangani and Muheza, the Tanga MunicipalCouncil, the Tanga Regional Authority, Irish Aid (donors), and the IUCN (The WordConservation Union) for technical and managerial advice. The overall objective of theTCZCDP is the sustainable use of coastal resources. The programme aims to enhancethe well-being of coastal communities in the region by improving the health of theenvironment that they depend upon and diversifying the options for using the coastalenvironment. The TCZDP started its work in 1987 and its activities are ongoing(Mgongo, 2002).
The Tanzania Coastal Management Partnership (TCMP) is a joint initiative betweenthe National Environmental Management Council (NEMC), the Coastal ResourcesCenter/University of Rhode Island and USAID. The partnership was initiated in 1997to develop and apply a national coastal management framework. This latter frame-work is based on a series of strategies that aim to develop an integrated manage-ment plan for Tanzania’s coastline and to develop sustainable and environmentallyfriendly economic activities in the area (Luhikula, 2002).
40
The Tanzania Forest Conservation Group (TFCG) was established in 1985, and pro-motes the conservation of forests with high biodiversity in Tanzania. The groupcounts amongst its successes lobbying for the creation of the Udzungwa NationalPark, Tanzania’s first rainforest park; the purchase of the Mazumbai Forest in theWest Usambaras for research purposes by the University of Dar es Salaam; and lob-bying for the EU – IUCN/Ministry of Livestock and Agriculture funded East UsambaraConservation and Development Project. Amongst its present activities within the PRBis the development of a Joint Forest Management (JFM) framework for the Amban-gulu Forest (West Usambaras) between local communities, local government and anearby tea estate. Through its work with communities adjacent to the Kambai Forest(West Usambaras), the TFCG has managed to have 600,000 trees planted. AtNgulwi (West Usambaras), the TFCG is trying to afforest denuded slopes and estab-lish an ecotourism programme.
International interventions
Probably the largest intervention in the Pangani River Basin (PRB) has been the RiverBasin Management and Smallholder Irrigation Improvement Project (RBMSIIP). This isa two-component project being implemented by the Ministry of Water and LivestockDevelopment (MoWLD) through its Water Resources Department; and the Ministry ofAgriculture and Food Security (MAFS) through its Irrigation Department. RBMSIIPwas originally designed as a six year programme (1996/97-2001/02) funded withIDA credit and government counterpart funding. Following a mid-term review in2001, the project’s new completion date was extended by a year to June 2003 tofinalise planned activities.
The primary objectives of the project are to strengthen the government’s capacity tomanage its water resources in an integrated and comprehensive manner that ensuresthe equitable, efficient and sustainable development of the resource and to addresswater-related environmental concerns at the national level and in the Rufiji and Pan-gani River Basins; and, to improve irrigation efficiencies of selected smallholder tradi-tional irrigation schemes in the two target basins. Its major achievement to date hasbeen a review of the national water policy and the drafting of a new water policy.The latter was approved by the Tanzanian Parliament in July 2002.
The UNDP-GEF East Africa Cross-border Biodiversity Project (EACBP) is a regionalproject funded by the Global Environment Facility (GEF) through the UNDP, and, inTanzania, is implemented by the National Environmental Management Council(NEMC). The project works through existing administrative structures in the region,with a strong community involvement as a backbone. The project’s major objective isto reduce the rate of biodiversity loss at selected cross-border sites in East Africa. Ithas two immediate objectives. The first is to create an enabling environment inwhich government agencies and communities can jointly regulate resource use; thesecond is to balance the supply and demand factors that impact upon biodiversityconservation and wise use. In the Basin area, the EACBP has been working in theShegena Forest Reserve, the largest forest block in the North Pare Mountains, whereit has sought to establish a JFM framework with local communities.
41
C.7 Conflict
As mentioned above, water users are legally obliged to hold water rights issued bythe Pangani Basin Water Office. The cost of a water right depends on the end towhich the water is to be put. Small-scale users are often reluctant to apply and payfor water rights, arguing that water is a 'gift from God'. According to Mujwahuzi(2001) there are 1,028 water rights in the Basin with a capacity to abstract 30.7m3/s. There are, however, an additional 2,094 abstractions with a capacity to ab-stract about 40 m3/s. “The present and potential water use conflicts [in the Basin]are the result of past uncoordinated and increased development of the water re-sources of the Pangani especially above Nyumba ya Mungu Dam” (Mujwahuzi, 2001:131).
Conflict within the Pangani River Basin (PRB) is not, however, restricted to water us-ers alone. In the examples provided below, it will become clear that many of the con-flicts facing the water sector are replicated in other resource use sectors, and be-tween different types and claims over resource use. The types of conflict identifiedhere are a simplification of the highly complex and contentious nature of conflict de-velopment. This Situation Analysis groups conflict into three broad categories de-signed to provide an overview of the various types and scales of conflict presentwithin the PRB. The categories are not mutually exclusive, given that it is in the na-ture of natural resources conflict and livelihood claims that the problems that affectresource access overlap, and often feed off one another. Hence, conflicts of scalemay exacerbate conflicts of tenure and vice versa. The categories are: conflicts ofscale, conflicts of tenure and conflicts of location.
Conflicts of scaleThe relationship between water users of different sizes and power in the PanganiRiver Basin is often described in dichotomous terms. Hence, large-scale plantationsusing hundreds of litres of water a second and employing highly efficient irrigationsystems, differ starkly from small-scale users using far less water and employingvery inefficient irrigation systems. It should be noted that similar conflicts may alsooccur within communities, between vested power interests (such as village govern-ments) and other community members. The extremes involved in these regards arefertile grounds for conflict to erupt. Examples of these kinds of conflict are as fol-lows:
The Shiri – Njoro Village and the Moshi Municipal Water and SewageAuthority
Shiri – Njoro lies along the Moshi – Arusha Road, close to Moshi Town. Moshi is arapidly growing urban area supported, in the main, by agriculture. As the towngrows, so too has its demand for water. In 2000, engineers from the municipal waterauthority arrived in Shiri – Njoro and capped the community’s main spring. Thespring yields 218 L/s, and the Moshi Municipal Water and Sewage Company(MMWSA) obtained a water right to abstract 116 L/s. The village had three furrows
42
originating from the spring that abstracted about 30 L/s each. Urban Water abstrac-tion, therefore, should have left the community with sufficient water to fill its fur-rows.
The MMWSA, however, abstracts around 24 L/s more than it is entitled to. The Shiri– Njoro Village Council claims that it can no longer operate the three furrows fromthe spring, and that their community – and its agricultural economy - has been hitvery hard. It is their intention to take the MMWSA to court and ‘we will sell ourgoats and dogs to raise the money’ to do so (Source: pers comm., Shiri – Njoro Vil-lage Council).
Afgem and the small-scale miners of Merelani
Tanzanite is a semiprecious bluish-purple gemstone found only in Tanzania. Tan-zanite-bearing soils are said to cover an area of just 20 km2 at Merelani. The area isdivided into a series of blocks, A, B, C and D. The 8 km2 Block C is said to containthe richest deposit, an estimated 2.2 million tonnes of tanzanite. Tanzanite was dis-covered in the area in 1967, and Merelani town now has 75,000 inhabitants (Ma-jtenyi and Muindi, 2001). It is ‘a boisterous, lawless settlement reminiscent of a Cali-fornia gold rush town’ (Lovgren, 2001: 1).
In 1999, a South African multinational, African Gem Resources Ltd (Afgem), sought,and obtained, a 13-year mining concession for Block C. By 2001, Afgem had in-vested US$ 8 million in the concession, and another $12 million will follow once thecompany starts full-scale operations (Majtenyi and Muindi, 2001).
Afgem, however, are not the only miners in Merelani. In fact, the industry is domi-nated by 10,000 small-scale miners, who oppose Afgem’s activities for the followingreasons (Majtenyi and Muindi, 2001):
• They accuse Afgem of trying to monopolise tanzanite mining in the area, and ofattempting to drive small-scale miners away. Afgem retorts that 70 percent of itsconcession is mined illegally. In the second of the mine’s two shafts, workersdiscovered a tunnel that lead all the way to the small-scale mining plots in BlockB (Lovgren, 2001).
• Soon after obtaining its concession, Afgem started fencing off Block C. Localminers claim, however, the boundaries between the blocks are indistinct and thatAfgem has no right to fence off the area.
• It is claimed that Afgem has sought to laser-brand its gems as a mark of qualityand authenticity. Local miners argue that this is, in fact, a ruse to ensure thattheir own gems are perceived as fake, forcing them to sell their gems only to Af-gem’s agents.
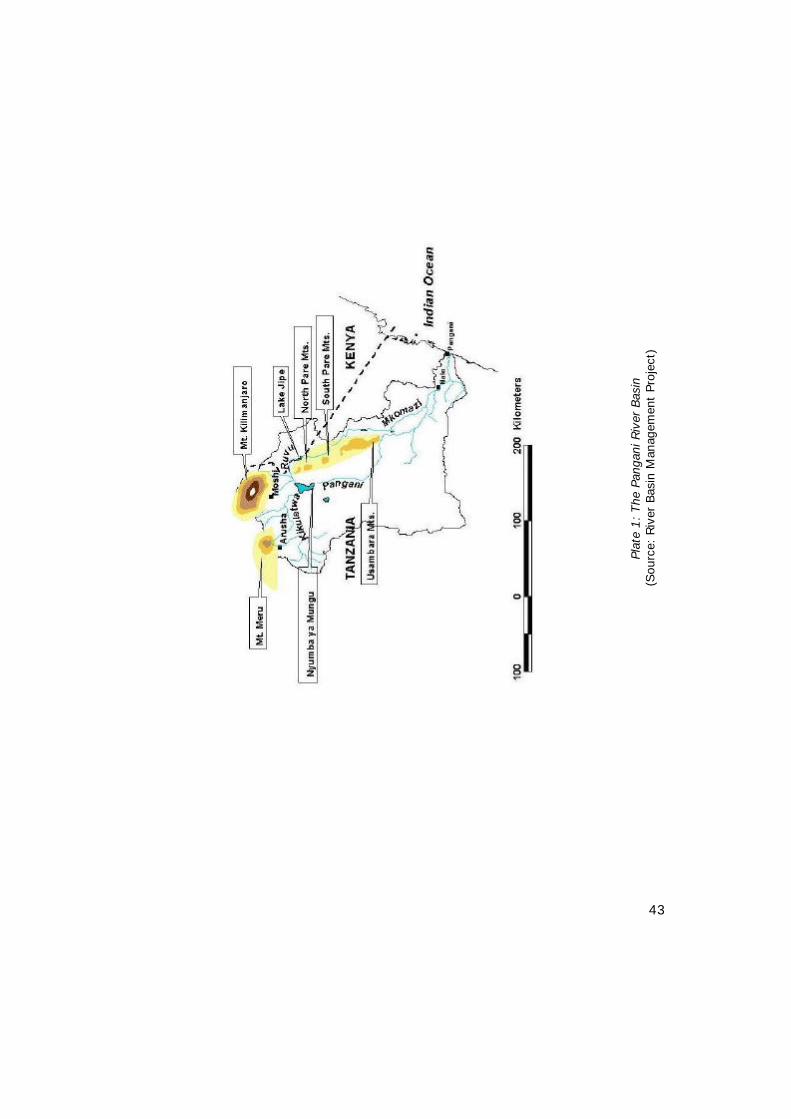
43
Plat
e 1: The
Pan
gani
Riv
er B
asin
(Sou
rce:
Riv
er B
asin
Man
agem
ent
Proj
ect)
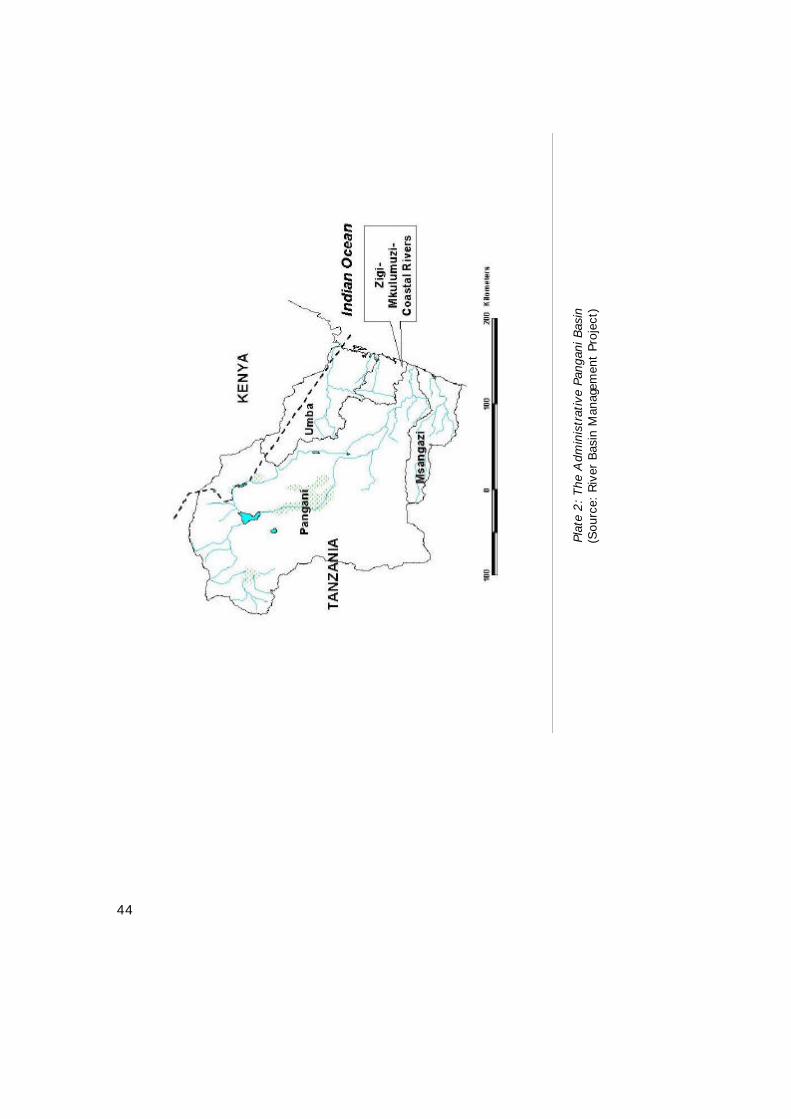
44
Plat
e 2: The
Adm
inis
trat
ive
Pang
ani B
asin
(Sou
rce:
Riv
er B
asin
Man
agem
ent
Proj
ect)
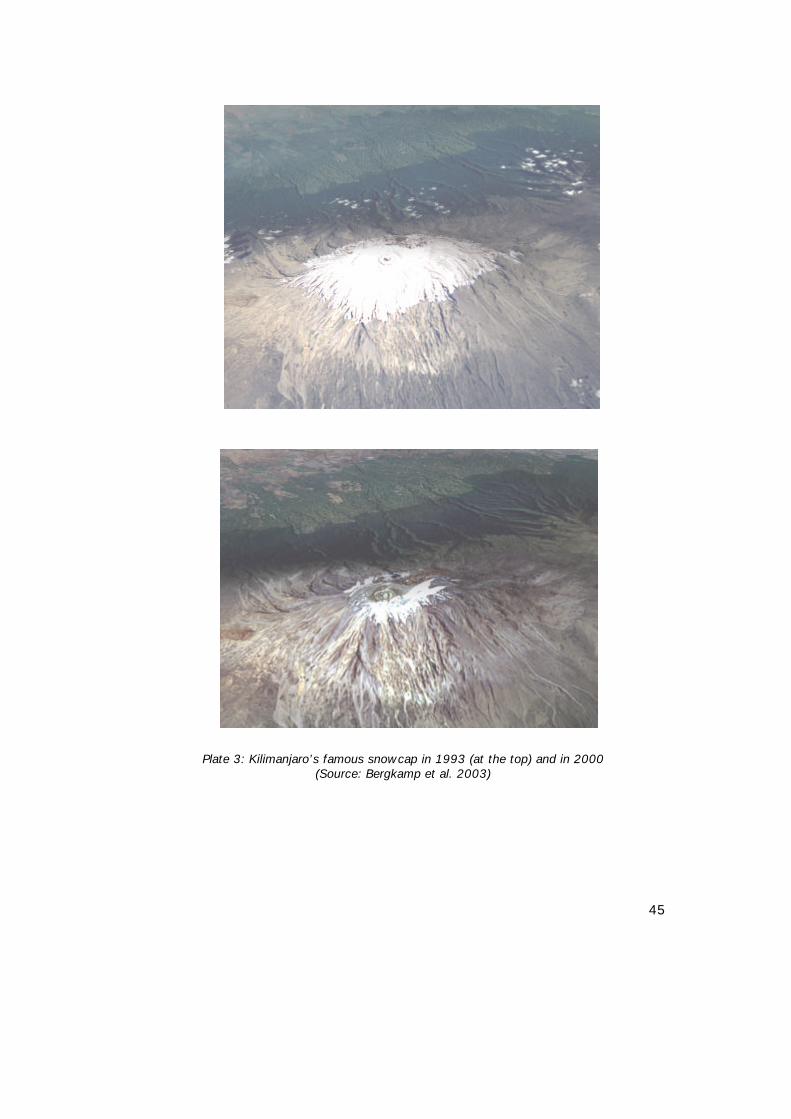
45
Plate 3: Kilimanjaro’s famous snowcap in 1993 (at the top) and in 2000(Source: Bergkamp et al. 2003)
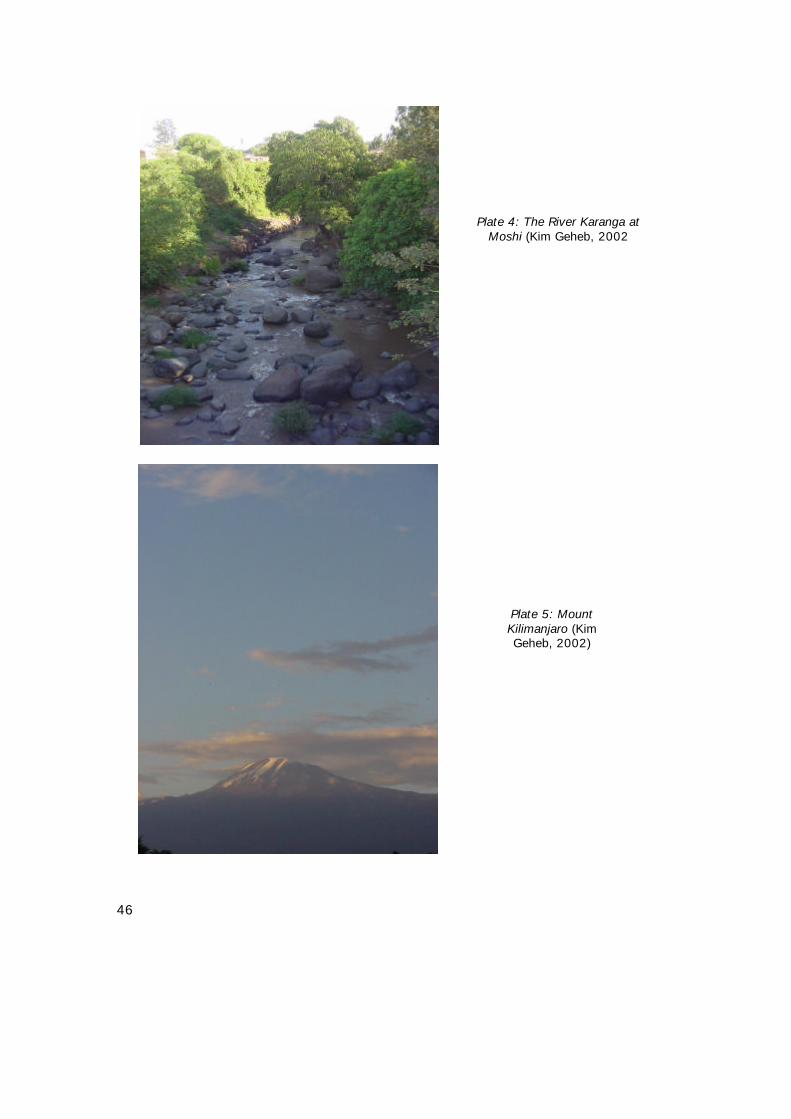
46
Plate 5: MountKilimanjaro (KimGeheb, 2002)
Plate 4: The River Karanga atMoshi (Kim Geheb, 2002
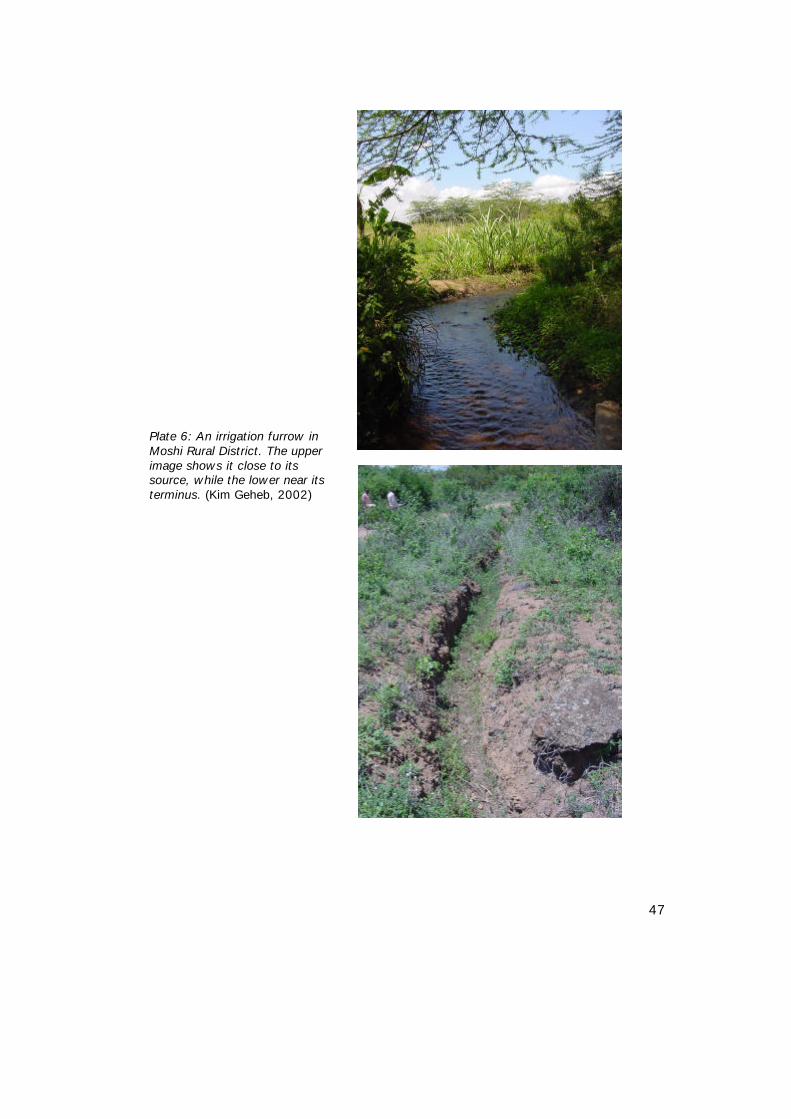
47
Plate 6: An irrigation furrow inMoshi Rural District. The upperimage shows it close to itssource, while the lower near itsterminus. (Kim Geheb, 2002)
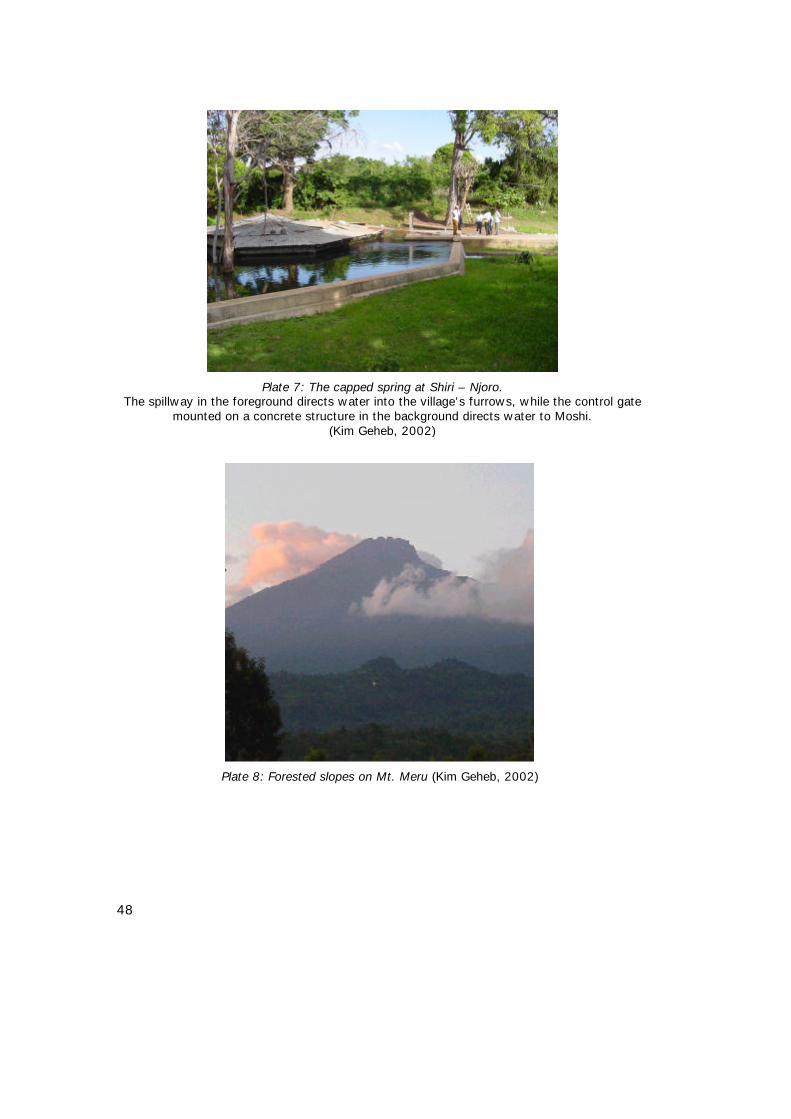
48
Plate 7: The capped spring at Shiri – Njoro.The spillway in the foreground directs water into the village’s furrows, while the control gate
mounted on a concrete structure in the background directs water to Moshi.(Kim Geheb, 2002)
Plate 8: Forested slopes on Mt. Meru (Kim Geheb, 2002)
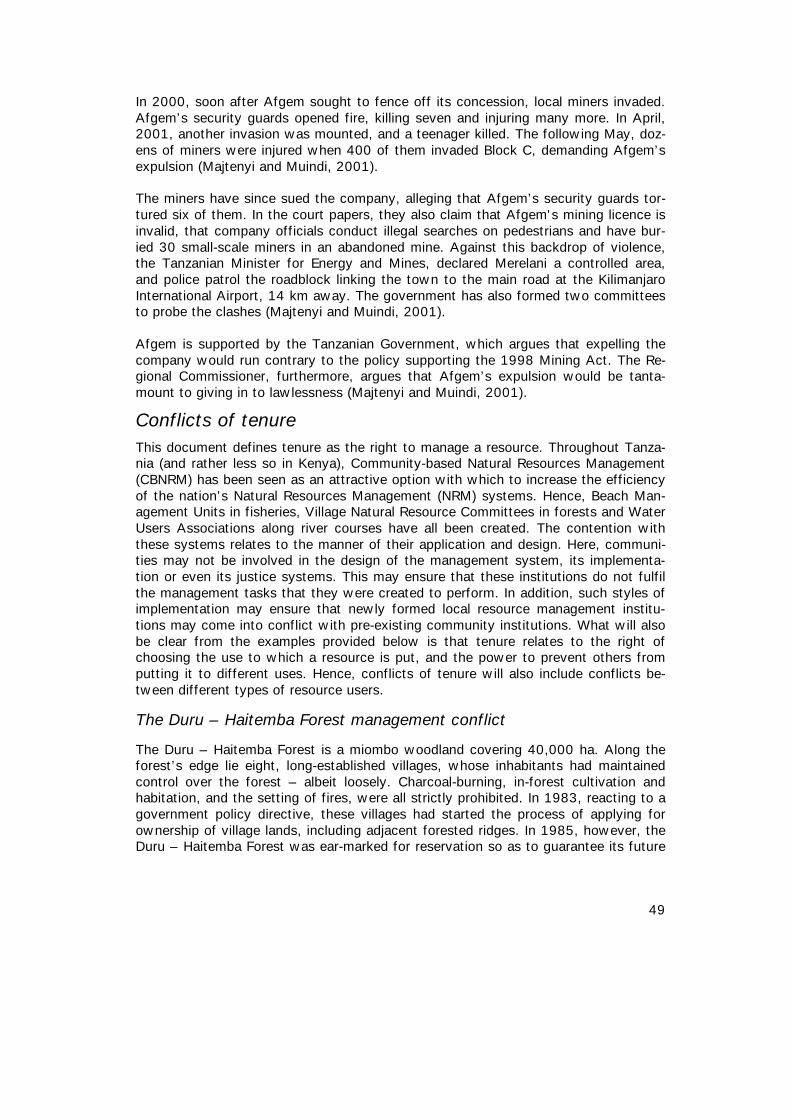
49
In 2000, soon after Afgem sought to fence off its concession, local miners invaded.Afgem’s security guards opened fire, killing seven and injuring many more. In April,2001, another invasion was mounted, and a teenager killed. The following May, doz-ens of miners were injured when 400 of them invaded Block C, demanding Afgem’sexpulsion (Majtenyi and Muindi, 2001).
The miners have since sued the company, alleging that Afgem’s security guards tor-tured six of them. In the court papers, they also claim that Afgem's mining licence isinvalid, that company officials conduct illegal searches on pedestrians and have bur-ied 30 small-scale miners in an abandoned mine. Against this backdrop of violence,the Tanzanian Minister for Energy and Mines, declared Merelani a controlled area,and police patrol the roadblock linking the town to the main road at the KilimanjaroInternational Airport, 14 km away. The government has also formed two committeesto probe the clashes (Majtenyi and Muindi, 2001).
Afgem is supported by the Tanzanian Government, which argues that expelling thecompany would run contrary to the policy supporting the 1998 Mining Act. The Re-gional Commissioner, furthermore, argues that Afgem’s expulsion would be tanta-mount to giving in to lawlessness (Majtenyi and Muindi, 2001).
Conflicts of tenureThis document defines tenure as the right to manage a resource. Throughout Tanza-nia (and rather less so in Kenya), Community-based Natural Resources Management(CBNRM) has been seen as an attractive option with which to increase the efficiencyof the nation’s Natural Resources Management (NRM) systems. Hence, Beach Man-agement Units in fisheries, Village Natural Resource Committees in forests and WaterUsers Associations along river courses have all been created. The contention withthese systems relates to the manner of their application and design. Here, communi-ties may not be involved in the design of the management system, its implementa-tion or even its justice systems. This may ensure that these institutions do not fulfilthe management tasks that they were created to perform. In addition, such styles ofimplementation may ensure that newly formed local resource management institu-tions may come into conflict with pre-existing community institutions. What will alsobe clear from the examples provided below is that tenure relates to the right ofchoosing the use to which a resource is put, and the power to prevent others fromputting it to different uses. Hence, conflicts of tenure will also include conflicts be-tween different types of resource users.
The Duru – Haitemba Forest management conflict
The Duru – Haitemba Forest is a miombo woodland covering 40,000 ha. Along theforest’s edge lie eight, long-established villages, whose inhabitants had maintainedcontrol over the forest – albeit loosely. Charcoal-burning, in-forest cultivation andhabitation, and the setting of fires, were all strictly prohibited. In 1983, reacting to agovernment policy directive, these villages had started the process of applying forownership of village lands, including adjacent forested ridges. In 1985, however, theDuru – Haitemba Forest was ear-marked for reservation so as to guarantee its future
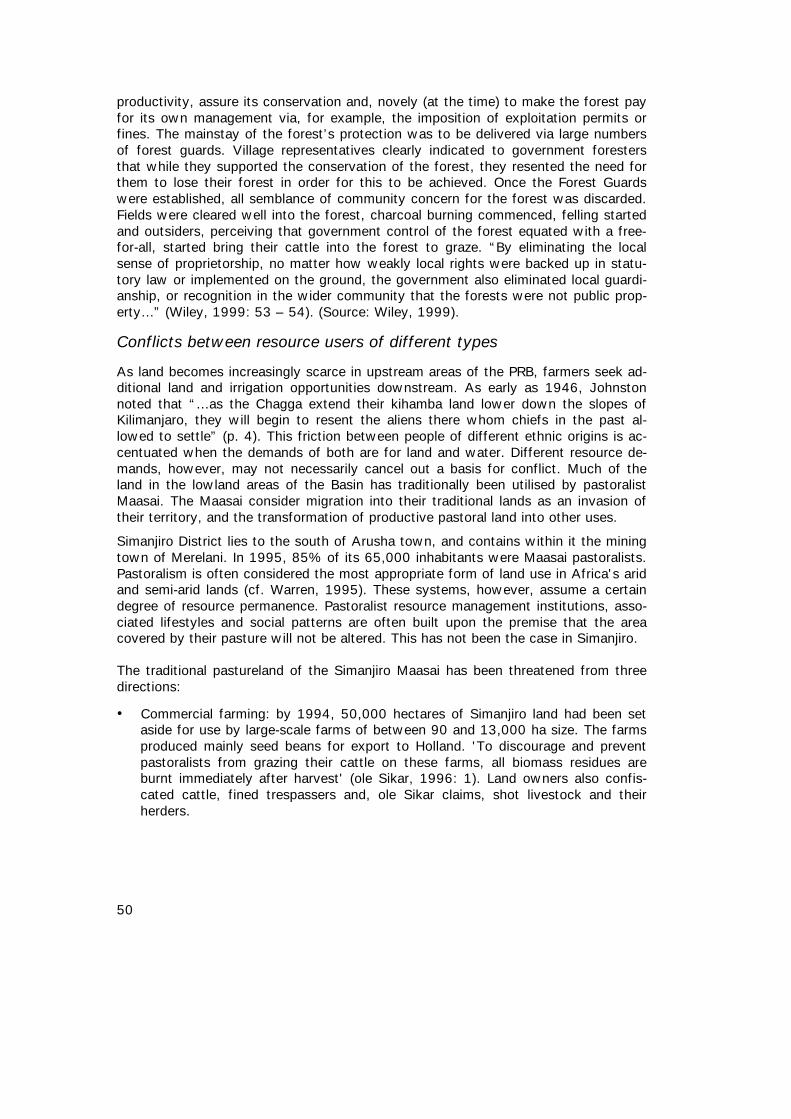
50
productivity, assure its conservation and, novely (at the time) to make the forest payfor its own management via, for example, the imposition of exploitation permits orfines. The mainstay of the forest’s protection was to be delivered via large numbersof forest guards. Village representatives clearly indicated to government forestersthat while they supported the conservation of the forest, they resented the need forthem to lose their forest in order for this to be achieved. Once the Forest Guardswere established, all semblance of community concern for the forest was discarded.Fields were cleared well into the forest, charcoal burning commenced, felling startedand outsiders, perceiving that government control of the forest equated with a free-for-all, started bring their cattle into the forest to graze. “By eliminating the localsense of proprietorship, no matter how weakly local rights were backed up in statu-tory law or implemented on the ground, the government also eliminated local guardi-anship, or recognition in the wider community that the forests were not public prop-erty…” (Wiley, 1999: 53 – 54). (Source: Wiley, 1999).
Conflicts between resource users of different types
As land becomes increasingly scarce in upstream areas of the PRB, farmers seek ad-ditional land and irrigation opportunities downstream. As early as 1946, Johnstonnoted that “…as the Chagga extend their kihamba land lower down the slopes ofKilimanjaro, they will begin to resent the aliens there whom chiefs in the past al-lowed to settle” (p. 4). This friction between people of different ethnic origins is ac-centuated when the demands of both are for land and water. Different resource de-mands, however, may not necessarily cancel out a basis for conflict. Much of theland in the lowland areas of the Basin has traditionally been utilised by pastoralistMaasai. The Maasai consider migration into their traditional lands as an invasion oftheir territory, and the transformation of productive pastoral land into other uses.
Simanjiro District lies to the south of Arusha town, and contains within it the miningtown of Merelani. In 1995, 85% of its 65,000 inhabitants were Maasai pastoralists.Pastoralism is often considered the most appropriate form of land use in Africa's aridand semi-arid lands (cf. Warren, 1995). These systems, however, assume a certaindegree of resource permanence. Pastoralist resource management institutions, asso-ciated lifestyles and social patterns are often built upon the premise that the areacovered by their pasture will not be altered. This has not been the case in Simanjiro.
The traditional pastureland of the Simanjiro Maasai has been threatened from threedirections:
• Commercial farming: by 1994, 50,000 hectares of Simanjiro land had been setaside for use by large-scale farms of between 90 and 13,000 ha size. The farmsproduced mainly seed beans for export to Holland. 'To discourage and preventpastoralists from grazing their cattle on these farms, all biomass residues areburnt immediately after harvest' (ole Sikar, 1996: 1). Land owners also confis-cated cattle, fined trespassers and, ole Sikar claims, shot livestock and theirherders.
51
• Mining activities - of both small and large-scale varieties, have assumed controlover large tracts of Simanjiro land that are then either so badly damaged thatthey yield no useful grazing product, or else are closed to grazing completely.
• Tourism: As has been the case for pastoralists in and around Mkomazi Game Re-serve, land in Simanjiro has been alienated for the purposes of protecting wildlife.The district's Maasai argue that this is unnecessary, given that they have co-existed with wildlife for centuries. 'Households have been forced to stop grazingtheir animals in these areas. At the same time the wild animals have been al-lowed to graze with domestic animals in traditional grazing areas such as the Si-manjiro Plains' (ole Sikar, 1996: 2). In addition, the Maasai complain, wildlifetransmits disease to Maasai livestock. The Simanjiro Maasai have been compen-sated neither for lost pasture nor for livestock lost to wildlife diseases.
These trends have occurred against a background of official government policyseeking, in particular, large-scale farming and industrial investment aimed at satisfy-ing national needs over and above localised pastoralist interests. Hence, strategiesaimed at meeting national goals may result in difficult-to-solve local managementproblems, and intractable resource exploitation difficulties giving rise to over-exploitation and localised conflict. In this sense, the conflicts of the Simanjiro andother Maasai are also conflicts of scale, and provide a graphic example of how scaleconflicts may also be tenurial conflicts at the same time.
Kenya’s Taita – Taveta District is not immune from these conflicts. Two thirds of thedistrict’s land is owned by just two land owners and the county council. As a result,many of Taita – Taveta’s indigenous population are squatters. As a result, seriousconflict exists between the landless and land-owners. Such conflict complicates themanagement of the district’s natural resources considerably, a problem that extendsinto the water sector. Squatters seeking to till the land in this semi-arid area arewholly dependent on irrigation (Musyoki, pers. comm.). They do not, however, pos-sess water rights, as they are obliged to do, and much of the water is in any caseabstracted upstream by the district’s large-scale sisal interests. Partly in an effort toaddress the conflict in the area, the government has purchased some 9,700 ha in aneffort to find land on which to settle small-scale farming interests.
Conflicts between differing water management perspectives: an exam-ple from Mt. Kilimanjaro
Tagseth (2002) argues that the failure of formal administrative systems within theBasin to recognise customary rights to water and its administration has been a causeof conflict between such customary interests and the formal administration of thePangani River Basin (PRB). One method employed by formal administrative sourceswithin the Basin has been the use of water control gates. It is said that becausesmall-scale irrigating communities were not consulted first, they viewed the controlgates as a gross violation of their right to water. In many cases, the gates have beenvandalised or completely destroyed (Figure 4). In other areas, villagers have simplycut new inflow points in the riverbank, by-passing control gates (Shishira, 2002).
52
PAMOJA (2002) argues that communities within the PRB perceive access to wateras being one of their basic rights, and take a dim view of government attempts toimpose tariffs on water use and rules on its exploitation. Part of communities’ reluc-tance with the PRB’s administration stems from their perception that large-scalecommercial interests are favoured over their own, smaller claims for water. The ‘top-down’ approaches so far adopted by the government, PAMOJA argues, are charac-terised by an absence of dialogue, and yields difficult-to-solve conflicts. Dialogue-based approaches, they feel, are more likely to ‘forge a way forward that meets theneeds and interests of policy makers, legislators and communities alike’ (PAMOJA,2002: 2).
On Mt. Kilimanjaro, a furrow committee chairman has traditionally managed irrigationfurrows. Chairmen are always male, and are drawn from the lineage of the personwho originally dug the furrow. The furrow passes through or along the land of vari-ous potential water users, many of whom wish to use the water for irrigation pur-poses. To qualify for an allocation, users must contribute towards maintenancecrews who regularly patrol the furrow looking for damage. Various additional rulesregulate water use, such as times between which abstraction may occur, how wateruse is to be rotated amongst users and so on. These rules are not set in stone. Thisis useful, because some people alongside furrows may need less water than others,while some need considerably more. Gillingham (1999) describes five ways in whichpeople who need more water than their allocation permits may obtain additional wa-ter: the first is to ‘borrow’ water – someone who needs more water than their alloca-tion will borrow water from someone they know who needs less. This is the mostcommon method of obtaining water additional to a person’s allocation. The second isto obtain additional water from another nearby furrow. The third is to buy water –here, someone who has used less water than he needs offers to sell the remainder ofhis allocation to someone he knows who needs more than his allocation. Becausewater is considered a ‘gift from God’, then it is illegal to buy it directly. Sellers getaround this by selling their labour to the buyer, and then, if questioned, saying thatthe buyer is borrowing the remainder of their water allocation. The fourth way of ob-taining water is to irrigate at night when there are no water allocations. Finally, thefifth way of gaining additional water is to steal it by, for example, irrigating while it issomeone else’s allocation day, although this is very unusual (Gillingham, 1999).
This flexibility in the rules, Gillingham (1999) argues, ‘…is crucial to the allocativeefficiency and sustainability of the irrigation system…If all furrow users were re-stricted to the use of their formal allocation only, the furrow irrigation system wouldmeet the irrigation water needs of only a few furrow users’. Gillingham argues thatthis system is reliable, because stealing is permitted neither under the formal alloca-tion system nor under the working rules – if the system were unreliable, peoplewould not contribute to the furrow’s maintenance. This complementary relationshipbetween formal and working rules takes a great deal of time to develop – the firstfurrows on Mt. Kilimanjaro were dug in the 18th century. In the lowland areas, wheresettlement is more recent, the climate drier, the population more scattered and socialdiversity much higher, then the cohesion between formal and working rules is not sogreat.
53
These rules emphasise social equity and conflict minimisation. They sit uneasilyalongside new, externally imposed, rules that demand efficient water use. In addi-tion, these new rules seek the establishment of Water Users’ Associations (WUAs),which are not the same as Furrow Committees. WUAs are expected to collect feesfrom water users that then contribute towards the payment of a water right, obtain-able from the Pangani Basin Water Office. In a culture where water is perceived to bea ‘gift from God’, the notion that it must be paid for is simply illogical. In addition,Gillingham worries, externally imposed sets of rules are far less likely to succeed thaninternally generated ones that have been altered and moulded to local cultural andenvironmental peculiarities over long periods of time. Gillingham believes that themismatch between the management process at the local level and that at the exter-nal level may endanger the success of externally sourced management initiatives.
Conflicts of location
Users located in upstream areas are placed more favourably vis-à-vis water abstrac-tion than are downstream users. At its most basic, these problems can be seen alongirrigation furrows where users close to the water source are able to grow crops withvery high water demands. Irrigated rice, for example, requires 3,000 litres of waterto produce a kilo of harvest. Users located at the end of a furrow, however, areobliged to plant low water demand crops. The serious problems faced by down-stream hydropower plants are another example.
The Lower Moshi Irrigation Scheme
Before the Lower Moshi Irrigation Scheme (LMIS) was developed in 1987, there wasvery little irrigated rice paddy in the area, and farmers could expect to harvest about2 tonnes of rice per hectare. Following completion of the scheme, yields increased to8 tonnes per hectare, prompting farmers outside the project to try to replicate theScheme’s farming techniques. As a result, water demands increased substantially,causing a constant water shortage supply problem downstream of the project. TheScheme itself has suffered from water shortages on account of intense abstractionsupstream, and has been forced to reduce the hectarage under irrigation from 2,300to 647 in 1994. Farmers involved in the Scheme were very unhappy. They explainedthat their water allocations followed a well-planned programme. Upstream users hadno such programme, so causing the water scarcity at the Scheme. In addition, farm-ers claimed, upstream users had influence within the government and Chama ChaMapinduzi (CCM) (Tanzania’s ruling party) circles, so they could not be challenged(Mujwahuzi, 2001: 134 and 136).
The case of small-scale irrigators and the Tanzania Electric Supply Co.
TANESCO claims that it needs at least 40 m3/s to run the New Pangani Falls (NPF)Hydropower facility. After the Nyumba ya Mungu Dam (NYM) has released waterinto the Pangani, additional water joins it via a few tributaries. By the time the waterarrives at NPF, however, it is often insufficient to drive the turbines. “Sometimes wehave so little water that we have to close down the station and allow the water topool overnight, so that we can open again in the morning” (Lugeiyamu pers. comm.).
54
As land becomes more and more scarce upstream of the NYM, farming downstreamof the dam has also increased. Because conditions down here are much warmer andrainfall much lower, the need to irrigate is commensurately greater. The NPF’s man-ager, therefore, blames unregulated water abstractions for the inadequate amountsof water that he receives. He points out that while water to his plant has declined,the area under irrigation has not. “Small-scale irrigators do not use electricity, so theydo not understand these problems” (Lugeiyama, pers. comm.).
At the same time, control over abstractions has declined. When the NPF facility wasconstructed, money was also available to construct water control gates along theriver’s main abstraction points, and to monitor these. As funding has declined, moni-toring has become more infrequent, the control gates have been destroyed and/ornew abstraction points cut into the riverbank.
As a result, electricity generation has declined. In April 1999, the NPF facility gener-ated 45 million kWh. In April, 2002, it generated 25 million kWh. This, of course,has a direct impact on the investment attractiveness of the plant. TANESCO is, atpresent, seeking to privatise itself. “If the NYM power plant has an 8 MW capacityand we can deliver only 3, who will invest in us?” (Lugeiyamu, pers. comm.).
C.8 Summary of pointsAt its core, the problems that face resource use in the Pangani River Basin (PRB) re-late to an increasing population against a background of high levels of poverty. Pov-erty and environmental degradation are often perceived to be interlinked (cf. WCED,1987). The problems of managing Common Property Resources (CPRs) are oftenthought to increase when there are large numbers of people involved, particularlywhen their cultural homogeneity may be weak (cf. Ostrom, 1990). The structure andfunction of rural livelihoods may become imperilled when the ability of rural people tocontrol and secure adequate sources of livelihood are threatened.
This chapter has reviewed these difficulties by first identifying a series of major ‘in-terests’ within the Basin. It has then gone on to consider the various conflicts thatexist between them. The main points to be derived from this discussion are as fol-lows:
• The major interests within the Basin comprise industrial interests (electricity,mining and farming), farming (large and small scale farming, both associated witha considerable reliance on irrigation), pastoralist interests (particularly in lowlandareas), and growing urban interests. This chapter has focussed primarily on thewater usage of these interests. Operating between these diverse interests andthe multiplicity of natural resources within the Basin are NGOs and internationaldonor agencies. The mandate of these is primarily conservation and/or the devel-opment and enhancement of rural livelihoods.
• It is important to note that the population of the Basin is high, that for many ofthem, livelihoods are derived from farming, and that there is much to suggestthat they are economically vulnerable. In addition, the diversity and richness of
55
the Basin’s resources mean that large(er)-scale interests are attracted to the Ba-sin, and substantial investments have been made. There exists, between theselarge-scale interests and small-scale livelihood security, room for conflict.
• This Chapter divided conflicts into three broad, inter-related, categories. The firstrelated to conflicts of scale, in which it was argued that small-scale users oftenhad to compete against much larger claims for the same resource. The secondconflict area related to conflicts of tenure. ‘Tenure’ here refers to the right tomanage one’s resources, and conflict arises between different managementsources and priorities. The third class of conflict is related to location. Here, theway in which the location of a group of resource users can bring them into con-flict with users elsewhere, was considered. The classic example of such ‘loca-tion’ conflict arising between upstream and downstream users was provided.
• It is clear, therefore, that the diversity of resources in the Pangani River Basin(PRB) brings with it an equal diversity of conflict types. What concerns the PRB isthe extent to which management is able to deal with conflict of all degrees of in-tensity and the natural resource allocation problems that underlie them.
56
D Natural Resource Management inthe Pangani River Basin
D.1 Introduction
This Chapter considers the Natural Resources Management (NRM) of the PanganiRiver Basin (PRB). In the first section, the ‘formal’ administration of the Basin is con-sidered. Many arms of government administer the basin. This is, in and of itself,problematic because it can mean that the initiative of one branch may undermine theactivities of others. For example, water conservation initiatives may be underminedby irrigation development activities. In addition, it may also mean that Central Gov-ernment may seek to implement national policies within the Basin without referenceto local conditions, demands and resource difficulties. Finally, it also means that ahighly ‘sectoral’ approach to management occurs, with forestry departments un-aware of, for example, wildlife development initiatives. While the latter initiativesmay not directly concern forests, they do concern the overall management of theBasin, of which both sectors are an integral part. The first section of this Chapterconsiders the activities of two important sectors within the Basin: water and for-estry, and assesses these in the light of management delivery.
The second section assesses the activities of management at the community level,while the third considers cross-border management of the Basin. The fourth sectionaddresses the difficulties of monitoring and data collection in the Basin. The finalsection will summarise the findings of this Chapter.
D.2 Government management, Legislation and policy
Water administration, legislation and policy
The principal legislation governing water resources in Tanzania is the Water Utiliza-tion Act No.42 of 1974 and its Amendment Act No.10 of 1981; and Written Laws(Miscellaneous) Act No.17 of 1989 and General (Regulations) Amendment. Act No.10 introduced the concept of allocating water based on hydrological boundaries.Hence, nine river/lake basins were identified, and basin water offices – including thePangani Basin Water Office (PBWO) - were established in five of them. The estab-lishment of the remaining four is underway (Sarmett and Kamugisha, 2002).
57
The PBWO was established in 1991, the product of donor concerns that there wouldbe inadequate water to run the New Pangani Falls dam, and was formed to ensurethat the Basin was managed and that adequate amounts of water arrived at the dam.
The PBWO reports to the Pangani Basin Water Board (PBWB). Initially, the PBWBcomprised representatives from government departments with a stake in the PanganiRiver Basin (PRB). Increasingly, however, members of the Board come from the pri-vate and NGO sectors, with nominal representation by community interests. TheBoard’s task is to advise the Basin Water Officer on all matters concerning (Sarmettand Kamugisha, 2002):
• the apportionment of water supplies;
• the determination, diminution or modification of water rights;
• the measures to be taken in case of drought;
• the priorities to be given to different uses of water in the basin.
The Water Board has an advisory role and the Water Officer (in charge of the PBWO)is not bound by its advice. The PBWO’s primary activities relate to issuing waterrights and pollution monitoring and control. It has very few regulatory and sanction-ing executive powers. There is not, in fact, any administrative level below the PBWO.At this stage, the PBWO has a ‘gentleman’s agreement’ with Regional HydrologicalOfficers (RHOs) (Sarmett, pers. comm.), who fall below the Regional Administration.In large measure, the role of the RHOs is to collect data on water flows. Since theestablishment of the PBWO, RHOs also assess applications for water rights and makerecommendations to the PBWO on whether or not these should be issued.
The PBWO encourages the formation of Water User’s Associations (WUAs) and,typically, water to be used for irrigation can only be applied for by a WUA. This issaid to make administration easier, because then the PBWO deals with the WUAalone and not multiple individuals. WUAs are also supposed to collect fees from wa-ter users that will ultimately be used to pay for their water right.
In the early 1990s, water rights in the PRB consumed a total of 33.4 m3/s, but aninspection carried out by the PBWO in 1992/93 suggested that actual abstractioncame to 48 m3/s (Mujwahuzi, 2002). There are 567 approved water rights in the fourTanzanian Regions sharing the Pangani River Basin, while an additional 300 haveprovisionally been granted. There are, however, almost twice as many abstractionscarried out without any water right (Table 5). About 46% of final and provisional wa-ter right grants come from the Kilimanjaro Region. Almost 66% of the Basin’s illegalabstractions occur in this Region.
Clearly, therefore, there exist serious difficulties in monitoring abstractions and inimplementing the tenets of Tanzania’s water legislation. Amongst the problems con-fronting the PBWO are the following;
• Although there are many monitoring stations throughout the PRB, their operationis erratic, and data series often interrupted because the stations fail. Manualmonitoring can also be carried out, but data collectors are often insufficiently
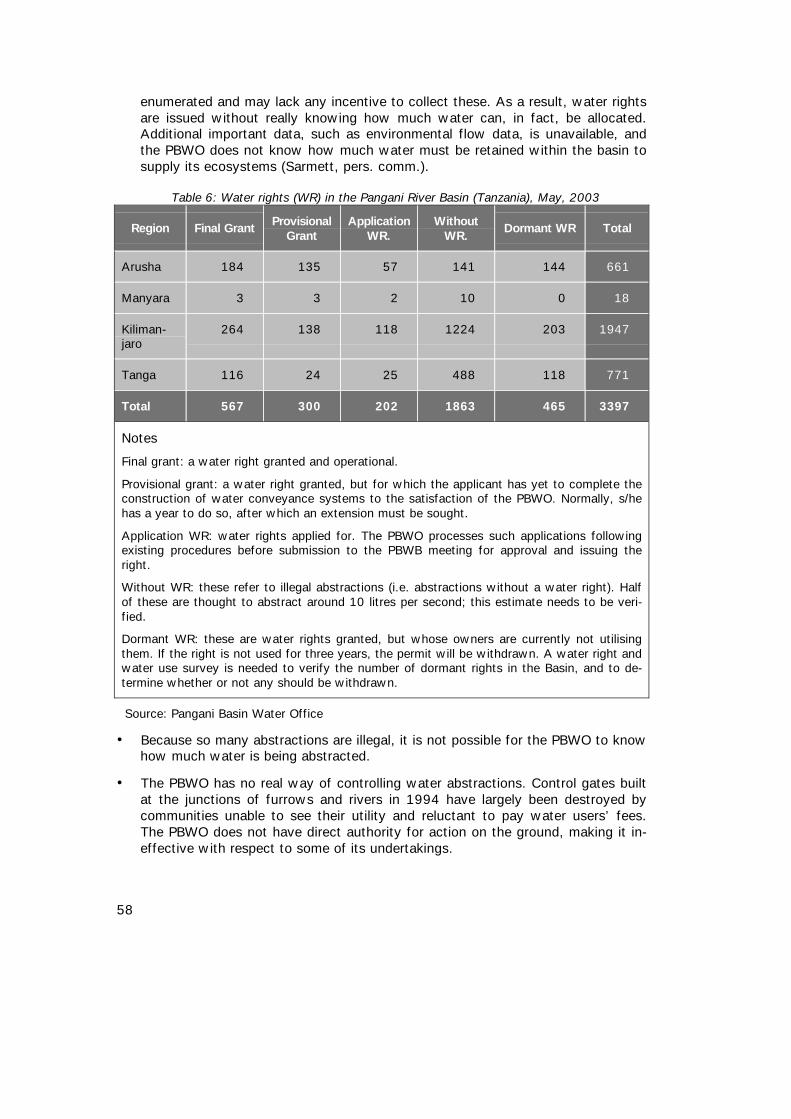
58
enumerated and may lack any incentive to collect these. As a result, water rightsare issued without really knowing how much water can, in fact, be allocated.Additional important data, such as environmental flow data, is unavailable, andthe PBWO does not know how much water must be retained within the basin tosupply its ecosystems (Sarmett, pers. comm.).
Table 6: Water rights (WR) in the Pangani River Basin (Tanzania), May, 2003
Region Final Grant ProvisionalGrant
ApplicationWR.
WithoutWR.
Dormant WR Total
Arusha 184 135 57 141 144 661
Manyara 3 3 2 10 0 18
Kiliman-jaro
264 138 118 1224 203 1947
Tanga 116 24 25 488 118 771
Total 567 300 202 1863 465 3397
Notes
Final grant: a water right granted and operational.
Provisional grant: a water right granted, but for which the applicant has yet to complete theconstruction of water conveyance systems to the satisfaction of the PBWO. Normally, s/hehas a year to do so, after which an extension must be sought.
Application WR: water rights applied for. The PBWO processes such applications followingexisting procedures before submission to the PBWB meeting for approval and issuing theright.
Without WR: these refer to illegal abstractions (i.e. abstractions without a water right). Halfof these are thought to abstract around 10 litres per second; this estimate needs to be veri-fied.
Dormant WR: these are water rights granted, but whose owners are currently not utilisingthem. If the right is not used for three years, the permit will be withdrawn. A water right andwater use survey is needed to verify the number of dormant rights in the Basin, and to de-termine whether or not any should be withdrawn.
Source: Pangani Basin Water Office
• Because so many abstractions are illegal, it is not possible for the PBWO to knowhow much water is being abstracted.
• The PBWO has no real way of controlling water abstractions. Control gates builtat the junctions of furrows and rivers in 1994 have largely been destroyed bycommunities unable to see their utility and reluctant to pay water users’ fees.The PBWO does not have direct authority for action on the ground, making it in-effective with respect to some of its undertakings.
59
• The PBWO is supposed to be administratively and financially independent. How-ever, many water users believe that water is a ‘gift from God’, and refuse to payfor their water rights, even though the rates are very low. The PBWO thereforefaces serious funding difficulties. The law is silent on how to deal with debtors.As a result, almost 60% of annual water rights bills fail to be settled (Sarmettand Kamugisha, 2002).
• The PBWO operates through offices over which it does not have authority. Forexample, the Regional Hydrologist, the Regional Hydro-geologist and the RegionalLaboratory fall under Water Resources Department and Central Laboratory. Fur-thermore, the PBWO does not have representatives in the districts, and the Wa-ter Utilisation Act does not provide any link between it and district authorities orother lower levels of administration. The Board has no formal links with the ad-ministration of the three regions in which it works. The Water Utilisation Actdoes not provide the executive of the Board with any consultative role, nor witha mandate to attend sittings of the Regional or District Councils within the basin.
• The Water Users’ Associations (WUAs) have been created in an attempt to im-prove management efficiency. The laws and regulations that permit the formationof the WUAs do not allow the Regional Hydrologist to question their activities.
• The administrative jurisdiction of the PBWO is the PRB, which does not followformal administrative boundaries. In the PRB, the PBWO must work with threeregional offices, complicating the administration of the Basin.
• The PBWO has no facility for solving conflict between water users.
• River basins comprise large numbers of resources that are inter-connected withone another and changes to one resource may have repercussions for the otherbasin resources. In the PRB, planning is fragmented, sectoral and regionally ordistrict oriented. There are no clearly defined roles for the Basin Board regulatorand service agents (like the hydrological services) at the implementation level.
Tanzania’s new Water Policy and subsequent legislation, the PBWO believes, willsolve many of these problems. The Policy (URT, 2002) says that ‘an effective institu-tional set-up’ is required to perform core water resource management functions.Such a ‘reviewed and streamlined’ set-up will be responsible for the enforcement ofthe water legislation. The policy claims that the roles and responsibilities of differentstakeholders will be clearly defined in the new framework, and will ensure the par-ticipation of legitimate representatives of stakeholders. The management structureand system will be designed to facilitate the involvement of responsible authorities atdifferent levels and promote autonomy at the Basin level. Appropriate, transparentand accountable management information systems will be established.
Because water resources management is a multi-sectoral activity, the policy argues,it requires an effective collaboration and coordination mechanism amongst variousrelevant sectors. The policy believes that sharing information and keeping relevantstakeholders aware can achieve the development of a multi-sectoral approach to themanagement of river basins.
60
The policy identifies five levels of basin management: the nation, the basin, thecatchment, the district and the community or water association level. At the nationallevel, the ministry responsible for water is charged with policy development and re-view, implementing water law and planning and the resolution of conflict betweenvarious national sectors. The basin level is the unit for which data will be collectedand analysed, water will be allocated, pollution controlled, water utilisation plansprepared, fees and charges collected, and water conflicts resolved. The present sys-tem of managing through Basin Water Boards will be strengthened. So as to bringmanagement closer to water users, Catchment Water Committees or Sub-catchmentWater Committees will be established, comprising representatives from the publicand private sectors, and from the Water User Associations within the basin. The rolethe Catchment Water Board includes the preparation and implementation of catch-ment plans, and the resolution of conflicts within the catchment.
District councils, the policy says, shall participate fully in basin boards and catchmentcommittees. Districts will be responsible for the planning and development of waterresources in accordance with basin plans, protection and conservation of natural re-sources, establishment of water management byelaws and conflict resolution. In ad-dition, district councils will assess the water demands of their respective districts,and participate in the preparation of basin plans.
The final level comprises community level and Water Users’ Associations (WUAs).These associations will be responsible for local-level management of allocated waterresources, which comprises, amongst others, the mediation of disputes, data collec-tion, participation in the preparation of water utilisation plans, conserving watersources and catchment areas, using water efficiently and ensuring return flows, lawenforcement and implementing water rights conditions, and pollution control. WUAswill send representatives to water boards and catchment committees.
Water administration in Kenya is governed by the Water Act of 2002 (RoK, 2002).Insofar as basin-wide management is concerned (provision for which is containedwithin the Water Act), the National Water Resources Management Strategy (RoK,2003) is highly relevant.
The Water Act established a Water Resources Management Authority (WRMA)charged with the management and administration of most aspects of Kenya’s waterresources. There are numerous organisations arranged beneath the WRMA, which aredescribed in the Box to the right. Here, the incorporation of stakeholders into themanagement and administration of the Act is considered.
The management unit that the WRMA is expected focus upon is water catchmentareas, which it is charged with defining. Each catchment is supposed to have aCatchment Area Advisory Committee (CAAC) of 15 members, appointed by theWRMA, and comprising representatives from a wide array of private and publicstakeholder sectors. Under the Water Act, the CAAC is charged to ‘advise officers ofthe Authority [WRMA] at the appropriate regional office concerning –
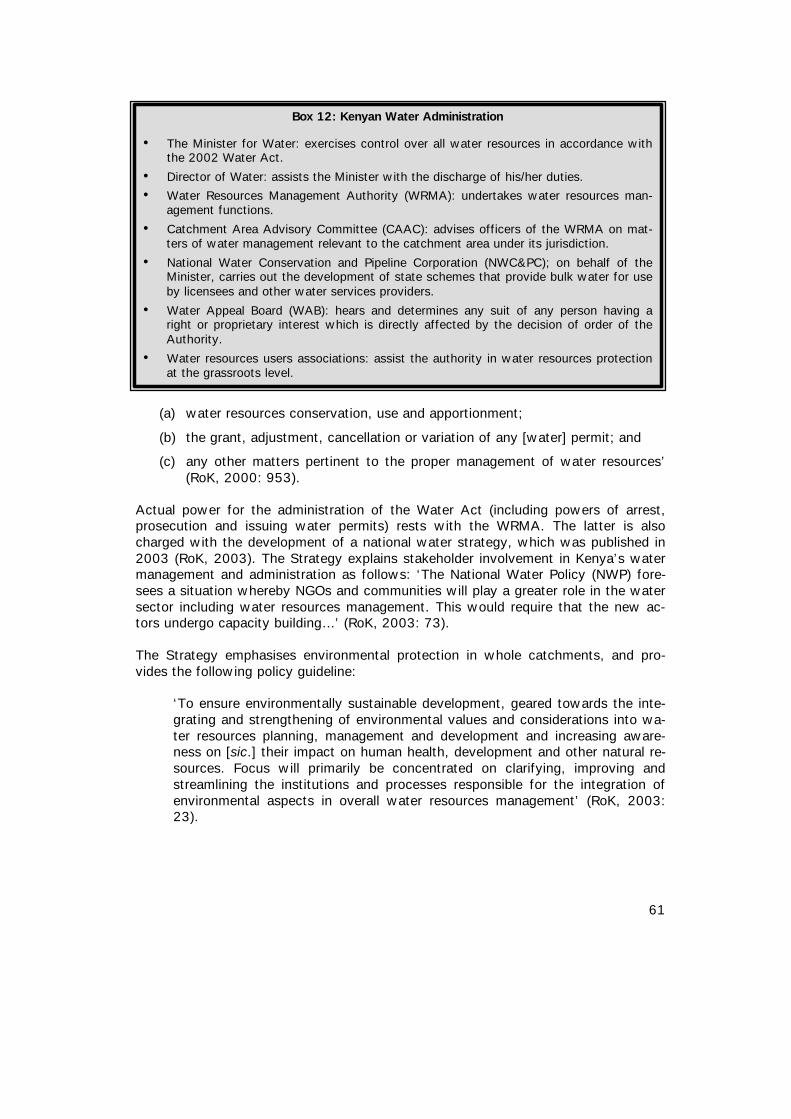
61
(a) water resources conservation, use and apportionment;
(b) the grant, adjustment, cancellation or variation of any [water] permit; and
(c) any other matters pertinent to the proper management of water resources’(RoK, 2000: 953).
Actual power for the administration of the Water Act (including powers of arrest,prosecution and issuing water permits) rests with the WRMA. The latter is alsocharged with the development of a national water strategy, which was published in2003 (RoK, 2003). The Strategy explains stakeholder involvement in Kenya’s watermanagement and administration as follows: ‘The National Water Policy (NWP) fore-sees a situation whereby NGOs and communities will play a greater role in the watersector including water resources management. This would require that the new ac-tors undergo capacity building…’ (RoK, 2003: 73).
The Strategy emphasises environmental protection in whole catchments, and pro-vides the following policy guideline:
‘To ensure environmentally sustainable development, geared towards the inte-grating and strengthening of environmental values and considerations into wa-ter resources planning, management and development and increasing aware-ness on [sic.] their impact on human health, development and other natural re-sources. Focus will primarily be concentrated on clarifying, improving andstreamlining the institutions and processes responsible for the integration ofenvironmental aspects in overall water resources management’ (RoK, 2003:23).
Box 12: Kenyan Water Administration
• The Minister for Water: exercises control over all water resources in accordance withthe 2002 Water Act.
• Director of Water: assists the Minister with the discharge of his/her duties.
• Water Resources Management Authority (WRMA): undertakes water resources man-agement functions.
• Catchment Area Advisory Committee (CAAC): advises officers of the WRMA on mat-ters of water management relevant to the catchment area under its jurisdiction.
• National Water Conservation and Pipeline Corporation (NWC&PC); on behalf of theMinister, carries out the development of state schemes that provide bulk water for useby licensees and other water services providers.
• Water Appeal Board (WAB): hears and determines any suit of any person having aright or proprietary interest which is directly affected by the decision of order of theAuthority.
• Water resources users associations: assist the authority in water resources protectionat the grassroots level.
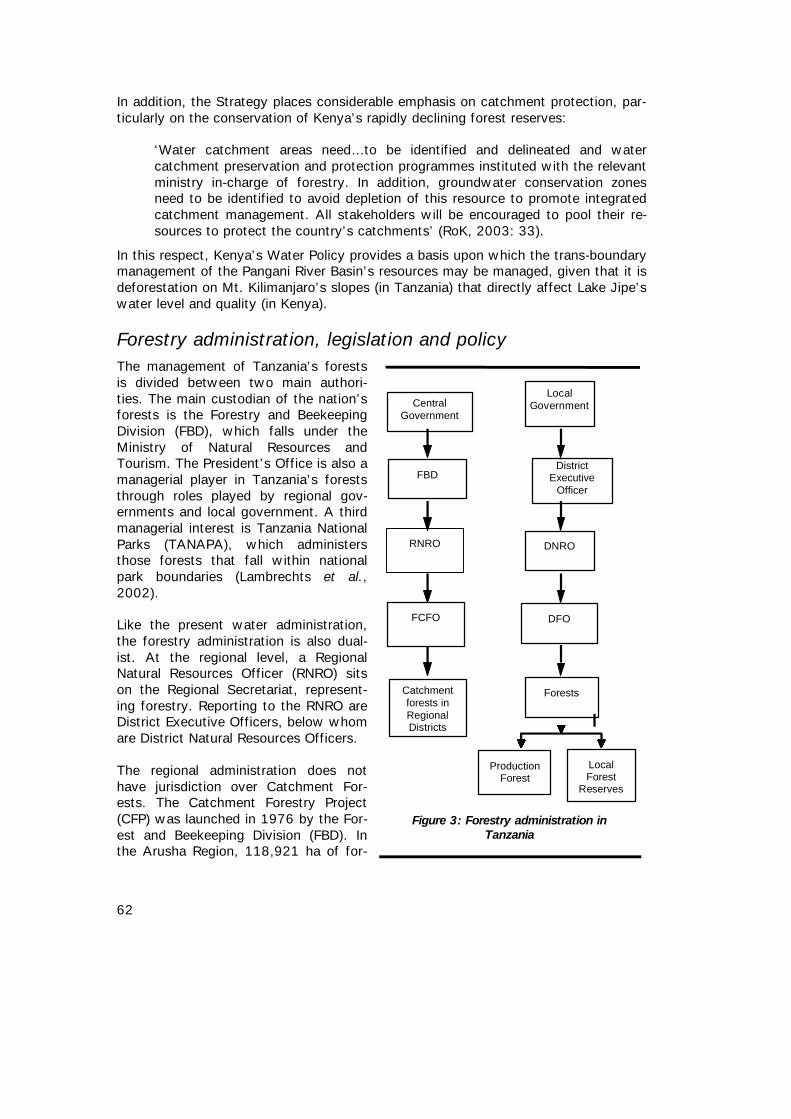
62
In addition, the Strategy places considerable emphasis on catchment protection, par-ticularly on the conservation of Kenya’s rapidly declining forest reserves:
‘Water catchment areas need…to be identified and delineated and watercatchment preservation and protection programmes instituted with the relevantministry in-charge of forestry. In addition, groundwater conservation zonesneed to be identified to avoid depletion of this resource to promote integratedcatchment management. All stakeholders will be encouraged to pool their re-sources to protect the country’s catchments’ (RoK, 2003: 33).
In this respect, Kenya’s Water Policy provides a basis upon which the trans-boundarymanagement of the Pangani River Basin’s resources may be managed, given that it isdeforestation on Mt. Kilimanjaro’s slopes (in Tanzania) that directly affect Lake Jipe’swater level and quality (in Kenya).
Forestry administration, legislation and policyThe management of Tanzania’s forestsis divided between two main authori-ties. The main custodian of the nation’sforests is the Forestry and BeekeepingDivision (FBD), which falls under theMinistry of Natural Resources andTourism. The President’s Office is also amanagerial player in Tanzania’s foreststhrough roles played by regional gov-ernments and local government. A thirdmanagerial interest is Tanzania NationalParks (TANAPA), which administersthose forests that fall within nationalpark boundaries (Lambrechts et al.,2002).
Like the present water administration,the forestry administration is also dual-ist. At the regional level, a RegionalNatural Resources Officer (RNRO) sitson the Regional Secretariat, represent-ing forestry. Reporting to the RNRO areDistrict Executive Officers, below whomare District Natural Resources Officers.
The regional administration does nothave jurisdiction over Catchment For-ests. The Catchment Forestry Project(CFP) was launched in 1976 by the For-est and Beekeeping Division (FBD). Inthe Arusha Region, 118,921 ha of for-
CentralGovernment
DistrictExecutive
Officer
LocalGovernment
Catchmentforests inRegionalDistricts
FCFO
RNRO
FBD
Forests
LocalForest
Reserves
ProductionForest
DFO
DNRO
Figure 3: Forestry administration inTanzania
63
est are covered by the project. In Kilimanjaro Region, it is 138,785, while in Tanga itis 107,499 (Kijazi, 2002). Catchment forests are considered ‘core protected areas’,and are administered from the CFP office in the FBD Headquarters, which reports tocentral government. Reporting to the CFP office are Regional Catchment Forest Man-agers – one in each region. Reporting to these are District Catchment Forest Manag-ers. These managers receive funds straight from the CFP office, and must have amanagement plan for each of the forests within their jurisdiction. These two separatehierarchies are presented in Figure 2. At the district level, District Forestry Officers(DFOs) implement FBD activities, including revenue collection. Most of the time, localand production forests fall under the district administration, but catchment forestsmay also fall within their remit. Because DFOs collect revenues on behalf of the FBD,then all of those holding a diploma or better are paid by the FBD (Kijazi andNashanda, pers. comm.).
The 1998 Forest Policy encourages community participation in the management ofnatural resources and this includes those communities adjacent to mangrove forestreserves. The Management Strategy requires that efforts be made to include localcommunities in different activities, from planning to implementation. Such activitiesinclude control of harvesting, planting mangroves in depleted areas, protection activi-ties like patrols, and awareness creation (Kijazi, 2002).
In Kenya, forests are remarkably under-regulated, a fact borne out by the cripplingrates of deforestation that have ensured that just 2 – 3% of the country is coveredby forest. Urgent remedial measures carried out by the government, including signifi-cant reform of the Forestry Department and the introduction of a new Forestry Bill,have yet to bear fruit. Within Kenya’s portion of the PRB, very few forest reservesremain, except for small patches of forest in the Taita Hills, Kenya’s only representa-tive of the Eastern Arc Mountains. Most of the difficulties associated with deforesta-tion arising in Kenya relate to tree cutting across the border in Tanzania, providing anexcellent example of the need for an adequate cross-border management strategy forthe Basin.
D.3 Community-level administration
Ideas concerning the joint management of resources have, of late, become a much-vaunted option in the management of natural resources. Typically (but not always)the ‘stakeholders’ involved in the management scheme are the state and resourceusing communities. At this broad level of discussion, the concept of joint manage-ment is extremely ambiguous, in part, because of the need to develop Natural Re-sources Management (NRM) systems that are site and society-specific.
Typically, at these levels of managerial intervention, management seeks institutionsas their building blocks. Institutions are “...the rules of the game in a society or, moreformally...the humanly devised constraints that shape human interaction” (North,1993: 3). In this sense, institutions form the limits within which daily lives are con-ducted. Care should be taken to understand that institutions are not static end prod-
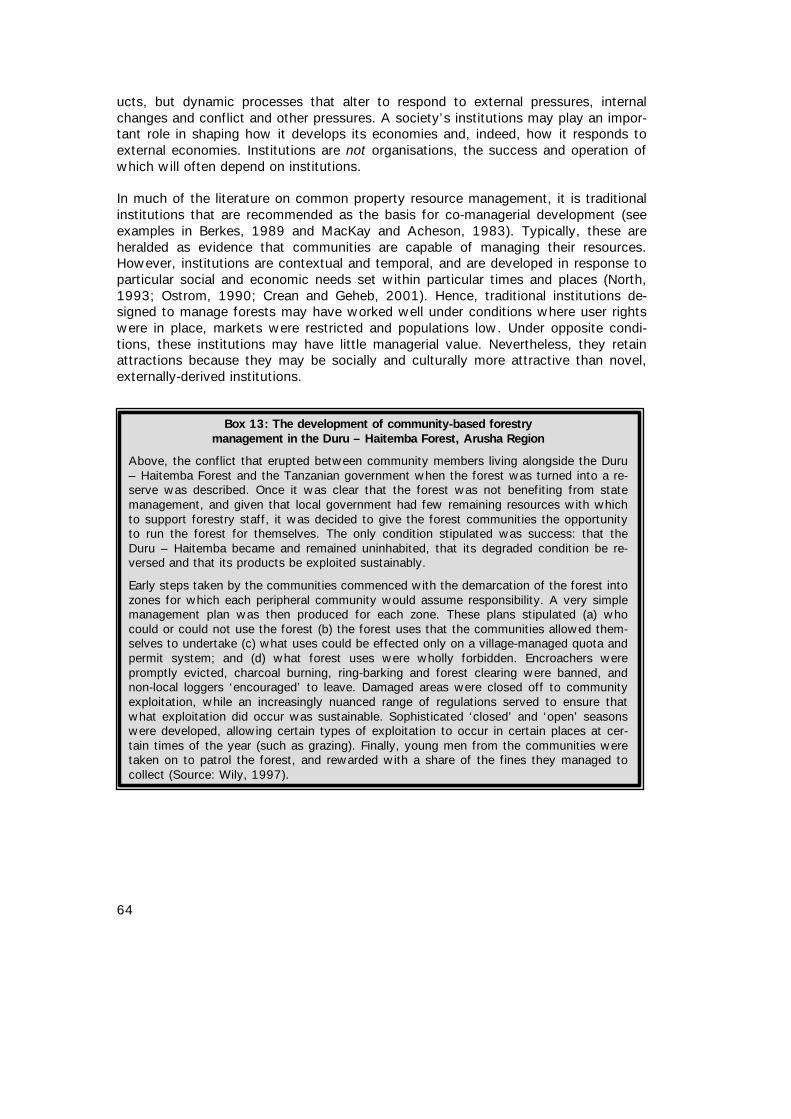
64
ucts, but dynamic processes that alter to respond to external pressures, internalchanges and conflict and other pressures. A society’s institutions may play an impor-tant role in shaping how it develops its economies and, indeed, how it responds toexternal economies. Institutions are not organisations, the success and operation ofwhich will often depend on institutions.
In much of the literature on common property resource management, it is traditionalinstitutions that are recommended as the basis for co-managerial development (seeexamples in Berkes, 1989 and MacKay and Acheson, 1983). Typically, these areheralded as evidence that communities are capable of managing their resources.However, institutions are contextual and temporal, and are developed in response toparticular social and economic needs set within particular times and places (North,1993; Ostrom, 1990; Crean and Geheb, 2001). Hence, traditional institutions de-signed to manage forests may have worked well under conditions where user rightswere in place, markets were restricted and populations low. Under opposite condi-tions, these institutions may have little managerial value. Nevertheless, they retainattractions because they may be socially and culturally more attractive than novel,externally-derived institutions.
Box 13: The development of community-based forestrymanagement in the Duru – Haitemba Forest, Arusha Region
Above, the conflict that erupted between community members living alongside the Duru– Haitemba Forest and the Tanzanian government when the forest was turned into a re-serve was described. Once it was clear that the forest was not benefiting from statemanagement, and given that local government had few remaining resources with whichto support forestry staff, it was decided to give the forest communities the opportunityto run the forest for themselves. The only condition stipulated was success: that theDuru – Haitemba became and remained uninhabited, that its degraded condition be re-versed and that its products be exploited sustainably.
Early steps taken by the communities commenced with the demarcation of the forest intozones for which each peripheral community would assume responsibility. A very simplemanagement plan was then produced for each zone. These plans stipulated (a) whocould or could not use the forest (b) the forest uses that the communities allowed them-selves to undertake (c) what uses could be effected only on a village-managed quota andpermit system; and (d) what forest uses were wholly forbidden. Encroachers werepromptly evicted, charcoal burning, ring-barking and forest clearing were banned, andnon-local loggers ‘encouraged’ to leave. Damaged areas were closed off to communityexploitation, while an increasingly nuanced range of regulations served to ensure thatwhat exploitation did occur was sustainable. Sophisticated ‘closed’ and ‘open’ seasonswere developed, allowing certain types of exploitation to occur in certain places at cer-tain times of the year (such as grazing). Finally, young men from the communities weretaken on to patrol the forest, and rewarded with a share of the fines they managed tocollect (Source: Wily, 1997).
65
A second batch of institutions of potential managerial value are government imple-mented structures and organisations that have been in place for a sufficiently longtime that communities view them as ‘normal’ within the remit of their daily lives. Inthis sense, such structures have become institutionalised to a host society.
As discussed earlier, Tanzania has been keen to establish Community-based NaturalResource Management (CBNRM) institutions in virtually all of its resource areas. Inthe Pangani River Basin (PRB), amongst the most important are Water Users Associa-tions (WUAs) and Village Natural Resources Committees (VNRCs). Attention is givento both of these in this section.
Tagseth (2002) identified two types of village-level furrow organisation. The first ofthese is centred on unnamed and informal groups of users described above, lead by achairman who organises users into work groups to maintain the furrow in return foran allocation of water. Chairmen have typically owned their furrows for generations.This historical claim of the organisation over the furrow and its water means that theorganisation perceives seeking permission to use the furrow’s water from, for exam-ple, the PBWO, as completely alien.
The second type of furrow organisation identified by Tagseth (2002) is much moreformal. Its leader is either elected or appointed. There are more rules governing, forexample, contributions towards the scheme and water allocation. Access to water isregulated with the use of membership fees, fines for violations and possibly bribery.
It is clear that the first of these two types of institutions is the least formal, whichmay render it unappealing to government administrative systems keen to developbureaucratic structures and clarity. It is, however, also based on traditional socialstructures and ideologies which probably mean that (a) it is better able to deal withvery localised difficulties and conflicts; and (b) it is more compatible with local per-ceptions and ways of thinking. In this sense, the first, informal, institution is betterable to deal with the high levels of social, resource and cultural heterogeneity presentin the PRB, while the second may not be able to deal with these kinds of vagaries.
Earlier, thoughts criticising the establishment and implementation of WUAs were dis-cussed. It was claimed that irrespective of the community emphasis contained in thisapproach, WUAs still represented impositions on communities which they had littlerespect for (PAMOJA, 2002). It should be stressed, however, that such institutions,despite being imposed upon communities, may still become ‘socialised’, in the sensethat they may be warped to meet communities’ needs and so as not to endangercommunity livelihood claims. This may not mean that the institution then delivers adesired managerial outcome, however. In order for this to occur, management objec-tives must also, in some way, curb communities’ fears and, to some extent, ensurethat it contributes to meeting their aspirations. In order for this to occur, communi-ties must play an important role in the design and implementation of managementsystems, in particular associated sanctioning (punishment) systems.
The Catchment Forestry Project (CFP) in Tanzania manages forests jointly with localcommunities adjacent to 23 catchment forests on a pilot basis. 36.5% of the forestin the three Tanzanian regions sharing the Pangani River Basin (PRB) is under JointForest Management (JFM: Table 6). The main community component of this initiative
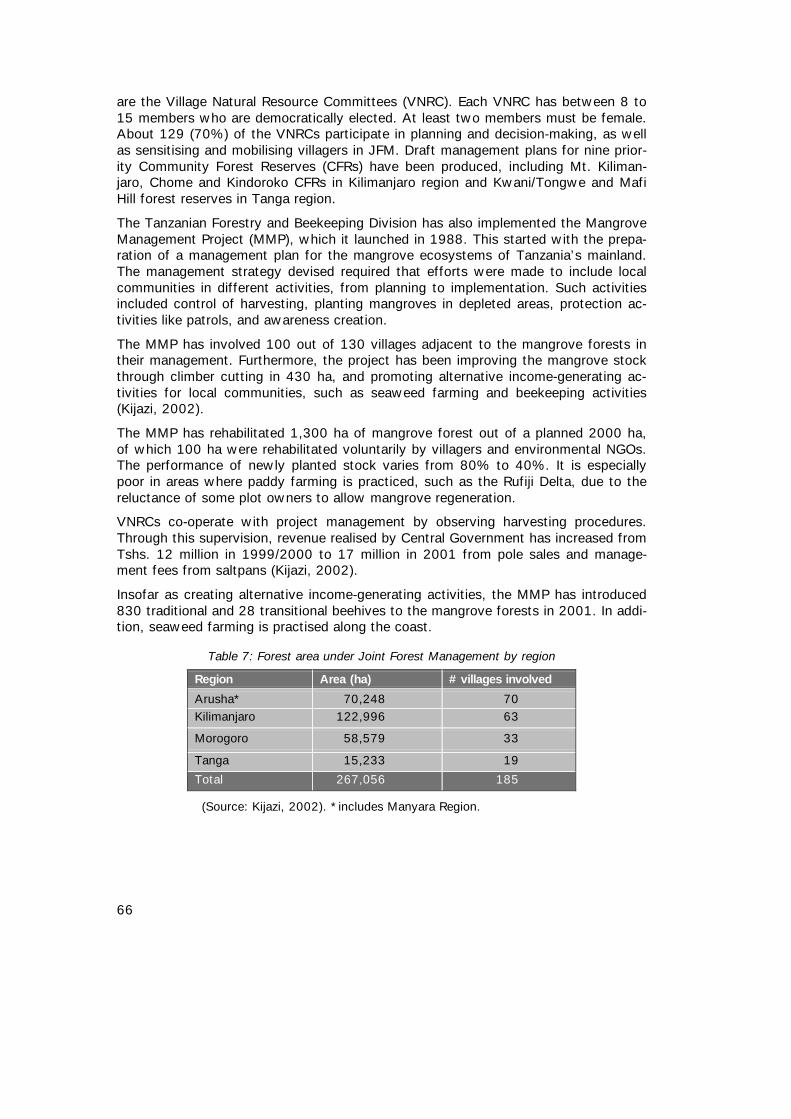
66
are the Village Natural Resource Committees (VNRC). Each VNRC has between 8 to15 members who are democratically elected. At least two members must be female.About 129 (70%) of the VNRCs participate in planning and decision-making, as wellas sensitising and mobilising villagers in JFM. Draft management plans for nine prior-ity Community Forest Reserves (CFRs) have been produced, including Mt. Kiliman-jaro, Chome and Kindoroko CFRs in Kilimanjaro region and Kwani/Tongwe and MafiHill forest reserves in Tanga region.
The Tanzanian Forestry and Beekeeping Division has also implemented the MangroveManagement Project (MMP), which it launched in 1988. This started with the prepa-ration of a management plan for the mangrove ecosystems of Tanzania’s mainland.The management strategy devised required that efforts were made to include localcommunities in different activities, from planning to implementation. Such activitiesincluded control of harvesting, planting mangroves in depleted areas, protection ac-tivities like patrols, and awareness creation.
The MMP has involved 100 out of 130 villages adjacent to the mangrove forests intheir management. Furthermore, the project has been improving the mangrove stockthrough climber cutting in 430 ha, and promoting alternative income-generating ac-tivities for local communities, such as seaweed farming and beekeeping activities(Kijazi, 2002).
The MMP has rehabilitated 1,300 ha of mangrove forest out of a planned 2000 ha,of which 100 ha were rehabilitated voluntarily by villagers and environmental NGOs.The performance of newly planted stock varies from 80% to 40%. It is especiallypoor in areas where paddy farming is practiced, such as the Rufiji Delta, due to thereluctance of some plot owners to allow mangrove regeneration.
VNRCs co-operate with project management by observing harvesting procedures.Through this supervision, revenue realised by Central Government has increased fromTshs. 12 million in 1999/2000 to 17 million in 2001 from pole sales and manage-ment fees from saltpans (Kijazi, 2002).
Insofar as creating alternative income-generating activities, the MMP has introduced830 traditional and 28 transitional beehives to the mangrove forests in 2001. In addi-tion, seaweed farming is practised along the coast.
Table 7: Forest area under Joint Forest Management by region
Region Area (ha) # villages involved
Arusha* 70,248 70Kilimanjaro 122,996 63
Morogoro 58,579 33
Tanga 15,233 19
Total 267,056 185
(Source: Kijazi, 2002). *includes Manyara Region.
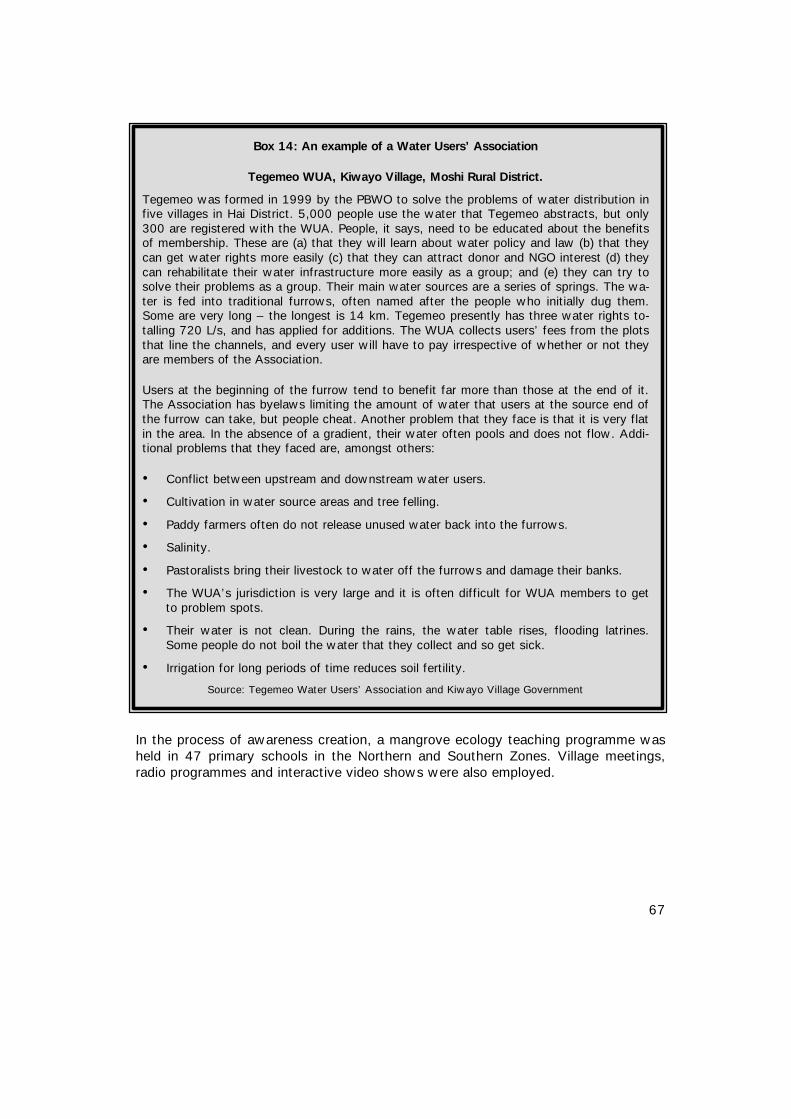
67
Box 14: An example of a Water Users’ Association
Tegemeo WUA, Kiwayo Village, Moshi Rural District.
Tegemeo was formed in 1999 by the PBWO to solve the problems of water distribution infive villages in Hai District. 5,000 people use the water that Tegemeo abstracts, but only300 are registered with the WUA. People, it says, need to be educated about the benefitsof membership. These are (a) that they will learn about water policy and law (b) that theycan get water rights more easily (c) that they can attract donor and NGO interest (d) theycan rehabilitate their water infrastructure more easily as a group; and (e) they can try tosolve their problems as a group. Their main water sources are a series of springs. The wa-ter is fed into traditional furrows, often named after the people who initially dug them.Some are very long – the longest is 14 km. Tegemeo presently has three water rights to-talling 720 L/s, and has applied for additions. The WUA collects users’ fees from the plotsthat line the channels, and every user will have to pay irrespective of whether or not theyare members of the Association.
Users at the beginning of the furrow tend to benefit far more than those at the end of it.The Association has byelaws limiting the amount of water that users at the source end ofthe furrow can take, but people cheat. Another problem that they face is that it is very flatin the area. In the absence of a gradient, their water often pools and does not flow. Addi-tional problems that they faced are, amongst others:
• Conflict between upstream and downstream water users.
• Cultivation in water source areas and tree felling.
• Paddy farmers often do not release unused water back into the furrows.
• Salinity.
• Pastoralists bring their livestock to water off the furrows and damage their banks.
• The WUA’s jurisdiction is very large and it is often difficult for WUA members to getto problem spots.
• Their water is not clean. During the rains, the water table rises, flooding latrines.Some people do not boil the water that they collect and so get sick.
• Irrigation for long periods of time reduces soil fertility.
Source: Tegemeo Water Users’ Association and Kiwayo Village Government
In the process of awareness creation, a mangrove ecology teaching programme washeld in 47 primary schools in the Northern and Southern Zones. Village meetings,radio programmes and interactive video shows were also employed.
68
D.4 Transboundary basin management
Facilities to manage the resources of the Pangani River Basin (PRB) between its bene-factor states of Kenya and Tanzania are limited. Efforts to remedy this difficulty havelargely been based around IUCN - EARO initiatives to conserve Lake Jipe. In Kenya,the Coast Development Authority (CDA) has the mandate to co-ordinate and plandevelopments in the Kenyan portion of the PRB. In 1993, it was determined that theCDA should work towards a comprehensive management and development plan forthose parts of the Basin located in Kenya, as well as looking into ways of dealingwith the specific problems of Lake Jipe. The CDA felt that they should co-operatewith similarly mandated counterparts in Tanzania (Howard, 1999).
In 1994, the CDA and the Pangani Basin Water Office (PBWO) met in Mombasa,Kenya to discuss common interests and possible ways of working together to de-velop a coordinated management system for the Basin, wetlands and the open wa-ters of Lake Jipe. In 1996, the PBWO and the CDA finalised their assessments of theneeds of the Lake Jipe catchment and its wetlands. In 1999, the CDA, PBWB andother stakeholders participated in a workshop to develop mechanisms to manageLake Jipe (Howard, 1999).
The PBWO has now taken the matter of waterweed on Lake Jipe to the legislativeassembly of the East African Community for Action. Since then, the momentum hasslowed, and the need to develop some mechanism by which to co-ordinate manage-ment between the two countries remains as important as ever. This is particularlytrue in the light of recent Kenyan developments that have seen the creation of WaterResources Management authorities. What their creation means for the Pangani RiverBasin and how they will liase with their Tanzanian counterparts is still not known.
D.5 Data collection and monitoring
A persistently raised cause for concern amongst the professionals interviewed forthis Situation Analysis and in the literature on the Pangani River Basin (PRB) relatesto the absence of adequate data on the Basin. Typically, these concerns focus on theabsence of hydrological data, and the worry is that a regulatory system based on theissuance of water rights must be able to know the size of the water stock. Thereexist, on the PRB’s rivers, many hydrological stations. For a variety of reasons –such as poor maintenance and batteries running out – many of these have not oper-ated for a statistically adequate length of time. In some cases, stations have stoppedrunning after just two years of operation, and nothing has been done to return themto service.
It is possible to carry out manual measurements, but the incentive for the technicianto do so had, informants claimed, to be balanced against his/her inadequate remu-neration. Respondents typically seemed preoccupied with the development of anautomated hydrological network against which manual measurements could be com-pared, and which could serve as the backbone of a substantial monitoring system.
69
Monitoring, of course, does not only comprise the collection of data. The translationof such data into a regulatory system is worthwhile only insofar as some sort ofregulatory back-up is available to ensure that these data play a managerially signifi-cant task. Hence, knowing how much fish is available to the Nyumba ya Mungu Damhas no relevance if that information cannot translate into a managerial output. Inmuch the same way, the development of an automated hydrological data collectionsystem makes no sense if illegal water abstractions cannot be prevented.
It is also important to emphasise that data on the technical dimensions of resourcechange (such as reduced flows, or variations in forest area) only yield information onthe outcomes of trends and processes occurring elsewhere, typically in social andeconomic arenas (although not always e.g. climate change). If the causes of envi-ronmental and natural resource change have social and economic origins, it is neces-sary to develop dynamic systems of monitoring socio-economic variation, the under-lying causes of these and the development of conflict. Such systems should also becapable of determining water demand within the Basin.
D.6 Summary of points
The administration of the Pangani River Basin’s (PRB) natural resources is sectoral.The activities of forestry departments are not necessarily synchronised to somewider and over-riding PRB management plan, but the outcome of forestry policies, inmuch the same way that the activities of institutions responsible for water manage-ment react to the nation’s water policy. This sectoralism permeates down into local-level administrative strategies. Hence, Village Natural Resources Committees utilisedin Joint Forestry Management are not the same as Water Users’ Associations. Com-munities located close to fisheries and protected areas, may also be obliged to createBeach Management Units and wildlife protection committees as per the policies ofthe Wildlife Division and the Fisheries Division. The plethora of village-based organi-sations in Tanzania overlay previously created ones like Village Governments. Inmany respects, the tasks that each group is charged with are not dissimilar to thetasks other groups are charged with. Ultimately, all of these organisations have todeal with the fair division of resources within a community, their sustainable exploi-tation and their conservation.
From the above discussion, the following points are emphasised:
• The PBWO is, in many respects, currently crippled by its lack of executive pow-ers and inadequate guiding data upon which to base water allocations. The newTanzanian Water Policy seeks to make the PBWO’s tasks easier to implement, toensure that its administrative hierarchy is clear and internalised, and that it hasthe necessary powers to implement both the policy and any subsequent legisla-tion. In Kenya, the new Water Bill is as yet untested, and its impact on those por-tions of the PRB lying in Kenya as yet unknown.
70
• The Forestry and Beekeeping Division appears not to have any similar plans forrestructuring, and forestry administration within the Basin remains dualised be-tween national and regional level administrations, and between the two countriesthat share the PRB.
• Both the water and forestry policies in the Basin increasingly emphasise the useof community-based organisations in their implementation. Concerns have beenraised as to the extent to which these organisations have been imposed uponcommunities. If communities have not been involved in the design and implemen-tation of these organisations, there may be negative repercussions on manage-ment outputs. An understanding of this problem may yield important lessons forKenya as it seeks to include users in the management of the nation’s resources.
• The transboundary management of the Basin is nascent. There exist, however,authorities with a mandate to manage and develop it on both sides of the Tanza-nia-Kenya border, and discussions geared towards identifying management solu-tions to the Basin's problems have commenced.
• The data collection and monitoring network within the Basin appears to be poor,irrespective of the resource sector. This Chapter has cautioned that emphasisingdata collection as integral to a management system makes no sense if the datacannot generate a managerial follow-through. It also emphasises the need to de-velop methods of monitoring social and economic change, and of establishingwhat the Basin's water demands are, in addition to the technical parameters ofresource change.
The next Chapter sets out to summarise the ‘issues’ that confront the Pangani RiverBasin. It commences with a summary of the issues gained from the proceedings of arecent Pangani River Basin workshop, along with those raised during interviews con-ducted for this Situation Analysis. The Chapter evaluates these issues as a basis forestablishing priority areas for action, and suggestions in this respect are provided inits final section.
71
E Pangani River Basinproblems and issues
E.1 Introduction
This Chapter is based on two sources of in formation. The first is the proceedings ofa workshop on the Pangani River Basin, held in May 2002 in Moshi. The second isthe interviews conducted for the purposes of this Situation Analysis. This Chapter isan attempt to assemble the perspectives of various stakeholders on the Pangani RiverBasin (PRB) as a potential basis upon which to identify priority areas for future ac-tion. The PRB’s issues are divided between environmental issues, socio-economicand political issues, issues of management and administration, areas for researchand, finally, the thoughts of respondents on what the management priorities of theBasin should be. On the basis of these issues, the concluding section lays out anumber of priority areas for action.
In almost every case, the issues considered below occur against a background ofrapid and high population growth and attendant increasing population densities. Thefinite nature of the Basin’s resources ensures that population increases and slow de-velopmental growth within the PRB may create the problems and issues consideredhere, or else exacerbate them.
E.2 Problems and issues of the PRB
Environmental issuesAmongst the Basin’s most serious difficulties is deforestation, which directly affectsits water retention capabilities, increases runoff and hence causes erosion within theBasin. Downstream, such processes ensure that flooding may occur and that the siltload of the Basin’s watercourses is considerable.
In some measure, deforestation has been wrought by high demands for forest prod-ucts. Many of the Basin’s remaining forests contain highly valuable timber, which, inthe absence of any effective monitoring and sanctioning system, is logged fairly eas-ily. Forests are also exploited for charcoal production, as well as for fuelwood tomeet domestic demand. In addition, the Basin’s forests often occupy prime agricul-tural areas. The Eastern Arc forests, for example, are located in high altitude areaswhere rainfall is good. As populations within the Basin increase, the amount of hu-man settlement along forest edges has grown, escalating the risk of forest fires. Fireis also used to clear land for agriculture.
72
In many cases, the farming practises employed have been developed at times whenresources were considerably more abundant than they are now, and may not becompatible with conditions of resource scarcity. Hence, much of the traditional irriga-tion within the Basin is highly inefficient and was developed against a background ofample per capita water supplies. As water abstractions have increased with popula-tion densities, these farming systems can have serious impacts on the Basin’s envi-ronment. These pressures have prompted farming along riverbanks, in stream-valleybottoms and spring sources. Increased siltation has repercussions for the river course(it may prompt meandering), as well as for down-stream industry, particularly hydro-power water retention facilities.
The high farming intensities in the Basin have ensured that soils are increasingly ex-hausted as crop rotation systems are replaced by perennial agriculture. Because landis now rarely fallow, it has to be irrigated to maintain outputs. The Basin’s traditionalwater abstraction systems are very inefficient and the amount of water reachingcrops may be up to 85% less than at the point of abstraction. Repetitive irrigationincreases the likelihood of soil salinisation and/or sodicty. The very large number ofabstractions in the Basin, furthermore, have reduced water flows, presumably in-cluding the amount of water available for environmental maintenance.
In the Basin’s lowland areas, it would appear that livestock numbers have increasedconsiderably, while the amount of pasture has declined as a result of agricultural de-velopment. This has prompted concerns for livestock over-stocking and consequentdegradation of pastoralist lands.
As development within the Basin increases without any concomitant waste disposalsystems, so too the likelihood of pollution at both local and Basin-wide levels hasincreased. Water quality concerns also arise in a different form – locally high levelsof fluoride content can have serious consequences for riparian populations.
Like elsewhere in Tanzania, overfishing within the Basin is a problem, with its coastaland Nyumba ya Mungu (NYM) dam fisheries being of particular concern. In Lake Jipe,the growth of waterweed has been so substantial that fishing is impeded. The latterhas itself been prompted by increased nutrient inflows coming down from agriculturalareas on Mt. Kilimanjaro and the North Pare Mountains. Elsewhere in the Basin, wa-ter hyacinth is a problem.
The problems facing the Basin’s swampland are contrary. On the one hand, thedrainage of swamp has serious repercussions for the regulation of river flow, as wellas the biodiversity supported by such wetlands. On the other hand, the training ofwatercourses (including those that pass through swampland) can increase theamount of water available downstream, particularly for hydropower production. It isnot only the water retained by such swamps that reduce river flows, but also theincreased evapotranspiration rates that they imply.
73
Uncontrolled mining can adversely affect landscapes and may even have pollutionimplications if the extraction of minerals from ore requires the use of chemical proc-esses. Sand mining in river courses can undermine the stability of riverbanks.
Many of the above trends occur against a background of considerable environmentalignorance. On the one hand, these relate to the absence of data concerning the Ba-sin’s flows and the water needed to meet environmental demands. On the otherhand, many of the Basin’s population are unaware of the environmental conse-quences of their economic activities.
The high intensity of resource exploitation, development, manipulation and changewithin the Basin has very serious consequences for the Basin’s biodiversity. The PRBcontains some of the globe’s most outstanding biodiversity resources with high lev-els of associated endemism and many restricted range species. Much of this (but byno means all) is forest-based. With so many of the Basin’s resource bases threatenedin the ways described above, these biodiversity resources face very real and seriousthreats.
Socio-economic and political issuesLike many of Tanzania’s other populations, most of the Pangani River Basin’s (PRB)inhabitants are not wealthy. Although the Basin contains substantial urban conglom-erations, these are not sufficiently large to absorb much of surplus labour containedwithin its rural areas. Many (if not most) of the Basin’s inhabitants are under-educated and/or under-skilled. In any case, even if skills were available, it is doubtfulthat the labour market is sufficiently developed to absorb them. Development withinthe Basin - as elsewhere in Tanzania - has failed to yield alternative income-generating opportunities that match the technical and skills levels of the Basin's in-habitants.
As a result, the only source of livelihood available to many in the Basin is primary i.e.a livelihood based on the direct exploitation of the Basin’s natural resources, be itforests, fisheries, wildlife resources or, most importantly, agriculture. For many, thesuccess of these small-scale ventures is directly related to land and water availability.As populations increase, however, so too does conflict between various types andscales of users. As a result, this Situation Analysis has presented examples of theconflict that occurs between upstream and downstream users, as well as that be-tween large-scale and small-scale ones.
Of course, conflict is but one manifestation of competition for resources. As this in-tensifies in upstream areas of the Basin, agriculturalists are forced to travel down-stream to attempt agriculture in less than adequate farming conditions. As discussedearlier, this takes land out of pastoralist production, bringing agriculturalists into con-flict with livestock herders.
74
As described above, much of the land use within the Basin can have very seriousenvironmental repercussions. Indeed, the nature of these consequences may directlyimpinge upon the ability of the land to support the economic uses to which it is put.In some cases, the political support to alter or stop these trends is absent or evencontrary, with politicians encouraging people to over-exploit resources in order togarner votes.
A final political problem voiced by respondents was that the Central Government ofTanzania, in its efforts to implement policy, may make management and resource-related decisions without reference to administrators and resource managers withinthe Basin. Of particular concern were large-scale developments (such as irrigationschemes and mining concessions) that were perceived to provoke additional, local-ised, conflict or to seriously impact the condition of the resource.
Issues of management and administrationThe Basin’s natural resource management legislation and policy is, in many cases,adequate, but is only potent insofar as it is supported by effective monitoring andlaw enforcement. Monitoring entails not only the ability to observe illegal resourceuse, but also the ability to gauge resource production and change. For example, theabsence of an adequate water flow monitoring network means that the waterauthorities do not know how much water travels through the Basin, and cannottherefore allocate water rights on this basis. Similarly, there exists no methodologyfor monitoring and gauging the social and economic causes that underlie much envi-ronmental degradation and resource over-exploitation.
Monitors assigned by the state to keep an eye on resource trends and exploitationmay be disinclined to monitor the resource if they are not adequately remunerated todo so. Poor remuneration may also be the basis upon which officials are bribed toturn a blind eye on illegal resource use. Low levels of expertise, or the absence ofadequate technology, may also compound resource monitoring difficulties.
Funding problems may affect other aspects of the management system. In the ab-sence of adequate finances, for example, it is difficult to see how an adequate moni-toring system may be implemented within the Basin, regardless of the resource in-volved. Lack of funding may also ensure that such data as can be collected may notbe analysed or findings correctly interpreted. Finally, funding difficulties may also im-pede the development of managerial capacity and efficiency.
In addition, management may be undermined by the manner in which it is arranged.In the Pangani River Basin (PRB), this problem appears to occur on two levels. On theone hand, management is not integrated, so that management activities in one sector– such as the development of irrigation – may have serious repercussions in othersectors – such as water conservation. On the other hand, the lines of authority oftenappear confused, with overlapping administrative jurisdictions or, indeed, inadequatejurisdictions. Hence, the Tanzanian system of central and regional government en-sures that there are potentially two administrative actors involved in the management
75
of any one resource. In Kenya, the developmental mandate of the Coast Develop-ment Authority appears to overlap with that of the newly created Water ResourcesManagement Authority.
Communities of resource users can solve many of the problems of administrativeconfusion and inadequate monitoring via different degrees of participation. In thePRB, the implementation of this process has faced a number of problems. First, manyof the structures by which it is intended that communities should be involved inmanagement have been imposed upon them, with no community participation in ad-ministrative design, in the implementation of management strategies or the sanc-tioning of offenders. Second, because communities may not have much input inmanagement design and implementation, these types of systems may actually un-dermine the ability of communities to meet livelihood needs or their ability to com-pete effectively against other resource users. Thirdly, a plethora of various resource‘committee’ types have been created throughout the Basin, instead of simply in-creasing the mandate of pre-existing village governments. Hence, village-level ad-ministration has been complicated and many Natural Resource Management (NRM)committees have overlapping or contrary jurisdictions. Finally, the lines of communi-cation between central NRM authorities and communities may be inadequately devel-oped. As a result, community demands and views may be overlooked or unrecog-nised. In the same way, the resource management or conservation goals of central-ised NRM authorities may not be understood – or even wholly misunderstood – bycommunities.
The administrative and bureaucratic process may hamper or undermine well-intentioned management gestures. For example, communities of resource users areempowered to create bye-laws which have the recognition of central government,regional and district authorities. However, the process of endorsing these may takeso long that a community’s initiative and managerial momentum is undermined andauthorities perceived not to be supporting them.
Such administrative difficulties may also manifest themselves in other ways. Institu-tions created to improve management may not have the necessary policy or legisla-tive tools or powers to adequately implement their mandate. The Pangani Basin Wa-ter Office (PBWO), for example, has no authority to take action on the ground. Inaddition, it operates through offices over which it does not have authority – e.g. theRegional Hydrologist, the Regional Hydro-geologist and the Regional Laboratory fallunder Water Resources Department and Central Laboratory. Finally, it is not equippedwith adequate water allocation systems.
The Pangani River Basin (PRB) is a cross-border resource. The mechanisms needed toensure that management in both Kenya and Tanzania is harmonised do not exist.
Areas for researchThe above difficulties are, in many respects, exacerbated by the absence of clear andadequate data on the trends and processes that shape the Pangani River Basin (PRB),and affect its management. There is no clear understanding of how the Basin’s in-creasing population will affect its resources in the future. Nor is there a good under-
76
standing of what kinds of Natural Resource Management (NRM) techniques can beemployed that are able to operate under such population densities.
Many of the research demands in the Basin concern its water and hydrology. Thus,while the total number of licensed abstractions are known, accumulated illegal ab-stractions are unknown. In addition, the amount of water required to maintain theBasin’s environmental systems is also unknown. The implications for the PanganiRiver of its training through the Kirua Swamps requires additional research (althoughsee IVO – NORPLAN, 1997). The contribution of Kilimanjaro’s snowcap to the Ba-sin’s water flows is unknown, as are the implications of the cap’s reduction.
Finally, little research has been carried out to identify effective management practisesthat will be able to cope with the Basin’s particular characteristics and problems.There is no understanding of how water may be adequately and fairly distributed be-tween up-stream and down-stream users. There is no knowledge of how a manage-ment system can be efficiently monitored and implemented in an environment char-acterised by inadequate and intermittent funding, limited technical inputs, low skilllevels and poorly developed community involvement. Importantly, the developmentof management systems capable of surviving under such constraints into the futurehas not occurred. Finally, an effective institutional basis upon which the integratedmanagement of the Basin’s resources has not yet been developed.
The management of the PRBDiscussions that occurred during the May 2002 Workshop on the Pangani River Ba-sin, as well as interviews carried out in support of this Situation Analysis, suggesteda number of options that management of the Basin may wish to consider. Amongstthese was the argument that the Basin’s inhabitants need to be aware of the PRBand the functions that it plays. Complaints have been raised that the river basin isnot adequately recognised as an administrative unit, and that vested administrativeand bureaucratic interests do vie to maintain the country's regional and national ad-ministrative emphasis. Funding, respondents said, needs to be adequate, and associ-ated remitting mechanisms need to be efficient.
The management of the Basin will need to ensure that government departments areco-ordinated with other managerial institutions. Good quality data needs to be col-lected to inform management, and management should be integrated. Finally,amongst a number of macro-level planning suggestions put forward was that themanagement of the PRB be linked to population growth control strategies.
Given that many of the Workshop’s participants and the individuals interviewed forthis Situation Analysis came from the water sector, many of the management sug-gestions obtained were concerned directly with water use and its regulation. Hence,it was suggested that management will need to follow clear work plans, whichshould contain measures to deal with water loss and inefficient water use. Manage-ment will need to be able to cater for the fair and adequate allocation of water, andillegal or inappropriate water use must be monitored and sanctioned. Water abstrac-tions should be licensed so that abstractions can be monitored. The management ofthe Basin, respondents argued, would also need to be able to reverse the degradationof water sources, and the PBWO should have an improved fee-collection structure.
77
Some Workshop participants felt that water shortages were not adequately recog-nised in Tanzania’s policies and that this needed to be remedied. In order to ensurethat stakeholders’ views are adequately represented in the Basin’s water manage-ment, calls were made for better stakeholder representation on the PRB Water Board.Finally, an adequate strategy is needed to oversee the implementation of Tanzania’snew Water Policy.
E.3 Priority areas for Action
On the Basis of the above discussion, three priority areas for action are identified:
1. The development of integrated management strategies for the PRB along with at-tendant forums. There appears to be little doubt that the Pangani River Basin(PRB) urgently needs integrated management strategies that can cope with the di-verse and complicated issues that have been described in this Situation Analysis.As such, it is proposed that the first priority area that needs to be considered isthe development of such strategies. Within this remit, attention is drawn to thefollowing constituent parts of any such strategy:
• Integration is necessary in the environmental perceptions of planners and ad-ministrators to ensure that management adopts holistic, basin-wide planningstrategies capable of dealing with the diversity of resources and problemsconfronting the PRB.
• It is important that the river basin should be seen as an administrative unitaround which management integration can occur and resource conflicts canbe resolved. It is also important that the use of the river basin as an adminis-trative unit need not be contrary to the fulfilment of national and regionaladministrative and policy objectives.
• An additional administrative device that could be considered is the adoptionof Water Demand Management (WDM) (see A.2 above). Given that such evi-dence as is available suggests that the Basin’s water supply is stressed, andthat present demand outstrips supply, the implementation of mechanismsthat serve to conserve water and encourage its efficient use would be valu-able within the context of the Basin’s integrated management.
• There is some sense in constructing strategies that can, in their early stages,be implemented incrementally as logistics and funding permits. In the absenceof adequate logistical and financial support, strategies that can only work viaan immediate, blanket, application are likely to fail. One possibility is to focusplanning on the sub-basin.
• The multitude of community-based institutions dealing with all sectors ofnatural resources exploitation is confusing and administratively inefficient.Hence, it makes sense to consider ways in which broad-spectrum local insti-tutions can be developed with the capability and power to tackle all naturalresource management difficulties within their jurisdiction. Each institution will
78
require state support, particularly in the form of endorsing communitybyelaws, and supporting community management initiatives.
• Land use planning should be considered an integral planning strategy from theoutset.
• Planning strategies should be matched against an understanding of capabili-ties and funding in the long run. It makes little sense to develop planningstrategies dependent on funding, data and logistical support that will eitherdisappear once donor funding is withdrawn or which do not match the un-derlying institutional make-up of the Basin.
2. The development of effective strategies to facilitate dialogue amongst and be-tween resource users and managers of different types and involved in differentsectors with a view to improving awareness at all levels of management. Mecha-nisms are needed to ensure that opportunities for dialogue opportunities betweenand amongst stakeholders and managers are maximised, so as to ensure that two-way exchanges of information may occur, dissemination improved and the knowl-edge of how stakeholders all play a part within the well-being of the Basin deliv-ered. It is necessary that awareness is created about all aspects of the conditionand management of the Basin and its stakeholders at all levels of managementand its co-ordination. It is suggested that forums be developed for this purpose,the mandate of which will extend to the resolution of conflict.
In addition, such forums could have administrative and executive powers, in whichall sectors of the Basin’s administration are represented. An important component ofthis process is ensuring that adequate lines of communication and dialogue are es-tablished between the upper echelons of administration with the lowest, community-levels.
The possibility of using radio and other forms of mass media must be considered aspossible avenues for the development of dialogue and effective, two-way, informa-tion dissemination. Care should be taken to ensure that all stakeholders and manag-ers are aware of new policy developments and changes to resource administrationand regulation. The role of forums developed for the purposes of integration shouldbe expanded to include dialogue responsibilities and information exchange. Theseinitiatives could be backed up with extension initiatives, which could also be used toobtain an impression of local concerns and grievances.
3. The identification and development of an adequate data collection and monitoringsystem. This action area is not restricted to the development of data collectionsystems for hydrological data. Satellite and GIS assessments of land use, exploita-tion rates and geographical change are pre-requisites for the development of land-use planning and monitoring. In addition, methodologies designed to monitor andgauge social and economic change and the development of conflict need to beidentified and implemented. The data and monitoring systems recommended mustmatch local funding and maintenance capabilities. Finally, the use of community-based natural resource management organisation as a way of monitoring resourceuse should also be explored.
79
F Conclusions
F.1 Synthesis of findings
It will be recalled that the first objective of the Situation analysis was to identify theresources that occupy the Pangani River Basin (PRB) and the processes and eventsthat affect them.
The Pangani River Basin has a very wide diversity of resources. Some of these, andthe important role they play in the Basin, are as follows:
• Forests play a crucial role in the PRB’s hydrology, serving to regulate water runoff, minimise erosion, store and purify water. In the PRB, they also make a vitalcontribution to global biodiversity.
• Water in the PRB is integral to the Basin’s agricultural economy, its power gen-eration, its urban, industrial and domestic demands and to livestock. It sustainsall life in the Basin.
• The Basin contains four protected areas (PAs). Kilimanjaro, in particular, plays animportant role in the nation’s tourism economy, and also harbours a wide array ofplant and animal species. The Mkomazi Game Reserve and Tsavo West NationalPark are examples of the Maasai – Somali Regional Centre of Endemism (RCE).
• The Basin’s biodiversity is almost unparalleled globally, and the centre of a greatdeal of international interest and conservation concerns.
• The PRB’s fisheries make important nutritional and economic contributions to theBasin’s rural communities.
• The fertile volcanic soils of the Pangani River Basin are the basis of its agricul-tural economy, and turned it into the 'breadbasket of Tanzania'.
• Mining plays an important role in the nation’s economy and in the generation ofemployment. Its benefits must be considered against its negative impacts, in-cluding pollution of the environment and the destabilisation of riverbanks.
The threats faced by the Basin’s resources are almost all related to over-exploitation.At their core, these threats relate to an increasing population against a background ofhigh levels of poverty. Poverty and environmental degradation are often perceived tobe interlinked (cf. WCED, 1987). The problems of managing Common Property Re-sources (CPRs) are often thought to increase when there are large numbers of peopleinvolved, particularly when their cultural homogeneity may be weak (cf. Ostrom,1990). The structure and function of rural livelihoods may become imperilled whenthe ability of rural people to control and secure adequate sources of livelihood isthreatened.
80
Above, the stakeholders of the Basin and their interests were described as follows:
• The major interests within the Basin comprise industrial interests (electricity,mining and farming), farming (large and small scale farming, both associated witha considerable reliance on irrigation), pastoralist interests (particularly in lowlandareas), and growing urban interests. Operating between these diverse interestsand the multiplicity of natural resources within the Basin are NGOs and interna-tional donor agencies. The mandate of these is primarily conservation and/or thedevelopment and enhancement of rural livelihoods.
• It is important to note that the population of the Basin is high. For a large propor-tion of this population, livelihoods are derived from farming, and there is much tosuggest that they are economically vulnerable. In addition, the diversity and rich-ness of the Basin’s resources mean that large(er)-scale interests are attracted tothe Basin, and substantial investments have been made. There exists, betweenthese large-scale interests and small-scale livelihood security, room for conflict.
• This Situation Analysis has divided the PRB’s conflicts into three broad catego-ries. The first relates to conflicts of scale, in which it was argued that small-scaleusers often have to compete against much larger and more powerful claims forthe same resource. The second conflict area identified related to conflicts of ten-ure. 'Tenure' here relates to the right to manage one's resources. It was pointedout that it is increasingly popular in Tanzania to assign communities of resourceusers with various types of associations and/or committees with which to man-age their resources. The hope is that the creation of such institutions will yieldbetter management outcomes. It was argued, however, that the way in whichthese institutions were often imposed upon communities, who then had no inputinto their design, goals or regulations, could potentially undermine the quality oftheir outputs. The third class of conflict related to location. Here, the way inwhich the location of a group of resource users can bring them into conflict withusers elsewhere, was considered. The classic example of such ‘location’ conflictarising between upstream and downstream users was provided. Here, down-stream users suffer from the excesses of upstream users.
Chapter D argued that the administration of the Pangani River Basin’s (PRB) naturalresources is sectoral. The activities of the Forestry and Beekeeping Division is notnecessarily synchronised to some wider and over-riding set of PRB managementstrategies, but the outcome of forestry and beekeeping policies, in much the sameway that the activities of the Pangani Basin Water Office (PBWO) reacts to the na-tion’s water policy.
This sectoralism permeates down into local-level administrative strategies. Thus, inTanzania’s Village Natural Resources Committees utilised in Joint Forestry Manage-ment are not the same as Water Users’ Associations. Communities located close tofisheries and protected areas, may also be obliged to create Beach ManagementUnits and wildlife protection committees as per the policies of the Wildlife Divisionand the Fisheries Division. The plethora of village-based organisations in Tanzaniaoverlay previously created ones like Village Governments. In many respects, thetasks that each group is charged with are not dissimilar to the tasks other groups are
81
charged with. Ultimately, all of these organisations have to deal with the fair divisionof resources within a community, their sustainable exploitation and their protectionfrom outsiders.
In Kenya, conversely, very few such groups exist, although new natural resourcepolicies increasingly seek to incorporate users into their management structures.
Chapter D emphasised the following points:
• The PBWO is, in many respects, currently crippled by its lack of executive pow-ers and the absence of any guiding data upon which to base water allocations.The new Tanzanian Water Policy seeks to make the PBWO’s tasks easier to im-plement, to ensure that its administrative hierarchy is clear and internalised, andthat it has the necessary powers to implement both the policy and any subse-quent legislation. In Kenya, the New Water Policy sees the creation of a WaterResources Management Authority and the inclusion of stakeholders in catchmentmanagement.
• The Forestry and Beekeeping Division appears not to have any similar plans forrestructuring, and forestry administration within the Basin remains dualised be-tween national and regional level administrations. In Kenya, the restructuring ofthe Forestry Department has yet to yield dividends. This may be of little conse-quence to the well-being of the Kenyan part of the basin, which suffers mainlyfrom the consequences of deforestation in Tanzania.
• Both the water and forestry policies in the Basin increasingly emphasise the useof community-based organisations in their implementation. As far as Tanzania isconcerned, there are worries over the extent to which these organisations havebeen imposed upon communities. If communities have not been involved in theirdesign and implementation, management outputs may be less than satisfactory.The lessons that the Tanzanians learn from these experiences may be valuable inthe design and implementation of similar systems in Kenya.
• The data collection and monitoring network within the Basin appears to be poor,irrespective of the resource sector. This Chapter has cautioned that emphasisingdata collection as integral to a management system makes no sense if the datacannot generate a managerial follow-through.
The second Objective of the Situation Analysis was to identify a series of broad ac-tion areas wherein interventions may feasibly be delivered.
Chapter E drew of the proceedings of a workshop on the Pangani River Basin and aseries of interviews with Basin stakeholders to list the problems and issues of theBasin. Based on this, three areas for priority action were identified. These were:
• The development of integrated management strategies for the PRB along withattendant forums There appears to be little doubt that the Pangani River Basin(PRB) urgently needs integrated management strategies capable of coping withthe diverse and complicated issues that have been described in this situationanalysis.
82
• The development of effective strategies to facilitate dialogue amongst and be-tween resource users and managers of different types and involved in differentsectors with a view to improving awareness at all levels of management. Mecha-nisms are needed to ensure that dialogue opportunities between and amongststakeholders and managers are maximised, so as to ensure that two-way ex-changes of information may occur, dissemination improved and the knowledge ofhow stakeholders all play a part within the well-being of the Basin delivered. It isnecessary that awareness is created about all aspects of the condition and man-agement of the Basin and its stakeholders at all levels of management and its co-ordination. Additional components of this priority area are the development of fo-rums capable of assuming this task, as well as serving as a mechanism to rem-edy conflict, and to bridge gaps between different levels of administration.
• The identification and development of an adequate data collection and monitoringsystem. This action area is not restricted to the development of data collectionsystems for hydrological data. A satellite and GIS assessment of land use, exploi-tation rates and geographical change is a pre-requisite for the development ofland-use planning and monitoring. The development of methodologies to assessand gauge the underlying social and economic causes of environmental degrada-tion and resource over-exploitation also needs to be identified. Such systemsshould also be capable of identifying water demands within the Basin. The dataand monitoring systems recommended must match local funding and mainte-nance capabilities.
The third objective of the SA was to identify other organisations, interests or institu-tions with which the IUCN may develop partnership as it seeks to develop the WANIinitiative in the PRB.
In section C6, a number of interventions by NGOs and international organisationswere considered and assessed in terms of their potential contribution to the devel-opment and implementation of integrated management strategies for the PRB. Here,we develop that analysis further, and suggest ways in which these organisationsmay contribute towards the integrated management of the PRB:
• PAMOJA’s expertise lies in the area of developing dialogue, particularly betweengovernment and community interests. This expertise could play a crucial role inthe integration of government planning and administration with local level com-munity resource management. At the same time, it is crucial that communityconcerns and ideas are adequately reflected in government decision-making andactions. PAMOJA can potentially ensure that this can occur.
• The Traditional Irrigation and Environmental Development Organisation (TIP) hasexperience similar to that of PAMOJA, and could enhance its application. Ofgreater interest, however, are the technical inputs that TIP can supply in the formof furrow design and development that can improve water conveyance systemsand their administration.
• The Tanzania Forestry Action Plan’s (TFAP) experience in the development oflocal level, integrated, resource problem solutions appear particularly pertinent tothe Pangani River Basin. The development of such systems for communities living
83
alongside the Basin’s forests would be a welcome component to any effectivemanagement planning within the Basin. If coupled with the activities of the Tan-zania Forest Conservation Group (TFCG), the coverage of these initiatives couldbe increased, the two organisations could mutually benefit from their shared ex-periences and knowledge, and an effective strategy for dealing with forest lossand degradation developed.
• Tanga Coastal Zone Conservation and Development Programme (TCZCDP) pos-sesses important practical experience in the development of an integrated naturalresource management strategy, from which the PRB could learn and potentiallybuild upon, expanding these lessons upwards and away from the TCZCDP’s ju-risdictional area. The jurisdiction of the Tanzania Coastal Management Partner-ship (TCMP) is considerably larger, and for that reason, the latter NGO could pos-sess valuable experience on the integrated management of large areas containinga very wide variety of natural resources.
• The River Basin Management and Smallholder Irrigation Improvement Project(RBMSIIP) is the only project to have attempted a Basin-wide approach to solvingthe PRB’s problems. In addition, it has also sought to integrate water conserva-tion issues with water development initiatives. The knowledge possessed by theProject in these areas is extremely important for the development of managementstrategies for the Basin. In addition, the experience of the Project in the develop-ment of a hydrological data collection network for the Basin is also pertinent forthe PRB.
• The UNDP-GEF East Africa Cross-border Biodiversity Project (EACBP) experiencewith cross-border resource management is important for the PRB. In addition, theEACBPs experiences with the development and implementation of community-based joint forestry management could be useful for the integrated managementof the Basin.
F.2 The Pangani River Basin and the WANI criteriaIn the introduction, the seven criteria required for a river basin to be included inWANI were listed. In this, the final section of the Situation Analysis, the extent towhich the PRB meets these criteria is considered.
• Considerable pressure on water and environmental resources
The discussion in Chapter C emphatically demonstrated the very serious water andenvironmental problems confronting the Pangani River Basin, which, it argued, havearisen from high population densities, and management difficulties that ensure thatresource exploitation is under-regulated.
• Biodiversity and ecosystem goods and services are threatenedChapter C also considered the very important biodiversity and ecosystems present inthe PRB. The Basin’s Eastern Arc and Coastal Forests, for example, are amongst just25 biodiversity hotspots in the world. The threats facing these forests and other re-sources within the basin have attracted international concern and conservation atten-tion.
84
• There may be inequality in the distribution of benefits in the catch-ment
The diverse resources of the PRB have attracted the interests of large-scale invest-ments, which have ensured that the conflicts that characterise the exploitation ofresources in the Basin are often between large- and small-scale users. The variablealtitude of the Basin, furthermore, means that water resources are plentiful in someparts of the Basin and not in others. The Basin displays widely distributed resourcesand uneven patterns of access to them. Finally, these uneven resource distributionand exploitation patterns occur against a background of national poverty, poor healthand slow economic development, accentuating the Basin’s difficulties.
• People are willing to act
The establishment of water users associations and other resource user groups in theBasin suggests local level desire to establish managerial control over their resources,not least a willingness to act. The various sectoral agencies responsible for the ad-ministration of the Basin are acutely aware of its problems and are anxious for assis-tance to solve these and to develop a managerial capacity capable of dealing withthe Basin’s problems.
Caution must, however, be exercised so that communities genuinely feel that suchresources committees represent their interests and are not merely some externallyderived notion that serves to inconvenience their lives.
• Where capacity exists to implement a projectHuman resources in the form of communities, international and non-governmentalorganisations and governmental agencies are ample. The technical and funding de-mands of any intervention will have to be evaluated and additional assessment ofcapacities made on this basis.
• Chances of success existThe diversity of resource issues, conflicts, interests and high degrees of povertymean that any intervention in the Pangani River Basin is going to yield variable out-puts and patchy success. Needless to say, the degree of success sought depends onthe level at which it is pegged.
• Opportunities for funding such a project existThe Basin-wide approach that WANI implies, the extreme poverty in the Basin andthe opportunities for developing community-based management strategies are all fac-tors that may appeal to donor agencies.
85
G References
Published sources:
Akitanda, P. 2002. South Kilimanjaro catchment forestry management strategies:perspectives and constraints for integrated water resources management inPangani Basin. In Ngana, J. O. (ed.) Water resources management: the caseof Pangani River Basin. Issues and approaches. Dar es Salaam, Dar es SalaamUniversity Press: 152 – 160.
Baker, N. E. and Baker, L. M. 2001. Tanzania. In Fishpool, L. D. C. and Evans, M. I.(eds.) Important bird areas of Africa and its associated islands: priority areasfor conservation. Newbury and Cambridge, UK, Pisces Publications and Bird-Life International (BirdLife Conservation Series No. 11).
Baldwin, R. R. 1946. Native Authority afforestation on Mt. Kilimanjaro. TanzaniaNotes and Records 21 (1946): 81 – 84.
Bergkamp, G., Orlando, B. and Burton, I. 2003. Change: Adaptation of water re-sources to climate change. IUCN/WANI. Gland, Switzerland and Cambridge,UK, World Conservation Union.
Berkes, F. (ed.) 1989. Common property resources: ecology and community basedsustainable development. London, Belhaven Press.
Burgess, N., FitzGibbon, C. and Clarke, P. 1996. Coastal Forests. In: McClanahan, T.R. and Young, T. P. (eds.) East African ecosystems and their conservation.New York, Oxford University Press: 329 – 359.
Bwathondi, P. O. J. and Mwamsojo, G. U. J. 1993. The status of the fishery re-source in the wetlands of Tanzania. G. L. and Crafter, S. A. (eds.) Wetlandsof Tanzania: proceedings of a seminar on the wetlands of Tanzania, Moro-goro, 27 – 29 November, 1991. IUCN, Gland, Switzerland: 49 – 60.
Cheke, R. A., Mann, C. F. and Allen, R. 2001. Sunbirds: A guide to the sunbirds,flowerpeckers, spiderhunters and sugarbirds of the world. Helm IdentificationGuides. London, Christopher Helm.
Conway, G. R. and Barbier, E. B. 1990. After the green revolution: sustainable agri-culture for development. London, Earthscan Publications Ltd.
Cordeiro, N. J. 1998. A preliminary survey of the montane avifauna of Mt Nilo, EastUsambaras, Tanzania. Scopus 20 (May 1998): 1 – 18.
Crean, K. and Geheb, K. 2001. Sustaining appearances: sustainable development andthe fisheries of Lake Victoria. Natural Resources Forum 25 (2001): 215 –224.
86
Dadzie, S., Haller, R. D. and Trewavas, E. 1988. A note on the fishes of Lake Jipeand Chale [sic.] on the Kenya – Tanzania Border. Journal of the East AfricanNatural History Society and National Museum 78 (192): 46 –51.
Dobson, E. B. 1940. Land tenure of the Wasambaa. Tanzania Notes and Records 10(1940): 1 – 27.
Ellis, F. 2000. Rural livelihoods and diversity in developing countries. Oxford, OxfordUniversity Press.
Evans, T. D. 1997. Records of birds from the forests of the East Usambara lowlands,Tanzania, August 1994 – February 1995. Scopus 19 (1997): 92 – 108.
FAO (Food and Agricultural Organization), 2001. Food Balance Sheets. www.fao.org.Rome, Food and Agricultural Organization.
Ferguson-Lees, J. and Christie, D. A. 2001. Raptors of the world. Boston, HoughtonMifflin Company.
Geological Survey, 1960. Summary of the geology of Tanganyika. Part II: Geologicalmap. Dar es Salaam, Geological Survey, Ministry of Mines and Commerce.
Gillingham, M. E. 1999. Gaining access to water: formal and working rules of indige-nous irrigation management on Mount Kilimanjaro, Tanzania. Natural Re-sources Journal 39 (3): 419 – 441.
GWP, 2002. Policy guidance and operational tools. ToolBox: Integrated Water Re-sources Management, Version 1. Global Water Partnership.
Hastenrath, S. and Greischar, L. 1997. Glacier recession on Kilimanjaro, East Africa.Journal of Glaciology 43 (145): 455 – 459.
Homewood, K. and Brockington, D. 1999. Biodiversity, conservation and develop-ment in Mkomazi Game Reserve, Tanzania. Global Ecology and Biodiversity1999 (8): 301 – 313.
Howard, G. (ed.). 1999. Lake Jipe Cross-border Planning Workshop on a Proposal forthe Development of Mechanisms for Trans-boundary Management of aShared Ecosystem. 13th - 15th October, 1999, Moshi (Tanzania and Taveta(Kenya). IUCN - The World Conservation Union, Eastern Africa Regional Pro-gramme. Nairobi, December, 1999.
Howard, G. 2002. Integrated River Basin Management (IRBM). In: The Pangani RiverBasin: Options for Integrated Management. Report on a Workshop held at theKilimanjaro Crane Hotel, Moshi, Tanzania, 8 – 10 May, 2002. Nairobi, IUCN– EARO: 92 - 95.
IUCN, 1999. Situation Analysis: an IUCN approach and method for strategic analysisand planning based on the experience of IUCN Regional and HQ programmes.Prepared by the M&E Initiative. Revised July 1999. Gland, The World Con-servation Union (IUCN).
87
IVO – NORPLAN 1997. Pangani River Training Project Feasibility Study. PBWO –TANESCO, Pangani Falls Redevelopment. IVO International and NORPLANA/S.
Johnston, P. H. 1946. Some notes on land tenure on Kilimanjaro and the kihamba ofthe Wachagga. Tanzania Notes and Records 21 (1946): 1 – 20.
Kaihura, F. B. S., Stocking, M. and Kahembe, E. 2001. Soil management and agrodi-versity: a case study from Arumeru, Arusha, Tanzania. Paper presented tothe symposium on Managing Biodiversity in Agricultural Systems, Montreal,Canada, November 8 - 12, 2001.
Keith Eltringham, S., Morley, R. J., Kingdon, J., Coe, M. J. and McWilliam, N. C.1999. Checklist: Mammals of Mkomazi. In Coe, M. J., McWilliam, N. C.,Stone, G. N. and Packer, M. J. (eds.). Mkomazi: the ecology, biodiversity andconservation of a Tanzanian Savanna. London, Royal Geographical Society(with the Institute of British Geographers): 505 – 510.
Keith Eltringham, S., Cooksey, I. A., Dixon, W. J. B., Raine, N. E., Sheldrick, C. J.,McWilliam, N. C. and Packer, M. J. 1999. Large mammals of Mkomazi. InCoe, M. J., McWilliam, N. C., Stone, G. N. and Packer, M. J. (eds.). Mko-mazi: the ecology, biodiversity and conservation of a Tanzanian Savanna.London, Royal Geographical Society (with the Institute of British Geogra-phers): 485 – 504.
Kijazi, A. S. 2002. Catchment and mangrove management programmes: activitiesand environmental concerns in the Pangani Basin. In: The Pangani River Ba-sin: options for management. Report of a Workshop held at the KilimanjaroCrane Hotel, Moshi, Tanzania, 8-10 May 2002. December 2002. Nairobi,IUCN – EARO: 36 - 40.
Lambrechts, C., Woodley, B., Hemp, A., Hemp, C. and Nnyiti, P. 2002. Aerial surveyof the threats to Mt. Kilimanjaro forests. Dar es Salaam, GEF Small GrantsProgramme, UNDP.
Lein, H. 2002. Migration, irrigation and land-use changes in the lowlands of Kiliman-jaro, Tanzania. In Ngana, J. O. (ed.) Water resources management: the caseof Pangani River Basin. Issues and approaches. Dar es Salaam, Dar es SalaamUniversity Press: 28 – 38.
Lovgren, S. 2001. All That Glitters. With Rena Singer and David Enrich. U.S. News &World Report, 131 (6), 13/8/2001.
Luhikula, G. 2002. The Tanzania Coastal Management Partnership (TCMP): a partnerin conservation. In: The Pangani River Basin: Options for Integrated Manage-ment. Report on a Workshop held at the Kilimanjaro Crane Hotel, Moshi, Tan-zania, 8 – 10 May, 2002. Nairobi, IUCN – EARO: 86 – 90.
Majtenyi, C. and Muindi, M. 2001. Tanzania: big is beautiful at Merelani. New Afri-can, Oct. 2001, Issue 400.
Makule, D. E. n.d. The Pangani Basin Water Resources Management.http://srdis.ciesin.columbia. edu/cases/tanzania-019.html
88
Mbonile, M. J. 2002. Rural population mobility in the Pangani Basin, Tanzania. InNgana, J. O. (ed.) Water resources management: the case of Pangani RiverBasin. Issues and approaches. Dar es Salaam, Dar es Salaam UniversityPress: 14 – 27.
McCay, B. J. and Acheson, J. M. (eds.) 1987. The question of the commons: theculture and ecology of communal resources. Tucson, University of ArizonaPress.
McClanahan, T. R. and Young, T. P. (eds.) 1996. East African ecosystems and theirconservation. New York, Oxford University Press.
Mgongo, E. N. E. 2002. Tanga Coastal Zone Conservation and Development Pro-gramme: activities and concerns in the Lower Pangani River Basin. In: ThePangani River Basin: Options for Integrated Management. Report on a Work-shop held at the Kilimanjaro Crane Hotel, Moshi, Tanzania, 8 – 10 May,2002. Nairobi, IUCN – EARO: 81 – 85.
Misana, S. and Makoi, J. 2001. The impact of irrigation on soil fertility and salin-ity/sodicity in the Pangani River Basin. In Ngana, J. O. (ed.). Water resourcesmanagement in the Pangani River Basin: challenges and opportunities. Dar esSalaam, Dar es Salaam University Press: 83 – 103.
Mjata, P. J. 2002. The Traditional Irrigation and Environmental Development Organi-sation (TIP). In: The Pangani River Basin: Options for Integrated Management.Report on a Workshop held at the Kilimanjaro Crane Hotel, Moshi, Tanzania,8 – 10 May, 2002. Nairobi, IUCN – EARO: 78 – 80.
Mkhandi, S. and J. O. Ngana 2001. Trend analysis and spatial variability of annualrainfall. In Ngana, J. O. (ed.). Water resources management in the PanganiRiver Basin: challenges and opportunities. Dar es Salaam University Press,Dar es Salaam. 150pp.: 11 - 20
Mkuula, S. 1993. Pollution of wetlands in Tanzania. In: Kamukala, G. L. and Crafter,S. A. (eds.) Wetlands of Tanzania: proceedings of a seminar on the wetlandsof Tanzania, Morogoro, 27 – 29 November, 1991. IUCN, Gland, Switzerland:85 – 93.
Mpemba, E. B. 1993. Wildlife resources and tourism in wetlands of Tanzania. In:Kamukala, G. L. and Crafter, S. A. (eds.) Wetlands of Tanzania: proceedingsof a seminar on the wetlands of Tanzania, Morogoro, 27 – 29 November,1991. IUCN, Gland, Switzerland: 61 – 66.
Mtalo, F. W. and Ndomba, P. M. Estimation of soil erosion in the Pangani Basin up-stream of Nyumba ya Mungu Reservoir. In Ngana, J. O. (ed.) Water resourcesmanagement: the case of Pangani River Basin. Issues and approaches. Dar esSalaam, Dar es Salaam University Press: 196 – 210.
Mujwahuzi, M. R. 2001. Water use conflicts in the Pangani Basin. In Ngana, J. O.(ed.). Water resources management in the Pangani River Basin: challengesand opportunities. Dar es Salaam, Dar es Salaam University Press: 128 –137.
89
Musyoki, M. M. 2003. The situation analysis of the Kenyan part of the Pangani RiverBasin Catchment: the Lake Jipe Watershed and system. Mombasa, Kenya:The Coast Development Authority, April 2003.
Musyoki, M. M. and Mwandotto, B. A. J. 1999. Presentation of results/reports onthe assessment of management needs for the watershed wetlands and wa-ters of Lake Jipe. Paper presented at the Lake Jipe Cross-border Workshop,13th - 15th October, 1999.
Mwamfupe, D. 2001. Shortage of water for irrigation and farmers’ response: a casestudy of Makuyuni and Kahe wards of Kilimanjaro Region, Tanzania. InNgana, J. O. (ed.). Water resources management in the Pangani River Basin:challenges and opportunities. Dar es Salaam, Dar es Salaam University Press:73 - 82
Mwamfupe, D. G., 2002. The role of non-farm activities in household economies: acase study of Pangani Basin, Tanzania. In Ngana, J. O. (ed.) Water resourcesmanagement: the case of Pangani River Basin. Issues and approaches. Dar esSalaam, Dar es Salaam University Press: 39 – 47.
Newmark, W. D. 1998. Forest area, fragmentation, and loss in the Eastern ArcMountains: implications for the conservation of biological diversity. Journal ofEast African Natural History 87 (1998): 1 – 8.
Ngana, J. O. 2001. Integrated water resources management: the case of the PanganiRiver Basin. In Ngana, J. O. (ed.). Water resources management in the Pan-gani River Basin: challenges and opportunities. Dar es Salaam, Dar es SalaamUniversity Press: 1 - 8
Ngula, D. E. P. 2002. Pangani River Basin: power generation and the environment.In: The Pangani River Basin: options for management. Report of a Workshopheld at the Kilimanjaro Crane Hotel, Moshi, Tanzania, 8-10 May 2002. De-cember 2002. Nairobi, IUCN – EARO: 67 – 71.
North, D. 1990. Institutions, institutional change and economic performance. Cam-bridge, Cambridge University Press.
Nshubemuki, L. 1993. Forestry resources in Tanzania’s wetlands: concepts and po-tentials. In: Kamukala, G. L. and Crafter, S. A. (eds.) Wetlands of Tanzania:proceedings of a seminar on the wetlands of Tanzania, Morogoro, 27 – 29November, 1991. IUCN, Gland, Switzerland:
Ole Sikar, T. Conflicts over natural resources in Maasai district of Simanjiro, Tanza-nia. Forests, trees and people - Newsletter No. 30, March 1996.
Ostrom, E. 1990. Governing the commons: the evolution of institutions for collectiveaction. Cambridge University Press, Cambridge.
PAMOJA, 2002. Dialogue on Water: A concept paper on water resource use andmanagement of conflicts in the Pangani River Basin: the possible role ofPAMOJA. Moshi, PAMOJA.
90
Richmond, M. D. (ed.) 1997. A guide to the seashores of Eastern Africa and theWestern Indian Ocean Islands. SIDA/Department for Research Cooperation,SAREC.
Rodgers, A. Mugabe, J. and Muthenge, C. 2001. Beyond Boundaries: Regional Over-view of Transboundary Natural Resource Management in Eastern Africa. InBiodiversity Support Program, Beyond Boundaries: Transboundary Natural Re-source Management in Eastern Africa. Washington, D.C., U.S.A.: BiodiversitySupport Program.
Rodgers, W. A. The Miombo Woodlands. In McClanahan, T. R. and Young, T. P.(eds.) East African ecosystems and their conservation. New York, OxfordUniversity Press: 299 - 325.
RoK (Republic of Kenya) 2002. Kenya Gazette Supplement. Acts, 2002 (no. 9); TheWater Act, 2002. Nairobi, October 24th, 2002. Nairobi, The GovernmentPrinter.
RoK (Republic of Kenya) 2003. The First National Water Resources ManagementStrategy. Nairobi, Ministry of Water Resources Management and Develop-ment, April 2003.
Røhr, P. C. and Killingtveit, Å. 2002. Study of two catchments on the hillside of Mt.Kilimanjaro. In Ngana, J. O. (ed.) Water resources management: the case ofPangani River Basin. Issues and approaches. Dar es Salaam, Dar es SalaamUniversity Press: 211 – 231.
Røhr, P. C. , Ngana, J. and Killingtveit, Å. 2002. Investigations of Chemka Spring,Kilimanjaro Region, Tanzania. In Ngana, J. O. (ed.) Water resources manage-ment: the case of Pangani River Basin. Issues and approaches. Dar es Sa-laam, Dar es Salaam University Press: 265 - 272.
Røhr, P. C., Killingtveit, Å., Nderingo, G. M. and Kigadye, P. E. n.d. Water and envi-ronmental conflicts in the Pangani River Basin – hydropower or irrigation?Undated manuscript.
Røhr, P. C., Killingtveit, Å Rumambo, O. H. 2002. Brief report on the River BasinManagement Project in Tanzania. In: The Pangani River Basin: options formanagement. Report of a Workshop held at the Kilimanjaro Crane Hotel,Moshi, Tanzania, 8-10 May 2002. December 2002. Nairobi, IUCN – EARO:44 – 48.
Sahib, I. 2002. The Tanzania Planting Company. In: The Pangani River Basin: optionsfor management. Report of a Workshop held at the Kilimanjaro Crane Hotel,Moshi, Tanzania, 8-10 May 2002. December 2002. Nairobi, IUCN – EARO:72 – 73.
Sarmett, J. D. and Kamugisha, S. M. 2002 Control of water utilisation in the PanganiBasin: the role of PBWO and PBWB. In: The Pangani River Basin: options formanagement. Report of a Workshop held at the Kilimanjaro Crane Hotel,Moshi, Tanzania, 8-10 May 2002. December 2002. Nairobi, IUCN – EARO:19 – 24.
91
Schechambo, F. 2002. Forest valuation and economic policies: learning from MountMeru Forest Reserve. In Ngana, J. O. (ed.) Water resources management: thecase of Pangani River Basin. Issues and approaches. Dar es Salaam, Dar esSalaam University Press: 161 – 169.
Sishira, E. K. 2002. Land use change and sustainability of water resource utilisationin The Pangani River Basin downstream of the Nyumba ya Mungu. In Ngana,J. O. (ed.) Water resources management: the case of Pangani River Basin. Is-sues and approaches. Dar es Salaam, Dar es Salaam University Press: 83 –89.
Sjöholm, H. and Luono, S. 2002. The green forest pastures of Suledo - Maasai com-munities organise to save their forests and secure their livelihoods. Forests,trees and people - Newsletter No. 46, September, 2002.
Stoorvogel, J. J. and Smaling, E. M. A. 1990. Assessment of soil nutrient depletionin sub-saharan Africa: 1983 - 2000. Vol. 1, Main Report. Wageningen, TheNetherlands, Winand Staring Centre for Integrated Land, Soil and Water Re-search.
Tagseth, M. 2002. Local practises and changes in farmer-managed irrigation in theHimo Catchment, Kilimanjaro. In Ngana, J. O. (ed.) Water resources man-agement: the case of Pangani River Basin. Issues and approaches. Dar esSalaam, Dar es Salaam University Press: 48 - 63.
TANESCO, 1994. Environmental Impact Assessment of the redevelopment of thehydro-electric power station at Pangani Falls: Baseline studies: mitigation ofadverse impacts and monitoring the attainment of intended mitigation. IVO –NORPLAN Joint Venture.
URT (United Republic of Tanzania), 2002. National Water Policy. Dar es Salaam,Ministry of Water and Livestock Development.
Vanden Bossche, J.-P. and Bernacsek, G. M. 1990. Sourcebook for the inland fisheryresources of Africa. Vol. 1. Cifa Technical Paper 18/1. Rome, Food and Agri-cultural Organization.
Warren, A. 1995. Changing understandings of the nature of environmental para-digms. Transactions of the Institute of British Geographers NS 20 (1995):193 - 203.
W.C.E.D. 1987. Our common future. Oxford, O.U.P for the World Commission onEnvironment and Development.
W.C.M.C. (World Conservation Monitoring Centre). 1985. Arusha National ParkFactsheet. www.unep.wcmc. org
W.C.M.C. (World Conservation Monitoring Centre). 1987. Kilimanjaro National ParkFactsheet. www.unep. wcmc.org
Wegelin-Schuringa, M. 1998. Water Demand Management and the Urban Poor. TheNetherlands, IRC International Water and Sanitation Centre.
92
West, K. 2002. The Water and Nature Initiative Challenge. In: The Pangani River Ba-sin: Options for Integrated Management. Report on a Workshop held at theKilimanjaro Crane Hotel, Moshi, Tanzania, 8 – 10 May, 2002. Nairobi, IUCN– EARO: 95 – 96.
WHO (World Health Organization). 2001. National health statistics. www.who.org.Geneva, World Health Organization.
Wily, L. 1999. Moving forward in African community forestry: trading power, notuse rights. Society and Natural Resources 12 (1999): 49 – 61.
Wilson, D. C., Medard, M. Harris, C. K. and Wiley, D. S. 1996. Potentials for coman-agement of the Nile perch fishery – Lake Victoria, Tanzania. Paper presentedat the ‘Voices from the Commons’ conference, International Association forthe study of common property, Berkeley, CA, June 5-8, 1996.
UNICEF (United Nations International Children’s Emergency Fund). 2001. The Stateof the World’s Children 2000. www.unicef.org. New York, UNICEF.
Yanda, P. Z. and Shishira, E. K. 2001. Forestry conservation and resource utilisationon the southern slopes of Mount Kilimanjaro: trends, conflicts and resolu-tions. In Ngana, J. O. (ed.). Water resources management in the PanganiRiver Basin: challenges and opportunities. Dar es Salaam, Dar es Salaam Uni-versity Press: 104 - 117.
Zimmerman, D., Turner, D. Pratt, D Willis, I. 1996. Birds of Kenya and Northern Tan-zania. London, Christopher Helm.
Interview sources
Burra, R., Advisor, PAMOJA, Arusha 13th November 2002
Bwoyo, D. Catchment Forest Manager, Arusha, 22nd November 2002.
Fundi, H. Regional Hydrologist, Tanga Region, Tanga, November 18th 2002.
Kijazi, A. and Nashanda, E. Forestry and Beekeeping Division, Dar es Salaam, No-vember 15th, 2002
Lugeiyamu, J. Manager, TANESCO Systems, Hale, November 18th, 2002
Mihayo, J. M., Director, Water Division, Dar es Salaam, November 15th, 2002
Mjata, P. J., Land-use Planner, TIP, Moshi, November 21st, 2002.
Msuha, M. BirdLife Officer, Wildlife Conservation Society of Tanzania, Dar es Sa-laam, November 14th, 2002
Nasari, J. Regional Hydrologist, Arusha Region, Arusha 13th November, 2002
Ngana, J. Associated Research Professor, Institute of Natural Resource Assessment,University of Dar es Salaam, 14th November, 2002
Ngula, D. Manager, Research and Development, TANESCO, 14th November 2002

93
Rumambo, O., Basin Management Advisor, River Basin Management Project, Ministryof Water and Livestock Development, Dar es Salaam, November 15th, 2002.
Salehe, J. National Project Manager, UNDP/GEF - East Africa Cross-Border Biodiver-sity Project, Arusha, November 22nd, 2002.
Sarmett, J. Water Officer; Pangani Basin Water Office, Dar es Salaam 14th November2002
Shiri – Njoro Village Government, Moshi 22nd November 2002
Tegemeo and Kiwayo Village Government, Kiwayo, November 21st, 2002
Interview sources for Appendix 1
Aram, F. V. - Tanga Urban Water Supply and Sewerage Authority
Denis, E. M. – DWE’s Office, Handeni
Fundi, H. Regional Hydrologist, Tanga Region
Hamisi, H. - Coordinator, Hellen Keller International (APOC)
Kisheru, N. - Regional Natural Resources Officer, RAS Tanga
Lyimo, Z. C. - Regional Livestock Officer, RAS Tanga
Maggid, R. B. - Coordinator, Tanga CDTI Project
Malange, J. P. – RWE, RAS Tanga
Materu, E. A. - Tanga Water Laboratory
Matiku, W. - East Usambara Catchments Forest.
Mwakibuzi, H. - District Planning Officer, Muheza
Mzee, R. S. - Amani Nature Reserve
Ntemi, A. - Amani Nature Reserve
Sasame, M. – DWE’s Office, Handeni
Tungu, L. S. M. - Regional Agricultural Officer, RAS Tanga
94
H Appendix 1: Smaller basins included in theadministrative Pangani Basin6
H.1 IntroductionThe Pangani River Basin (PRB) covers an area of 43,650 km2. The Basin is surrounded bya series of small, independent, basins, which while not strictly part of the Pangani RiverBasin hydrologically, they are administered by the Pangani Basin Water Office (PBWO)because they are too small to merit their own Basin office. The area administered byPangani Basin Water Office includes the main Pangani, Umba, Msangazi, Zigi7, CoastalRivers and Mkulumuzi Catchments, together totalling 58,510 km2. In this Appendix, in-formation about these additional basins is summarised as a basis upon which future proj-ect activities within the PRB may expand to include these additional basins. The basinsconcerned are as follows:
• The Umba River Catchment (8,070 km2)• The Msangazi River Catchment (5,030 km2)• The Zigi River Catchment (see Coastal Rivers)• The Coastal Rivers Catchments (2,080 km2 including Zigi and Mkulumuzi). Be-
sides the Mkulumuzi, most of the Coastal Catchment's rivers are seasonal.
Each of these catchments is discussed in turn.
H.2 The Umba River Catchment:The Umba River Catchment covers a total area of 8,070 km2 (of which about 2,560 km2
lies in Kenya), where the Umba's mouth lies at Vanga on the Kenya coast. The river has adense network of tributaries most of which drain the north-western slopes of the Usam-bara Mountains. These enter the Umba from the south. The river receives very few tribu-taries from the north. The catchment receives an annual average of 600 mm of rainfall.The Umba Game Reserve, formerly part of the Mkomazi Game Reserve, lies within theBasin. Vegetation typical of this park covers much of the catchment: sparse, dry, savan-nah-type bush and low trees. Mountainous slopes in the Basin are covered by afro-montane forest. The Umba River Catchment is sparsely populated. The main land use inits northern part is wildlife conservation, while cattle grazing is the main land use in thesouth.
6 This Appendix has been prepared by the Pangani Basin Water Office.
7 Some authors use the 'Sigi' spelling, 'Zigi' is the preferred spelling of the catchment's residents (pers.comm., 2003)
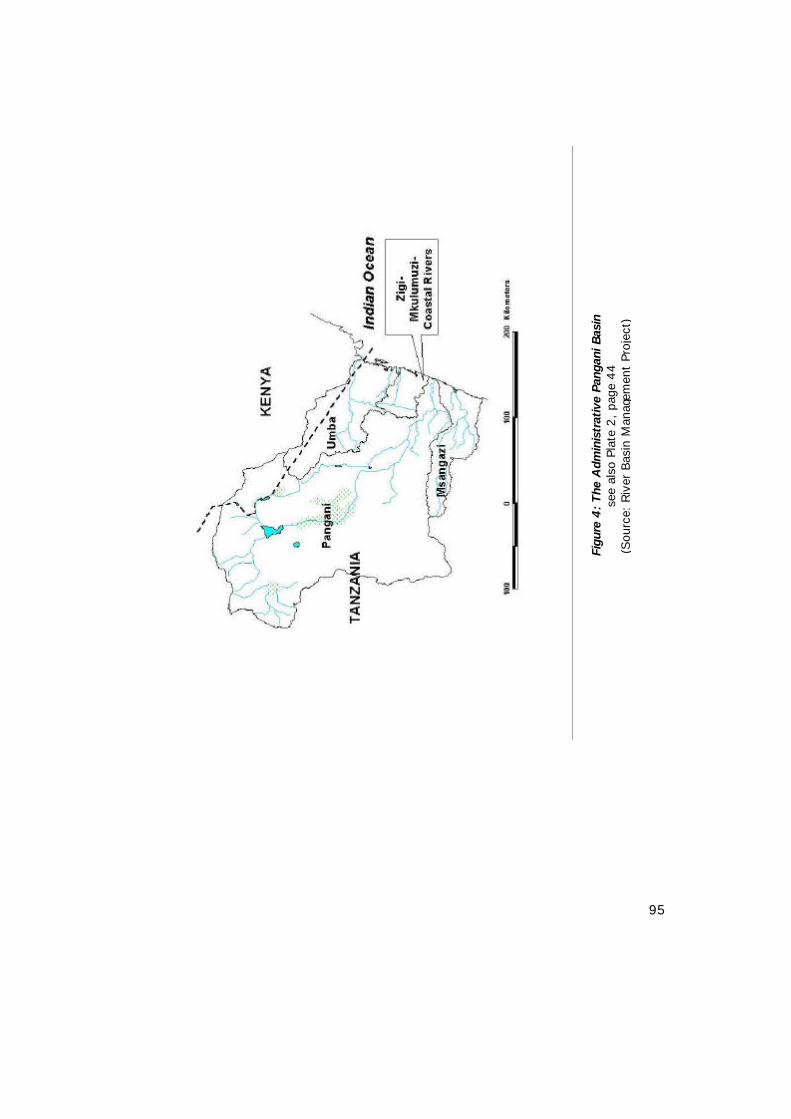
95
Figu
re 4
: The
Adm
inis
trat
ive
Pang
ani B
asin
see
also
Pla
te 2
, pa
ge 4
4(S
ourc
e: R
iver
Bas
in M
anag
emen
t Pr
ojec
t)
96
Agriculture and irrigation
Rainfed agriculture in considerably more common than irrigated agriculture. Never-theless, besides the Mkomazi and Luengera valleys, which lie in the main PanganiRiver Catchment, most of the present or proposed small irrigation schemes in theTanga Region are situated along the Umba River and its tributaries. These schemesinclude Mnazi, Kitivo, Kivingo Mnazi village and Mwakijembe Irrigation schemes. Themain irrigated crop is rice, followed by maize. In the upper parts of the catchment;vegetables and Irish potatoes are also under irrigation. The total area under irrigationis estimated at 1,475 ha, consuming an estimated 25.2 m3 x 106 annually.
Natural Resources
Protected Areas
The Umba Game Reserve contains an area of some 450 km2 contiguous to Kenya’sTsavo National Park. The reserve’s wildlife comprises, amongst others, buffaloes,elephants, lions and various buck and antelope. The main threat facing this wildlife ispoaching by locals, and people entering the area from Kenya.
Forests
The Umba catchment was once rich in forests that included tree species such asBrachylaena hulensis (‘Mkarambati’) and Albizia vesicular (‘Mkingu’). Brachylaenahulensis is used mainly for making carvings, building poles and furniture. It is heavilyharvested and is considered an endangered species. Illegal forest harvesting for char-coal manufacture also occurs.
To address the problem of illegal forest harvesting, community-based forest man-agement approaches have been developed with villagers, such as those in Mwaki-jembe, Mwanyumba, Mavovo and Daluni villages.
Minerals
The Umba River Catchment is rich in mineral deposits, particularly gemstones.Around the Mghwashi and Kararani areas, blue sapphire is to be found, along withgreen tourmaline and the rose garnet. Mining is presently carried out by small-scaleminers who lack internal markets, forcing them to sell their gems on the black marketin Kenya (Kisheru, pers. comm.)
Water use conflict
Conflict exists between water users due to insufficient supply, especially in thoseareas where irrigation is practiced.
Data collection network
• Umba River at Mlalo (1B1): a secondary station, with range of staff gauges (0 -3m.); the station is operational with a rating curve, but needs updating.
97
• Umba River at Mwakijembe (1B4A): a primary station, with staff gauges (0 -4m); it is installed with a, ‘Orpheus’ type data logger. The station is operational,although it requires updating.
• Mbalamo River at Kivingo (1B1A): a secondary station with staff gauges (0 –2m). Requires rehabilitation.
• Bombo River at Kwamkole (1B5): an operational secondary station with staffgauges (0 - 3m).
• Mlalo rainfall station (9438068): operational and in good condition.
• Mnazi meteorological station (9438075): well-functioning, with both auto-metand manual stations.
H.3 The Msangazi River Catchment
The Msangazi River Catchments covers an area of 5030 km2 and is considered toinclude a series of narrow catchments extending from west to east over almost theentire width of the Tanga Region. The catchments border the Pangani River Basin tothe South. Most of the rivers only flow during exceptionally wet rainy seasons intheir upper reaches. Downstream of Handeni Township, however, the Msangazi Riverflows regularly during the rainy season.
The entire catchment has uniform geographical features and can be classified ashilly, although the lower reaches, where sisal and coconut plantations are cultivated,are flat. The vegetation cover is comprised of bush and low tree savannah. Besidesscattered agriculture, most of the land is unused economically. Average annual rain-fall is about 900mm.
Population
The Msangazi sub-catchments cover three districts in the Tanga Region: Kilindi, Han-deni and Pangani. The total population within the catchments in the Kilindi Districtwas 31,177 in 2002, and 141,263 in the Handeni District. This represents about44% of the population of the two districts. The population of the Msangazi Catch-ments within Pangani district is 10,298 people.
Land use
• Agriculture: mainly subsistence farming. Crops grown include maize, cassava,beans, banana, sugar cane and various vegetables. A newly introduced crop,Moringa oleifera (‘Mirongeronge’) is used in the manufacture of cooking oil andin water purification.
• Livestock: small quantities of cattle, goats and sheep are kept in the catchments.
98
Natural resources
Water
The main town in the catchment is the Handeni Township (population 7,700). Thetown’s main water supply is derived from water pumped from the Pangani River. Inaddition, the town derives water from two boreholes: Nderema (9 m3/hr) and Mnazini(12m3/hr). These serve 35% of township’s population. The town’s final water sourceis derived from one of the Msangazi River’s tributaries, which has been pondednearby. The pond’s capacity 22,500 m3, and about 12m3/hr is abstracted from it.
Forests
The Bondo and Kwamsisi forests both lie within these catchments. Available speciesof trees are Jubernalia gloriflora (‘mtondoro’), Dalbergia Melanoxylon (‘mpingu’),Pterocaptus angolensis (‘mninga’) and ‘mkomba’.
Wildlife
Spartan wildlife reserves occur in the upper reaches of the catchments, and includewild pigs, monkeys/baboons and reedbuck. In the lower parts of the catchments (inPangani District) lies the Sadani National Park, within which elephants, giraffes, an-telopes, sable antelope and reedbuck.
Minerals
The catchments have no known mineral potential.
Problems and potential conflicts
• Encroachment and cultivation around water sources, including riverbanks.
• Bush fires: these are a serious problem, and are set to clear bush for agriculturaluse.
• Illegal tree harvesting: for timber, building poles and charcoal. The most soughtafter timber trees are Pterocaptus angolensis (‘mninga’), Dalbergia melanocylon(‘mpingu’), and Julbernalia gloriflora (‘mtondoro’) and Mkomba
• There is an emerging conflict between livestock keepers and farmers over wa-tering points.
Disease
The most common diseases in the catchment area are malaria and typhoid. Choleraand other diseases that cause diarrhoea occur occasionally.
Data collection network
• Msangazi River at Kideleko (1E3): an operational secondary station with a num-ber of gauges (0 - 1m ranges).
99
• Msangazi River at Kwedilomba (1E1): an operational station (0 - 2m ranges), in-stalled with a ‘Thalamides’ type data logger.
• Handeni Meteorological Station (9538079): operational, with an auto-met sta-tion.
• Rainfall station at Kwedilomba: operational.
Governmental and non-governmental organisations operating in thecatchment
• World Vision (NGO)• HADEA - (Handeni Development Association)• HIAP - Handeni Integrated Agro-forest Project (Phased out 2000.)• Ded - GTZ –Technical and advisory support in the district (water)
H.4 The Zigi River Catchment
The perennial Zigi River drains the eastern slopes of the Usambara Mountains, andhas two main tributaries flowing from north and south (Muzi and Kihuhwi). Aftertheir confluence, the Zigi drains eastwards into the Indian Ocean via the MabayaniDam, a source for the Tanga Municipal Water Supply.
The upper reaches of the catchment are mountainous, consisting mainly of denseforest interspersed with tea plantations. Its lower parts are hilly, comprising dry sa-vannah-type bushes and low trees, as well as sisal estates. Along the coast, coconutand palm trees are common. As such, the entire catchment is fairly well vegetated,and the risk of erosion minimal.
Rainfall in the Zigi catchment is bi-modal. However, its distribution varies from 1,000to 2,000 mm. Yearly average rainfall is estimated at 1200 to 1400 mm.
Natural resources
Forests
There are 30,000 ha of forest in the Zigi Catchment, which include the East Usam-bara Catchment Forest, part of the Eastern Arc Mountain forests. The importance ofthe catchment’s forests includes:
• provision of timber and medicinal plants to local communities;• forests are the source of the Zigi River, which provides domestic water for Tanga
Municipality;• conserving water by regulating run-off, preventing soil erosion, improving infiltra-
tion to groundwater aquifers and water quality;• habitat for very high levels of biodiversity, and contributing to the maintenance of
the global gene pool;• the escarpment forests of the East Usambara Mountains prevent erosion and
landslides.
100
Biodiversity and protected areas
Amani Nature Reserve (ANR) was established in 1997 and has a total area of 8,380ha. The Reserve is located in the East Usambara Catchment Forest. The East Usam-bara Mountains are the largest mountain block in the Eastern Arc Mountain chain.The ANR consists of tall luxurious montane forest and deciduous lowland forest withan average altitude boundary of 850m.
Biologically, the ANR has a very rich species composition. The East Usambara Moun-tains are regarded as a global centre of plant diversity. Amongst the reserve’s andforests’ endemic plant genera and species are Saintpaulia (9 species), Cynometra (4species), Streptocarpus (2 species), Impatients katae, Vernonia amaniencis, Doli-chometra leucantha and Cordia peter.
In addition, the East Usambara Mountains are recognised as having the second mostdiverse fauna in Africa. Some of the ANR’s mammals are classified as globallythreatened, such as the East African Collared Fruit Bat (Myonyctris relicta), the Blackand Rufous Elephant Shrew (Rhyncoyon petersi), the Bushy-tailed Mongoose (Bdeo-gade crassicauda omnivore) and Abbot’s Duiker (Cephalophus spadix).
The International Council for Bird Preservation (ICBP) has classified both the montaneand lowland forests of the East Usambara as an Endemic Bird Area (EBA). Thirteenglobally endangered species of birds, such as the Usambara Eagle Owl (Bubo vos-seleri), the Usambara Mountain Weaver (Ploseus nicolli), the Amani Sunbird (Anthrep-tes pallidigaster), and the Long-Billed Apalis (Apalismoreaui moreaui), are known tolive in ANR.
Amongst the Reserve’s and forests’ amphibians, reptiles and invertebrate species,biodiversity and endemism are also very high. Many amphibians breed and find habi-tat in and along the Zigi River, which also provides habitat to numerous reptile andinsect species.
Water and soils
The Amani Nature Reserve is one of the most important water catchments areas inthe East Usambara Mountains. The montane rain forest that covers the larger part ofthe Reserve plays a significant role in the hydrological cycle of the Tanga Region.The Zigi River provides domestic water to Tanga Municipality (population 300,000),associated industries, estates and adjacent local communities.
The Mabayani dam lies on the Zigi River, water from which supplies Tanga Munici-pality. Its reservoir is approximately 3,500m long with an average width of 400m.Initially (in 1978), the reservoir had a nominal storage capacity of 7.7 million m3, butthis has gradually decreased due to siltation caused by erosion and landslides. Addi-tional deposits are derived from plants uprooted by floodwaters, effluent from thedecortication of sisal leaves and matter synthesised in the reservoir itself by phyto-and zooplankton communities, fish and other invertebrate animals.
The decay of organic matter requires oxygen, resulting in the de-oxygenation of sur-rounding waters. The presence of such organic nutrients also stimulates the produc-tion of more plant material, causing the production of more organic matter and sub-
101
sequent oxygen depletion at the bottom of the dam. Combined, these processes ofnutrient inflows and subsequent de-oxygenation may cause eutrophication, althoughno evidence of this has yet been obtained from the dam. The concern that this mayoccur nevertheless exists, and the following are recommended as possible mitigatingmeasures:
• to monitor the accumulation of sediment /organic matter in the dam;• to frequently remove aquatic weeds (e.g. water hyacinth or the Nile cabbage)
from the surface of the dam manually, biologically or mechanically;• to control the quality and volume of effluent from upstream sisal factories;• to identify the proportion of aquatic macrophytes that are swept over the dam
spillway. If the proportion is small, methods for increasing it should be under-taken.
Fisheries
Fishing is carried out mainly along the coast of Indian Ocean, where the Zigi River’smouth is to be found. Minor fisheries exist along its course, targeting fish such asClarias spp. (a cat fish, ‘kambare’), Tilapia spp. (‘perege’), Labeo (‘ningu’), Synodon-tis (‘ngogogo’), Barbus (‘kuyu’) and others. Fishing on the Mabayani reservoir is for-bidden because its water is intended as a source of domestic water for the TangaMunicipality.
Land
The main land use in the catchment is agriculture, practised mainly on a small-scalelevel. Crops such as maize, cassava, banana and fruit are cultivated, while cashcrops such as sisal, tea and forest (like the Longuza Teak Plantation project). To aminor extent, cattle grazing is also practiced.
Problems
• Deforestation: this occurs mainly as a result of illegal tree harvesting for timber,firewood, building poles, clearing for agriculture etc., and serves to increase sur-face runoff, while decreasing groundwater recharge.
• Effluent discharge: the discharge of raw or partially treated effluent from sisaldecortications causes the de-oxygenation of the water into which it is deposited,and works as a nutrient, so assisting eutrophication.
• Agrochemical application: although there is no available data on the effect ofagrochemicals on water sources in the catchment, it is likely that agrochemicalresidues/spills reach water bodies via storm water. Depending on agrochemicaltype and concentration, human health and the aquatic life can be affected bysuch residue. In the Zigi River Catchment, agrochemicals, including pesticides,herbicides and fertilisers are mainly used in Amani tea estates and tree nurseries(Materu, pers. comm.).
• Human settlement close to water sources: this causes land degradation and in-creased sediment concentrations in water; the pollution of water by faecal seep-
102
age from toilets or the direct disposal of faeces, as well as physically and chemi-cally by solid waste disposal to water bodies.
• Aquatic weed: several species of aquatic weed occur in the Zigi River and Maba-yani dam, e.g. Water hyacinth (Eichhornia crassipes), Nile cabbage (Pistia stratio-tes) and the water ivy (Lpomoea aquatica). The water hyacinth is capable ofblanketing the water surface such that it affects water quality. This may also af-fect human health by improving the conditions needed for the reproduction ofvarious vectors important in the life cycle of various human pathogens, such asmosquitoes (malaria), and snails (bilharzia).
• Poor farming methods: the use of fire to clear vegetation, the cultivation ofmountain slopes, tree felling and other human activities in water catchmentsmay serve to increase water turbidity, colour and sediment load, especially dur-ing the rainy season. These causes have been attributed to the December 1999increase in water turbidity on the Mabayani Dam from 20-30 NTU to 1,400 NTU(Materu, pers. comm.).
• Disease: river blindness occurs in the Muheza District of the Zigi Catchment.This is caused by a worm (filaria) called Onchocerca volvulus. The parasite istransmitted to humans through the bite of a small black fly. Besides blindness,the disease also causes severe skin problems. The flies breed in well oxygenatedfast moving water. Other diseases in the Zigi Catchment related to water arecholera, typhoid and malaria (Maggid, pers. comm.).
Existing and potential conflict
• Conflict is expected between water users in the Tanga Municipality and Muhezatown. The latter’s water supply is presently inadequate, and a proposal exists totap water from the Zigi River on which the whole population of the Tanga Mu-nicipality presently depends on.
• Conflict between domestic water use and environmental requirements: the mini-mum water flow required to sustain the ecosystem below the Mabayani Dam isunknown.
• Conflict between polluters and water managers: for example, conflict betweenwater management and agricultural interests as the former seeks to control wa-ter pollution, for example, organic pollution from sisal estates (Mjesani, Kiba-ranga, Lanconi and Bamba), and agro-chemical pollution from tea estates.
Data collection network.
• Zigi River at Lancon (1C1): an operational primary station with staff gauges (0 -10m); installed with an ‘Orpheus’ type data logger.
• Zigi River at Miembeni (1C2): an operational secondary station with staff gauges(0 - 4m); the rating curve needs updating.
• Zigi River at Kisiwani (1C4): a secondary station with staff gauges (0 - 3m) forcatchment forestry use. Rating curve needs updating. 0 - 1m gauge has beenwashed away by floods.
103
• Muzi River at Msakazi (1CA1): operational, but rating curve needs updating.
• Zigi-Lancon Rainfall Station: operational.
• Mabayani dam, water level and rainfall stations: operational.
• There are additional rainfall stations in the catchment operated by various institu-tions, such as Longuza Forest, East Usambara Catchment Forest etc
H.5 The Coastal River Catchment (Mkulumuzi)
The coastal rivers originate in the escarpment that runs parallel to the coast at a dis-tance of 20 to 30 km. Average rainfall within the catchments is 1,100 mm. Theirecology is fairly uniform. Slopes at the headwaters are generally hilly, and graduallyflatten as they enter the coastal plain. Coconut, palm and cashew nut trees dominatevegetation. Sisal is also grown on a large scale. Erosion problems have not been ob-served in these catchments.
Most coastal rivers only flow during short periods in the rainy season and are dry forthe rest of the year. The only exception is the perennial Mkulumuzi River. This river’scatchment covers 337 km2, and is situated directly to the south of the Zigi Rivercatchment. Its source lies in the Magoroto Forest.
Natural resources
Water supply
The Mkulumuzi River supplies water to Muheza town, with a population of about25,700 people.
Agriculture
Agriculture in the area is mainly practised at a subsistence level, with an exception ofsisal, which is grown at commercial scales. Subsistence crops grown include maize,banana, cassava, rice and sweet potatoes. Fruit (particularly oranges), coconuts,cashew nuts and spices are cultivated as cash crops.
Livestock
Livestock keeping in the catchments is fairly insignificant. Small numbers of dairycattle, goats and pigs are kept.
Fisheries
Although fishing is a common activity along the coast, no significant fishing activityoccurs in the coastal river catchments.
Existing and potential conflicts
• Settlement: serious demands for settlement land occur after sisal plantationshave collapsed, and staff evicted.
• Insufficient water for Muheza Township.
104
The data collection network
• Mkulumuzi at Upare (unregistered): a new river gauging station equipped with a‘Thalimedes’ type data logger.
• Msimbazi River at Lugongo: a new river gauging station equipped with staffgauges (ranging from 0 - 2m)
• Mlingano Meteorological Station (under the Ministry of Agriculture): operational.
Supporting organisations
• Irish Aid: supports integrated planned programmes in the area.
• TASAF• NORAD: Village Transport and Travel Programme (VTTP)• IUCN: Coastal environmental conservation, in collaboration with Ireland Aid.• AXIOS International: assists orphans and vulnerable children• GTZ: assists health infrastructure, support of basic drug distribution to the health
centres.• APOC/CDTI: Onchoceriasis control.