Embed Size (px)
Citation preview

10th Sensometrics symposium, Rotterdam - 2010-07-27
Panel performance in
Temporal Dominance of Sensations studies
N. Pineau1, M. Lepage1, F. Lenfant1,
N. Martin1, P. Schlich2, A. Rytz1
1 Nestec SA, Lausanne, Switzerland2 Centre des Sciences du Goût et de l’Alimentation, Dijon, France

Outline
• Background & objectives- TDS data
- Evaluation of panel performance
• Alternative method to assess discrimination (panel) - Method used as a reference: Permutation approach
- Alternative method based on Analysis of Variance
- Comparison of the results between both approaches
• Same approach for agreement and individual
performance- The same approach can be used to measure the agreement between panellists
- The same approach can be used at individual level
• Conclusion
p. 2
p. 3
Temporal Dominance of Sensations Presentation
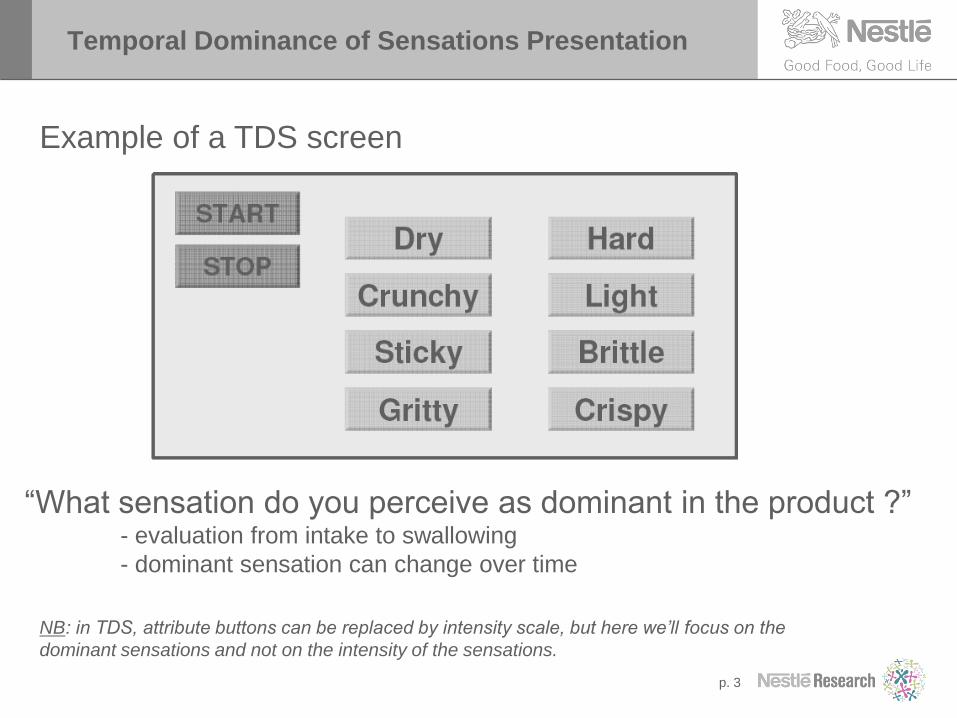
Example of a TDS screen
“What sensation do you perceive as dominant in the product ?”- evaluation from intake to swallowing
- dominant sensation can change over time
NB: in TDS, attribute buttons can be replaced by intensity scale, but here we’ll focus on the
dominant sensations and not on the intensity of the sensations.
0 0.5
1 1.5
2 2.5
3 3.5
4 4.5
5 5.5
6 6.5
7 7.5
8 8.5
9 9.5
10
10.5
11
11.5
12
12.5
13
13.5
14
14.5
15
Crunchy 0 0 0 0 0 0 1 1 1 1 0 0 0 0 0 0 0 0 0 0 0 0 0 0 0 0 0 0 0 0 0
Crispy 0 0 0 0 0 0 0 0 0 0 1 1 1 1 1 1 1 0 0 0 0 1 1 1 1 1 0 0 0 0 0
Gritty 0 0 0 0 0 0 0 0 0 0 0 0 0 0 0 0 0 0 0 0 0 0 0 0 0 0 0 0 0 0 0
Brittle 0 0 0 0 0 0 0 0 0 0 0 0 0 0 0 0 0 1 0 0 0 0 0 0 0 0 0 0 0 0 0
Dry 0 0 0 0 0 0 0 0 0 0 0 0 0 0 0 0 0 0 0 0 0 0 0 0 0 0 0 0 0 0 0
Light 0 0 0 0 0 0 0 0 0 0 0 0 0 0 0 0 0 0 1 1 1 0 0 0 0 0 0 0 0 0 0
Hard 0 0 0 0 0 0 0 0 0 0 0 0 0 0 0 0 0 0 0 0 0 0 0 0 0 0 0 0 0 0 0
Sticky 0 0 0 0 0 0 0 0 0 0 0 0 0 0 0 0 0 0 0 0 0 0 0 0 0 0 1 1 1 1 0
STOP 0 0 0 0 0 0 0 0 0 0 0 0 0 0 0 0 0 0 0 0 0 0 0 0 0 0 0 0 0 0 1
Standardize d curv e s
0.0
0.1
0.2
0.3
0.4
0.5
0.6
0.7
0 0.1 0.2 0.3 0.4 0.5 0.6 0.7 0.8 0.9 1
Tim e [0,1]
Do
min
an
ce
ra
te [
%]
0
START Crunchy
3
Brittle
8,5
Light
9
Crispy
11
Sticky
13,5 15
STOP
Crispy
5Time
Attribute
Dominance periods
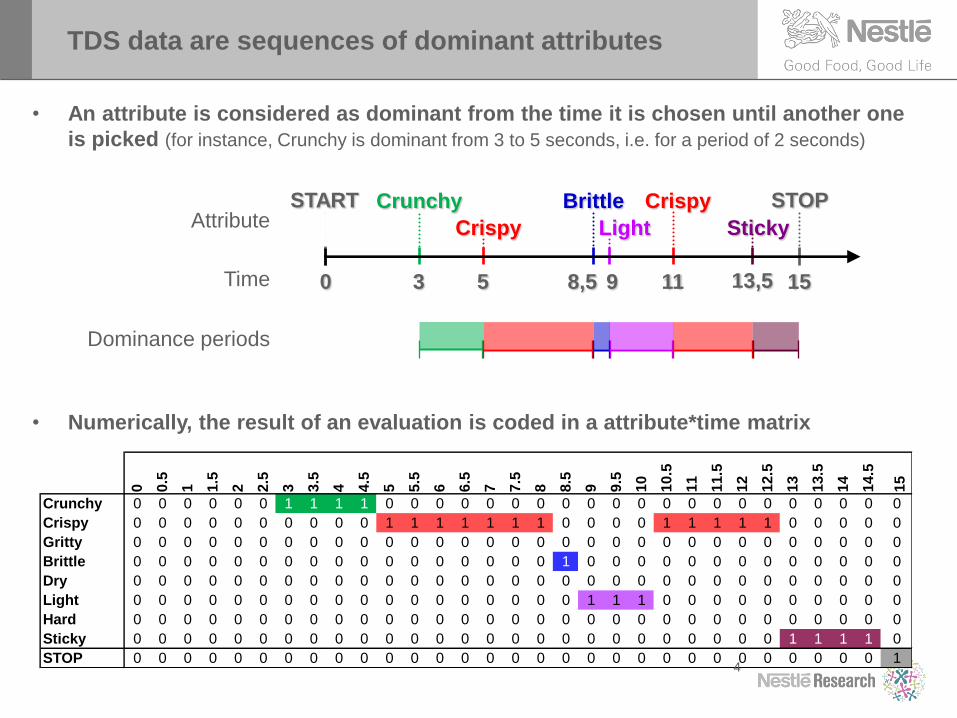
TDS data are sequences of dominant attributes
• An attribute is considered as dominant from the time it is chosen until another one
is picked (for instance, Crunchy is dominant from 3 to 5 seconds, i.e. for a period of 2 seconds)
• Numerically, the result of an evaluation is coded in a attribute*time matrix
4

5
From TDS data to TDS curves
0 0.5
1 1.5
2 2.5
3 3.5
4 4.5
5 5.5
6 6.5
7 7.5
8 8.5
9 9.5
10
10.5
11
11.5
12
12.5
13
13.5
14
14.5
15
Brittle 0 0 0 0 0 0 0 0 0 0 0 0 0 0 0 0 0 1 0 0 0 0 0 0 0 0 0 0 0 0 0
Crispy 0 0 0 0 0 0 0 0 0 0 1 1 1 1 1 1 1 0 0 0 0 1 1 1 1 1 0 0 0 0 0
Crunchy 0 0 0 0 0 0 1 1 1 1 0 0 0 0 0 0 0 0 0 0 0 0 0 0 0 0 0 0 0 0 0
Dry 0 0 0 0 0 0 0 0 0 0 0 0 0 0 0 0 0 0 0 0 0 0 0 0 0 0 0 0 0 0 0
Gritty 0 0 0 0 0 0 0 0 0 0 0 0 0 0 0 0 0 0 0 0 0 0 0 0 0 0 0 0 0 0 0
Hard 0 0 0 0 0 0 0 0 0 0 0 0 0 0 0 0 0 0 0 0 0 0 0 0 0 0 0 0 0 0 0
Light 0 0 0 0 0 0 0 0 0 0 0 0 0 0 0 0 0 0 1 1 1 0 0 0 0 0 0 0 0 0 0
Sticky 0 0 0 0 0 0 0 0 0 0 0 0 0 0 0 0 0 0 0 0 0 0 0 0 0 0 1 1 1 1 0
STOP 0 0 0 0 0 0 0 0 0 0 0 0 0 0 0 0 0 0 0 0 0 0 0 0 0 0 0 0 0 0 1
0 0.5
1 1.5
2 2.5
3 3.5
4 4.5
5 5.5
6 6.5
7 7.5
8 8.5
9 9.5
10
10.5
11
11.5
12
12.5
13
13.5
14
14.5
15
Crunchy 0 0 0 0 0 0 1 1 1 1 0 0 0 0 0 0 0 0 0 0 0 0 0 0 0 0 0 0 0 0 0
Crispy 0 0 0 0 0 0 0 0 0 0 1 1 1 1 1 1 1 0 0 0 0 1 1 1 1 1 0 0 0 0 0
Gritty 0 0 0 0 0 0 0 0 0 0 0 0 0 0 0 0 0 0 0 0 0 0 0 0 0 0 0 0 0 0 0
Brittle 0 0 0 0 0 0 0 0 0 0 0 0 0 0 0 0 0 1 0 0 0 0 0 0 0 0 0 0 0 0 0
Dry 0 0 0 0 0 0 0 0 0 0 0 0 0 0 0 0 0 0 0 0 0 0 0 0 0 0 0 0 0 0 0
Light 0 0 0 0 0 0 0 0 0 0 0 0 0 0 0 0 0 0 1 1 1 0 0 0 0 0 0 0 0 0 0
Hard 0 0 0 0 0 0 0 0 0 0 0 0 0 0 0 0 0 0 0 0 0 0 0 0 0 0 0 0 0 0 0
Sticky 0 0 0 0 0 0 0 0 0 0 0 0 0 0 0 0 0 0 0 0 0 0 0 0 0 0 1 1 1 1 0
STOP 0 0 0 0 0 0 0 0 0 0 0 0 0 0 0 0 0 0 0 0 0 0 0 0 0 0 0 0 0 0 1
Standardize d curv e s
0.0
0.1
0.2
0.3
0.4
0.5
0.6
0.7
0 0.1 0.2 0.3 0.4 0.5 0.6 0.7 0.8 0.9 1
Tim e [0,1]
Do
min
an
ce
ra
te [
%]
0.0
0
0.0
3
0.0
7
0.1
0
0.1
3
0.1
7
0.2
0
0.2
3
0.2
7
0.3
0
0.3
3
0.3
7
0.4
0
0.4
3
0.4
7
0.5
0
0.5
3
0.5
7
0.6
0
0.6
3
0.6
7
0.7
0
0.7
3
0.7
7
0.8
0
0.8
3
0.8
7
0.9
0
0.9
3
0.9
7
1.0
0
Crunchy 38 35 25 19 12 6 3 0 0 0 0 0 0 0 0 0 0 0 0 0 0 0 0 0 0 0 0 0 0 0 0
Crispy 39 42 49 53 51 46 43 39 35 31 28 23 19 18 15 13 12 11 11 11 9 10 11 12 13 15 14 15 14 13 12
Gritty 0 0 0 0 0 0 0 0 0 0 0 0 0 0 0 0 2 2 2 2 3 4 5 6 8 8 9 9 8 8 7
Brittle 8 8 10 13 18 26 30 32 34 35 38 35 32 29 26 24 22 19 18 16 14 10 9 8 8 8 8 9 8 8 7
Dry 0 0 1 1 2 2 1 0 0 2 2 4 4 6 7 6 5 6 6 8 9 8 9 10 11 13 15 15 16 17 20
Light 8 8 9 9 12 17 20 24 26 25 23 26 30 33 39 44 44 46 44 43 42 42 39 34 30 26 23 20 21 21 21
Hard 7 7 6 5 5 3 2 3 2 2 2 2 1 0 0 0 0 0 0 0 1 2 2 2 1 0 0 0 0 0 0
Sticky 0 0 0 0 0 0 1 2 3 5 7 10 14 14 13 13 15 16 19 20 22 24 25 28 29 30 31 32 33 33 33
STOP 0 0 0 0 0 0 0 0 0 0 0 0 0 0 0 0 0 0 0 0 0 0 0 0 0 0 0 0 0 0 100
Standardized curves - WF 07
0.0
0.1
0.2
0.3
0.4
0.5
0.6
0.7
0 0.1 0.2 0.3 0.4 0.5 0.6 0.7 0.8 0.9 1
Time [0,1]
Do
min
an
ce r
ate
[%
]
(Lenfant et al., 2009)
p. 6
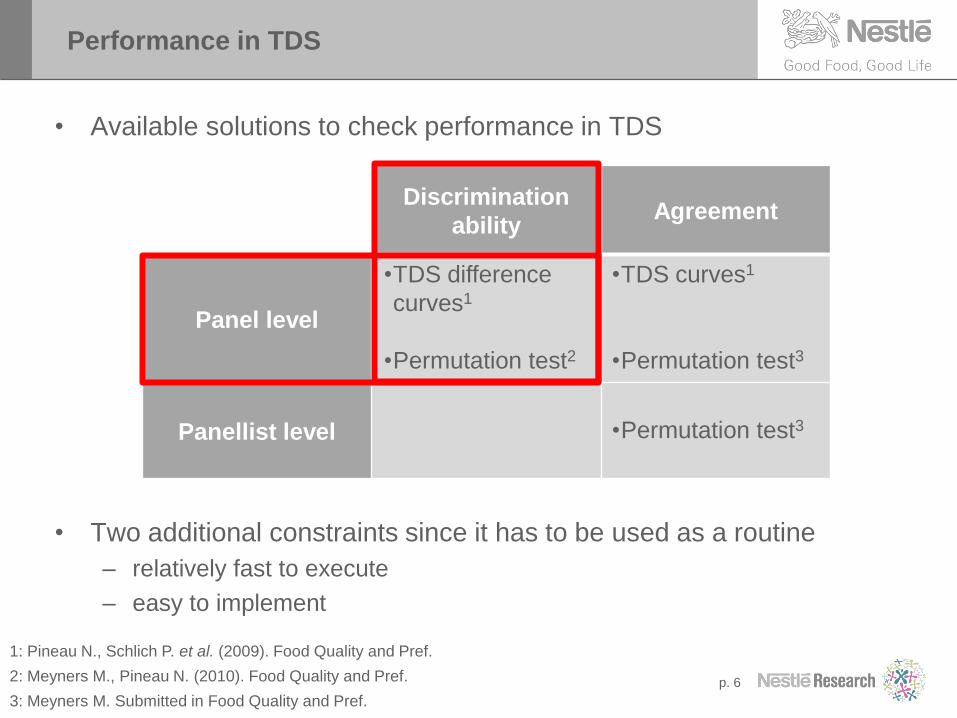
Performance in TDS
• Available solutions to check performance in TDS
• Two additional constraints since it has to be used as a routine
– relatively fast to execute
– easy to implement
Discrimination
abilityAgreement
Panel level
Panellist level
•TDS difference
curves1
•Permutation test2
•TDS curves1
•Permutation test3
•Permutation test3
1: Pineau N., Schlich P. et al. (2009). Food Quality and Pref.
2: Meyners M., Pineau N. (2010). Food Quality and Pref.
3: Meyners M. Submitted in Food Quality and Pref.

Outline
• Background & objectives- TDS data
- Evaluation of panel performance
• A new method to assess discrimination (panel) - Method used as a reference: Permutation approach
- Alternative method based on Analysis of Variance
- Comparison between both approaches
• Extension to agreement and individual performance- The same approach can be used to measure the agreement between panellists
- The same approach can be used at individual level
• Conclusion
p. 7
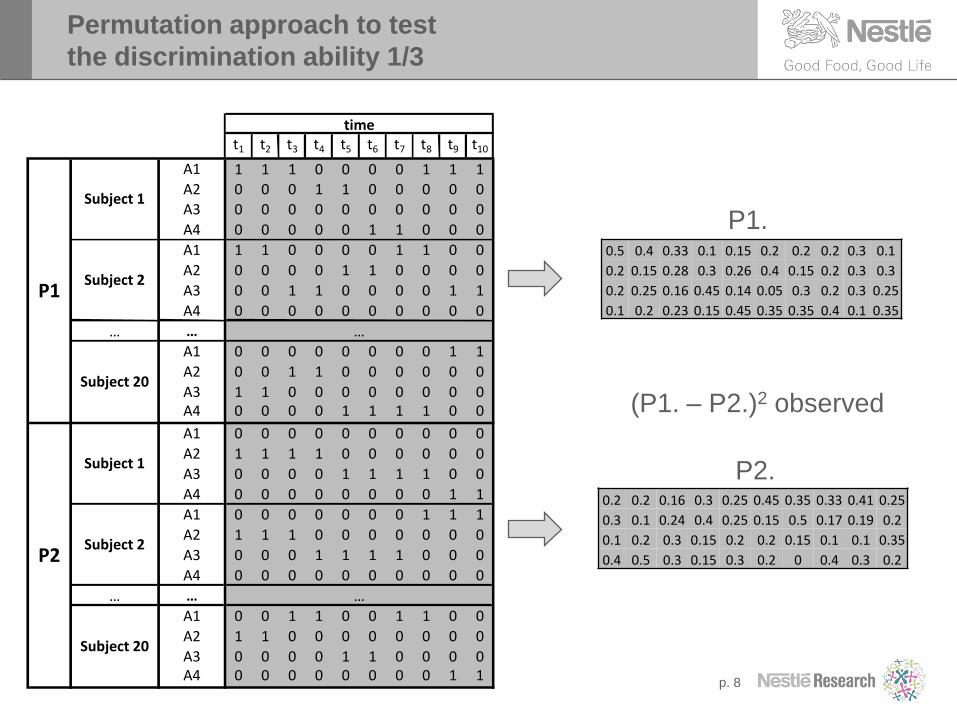
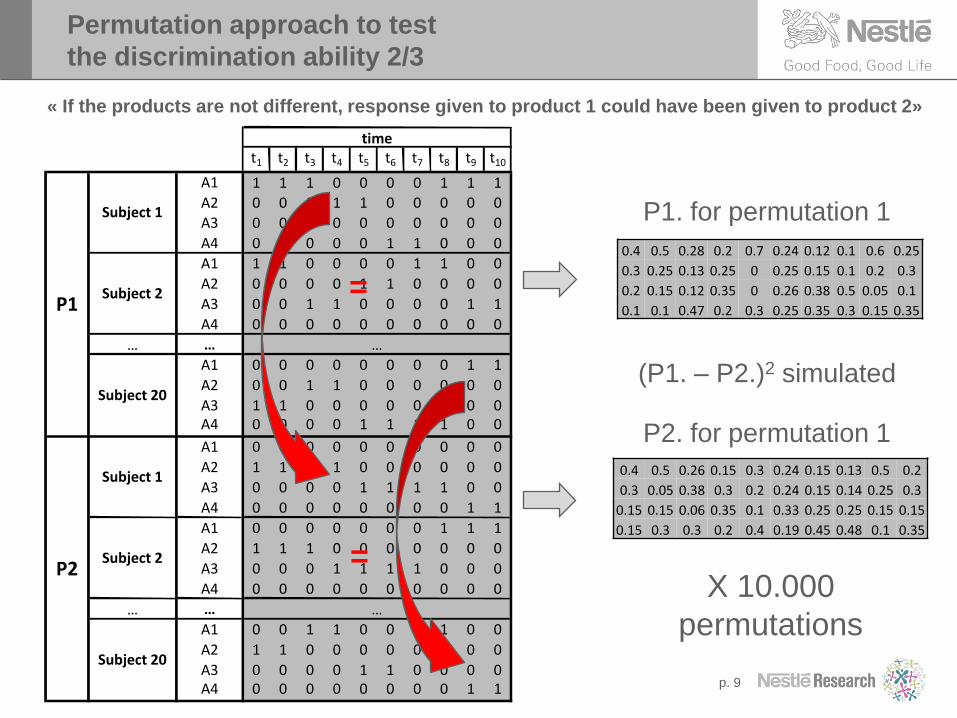
Permutation approach to test
the discrimination ability 1/3
p. 8
0.5 0.4 0.33 0.1 0.15 0.2 0.2 0.2 0.3 0.1
0.2 0.15 0.28 0.3 0.26 0.4 0.15 0.2 0.3 0.3
0.2 0.25 0.16 0.45 0.14 0.05 0.3 0.2 0.3 0.25
0.1 0.2 0.23 0.15 0.45 0.35 0.35 0.4 0.1 0.35
(P1. – P2.)2 observed
0.2 0.2 0.16 0.3 0.25 0.45 0.35 0.33 0.41 0.25
0.3 0.1 0.24 0.4 0.25 0.15 0.5 0.17 0.19 0.2
0.1 0.2 0.3 0.15 0.2 0.2 0.15 0.1 0.1 0.35
0.4 0.5 0.3 0.15 0.3 0.2 0 0.4 0.3 0.2
P1.
P2.
t1 t2 t3 t4 t5 t6 t7 t8 t9 t10
A1 1 1 1 0 0 0 0 1 1 1A2 0 0 0 1 1 0 0 0 0 0
A3 0 0 0 0 0 0 0 0 0 0
A4 0 0 0 0 0 1 1 0 0 0
A1 1 1 0 0 0 0 1 1 0 0
A2 0 0 0 0 1 1 0 0 0 0
A3 0 0 1 1 0 0 0 0 1 1
A4 0 0 0 0 0 0 0 0 0 0
… …
A1 0 0 0 0 0 0 0 0 1 1
A2 0 0 1 1 0 0 0 0 0 0
A3 1 1 0 0 0 0 0 0 0 0A4 0 0 0 0 1 1 1 1 0 0
A1 0 0 0 0 0 0 0 0 0 0
A2 1 1 1 1 0 0 0 0 0 0
A3 0 0 0 0 1 1 1 1 0 0
A4 0 0 0 0 0 0 0 0 1 1
A1 0 0 0 0 0 0 0 1 1 1
A2 1 1 1 0 0 0 0 0 0 0
A3 0 0 0 1 1 1 1 0 0 0
A4 0 0 0 0 0 0 0 0 0 0
… …
A1 0 0 1 1 0 0 1 1 0 0
A2 1 1 0 0 0 0 0 0 0 0
A3 0 0 0 0 1 1 0 0 0 0A4 0 0 0 0 0 0 0 0 1 1
…
Subject 20
P1
P2
…
Subject 20
Subject 1
Subject 2
time
Subject 1
Subject 2
0.4 0.5 0.26 0.15 0.3 0.24 0.15 0.13 0.5 0.2
0.3 0.05 0.38 0.3 0.2 0.24 0.15 0.14 0.25 0.3
0.15 0.15 0.06 0.35 0.1 0.33 0.25 0.25 0.15 0.15
0.15 0.3 0.3 0.2 0.4 0.19 0.45 0.48 0.1 0.35
P2. for permutation 1
Permutation approach to test
the discrimination ability 2/3
=
=
« If the products are not different, response given to product 1 could have been given to product 2»
(P1. – P2.)2 simulated
X 10.000
permutations
0.4 0.5 0.28 0.2 0.7 0.24 0.12 0.1 0.6 0.25
0.3 0.25 0.13 0.25 0 0.25 0.15 0.1 0.2 0.3
0.2 0.15 0.12 0.35 0 0.26 0.38 0.5 0.05 0.1
0.1 0.1 0.47 0.2 0.3 0.25 0.35 0.3 0.15 0.35
P1. for permutation 1
p. 9
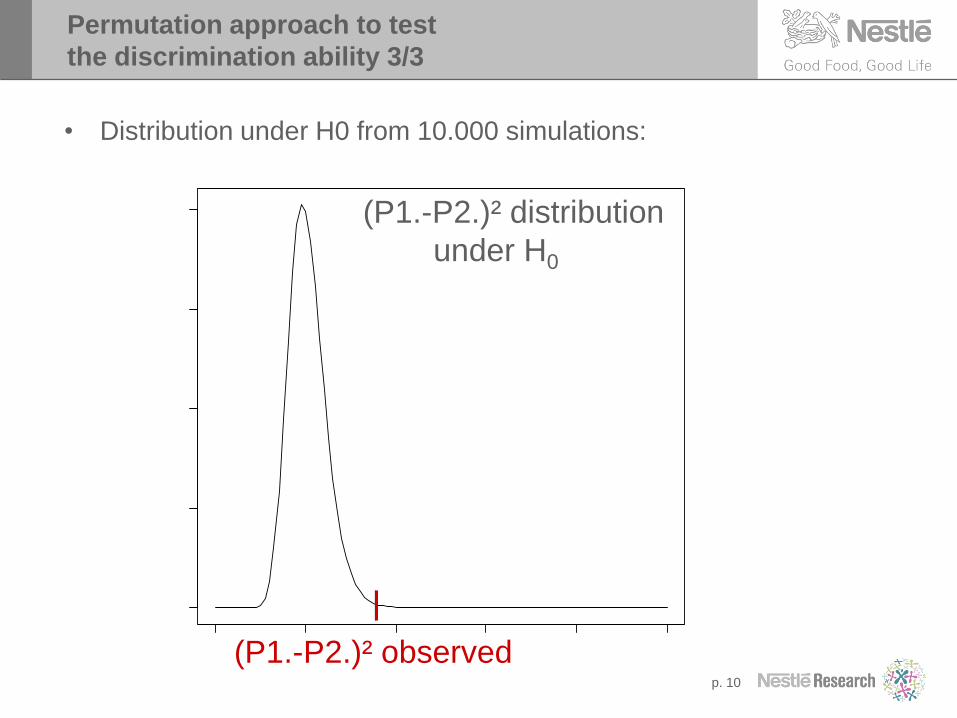
Permutation approach to test
the discrimination ability 3/3
• Distribution under H0 from 10.000 simulations:
p. 10
0 1 2 3 4 5
0.0
0.5
1.0
1.5
2.0
x
df(
x, 1
00
, 1
00
)
(P1.-P2.)² distribution
under H0
(P1.-P2.)² observed
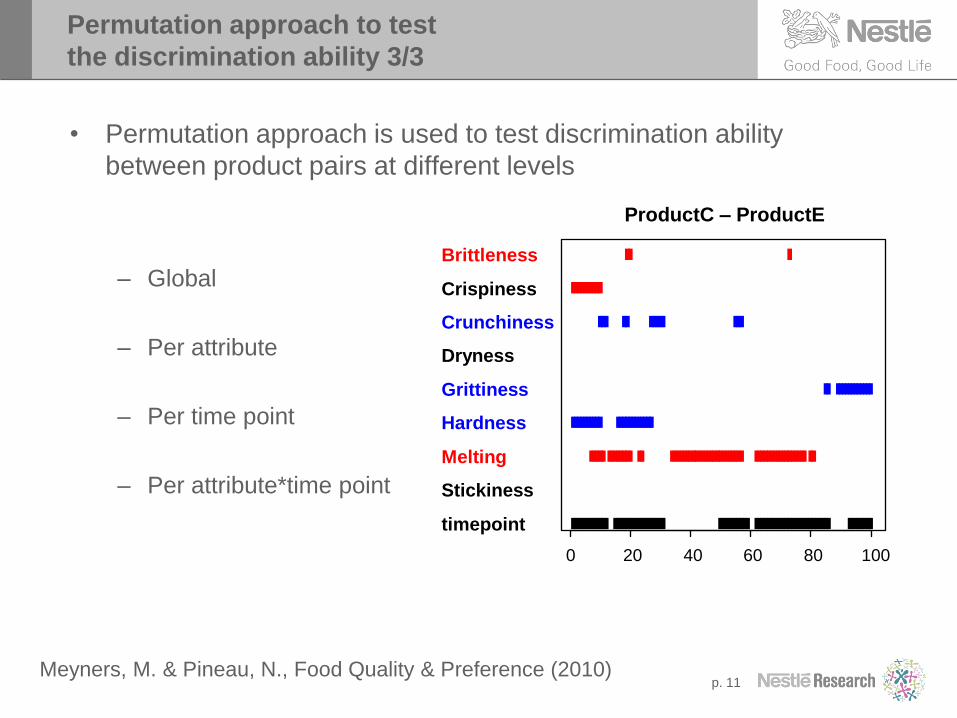
• Permutation approach is used to test discrimination ability
between product pairs at different levels
– Global
– Per attribute
– Per time point
– Per attribute*time point
p. 11
ProductC – ProductE
0 20 40 60 80 100
timepoint
Stickiness
Dryness
Crispiness
Melting
Brittleness
Hardness
Grittiness
Crunchiness
Permutation approach to test
the discrimination ability 3/3
Meyners, M. & Pineau, N., Food Quality & Preference (2010)
t1 t2 t3 t4 t5 t6 t7 t8 t9 t10
A1 1 1 1 0 0 0 0 1 1 1
A2 0 0 0 1 1 0 0 0 0 0
A3 0 0 0 0 0 0 0 0 0 0
A4 0 0 0 0 0 1 1 0 0 0
A1 1 1 0 0 0 0 1 1 0 0
A2 0 0 0 0 1 1 0 0 0 0
A3 0 0 1 1 0 0 0 0 1 1
A4 0 0 0 0 0 0 0 0 0 0
… …
A1 0 0 0 0 0 0 0 0 1 1
A2 0 0 1 1 0 0 0 0 0 0
A3 1 1 0 0 0 0 0 0 0 0A4 0 0 0 0 1 1 1 1 0 0
A1 0 0 0 0 0 0 0 0 0 0
A2 1 1 1 1 0 0 0 0 0 0
A3 0 0 0 0 1 1 1 1 0 0
A4 0 0 0 0 0 0 0 0 1 1
A1 0 0 0 0 0 0 0 1 1 1
A2 1 1 1 0 0 0 0 0 0 0
A3 0 0 0 1 1 1 1 0 0 0
A4 0 0 0 0 0 0 0 0 0 0
… …
A1 0 0 1 1 0 0 1 1 0 0
A2 1 1 0 0 0 0 0 0 0 0
A3 0 0 0 0 1 1 0 0 0 0A4 0 0 0 0 0 0 0 0 1 1
…
Subject 20
P1
P2
…
Subject 20
Subject 1
Subject 2
time
Subject 1
Subject 2
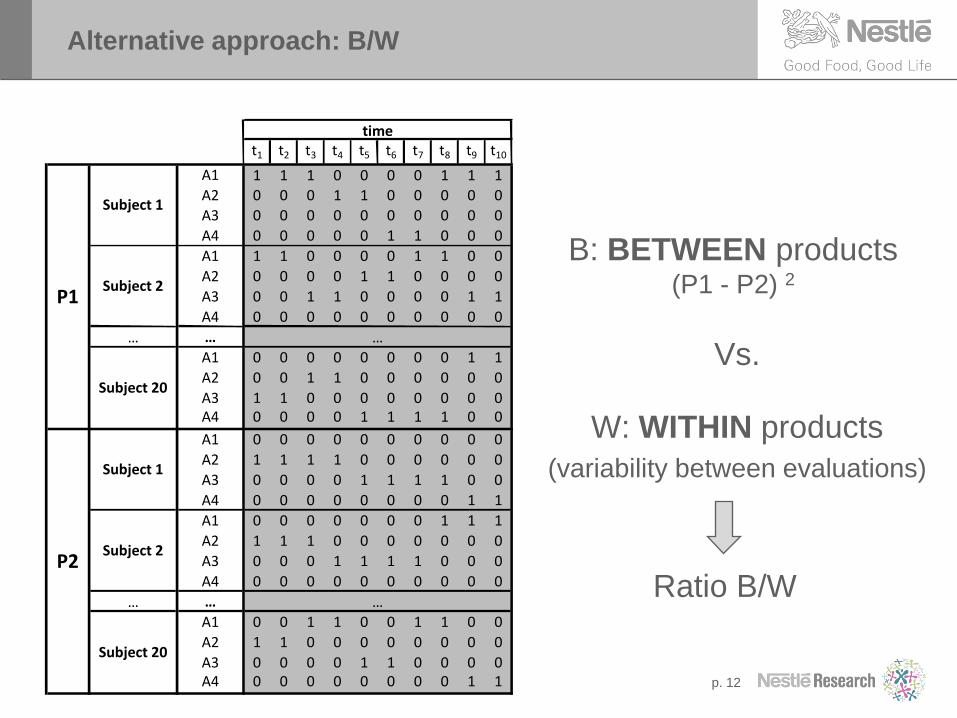
Alternative approach: B/W
p. 12
B: BETWEEN products(P1 - P2) 2
Ratio B/W
Vs.
W: WITHIN products
(variability between evaluations)

Example for one time point
p. 13
B: BETWEEN products(P1 - P2) 2
Vs.
W: WITHIN products
(variability between evaluations)
A1 0.21A2 0.28
A3 0.07A4 0.44
P1
A1 0.25A2 0.31
A3 0.17A4 0.27
P2
t1
A1 1
A2 0
A3 0
A4 0
A1 1
A2 0
A3 0
A4 0
… … …A1 0
A2 0
A3 1A4 0
A1 0
A2 1
A3 0
A4 0
A1 0
A2 1
A3 0
A4 0
… … …A1 0
A2 1
A3 0A4 0
Subject 20
P1
P2
Subject 20
Subject 1
Subject 2
Subject 1
Subject 2

Example for one time point
p. 14
ANOVA model
For 1 time point
Product
+ Subject
+ Attribute
+ P*S
+ S*A
+ P*A
+ Ԑ
Mean Square
0
0
MSA
0
B
W
Disagremt toward
attribute use
t1
A1 1
A2 0
A3 0
A4 0
A1 1
A2 0
A3 0
A4 0
… … …A1 0
A2 0
A3 1A4 0
A1 0
A2 1
A3 0
A4 0
A1 0
A2 1
A3 0
A4 0
… … …A1 0
A2 1
A3 0A4 0
Subject 20
P1
P2
Subject 20
Subject 1
Subject 2
Subject 1
Subject 2
B/W
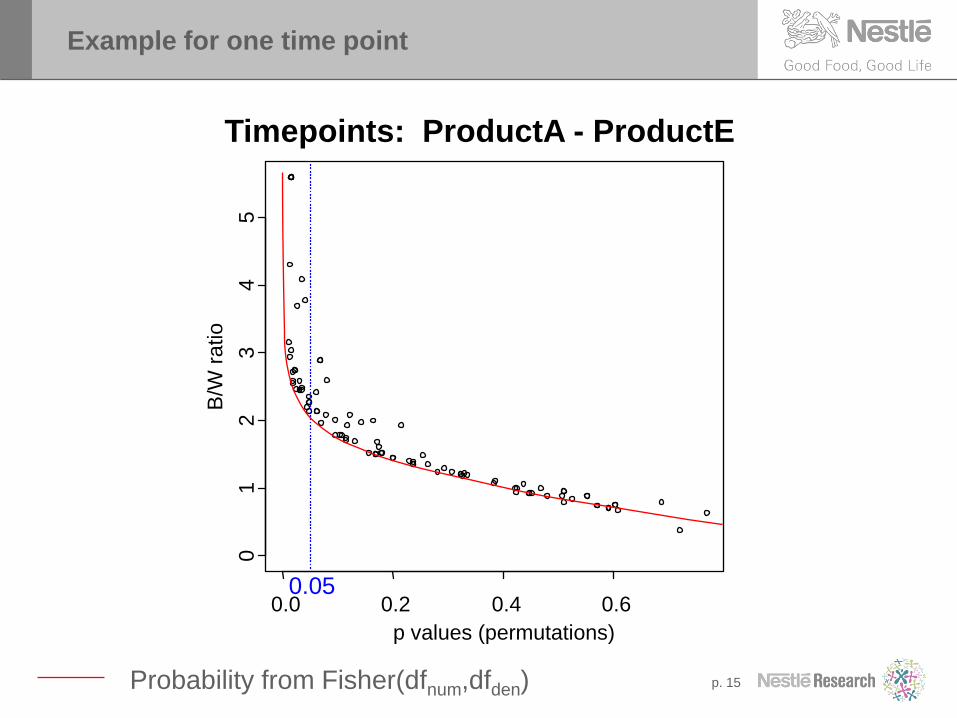
Example for one time point
p. 15
0.0 0.2 0.4 0.6
01
23
45
Timepoints: ProductA - ProductE
p values (permutations)
B/W
ratio
0.05
Probability from Fisher(dfnum,dfden)
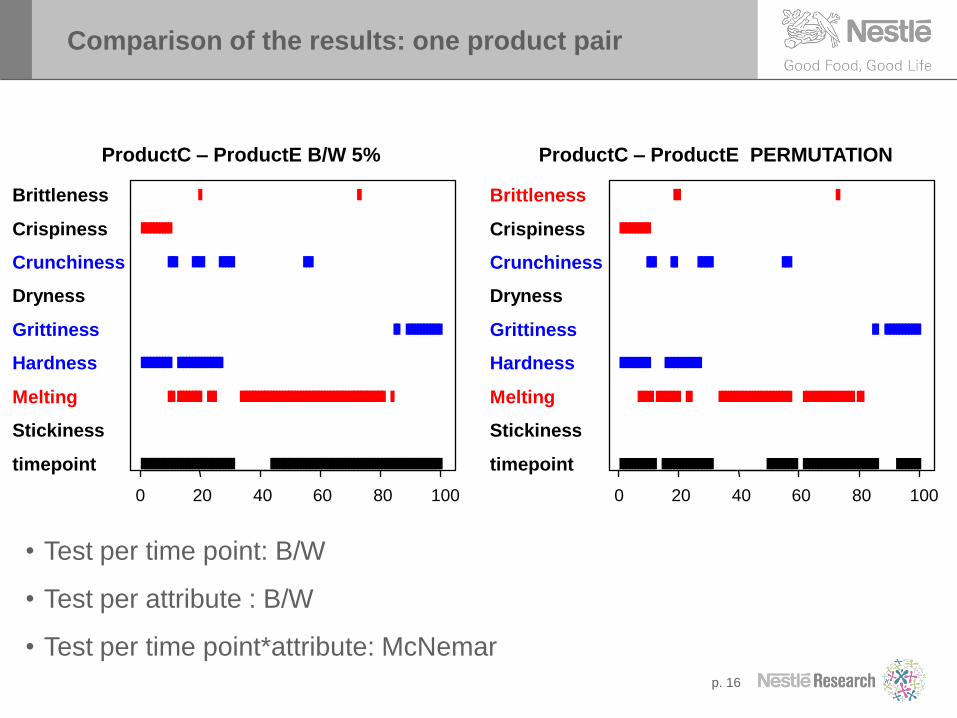
0 20 40 60 80 100
ProductC – ProductE B/W 5%
timepoint
Stickiness
Dryness
Crispiness
Brittleness
Melting
Hardness
Grittiness
Crunchiness
Comparison of the results: one product pair
p. 16
0 20 40 60 80 100
ProductC – ProductE PERMUTATION
timepoint
Stickiness
Dryness
Crispiness
Melting
Brittleness
Hardness
Grittiness
Crunchiness
• Test per time point: B/W
• Test per attribute : B/W
• Test per time point*attribute: McNemar
p. 17
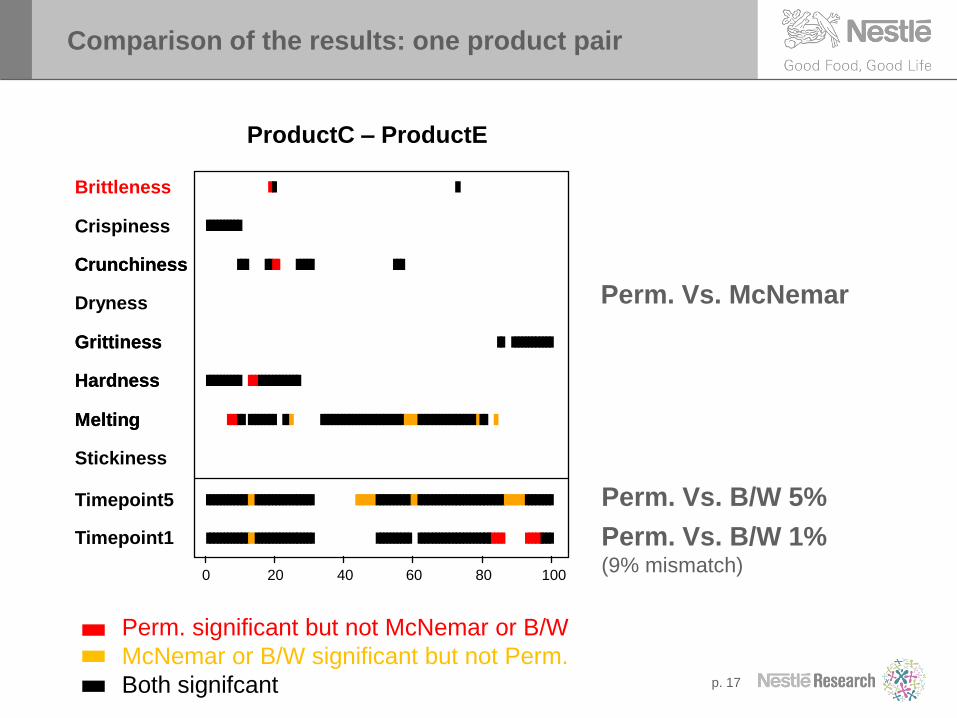
Comparison of the results: one product pair
Perm. Vs. McNemar
Perm. Vs. B/W 5%
0 20 40 60 80 100
ProductC – ProductE
Timepoint5
Stickiness
Melting
Hardness
Grittiness
Dryness
Crunchiness
Crispiness
Brittleness
Melting
Hardness
Grittiness
Crunchiness
Timepoint1 Perm. Vs. B/W 1%(9% mismatch)
Perm. significant but not McNemar or B/W
McNemar or B/W significant but not Perm.
Both signifcant
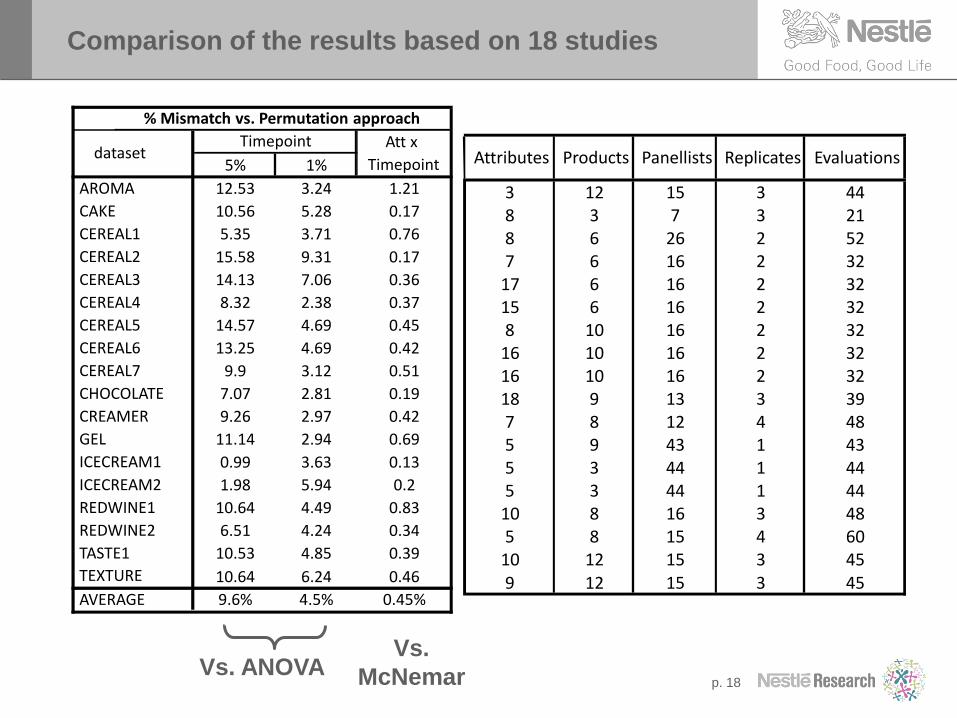
Comparison of the results based on 18 studies
Vs.
McNemarVs. ANOVAp. 18
5% 1%
AROMA 12.53 3.24 1.21
CAKE 10.56 5.28 0.17
CEREAL1 5.35 3.71 0.76
CEREAL2 15.58 9.31 0.17
CEREAL3 14.13 7.06 0.36
CEREAL4 8.32 2.38 0.37
CEREAL5 14.57 4.69 0.45
CEREAL6 13.25 4.69 0.42
CEREAL7 9.9 3.12 0.51
CHOCOLATE 7.07 2.81 0.19
CREAMER 9.26 2.97 0.42
GEL 11.14 2.94 0.69
ICECREAM1 0.99 3.63 0.13
ICECREAM2 1.98 5.94 0.2
REDWINE1 10.64 4.49 0.83
REDWINE2 6.51 4.24 0.34
TASTE1 10.53 4.85 0.39
TEXTURE 10.64 6.24 0.46
AVERAGE 9.6% 4.5% 0.45%
dataset
% Mismatch vs. Permutation approach
Timepoint Att x
Timepoint
3 12 15 3 448 3 7 3 218 6 26 2 527 6 16 2 32
17 6 16 2 3215 6 16 2 328 10 16 2 32
16 10 16 2 3216 10 16 2 3218 9 13 3 397 8 12 4 485 9 43 1 435 3 44 1 445 3 44 1 44
10 8 16 3 485 8 15 4 60
10 12 15 3 459 12 15 3 45
Products Panellists Replicates EvaluationsAttributes

Outline
• Background & objectives- TDS data
- Evaluation of panel performance
• Alternative method to assess discrimination (panel) - Method used as a reference: Permutation approach
- Alternative method based on Analysis of Variance
- Comparison of the results between both approaches
• Same approach for agreement and individual
performance- The same approach can be used to measure the agreement between panellists
- The same approach can be used at individual level
• Conclusion
p. 19
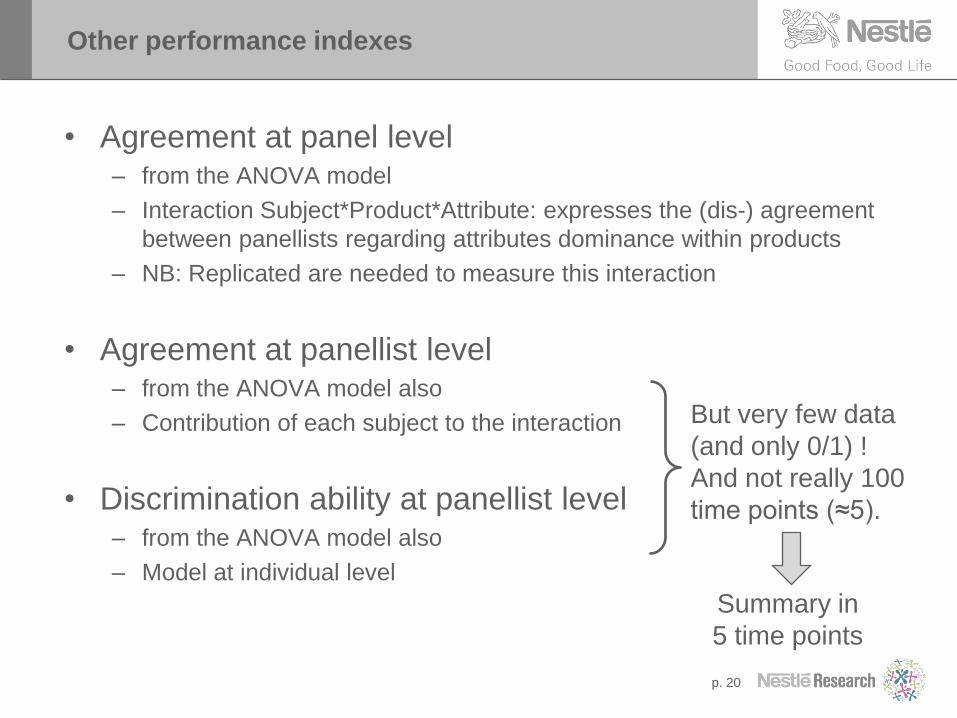
Other performance indexes
• Agreement at panel level– from the ANOVA model
– Interaction Subject*Product*Attribute: expresses the (dis-) agreement
between panellists regarding attributes dominance within products
– NB: Replicated are needed to measure this interaction
• Agreement at panellist level– from the ANOVA model also
– Contribution of each subject to the interaction
• Discrimination ability at panellist level – from the ANOVA model also
– Model at individual level
p. 20
But very few data
(and only 0/1) !
And not really 100
time points (≈5).
Summary in
5 time points

Conclusion
• Smart way of doing: permutation approach
• But B/W approach gives very close results
– As long as alpha level is decreased
• And easy to run
– Analysis with any ANOVA/GLM software
– Faster to run
• Time for 10.000 permutations : 6h
• Time for 1.000 permutations: 30 minutes
• Time for B/W approach: about 1 minute
• Next step: validation at panellist level
p. 21