Embed Size (px)
Citation preview
PFSG and E3S Fast Forward Conference
Panel Performance – and Fast! Leatherhead Food Research 13/05/13
1

HELP!
2

Agenda for workshop
• Introduction
• Data analysis and discussion
• Round up and Q and A
3
Fast checks
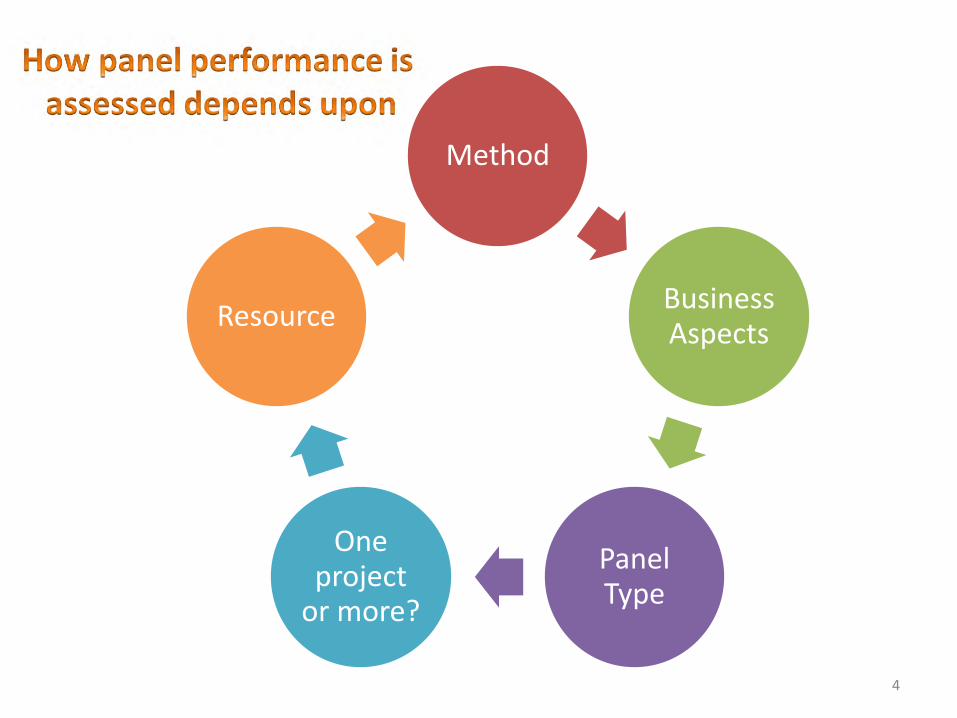
Method
Business Aspects
Panel Type
One project
or more?
Resource
4
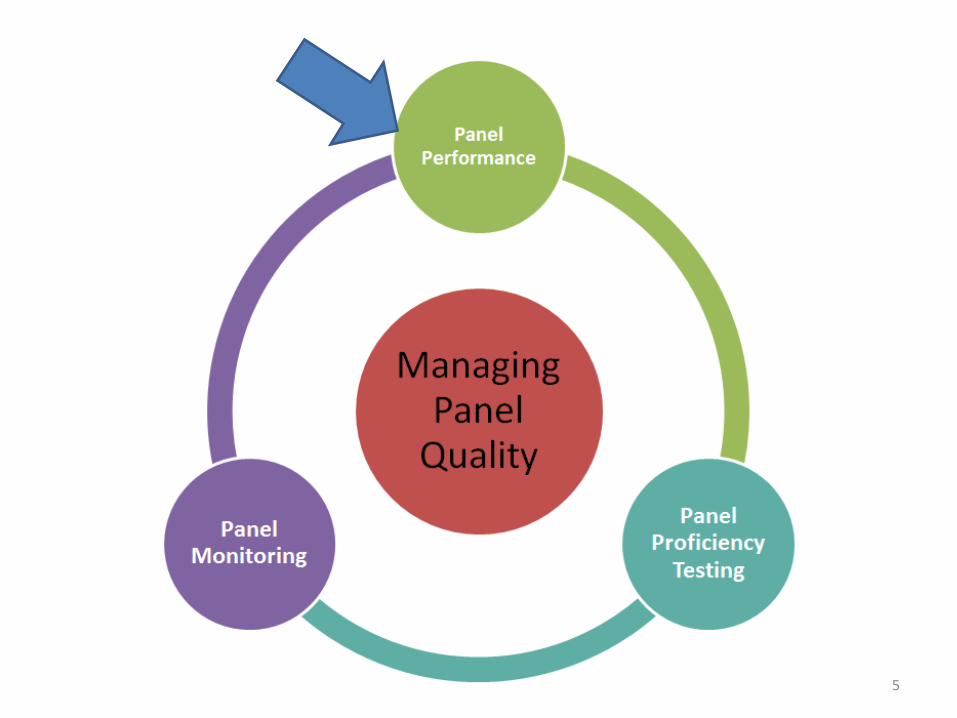
5
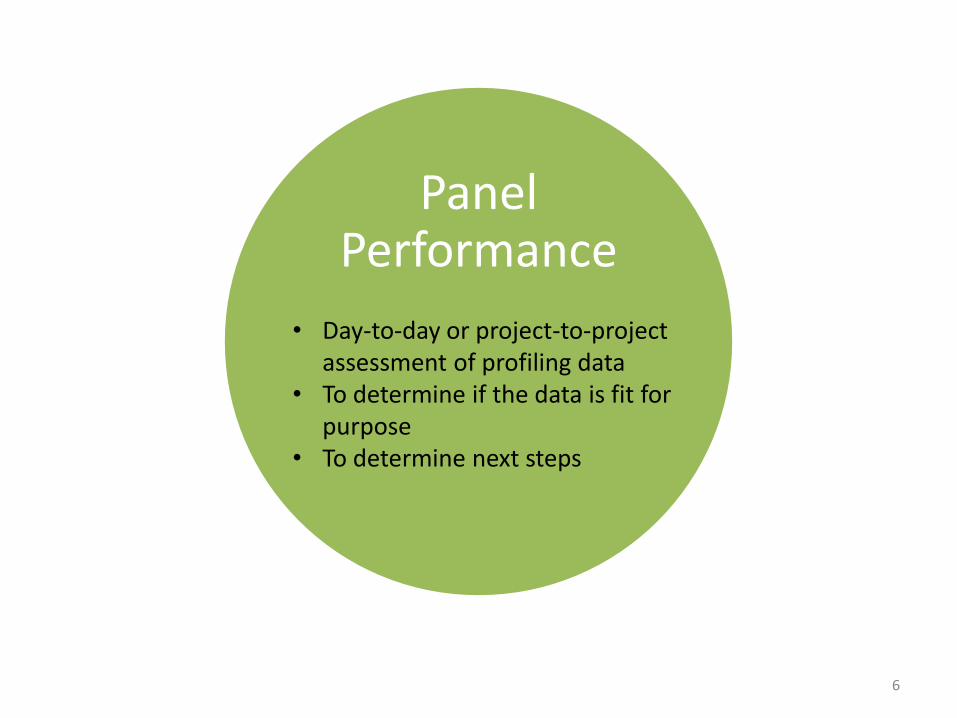
Panel Performance
• Day-to-day or project-to-project assessment of profiling data
• To determine if the data is fit for purpose
• To determine next steps
6
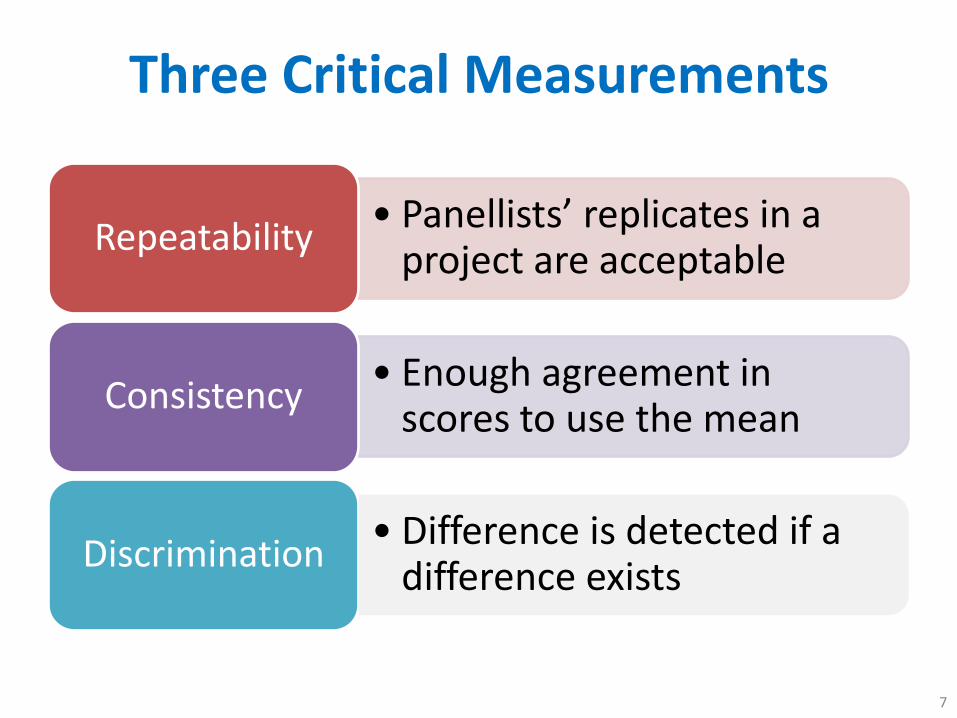
Three Critical Measurements
7
• Panellists’ replicates in a project are acceptable
Repeatability
• Enough agreement in scores to use the mean
Consistency
Discrimination • Difference is detected if a
difference exists

How long do panel performance checks take? Results from LinkedIn* Survey
8 *PFSG, ASTM, PanelCheck, Sensometrics and SSP Groups
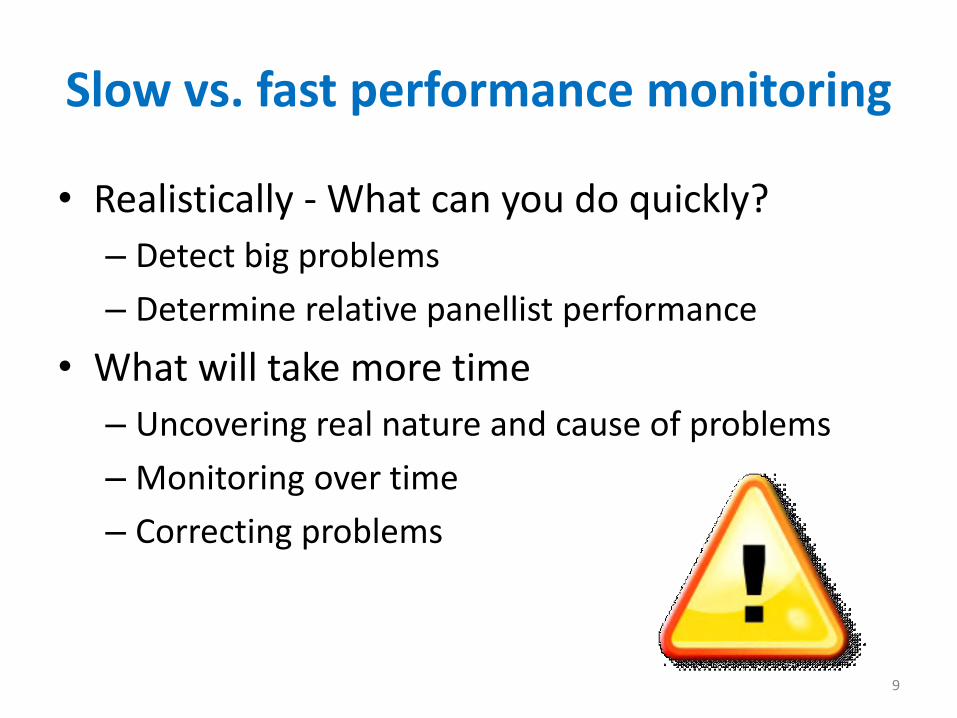
Slow vs. fast performance monitoring
• Realistically - What can you do quickly?
– Detect big problems
– Determine relative panellist performance
• What will take more time
– Uncovering real nature and cause of problems
– Monitoring over time
– Correcting problems
9
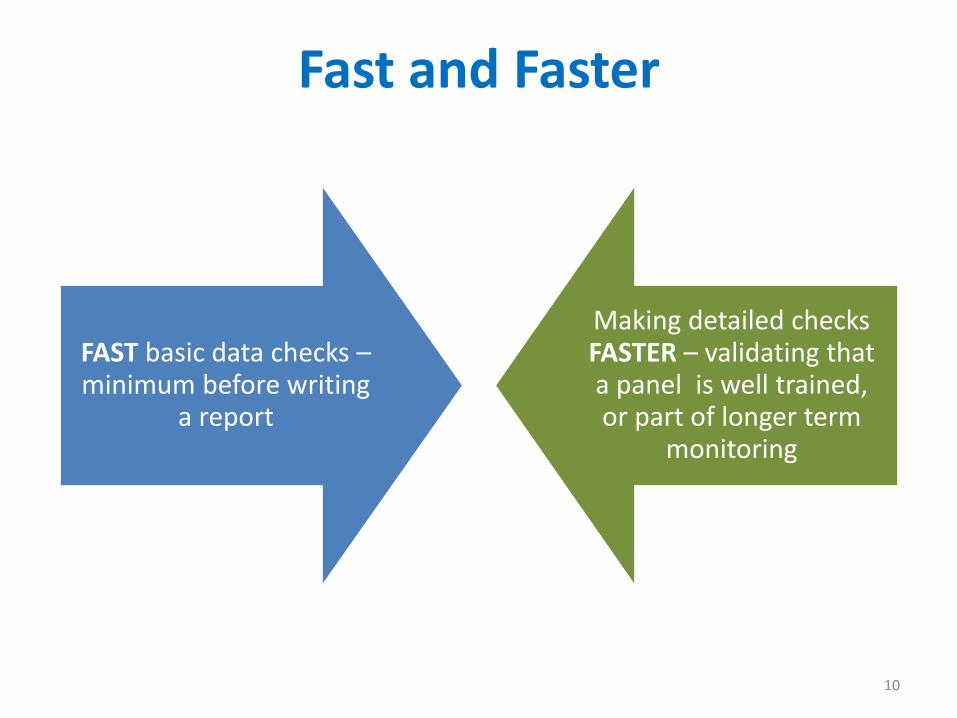
Fast and Faster
10
FAST basic data checks – minimum before writing
a report
Making detailed checks FASTER – validating that a panel is well trained, or part of longer term
monitoring
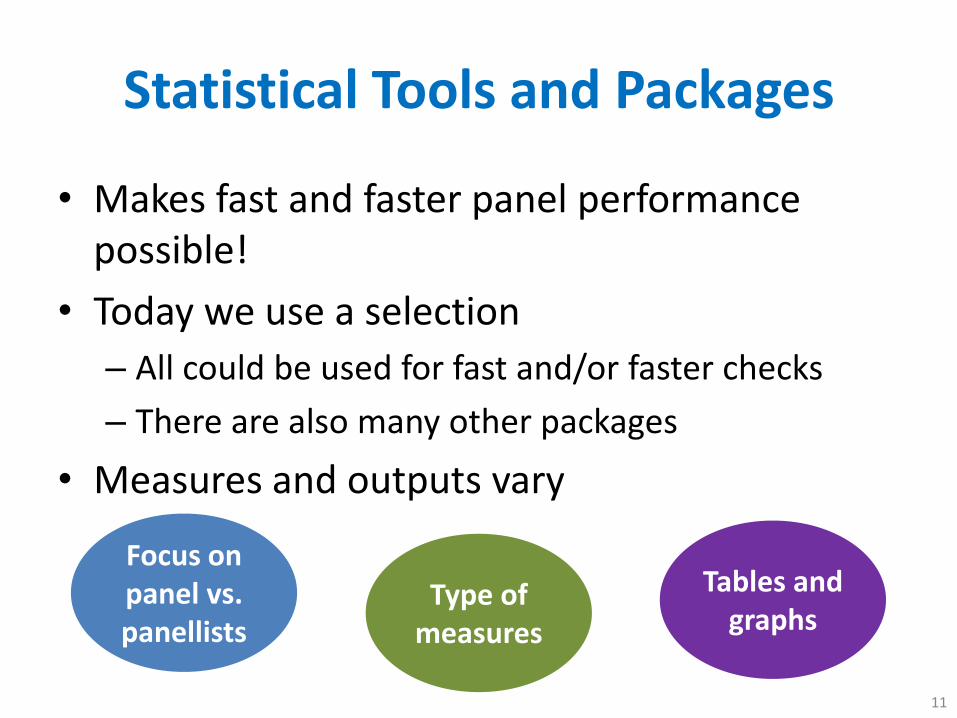
Statistical Tools and Packages
• Makes fast and faster panel performance possible!
• Today we use a selection
– All could be used for fast and/or faster checks
– There are also many other packages
• Measures and outputs vary
11
Focus on panel vs. panellists
Type of measures
Tables and graphs
The dataset
• Descriptive analysis
• 10 apple flavour attributes
• A range of apple varieties
• Natural variability an additional factor to consider
12
Anne
• Really fast panel performance
• Quick essential checks before writing a report on a routine test
• 30 minutes evaluation maximum
• Examples with Senpaq and XLSTAT
13

SENPAQ (Qi Statistics)
• Easy to use
• Tests for differences in product mean scores
• Visualisations and statistical tests
• Multivariate Analysis
– Principal Components (PCA)
– Canonical Variates (CVA)
• Panel Performance
Your Task
• Your boss is knocking on your door for the results
• What would you look at to quickly check panel performance?
• Find a laptop and run the analysis
15
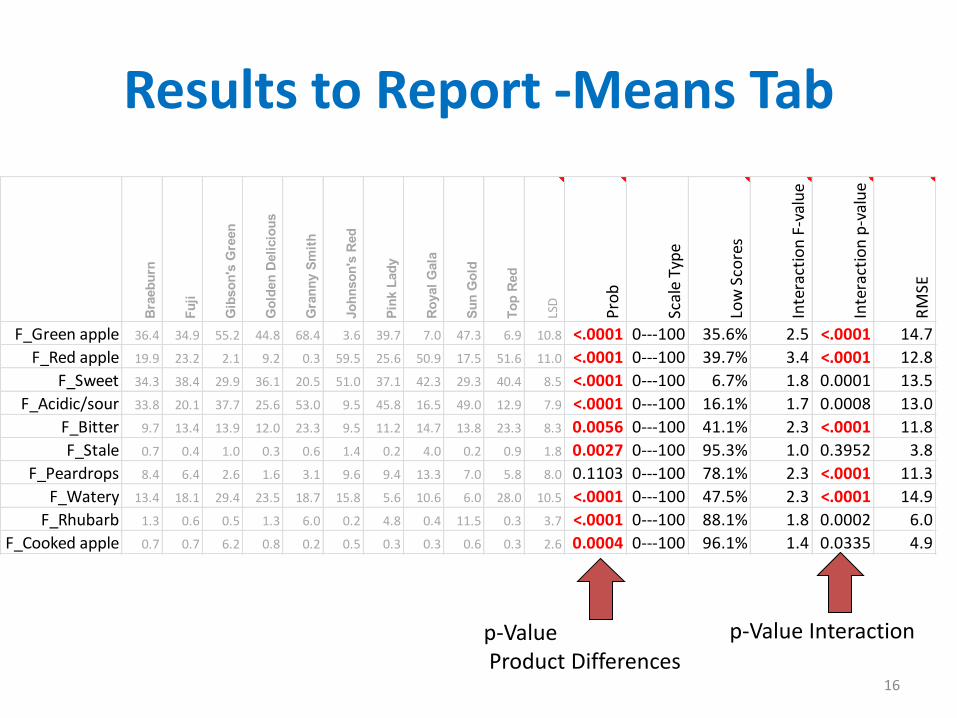
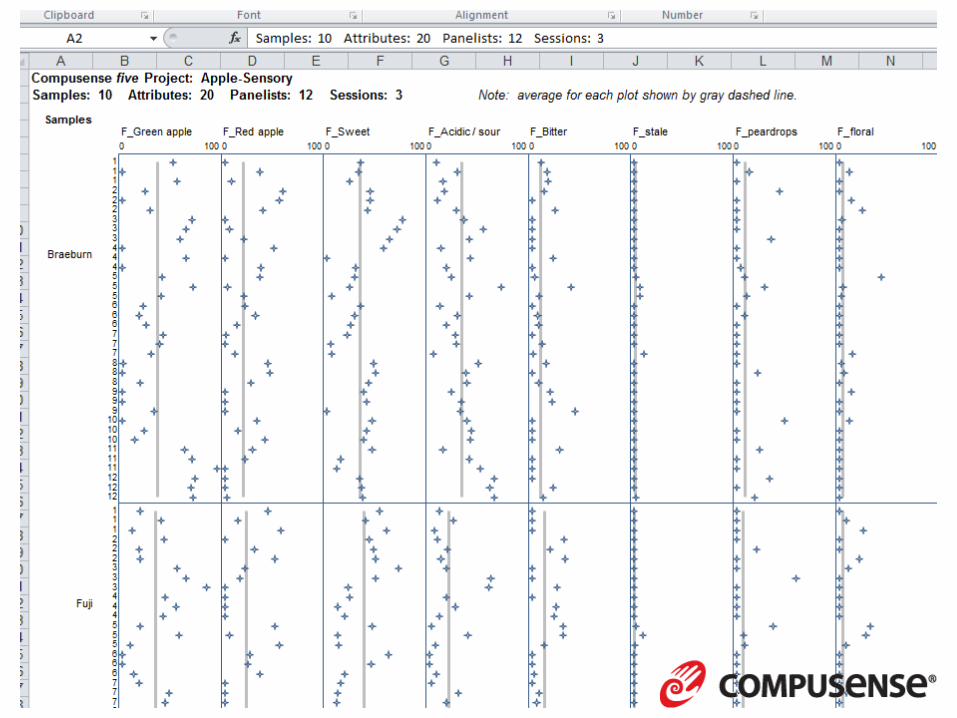
Results to Report -Means Tab
16
Bra
ebur
n
Fuji
Gib
son'
s G
reen
Gol
den
Del
icio
us
Gra
nny
Smith
John
son'
s R
ed
Pink
Lad
y
Roy
al G
ala
Sun
Gol
d
Top
Red
LSD
Pro
b
Scal
e Ty
pe
Low
Sco
res
Inte
ract
ion
F-v
alu
e
Inte
ract
ion
p-v
alu
e
RM
SE
F_Green apple 36.4 34.9 55.2 44.8 68.4 3.6 39.7 7.0 47.3 6.9 10.8 <.0001 0---100 35.6% 2.5 <.0001 14.7
F_Red apple 19.9 23.2 2.1 9.2 0.3 59.5 25.6 50.9 17.5 51.6 11.0 <.0001 0---100 39.7% 3.4 <.0001 12.8
F_Sweet 34.3 38.4 29.9 36.1 20.5 51.0 37.1 42.3 29.3 40.4 8.5 <.0001 0---100 6.7% 1.8 0.0001 13.5
F_Acidic/sour 33.8 20.1 37.7 25.6 53.0 9.5 45.8 16.5 49.0 12.9 7.9 <.0001 0---100 16.1% 1.7 0.0008 13.0
F_Bitter 9.7 13.4 13.9 12.0 23.3 9.5 11.2 14.7 13.8 23.3 8.3 0.0056 0---100 41.1% 2.3 <.0001 11.8
F_Stale 0.7 0.4 1.0 0.3 0.6 1.4 0.2 4.0 0.2 0.9 1.8 0.0027 0---100 95.3% 1.0 0.3952 3.8
F_Peardrops 8.4 6.4 2.6 1.6 3.1 9.6 9.4 13.3 7.0 5.8 8.0 0.1103 0---100 78.1% 2.3 <.0001 11.3
F_Watery 13.4 18.1 29.4 23.5 18.7 15.8 5.6 10.6 6.0 28.0 10.5 <.0001 0---100 47.5% 2.3 <.0001 14.9
F_Rhubarb 1.3 0.6 0.5 1.3 6.0 0.2 4.8 0.4 11.5 0.3 3.7 <.0001 0---100 88.1% 1.8 0.0002 6.0
F_Cooked apple 0.7 0.7 6.2 0.8 0.2 0.5 0.3 0.3 0.6 0.3 2.6 0.0004 0---100 96.1% 1.4 0.0335 4.9
p-Value Product Differences
p-Value Interaction
17
Bra
ebur
n
Fuji
Gib
son'
s G
reen
Gol
den
Del
icio
us
Gra
nny
Smith
John
son'
s R
ed
Pink
Lad
y
Roy
al G
ala
Sun
Gol
d
Top
Red
LSD
Pro
b
Scal
e Ty
pe
Low
Sco
res
Inte
ract
ion
F-v
alu
e
Inte
ract
ion
p-v
alu
e
RM
SE
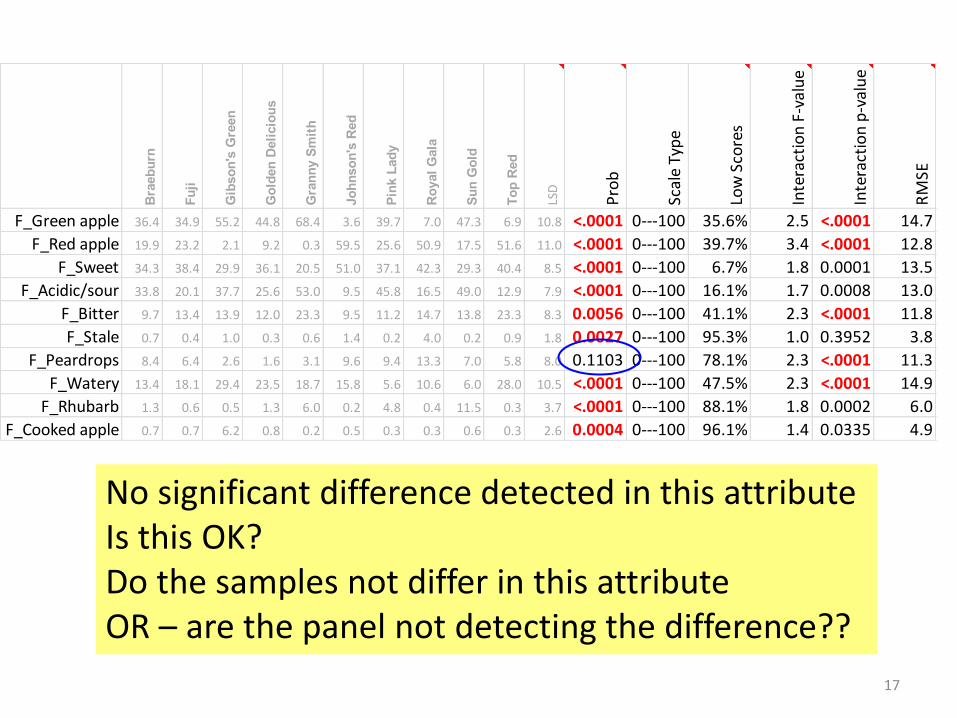
F_Green apple 36.4 34.9 55.2 44.8 68.4 3.6 39.7 7.0 47.3 6.9 10.8 <.0001 0---100 35.6% 2.5 <.0001 14.7
F_Red apple 19.9 23.2 2.1 9.2 0.3 59.5 25.6 50.9 17.5 51.6 11.0 <.0001 0---100 39.7% 3.4 <.0001 12.8
F_Sweet 34.3 38.4 29.9 36.1 20.5 51.0 37.1 42.3 29.3 40.4 8.5 <.0001 0---100 6.7% 1.8 0.0001 13.5
F_Acidic/sour 33.8 20.1 37.7 25.6 53.0 9.5 45.8 16.5 49.0 12.9 7.9 <.0001 0---100 16.1% 1.7 0.0008 13.0
F_Bitter 9.7 13.4 13.9 12.0 23.3 9.5 11.2 14.7 13.8 23.3 8.3 0.0056 0---100 41.1% 2.3 <.0001 11.8
F_Stale 0.7 0.4 1.0 0.3 0.6 1.4 0.2 4.0 0.2 0.9 1.8 0.0027 0---100 95.3% 1.0 0.3952 3.8
F_Peardrops 8.4 6.4 2.6 1.6 3.1 9.6 9.4 13.3 7.0 5.8 8.0 0.1103 0---100 78.1% 2.3 <.0001 11.3
F_Watery 13.4 18.1 29.4 23.5 18.7 15.8 5.6 10.6 6.0 28.0 10.5 <.0001 0---100 47.5% 2.3 <.0001 14.9
F_Rhubarb 1.3 0.6 0.5 1.3 6.0 0.2 4.8 0.4 11.5 0.3 3.7 <.0001 0---100 88.1% 1.8 0.0002 6.0
F_Cooked apple 0.7 0.7 6.2 0.8 0.2 0.5 0.3 0.3 0.6 0.3 2.6 0.0004 0---100 96.1% 1.4 0.0335 4.9
No significant difference detected in this attribute Is this OK? Do the samples not differ in this attribute OR – are the panel not detecting the difference??
18
Bra
ebur
n
Fuji
Gib
son'
s G
reen
Gol
den
Del
icio
us
Gra
nny
Smith
John
son'
s R
ed
Pink
Lad
y
Roy
al G
ala
Sun
Gol
d
Top
Red
LSD
Pro
b
Scal
e Ty
pe
Low
Sco
res
Inte
ract
ion
F-v
alu
e
Inte
ract
ion
p-v
alu
e
RM
SE
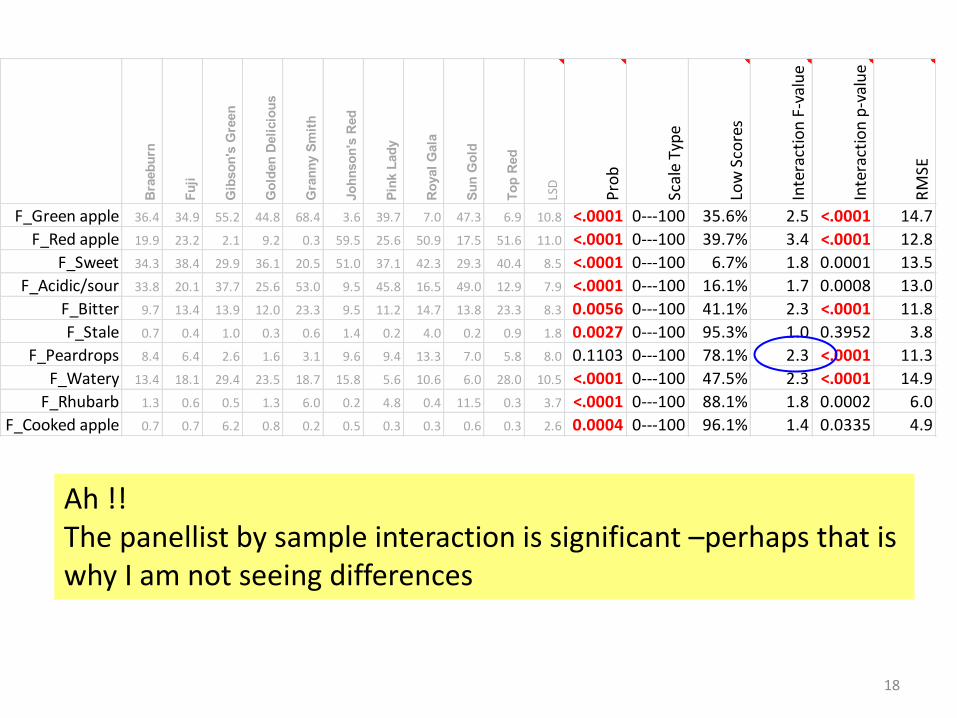
F_Green apple 36.4 34.9 55.2 44.8 68.4 3.6 39.7 7.0 47.3 6.9 10.8 <.0001 0---100 35.6% 2.5 <.0001 14.7
F_Red apple 19.9 23.2 2.1 9.2 0.3 59.5 25.6 50.9 17.5 51.6 11.0 <.0001 0---100 39.7% 3.4 <.0001 12.8
F_Sweet 34.3 38.4 29.9 36.1 20.5 51.0 37.1 42.3 29.3 40.4 8.5 <.0001 0---100 6.7% 1.8 0.0001 13.5
F_Acidic/sour 33.8 20.1 37.7 25.6 53.0 9.5 45.8 16.5 49.0 12.9 7.9 <.0001 0---100 16.1% 1.7 0.0008 13.0
F_Bitter 9.7 13.4 13.9 12.0 23.3 9.5 11.2 14.7 13.8 23.3 8.3 0.0056 0---100 41.1% 2.3 <.0001 11.8
F_Stale 0.7 0.4 1.0 0.3 0.6 1.4 0.2 4.0 0.2 0.9 1.8 0.0027 0---100 95.3% 1.0 0.3952 3.8
F_Peardrops 8.4 6.4 2.6 1.6 3.1 9.6 9.4 13.3 7.0 5.8 8.0 0.1103 0---100 78.1% 2.3 <.0001 11.3
F_Watery 13.4 18.1 29.4 23.5 18.7 15.8 5.6 10.6 6.0 28.0 10.5 <.0001 0---100 47.5% 2.3 <.0001 14.9
F_Rhubarb 1.3 0.6 0.5 1.3 6.0 0.2 4.8 0.4 11.5 0.3 3.7 <.0001 0---100 88.1% 1.8 0.0002 6.0
F_Cooked apple 0.7 0.7 6.2 0.8 0.2 0.5 0.3 0.3 0.6 0.3 2.6 0.0004 0---100 96.1% 1.4 0.0335 4.9
Ah !! The panellist by sample interaction is significant –perhaps that is why I am not seeing differences
19
1 2 3 4 5 6 7 8 9 10 11 12 Inte
racti
on
p-v
alu
e
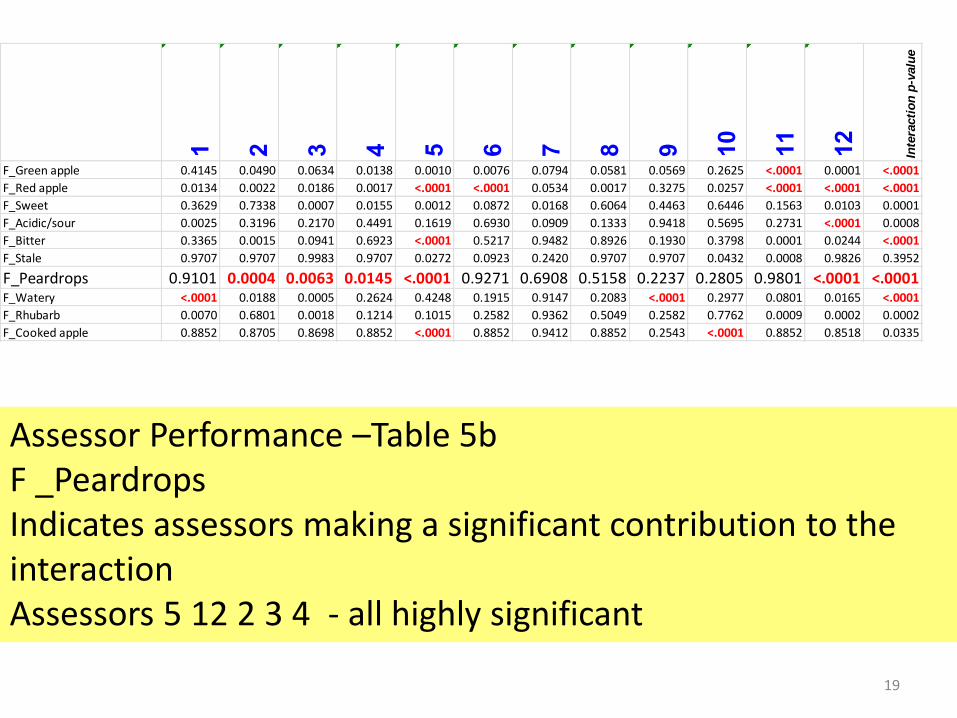
F_Green apple 0.4145 0.0490 0.0634 0.0138 0.0010 0.0076 0.0794 0.0581 0.0569 0.2625 <.0001 0.0001 <.0001
F_Red apple 0.0134 0.0022 0.0186 0.0017 <.0001 <.0001 0.0534 0.0017 0.3275 0.0257 <.0001 <.0001 <.0001
F_Sweet 0.3629 0.7338 0.0007 0.0155 0.0012 0.0872 0.0168 0.6064 0.4463 0.6446 0.1563 0.0103 0.0001
F_Acidic/sour 0.0025 0.3196 0.2170 0.4491 0.1619 0.6930 0.0909 0.1333 0.9418 0.5695 0.2731 <.0001 0.0008
F_Bitter 0.3365 0.0015 0.0941 0.6923 <.0001 0.5217 0.9482 0.8926 0.1930 0.3798 0.0001 0.0244 <.0001
F_Stale 0.9707 0.9707 0.9983 0.9707 0.0272 0.0923 0.2420 0.9707 0.9707 0.0432 0.0008 0.9826 0.3952
F_Peardrops 0.9101 0.0004 0.0063 0.0145 <.0001 0.9271 0.6908 0.5158 0.2237 0.2805 0.9801 <.0001 <.0001F_Watery <.0001 0.0188 0.0005 0.2624 0.4248 0.1915 0.9147 0.2083 <.0001 0.2977 0.0801 0.0165 <.0001
F_Rhubarb 0.0070 0.6801 0.0018 0.1214 0.1015 0.2582 0.9362 0.5049 0.2582 0.7762 0.0009 0.0002 0.0002
F_Cooked apple 0.8852 0.8705 0.8698 0.8852 <.0001 0.8852 0.9412 0.8852 0.2543 <.0001 0.8852 0.8518 0.0335
Assessor Performance –Table 5b F _Peardrops Indicates assessors making a significant contribution to the interaction Assessors 5 12 2 3 4 - all highly significant

20
Pictures are always useful!
Action
21
If F_Peardrop a key attribute in the product assessment Report –inconclusive result Instigate panel training in this attribute
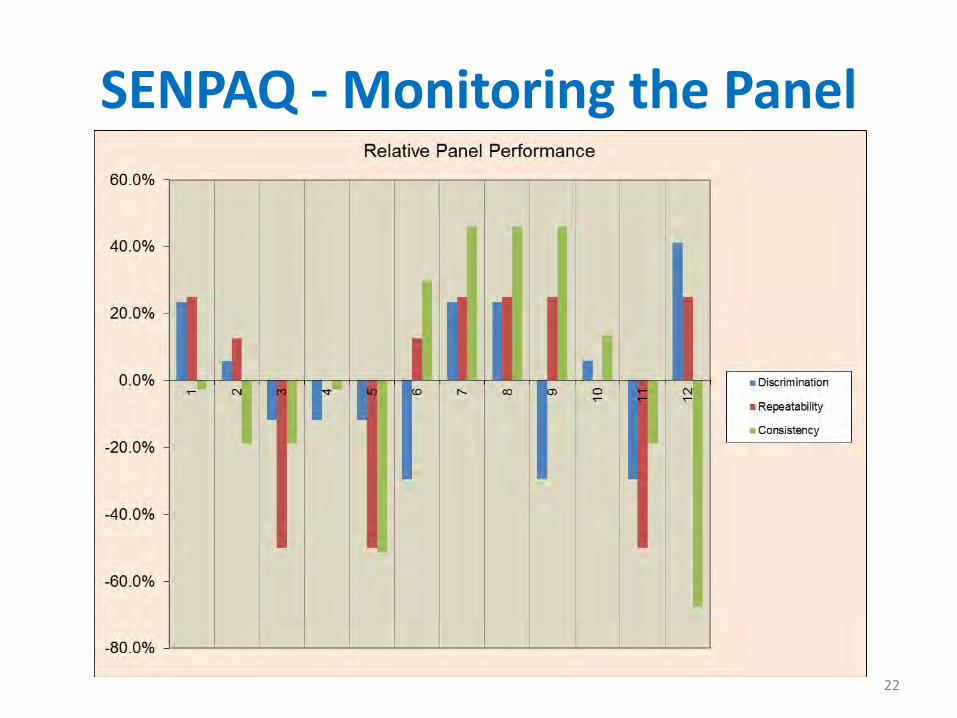
SENPAQ - Monitoring the Panel
22
XLSTAT
• XLSTAT MX package –offers panel analysis
• Fits ANOVA models
• Focus is on panellists rather than products
• Some useful graphical outputs
23
24
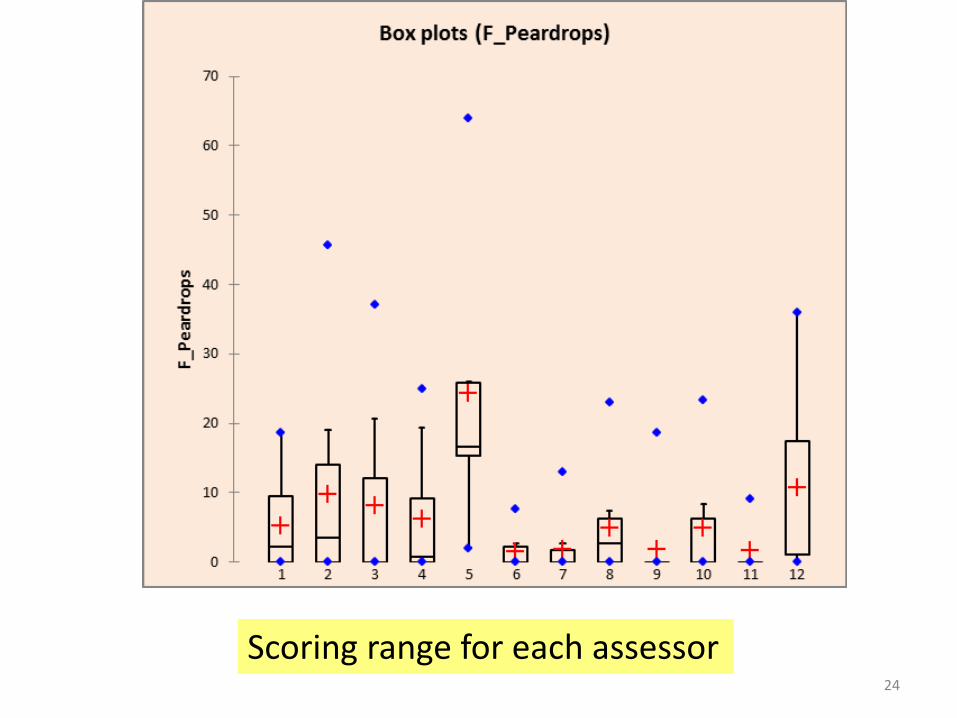
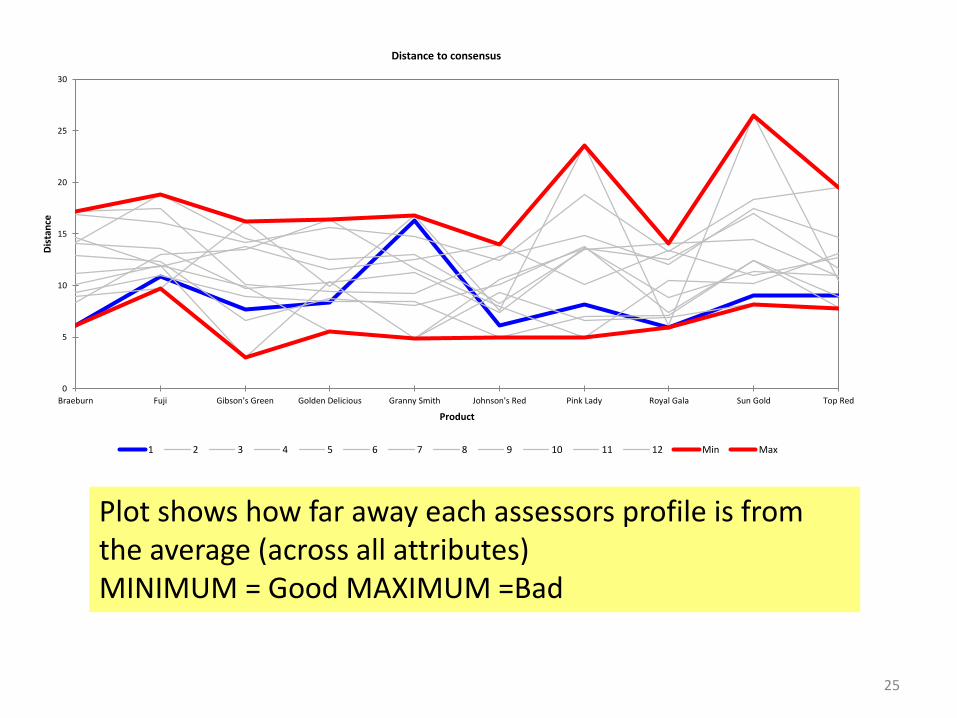
Scoring range for each assessor
25
0
5
10
15
20
25
30
Braeburn Fuji Gibson's Green Golden Delicious Granny Smith Johnson's Red Pink Lady Royal Gala Sun Gold Top Red
Dis
tan
ce
Product
Distance to consensus
1 2 3 4 5 6 7 8 9 10 11 12 Min Max
Plot shows how far away each assessors profile is from the average (across all attributes) MINIMUM = Good MAXIMUM =Bad

Lauren
• Making more involved panel performance analyses for a project faster or more efficient
• Post training checks, regular monitoring, etc.
• Several hours evaluation or more
• Examples using PanelCheck, FIZZ and Compusense
26
27
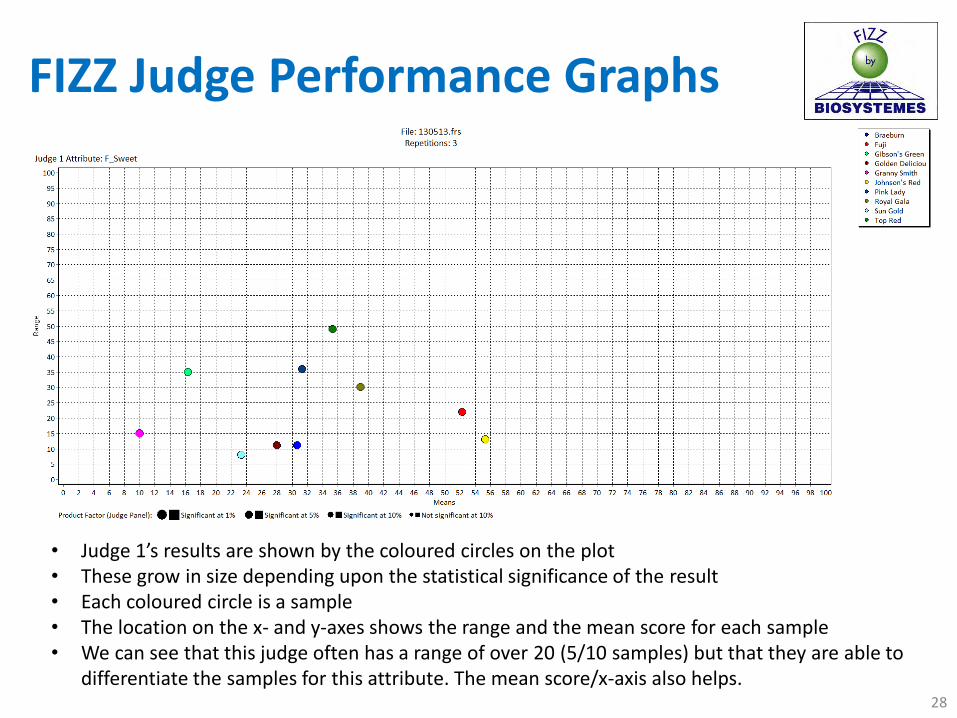
FIZZ Judge Performance Graphs
28
• Judge 1’s results are shown by the coloured circles on the plot • These grow in size depending upon the statistical significance of the result • Each coloured circle is a sample • The location on the x- and y-axes shows the range and the mean score for each sample • We can see that this judge often has a range of over 20 (5/10 samples) but that they are able to
differentiate the samples for this attribute. The mean score/x-axis also helps.
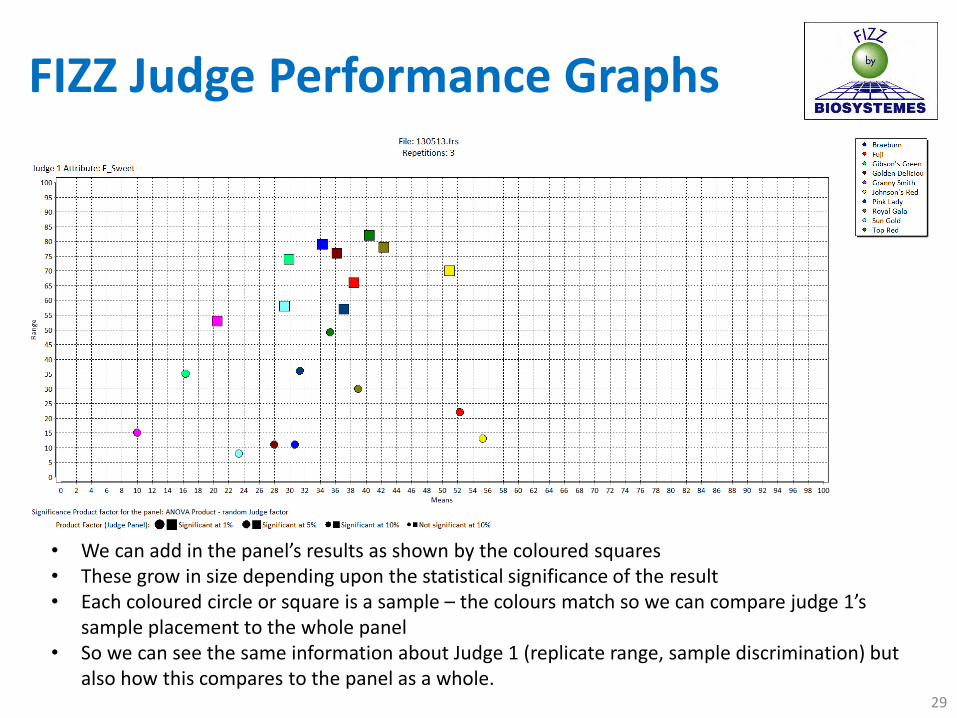
FIZZ Judge Performance Graphs
29
• We can add in the panel’s results as shown by the coloured squares • These grow in size depending upon the statistical significance of the result • Each coloured circle or square is a sample – the colours match so we can compare judge 1’s
sample placement to the whole panel • So we can see the same information about Judge 1 (replicate range, sample discrimination) but
also how this compares to the panel as a whole.
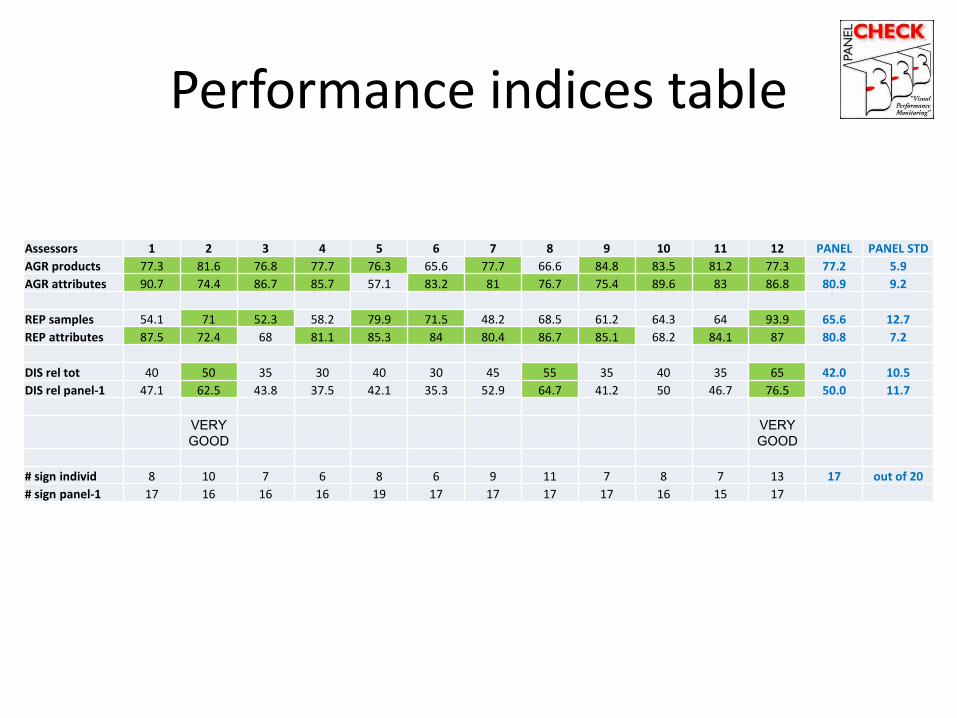
Performance indices table
Assessors 1 2 3 4 5 6 7 8 9 10 11 12 PANEL PANEL STD AGR products 77.3 81.6 76.8 77.7 76.3 65.6 77.7 66.6 84.8 83.5 81.2 77.3 77.2 5.9 AGR attributes 90.7 74.4 86.7 85.7 57.1 83.2 81 76.7 75.4 89.6 83 86.8 80.9 9.2
REP samples 54.1 71 52.3 58.2 79.9 71.5 48.2 68.5 61.2 64.3 64 93.9 65.6 12.7 REP attributes 87.5 72.4 68 81.1 85.3 84 80.4 86.7 85.1 68.2 84.1 87 80.8 7.2
DIS rel tot 40 50 35 30 40 30 45 55 35 40 35 65 42.0 10.5 DIS rel panel-1 47.1 62.5 43.8 37.5 42.1 35.3 52.9 64.7 41.2 50 46.7 76.5 50.0 11.7
VERY GOOD
VERY GOOD
# sign individ 8 10 7 6 8 6 9 11 7 8 7 13 17 out of 20 # sign panel-1 17 16 16 16 19 17 17 17 17 16 15 17
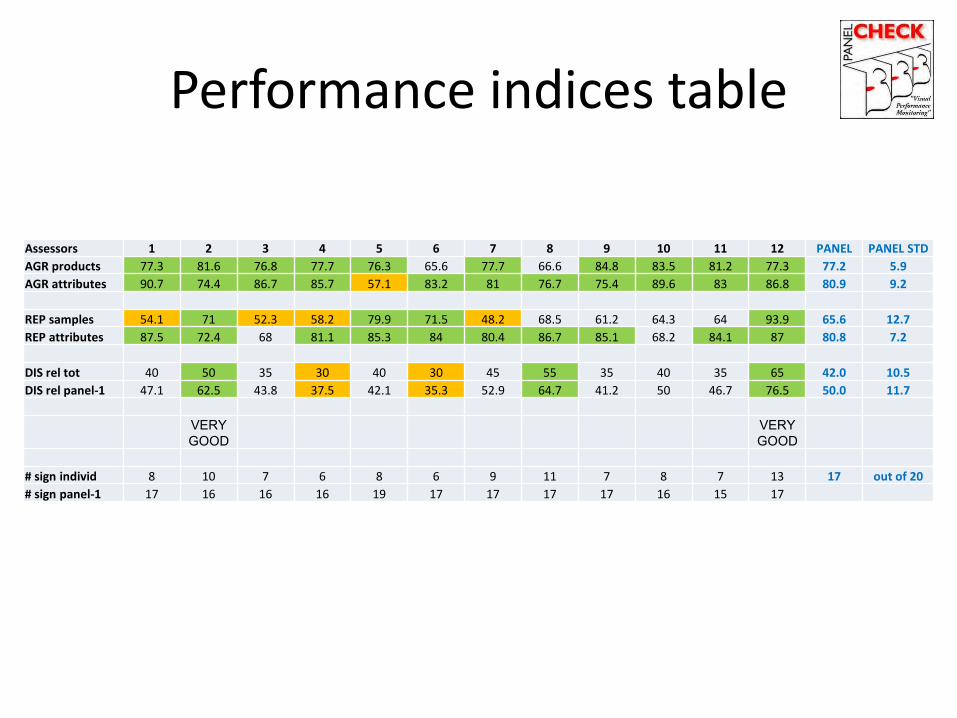
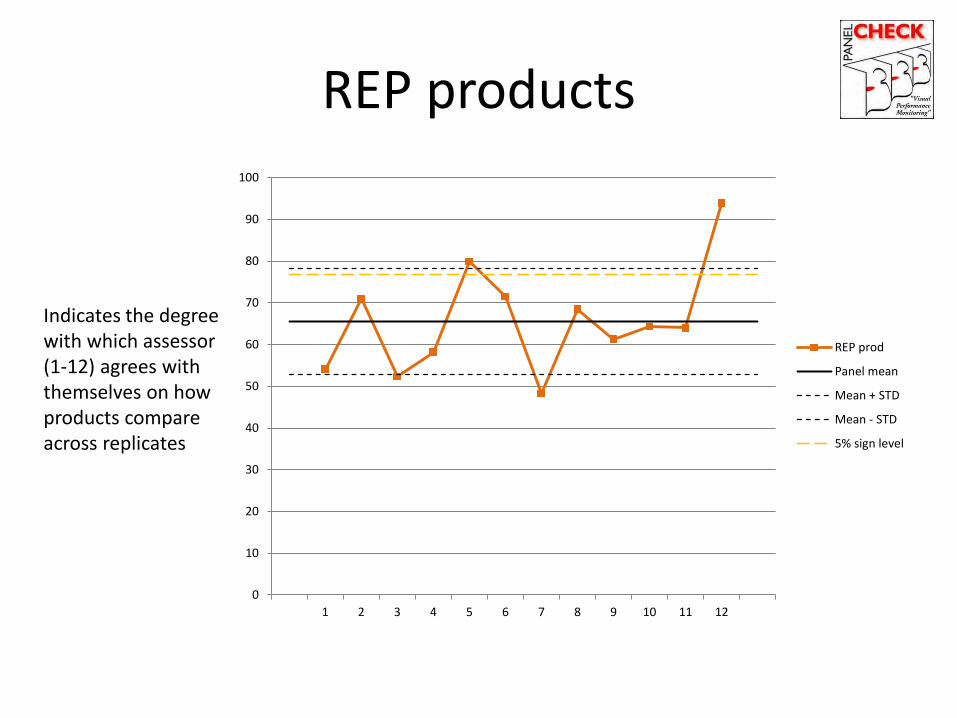
REP products
0
10
20
30
40
50
60
70
80
90
100
1 2 3 4 5 6 7 8 9 10 11 12
REP prod
Panel mean
Mean + STD
Mean - STD
5% sign level
Indicates the degree with which assessor (1-12) agrees with themselves on how products compare across replicates
Demo with PanelCheck
• Groups around each PC
• Use the handout with the instructions
• The screenshots will be on the slide
• Any questions please just ask
• Some of the LFR staff are on hand to help
• Follow through my clicks…
35
Providing Immediate Feedback An example using Visual Proportions
The power of calibrated descriptive sensory panels
August 25, 2010
FCM Feedback Calibration Method

The power of calibrated descriptive sensory panels
August 25, 2010
Immediate Feedback

Round up
• A proposed way of working
• Software
• The ideal panel performance infographic
• Making time for panel performance
• Discussion and Q and A
38
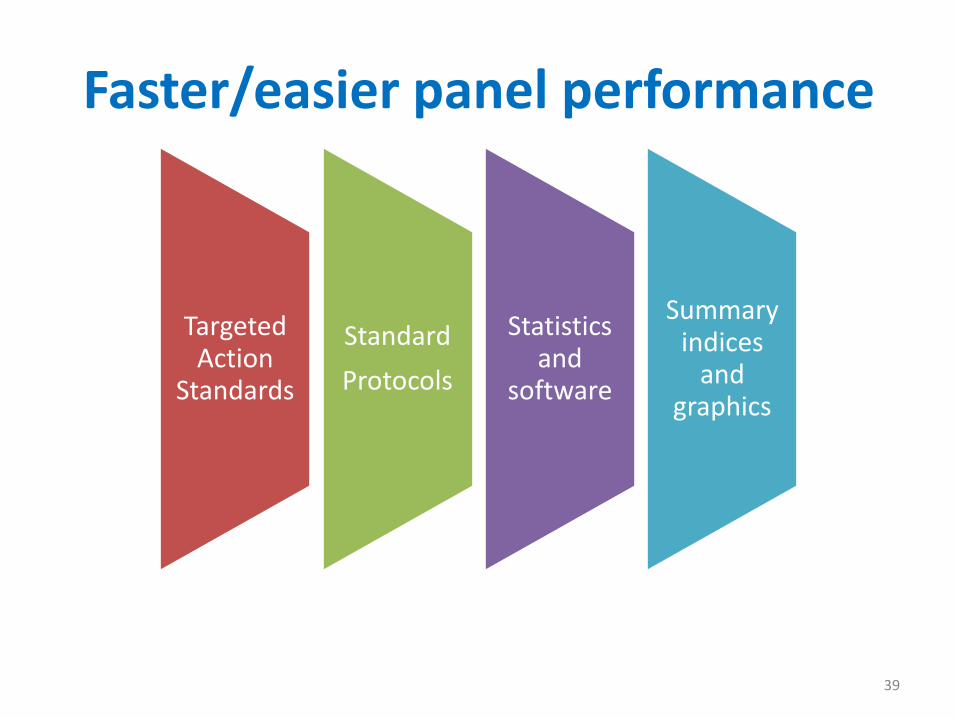
Faster/easier panel performance
39
Targeted Action
Standards
Standard
Protocols
Statistics and
software
Summary indices
and graphics
Software
• All packages used today (Senpaq, FIZZ, XLSTAT, PanelCheck, Compusense) can be used for FAST and FASTER panel performance
• Other packages are also available:
– Senstools, EyeQuestion, JMP, Tragon QDA, etc. . .
• What are existing packages good at?
• What (if anything) is missing?
40

The ideal panel performance infographic?
• Panellist and panel information
• Repeatability, consistency and discrimination
• All attributes
• In/borderline/out
• Detail of problem areas
41
Making time for panel performance
• Job roles
• Planning and resource
• Report on panel performance
• Tailored data visualisations and statistics
• Work with your sensory software provider
42

Thank you
• Jenny Arden for helping set up the demos
• LFR IT: Ian Goulding and Matthew Alcoe for setting up the computers
• Christina Bance for sending out the data set in advance
• LFR staff for helping set up the room
43

Discussion/Q and A
• How important is it to you that performance checks are fast?
• What do you need to check the quality of data/panel performance?
• What are existing software packages good at?
• What (if anything) is missing?
44