Embed Size (px)
Citation preview
Panel 1: New Approaches to Measurement and Metrology for NMs in Complex Matrices
Questions addressed in this topic include: • Presentation
• What are the state of the art tools for detecting and characterizing ENMs in complex biological and environmental matrices?
• Discussion • What tools still need to be developed?
• What are the needs for standard methods and
instrumentation?
Panel 1: New Approaches to Measurement and Metrology for NMs in Complex Matrices
Questions addressed in this topic include: • Presentation
• What are the state of the art tools for detecting and characterizing ENMs in complex biological and environmental matrices?
• Focus on Inorganic NPs
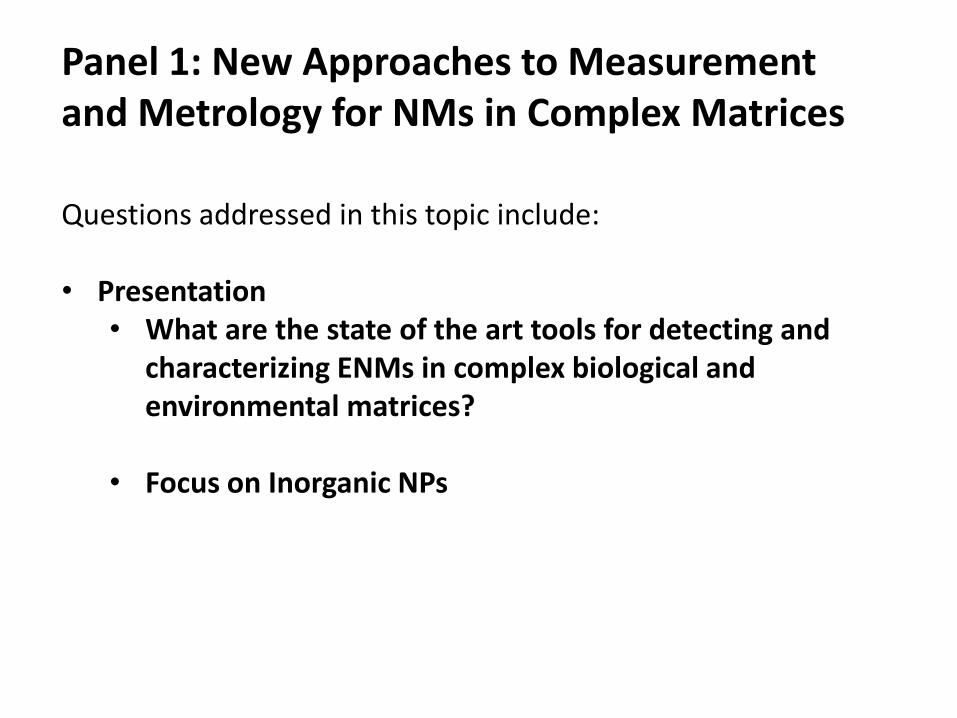
Wear/ Abrasion
Washing
Discharge/waste
Incineration
Weathering
Biodegradation UV
Use
Disposal
Adapted from USEPA,2012
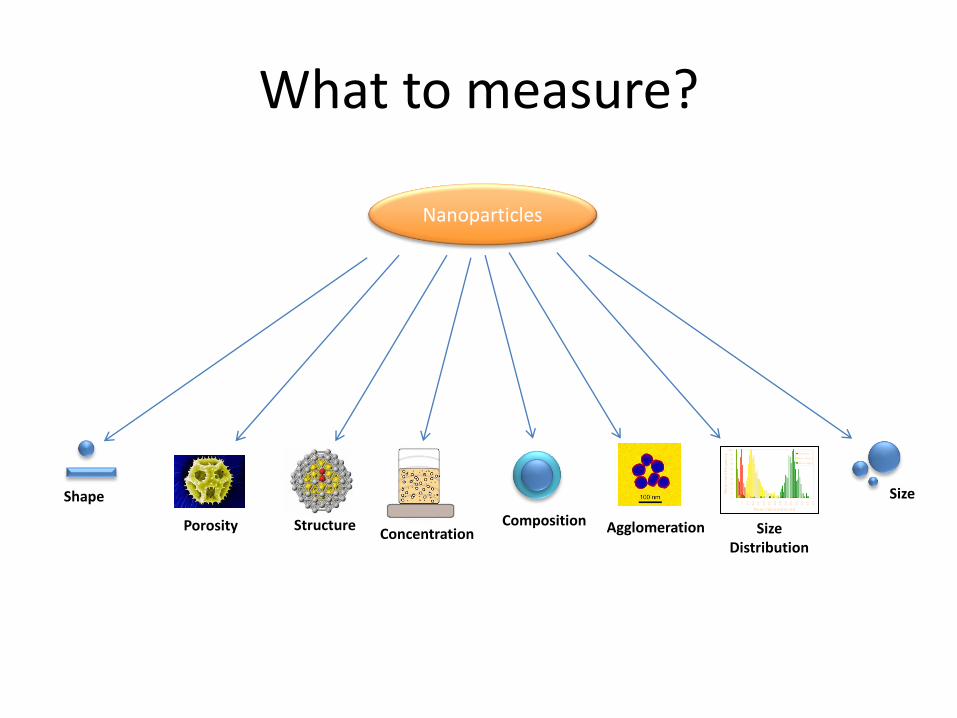
What to measure?
Size
Size Distribution
Shape
Composition Structure Porosity Concentration Agglomeration
Nanoparticles
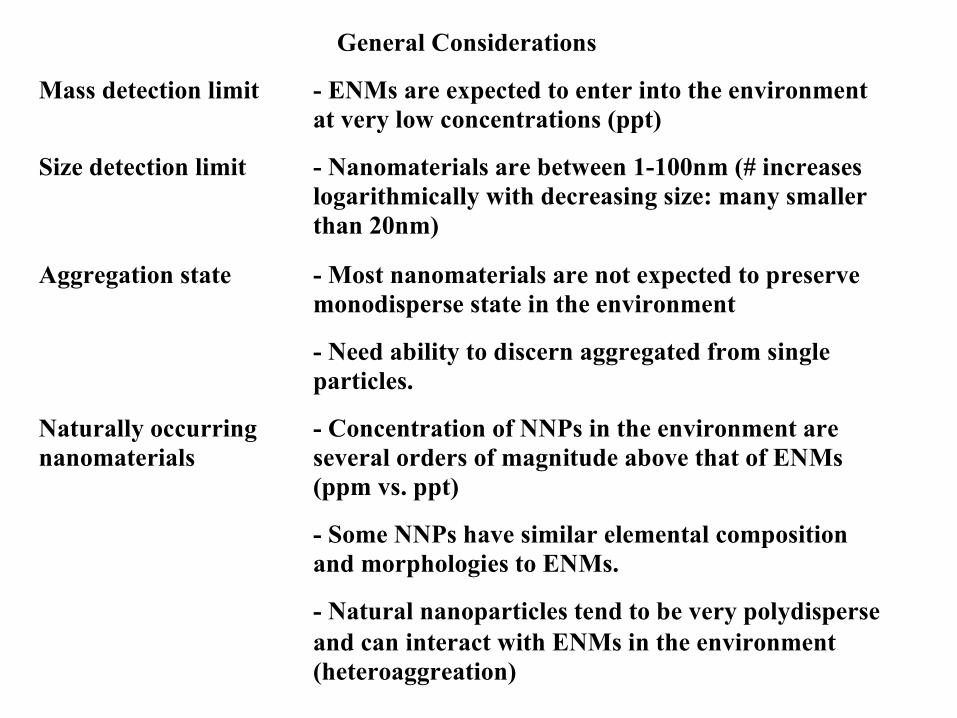
General Considerations
Mass detection limit - ENMs are expected to enter into the environment
at very low concentrations (ppt)
Size detection limit - Nanomaterials are between 1-100nm (# increases
logarithmically with decreasing size: many smaller
than 20nm)
Aggregation state - Most nanomaterials are not expected to preserve
monodisperse state in the environment
- Need ability to discern aggregated from single
particles.
Naturally occurring
nanomaterials
- Concentration of NNPs in the environment are
several orders of magnitude above that of ENMs
(ppm vs. ppt)
- Some NNPs have similar elemental composition
and morphologies to ENMs.
- Natural nanoparticles tend to be very polydisperse
and can interact with ENMs in the environment
(heteroaggreation)
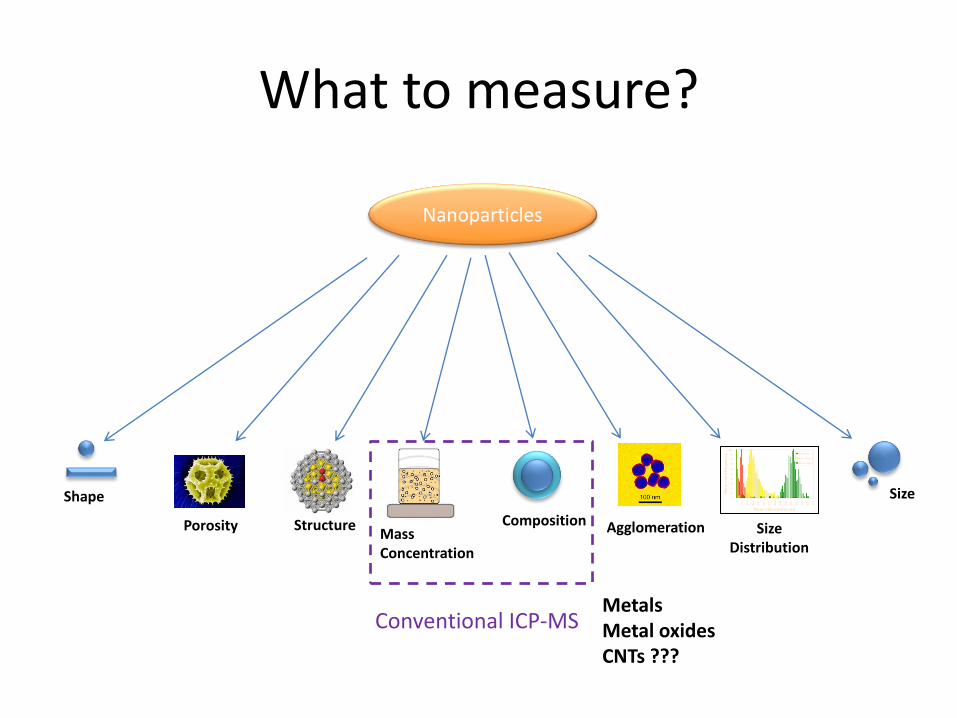
What to measure?
Size
Size Distribution
Shape
Composition Structure Porosity Mass Concentration
Agglomeration
Nanoparticles
Conventional ICP-MS Metals Metal oxides CNTs ???
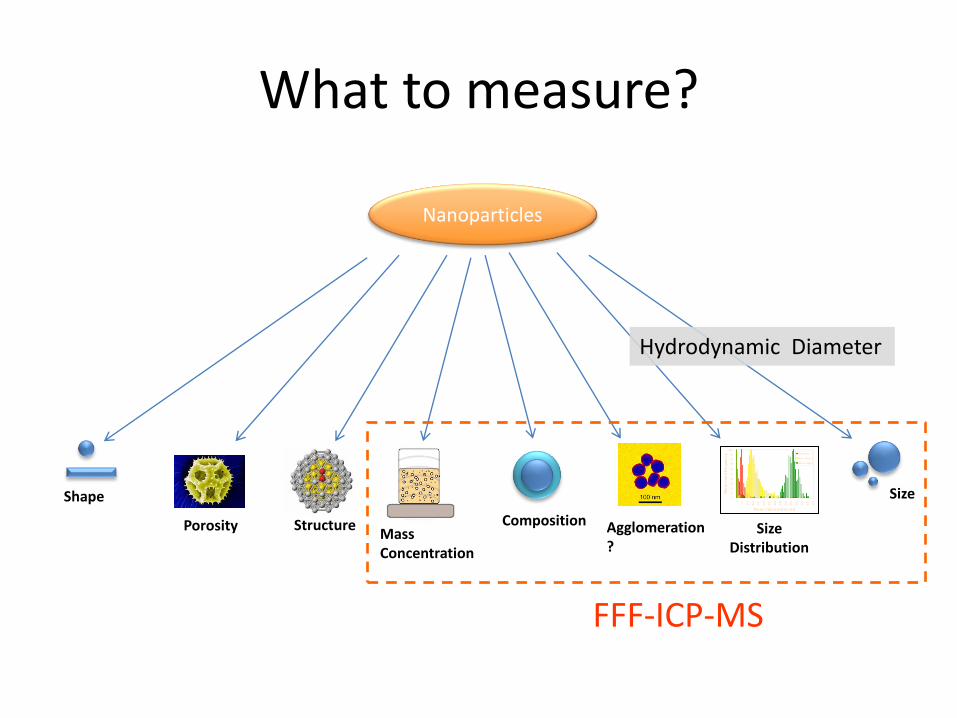
What to measure?
Size
Size Distribution
Shape
Composition Structure Porosity Mass Concentration
Agglomeration ?
Nanoparticles
FFF-ICP-MS
Hydrodynamic Diameter
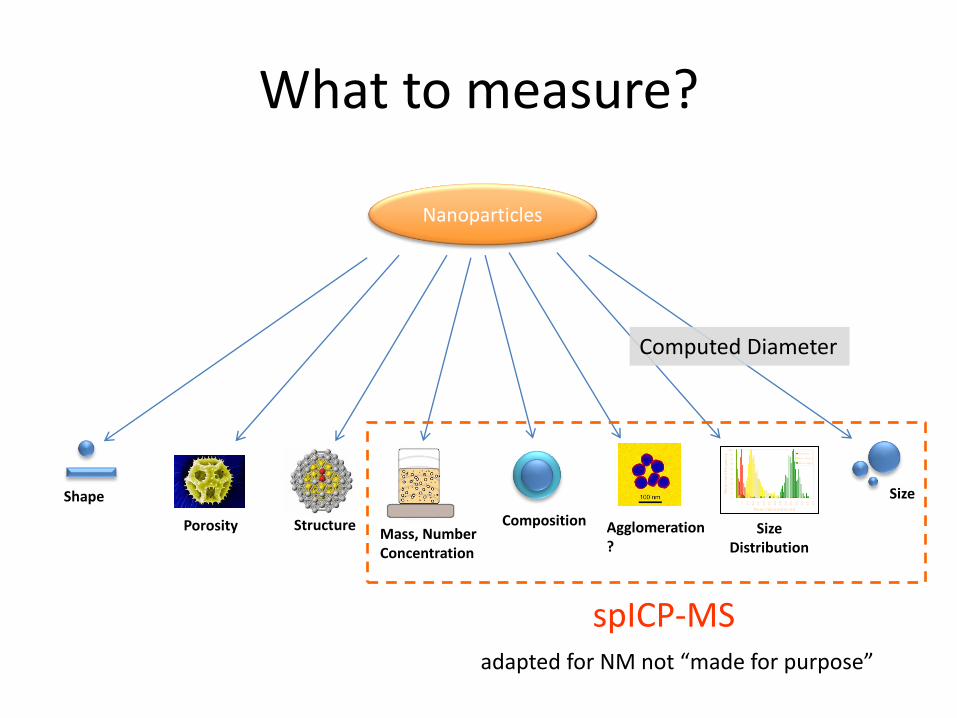
What to measure?
Size
Size Distribution
Shape
Composition Structure Porosity Mass, Number Concentration
Agglomeration ?
Nanoparticles
spICP-MS
Computed Diameter
adapted for NM not “made for purpose”
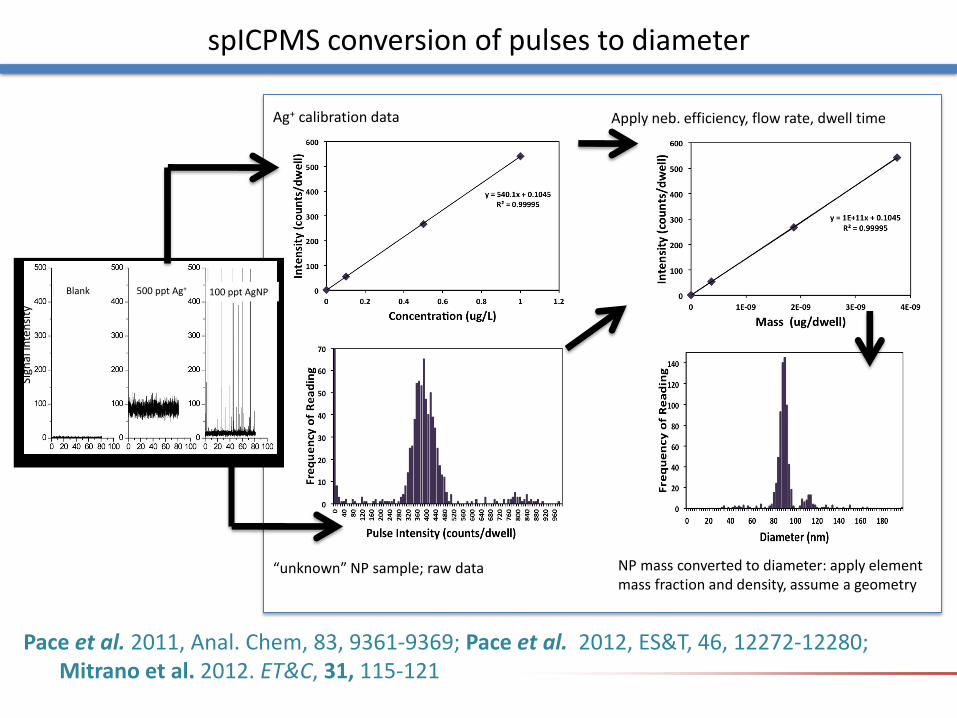
, dwell time
Ag+ calibration data Convert to mass flux; using efficiency
“unknown” NP sample; raw data NP mass converted to diameter: apply element mass fraction and density, assume a geometry
Time(seconds)
Signalintensity
Blank 500pptAg+ 100pptAgNP
Apply neb. efficiency, flow rate, dwell time
spICPMS conversion of pulses to diameter
Pace et al. 2011, Anal. Chem, 83, 9361-9369; Pace et al. 2012, ES&T, 46, 12272-12280; Mitrano et al. 2012. ET&C, 31, 115-121
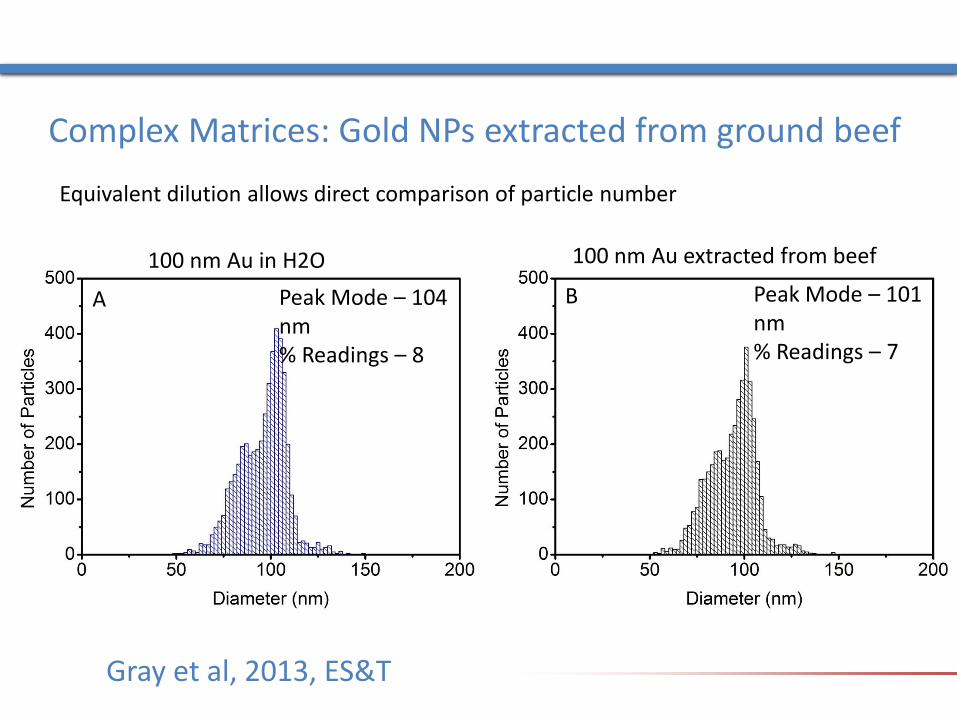
Gray et al, 2013, ES&T
Complex Matrices: Gold NPs extracted from ground beef
A B Peak Mode – 104 nm % Readings – 8
Peak Mode – 101 nm % Readings – 7
100 nm Au in H2O 100 nm Au extracted from beef
Equivalent dilution allows direct comparison of particle number
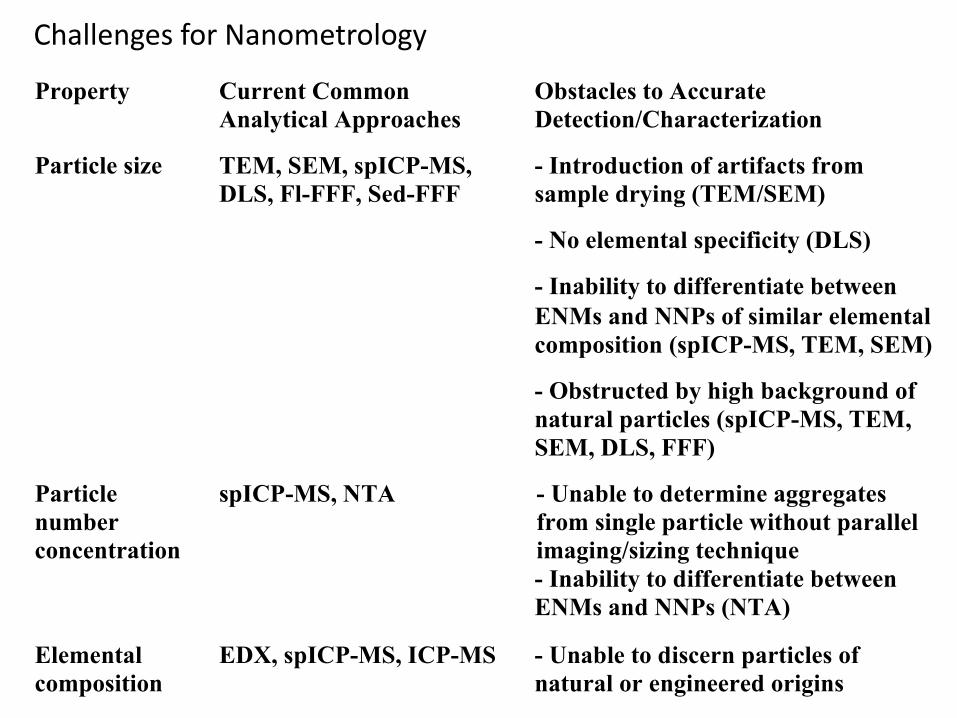
Property Current Common
Analytical Approaches
Obstacles to Accurate
Detection/Characterization
Particle size TEM, SEM, spICP-MS,
DLS, Fl-FFF, Sed-FFF
- Introduction of artifacts from
sample drying (TEM/SEM)
- No elemental specificity (DLS)
- Inability to differentiate between
ENMs and NNPs of similar elemental
composition (spICP-MS, TEM, SEM)
- Obstructed by high background of
natural particles (spICP-MS, TEM,
SEM, DLS, FFF)
Particle
number
concentration
spICP-MS, NTA - Unable to determine aggregates
from single particle without parallel
imaging/sizing technique
- - Inability to differentiate between
ENMs and NNPs (NTA)
Elemental
composition
EDX, spICP-MS, ICP-MS - Unable to discern particles of
natural or engineered origins
Challenges for Nanometrology
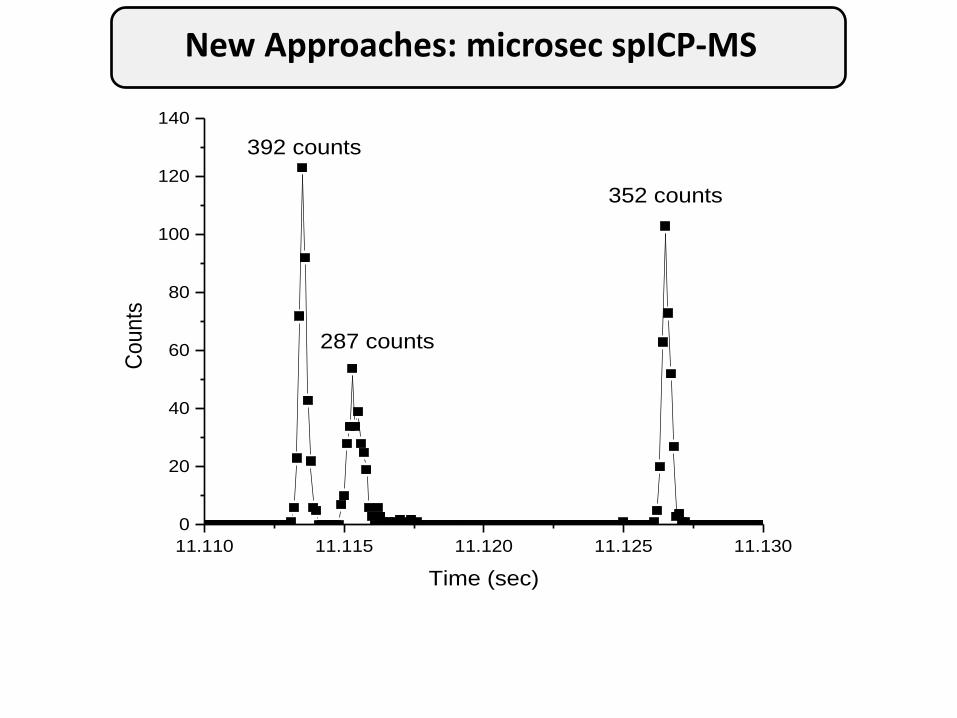
New Approaches: microsec spICP-MS
Montaño, M.; Ranville, J.; Badiei, H. Unpublished Data, 2013
11.110 11.115 11.120 11.125 11.130
0
20
40
60
80
100
120
140C
ounts
Time (sec)
392 counts
287 counts
352 counts
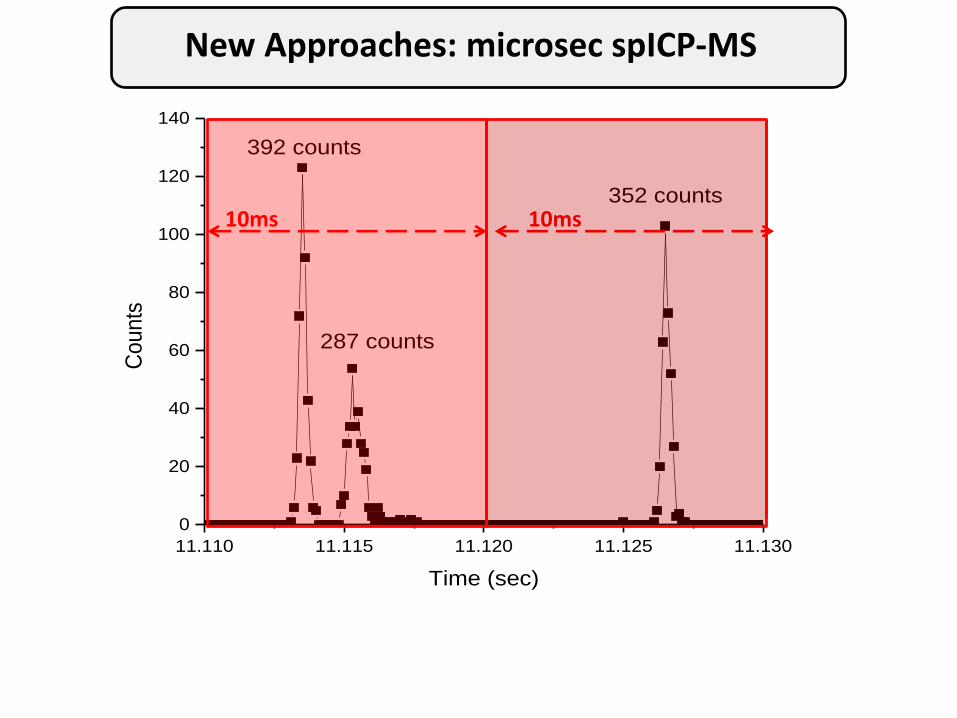
New Approaches: microsec spICP-MS
Montaño, M.; Ranville, J.; Badiei, H. Unpublished Data, 2013
11.110 11.115 11.120 11.125 11.130
0
20
40
60
80
100
120
140C
ounts
Time (sec)
392 counts
287 counts
352 counts10ms 10ms
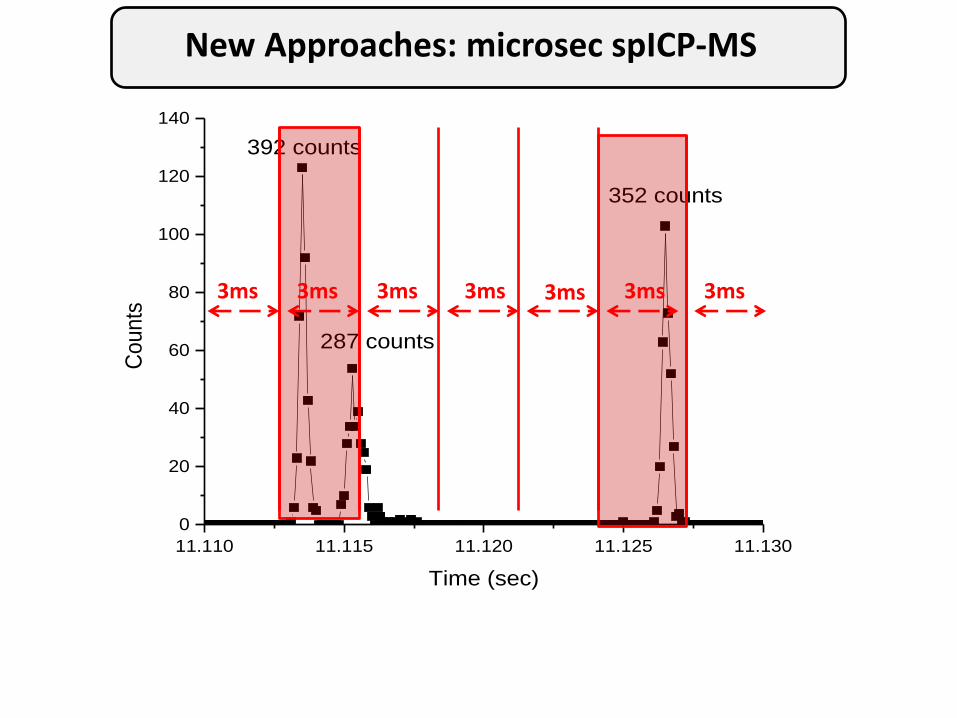
New Approaches: microsec spICP-MS
Montaño, M.; Ranville, J.; Badiei, H. Unpublished Data, 2013
11.110 11.115 11.120 11.125 11.130
0
20
40
60
80
100
120
140C
ounts
Time (sec)
392 counts
287 counts
352 counts
3ms 3ms 3ms 3ms 3ms 3ms 3ms
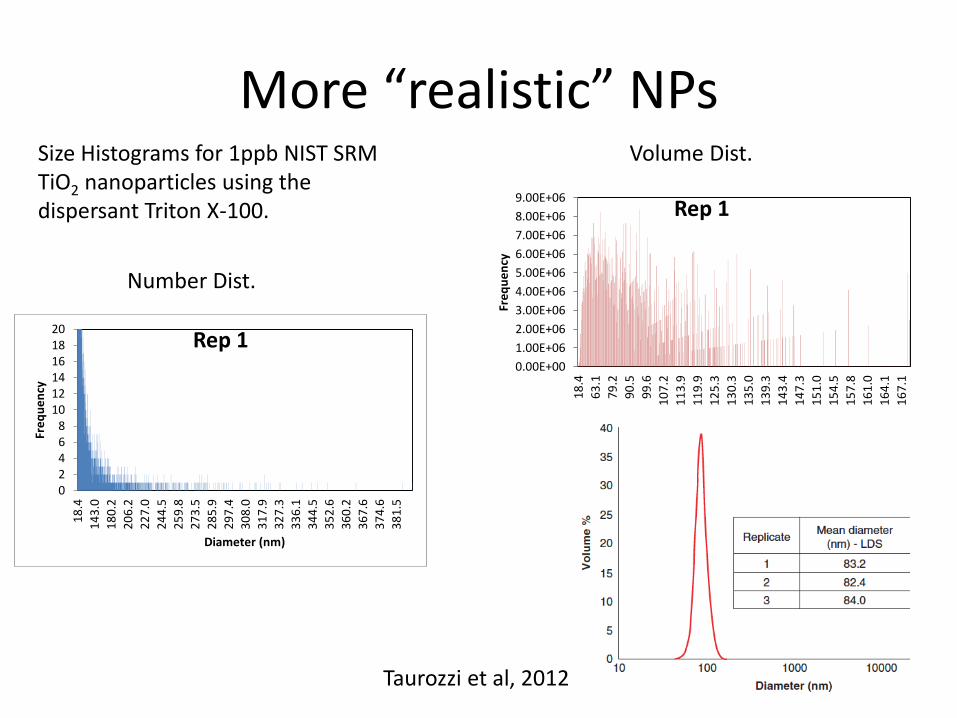
More “realistic” NPs
02468
101214161820
18
.4
14
3.0
18
0.2
20
6.2
22
7.0
24
4.5
25
9.8
27
3.5
28
5.9
29
7.4
30
8.0
31
7.9
32
7.3
33
6.1
34
4.5
35
2.6
36
0.2
36
7.6
37
4.6
38
1.5
Fre
qu
en
cy
Diameter (nm)
Rep 1 0.00E+00
1.00E+06
2.00E+06
3.00E+06
4.00E+06
5.00E+06
6.00E+06
7.00E+06
8.00E+06
9.00E+06
18
.4
63
.1
79
.2
90
.5
99
.6
10
7.2
11
3.9
11
9.9
12
5.3
13
0.3
13
5.0
13
9.3
14
3.4
14
7.3
15
1.0
15
4.5
15
7.8
16
1.0
16
4.1
16
7.1
Fre
qu
en
cy
Diameter (nm)
Rep 1
Size Histograms for 1ppb NIST SRM TiO2 nanoparticles using the dispersant Triton X-100.
Volume Dist.
Number Dist.
Taurozzi et al, 2012
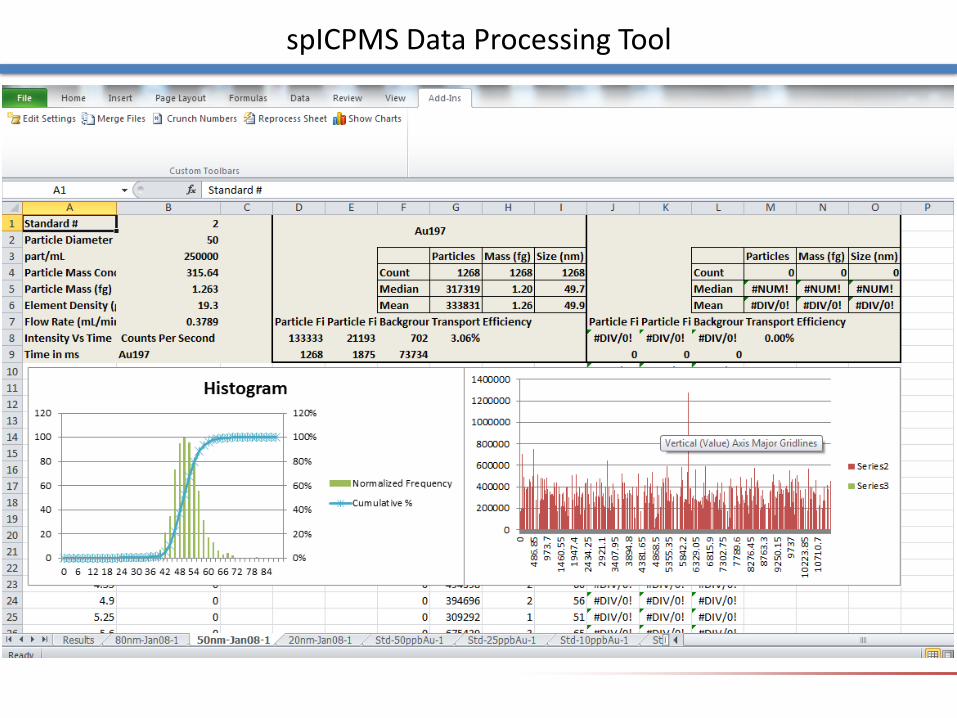
spICPMS Data Processing Tool
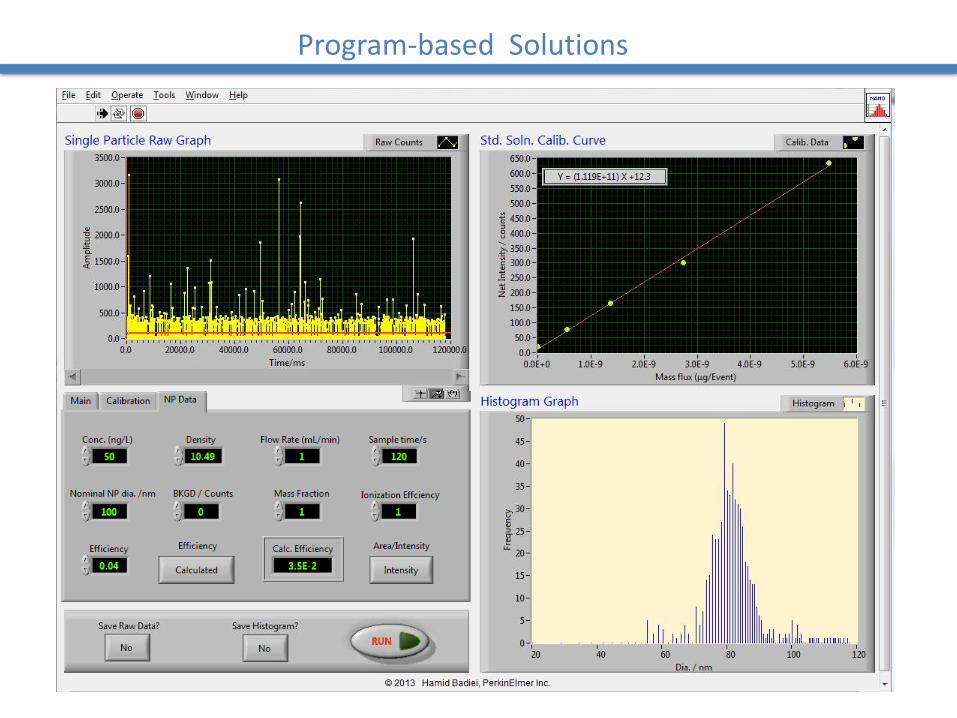
Program-based Solutions
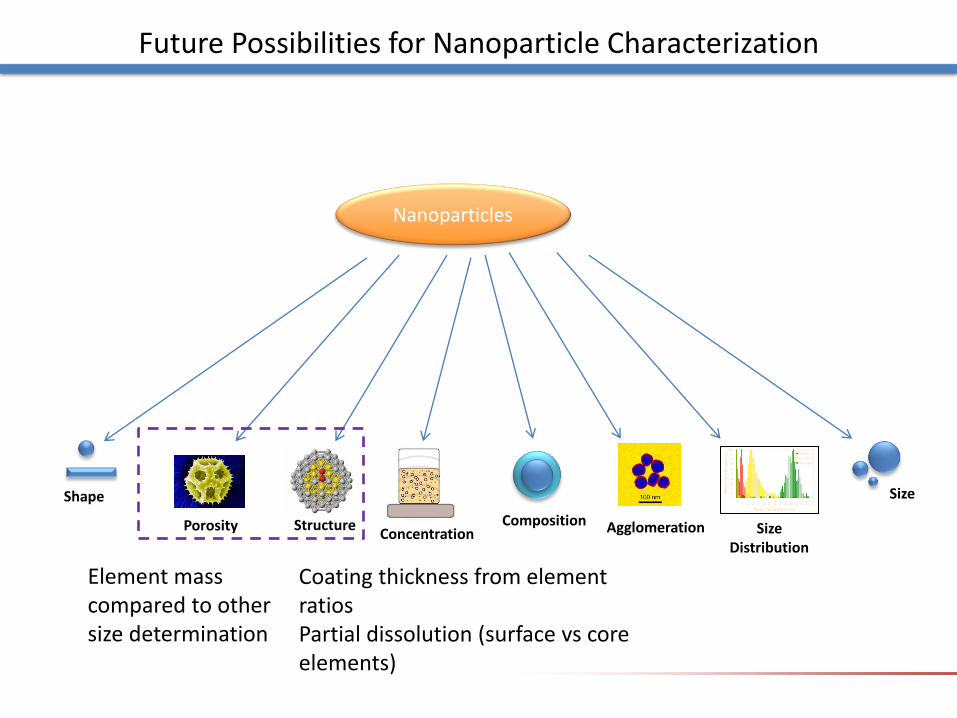
Future Possibilities for Nanoparticle Characterization
Size
Size Distribution
Shape
Composition Structure Porosity Concentration Agglomeration
Nanoparticles
Element mass compared to other size determination
Coating thickness from element ratios Partial dissolution (surface vs core elements)
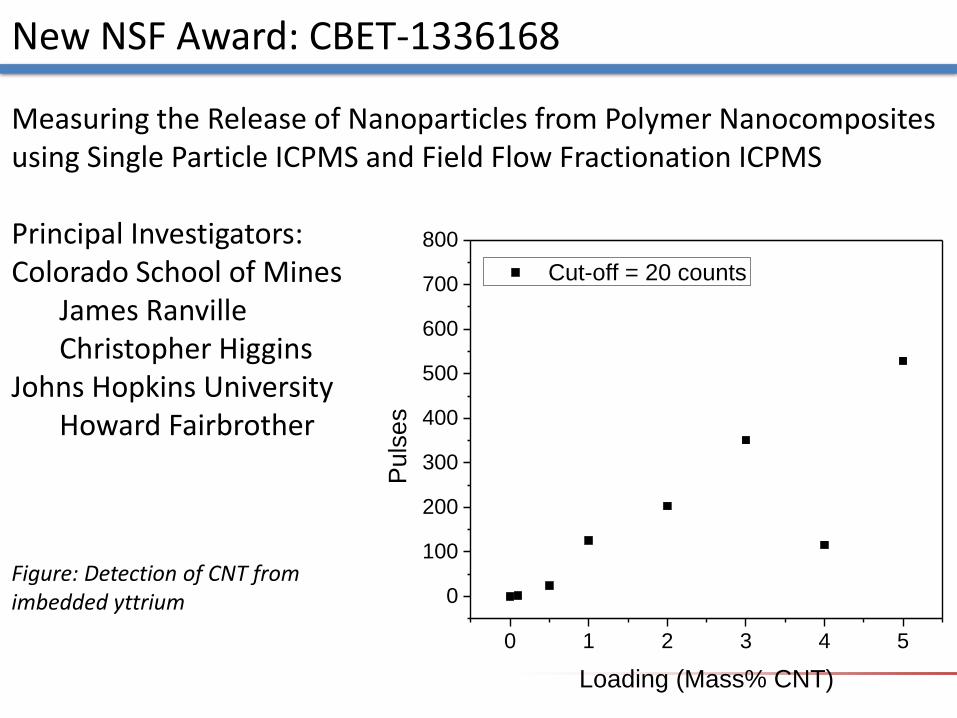
New NSF Award: CBET-1336168 Measuring the Release of Nanoparticles from Polymer Nanocomposites using Single Particle ICPMS and Field Flow Fractionation ICPMS Principal Investigators: Colorado School of Mines James Ranville Christopher Higgins Johns Hopkins University Howard Fairbrother Figure: Detection of CNT from imbedded yttrium
0 1 2 3 4 5
0
100
200
300
400
500
600
700
800
Cut-off = 20 counts
Puls
es
Loading (Mass% CNT)
Panel 1: New Approaches to Measurement and Metrology for NMs in Complex Matrices
Questions addressed in this topic include:
• Discussion • What tools still need to be developed?
• What are the needs for standard methods and
instrumentation?