Embed Size (px)
Citation preview

PANDEMICS AND CONSTRUCTION PRODUCTIVITY:
QUANTIFYING THE IMPACTCommissioned by ELECTRI International. Conducted by Maxim Consulting Group and Marquette University. Researchers: Michael McLin, Managing Director, Dan Doyon, Director, Brian Lightner, Associate Director, Maxim Consulting Group; Mark Federle, Associate Dean for Academic Affairs, Marquette University.
AUGUST
2020
2Pandemics and Construction Productivity: Quantifying the Impact
ELECTRI Council ............................................................................................................................................................. 4
Acknowledgements ........................................................................................................................................................ 8
Executive Summary ........................................................................................................................................................ 9
Overview ................................................................................................................................................................. 9
Findings ................................................................................................................................................................ 10
Part I - Pandemic Mitigation Tracking ............................................................................................................ 10
Part II - Productivity Benchmarking ................................................................................................................ 11
Part III – Business and Project Impacts ........................................................................................................... 11
Part I - Pandemic Mitigation Tracking ........................................................................................................................... 12
Objective .............................................................................................................................................................. 12
Data Collection and Methodology ....................................................................................................................... 12
Sample Set ............................................................................................................................................................ 13
Summary Findings ................................................................................................................................................ 14
Roadmap .............................................................................................................................................................. 15
Part II - Productivity Benchmarking .............................................................................................................................. 16
Objective .............................................................................................................................................................. 16
Data Collection and Methodology ....................................................................................................................... 16
The Collection Process ......................................................................................................................................... 16
Sample Set ..................................................................................................................................................... 19
Summary Findings ................................................................................................................................................ 21
Roadmap .............................................................................................................................................................. 21
Contents
2

3Pandemics and Construction Productivity: Quantifying the Impact
Part III - Business Impact of a Pandemic ....................................................................................................................... 22
Objective .............................................................................................................................................................. 22
Data Collection and Methodology ....................................................................................................................... 22
Jobsite Impacts ..................................................................................................................................................... 22
Project Management Impacts ............................................................................................................................... 23
Business Impacts ................................................................................................................................................... 23
Other Impacts ....................................................................................................................................................... 24
Operationalizing the Findings with Best Practices ................................................................................................ 24
Appendices
AppendixA:PandemicMitigationTrackingDataCollectionDefinitions&Tools ................................................ 26
Appendix B: Productivity Change Order Calculator ............................................................................................. 27
Appendix C: Double-Blind Productivity Benchmark Participant Survey ............................................................... 28
About the Authors ........................................................................................................................................................ 29
4Pandemics and Construction Productivity: Quantifying the Impact
President's Counsel - $1,000,000 or moreContractors
The Hugh D. 'Buz' and Irene E. 'Betty' Allison Trust, Hugh D.
'Buz' Allison, d.
The Richard W. and Darlene Y. McBride Trust, Richard W.
McBride*
The Al and Margaret Wendt Trust, Albert G. Wendt*, d.
NECA Chapters and AffiliatesNational Electrical Contractors Association*, David Long
Manufacturers, Distributors, Utilities and AffiliatesSchneider Electric / Square D, Phil Santoro
Program Guarantor - $500,000 or moreContractors
McCormick Systems, Jack McCormick
NECA Chapters and AffiliatesElectrical Contractors Trust of Alameda County,
Jody Brahmst
Manufacturers, Distributors, Utilities and AffiliatesThe Okonite Company, Bruce Sellers
Ambassador - $450,000 or moreContractors
Southern Contracting Company, Timothy McBride
Commissioner - $400,000 or moreNECA Chapters and Affiliates
San Diego County Chapter NECA, Bob Friar, Jr.
Diplomat - $350,000 or moreNECA Chapters and Affiliates
Boston Chapter NECA, Joseph H Bodio
Manufacturers, Distributors, Utilities and AffiliatesEaton Corporation, Rob Haynes
Graybar, Edward Deems
Trimble, featuring Accubid Products, Sarah Miller
Envoy - $300,000 or moreContractors
O'Connell Electric Company, Walter T. Parkes* and
Michael Parkes
NECA Chapters and AffiliatesNortheastern Illinois Chapter NECA, Tony Mulizio
Northeastern Line Constructors Chapter NECA,
George Troutman
Northern Indiana Chapter NECA, Anthony J. Maloney, III
Santa Clara Valley Chapter NECA, Michael Jurewicz
Western Pennsylvania Chapter NECA, Robert J. Bruce
Manufacturers, Distributors, Utilities and AffiliatesEMERSON RIGID / Greenlee, Joel Smith
Viewpoint Construction Software, Karl Rajotte
Regent - $250,000 or moreContractors
Cannon&WendtElectricCompany,DavidE.Fagan
Capital Electric Construction, Robert E. and Sharon Doran* -
In memory of Robert E. Doran, Jr.
John R. Colson, TX
Maron Electric Co., Jerold H. Nixon, d., and Eric F. Nixon
Miller Electric Company, H. E. "Buck" Autrey* ** and
Henry Brown
Robert L. Pfeil, d., IN
NECA Chapters and AffiliatesChicago&CookCountyChapterNECA,RichardJamerson
New York City Chapter NECA*, Stephen Gianotti
Northern California Chapter NECA, Greg E. Armstrong
Oregon-Columbia Chapter NECA, Pat Maloney
Puget Sound Chapter NECA, Michael J. Holmes
Southeastern Michigan Chapter NECA*,
Thomas Mittelbrun, III
Manufacturers, Distributors, Utilities and AffiliatesABB Installation Products, David Kendall
MCA, Inc., Heather Moore
ELECTRI CouncilELECTRI International–The Foundation for Electrical Construction, Inc. As of July 2020

5Pandemics and Construction Productivity: Quantifying the Impact
Champion - $200,000 or moreNECA Chapters and Affiliates
Greater Toronto Electrical Contractors Association,
Paul Sheridan
Illinois Chapter NECA*, Terry Buhs
Los Angeles County Chapter NECA, James Willson
North Florida Chapter NECA, Katie Enkiri
Northern New Jersey Chapter NECA, Henry J. Sassaman
Governor - $150,000 or moreContractors
Bana Electric Corporation, Stephen Bender
Center Line Electric, Inc., Clyde Jones
Brian Christopher, OR
Clennon Electric, Inc., Lawrence H. Clennon
Cogburn Bros Electric, Inc., Larry Cogburn and
Ron L. Cogburn
Ferndale Electric Co., Arthur Ashley
J. Ranck Electric, Inc., Jeremy Rowley
Kelso-Burnett Company, Stefan Lopata
L.L.D. Electric Co. (Hyslop Shannon Foundation), Tom Morton
Lone Star Electric, Mark A. Huston
M. J. Electric, LLC, Edward Farrington
McPhee, Ltd., Michael E. McPhee
Michels Corporation, Gerald W. Schulz
Pieper Electric, Richard R. Pieper, Sr.*
Quebe Holdings, Inc., Dennis F. Quebe
Sidney Electric Company, John S. Frantz
The Superior Group, A Division of Electrical Specialists,
Gregory E. Stewart
Turner Electric Service, Inc., Robert J. Turner, II
United Electric Company, Inc., Dan Walsh
VEC, Inc., Rex A. Ferry
Zenith Systems, LLC, Michael B. Joyce
NECA Chapters and AffiliatesAtlanta Chapter NECA, Rilo Stephens
Cascade Chapter NECA, Dave Ginestra
Central Indiana Chapter NECA, Steven Gottfried
Dakotas Chapter NECA, Ed Christian
Eastern Illinois Chapter NECA, Gregory Outsen
ElectricalContractorsTrustofSolano&NapaCounties,
Gregory D. Long
Finger Lakes New York Chapter NECA, Todd Usmail
Greater Cleveland Chapter NECA, David Haines
Kansas City Chapter NECA, Kenneth C. Borden
Long Island Chapter NECA, Donald Leslie, Jr.
Michigan Chapter NECA, Neil Parish
Milwaukee Chapter NECA, Dave Washebek
OregonPacific-CascadeChapterNECA,ThomasKyle
Penn-Del-Jersey Chapter NECA, Kenneth R. MacDougall
South Florida Chapter NECA, Wade Helms
South Texas Chapter NECA, Leslie M. Moynahan
Washington, D.C. Chapter NECA, JT Thomas
Manufacturers, Distributors, Utilities and AffiliatesLegrand North America, Steve Killius
Lutron Electronics Co., Inc., Richard Angel
Panduit Corporation, Ronald Greaves
Founder - $100,000 or moreContractors
Abbott Electric, Inc., Michael C. Abbott
ADCO Electrical Corporation, Gina M. Addeo
AlcanElectrical&Engineering,Inc.,ScottBringmann
Allison Smith Company LLC, Chris Reichart
Alterman, Inc., John C. Wright
Amaya Electric, John Amaya
ARS Proyectos, Mexico, Carlos Anastas
B&DIndustries,Inc.,ClintonBeall
Bagby&RussellElectricCo.,FranklinD.Russell
- In memory of Robert L. Russell
Baker Electric, Inc., Ted N. Baker
Berwick Electric Company, Doug Berwick
- to honor the leadership and passion that Jim Peterson
has provided for the growth and success of Berwick
Electric Co.
ELECTRI Council

6Pandemics and Construction Productivity: Quantifying the Impact
Big State Electric, Vincent Real
Boggs Electric Company, Inc., Michael H. Boggs
Daniel Bozick, d., CA
Bruce&MerrileesElectricCo.,JayH.Bruce
Richard L. Burns*, d., FL
Carl T. Madsen, Inc., Rocky Sharp
Chewning&Wilmer,Inc.,CarsonRogers
Christenson Electric, Inc., Sonja Rheaume
Collins Electric Company, Inc., Kevin E. Gini
Continental Electrical Construction Co., David A. Witz
Ben and Jolene Cook, TX
Corona Industrial Electric, Herbert P. Spiegel
- A tribute in memory of Flora Spiegel
CSI Electrical Contractors, Inc., Steve Watts
Thomas F. and Alana Curran, CA
Daniel's Electrical Construction Company, Inc.,
Thomas G. Ispas
DiFazioPower&Electric,LLC,RobertDiFazio
Divane Bros Electric Co.,
- In memory of William T. Divane, Sr. and
Daniel J. Divane III
Edward G. Sawyer Company, Inc., Joseph J. McCluskey, Jr.
Egan Company, Duane Hendricks
Electric Power Equipment Company ***
Electrical Corporation of America, Donald Laffoon
Empire Electric, Inc., Kellie Holland
ERMCO Electrical and System Contractor, Greg Gossett
Ferguson Electric Construction Co., Jim Schneider
Fisk Electric Company, Orvil Anthony*
Fuller Electric, Earl Restine
- Honoring our founders and family
Giles Electric Company, Inc., Bradley S. Giles
Gregg Electric, Inc., Randy Fehlman*
Gurtz Eiectrtc Company, Frank Gurtz
- In honor of Gerald Gurtz
Hardt Electric Inc., Peter D. Hardt
Harrington Electric Co., Thomas A. Morgan
Holmes Electric Company, Michael J. Holmes
Eddie E. Horton, TX
Hunt Electric Corporation, Michael Hanson
Jamerson&BauwensElectricalContractors,Inc.,KennethJ.
Bauwens
Johnson Electrical Construction Corporation, Donald Leslie, Jr.
Jordan-Smith Electric, Travis A. Smith
Thomas Kyle, OR
LK.Comstock&Co.,Inc.,BenD'Alessandro
Lighthouse Electric Company, Inc., Todd A. Mikec
The Lindheim Family, Michael Lindheim*
Long Electric Company, Gregory D. Long
Mark One Electric Company, Inc., Carl J. Privitera, Sr.
Mayers Electric Company, Howard Mayers
McCoy Electric, Max N. Landon
MJM Electric, Inc, Mark J. Mazur
MONA Electric Group, David McKay
Motor City Electric Co., Richard J. Martin*
Newkirk Electric Associates, Inc., Ted C. Anton
OEG, Jeff Thiede
Parsons Electric Company, Joel Moryn
Peter D. Furness Electric Co., John F. Hahn, Jr.*
Potelco, Inc., Gary A. Tucci
Pritchard Electric Co., Tom Braley
R. W. Leet Electric, Inc., Tim Russell
Red Top Electric Company Emeryville, Inc., Michael C. Curran - In honor of George T. and Mary K. Curran
Robertson Bright, Inc., Wally Budgell
Roman Electric Company, Phillip G. Rose
Rosendin Electric, Matthew J Englert
Sargent Electric Company, Frederic B. Sargent
Schultheis Electric / TSB, Inc., Tim Schultheis
Gerald W. Schulz, WI
Service Electric Company, Brian Imsand*
Shaw Electric Company, Robert C. Minielly
TEC-Corp / Thompson Electric Co., Skip Perley - In memory of Alfred C. Thompson
ELECTRI Council
7Pandemics and Construction Productivity: Quantifying the Impact
Toomer Electrical Co., Inc., Ronald J. Toomer
Tri-City Electric Co., Inc., D. R. "Rod" Borden, Jr.*
Triangle Electric Company, Roy C. Martin
Truland Systems Corporation ***
Truland Walker Seal Transportation, Inc.***
United Electric Company, Inc., Jarrett D. Hayes
Universal Systems, Gene W. Dennis
Whitehead Electric Company, Christopher Foster
Zwicker Electric Company, Inc., David Pinter
NECA Chapters and AffiliatesAlaska Chapter NECA, Larry Bell
American Line Builders Chapter NECA, Richard V. Miller
Arizona Chapter NECA, Joe Graham
Atlantic Coast Chapter NECA, Carson Rogers
Canadian Electrical Contractors Association, Colin Campbell
Central Ohio Chapter NECA, Brian Damant
East Tennessee Chapter NECA, Mike Young
electrical training ALLIANCE, Marty Reisberg
Greater Sacramento Chapter NECA, Frank Schetter
Iowa Chapter NECA, Angela Bowersox
Kansas Chapter NECA, Shawn Smith
Minneapolis Chapter NECA, Duane Hendricks
Missouri Valley Line Constructors Chapter NECA,
Joe Mitchell
North Central Ohio Chapter NECA, Jason Walden
North Texas Chapter NECA, Steve Hargrove
Rocky Mountain Chapter NECA, Rory Berumen
San Francisco Chapter NECA, Leonard Lynch
Southeastern Line Constructors Chapter NECA,
C. Stephen Gaines, Jr.
Southern Colorado Chapter NECA, Sue King
Southern Indiana Chapter NECA, Jeff Hayden
Southern Nevada Chapter, NECA, Donald Campbell
Southern Sierras Chapter NECA, David Shankle
St. Louis Chapter NECA, Robert Senf
West Virginia-Ohio Valley Chapter NECA, Ted Brady
Western Line Constructors Chapter NECA, Jules W. Weaver
Wisconsin Chapter NECA, Daniel Shea
Manufacturers, Distributors, Utilities and Affiliates3M, Ryland Marek
Acuity Brands, Inc., Mike Shovelin
Border States Electric, Ryan Evans
Build Ops, Alok Chanani
Cerro Wire, LLC, Stewart Smallwood
Cree Inc.
Crescent Electric Supply, Tim Rooney
E2E Summit, Timothy Speno
Elliott Electric Supply, Greg Fitzgerald
Encore Wire Corporation, Kevin Kieffer
Allen W. Estes, III, WA
Focus Investments Advisors, Andrew Wasa
Ideal Industries, Inc., Tony Randolph
Mayer Electric Supply, Kyle Walters
Milwaukee Tool Corporation, Brett Wilson
Mosaic Learning, Brendan Connors
Moss-Adams LLP, Buddy Wall
Philips Lighting
Procore Technologies, Darryl Kysar
Rexel/Gexpro, Chris Chickanosky
SanDiegoGas&Electric,JamesBoland
Sonepar USA, Paul Hollenbacher
Southwire Company LLC, Russ King
Thomas Industries, Inc.
United Rentals, Kevin Parr
Werner Company, Lenny Colasuonno
WESCO Distribution, Inc., John Muenchen
ELECTRI Council
* denotes founding member of ELECTRI'21 COUNCIL (1989-1990)
**denotesfirstcontributor
*** denotes no longer in business
d. denotes deceased.

Pandemics and Construction Productivity: Quantifying the Impact
Acknowledgements
8
Manyindividualsandtheirfirmsworkedcollaborativelyandintensivelytoproducethedataandrecommendationsfor this study. ELECTRI International and the National Electrical Contractors Association acknowledge, with sincere appreciation, their dedication to the electrical construction industry.
• TIM SPENO, CHAIR E2E Summit
• JOHN FRANTZ Sidney Electric Company, Inc.
• GREG GOSSETT ERMCO, Inc.
• KELLIE HOLLAND Empire Electric, Inc.
• JAMES MACDONALD Miller Electric Company
• DAVID MOELLER Graybar
• TIM MOORE Rosendin Electric Inc.
• MICHAEL PARKES O’Connell Electric Company, Inc.
• SKIP PERLEY Thompson Electric Company
• JAMES POTTS ERMCO, Inc.
• SONJA RHEAUME Christenson Electric, Inc.
• PHIL SANTORO Schneider Electric
• DAN SHEA SheaElectric&CommunicationsLLC
• BRIAN WILKERSON ERMCO, Inc.
• JOEY SHORTER Atlanta Electrical Contractors Association
• DAVID LONG NECA
• JOSH BONE ELECTRI International
• LAURA HOLMES ELECTRI International
This ELECTRI International research project has been conducted under the auspices of the Research Center.
©2020 ELECTRI International–The Foundation for Electrical Construction, Inc. All Rights Reserved. The material in this publication is copyright protected and may not be reproduced without the premission of ELECTRI International.

9Data-Driven Analysis Of The Factors Affecting The Union Inside Electrical Contractor Market Share
Executive Summary
OverviewA pandemic can have far reaching impacts on the U.S. economy. Companies in once successful industries across the United States have felt the immediate impact of the current pandemic in the most devastating ways. Since March 2020, many companies have come to a complete and total shutdown, displacing more than 25 million Americans from their jobs. Other industries, such as the healthcare andmedicalresearchfields,haveseenexcessivestress placed on them not only in terms of resources and equipment, but also on the personal lives of the professionals administering these services. These are truly unprecedented times that were unforeseen just six months ago.
The federal government has tried to do its part to care for the unemployed, the small businesses, and even some large industries that have been most noticeably impacted by the government-directed shutdowns and forced isolations of our population. The CARES Act has gone a long way to help start bridging the gap from today toward recovery. Yet, it is not enough and cannot be the end of the support provided to corporations across this country.
The essential operations that have been asked to remain working during this pandemic are caught in the middle ground and left out of these often-discussed areas of our society and business. These industries are traditionally known to provide food, basic human necessities or some service that our government has deemed critical to the well-being of our citizens. These are the operations that keep our economy moving in some way to help prevent a total collapse of our infrastructure.
The construction industry is one of those essential industries that has continued to deliver its services to both private owners and government agencies alike. It has done so while adapting to and adhering to a continuously-updated and changing set of
recommendations from our health, state, and federal governmentofficials.Duringthistimeofessentialoperation, our construction workers continue to receive their paychecks; contributions to union pension and health funds continue without drawdowns; and our building owners receive their buildings per the completion schedules for which they have asked. While these are all positives for the economy, the unintended consequence of being deemed essential and working under these new mandates has fallen directly at the feet of the corporations that employ this workforce.
Mostoftheseconstructioncompaniesworkonfixedpricecontractswithlimited(ifany)financialreliefperthe terms of their owner agreements. So, the added costsandinefficienciesofbeinganessentialbusinessaredirectlytakenfromthecorporateprofits.Withoutfinancialaidfromourgovernment,thisindustrywillalso suffer from the impact of this pandemic, but it will look different from the early impact on the people and industries our legislative branch has tried to save thus far during the pandemic.
It could be months or, in some cases, a few years from the start of this pandemic until we see construction companies fail. It will happen because they have no clear channel for equitable adjustment and have been contractually mandated to continue operations. The new normal being created from pandemic-driven healthandsocialmodificationsisbeingseenearlyinthe construction industry. Congress should take note astowhatthepotentialfinancialorprofitabilityripplelooks like as we start to reopen America.
Construction sites are usually vibrant micro-communities that thrive on fast-paced teamwork and require the precision of large numbers of men and women working together in tight spaces. They all play their parts, working together to erect massive buildings. Nearly every activity on a job site takes more than one person to complete, so the rule of social distancing creates a nearly impossible challenge. Hundreds of men and women line up daily to have

10Pandemics and Construction Productivity: Quantifying the Impact
their temperatures scanned prior to beginning work. To move to and from their work areas, they ride in elevators in one-third the capacity that they once did in ordertocreatesufficientspacefromeachother.
This requirement takes up hours that used to be spent productively installing construction materials. Instead, these hours are now spent simply getting to the work area. Every activity is spaced at six-foot distances. Safetytoolboxtalks,stretchandflexprograms,anddaily meetings are all impacted as communication and coordination of activities has diminished at job sites. Each site has created its own version of shelter-in-place habits that have slowed down the industry to reduce the potential spread of this virus while continuing to work.
Thefindingsofthisstudyarebasedupondatacollected from NECA members who represent some of the largest and most sophisticated contractors in the United States. The analysis and conclusions derived from the data set are intended to serve as a representation of the average impact on electrical contractors across the country. It should be noted that the research consultants performed a similar study for the sheet metal, HVAC and mechanical trades. The outcome of that study produced comparable results, as would be expected since the nature of the work impactsareverysimilar.Contractorsmayfindvariabilityintheirowncompaniesandfindutilityinconductingtheirownimpactstudy.However,itwouldbedifficultto recreate the same conditions that occurred globally and within the United States over the timeline of this study.
The construction industry thrives on challenge and innovation and will continually improve to deliver productssafelytoowners.Intime,firmswilladjustto this new normal and price the contracted work appropriately. However, in the near term, the industry’s financialburdenfromthesocialrestrictionsplacedonitmay be so great that many companies will not survive to compete in the future.
FindingsMeasurements of the impact of this pandemic suggest that construction productivity has been impacted by nearly 20%. A rule of thumb for self-performing
contractors is that a 10% impact on productivity results in a 100% impact on profitability. Accordingly, contractors need to consider seriously theimpactofthisstudyontheirprofitabilityandseekequitable adjustments that adequately compensate them for the impact.
This study is divided into three distinct sections:
• Part I - Pandemic Mitigation Tracking specificallyquantifieshoursassociatedwithpreventative measures such as training, health screenings, cleaning and disinfecting, job site access, and administration - all instituted to minimize exposure.
• Part II - Productivity Benchmarkingspecificallyquantifiesthereductionindirectworkproductivity related to social distancing rules, staggered shifts, reduced crew sizes, increased personal protective equipment requirements, and related job site regulations.
• Part III - Business and Project Impacts specificallyquantifiesancillaryimpactsexperienced by most contractors who participated in this study.
The following section provides a description of each of the three distinct parts.
Part I - Pandemic Mitigation TrackingBased on a random sampling of more than 92,000 labor hours, data collected to date suggest that 8.9% of labor hours is lost due to pandemic mitigation activities. It is reasonable to expect that, if crews were not spending 8.9% of their available productive time working on pandemic mitigation, they would be putting work in place.
Contractors should prepare and submit change order requests to seek compensation for the impact of pandemic mitigation and prevention efforts instituted on their projects. Pandemic mitigation was never contemplated at the time of pricing a project and represents an unforeseen cost. Contained within this study is a change order calculator for contractors.
11Pandemics and Construction Productivity: Quantifying the Impact
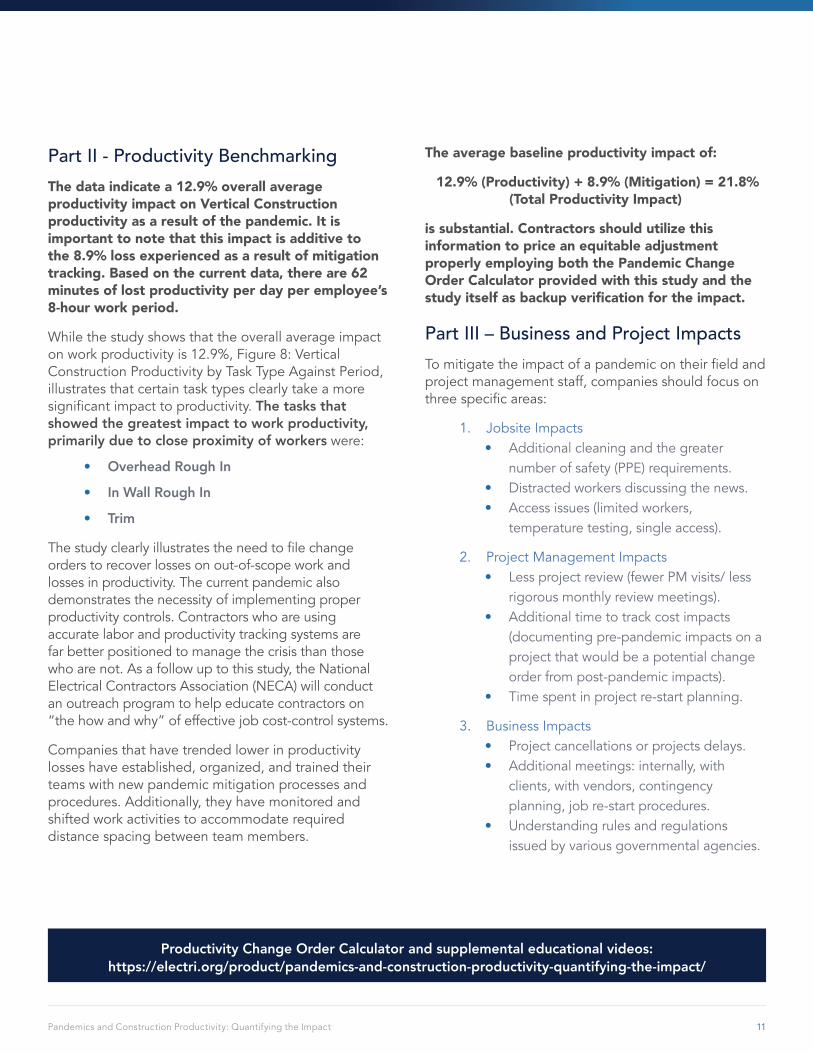
Part II - Productivity BenchmarkingThe data indicate a 12.9% overall average productivity impact on Vertical Construction productivity as a result of the pandemic. It is important to note that this impact is additive to the 8.9% loss experienced as a result of mitigation tracking. Based on the current data, there are 62 minutes of lost productivity per day per employee’s 8-hour work period.
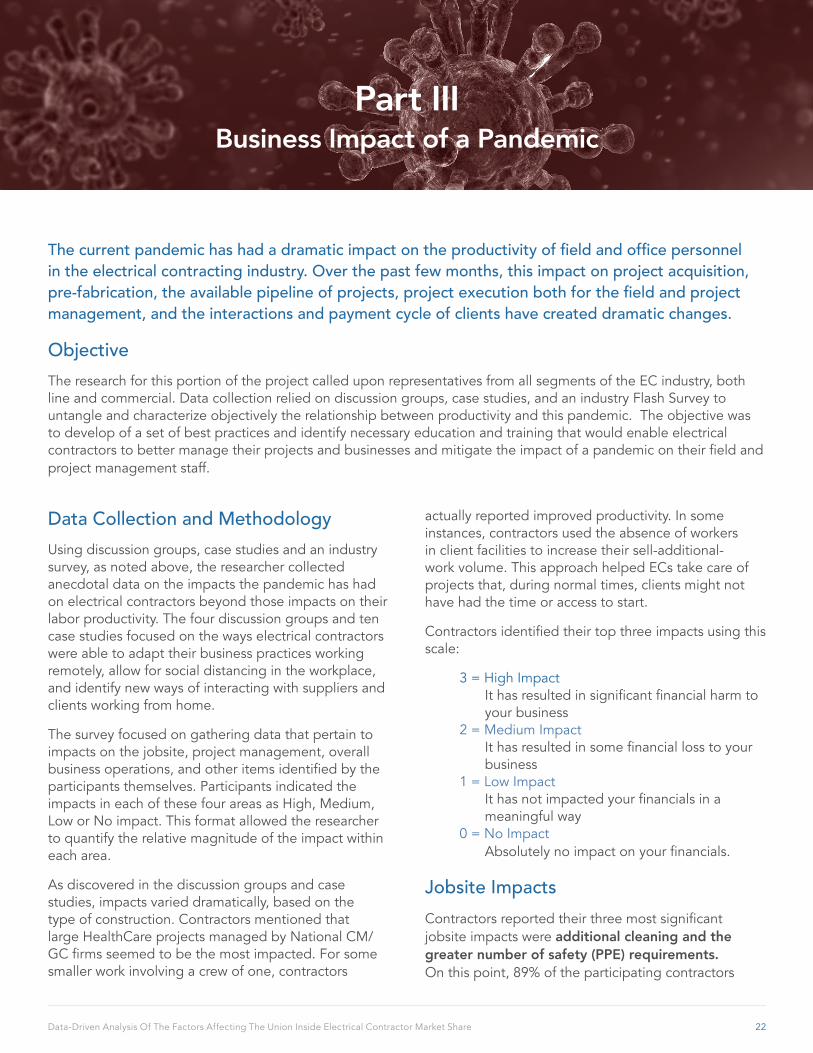
While the study shows that the overall average impact on work productivity is 12.9%, Figure 8: Vertical Construction Productivity by Task Type Against Period, illustrates that certain task types clearly take a more significantimpacttoproductivity.The tasks that showed the greatest impact to work productivity, primarily due to close proximity of workers were:
• Overhead Rough In
• In Wall Rough In
• Trim
Thestudyclearlyillustratestheneedtofilechangeorders to recover losses on out-of-scope work and losses in productivity. The current pandemic also demonstrates the necessity of implementing proper productivity controls. Contractors who are using accurate labor and productivity tracking systems are far better positioned to manage the crisis than those who are not. As a follow up to this study, the National Electrical Contractors Association (NECA) will conduct an outreach program to help educate contractors on “the how and why” of effective job cost-control systems.
Companies that have trended lower in productivity losses have established, organized, and trained their teams with new pandemic mitigation processes and procedures. Additionally, they have monitored and shifted work activities to accommodate required distance spacing between team members.
The average baseline productivity impact of:
12.9% (Productivity) + 8.9% (Mitigation) = 21.8% (Total Productivity Impact)
is substantial. Contractors should utilize this information to price an equitable adjustment properly employing both the Pandemic Change Order Calculator provided with this study and the study itself as backup verification for the impact.
Part III – Business and Project ImpactsTomitigatetheimpactofapandemicontheirfieldandproject management staff, companies should focus on threespecificareas:
1. Jobsite Impacts • Additional cleaning and the greater
number of safety (PPE) requirements. • Distracted workers discussing the news. • Access issues (limited workers,
temperature testing, single access).
2. Project Management Impacts • Less project review (fewer PM visits/ less
rigorous monthly review meetings). • Additional time to track cost impacts
(documenting pre-pandemic impacts on a project that would be a potential change order from post-pandemic impacts).
• Time spent in project re-start planning.
3. Business Impacts • Project cancellations or projects delays. • Additional meetings: internally, with
clients, with vendors, contingency planning, job re-start procedures.
• Understanding rules and regulations issued by various governmental agencies.
Productivity Change Order Calculator and supplemental educational videos: https://electri.org/product/pandemics-and-construction-productivity-quantifying-the-impact/

12Data-Driven Analysis Of The Factors Affecting The Union Inside Electrical Contractor Market Share
Part IPandemic Mitigation Tracking
ObjectiveThe objective of Pandemic Mitigation Tracking is to quantify lost productivity directly associated with jobsite pandemic mitigation requirements such as training, health screenings, cleaning and disinfecting, job site access and administration—all instituted to minimize exposure.
Data Collection and MethodologyTo collect project hours on a daily basis, the consultants provided participants with an application for iOS and Android smartphones and tablets. A Microsoft Excel-based worksheet for participants with bulk daily time data offered an additional data collection option. Data collection began on April 15, 2020 and ended July 3, 2020.
A single data point for this research represents time reportedtofivestandardizedtimecodes,perproject,perday.Standarddefinitionsforeachtimecodenormalize the data across the range of participants in the sample. The time codes are:
• 100 - Total Hours Worked • 200 - Hours lost to COVID Safety and Training • 201 - Hours lost to COVID Distancing and
Jobsite Access • 202 - Hours lost to COVID Cleaning and
Disinfecting • 203 - Hours lost to COVID Administration.
Detaileddefinitionofthetypesofactivitiespertimecode are included in Appendix A.
Definitionsofactivitiesforeachtimecodecategorywere drawn from:
• Local, state, and federal government guidelines for social distancing
• OSHA’s ‘Guidance on Preparing Workplaces for COVID-19’
• OSHA’s ‘Interim Enforcement Response Plan for Coronavirus Disease 2019’
• First-hand accounts provided by contractors.
Participants received instruction for using the data collection tools via a combination of methods:
• Webinar (live and recorded) • PDF Instruction Manual • Instructions and FAQ embedded in both data
collection tools • Direct access to the research project’s
consultants via phone, text or email for technicalsupportandanswerstotheirspecificquestions.
Each day, the research team reviewed sample size and geographic coverage using a heat map linked to the sample data set.
The analysis of the collected data centers around a single question: Is it reasonable to expect that, on average, the percent of labor hours a contractor loses on jobsite pandemic mitigation requirements are hours not available to produce work at estimated rates of production and/or rates of production as defined in resources such as NECA’s Manual of Labor Units 2019-2020?
13Pandemics and Construction Productivity: Quantifying the Impact
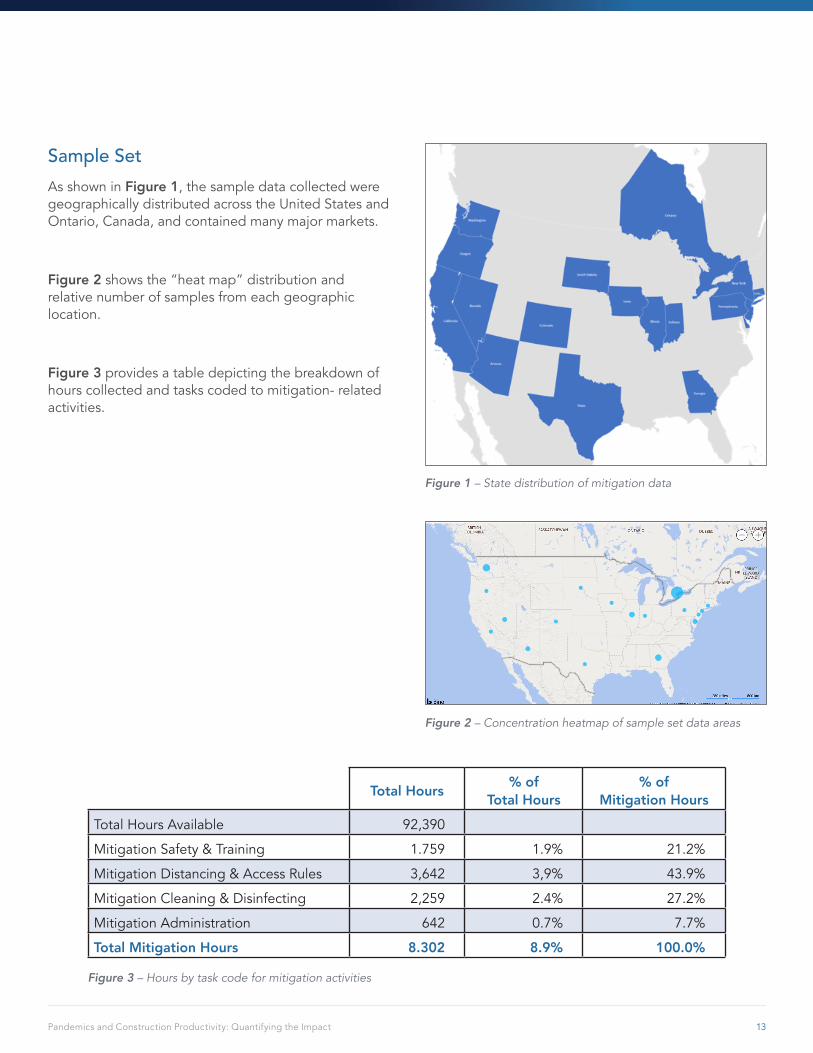
Sample SetAs shown in Figure 1, the sample data collected were geographically distributed across the United States and Ontario, Canada, and contained many major markets.
Figure 2 shows the “heat map” distribution and relative number of samples from each geographic location.
Figure 3 provides a table depicting the breakdown of hours collected and tasks coded to mitigation- related activities.
Figure 1 – State distribution of mitigation data
Figure 2 – Concentration heatmap of sample set data areas
Total Hours % of Total Hours
% of Mitigation Hours
Total Hours Available 92,390
MitigationSafety&Training 1.759 1.9% 21.2%
MitigationDistancing&AccessRules 3,642 3,9% 43.9%
MitigationCleaning&Disinfecting 2,259 2.4% 27.2%
Mitigation Administration 642 0.7% 7.7%
Total Mitigation Hours 8.302 8.9% 100.0%
Figure 3 – Hours by task code for mitigation activities
14Pandemics and Construction Productivity: Quantifying the Impact
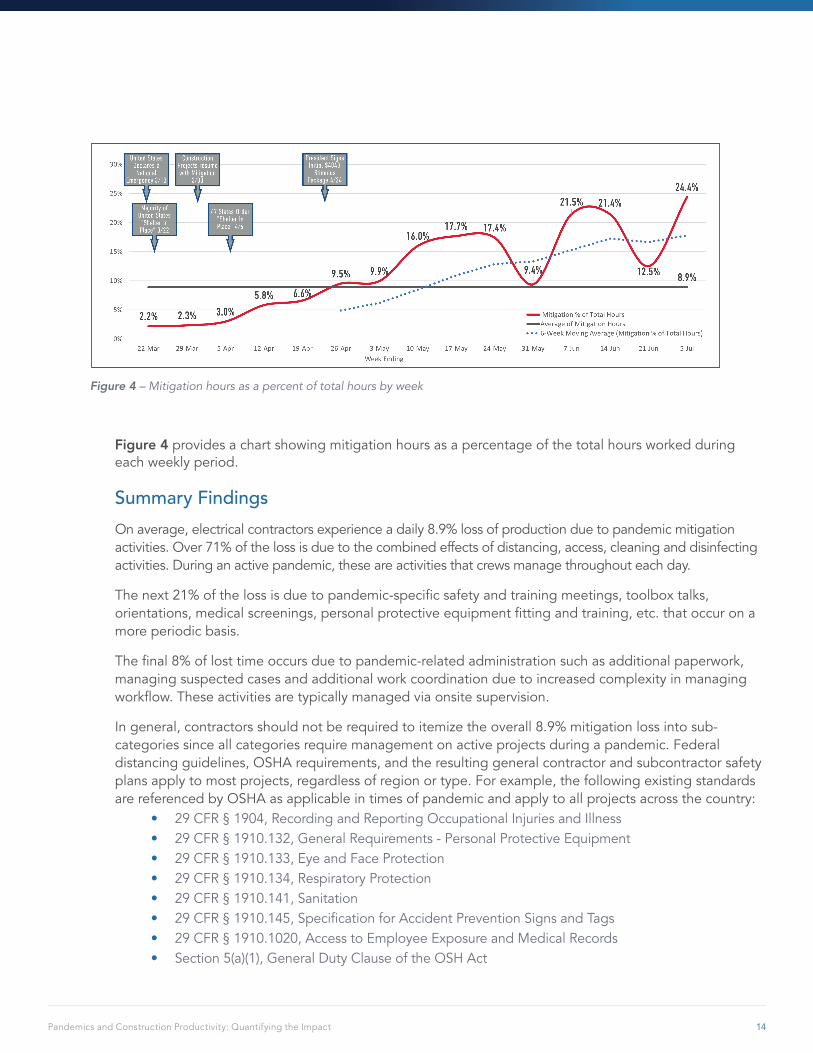
Figure 4 provides a chart showing mitigation hours as a percentage of the total hours worked during each weekly period.
Summary FindingsOn average, electrical contractors experience a daily 8.9% loss of production due to pandemic mitigation activities. Over 71% of the loss is due to the combined effects of distancing, access, cleaning and disinfecting activities. During an active pandemic, these are activities that crews manage throughout each day.
Thenext21%ofthelossisduetopandemic-specificsafetyandtrainingmeetings,toolboxtalks,orientations,medicalscreenings,personalprotectiveequipmentfittingandtraining,etc.thatoccuronamore periodic basis.
Thefinal8%oflosttimeoccursduetopandemic-relatedadministrationsuchasadditionalpaperwork,managing suspected cases and additional work coordination due to increased complexity in managing workflow.Theseactivitiesaretypicallymanagedviaonsitesupervision.
In general, contractors should not be required to itemize the overall 8.9% mitigation loss into sub-categories since all categories require management on active projects during a pandemic. Federal distancing guidelines, OSHA requirements, and the resulting general contractor and subcontractor safety plans apply to most projects, regardless of region or type. For example, the following existing standards are referenced by OSHA as applicable in times of pandemic and apply to all projects across the country:
• 29 CFR § 1904, Recording and Reporting Occupational Injuries and Illness • 29 CFR § 1910.132, General Requirements - Personal Protective Equipment • 29 CFR § 1910.133, Eye and Face Protection • 29 CFR § 1910.134, Respiratory Protection • 29 CFR § 1910.141, Sanitation • 29CFR§1910.145,SpecificationforAccidentPreventionSignsandTags • 29 CFR § 1910.1020, Access to Employee Exposure and Medical Records • Section 5(a)(1), General Duty Clause of the OSH Act
Figure 4 – Mitigation hours as a percent of total hours by week

15Pandemics and Construction Productivity: Quantifying the Impact
Itispossiblethatlocal,state,owner-driven,orcontractor-specificmitigationrequirementscouldaffectthe degree and complexity required to comply with mitigation requirements. In such cases, contractors shouldusethe8.9%lossasabaselinefromwhichmodificationsspecifictotheirsituationaremade.Factors to consider are provided in the “Roadmap” section that follows.
Is the situation improving with time? It is too early to tell. It is reasonable to expect that the early uncertaintysurroundingthenecessityanddegreeofmitigationrequirementswilleaseasthespecificdiseaseisbetterunderstoodandenforcementagenciesmoreclearlydefinerequirements.Itisalsoreasonable to expect that contractors will improve their ability to cope with mitigation requirements as time goes on, provided they know what to expect. Until then, to assess the degree of impact they will experience, contractors should consider several factors that will modify the current average including:
• GC/CM/OwnerSite-SpecificSafetyPlans • GC/CM Site Logistics Plans • Quality of Work Coordination • Local,state,orothermodifierstoFederalGuidelines
With the number of hours and projects sampled, 8.9% is a solid calculation of the current average loss experienced daily by contractors across the country with a margin of error of ±3%.
RoadmapContractors should utilize the average loss in productivity in the following scenarios:
• Use the average provided (and the calculator provided as backup) to prepare change orders requesting relief for the time lost due to managing pandemic mitigation requirements.
• Usetheaverageprovidedasamultiplieronanactiveprojecttoforecastfinancialprojections,schedule impact, and resource availability.
• Use the average provided as a multiplier both for estimating projects that will require pandemic mitigation factors as projects re-open and for future projects, assuming prolonged mitigation requirements.
Factorsthatshouldbeconsideredasmodificationstothebaselineaverageincludebutarenotlimitedto: • Detailed knowledge of federal, OSHA, and CDC applicable guidelines and directives. • Localandstatemodifiersoradditionstofederal,OSHA,andCDCguidelinesanddirectives. • Availabilityandclarityofowner,GC/CMproject-specificsafetyplans. • Project-specificcharacteristicsthatinfluencesocialdistancingandlogistics. • Relationships with the GC/CM.
It should be noted that some traditional methods of schedule acceleration, such as additional manpower or overtime, are either not possible due to the nature of pandemic mitigation guidelines and directives or will compound the effects of activities such as waiting for access to work areas or gaining access to trailers for medical screenings, to name a few.
Contractors should look to their local NECA Chapters for news and information regarding additional training and education as well as updates to the data provided.
Productivity Change Order Calculator and supplemental educational videos: https://electri.org/product/pandemics-and-construction-productivity-quantifying-the-impact/

16Data-Driven Analysis Of The Factors Affecting The Union Inside Electrical Contractor Market Share
Part IIProductivity Benchmarking
ObjectiveThe aim of the Productivity Benchmarking had three elements:
1. Measure electrical contractor companies’ pre- and post-pandemic direct work productivity
2. Measure the impacted tasks by market segment, project/job type and geographic area
3. Provideanalysis,summaryfindings,andaroadmaptooperationalizetheresults
To achieve this objective, the research consultants established a model to normalize data and provide a consistent andstructuredmannerinwhichtocollectandanalyzetheproductivitydata.Morespecifically,theconsultantteam:
• DocumentedspecifictasksdesignedbyanELECTRI-designatedTaskForce.Thisenabledcollectionofpercent completed and hours for common tasks across companies by market segment
• Constructed a formalized data gathering process from multiple electrical contracting companies across the US
• Definedspecificcriticaldatesthatimpactedcontractorproductivity(i.e.–Shelter-in-placeorders)
• Measured, tracked, mapped and analyzed the data provided by contractors
• Built analytics models to generate insights into data and then summarized the results
• Utilizedadouble-blindmethodologytoensureconfidentialitywithonlytheprojectleader(MaximConsulting) knowing which contractor’s data are aggregated in the results
• Providedcontractorswhoparticipatedinthestudyanindividualizedprofileoftheirresultsversusthenationalnumberstoassistthemfurtherwiththeirquantification
Data Collection and MethodologyThe Collection Process
The data collection process involved the generation of large amounts of data from contractors who provided the information using a formalized template.
For each data point, the project consultants collected the following information from contractors:
• Market Segment • Project ID • Project/Job Name • Project/Job Type • Location City • Location State • Contact Person
• Contact Person Phone • Week Start Date • Week Date • Task Code • Percent Complete • Hours • Week of Data Collection
Contractorsreceivedaspecificselectionofoptionsfor the Project/Job Type based on the federal government’s establishment of essential projects:
• Chemical • Commercial Facilities • Communications • Critical Manufacturing • Dams

17Pandemics and Construction Productivity: Quantifying the Impact
• Defense Industrial Base • Emergency Services • Energy • Financial Services • Food and Agriculture • Government Facilities • Healthcare and Public Health • Information Technology • Nuclear Reactors, Materials, and Waste • Transportation Systems • Water and Wastewater Systems • Other(inanyinstanceinwhichaspecificstate
had a departure from the federal list)
ContractorsreceivedspecificselectionoptionsfortheMarket Segment:
• Vertical Construction (high rise, mid-rise, commercial, healthcare, etc.)
• HorizontalConstruction(trafficsignalization,streets and bridges, agriculture, etc.)
• Line Construction (power transmission and distribution, substations, etc.)
• SystemsonlyConstruction(i.e.–firealarm,low voltage, etc.)
• Maintenance (facility maintenance, etc.)
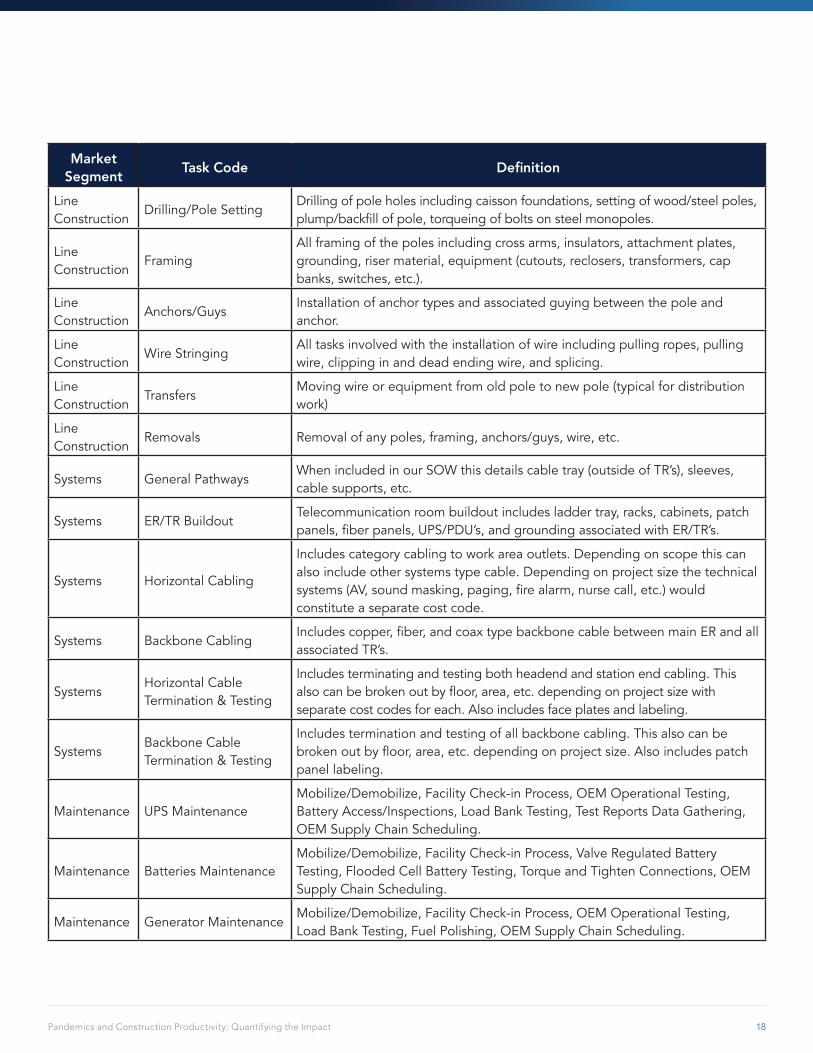
Data were normalized by providing contractors with thespecificdefinitionfortheTaskCodesassociatedwith each Market Segment:
Market Segment Task Code Definition
Vertical UndergroundUtility and Communication Conduits, Site Lighting, Pole Bases, Trenching, Utility Transformer Pad, Ductbank, Secondary Feeder Conduits to Service, Vaults.
Vertical In SlabBranch Distribution Raceways (power, lighting, equipment), BAS Raceways, Feeder/PowerDistributionRaceways.LifeSafety&CommunicationRaceways,if acceptable.
Vertical Overhead Rough InPower, Lighting, and Equipment Raceways, Life Safety Raceways, Communications Raceways, BAS Raceways, Feeder Raceways if Not in Slab, Branch Home Runs.
Vertical In Wall Rough InThe “In The Wall” Portion of the Raceway That Needs to Be Concealed in a Wall for Switches, Receptacles, Communication, Life Safety, BAS Devices, any Miscellaneous Equipment That Needs a Wall Rough In.
Vertical Wire PullingWire&CableInstallationsforallSystemsBelowSlaborOverhead.FeederWire, Branch Power, Branch Lighting and Equipment Wire, Life Safety, Communications, and BAS Cabling.
Vertical TrimLight Fixture Installation, Power and Lighting Device Installation, Life Safety, Communication, and BAS Device Installation.
VerticalElectric&EquipmentRooms
Switchboards, Panelboards, Electrical Switching Devices, VFD’s, Mechanical Equipment Connections (HVAC, Plumbing, Process, etc.)
Horizontal TrafficSignals BelowGradeWork,SetPoles&Equipment,Wiring.
Horizontal Street Lighting BelowGradeWork,SetPoles&Luminaires,Wiring.
Horizontal Interconnect Below Grade Work, Below Grade Wiring, Overhead Work (if applicable).
Line Construction
Mobilization/Demobilization
Mobilization/Demobilization of equipment, tooling and manpower to project. Includes warehouse support, trucking, on-boarding and establishment of laydown/officeareas.
18Pandemics and Construction Productivity: Quantifying the Impact
Market Segment Task Code Definition
Line Construction
Drilling/Pole SettingDrilling of pole holes including caisson foundations, setting of wood/steel poles, plump/backfillofpole,torqueingofboltsonsteelmonopoles.
Line Construction
FramingAll framing of the poles including cross arms, insulators, attachment plates, grounding, riser material, equipment (cutouts, reclosers, transformers, cap banks, switches, etc.).
Line Construction
Anchors/GuysInstallation of anchor types and associated guying between the pole and anchor.
Line Construction
Wire StringingAll tasks involved with the installation of wire including pulling ropes, pulling wire, clipping in and dead ending wire, and splicing.
Line Construction
TransfersMoving wire or equipment from old pole to new pole (typical for distribution work)
Line Construction
Removals Removal of any poles, framing, anchors/guys, wire, etc.
Systems General PathwaysWhen included in our SOW this details cable tray (outside of TR’s), sleeves, cable supports, etc.
Systems ER/TR BuildoutTelecommunication room buildout includes ladder tray, racks, cabinets, patch panels,fiberpanels,UPS/PDU’s,andgroundingassociatedwithER/TR’s.
Systems Horizontal Cabling
Includes category cabling to work area outlets. Depending on scope this can also include other systems type cable. Depending on project size the technical systems(AV,soundmasking,paging,firealarm,nursecall,etc.)wouldconstitute a separate cost code.
Systems Backbone CablingIncludescopper,fiber,andcoaxtypebackbonecablebetweenmainERandallassociated TR’s.
SystemsHorizontal Cable Termination&Testing
Includes terminating and testing both headend and station end cabling. This alsocanbebrokenoutbyfloor,area,etc.dependingonprojectsizewithseparate cost codes for each. Also includes face plates and labeling.
SystemsBackbone Cable Termination&Testing
Includes termination and testing of all backbone cabling. This also can be brokenoutbyfloor,area,etc.dependingonprojectsize.Alsoincludespatchpanel labeling.
Maintenance UPS MaintenanceMobilize/Demobilize, Facility Check-in Process, OEM Operational Testing, Battery Access/Inspections, Load Bank Testing, Test Reports Data Gathering, OEM Supply Chain Scheduling.
Maintenance Batteries MaintenanceMobilize/Demobilize, Facility Check-in Process, Valve Regulated Battery Testing, Flooded Cell Battery Testing, Torque and Tighten Connections, OEM Supply Chain Scheduling.
Maintenance Generator MaintenanceMobilize/Demobilize, Facility Check-in Process, OEM Operational Testing, Load Bank Testing, Fuel Polishing, OEM Supply Chain Scheduling.
19Pandemics and Construction Productivity: Quantifying the Impact
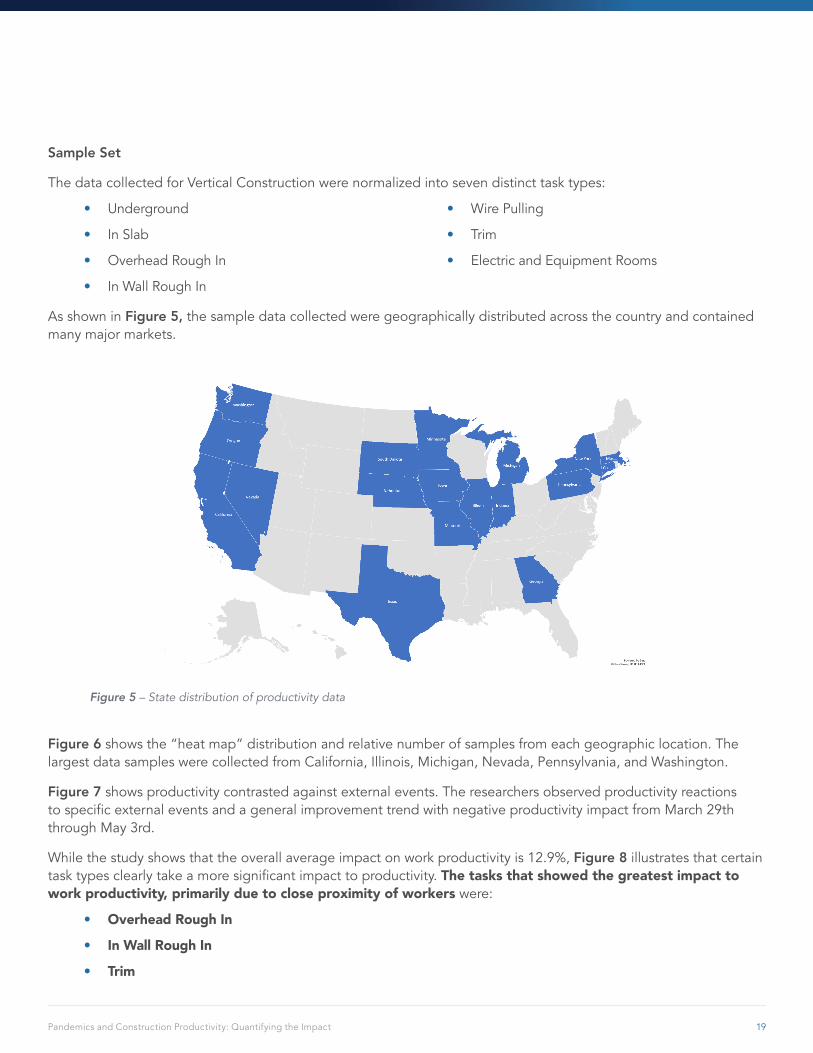
Sample Set
The data collected for Vertical Construction were normalized into seven distinct task types:
• Underground
• In Slab
• Overhead Rough In
• In Wall Rough In
• Wire Pulling
• Trim
• Electric and Equipment Rooms
As shown in Figure 5, the sample data collected were geographically distributed across the country and contained many major markets.
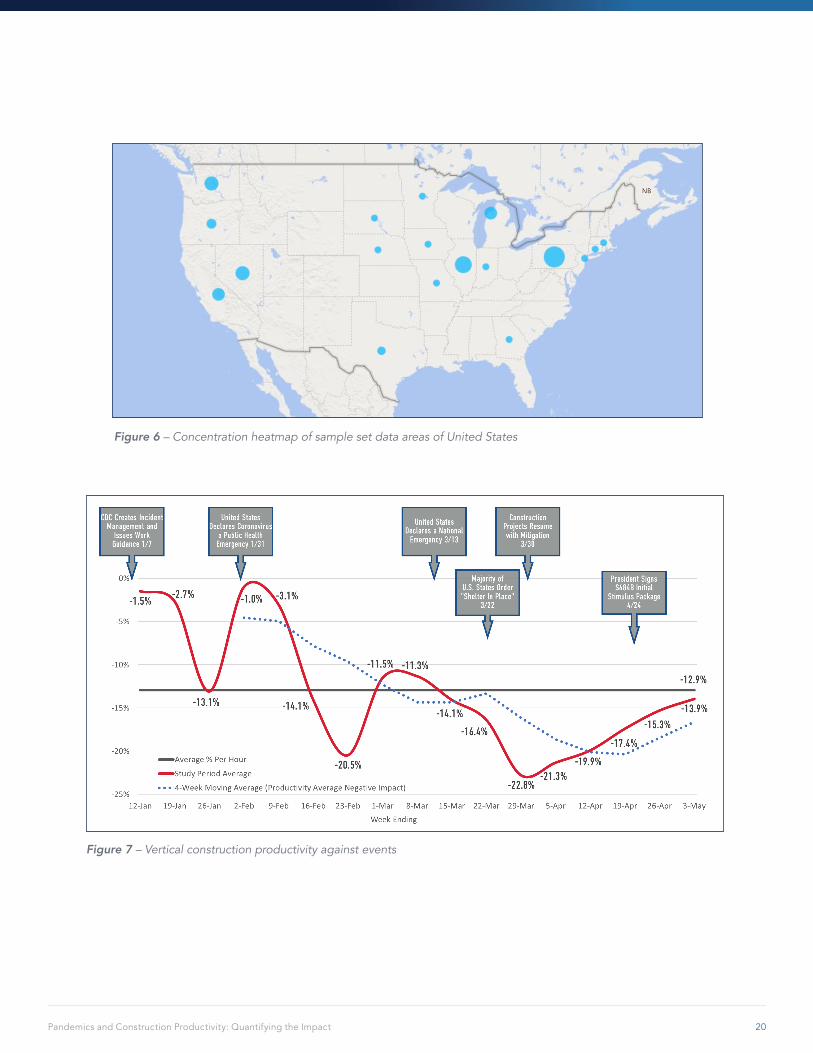
Figure 6 shows the “heat map” distribution and relative number of samples from each geographic location. The largest data samples were collected from California, Illinois, Michigan, Nevada, Pennsylvania, and Washington.
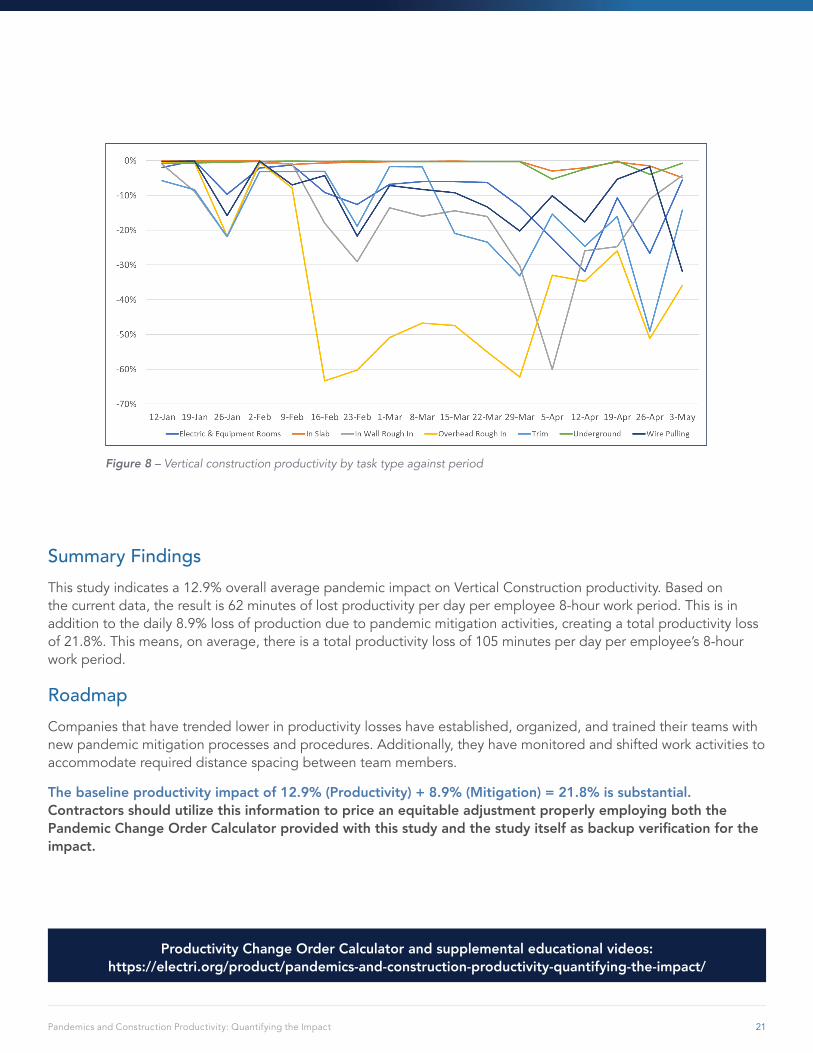
Figure 7 shows productivity contrasted against external events. The researchers observed productivity reactions tospecificexternaleventsandageneralimprovementtrendwithnegativeproductivityimpactfromMarch29ththrough May 3rd.
While the study shows that the overall average impact on work productivity is 12.9%, Figure 8 illustrates that certain tasktypesclearlytakeamoresignificantimpacttoproductivity.The tasks that showed the greatest impact to work productivity, primarily due to close proximity of workers were:
• Overhead Rough In
• In Wall Rough In
• Trim
Figure 5 – State distribution of productivity data
20Pandemics and Construction Productivity: Quantifying the Impact
Figure 6 – Concentration heatmap of sample set data areas of United States
Figure 7 – Vertical construction productivity against events
21Pandemics and Construction Productivity: Quantifying the Impact
Summary FindingsThis study indicates a 12.9% overall average pandemic impact on Vertical Construction productivity. Based on the current data, the result is 62 minutes of lost productivity per day per employee 8-hour work period. This is in addition to the daily 8.9% loss of production due to pandemic mitigation activities, creating a total productivity loss of 21.8%. This means, on average, there is a total productivity loss of 105 minutes per day per employee’s 8-hour work period.
RoadmapCompanies that have trended lower in productivity losses have established, organized, and trained their teams with new pandemic mitigation processes and procedures. Additionally, they have monitored and shifted work activities to accommodate required distance spacing between team members.
The baseline productivity impact of 12.9% (Productivity) + 8.9% (Mitigation) = 21.8% is substantial. Contractors should utilize this information to price an equitable adjustment properly employing both the Pandemic Change Order Calculator provided with this study and the study itself as backup verification for the impact.
Figure 8 – Vertical construction productivity by task type against period
Productivity Change Order Calculator and supplemental educational videos: https://electri.org/product/pandemics-and-construction-productivity-quantifying-the-impact/
22Data-Driven Analysis Of The Factors Affecting The Union Inside Electrical Contractor Market Share
Part IIIBusiness Impact of a Pandemic
Data Collection and MethodologyUsing discussion groups, case studies and an industry survey, as noted above, the researcher collected anecdotal data on the impacts the pandemic has had on electrical contractors beyond those impacts on their labor productivity. The four discussion groups and ten case studies focused on the ways electrical contractors were able to adapt their business practices working remotely, allow for social distancing in the workplace, and identify new ways of interacting with suppliers and clients working from home.
The survey focused on gathering data that pertain to impacts on the jobsite, project management, overall businessoperations,andotheritemsidentifiedbytheparticipants themselves. Participants indicated the impacts in each of these four areas as High, Medium, Low or No impact. This format allowed the researcher to quantify the relative magnitude of the impact within each area.
As discovered in the discussion groups and case studies, impacts varied dramatically, based on the type of construction. Contractors mentioned that large HealthCare projects managed by National CM/GCfirmsseemedtobethemostimpacted.Forsomesmaller work involving a crew of one, contractors
actually reported improved productivity. In some instances, contractors used the absence of workers in client facilities to increase their sell-additional-work volume. This approach helped ECs take care of projects that, during normal times, clients might not have had the time or access to start.
Contractorsidentifiedtheirtopthreeimpactsusingthisscale:
3 = High ImpactIthasresultedinsignificantfinancialharmtoyour business
2 = Medium ImpactIthasresultedinsomefinanciallosstoyourbusiness
1 = Low ImpactIthasnotimpactedyourfinancialsinameaningful way
0 = No ImpactAbsolutelynoimpactonyourfinancials.
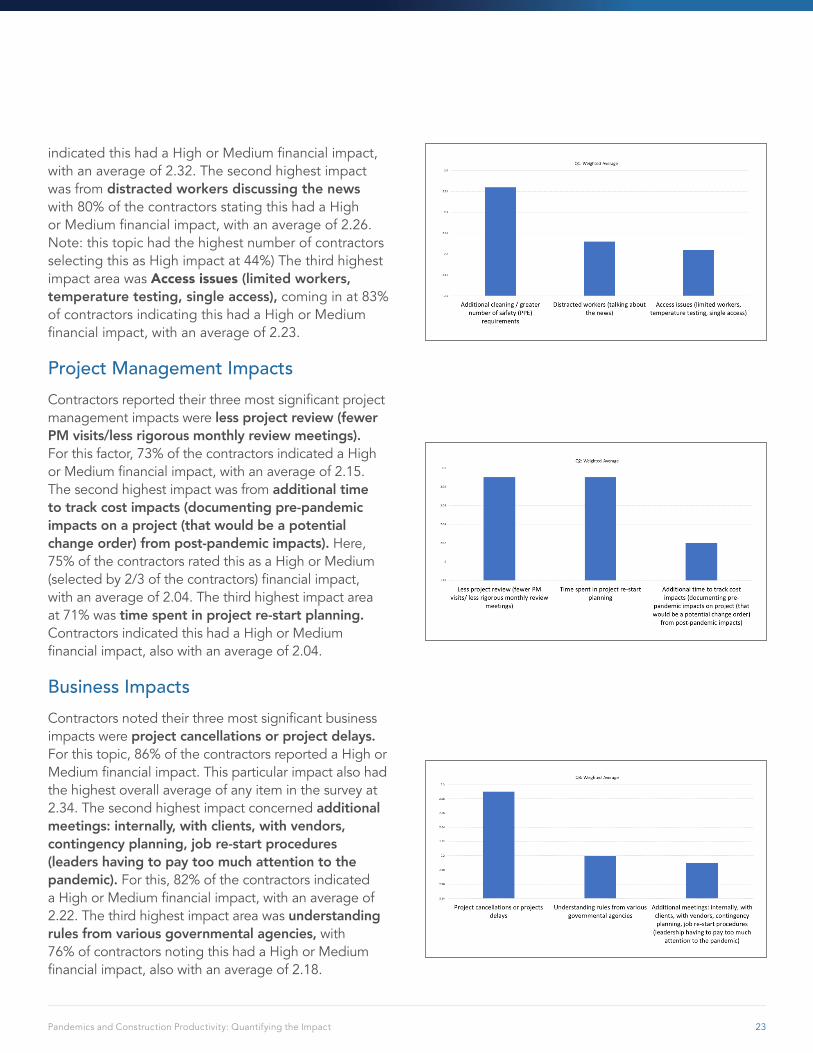
Jobsite ImpactsContractorsreportedtheirthreemostsignificantjobsite impacts were additional cleaning and the greater number of safety (PPE) requirements. On this point, 89% of the participating contractors
The current pandemic has had a dramatic impact on the productivity of field and office personnel in the electrical contracting industry. Over the past few months, this impact on project acquisition, pre-fabrication, the available pipeline of projects, project execution both for the field and project management, and the interactions and payment cycle of clients have created dramatic changes.
ObjectiveThe research for this portion of the project called upon representatives from all segments of the EC industry, both line and commercial. Data collection relied on discussion groups, case studies, and an industry Flash Survey to untangle and characterize objectively the relationship between productivity and this pandemic. The objective was to develop of a set of best practices and identify necessary education and training that would enable electrical contractorstobettermanagetheirprojectsandbusinessesandmitigatetheimpactofapandemicontheirfieldandproject management staff.
23Pandemics and Construction Productivity: Quantifying the Impact
indicatedthishadaHighorMediumfinancialimpact,with an average of 2.32. The second highest impact was from distracted workers discussing the news with 80% of the contractors stating this had a High orMediumfinancialimpact,withanaverageof2.26.Note: this topic had the highest number of contractors selecting this as High impact at 44%) The third highest impact area was Access issues (limited workers, temperature testing, single access), coming in at 83% of contractors indicating this had a High or Medium financialimpact,withanaverageof2.23.
Project Management ImpactsContractorsreportedtheirthreemostsignificantprojectmanagement impacts were less project review (fewer PM visits/less rigorous monthly review meetings). For this factor, 73% of the contractors indicated a High orMediumfinancialimpact,withanaverageof2.15.The second highest impact was from additional time to track cost impacts (documenting pre-pandemic impacts on a project (that would be a potential change order) from post-pandemic impacts). Here, 75% of the contractors rated this as a High or Medium (selectedby2/3ofthecontractors)financialimpact,with an average of 2.04. The third highest impact area at 71% was time spent in project re-start planning. Contractors indicated this had a High or Medium financialimpact,alsowithanaverageof2.04.
Business ImpactsContractorsnotedtheirthreemostsignificantbusinessimpacts were project cancellations or project delays. For this topic, 86% of the contractors reported a High or Mediumfinancialimpact.Thisparticularimpactalsohadthe highest overall average of any item in the survey at 2.34. The second highest impact concerned additional meetings: internally, with clients, with vendors, contingency planning, job re-start procedures (leaders having to pay too much attention to the pandemic). For this, 82% of the contractors indicated aHighorMediumfinancialimpact,withanaverageof2.22. The third highest impact area was understanding rules from various governmental agencies, with 76% of contractors noting this had a High or Medium financialimpact,alsowithanaverageof2.18.
24Pandemics and Construction Productivity: Quantifying the Impact
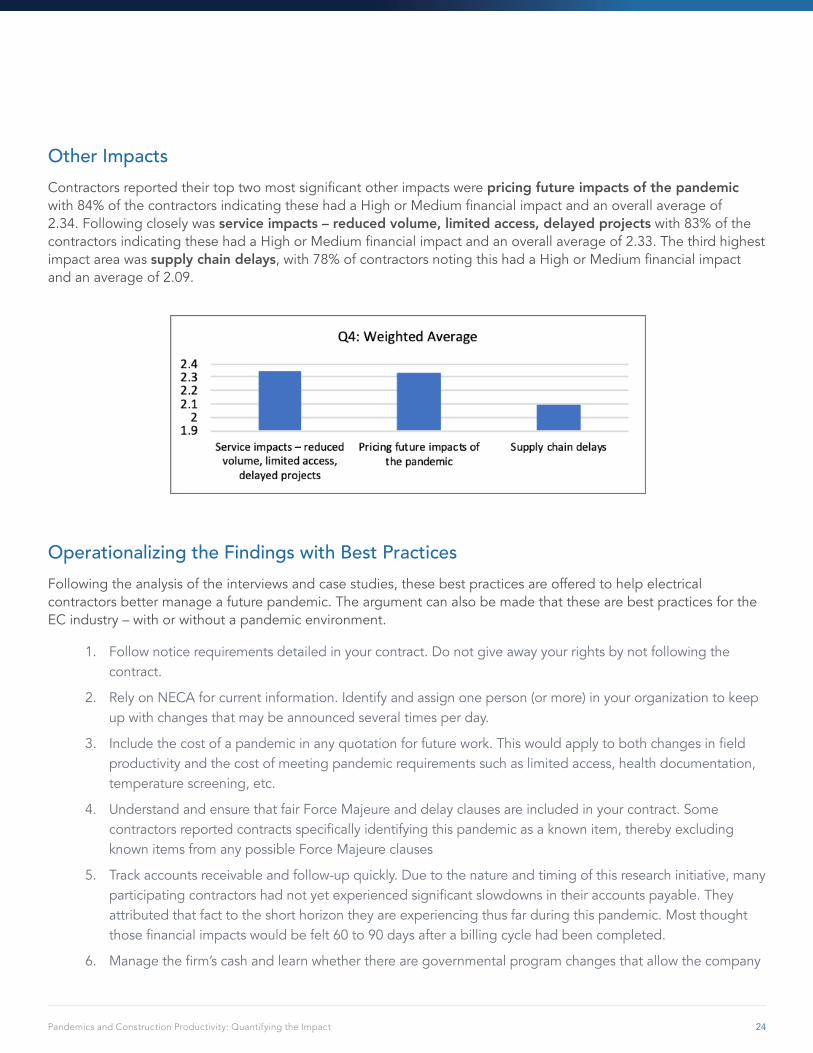
Other ImpactsContractorsreportedtheirtoptwomostsignificantotherimpactswerepricing future impacts of the pandemic with84%ofthecontractorsindicatingthesehadaHighorMediumfinancialimpactandanoverallaverageof2.34. Following closely was service impacts – reduced volume, limited access, delayed projects with 83% of the contractorsindicatingthesehadaHighorMediumfinancialimpactandanoverallaverageof2.33.Thethirdhighestimpact area was supply chain delays,with78%ofcontractorsnotingthishadaHighorMediumfinancialimpactand an average of 2.09.
Operationalizing the Findings with Best PracticesFollowing the analysis of the interviews and case studies, these best practices are offered to help electrical contractors better manage a future pandemic. The argument can also be made that these are best practices for the EC industry – with or without a pandemic environment.
1. Follow notice requirements detailed in your contract. Do not give away your rights by not following the contract.
2. Rely on NECA for current information. Identify and assign one person (or more) in your organization to keep up with changes that may be announced several times per day.
3. Includethecostofapandemicinanyquotationforfuturework.Thiswouldapplytobothchangesinfieldproductivity and the cost of meeting pandemic requirements such as limited access, health documentation, temperature screening, etc.
4. Understand and ensure that fair Force Majeure and delay clauses are included in your contract. Some contractorsreportedcontractsspecificallyidentifyingthispandemicasaknownitem,therebyexcludingknown items from any possible Force Majeure clauses
5. Track accounts receivable and follow-up quickly. Due to the nature and timing of this research initiative, many participatingcontractorshadnotyetexperiencedsignificantslowdownsintheiraccountspayable.Theyattributed that fact to the short horizon they are experiencing thus far during this pandemic. Most thought thosefinancialimpactswouldbefelt60to90daysafterabillingcyclehadbeencompleted.
6. Managethefirm’scashandlearnwhethertherearegovernmentalprogramchangesthatallowthecompany
25Pandemics and Construction Productivity: Quantifying the Impact
to borrow or defer payments. To “hoard” or keep cash, contractors reported the need to understand what programscanhelpwithcashflowandhowtousethefirm’sbanktonegotiatebetterline-of-creditterms.
7. Smallcontractors,especially,mustmakesuretofindthetimetowork“on”thebusinessratherthanjust“in”thebusiness.Manysmallbusinessownersindicatedthat,afterworkinginthefieldallday,itwasdifficulttokeep up with rapidly changing information.
8. Ensurethecompany’stechnologyissufficienttosupportremotework.Somecontractorsreportedforced investment in technologies rather than planned investment. In those situations, they noted that costinefficienciesoccurredduetotheneedtopurchasequickly,whethertheitemwascommunicationtechnology/bandwidth or large numbers of laptops. For the longer term, some contractors are planning for a more robust system to manage payroll, purchasing, and job costs.
9. Encouragediversificationwithinmarketsegments.Contractorswhoseemedmostimpactedwerethoseheavilyreliantonasinglemarketsegmentthatitselfwassignificantlyimpacted.Forexample,inthispandemic, the automotive, hospitality, and retail markets all experienced a much bigger negative impact than other market segments.
10. Keep an appropriate stock of PPE equipment. For some electrical contractors, the purchasing manager spent the entire day for multiple weeks trying to locate needed PPE. Anticipate future changes and requirements (face shields, cleaning solutions, etc.) with which companies may be forced to comply.
26Data-Driven Analysis Of The Factors Affecting The Union Inside Electrical Contractor Market Share
Appendix APandemic Mitigation Tracking Data Collection Definitions & Tools
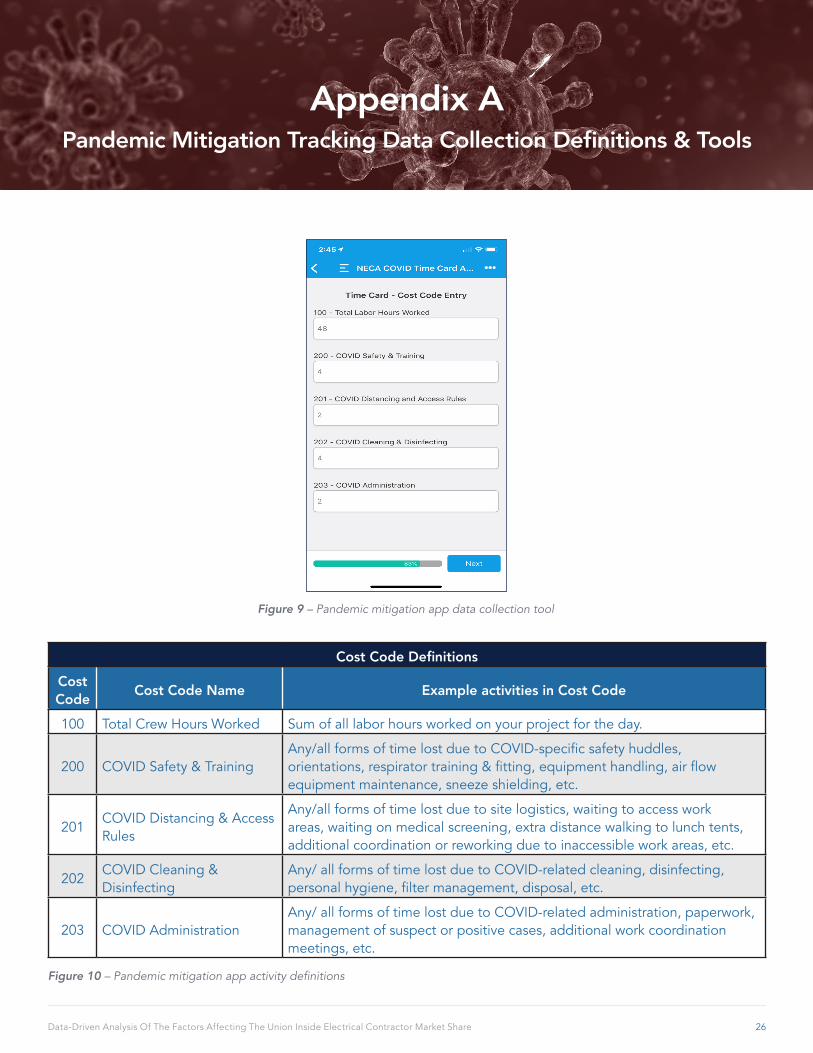
Figure 9 – Pandemic mitigation app data collection tool
Cost Code DefinitionsCost Code Cost Code Name Example activities in Cost Code
100 Total Crew Hours Worked Sum of all labor hours worked on your project for the day.
200 COVIDSafety&TrainingAny/allformsoftimelostduetoCOVID-specificsafetyhuddles,orientations,respiratortraining&fitting,equipmenthandling,airflowequipment maintenance, sneeze shielding, etc.
201COVIDDistancing&AccessRules
Any/all forms of time lost due to site logistics, waiting to access work areas, waiting on medical screening, extra distance walking to lunch tents, additional coordination or reworking due to inaccessible work areas, etc.
202COVIDCleaning&Disinfecting
Any/ all forms of time lost due to COVID-related cleaning, disinfecting, personalhygiene,filtermanagement,disposal,etc.
203 COVID AdministrationAny/ all forms of time lost due to COVID-related administration, paperwork, management of suspect or positive cases, additional work coordination meetings, etc.
Figure 10 – Pandemic mitigation app activity definitions
27Data-Driven Analysis Of The Factors Affecting The Union Inside Electrical Contractor Market Share
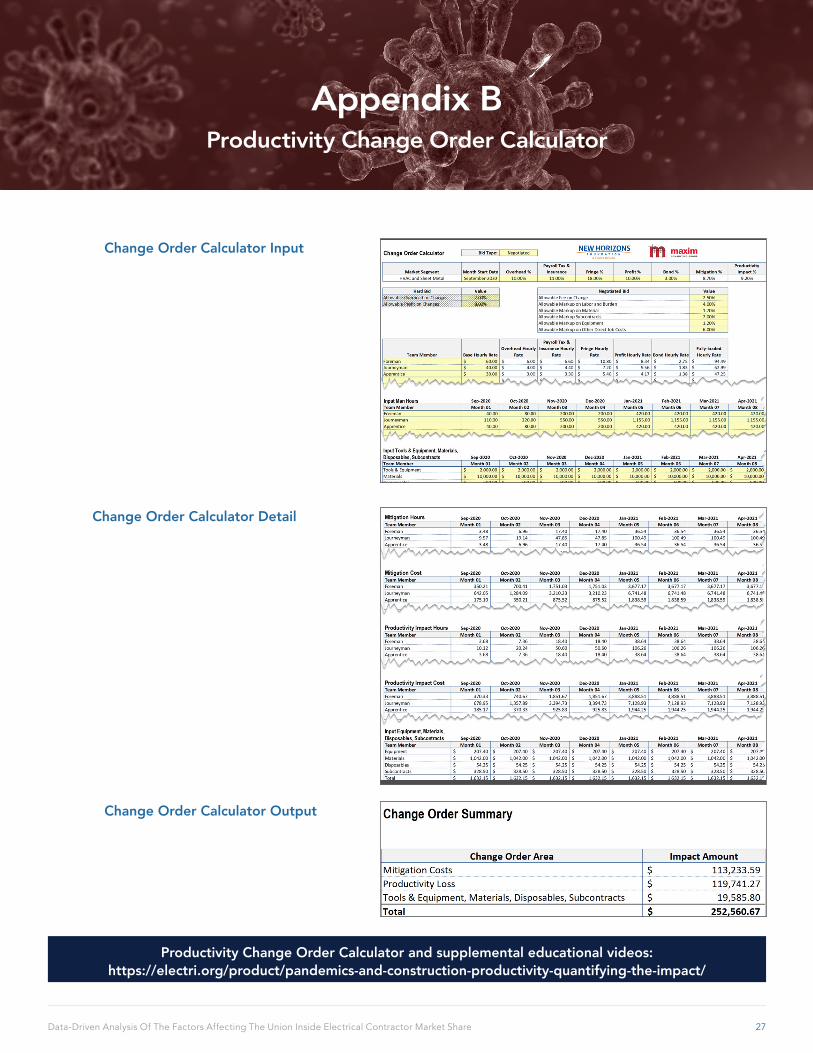
Appendix BProductivity Change Order Calculator
Productivity Change Order Calculator and supplemental educational videos: https://electri.org/product/pandemics-and-construction-productivity-quantifying-the-impact/
Change Order Calculator Input
Change Order Calculator Detail
Change Order Calculator Output

28Data-Driven Analysis Of The Factors Affecting The Union Inside Electrical Contractor Market Share
Appendix CDouble-Blind Productivity Benchmark Participant Survey
The research study utilized a double-blind methodology to observe pre- and post-pandemic construction productivity impacted by behavioral interventions. Blinding or masking refers to the withholding of information regarding treatment allocation from one or more research study participants. It is an essential methodological feature of studies that helps maximize the validity of the research results.
29Pandemics and Construction Productivity: Quantifying the Impact
Michael McLin, Managing Director at Maxim Consulting Group, works with construction-relatedfirmsofallsizestoevaluatetheirbusinesspracticesandassistwithmanagementchallenges. His areas of specialization include organizational assessments, strategic planning, project execution, productivity improvement, prefabrication, peer groups, and training programs. McLin has consulted with some of the most sophisticated contractors in the U.S. and his industry experience includes some of the most complex construction projects undertaken across the country. He is adept at utilizing available tools and analysis to identify opportunities and challenges within an organization. In addition to his expertise in many facets of the construction world, McLin is a nationally-recognized public speaker and published author.
Dan Doyon,DirectoratMaximConsulting,workswithconstruction-relatedfirmstosolvecomplexbusinesschallengesthatdriverevenueandprofitability.Hisbroadexperiencein business process improvement across construction and related industries provides him with a unique perspective to identify and solve operational issues. His subject expertise includesorganizationalassessments,strategicbusinessplanning,financialplanningandanalysis, technology, organizational design and transition, productivity improvement, peer groups, and prefabrication system design. With his guidance and recommendations, companies have driven over $160 billion in top line sales growth and hundreds of millions in operational savings through improved processes.
Brian Lightner, Associate Director at Maxim Consulting, is responsible for client evaluation andimplementationprocesses.Hisextensiveworkwithconstructionfirms,includingthefirstISO9000certifiedGeneralContractorintheU.S.,hasfocusedonprocessimprovement initiatives. He is keenly aware of the challenges that contractors face, includingintheirfieldoperations.Lightner’sareasofexpertiseincludeprojectplanning/scheduling/execution;fieldproductivityassessments;projectrecovery;andprocessimprovement/integration/standardization. His experience with both construction specialties andhighly-successfulgeneralcontractorsallowshimtoexecutemanyexemplaryfieldoperation and productivity studies.
Mark Federle, Associate Dean for Academic Affairs at Marquette University, is a licensedProfessionalEngineerandCertifiedProfessionalConstructor.PriorprofessionalengagementsincludeservingasChiefInformationOfficerforTheWeitzCompany(DesMoines) and as Professor-in-Charge of Iowa State University’s Construction Engineering program. He was elected to the National Academy of Construction in 2018 and is a Fellow of ASCE. Since the mid-1990s, Federle has worked with ELECTRI International and NECA as a researcher and instructor and has published extensively on electrical contracting in ELECTRICAL CONTRACTOR magazine.
The Consulting Research Team

30Pandemics and Construction Productivity: Quantifying the Impact
1201 Pennsylvania Ave. NW, Suite 1200 Washington, D.C. 20004T: 202-991-6257 www.electri.org
Index Number # F3434