Embed Size (px)
Citation preview

Pandemic InfluenzaOverview and Current Planning
Considerations
State of Connecticut Department of Public Health
Albert L. Geetter, MDSection Chief
Office of Public Health Preparedness


Definitions
Bird Flu/Avian Influenza
o Domestic Poultry
o Migratory Waterfowl
Pandemic Influenza


H1 N1H2 N2H3 N3H4 N4H5 N5H6 N6H7 N7H8 N8H9 N9H10H11H12H13H14H15
Natural hosts of influenza viruses
Haemagglutinin subtype Neuraminidase subtype

Implications
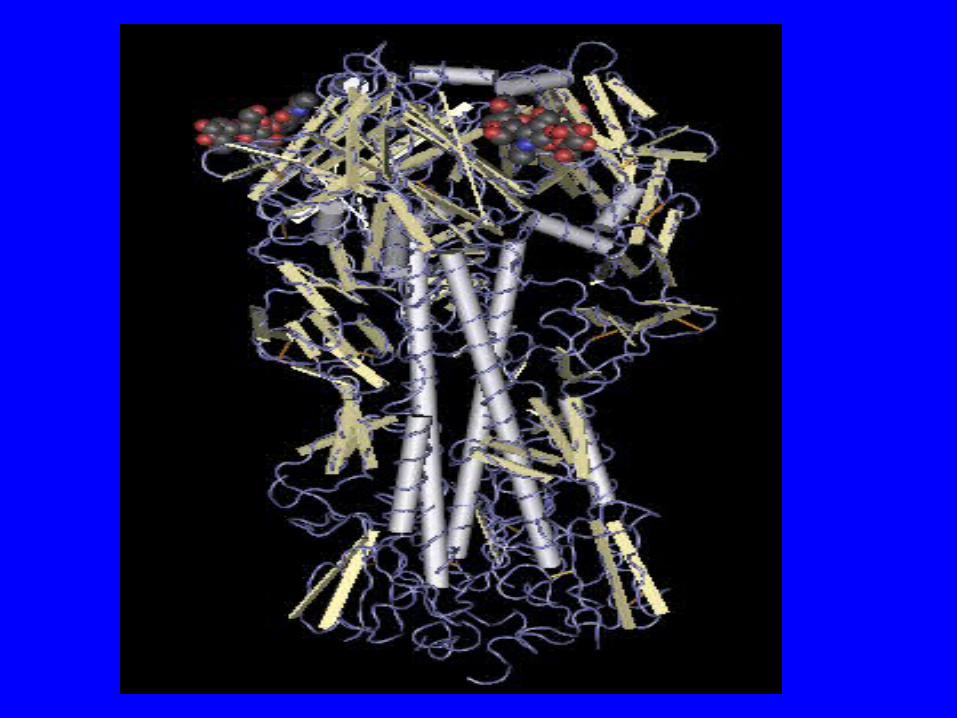
Novel Virus
lack of immune “experience”

PATHOGENICITY
VS
TRANSMISSABILITY

Transmissability
Reassortment via Antigenic Shift•Human and Avian recombinant
in “other” species.
Mutation via Antigenic Drift•Internal Genetic Adaptive Change


Avian-human pandemic
reassortant virus
Avianvirus
Human virus
Avian reassortant
virus
Avianvirus
Reassortment
in hogs
Reassortment
in humans
Generation of Pandemic Influenza
Reassortment is where a human & other animal
strains can mix and form a new strain


Children/Teenagers 29%
Adults 59%
Seniors 12%
Demographics
Glass, RJ, et al. Local mitigation strategies for pandemic influenza. NISAC, SAND Number: 2005-7955J
School
Household
Workplace
Likely sites of transmission
Who Infects Who?To Children To Teenagers To Adults To Seniors Total From
From Children 21.4 3.0 17.4 1.6 43.4
From Teenagers 2.4 10.4 8.5 0.7 21.9
From Adults 4.6 3.1 22.4 1.8 31.8
From Seniors 0.2 0.1 0.8 1.7 2.8
Total To 28.6 16.6 49.0 5.7
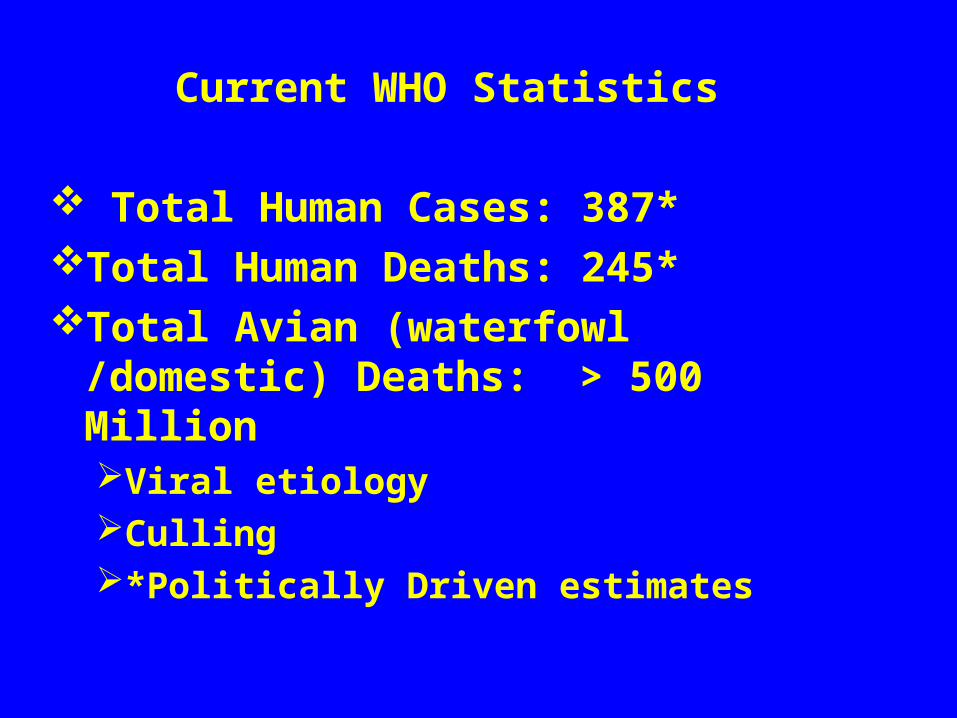
Current WHO Statistics
Total Human Cases: 387*Total Human Deaths: 245*Total Avian (waterfowl /domestic)
Deaths: > 500 MillionViral etiologyCulling*Politically Driven estimates

Pandemic Influenza: Background & Assumptions
• Novel virus, fully susceptible population, efficient and sustained human to human spread – “1918-like” pandemic would result in ~2 million deaths in US– Vaccine (pandemic strain) likely delayed or not available– Antivirals may be insufficient quantity, ineffective and/or difficult to
distribute in a timely way– Epidemic over a large geographic area affecting a large proportion of the
population

Pandemics of the 20th Century

• The "Spanish influenza", between 1918 to 1919, was due to an A/H1N1 virus related to porcine influenza
• The "Asian influenza", between 1957 to 1958, was due to an A/H2N2 virus
• The "Hong Kong influenza", between 1968 to 1969, was due to an A/H3N2 virus.

20th Century Influenza Pandemics
• 1968-69 “Hong Kong flu,” (H3N2)– 34,000 US deaths (1-4 million worldwide)
• 1957-58 “Asian flu,” (H2N2)– 70,000 US deaths (1-4 million worldwide)
• 1918-19 “Spanish flu,” (H1N1)– >600,000 US deaths (20-100 M worldwide)– 30-40% infected– 2.5% overall mortality– Most deaths among young, healthy adults

Projected GDP Loss From Severe Pandemic: $10.1 Billion
Projected GDP Percent Loss from Severe Pandemic: 5.23 percent
Ranking of Percentage Losses Out of 50 States (Highest = 1): 46
Projected Losses Due to Workforce Absenteeism and Deaths: $ 5 billion
Projected Losses to State Industries: $3.2 billion
Projected Losses Due to Potential Drop in Trade: $1.9 billion
Projected Lives Lost: 29,000
Projected Number of Illnesses: 1,039,000

Pandemic Severity Index
1918

Category 5
Category 4
Category 3
Category 2Category 1
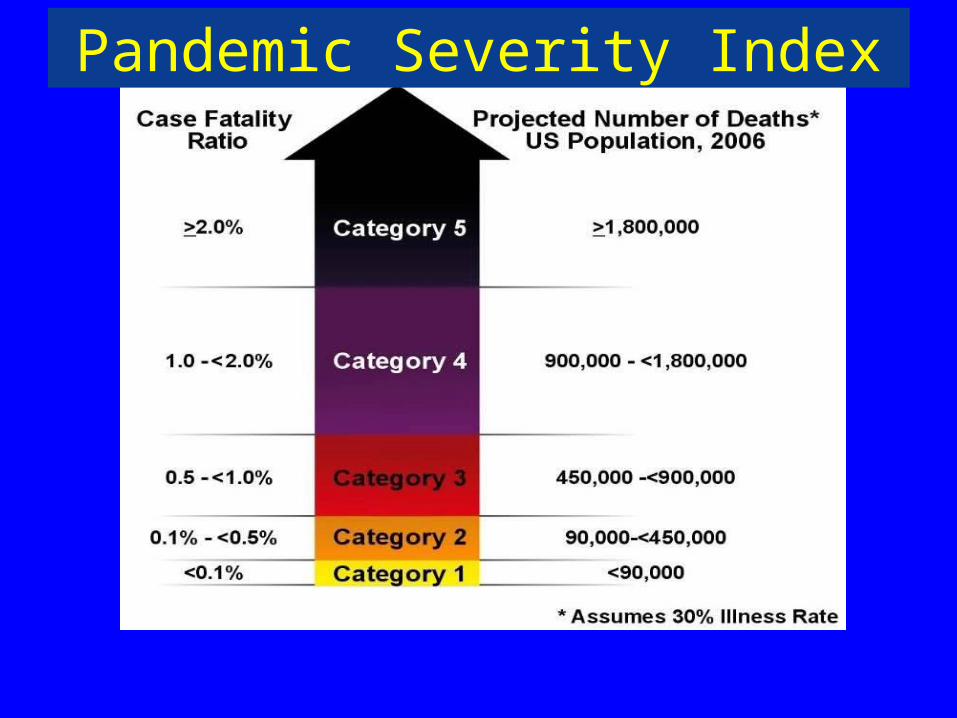
Pandemic Severity Index
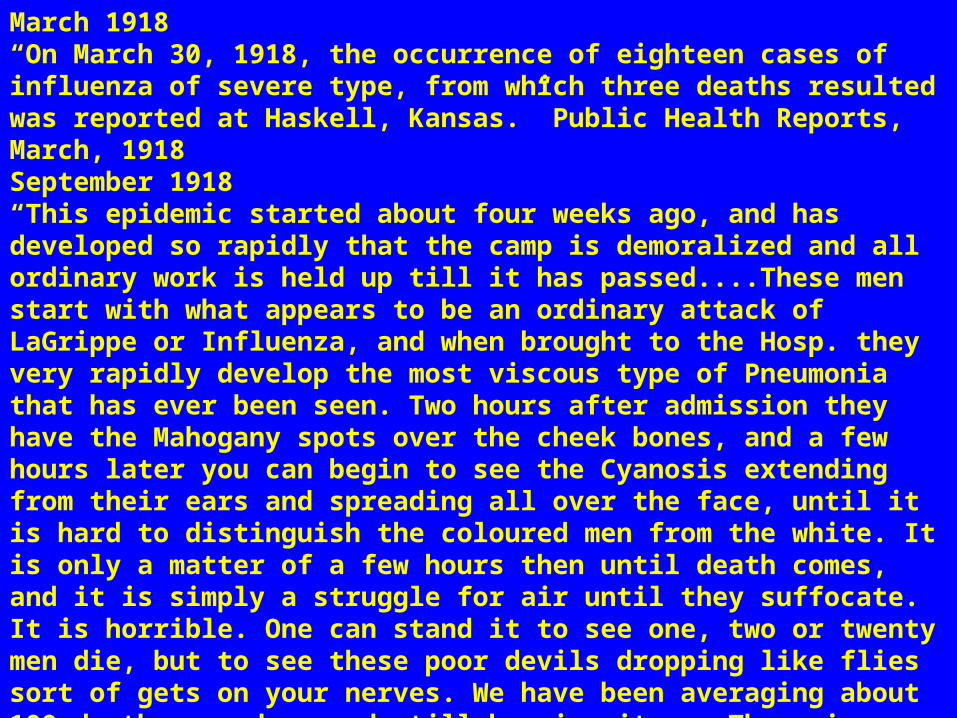
March 1918“On March 30, 1918, the occurrence of eighteen cases of influenza of severe type, from which three deaths resulted was reported at Haskell, Kansas.” Public Health Reports, March, 1918September 1918“This epidemic started about four weeks ago, and has developed so rapidly that the camp is demoralized and all ordinary work is held up till it has passed....These men start with what appears to be an ordinary attack of LaGrippe or Influenza, and when brought to the Hosp. they very rapidly develop the most viscous type of Pneumonia that has ever been seen. Two hours after admission they have the Mahogany spots over the cheek bones, and a few hours later you can begin to see the Cyanosis extending from their ears and spreading all over the face, until it is hard to distinguish the coloured men from the white. It is only a matter of a few hours then until death comes, and it is simply a struggle for air until they suffocate. It is horrible. One can stand it to see one, two or twenty men die, but to see these poor devils dropping like flies sort of gets on your nerves. We have been averaging about 100 deaths per day, and still keeping it up. There is no doubt in my mind that there is a new mixed infection here, but what I don’t know.”A physician stationed at Fort Devens outside Boston, late September, 1918


Stages of a Pandemic
The World Health Organization (WHO) has developed a global influenza preparedness plan, which defines the stages of a pandemic, outlines the role of WHO, and makes recommendations for national measures before and during a pandemic. The phases are:

Interpandemic period
Phase 1 : No new influenza virus subtypes have been detected in humans. An influenza virus subtype that has caused human infection may be present in animals. If present in animals, the risk of human infection or disease is considered to be low.
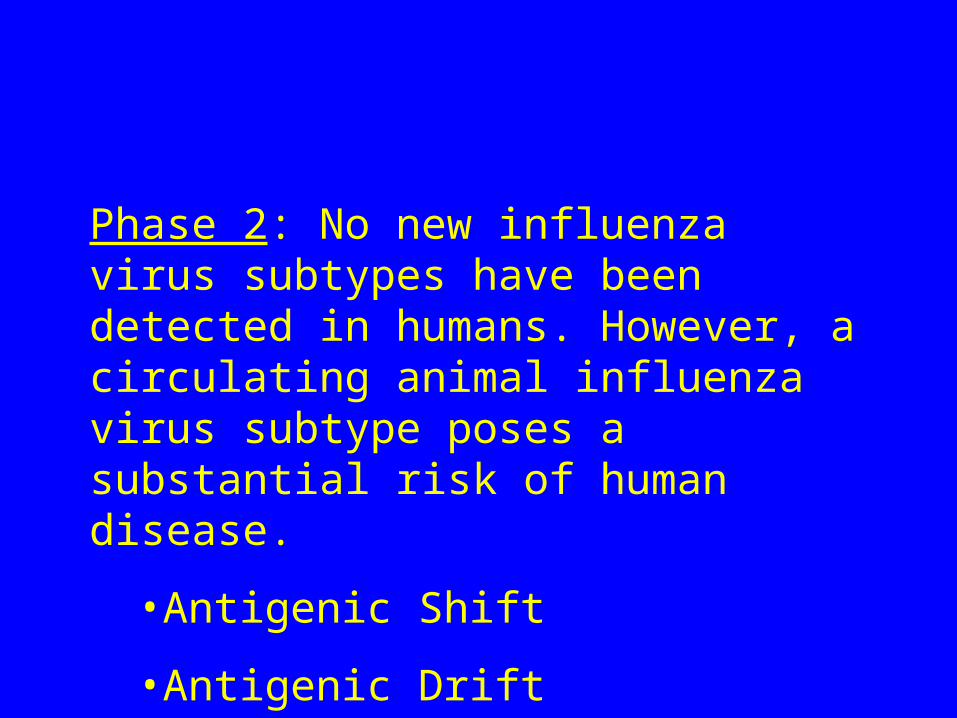
Phase 2: No new influenza virus subtypes have been detected in humans. However, a circulating animal influenza virus subtype poses a substantial risk of human disease.
•Antigenic Shift
•Antigenic Drift

Pandemic alert period
Phase 3: Human infection(s) with a new subtype but no human-to-human spread, or at most rare instances of spread to a close contact.
Phase 4: Small cluster(s) with limited human-to-human transmission but spread is highly localized, suggesting that the virus is not well adapted to humans.

Phase 5: Larger cluster(s) but human-to-human spread still localized, suggesting that the virus is becoming increasingly better adapted to humans but may not yet be fully transmissible (substantial pandemic risk).

Phase 6: Pandemic: increased and sustained transmission in general population.
Pandemic period

Government Response to a Disaster
FEMA
FBI
DoD DoT
DoE
EPA
USDA
AITNRL
PHHS
USAMRIID DHHS
ATSDR
NMRI
NIH
CDC
SBCCOMC/B-RRT
?
DHS


A tale of two citiesPhiladelphia & St. Louis
• In St. Louis, when the first cases of disease among civilians were reported on October 5, city authorities moved quickly to introduce a wide range of measures designed to promote "social distancing," implementing these measures within two days.

A Tale of Two CitiesPhiladelphia & St. Louis
• Philadelphia's officials response to the news of the pandemic was to downplay its significance. They allowed large public gatherings to continue taking place - most notably a city-wide parade on September 28, 1918.
• Bans on public gatherings, school closures and other NPI's did not begin to be implemented until October 3.

Philadelphia 1918 War Bond Parade

Philadelphia & St Louis
• Philadelphia experienced a peak weekly death rate of 257 per 100,000 people and an overall death count of 719 per 100,000.
• St. Louis showed much lower totals, with a weekly mortality peak of just 31 per 100,000 and a final mortality count of 347 per 100,000.

Shelter in PlaceFoodWaterFlashlight Battery/Crank Powered RadioCooking UtensilSterno Powered Fondue PotCell PhoneWritten Contact ListPrescriptions Allotment Resupply 80% of production-outsourced

Current Programs in Development
Surveillance Response/Activation/Mitigation
Surge Triage Alternate Care Sites Antiviral Distribution Vaccine Development Non Pharmaceutical Intervention1. Cough Etiquette
2. Hand Washing 3. Social Distancing 4. Shelter in Place
Legal Ethical Recovery Restoration


Two Tamiflu with “jimmies”
....please
Hmmm.... Taste just
like Relenza

Use of Antivirals to Blunt a Pandemic
1. Delay disease transmission and outbreak peak2. Decompress peak burden on healthcare infrastructure3. Diminish overall cases and health impacts
Done in combination with non-drug interventions
DailyCases
#1
#2
#3
Days since First Case
Pandemic outbreak:No intervention
Pandemic outbreak:With intervention

Vaccine (pandemic strain) likely delayed or not available
– Antivirals may be insufficient quantity, ineffective and/or difficult to distribute in a timely way
– Epidemic over a large geographic area affecting a large proportion of the population

Hospitals-32
Total Staffed Beds~7294
Professional Staff~14,077
Support Staff~47,425

Operational Considerations
Maximum surge rate: 48-72 hours
Expected staff depletion rate: 30-40%
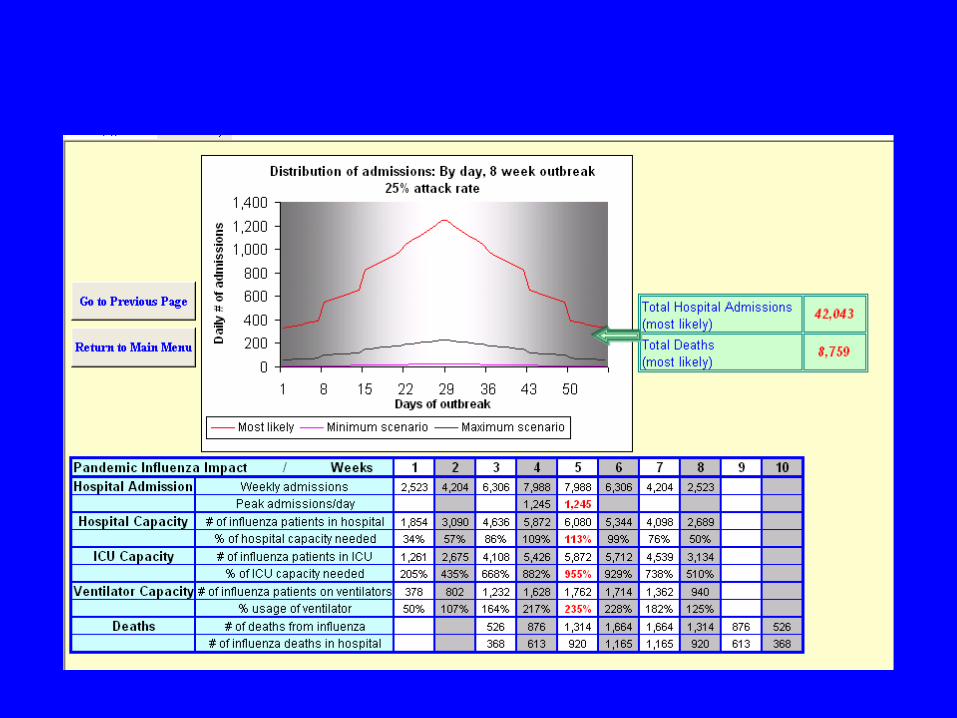
Attack Rate 30%
Connecticut Population~3.5 Million
Acutely Ill ~1 Million
Morbidity

Pandemic Mortality Rate1-2%
projected 10,000-20,000 Deathsover a 10-12 week period

Pandemic Mortality Rate = 1-2%
10,000 – 20,000 projected pandemic deaths
5,500 – 6,600 ‘statistically expected’ deaths
TOTAL DEATHS 15,500 – 26,600

Management Categories
Critical Personnel
Essential Personnel
Support Personnel
Substitution
Sentinel Events
Impending Capacity Overload
Staff absence from assigned duties
ED Surge

Simultaneous Cessation of all Elective Procedures
Activate Staff: Notification, Call-down Reassignment from elective to acute care duties
Furlough, Early Discharge, of Non-Acute Patients
Designate % In-house Bed Capacity for Acute Viral Respiratory Syndrome Patients
Initial Response

Professional Staffing
Community Health Organizations
Local Health Departments
MRC
ESARVHP

Administrative Issues
ACH Oversight of all Non-Medical Aspects of ACF Operations
ACF to Operateas a Satellite of a Designated ACHunder its DPH licensure
Insurance Billing for Services Rendered under ACH Licensure
ACF/TC Activation
Predetermined Site Selection in concert with area ACH, Regional Emergency
Response and local Chief Elected Officials
Mobile Field Hospital Activation to provide 25 bed TC for each of the five DEMHS
regions

ACF Functional ElementsFree Standing“Hard” Shelter
HVACFoodRehydrationBeddingShowers Water intake
Sewage facilities Oral pharmaceuticals Temporary morgue capacity Ease of vehicle access Communications capability Basic medical/nursing care
Proximity but not contiguity to ACH’s and TC’s, to avoid aggregation of individuals seeking medical care

TC Functions
All 911 calls regarding acute respiratory syndrome will result in diversion to a
regional TC for evaluation
Risk communication to public will encourage private transport of similarly
ill individuals to the TC

Triage Classification
Acutely Ill, requiring transport to ACH as bed becomes available
Clinically Subacute Illness, requiring ACF support
Ill individuals who can remain at home
Worried Well
Expectant

Mortuary Operations
ACH, ACF and TC
On premises identification and body storage to be an oversight function of
the OCME and DMORT Teams

Declaration to deactivate the ACF/TC module
will be at the discretion of DPH Commissioner
in concert with ACH/DMAT/TC Administrators
Recovery

Procedure
Patient discharge/transfer per ACH protocols
Administrative and medical support personnel return to pre-event clinical duties
DMAT deconstruction and storage of MFH modules
Pharmaceutical cache returned to point of origin

Questions
Comments