Embed Size (px)
Citation preview
Working Paper No. 327
Accessed at https://www.nipfp.org.in/publications/working-papers/1924/ Page 1 Accessed at https://www.nipfp.org.in/publications/working-papers/1924/ Page 1
NIPFP Working Paper Series
Pandemic and GST Revenue: An Assessment
for Union and States No. 327 22-December-2020 Sacchidananda Mukherjee
National Institute of Public Finance and Policy New Delhi
Working Paper No. 327
Accessed at https://www.nipfp.org.in/publications/working-papers/1924/ Page 2 Accessed at https://www.nipfp.org.in/publications/working-papers/1924/ Page 2
Pandemic and GST Revenue: An Assessment for Union and States
Sacchidananda Mukherjee*
*- Associate Professor, National Institute of Public Finance and Policy (NIPFP), 18/2, Satsang
Vihar Marg, Special Institutional Area, New Delhi – 110 067, INDIA. E-mail:
[email protected], [email protected]
Abstract
Uncertainties surrounding GST collection in financial year 2020-21 have heightened due to
ongoing COVID-19 pandemic. Given that economic activity is gradually returning to pre-
pandemic levels, this paper projects overall as well as state-wise GST collection for 2020-21.
The estimated GST collection of 2020-21 is the sum of realized GST collection during April
to October 2020 and projected GST collection during November 2020 to March 2021. The
study builds different scenarios based on monthly (year-on-year) growth experience with
different assumptions about the likely base of GST collection for the remaining months of the
current fiscal year. The revenue gap is estimated for states by taking the difference between
the projected GST collection and revenue under protection in GST for 2020-21. The
difference between the projected GST compensation cess collection in 2020-21 and sum of
the revenue gaps of states provides the expected additional revenue requirement for full GST
compensation payments to states. Acknowledging that a part of revenue loss is due to the
pandemic, and that the compensation mechanism to fill the shortfall for 2020-21 and coming
years is still evolving in the GST Council, present paper contributes to the ongoing debate on
GST compensation requirements of states by projecting alternative set of numbers for the
year 2020-21. As per our estimates, shortfall in GST compensation fund is expected to be Rs.
1.95 lakh in the best case scenario as against Rs. 2.35 lakh crore estimated by the GST
Council. In the worst case scenario, the shortfall will be Rs. 2.45 lakh crore for the fiscal year
2020-21.
Key Words: Revenue Projection, Goods and Services Tax (GST), Revenue Under Protection
(RUP), GST Compensation, Tax Effort, Tax Compliance, India.
JEL Classification: H25, H71, H68, C53
Acknowledgements: I am grateful to Dr. Pinaki Chakraborty, Director, NIPFP for detailed
comments and suggestions on earlier drafts of this paper. Usual disclaimer nevertheless
applies.
Working Paper No. 327
Accessed at https://www.nipfp.org.in/publications/working-papers/1924/ Page 3 Accessed at https://www.nipfp.org.in/publications/working-papers/1924/ Page 3
1. Introduction
Revenue impact of COVID-19 pandemic would be different across different economies
depending on duration and severity of the impact of pandemic in terms of mortality and
morbidity, stringency; duration and spatial spread of confinement measures adopted,
structure of the economy, exposure to international flows including trade and tourism,
structure and composition of government revenues, and measures taken to cushion firms
and households from the impact of the pandemic (OECD 2020). Since revenue realization of
economies depends on tax and non-tax payment cycles, it is too early to present a
comparative assessment of revenue impact of COVID-19 pandemic across countries.
Moreover, realization of benefits of fiscal measures adopted by different economies to
stimulate the economy may differ depending on speed of transmission. In addition, measures
adopted by tax administrations to facilitate ease-of-tax compliance by allowing deferment of
tax payments, extending deadlines of filing tax returns, etc. may delay in realization of
revenue.
Some early signs of revenue impacts of the pandemic are available from Asian economies.
Japan reports a revenue fall of 9.2 percent in the year ending March 2020 (Reuters 2020),
and in Korea revenue for Q1 of 2020 has declined by KRW 8.5 trillion relative to Q1 of 2019
(a fall of approximately 11%) (Eun-joo 2020). Combined government deficit (as measured
by net borrowing) of 27 countries of the European Union have increased from 0.3 percent of
aggregate GDP in Q2 of 2019 to 11.4 percent of aggregate GDP in Q2 of 2020. Since a
significant share of revenue of South Asian economies comes from trade taxes (on average
15% of total revenue during 2015-17, according to WTO as reported in OECD 2020), current
slowdown in global trade is expected to impact severely than during global financial crisis
(OECD 2020). It is also likely that all sources of government revenues will decrease due to
fall in economic activities. Being most responsive to economy cycles, revenue from Corporate
Income Tax (CIT) is likely to decrease more than the fall in economic activity. Any fall in
employment and /or wages and salaries is likely to impact Personal Income Tax (PIT)
collection. Tax from consumption like VAT/ GST is also likely to fall due to the impact of
lockdowns and lower consumer confidence, as well as a potential shift towards the
consumption of basic necessities, which are either exempted or taxed at lower rates (OECD
2020).
Though the spread of COVID-19 is on an apparent decline in India, the economic impact of
the pandemic is still evolving, as new waves of COVID-19 infection are striking locally. Any
estimate on revenue impact, thus, may not be free from shortcoming and constraints.
However, as GDP data of last two quarters is now available, and as GST shows the brightest
sign of recovery among all revenue streams, an attempt is made in this paper to project GST
revenue for 2020-21. The paper further delves into the issue of compensation to states in the
Working Paper No. 327
Accessed at https://www.nipfp.org.in/publications/working-papers/1924/ Page 4 Accessed at https://www.nipfp.org.in/publications/working-papers/1924/ Page 4
case of revenue shortfall enshrined in the prevailing law, and presents an estimate of GST
revenue shortfall that Indian states may likely to face in 2020-21.
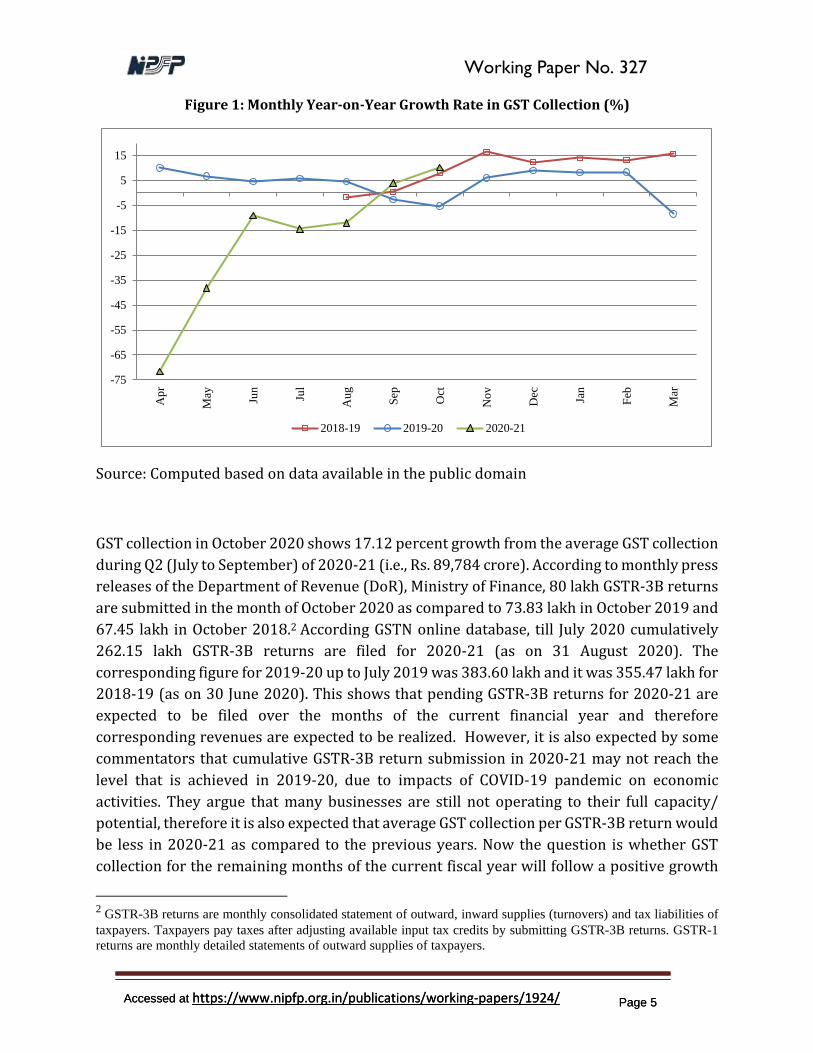
GST collection of October 2020 shows 10.2 percent Year-On-Year (YOY) growth. October
2020 is the second consecutive month (besides September 2020) of the current fiscal year
which shows a positive growth (YOY) in GST collection (Figure 1). This is a positive sign of
recovery of Indian economy from the ongoing COVID-19 pandemic. The growth in GST
collection realized in the month of October 2020 is a combination of gradual unlocking of the
economy, increase in economic activity, and increase in consumption demand due to festive
season. However, the positive growth cannot be fully attributed to delayed submissions of
GST returns (GSTR-3B) of previous months of the current fiscal year, as commented by many.
In 2019-20 growth rates in GST collection declined during September (-3%) and October (-
5%) with respect to respective months of 2018-19. After maintaining an average monthly
(YOY) growth rate of 6 percent during April to August 2019, the fall in growth rates in GST
collection during festive months (September and October of 2019) and in March 2020 (-8%)
resulted in fall in growth rate in overall GST collection of 2019-20 to 3.8 percent. Barring the
three months, average monthly growth rate was 7 percent in 2019-20. Average monthly
(YOY) growth rate in GST collection was 14.4 percent during November 2018 to March 2019.
During November 2019 to March 2020 average monthly (YOY) growth rate fell down to 4.6
percent. The difference in growth path of 2019-20 with respect to 2018-19 may be attributed
to several structural changes initiated by the GST Council in terms of increasing the threshold
of GST registration from Rs. 20 lakh to Rs. 40 lakh with effective from 1 April 2019,1 reducing
tax rates of several commodities during 2019-20, besides fall in nominal growth rate in Gross
Value Added (GVA at basic prices, 2011-12 series) from 10.5 percent in 2018-19 to 7 percent
in 2019-20 (Appendix Table A1).
1 In the 32nd meeting on 10 January 2019, the GST council decided to increase GST registration threshold for sales of
goods to Rs. 40 lakh from Rs. 20 lakh for general category states and from Rs. 10 lakh to Rs. 20 lakh for special
category states with effective from 1 April 2019. There was no change in threshold limits for service providers. All
general category states (except Telangana) and Himachal Pradesh, Delhi, Jammu & Kashmir, Ladakh, Assam opted
for Rs. 40 lakh threshold. Puducherry, Meghalaya, Mizoram, Tripura, Manipur, Sikkim, Nagaland, Arunachal Pradesh
and Uttarakhand opted for Rs. 20 lakh threshold. The threshold of annual turnover for composition scheme has also
increased from Rs. 75 lakh to Rs. 1.5 crore with effective from 1 April 2019. The council also decreased composition
rate from 2 percent to 1 percent for manufacturers. However, the limit remains unchanged at Rs. 75 lakh for North
Eastern States and Uttarakhand. New scheme introduced with a fixed GST rate of 6 percent (3% CGST and 3% SGST)
for independent service providers as well as mixed suppliers of goods and services with an annual turnover of up to
Rs. 50 lakh in the preceding financial year.
Working Paper No. 327
Accessed at https://www.nipfp.org.in/publications/working-papers/1924/ Page 5 Accessed at https://www.nipfp.org.in/publications/working-papers/1924/ Page 5
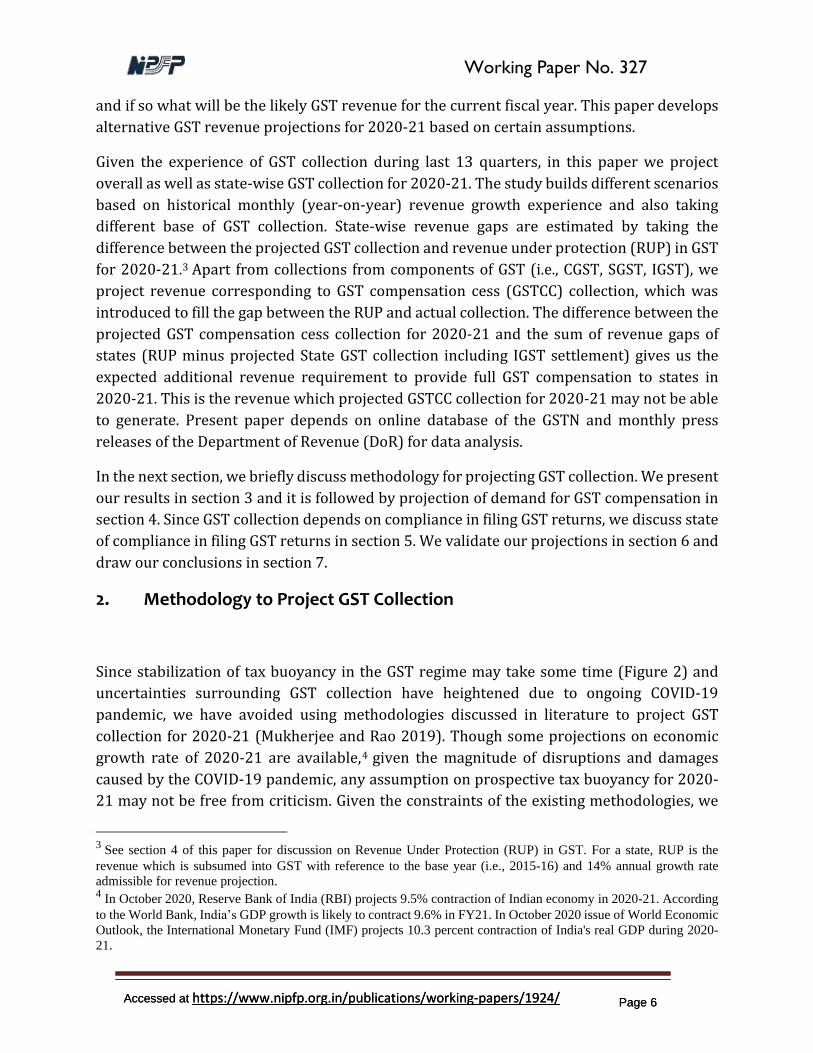
Figure 1: Monthly Year-on-Year Growth Rate in GST Collection (%)
Source: Computed based on data available in the public domain
GST collection in October 2020 shows 17.12 percent growth from the average GST collection
during Q2 (July to September) of 2020-21 (i.e., Rs. 89,784 crore). According to monthly press
releases of the Department of Revenue (DoR), Ministry of Finance, 80 lakh GSTR-3B returns
are submitted in the month of October 2020 as compared to 73.83 lakh in October 2019 and
67.45 lakh in October 2018.2 According GSTN online database, till July 2020 cumulatively
262.15 lakh GSTR-3B returns are filed for 2020-21 (as on 31 August 2020). The
corresponding figure for 2019-20 up to July 2019 was 383.60 lakh and it was 355.47 lakh for
2018-19 (as on 30 June 2020). This shows that pending GSTR-3B returns for 2020-21 are
expected to be filed over the months of the current financial year and therefore
corresponding revenues are expected to be realized. However, it is also expected by some
commentators that cumulative GSTR-3B return submission in 2020-21 may not reach the
level that is achieved in 2019-20, due to impacts of COVID-19 pandemic on economic
activities. They argue that many businesses are still not operating to their full capacity/
potential, therefore it is also expected that average GST collection per GSTR-3B return would
be less in 2020-21 as compared to the previous years. Now the question is whether GST
collection for the remaining months of the current fiscal year will follow a positive growth
2 GSTR-3B returns are monthly consolidated statement of outward, inward supplies (turnovers) and tax liabilities of
taxpayers. Taxpayers pay taxes after adjusting available input tax credits by submitting GSTR-3B returns. GSTR-1
returns are monthly detailed statements of outward supplies of taxpayers.
-75
-65
-55
-45
-35
-25
-15
-5
5
15A
pr
May Jun
Jul
Au
g
Sep
Oct
No
v
Dec Jan
Feb
Mar
2018-19 2019-20 2020-21
Working Paper No. 327
Accessed at https://www.nipfp.org.in/publications/working-papers/1924/ Page 6 Accessed at https://www.nipfp.org.in/publications/working-papers/1924/ Page 6
and if so what will be the likely GST revenue for the current fiscal year. This paper develops
alternative GST revenue projections for 2020-21 based on certain assumptions.
Given the experience of GST collection during last 13 quarters, in this paper we project
overall as well as state-wise GST collection for 2020-21. The study builds different scenarios
based on historical monthly (year-on-year) revenue growth experience and also taking
different base of GST collection. State-wise revenue gaps are estimated by taking the
difference between the projected GST collection and revenue under protection (RUP) in GST
for 2020-21.3 Apart from collections from components of GST (i.e., CGST, SGST, IGST), we
project revenue corresponding to GST compensation cess (GSTCC) collection, which was
introduced to fill the gap between the RUP and actual collection. The difference between the
projected GST compensation cess collection for 2020-21 and the sum of revenue gaps of
states (RUP minus projected State GST collection including IGST settlement) gives us the
expected additional revenue requirement to provide full GST compensation to states in
2020-21. This is the revenue which projected GSTCC collection for 2020-21 may not be able
to generate. Present paper depends on online database of the GSTN and monthly press
releases of the Department of Revenue (DoR) for data analysis.
In the next section, we briefly discuss methodology for projecting GST collection. We present
our results in section 3 and it is followed by projection of demand for GST compensation in
section 4. Since GST collection depends on compliance in filing GST returns, we discuss state
of compliance in filing GST returns in section 5. We validate our projections in section 6 and
draw our conclusions in section 7.
2. Methodology to Project GST Collection
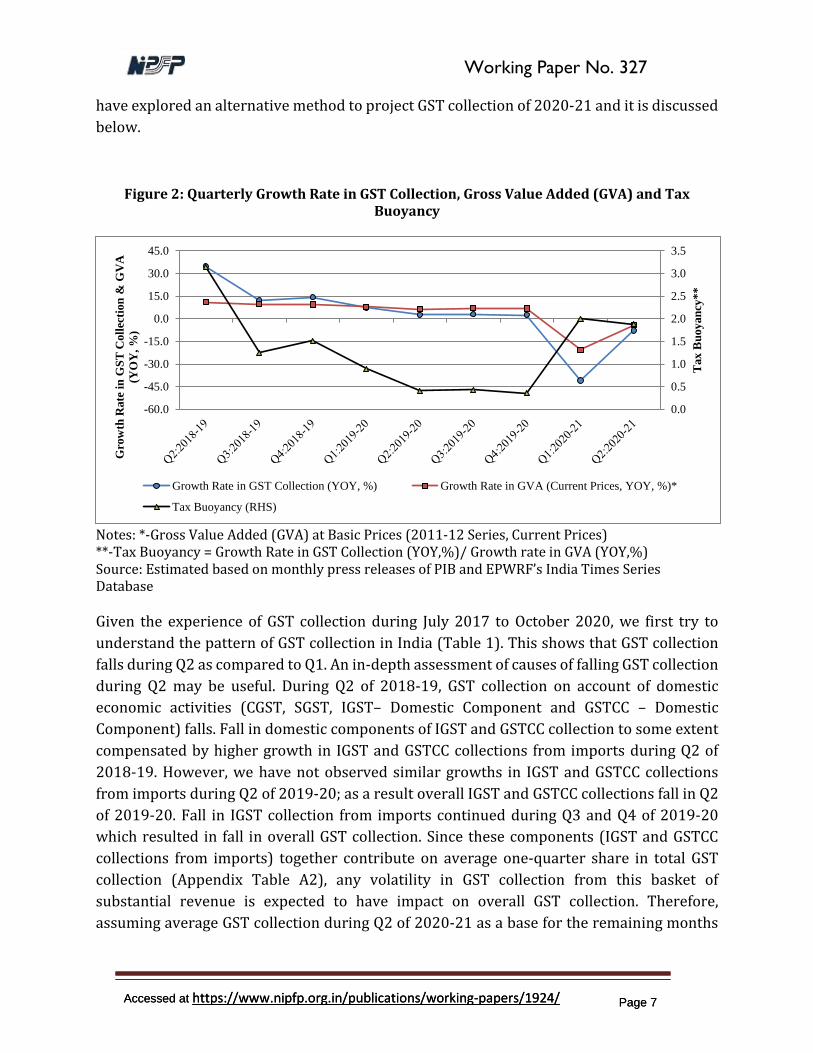
Since stabilization of tax buoyancy in the GST regime may take some time (Figure 2) and
uncertainties surrounding GST collection have heightened due to ongoing COVID-19
pandemic, we have avoided using methodologies discussed in literature to project GST
collection for 2020-21 (Mukherjee and Rao 2019). Though some projections on economic
growth rate of 2020-21 are available,4 given the magnitude of disruptions and damages
caused by the COVID-19 pandemic, any assumption on prospective tax buoyancy for 2020-
21 may not be free from criticism. Given the constraints of the existing methodologies, we
3 See section 4 of this paper for discussion on Revenue Under Protection (RUP) in GST. For a state, RUP is the
revenue which is subsumed into GST with reference to the base year (i.e., 2015-16) and 14% annual growth rate
admissible for revenue projection. 4 In October 2020, Reserve Bank of India (RBI) projects 9.5% contraction of Indian economy in 2020-21. According
to the World Bank, India’s GDP growth is likely to contract 9.6% in FY21. In October 2020 issue of World Economic
Outlook, the International Monetary Fund (IMF) projects 10.3 percent contraction of India's real GDP during 2020-
21.
Working Paper No. 327
Accessed at https://www.nipfp.org.in/publications/working-papers/1924/ Page 7 Accessed at https://www.nipfp.org.in/publications/working-papers/1924/ Page 7
have explored an alternative method to project GST collection of 2020-21 and it is discussed
below.
Figure 2: Quarterly Growth Rate in GST Collection, Gross Value Added (GVA) and Tax Buoyancy
Notes: *-Gross Value Added (GVA) at Basic Prices (2011-12 Series, Current Prices) **-Tax Buoyancy = Growth Rate in GST Collection (YOY,%)/ Growth rate in GVA (YOY,%) Source: Estimated based on monthly press releases of PIB and EPWRF’s India Times Series Database Given the experience of GST collection during July 2017 to October 2020, we first try to
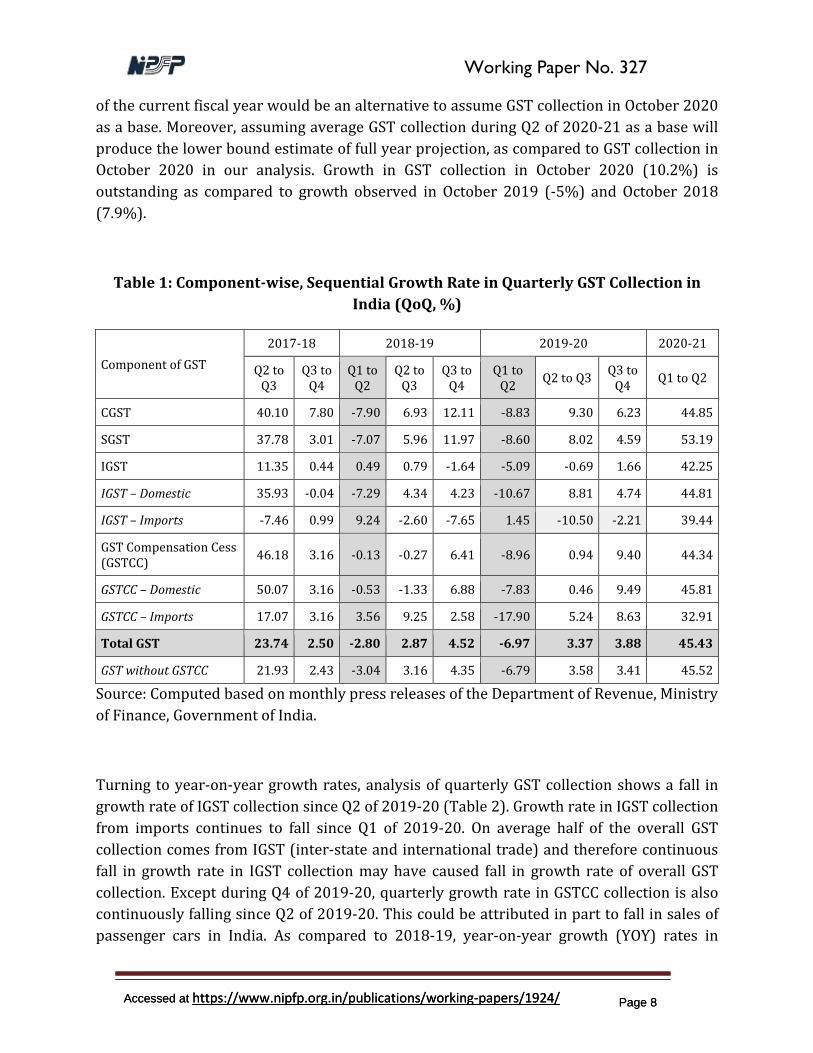
understand the pattern of GST collection in India (Table 1). This shows that GST collection
falls during Q2 as compared to Q1. An in-depth assessment of causes of falling GST collection
during Q2 may be useful. During Q2 of 2018-19, GST collection on account of domestic
economic activities (CGST, SGST, IGST– Domestic Component and GSTCC – Domestic
Component) falls. Fall in domestic components of IGST and GSTCC collection to some extent
compensated by higher growth in IGST and GSTCC collections from imports during Q2 of
2018-19. However, we have not observed similar growths in IGST and GSTCC collections
from imports during Q2 of 2019-20; as a result overall IGST and GSTCC collections fall in Q2
of 2019-20. Fall in IGST collection from imports continued during Q3 and Q4 of 2019-20
which resulted in fall in overall GST collection. Since these components (IGST and GSTCC
collections from imports) together contribute on average one-quarter share in total GST
collection (Appendix Table A2), any volatility in GST collection from this basket of
substantial revenue is expected to have impact on overall GST collection. Therefore,
assuming average GST collection during Q2 of 2020-21 as a base for the remaining months
0.0
0.5
1.0
1.5
2.0
2.5
3.0
3.5
-60.0
-45.0
-30.0
-15.0
0.0
15.0
30.0
45.0
Tax
Bu
oy
an
cy*
*
Gro
wth
Rate
in
GS
T C
oll
ecti
on
& G
VA
(YO
Y,
%)
Growth Rate in GST Collection (YOY, %) Growth Rate in GVA (Current Prices, YOY, %)*
Tax Buoyancy (RHS)
Working Paper No. 327
Accessed at https://www.nipfp.org.in/publications/working-papers/1924/ Page 8 Accessed at https://www.nipfp.org.in/publications/working-papers/1924/ Page 8
of the current fiscal year would be an alternative to assume GST collection in October 2020
as a base. Moreover, assuming average GST collection during Q2 of 2020-21 as a base will
produce the lower bound estimate of full year projection, as compared to GST collection in
October 2020 in our analysis. Growth in GST collection in October 2020 (10.2%) is
outstanding as compared to growth observed in October 2019 (-5%) and October 2018
(7.9%).
Table 1: Component-wise, Sequential Growth Rate in Quarterly GST Collection in
India (QoQ, %)
Component of GST
2017-18 2018-19 2019-20 2020-21
Q2 to Q3
Q3 to Q4
Q1 to Q2
Q2 to Q3
Q3 to Q4
Q1 to Q2
Q2 to Q3 Q3 to
Q4 Q1 to Q2
CGST 40.10 7.80 -7.90 6.93 12.11 -8.83 9.30 6.23 44.85
SGST 37.78 3.01 -7.07 5.96 11.97 -8.60 8.02 4.59 53.19
IGST 11.35 0.44 0.49 0.79 -1.64 -5.09 -0.69 1.66 42.25
IGST – Domestic 35.93 -0.04 -7.29 4.34 4.23 -10.67 8.81 4.74 44.81
IGST – Imports -7.46 0.99 9.24 -2.60 -7.65 1.45 -10.50 -2.21 39.44
GST Compensation Cess (GSTCC)
46.18 3.16 -0.13 -0.27 6.41 -8.96 0.94 9.40 44.34
GSTCC – Domestic 50.07 3.16 -0.53 -1.33 6.88 -7.83 0.46 9.49 45.81
GSTCC – Imports 17.07 3.16 3.56 9.25 2.58 -17.90 5.24 8.63 32.91
Total GST 23.74 2.50 -2.80 2.87 4.52 -6.97 3.37 3.88 45.43
GST without GSTCC 21.93 2.43 -3.04 3.16 4.35 -6.79 3.58 3.41 45.52
Source: Computed based on monthly press releases of the Department of Revenue, Ministry
of Finance, Government of India.
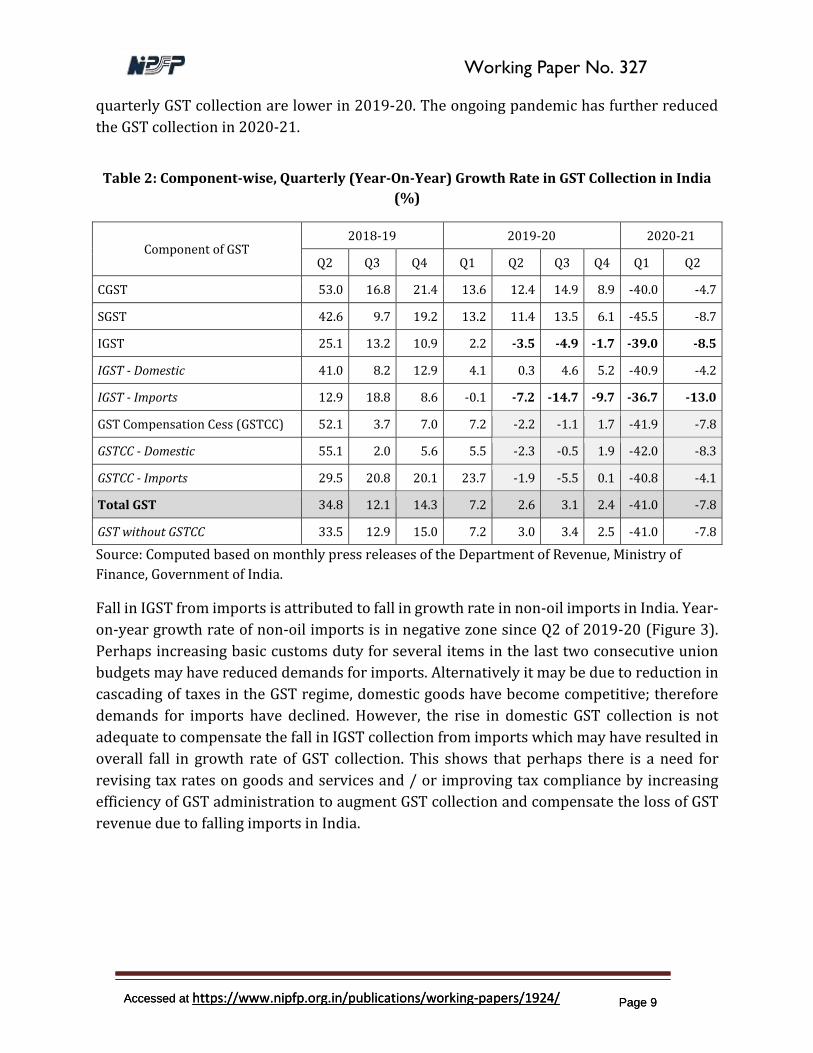
Turning to year-on-year growth rates, analysis of quarterly GST collection shows a fall in
growth rate of IGST collection since Q2 of 2019-20 (Table 2). Growth rate in IGST collection
from imports continues to fall since Q1 of 2019-20. On average half of the overall GST
collection comes from IGST (inter-state and international trade) and therefore continuous
fall in growth rate in IGST collection may have caused fall in growth rate of overall GST
collection. Except during Q4 of 2019-20, quarterly growth rate in GSTCC collection is also
continuously falling since Q2 of 2019-20. This could be attributed in part to fall in sales of
passenger cars in India. As compared to 2018-19, year-on-year growth (YOY) rates in
Working Paper No. 327
Accessed at https://www.nipfp.org.in/publications/working-papers/1924/ Page 9 Accessed at https://www.nipfp.org.in/publications/working-papers/1924/ Page 9
quarterly GST collection are lower in 2019-20. The ongoing pandemic has further reduced
the GST collection in 2020-21.
Table 2: Component-wise, Quarterly (Year-On-Year) Growth Rate in GST Collection in India
(%)
Component of GST 2018-19 2019-20 2020-21
Q2 Q3 Q4 Q1 Q2 Q3 Q4 Q1 Q2
CGST 53.0 16.8 21.4 13.6 12.4 14.9 8.9 -40.0 -4.7
SGST 42.6 9.7 19.2 13.2 11.4 13.5 6.1 -45.5 -8.7
IGST 25.1 13.2 10.9 2.2 -3.5 -4.9 -1.7 -39.0 -8.5
IGST - Domestic 41.0 8.2 12.9 4.1 0.3 4.6 5.2 -40.9 -4.2
IGST - Imports 12.9 18.8 8.6 -0.1 -7.2 -14.7 -9.7 -36.7 -13.0
GST Compensation Cess (GSTCC) 52.1 3.7 7.0 7.2 -2.2 -1.1 1.7 -41.9 -7.8
GSTCC - Domestic 55.1 2.0 5.6 5.5 -2.3 -0.5 1.9 -42.0 -8.3
GSTCC - Imports 29.5 20.8 20.1 23.7 -1.9 -5.5 0.1 -40.8 -4.1
Total GST 34.8 12.1 14.3 7.2 2.6 3.1 2.4 -41.0 -7.8
GST without GSTCC 33.5 12.9 15.0 7.2 3.0 3.4 2.5 -41.0 -7.8
Source: Computed based on monthly press releases of the Department of Revenue, Ministry of
Finance, Government of India.
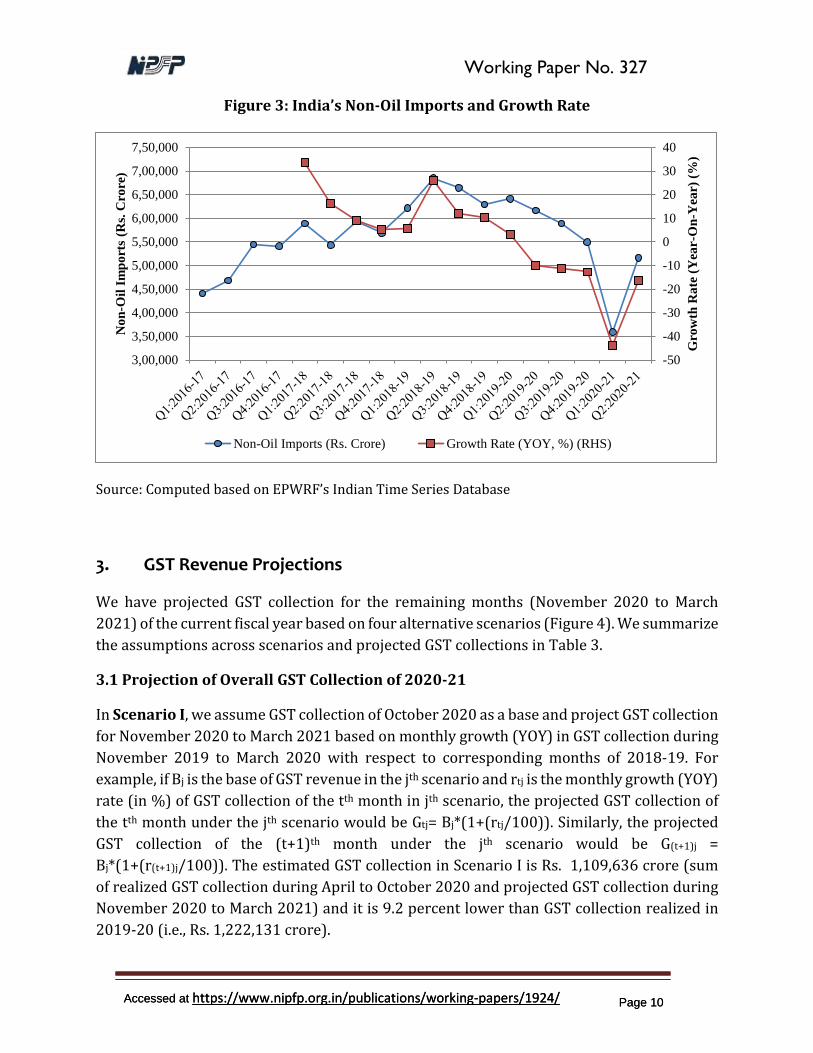
Fall in IGST from imports is attributed to fall in growth rate in non-oil imports in India. Year-
on-year growth rate of non-oil imports is in negative zone since Q2 of 2019-20 (Figure 3).
Perhaps increasing basic customs duty for several items in the last two consecutive union
budgets may have reduced demands for imports. Alternatively it may be due to reduction in
cascading of taxes in the GST regime, domestic goods have become competitive; therefore
demands for imports have declined. However, the rise in domestic GST collection is not
adequate to compensate the fall in IGST collection from imports which may have resulted in
overall fall in growth rate of GST collection. This shows that perhaps there is a need for
revising tax rates on goods and services and / or improving tax compliance by increasing
efficiency of GST administration to augment GST collection and compensate the loss of GST
revenue due to falling imports in India.
Working Paper No. 327
Accessed at https://www.nipfp.org.in/publications/working-papers/1924/ Page 10 Accessed at https://www.nipfp.org.in/publications/working-papers/1924/ Page 10
Figure 3: India’s Non-Oil Imports and Growth Rate
Source: Computed based on EPWRF’s Indian Time Series Database
3. GST Revenue Projections
We have projected GST collection for the remaining months (November 2020 to March
2021) of the current fiscal year based on four alternative scenarios (Figure 4). We summarize
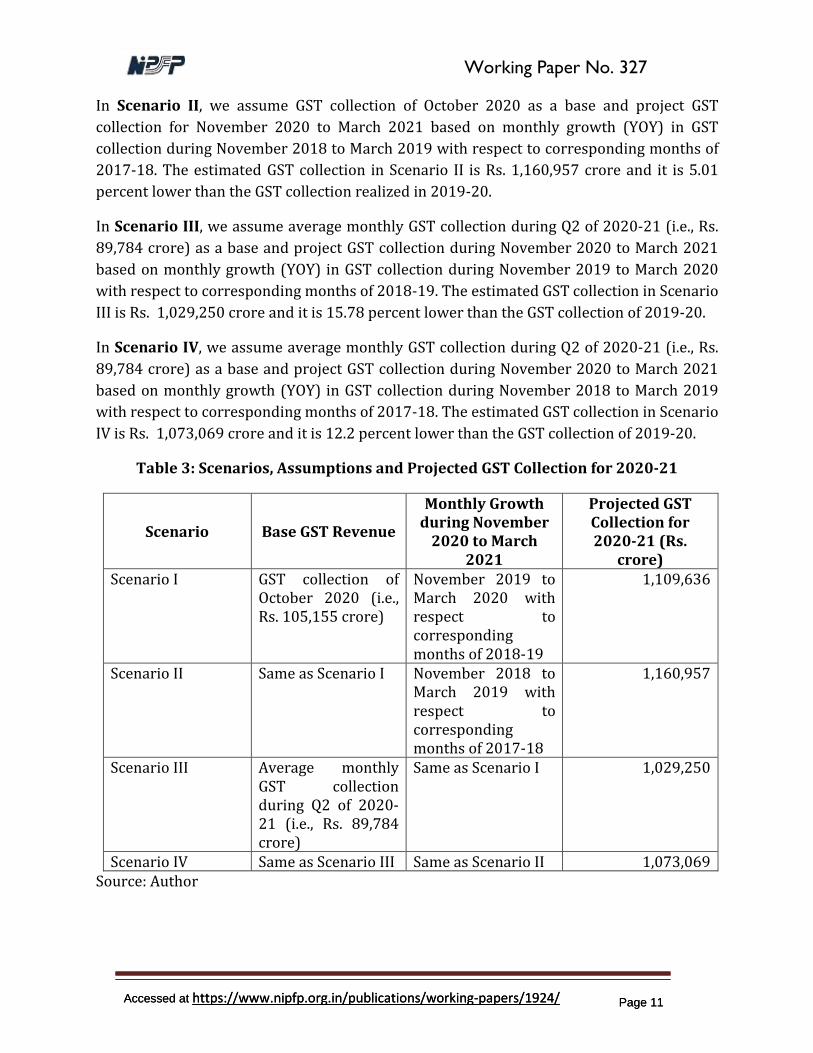
the assumptions across scenarios and projected GST collections in Table 3.
3.1 Projection of Overall GST Collection of 2020-21
In Scenario I, we assume GST collection of October 2020 as a base and project GST collection
for November 2020 to March 2021 based on monthly growth (YOY) in GST collection during
November 2019 to March 2020 with respect to corresponding months of 2018-19. For
example, if Bj is the base of GST revenue in the jth scenario and rtj is the monthly growth (YOY)
rate (in %) of GST collection of the tth month in jth scenario, the projected GST collection of
the tth month under the jth scenario would be Gtj= Bj*(1+(rtj/100)). Similarly, the projected
GST collection of the (t+1)th month under the jth scenario would be G(t+1)j =
Bj*(1+(r(t+1)j/100)). The estimated GST collection in Scenario I is Rs. 1,109,636 crore (sum
of realized GST collection during April to October 2020 and projected GST collection during
November 2020 to March 2021) and it is 9.2 percent lower than GST collection realized in
2019-20 (i.e., Rs. 1,222,131 crore).
-50
-40
-30
-20
-10
0
10
20
30
40
3,00,000
3,50,000
4,00,000
4,50,000
5,00,000
5,50,000
6,00,000
6,50,000
7,00,000
7,50,000
Gro
wth
Ra
te (
Yea
r-O
n-Y
ear)
(%
)
No
n-O
il I
mp
ort
s (R
s. C
rore
)
Non-Oil Imports (Rs. Crore) Growth Rate (YOY, %) (RHS)
Working Paper No. 327
Accessed at https://www.nipfp.org.in/publications/working-papers/1924/ Page 11 Accessed at https://www.nipfp.org.in/publications/working-papers/1924/ Page 11
In Scenario II, we assume GST collection of October 2020 as a base and project GST
collection for November 2020 to March 2021 based on monthly growth (YOY) in GST
collection during November 2018 to March 2019 with respect to corresponding months of
2017-18. The estimated GST collection in Scenario II is Rs. 1,160,957 crore and it is 5.01
percent lower than the GST collection realized in 2019-20.
In Scenario III, we assume average monthly GST collection during Q2 of 2020-21 (i.e., Rs.
89,784 crore) as a base and project GST collection during November 2020 to March 2021
based on monthly growth (YOY) in GST collection during November 2019 to March 2020
with respect to corresponding months of 2018-19. The estimated GST collection in Scenario
III is Rs. 1,029,250 crore and it is 15.78 percent lower than the GST collection of 2019-20.
In Scenario IV, we assume average monthly GST collection during Q2 of 2020-21 (i.e., Rs.
89,784 crore) as a base and project GST collection during November 2020 to March 2021
based on monthly growth (YOY) in GST collection during November 2018 to March 2019
with respect to corresponding months of 2017-18. The estimated GST collection in Scenario
IV is Rs. 1,073,069 crore and it is 12.2 percent lower than the GST collection of 2019-20.
Table 3: Scenarios, Assumptions and Projected GST Collection for 2020-21
Scenario Base GST Revenue
Monthly Growth during November
2020 to March 2021
Projected GST Collection for 2020-21 (Rs.
crore) Scenario I GST collection of
October 2020 (i.e., Rs. 105,155 crore)
November 2019 to March 2020 with respect to corresponding months of 2018-19
1,109,636
Scenario II Same as Scenario I November 2018 to March 2019 with respect to corresponding months of 2017-18
1,160,957
Scenario III Average monthly GST collection during Q2 of 2020-21 (i.e., Rs. 89,784 crore)
Same as Scenario I 1,029,250
Scenario IV Same as Scenario III Same as Scenario II 1,073,069 Source: Author
Working Paper No. 327
Accessed at https://www.nipfp.org.in/publications/working-papers/1924/ Page 12 Accessed at https://www.nipfp.org.in/publications/working-papers/1924/ Page 12
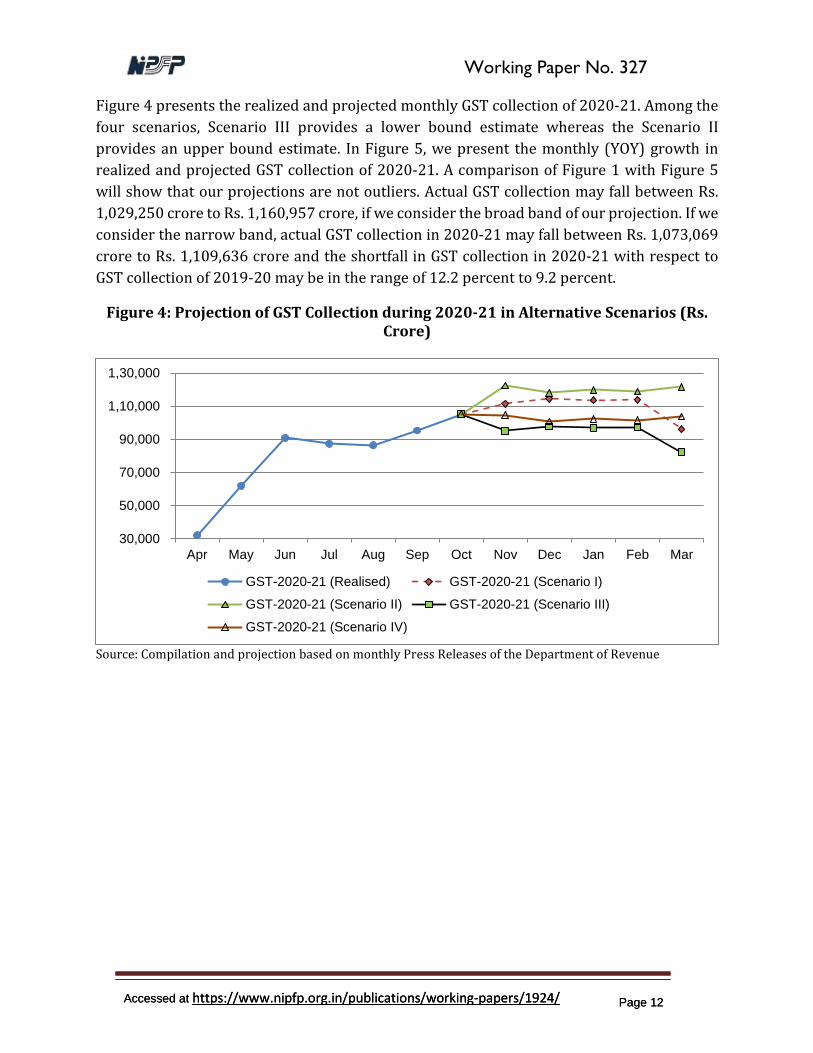
Figure 4 presents the realized and projected monthly GST collection of 2020-21. Among the
four scenarios, Scenario III provides a lower bound estimate whereas the Scenario II
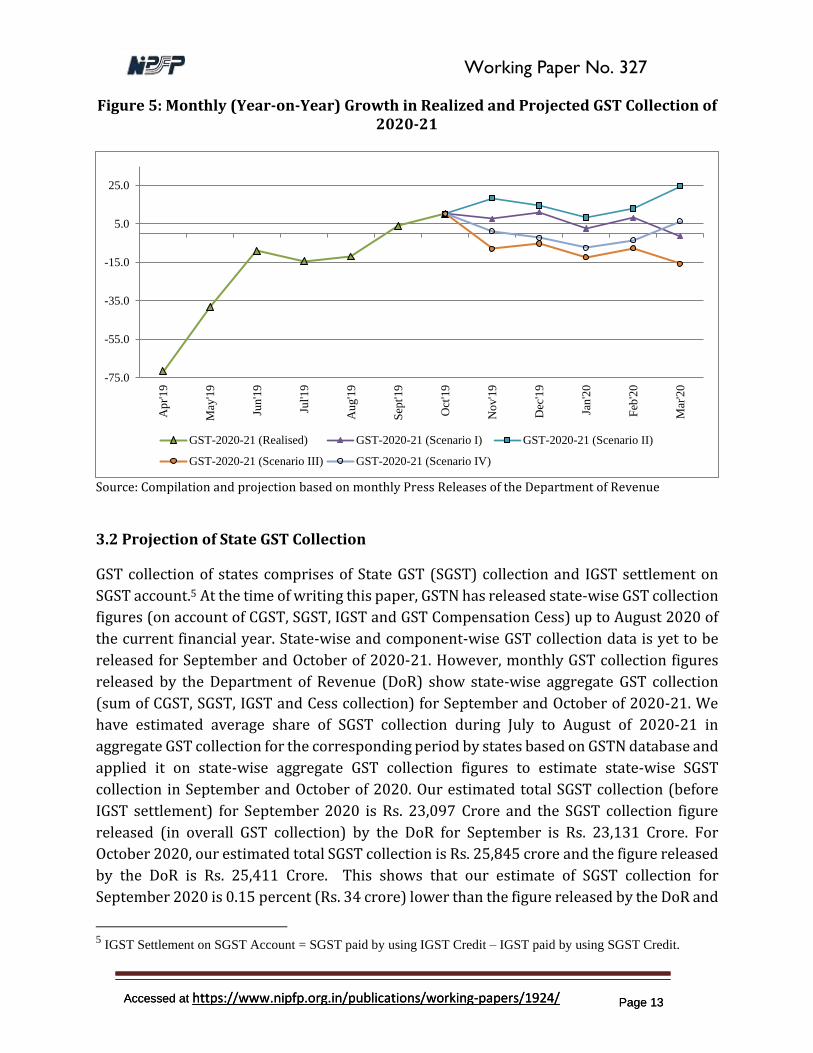
provides an upper bound estimate. In Figure 5, we present the monthly (YOY) growth in
realized and projected GST collection of 2020-21. A comparison of Figure 1 with Figure 5
will show that our projections are not outliers. Actual GST collection may fall between Rs.
1,029,250 crore to Rs. 1,160,957 crore, if we consider the broad band of our projection. If we
consider the narrow band, actual GST collection in 2020-21 may fall between Rs. 1,073,069
crore to Rs. 1,109,636 crore and the shortfall in GST collection in 2020-21 with respect to
GST collection of 2019-20 may be in the range of 12.2 percent to 9.2 percent.
Figure 4: Projection of GST Collection during 2020-21 in Alternative Scenarios (Rs. Crore)
Source: Compilation and projection based on monthly Press Releases of the Department of Revenue
30,000
50,000
70,000
90,000
1,10,000
1,30,000
Apr May Jun Jul Aug Sep Oct Nov Dec Jan Feb Mar
GST-2020-21 (Realised) GST-2020-21 (Scenario I)
GST-2020-21 (Scenario II) GST-2020-21 (Scenario III)
GST-2020-21 (Scenario IV)
Working Paper No. 327
Accessed at https://www.nipfp.org.in/publications/working-papers/1924/ Page 13 Accessed at https://www.nipfp.org.in/publications/working-papers/1924/ Page 13
Figure 5: Monthly (Year-on-Year) Growth in Realized and Projected GST Collection of 2020-21
Source: Compilation and projection based on monthly Press Releases of the Department of Revenue
3.2 Projection of State GST Collection
GST collection of states comprises of State GST (SGST) collection and IGST settlement on
SGST account.5 At the time of writing this paper, GSTN has released state-wise GST collection
figures (on account of CGST, SGST, IGST and GST Compensation Cess) up to August 2020 of
the current financial year. State-wise and component-wise GST collection data is yet to be
released for September and October of 2020-21. However, monthly GST collection figures
released by the Department of Revenue (DoR) show state-wise aggregate GST collection
(sum of CGST, SGST, IGST and Cess collection) for September and October of 2020-21. We
have estimated average share of SGST collection during July to August of 2020-21 in
aggregate GST collection for the corresponding period by states based on GSTN database and
applied it on state-wise aggregate GST collection figures to estimate state-wise SGST
collection in September and October of 2020. Our estimated total SGST collection (before
IGST settlement) for September 2020 is Rs. 23,097 Crore and the SGST collection figure
released (in overall GST collection) by the DoR for September is Rs. 23,131 Crore. For
October 2020, our estimated total SGST collection is Rs. 25,845 crore and the figure released
by the DoR is Rs. 25,411 Crore. This shows that our estimate of SGST collection for
September 2020 is 0.15 percent (Rs. 34 crore) lower than the figure released by the DoR and
5 IGST Settlement on SGST Account = SGST paid by using IGST Credit – IGST paid by using SGST Credit.
-75.0
-55.0
-35.0
-15.0
5.0
25.0
Ap
r'1
9
May
'19
Jun'1
9
Jul'1
9
Au
g'1
9
Sep
t'19
Oct
'19
No
v'1
9
Dec
'19
Jan
'20
Feb
'20
Mar
'20
GST-2020-21 (Realised) GST-2020-21 (Scenario I) GST-2020-21 (Scenario II)
GST-2020-21 (Scenario III) GST-2020-21 (Scenario IV)
Working Paper No. 327
Accessed at https://www.nipfp.org.in/publications/working-papers/1924/ Page 14 Accessed at https://www.nipfp.org.in/publications/working-papers/1924/ Page 14
for October 2020 it is 1.71 percent (Rs. 434 crore) higher than the figure released by the DoR.
The differences between our estimates and the figures released by the DoR are not
substantial to change revenue profiles of states.
GSTN has also released State-wise IGST settlement on SGST account for the period April to
August 2020-21. To estimate state-wise IGST settlement corresponding to September and
October of 2020-21, we first estimate the average percentage share of a state in total IGST
settlement allocated to SGST account during July to August of 2020-21. In the next step, we
apply the share in aggregate IGST settlement figures (on account of SGST) of September and
October of 2020-21 as released by the DoR in monthly GST collection statements, to estimate
the state-wise IGST settlement. We add up state-wise SGST collection and IGST settlement
figures for the period April to October of 2020 and also estimate average state GST and IGST
settlement figures for July to September of 2020-21 to use as base in revenue projections.
In Scenario I, we estimate monthly growth (YOY) in state-wise SGST collection (including
IGST settlement) during November 2019 to March 2020 with respect to corresponding
months of 2018-19. We apply the monthly growth rates to base revenue, which is the SGST
collection (including IGST settlement) realized in the month of October 2020, to project GST
collection during November 2020 to March 2021. The sum of realized SGST collection
(including IGST settlement) during April to October 2020 and projected SGST collection
(including IGST settlement) during November 2020 to March 2021 gives us the expected
state GST collection of 2020-21.
In Scenario II, we estimate monthly growth (YOY) in state-wise SGST collection (including
IGST settlement) during November 2018 to March 2019 with respect to corresponding
months of 2017-18. We apply the monthly growth rates to base revenue, which is the SGST
collection (including IGST settlement) realized in the month of October 2020, to project GST
collection during November 2020 to March 2021. The sum of realized SGST collection
(including IGST settlement) during April to October 2020 and projected SGST collection
(including IGST settlement) during November 2020 to March 2021 gives us the expected
state GST collection of 2020-21.
For projection under Scenario III, we estimate monthly growth in state-wise SGST collection
(including IGST settlement) during November 2019 to March 2020 with respect to
corresponding monthly figures of 2018-19. We apply monthly growth rates to base revenue,
which is the average monthly SGST collection (including IGST settlement) during July to
September of 2020, to project state GST collection during November 2020 to March 20201.
In Scenario IV, we estimate monthly growth in state-wise SGST collection (including IGST
settlement) during November 2018 to March 2019 with respect to corresponding months of
2017-18. We apply the growth rates to base revenue, which is the average monthly SGST
Working Paper No. 327
Accessed at https://www.nipfp.org.in/publications/working-papers/1924/ Page 15 Accessed at https://www.nipfp.org.in/publications/working-papers/1924/ Page 15
collection (including IGST settlement) during July to September of 2020, to project state GST
collection during November 2020 to March 2021.
For ease of presentation, we classify the states into two categories – major states comprising
of erstwhile general category states and minor states comprising of North-Eastern and hilly
states and United Territories with legislative assembly.
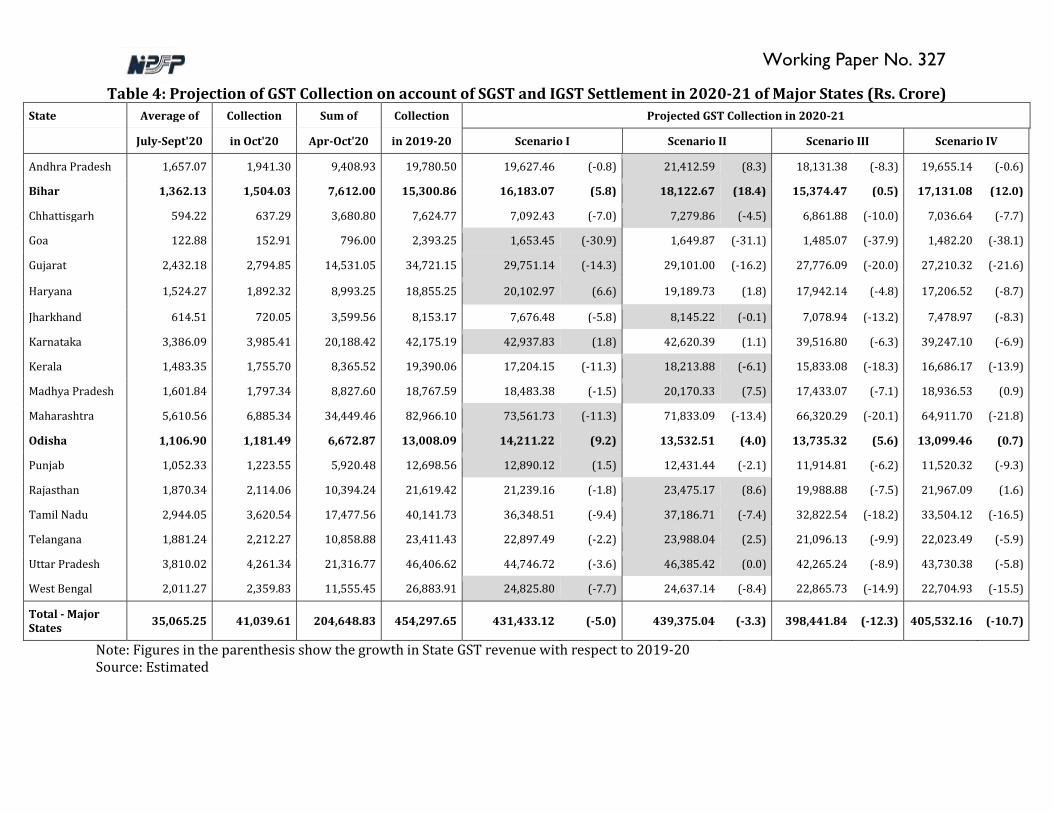
Major state-wise projections of GST collection in 2020-21 are presented in Table 4. This
shows that all states do not follow the same growth path in GST collection, e.g., Andhra
Pradesh, Bihar and Chhattisgarh are expected to do better in one scenario whereas Goa,
Gujarat and Haryana are expected to do better in another scenario. Among all major states,
only Bihar and Odisha are expected to have positive growth in State GST collection across all
scenarios. Aggregate GST collection of major states in 2020-21 may fall short of 3.3 percent
to 12.3 percent of GST collection of 2019-20. However, different states may have different
shortfall depending on growth in GST collection that would be realized during November
2020 to March 2021.
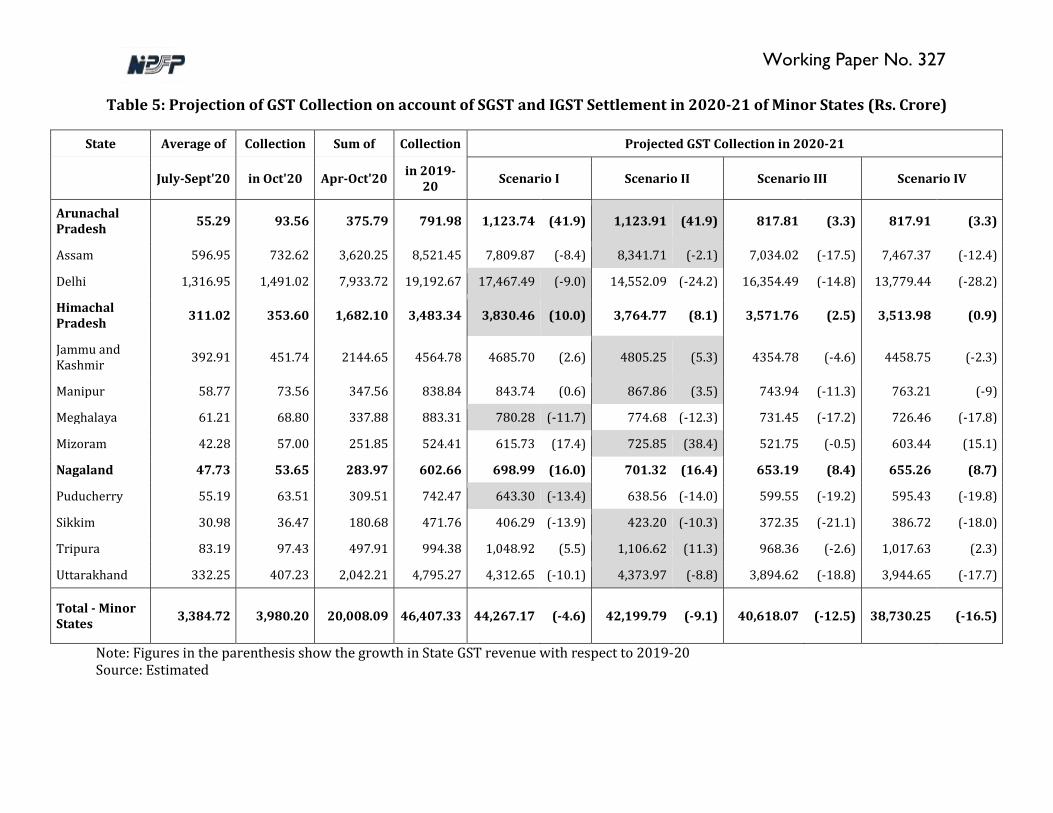
Like major states, growth path in GST collection varies across minor states and some states
are expected to do better in alternative scenarios (Table 5). Among all minor states, Himachal
Pradesh and Nagaland are expected to have positive growth in state GST collection across all
scenarios. Aggregate GST collection in 2020-21 of minor states may fall short of 4.6 percent
to 16.5 percent of GST collection of 2019-20.
The wide range in projected GST collection of 2020-21 may be considered as the likely band
in which actual GST collection may lie. Given the challenges involved in projection of GST and
uncertainties created by the ongoing pandemic, this is an attempt to explore alternative
methodology for GST revenue projection. We are hopeful that with stabilization of the GST
system and better availability of long time series data of GST collection, better projections
could be made. Availability of quarterly data of Gross State Value Addition (GSVA) and other
high frequency indicators may help to refine the projections and also contain the range of
the projected values.
Working Paper No. 327
Table 4: Projection of GST Collection on account of SGST and IGST Settlement in 2020-21 of Major States (Rs. Crore)
State Average of Collection Sum of Collection Projected GST Collection in 2020-21
July-Sept'20 in Oct'20 Apr-Oct'20 in 2019-20 Scenario I Scenario II Scenario III Scenario IV
Andhra Pradesh 1,657.07 1,941.30 9,408.93 19,780.50 19,627.46 (-0.8) 21,412.59 (8.3) 18,131.38 (-8.3) 19,655.14 (-0.6)
Bihar 1,362.13 1,504.03 7,612.00 15,300.86 16,183.07 (5.8) 18,122.67 (18.4) 15,374.47 (0.5) 17,131.08 (12.0)
Chhattisgarh 594.22 637.29 3,680.80 7,624.77 7,092.43 (-7.0) 7,279.86 (-4.5) 6,861.88 (-10.0) 7,036.64 (-7.7)
Goa 122.88 152.91 796.00 2,393.25 1,653.45 (-30.9) 1,649.87 (-31.1) 1,485.07 (-37.9) 1,482.20 (-38.1)
Gujarat 2,432.18 2,794.85 14,531.05 34,721.15 29,751.14 (-14.3) 29,101.00 (-16.2) 27,776.09 (-20.0) 27,210.32 (-21.6)
Haryana 1,524.27 1,892.32 8,993.25 18,855.25 20,102.97 (6.6) 19,189.73 (1.8) 17,942.14 (-4.8) 17,206.52 (-8.7)
Jharkhand 614.51 720.05 3,599.56 8,153.17 7,676.48 (-5.8) 8,145.22 (-0.1) 7,078.94 (-13.2) 7,478.97 (-8.3)
Karnataka 3,386.09 3,985.41 20,188.42 42,175.19 42,937.83 (1.8) 42,620.39 (1.1) 39,516.80 (-6.3) 39,247.10 (-6.9)
Kerala 1,483.35 1,755.70 8,365.52 19,390.06 17,204.15 (-11.3) 18,213.88 (-6.1) 15,833.08 (-18.3) 16,686.17 (-13.9)
Madhya Pradesh 1,601.84 1,797.34 8,827.60 18,767.59 18,483.38 (-1.5) 20,170.33 (7.5) 17,433.07 (-7.1) 18,936.53 (0.9)
Maharashtra 5,610.56 6,885.34 34,449.46 82,966.10 73,561.73 (-11.3) 71,833.09 (-13.4) 66,320.29 (-20.1) 64,911.70 (-21.8)
Odisha 1,106.90 1,181.49 6,672.87 13,008.09 14,211.22 (9.2) 13,532.51 (4.0) 13,735.32 (5.6) 13,099.46 (0.7)
Punjab 1,052.33 1,223.55 5,920.48 12,698.56 12,890.12 (1.5) 12,431.44 (-2.1) 11,914.81 (-6.2) 11,520.32 (-9.3)
Rajasthan 1,870.34 2,114.06 10,394.24 21,619.42 21,239.16 (-1.8) 23,475.17 (8.6) 19,988.88 (-7.5) 21,967.09 (1.6)
Tamil Nadu 2,944.05 3,620.54 17,477.56 40,141.73 36,348.51 (-9.4) 37,186.71 (-7.4) 32,822.54 (-18.2) 33,504.12 (-16.5)
Telangana 1,881.24 2,212.27 10,858.88 23,411.43 22,897.49 (-2.2) 23,988.04 (2.5) 21,096.13 (-9.9) 22,023.49 (-5.9)
Uttar Pradesh 3,810.02 4,261.34 21,316.77 46,406.62 44,746.72 (-3.6) 46,385.42 (0.0) 42,265.24 (-8.9) 43,730.38 (-5.8)
West Bengal 2,011.27 2,359.83 11,555.45 26,883.91 24,825.80 (-7.7) 24,637.14 (-8.4) 22,865.73 (-14.9) 22,704.93 (-15.5)
Total - Major States
35,065.25 41,039.61 204,648.83 454,297.65 431,433.12 (-5.0) 439,375.04 (-3.3) 398,441.84 (-12.3) 405,532.16 (-10.7)
Note: Figures in the parenthesis show the growth in State GST revenue with respect to 2019-20 Source: Estimated
Working Paper No. 327
Table 5: Projection of GST Collection on account of SGST and IGST Settlement in 2020-21 of Minor States (Rs. Crore)
State Average of Collection Sum of Collection Projected GST Collection in 2020-21
July-Sept'20 in Oct'20 Apr-Oct'20 in 2019-
20 Scenario I Scenario II Scenario III Scenario IV
Arunachal Pradesh
55.29 93.56 375.79 791.98 1,123.74 (41.9) 1,123.91 (41.9) 817.81 (3.3) 817.91 (3.3)
Assam 596.95 732.62 3,620.25 8,521.45 7,809.87 (-8.4) 8,341.71 (-2.1) 7,034.02 (-17.5) 7,467.37 (-12.4)
Delhi 1,316.95 1,491.02 7,933.72 19,192.67 17,467.49 (-9.0) 14,552.09 (-24.2) 16,354.49 (-14.8) 13,779.44 (-28.2)
Himachal Pradesh
311.02 353.60 1,682.10 3,483.34 3,830.46 (10.0) 3,764.77 (8.1) 3,571.76 (2.5) 3,513.98 (0.9)
Jammu and Kashmir
392.91 451.74 2144.65 4564.78 4685.70 (2.6) 4805.25 (5.3) 4354.78 (-4.6) 4458.75 (-2.3)
Manipur 58.77 73.56 347.56 838.84 843.74 (0.6) 867.86 (3.5) 743.94 (-11.3) 763.21 (-9)
Meghalaya 61.21 68.80 337.88 883.31 780.28 (-11.7) 774.68 (-12.3) 731.45 (-17.2) 726.46 (-17.8)
Mizoram 42.28 57.00 251.85 524.41 615.73 (17.4) 725.85 (38.4) 521.75 (-0.5) 603.44 (15.1)
Nagaland 47.73 53.65 283.97 602.66 698.99 (16.0) 701.32 (16.4) 653.19 (8.4) 655.26 (8.7)
Puducherry 55.19 63.51 309.51 742.47 643.30 (-13.4) 638.56 (-14.0) 599.55 (-19.2) 595.43 (-19.8)
Sikkim 30.98 36.47 180.68 471.76 406.29 (-13.9) 423.20 (-10.3) 372.35 (-21.1) 386.72 (-18.0)
Tripura 83.19 97.43 497.91 994.38 1,048.92 (5.5) 1,106.62 (11.3) 968.36 (-2.6) 1,017.63 (2.3)
Uttarakhand 332.25 407.23 2,042.21 4,795.27 4,312.65 (-10.1) 4,373.97 (-8.8) 3,894.62 (-18.8) 3,944.65 (-17.7)
Total - Minor States
3,384.72 3,980.20 20,008.09 46,407.33 44,267.17 (-4.6) 42,199.79 (-9.1) 40,618.07 (-12.5) 38,730.25 (-16.5)
Note: Figures in the parenthesis show the growth in State GST revenue with respect to 2019-20 Source: Estimated
Working Paper No. 327
Accessed at https://www.nipfp.org.in/publications/working-papers/1924/ Page 18 Accessed at https://www.nipfp.org.in/publications/working-papers/1924/ Page 18
4. Projection of Demand for GST Compensation
According to the Goods and Services Tax (Compensation to States) Act 2017, states will
receive GST compensation during the transition period of GST (first five years of GST
introduction), if State GST (SGST collection including receipts of Integrated GST settlement
on account of SGST) revenue falls short of the projected revenue collection. The projection
of state revenue in GST is based on revenue that is subsumed in GST (also known as revenue
under protection in GST) in the base year 2015-16 and 14 percent annual growth rate (YOY)
in the revenue under protection during the GST transition period. Therefore, if a state’s
revenue under protection is expressed as ‘R’ in the year 2015-16, the projected revenue
would be 1.14R in 2016-17, and (1.14)2R in 2017-18, (1.14)3R in 2018-19 and so on.
Many commentators believe that 14 percent annual growth in GST revenue projection was
too generous promise, as not many states had a growth rate of subsumed taxes higher than
14 percent during 2012-13 to 2016-17, with most of them falling in the 5 percent to 12
percent growth rate band (Gupta and Rajaraman 2020). Perhaps the basic premise of
promising to give compensation at 14 percent growth was based on the expectation of
improvement in tax compliance, as experienced in most countries where VAT/ GST was
introduced and consequently termed VAT as “money machine” (Keen 2007). However,
Indian GST system is yet to be stabilized and the ongoing pandemic may delay the
stabilization.
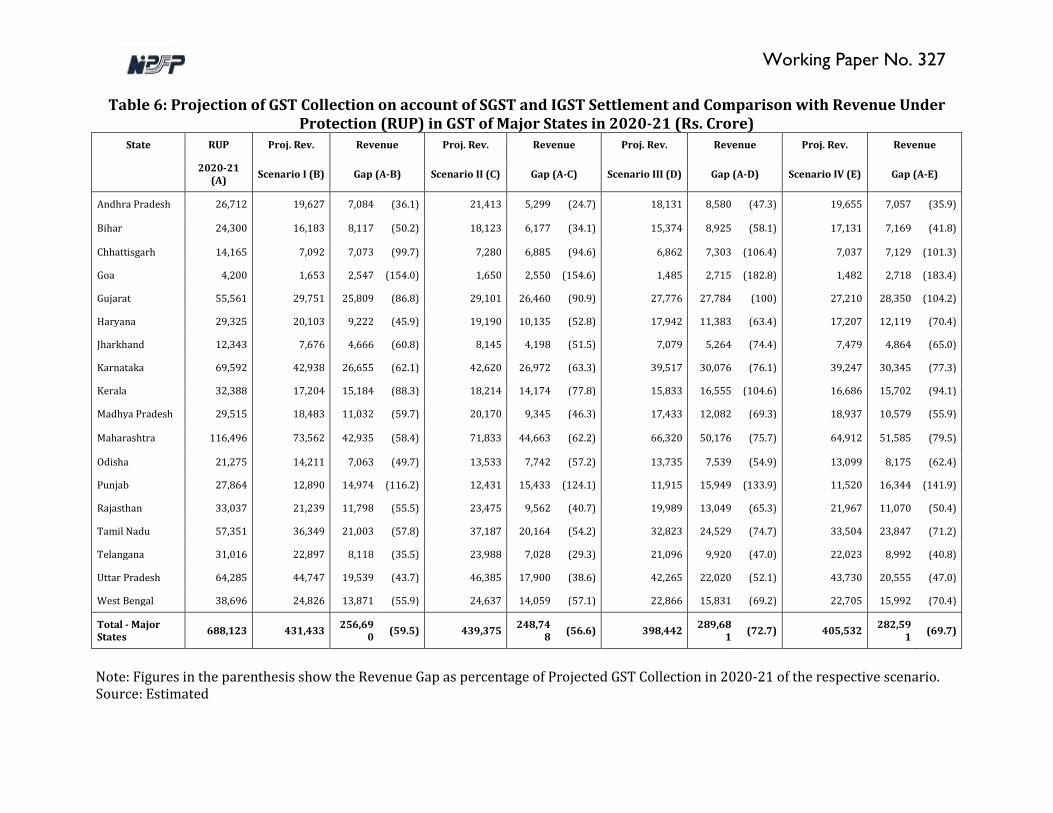
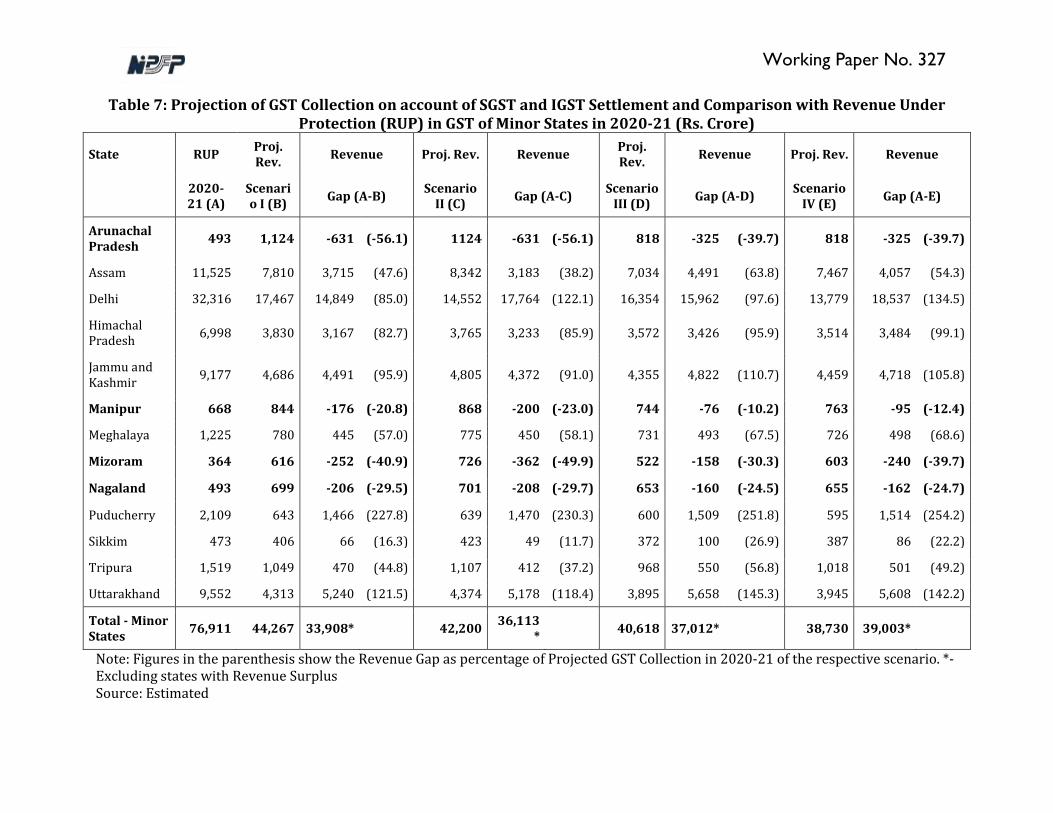
Based on state-wise revenue subsumed in GST with reference to 2015-16, 6 we present
revenue under protection for 2020-21 in Table 6 and Table 7 for major and minor states
respectively. The difference between state-wise revenue under protection and projected GST
collection in 2020-21 gives us the expected revenue gap for 2020-21.
Table 6 shows that maximum revenue gaps are expected for Goa, Punjab, Chhattisgarh,
Kerala and Chhattisgarh. Overall revenue gap of major states will vary between Rs. 2.5 lakh
crore to Rs. 2.9 lakh crore. Some minor states are expected to have revenue surplus across
all scenarios, e.g., Arunachal Pradesh, Manipur, Mizoram and Nagaland (Table 7). Among
minor states, highest revenue gaps are expected for Puducherry, Uttarakhand, Delhi and
Jammu and Kashmir. Overall revenue gap of minor states (excluding revenue surplus states)
will vary between Rs. 32,644 crore to Rs. 42,200 crore. In addition to generous promise of
revenue protection in GST, the reason for high revenue gap in the current fiscal year is also
attributed to economic hardship caused by the ongoing pandemic as well as falling year-on-
year growth rate of GVA since Q3 of 2018-19 (Appendix Table A1).
6
https://tutorial.gst.gov.in/offlineutilities/gst_statistics/Yearwise-Pre-GST-revenue.pdf (last accessed on 12 December 2020).
Working Paper No. 327
Table 6: Projection of GST Collection on account of SGST and IGST Settlement and Comparison with Revenue Under Protection (RUP) in GST of Major States in 2020-21 (Rs. Crore)
State RUP Proj. Rev. Revenue Proj. Rev. Revenue Proj. Rev. Revenue Proj. Rev. Revenue
2020-21
(A) Scenario I (B) Gap (A-B) Scenario II (C) Gap (A-C) Scenario III (D) Gap (A-D) Scenario IV (E) Gap (A-E)
Andhra Pradesh 26,712 19,627 7,084 (36.1) 21,413 5,299 (24.7) 18,131 8,580 (47.3) 19,655 7,057 (35.9)
Bihar 24,300 16,183 8,117 (50.2) 18,123 6,177 (34.1) 15,374 8,925 (58.1) 17,131 7,169 (41.8)
Chhattisgarh 14,165 7,092 7,073 (99.7) 7,280 6,885 (94.6) 6,862 7,303 (106.4) 7,037 7,129 (101.3)
Goa 4,200 1,653 2,547 (154.0) 1,650 2,550 (154.6) 1,485 2,715 (182.8) 1,482 2,718 (183.4)
Gujarat 55,561 29,751 25,809 (86.8) 29,101 26,460 (90.9) 27,776 27,784 (100) 27,210 28,350 (104.2)
Haryana 29,325 20,103 9,222 (45.9) 19,190 10,135 (52.8) 17,942 11,383 (63.4) 17,207 12,119 (70.4)
Jharkhand 12,343 7,676 4,666 (60.8) 8,145 4,198 (51.5) 7,079 5,264 (74.4) 7,479 4,864 (65.0)
Karnataka 69,592 42,938 26,655 (62.1) 42,620 26,972 (63.3) 39,517 30,076 (76.1) 39,247 30,345 (77.3)
Kerala 32,388 17,204 15,184 (88.3) 18,214 14,174 (77.8) 15,833 16,555 (104.6) 16,686 15,702 (94.1)
Madhya Pradesh 29,515 18,483 11,032 (59.7) 20,170 9,345 (46.3) 17,433 12,082 (69.3) 18,937 10,579 (55.9)
Maharashtra 116,496 73,562 42,935 (58.4) 71,833 44,663 (62.2) 66,320 50,176 (75.7) 64,912 51,585 (79.5)
Odisha 21,275 14,211 7,063 (49.7) 13,533 7,742 (57.2) 13,735 7,539 (54.9) 13,099 8,175 (62.4)
Punjab 27,864 12,890 14,974 (116.2) 12,431 15,433 (124.1) 11,915 15,949 (133.9) 11,520 16,344 (141.9)
Rajasthan 33,037 21,239 11,798 (55.5) 23,475 9,562 (40.7) 19,989 13,049 (65.3) 21,967 11,070 (50.4)
Tamil Nadu 57,351 36,349 21,003 (57.8) 37,187 20,164 (54.2) 32,823 24,529 (74.7) 33,504 23,847 (71.2)
Telangana 31,016 22,897 8,118 (35.5) 23,988 7,028 (29.3) 21,096 9,920 (47.0) 22,023 8,992 (40.8)
Uttar Pradesh 64,285 44,747 19,539 (43.7) 46,385 17,900 (38.6) 42,265 22,020 (52.1) 43,730 20,555 (47.0)
West Bengal 38,696 24,826 13,871 (55.9) 24,637 14,059 (57.1) 22,866 15,831 (69.2) 22,705 15,992 (70.4)
Total - Major States 688,123 431,433 256,69
0 (59.5) 439,375 248,748 (56.6) 398,442 289,68
1 (72.7) 405,532 282,591 (69.7)
Note: Figures in the parenthesis show the Revenue Gap as percentage of Projected GST Collection in 2020-21 of the respective scenario. Source: Estimated
Working Paper No. 327
Table 7: Projection of GST Collection on account of SGST and IGST Settlement and Comparison with Revenue Under Protection (RUP) in GST of Minor States in 2020-21 (Rs. Crore)
State RUP Proj. Rev.
Revenue Proj. Rev. Revenue Proj. Rev.
Revenue Proj. Rev. Revenue
2020-21 (A)
Scenario I (B)
Gap (A-B) Scenario
II (C) Gap (A-C)
Scenario III (D)
Gap (A-D) Scenario
IV (E) Gap (A-E)
Arunachal Pradesh
493 1,124 -631 (-56.1) 1124 -631 (-56.1) 818 -325 (-39.7) 818 -325 (-39.7)
Assam 11,525 7,810 3,715 (47.6) 8,342 3,183 (38.2) 7,034 4,491 (63.8) 7,467 4,057 (54.3)
Delhi 32,316 17,467 14,849 (85.0) 14,552 17,764 (122.1) 16,354 15,962 (97.6) 13,779 18,537 (134.5)
Himachal Pradesh
6,998 3,830 3,167 (82.7) 3,765 3,233 (85.9) 3,572 3,426 (95.9) 3,514 3,484 (99.1)
Jammu and Kashmir
9,177 4,686 4,491 (95.9) 4,805 4,372 (91.0) 4,355 4,822 (110.7) 4,459 4,718 (105.8)
Manipur 668 844 -176 (-20.8) 868 -200 (-23.0) 744 -76 (-10.2) 763 -95 (-12.4)
Meghalaya 1,225 780 445 (57.0) 775 450 (58.1) 731 493 (67.5) 726 498 (68.6)
Mizoram 364 616 -252 (-40.9) 726 -362 (-49.9) 522 -158 (-30.3) 603 -240 (-39.7)
Nagaland 493 699 -206 (-29.5) 701 -208 (-29.7) 653 -160 (-24.5) 655 -162 (-24.7)
Puducherry 2,109 643 1,466 (227.8) 639 1,470 (230.3) 600 1,509 (251.8) 595 1,514 (254.2)
Sikkim 473 406 66 (16.3) 423 49 (11.7) 372 100 (26.9) 387 86 (22.2)
Tripura 1,519 1,049 470 (44.8) 1,107 412 (37.2) 968 550 (56.8) 1,018 501 (49.2)
Uttarakhand 9,552 4,313 5,240 (121.5) 4,374 5,178 (118.4) 3,895 5,658 (145.3) 3,945 5,608 (142.2)
Total - Minor States
76,911 44,267 33,908* 42,200 36,113
* 40,618 37,012* 38,730 39,003*
Note: Figures in the parenthesis show the Revenue Gap as percentage of Projected GST Collection in 2020-21 of the respective scenario. *- Excluding states with Revenue Surplus Source: Estimated
Accessed at https://www.nipfp.org.in/publications/working-papers/1924/ Page 21 Accessed at https://www.nipfp.org.in/publications/working-papers/1924/ Page 21
Working Paper No. 327
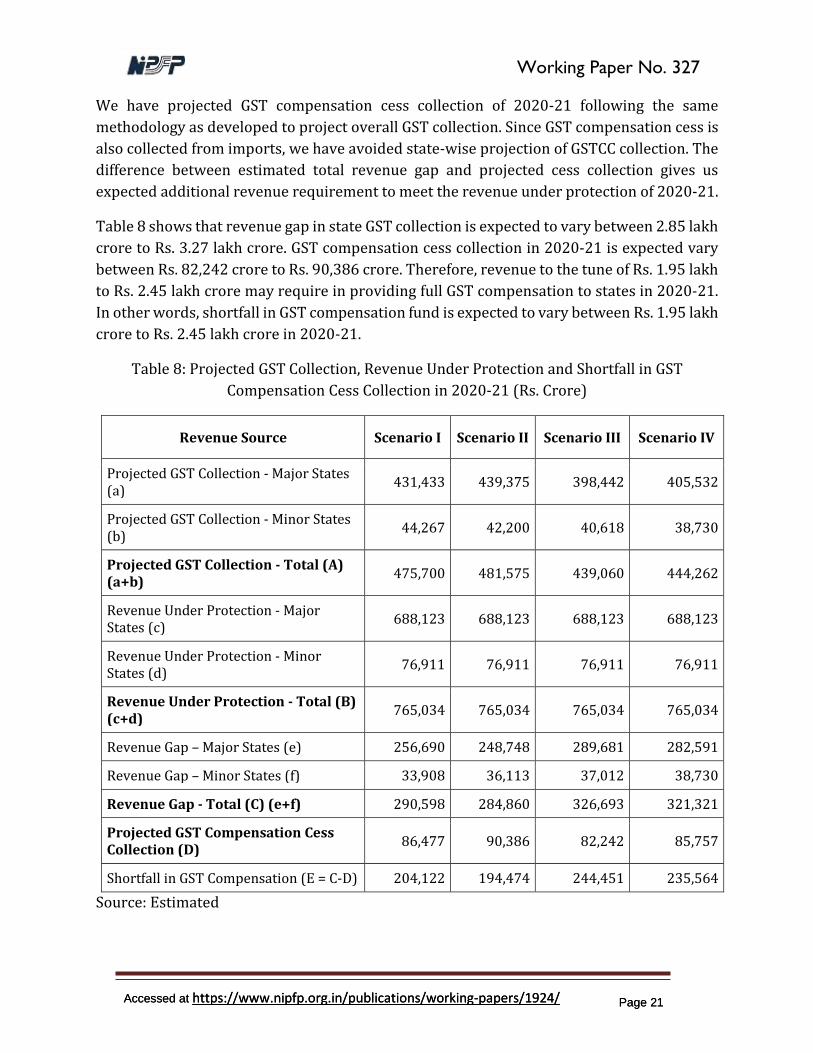
We have projected GST compensation cess collection of 2020-21 following the same
methodology as developed to project overall GST collection. Since GST compensation cess is
also collected from imports, we have avoided state-wise projection of GSTCC collection. The
difference between estimated total revenue gap and projected cess collection gives us
expected additional revenue requirement to meet the revenue under protection of 2020-21.
Table 8 shows that revenue gap in state GST collection is expected to vary between 2.85 lakh
crore to Rs. 3.27 lakh crore. GST compensation cess collection in 2020-21 is expected vary
between Rs. 82,242 crore to Rs. 90,386 crore. Therefore, revenue to the tune of Rs. 1.95 lakh
to Rs. 2.45 lakh crore may require in providing full GST compensation to states in 2020-21.
In other words, shortfall in GST compensation fund is expected to vary between Rs. 1.95 lakh
crore to Rs. 2.45 lakh crore in 2020-21.
Table 8: Projected GST Collection, Revenue Under Protection and Shortfall in GST
Compensation Cess Collection in 2020-21 (Rs. Crore)
Revenue Source Scenario I Scenario II Scenario III Scenario IV
Projected GST Collection - Major States (a)
431,433 439,375 398,442 405,532
Projected GST Collection - Minor States (b)
44,267 42,200 40,618 38,730
Projected GST Collection - Total (A) (a+b)
475,700 481,575 439,060 444,262
Revenue Under Protection - Major States (c)
688,123 688,123 688,123 688,123
Revenue Under Protection - Minor States (d)
76,911 76,911 76,911 76,911
Revenue Under Protection - Total (B) (c+d)
765,034 765,034 765,034 765,034
Revenue Gap – Major States (e) 256,690 248,748 289,681 282,591
Revenue Gap – Minor States (f) 33,908 36,113 37,012 38,730
Revenue Gap - Total (C) (e+f) 290,598 284,860 326,693 321,321
Projected GST Compensation Cess Collection (D)
86,477 90,386 82,242 85,757
Shortfall in GST Compensation (E = C-D) 204,122 194,474 244,451 235,564
Source: Estimated
Accessed at https://www.nipfp.org.in/publications/working-papers/1924/ Page 22 Accessed at https://www.nipfp.org.in/publications/working-papers/1924/ Page 22
Working Paper No. 327
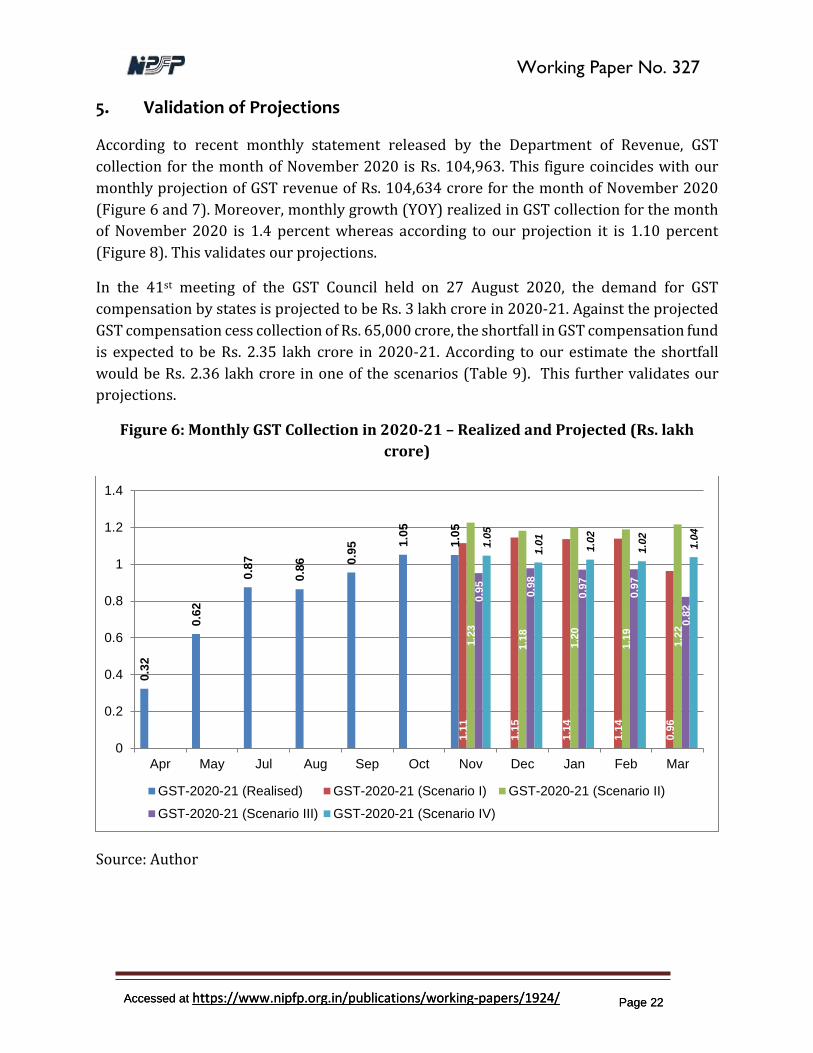
5. Validation of Projections
According to recent monthly statement released by the Department of Revenue, GST
collection for the month of November 2020 is Rs. 104,963. This figure coincides with our
monthly projection of GST revenue of Rs. 104,634 crore for the month of November 2020
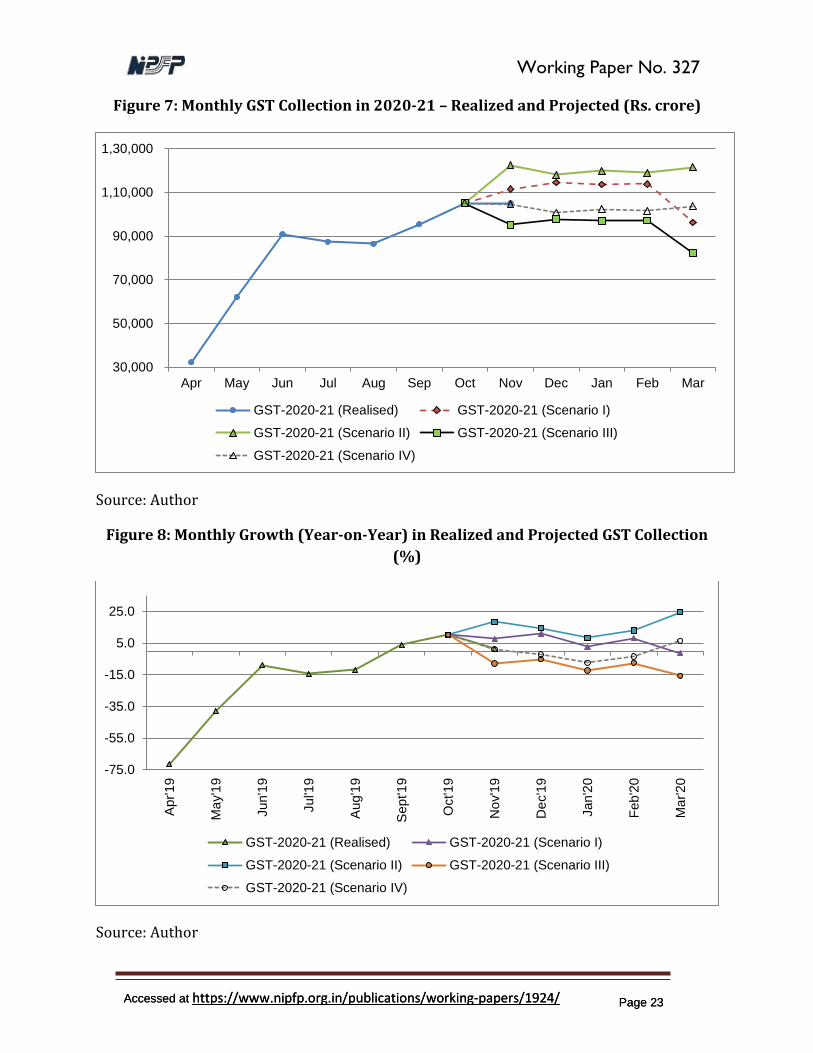
(Figure 6 and 7). Moreover, monthly growth (YOY) realized in GST collection for the month
of November 2020 is 1.4 percent whereas according to our projection it is 1.10 percent
(Figure 8). This validates our projections.
In the 41st meeting of the GST Council held on 27 August 2020, the demand for GST
compensation by states is projected to be Rs. 3 lakh crore in 2020-21. Against the projected
GST compensation cess collection of Rs. 65,000 crore, the shortfall in GST compensation fund
is expected to be Rs. 2.35 lakh crore in 2020-21. According to our estimate the shortfall
would be Rs. 2.36 lakh crore in one of the scenarios (Table 9). This further validates our
projections.
Figure 6: Monthly GST Collection in 2020-21 – Realized and Projected (Rs. lakh
crore)
Source: Author
0.3
2
0.6
2
0.8
7
0.8
6 0.9
5 1.0
5
1.0
51.1
1
1.1
5
1.1
4
1.1
4
0.9
6
1.2
3
1.1
8
1.2
0
1.1
9
1.2
2
0.9
5
0.9
8
0.9
7
0.9
7
0.8
2
1.0
5
1.0
1
1.0
2
1.0
2
1.0
4
0
0.2
0.4
0.6
0.8
1
1.2
1.4
Apr May Jul Aug Sep Oct Nov Dec Jan Feb Mar
GST-2020-21 (Realised) GST-2020-21 (Scenario I) GST-2020-21 (Scenario II)
GST-2020-21 (Scenario III) GST-2020-21 (Scenario IV)
Accessed at https://www.nipfp.org.in/publications/working-papers/1924/ Page 23 Accessed at https://www.nipfp.org.in/publications/working-papers/1924/ Page 23
Working Paper No. 327
Figure 7: Monthly GST Collection in 2020-21 – Realized and Projected (Rs. crore)
Source: Author
Figure 8: Monthly Growth (Year-on-Year) in Realized and Projected GST Collection
(%)
Source: Author
30,000
50,000
70,000
90,000
1,10,000
1,30,000
Apr May Jun Jul Aug Sep Oct Nov Dec Jan Feb Mar
GST-2020-21 (Realised) GST-2020-21 (Scenario I)
GST-2020-21 (Scenario II) GST-2020-21 (Scenario III)
GST-2020-21 (Scenario IV)
-75.0
-55.0
-35.0
-15.0
5.0
25.0
Apr'19
Ma
y'1
9
Jun'1
9
Jul'1
9
Aug'1
9
Sept'1
9
Oct'1
9
No
v'1
9
De
c'1
9
Jan'2
0
Feb
'20
Ma
r'2
0
GST-2020-21 (Realised) GST-2020-21 (Scenario I)
GST-2020-21 (Scenario II) GST-2020-21 (Scenario III)
GST-2020-21 (Scenario IV)
Accessed at https://www.nipfp.org.in/publications/working-papers/1924/ Page 24 Accessed at https://www.nipfp.org.in/publications/working-papers/1924/ Page 24
Working Paper No. 327
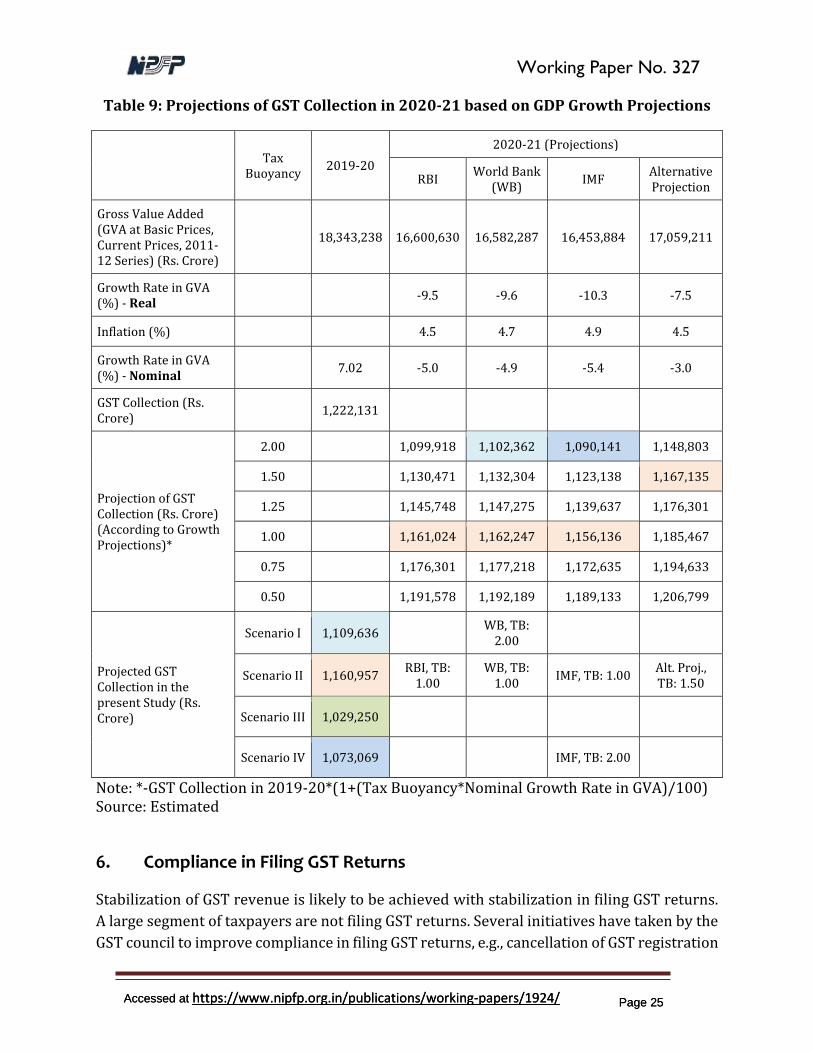
The Reserve Bank of India (RBI), the World Bank and the International Monetary Fund (IMF)
have projected India’s growth rate of GDP for 2020-21.7 Since GST collection depends on
nominal GDP, we have taken nominal growth rates (real growth rate + inflation) in projecting
GST collection in 2020-21 across alternative assumptions of tax buoyancy (Table 9). Since
nominal growth rate of the current financial year is projected to vary between -4.9 to -5.4
percent, as an alternative we have considered 3 percent contraction of nominal GDP and
projected corresponding GST collection.
We present projections of GST collections across alternative projections of GDP growth rates
across alternative assumptions of tax buoyancy and compare with our projected GST
collection in Table 9. It shows that though our projections are conservative, they are in line
with some of the alternative projections of GST collection based on projection of GDP growth
and tax buoyancy. This further validates our projections.
7 RBI's Monetary Policy Report - October 2020 (https://www.rbi.org.in/Scripts/PublicationsView.aspx?id=19980),
IMF Country News (https://www.imf.org/en/Countries/IND) and World Bank Over View
(https://www.worldbank.org/en/country/india/overview) last accessed on 2 December 2020.
Accessed at https://www.nipfp.org.in/publications/working-papers/1924/ Page 25 Accessed at https://www.nipfp.org.in/publications/working-papers/1924/ Page 25
Working Paper No. 327
Table 9: Projections of GST Collection in 2020-21 based on GDP Growth Projections
Tax
Buoyancy 2019-20
2020-21 (Projections)
RBI World Bank
(WB) IMF
Alternative Projection
Gross Value Added (GVA at Basic Prices, Current Prices, 2011-12 Series) (Rs. Crore)
18,343,238 16,600,630 16,582,287 16,453,884 17,059,211
Growth Rate in GVA (%) - Real -9.5 -9.6 -10.3 -7.5
Inflation (%) 4.5 4.7 4.9 4.5
Growth Rate in GVA (%) - Nominal 7.02 -5.0 -4.9 -5.4 -3.0
GST Collection (Rs. Crore) 1,222,131
Projection of GST Collection (Rs. Crore) (According to Growth Projections)*
2.00 1,099,918 1,102,362 1,090,141 1,148,803
1.50 1,130,471 1,132,304 1,123,138 1,167,135
1.25 1,145,748 1,147,275 1,139,637 1,176,301
1.00 1,161,024 1,162,247 1,156,136 1,185,467
0.75 1,176,301 1,177,218 1,172,635 1,194,633
0.50 1,191,578 1,192,189 1,189,133 1,206,799
Projected GST Collection in the present Study (Rs. Crore)
Scenario I 1,109,636 WB, TB:
2.00
Scenario II 1,160,957 RBI, TB:
1.00 WB, TB:
1.00 IMF, TB: 1.00
Alt. Proj., TB: 1.50
Scenario III 1,029,250
Scenario IV 1,073,069 IMF, TB: 2.00
Note: *-GST Collection in 2019-20*(1+(Tax Buoyancy*Nominal Growth Rate in GVA)/100) Source: Estimated
6. Compliance in Filing GST Returns
Stabilization of GST revenue is likely to be achieved with stabilization in filing GST returns.
A large segment of taxpayers are not filing GST returns. Several initiatives have taken by the
GST council to improve compliance in filing GST returns, e.g., cancellation of GST registration
Accessed at https://www.nipfp.org.in/publications/working-papers/1924/ Page 26 Accessed at https://www.nipfp.org.in/publications/working-papers/1924/ Page 26
Working Paper No. 327
for not filing GSTR-3B returns for six or more than six return periods, blocking of E-Way Bill
generation facility for not filing two or more consecutive GSTR-3B returns, in the coming
months compliance is expected to improve.
Based on data available from the GSTN database, we have estimated the gap in filing GST
returns as follows:
Gap in Filing GSTR-3B = (Number of Taxpayers Eligible to File GSTR-3B – Number of
Taxpayers Filed GSTR-3B)/ Number of Taxpayers Eligible to File
GSTR-3B*100
Gap in Filing GSTR-1 = (Number of Taxpayers Eligible to File GSTR-1 – Number of
Taxpayers Filed GSTR-1)/ Number of Taxpayers Eligible to File
GSTR-1*100
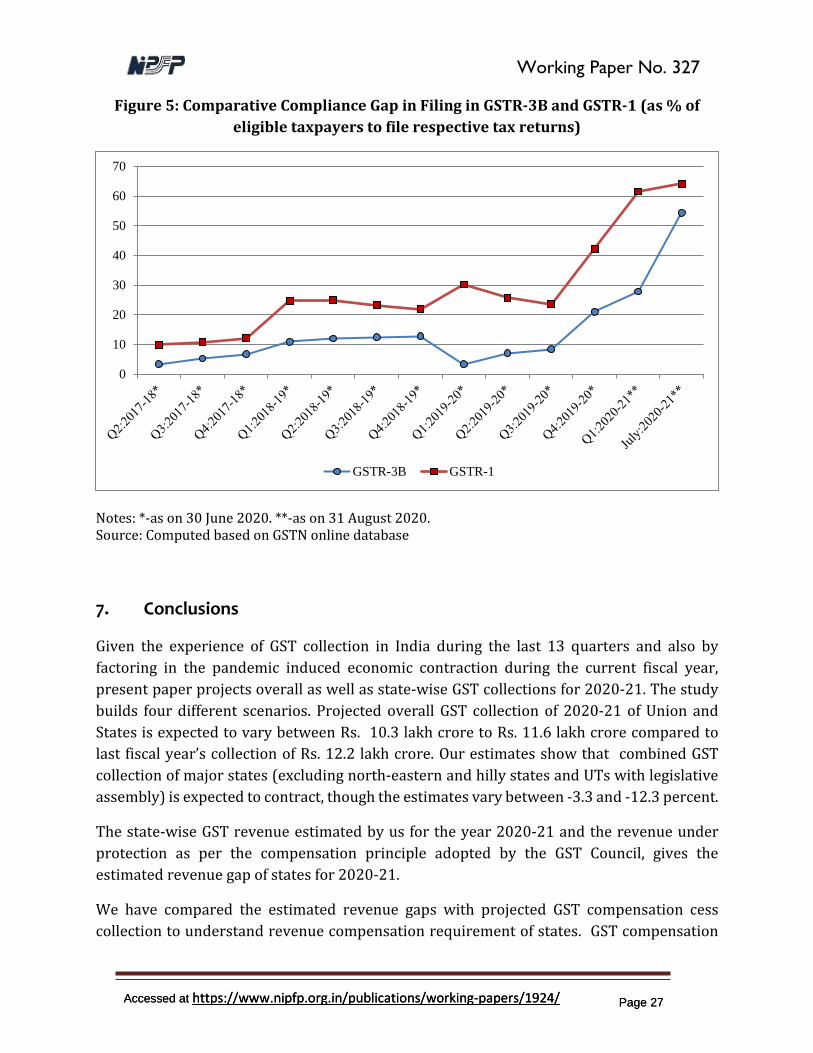
Figure 5 shows that gap in filing GSTR-3B is lower as compared to GSTR-1. Non-filers of
GSTR-1 are higher than non-filers of GSTR-3B. For effective tax enforcement, filing both the
GST returns (GSTR-1 and GSTR-3B) are required to assess possible instances of tax evasion.
Gaps in filing GST returns have gone up since Q4 of 2019-20. Lockdown due to COVID-19
outbreak may have caused difficulties for taxpayers to file GST returns in Q1 of 2020-21. It
is expected that compliance in filing GST returns will improve with gradual unlocking of the
economy.
It is likely that only a small percentage of taxpayers, who are eligible to file both GSTR-1 and
GSTR-3B, are filing both the GST returns. With increasing compliance in filing GST returns,
identification of mismatches of information reported across GST returns (GSTR-1, GSTR-2A
and GSTR-3B) will improve.
Accessed at https://www.nipfp.org.in/publications/working-papers/1924/ Page 27 Accessed at https://www.nipfp.org.in/publications/working-papers/1924/ Page 27
Working Paper No. 327
Figure 5: Comparative Compliance Gap in Filing in GSTR-3B and GSTR-1 (as % of
eligible taxpayers to file respective tax returns)
Notes: *-as on 30 June 2020. **-as on 31 August 2020. Source: Computed based on GSTN online database
7. Conclusions
Given the experience of GST collection in India during the last 13 quarters and also by
factoring in the pandemic induced economic contraction during the current fiscal year,
present paper projects overall as well as state-wise GST collections for 2020-21. The study
builds four different scenarios. Projected overall GST collection of 2020-21 of Union and
States is expected to vary between Rs. 10.3 lakh crore to Rs. 11.6 lakh crore compared to
last fiscal year’s collection of Rs. 12.2 lakh crore. Our estimates show that combined GST
collection of major states (excluding north-eastern and hilly states and UTs with legislative
assembly) is expected to contract, though the estimates vary between -3.3 and -12.3 percent.
The state-wise GST revenue estimated by us for the year 2020-21 and the revenue under
protection as per the compensation principle adopted by the GST Council, gives the
estimated revenue gap of states for 2020-21.
We have compared the estimated revenue gaps with projected GST compensation cess
collection to understand revenue compensation requirement of states. GST compensation
0
10
20
30
40
50
60
70
GSTR-3B GSTR-1
Accessed at https://www.nipfp.org.in/publications/working-papers/1924/ Page 28 Accessed at https://www.nipfp.org.in/publications/working-papers/1924/ Page 28
Working Paper No. 327
cess collection estimated by us is deduced from the revenue gap to get the estimate of
revenue shortfall in the GST Compensation Fund. The compensation as per our estimates
may vary between Rs. 1.95 lakh crore to Rs. 2.45 lakh crore.
We observed that there is a large difference in filing GST returns when we compare GSTR-1
and GSTR-3B. Reduction in mismatch between the two will result in significant increase in
compliance and revenue. Lockdown due to COVID-19 outbreak may have caused difficulties
for taxpayers to file GST returns in Q1 of 2020-21 but it has started improving thereafter.
Working Paper No. 327
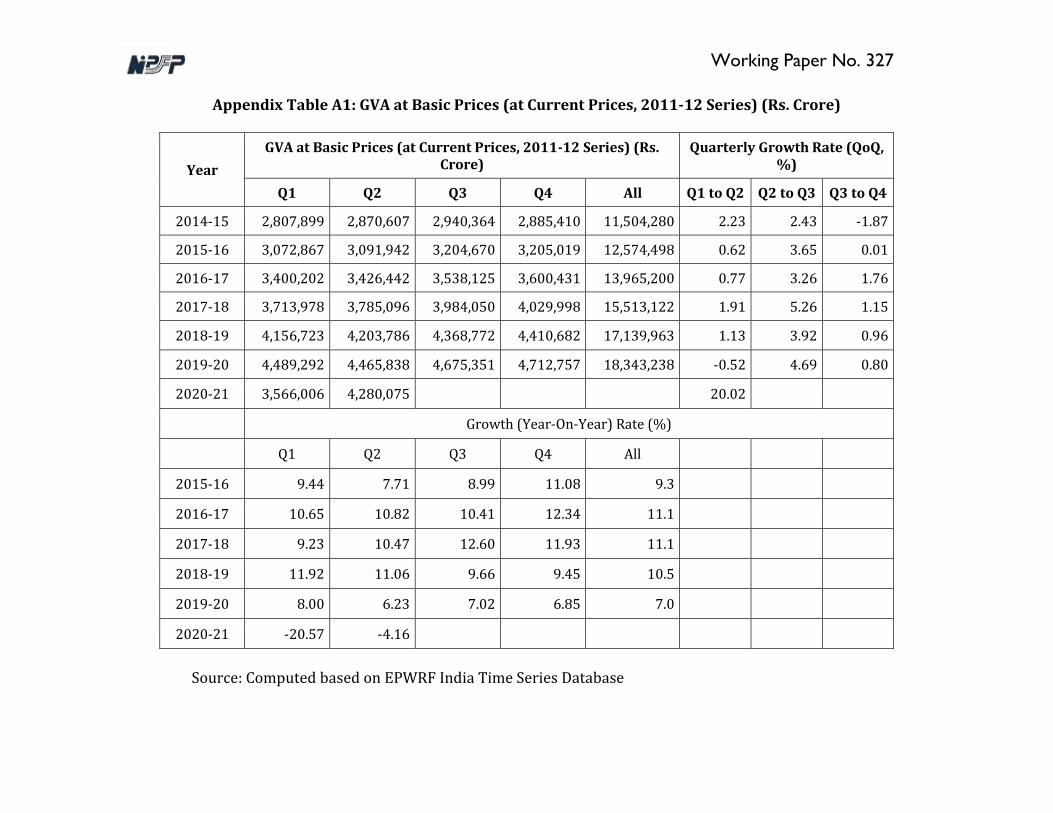
Appendix Table A1: GVA at Basic Prices (at Current Prices, 2011-12 Series) (Rs. Crore)
Year
GVA at Basic Prices (at Current Prices, 2011-12 Series) (Rs. Crore)
Quarterly Growth Rate (QoQ, %)
Q1 Q2 Q3 Q4 All Q1 to Q2 Q2 to Q3 Q3 to Q4
2014-15 2,807,899 2,870,607 2,940,364 2,885,410 11,504,280 2.23 2.43 -1.87
2015-16 3,072,867 3,091,942 3,204,670 3,205,019 12,574,498 0.62 3.65 0.01
2016-17 3,400,202 3,426,442 3,538,125 3,600,431 13,965,200 0.77 3.26 1.76
2017-18 3,713,978 3,785,096 3,984,050 4,029,998 15,513,122 1.91 5.26 1.15
2018-19 4,156,723 4,203,786 4,368,772 4,410,682 17,139,963 1.13 3.92 0.96
2019-20 4,489,292 4,465,838 4,675,351 4,712,757 18,343,238 -0.52 4.69 0.80
2020-21 3,566,006 4,280,075 20.02
Growth (Year-On-Year) Rate (%)
Q1 Q2 Q3 Q4 All
2015-16 9.44 7.71 8.99 11.08 9.3
2016-17 10.65 10.82 10.41 12.34 11.1
2017-18 9.23 10.47 12.60 11.93 11.1
2018-19 11.92 11.06 9.66 9.45 10.5
2019-20 8.00 6.23 7.02 6.85 7.0
2020-21 -20.57 -4.16
Source: Computed based on EPWRF India Time Series Database
Working Paper No. 327
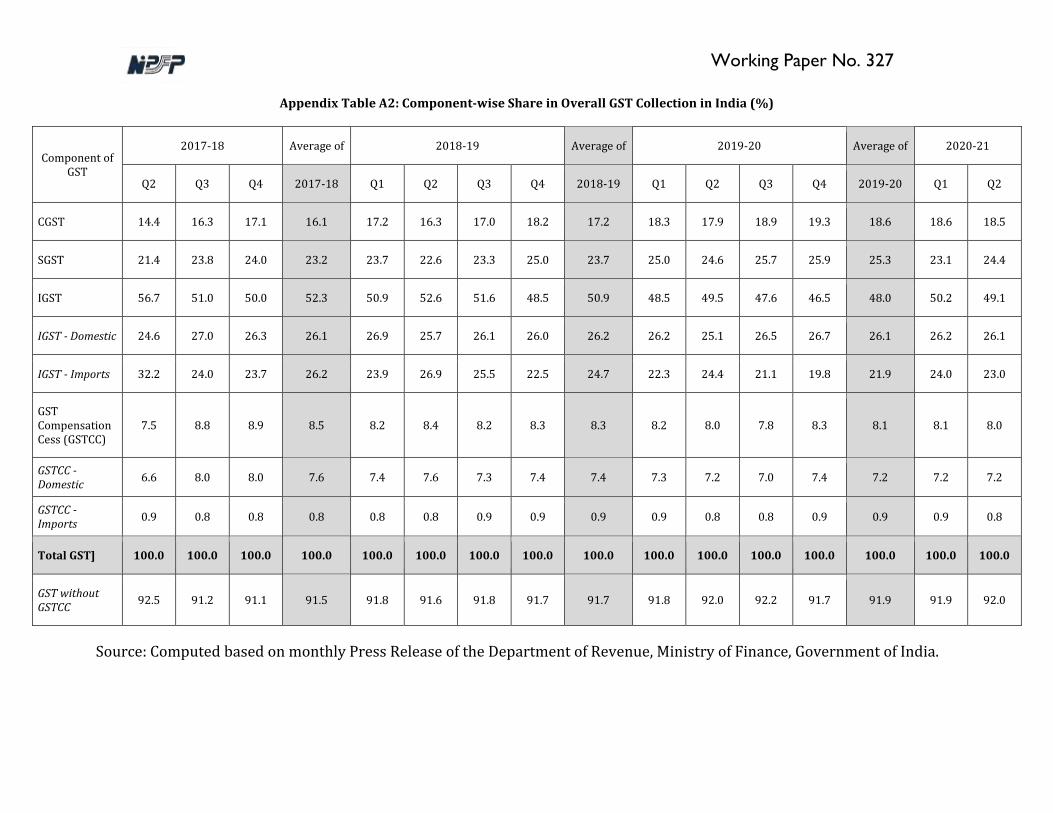
Appendix Table A2: Component-wise Share in Overall GST Collection in India (%)
Component of GST
2017-18 Average of 2018-19 Average of 2019-20 Average of 2020-21
Q2 Q3 Q4 2017-18 Q1 Q2 Q3 Q4 2018-19 Q1 Q2 Q3 Q4 2019-20 Q1 Q2
CGST 14.4 16.3 17.1 16.1 17.2 16.3 17.0 18.2 17.2 18.3 17.9 18.9 19.3 18.6 18.6 18.5
SGST 21.4 23.8 24.0 23.2 23.7 22.6 23.3 25.0 23.7 25.0 24.6 25.7 25.9 25.3 23.1 24.4
IGST 56.7 51.0 50.0 52.3 50.9 52.6 51.6 48.5 50.9 48.5 49.5 47.6 46.5 48.0 50.2 49.1
IGST - Domestic 24.6 27.0 26.3 26.1 26.9 25.7 26.1 26.0 26.2 26.2 25.1 26.5 26.7 26.1 26.2 26.1
IGST - Imports 32.2 24.0 23.7 26.2 23.9 26.9 25.5 22.5 24.7 22.3 24.4 21.1 19.8 21.9 24.0 23.0
GST Compensation Cess (GSTCC)
7.5 8.8 8.9 8.5 8.2 8.4 8.2 8.3 8.3 8.2 8.0 7.8 8.3 8.1 8.1 8.0
GSTCC - Domestic 6.6 8.0 8.0 7.6 7.4 7.6 7.3 7.4 7.4 7.3 7.2 7.0 7.4 7.2 7.2 7.2
GSTCC - Imports 0.9 0.8 0.8 0.8 0.8 0.8 0.9 0.9 0.9 0.9 0.8 0.8 0.9 0.9 0.9 0.8
Total GST] 100.0 100.0 100.0 100.0 100.0 100.0 100.0 100.0 100.0 100.0 100.0 100.0 100.0 100.0 100.0 100.0
GST without GSTCC 92.5 91.2 91.1 91.5 91.8 91.6 91.8 91.7 91.7 91.8 92.0 92.2 91.7 91.9 91.9 92.0
Source: Computed based on monthly Press Release of the Department of Revenue, Ministry of Finance, Government of India.
Accessed at https://www.nipfp.org.in/publications/working-papers/1924/ Page 31 Accessed at https://www.nipfp.org.in/publications/working-papers/1924/ Page 31
Working Paper No. 327
References
Eun-joo, L. (2020), "S. Korea’s Q1 tax revenue shrinks $6.9 bn, fiscal deficit hits record high
by March", Pulse by Maeil Business News Korea & mk.co.kr,
https://pulsenews.co.kr/view.php?year=2020&no=466629 (accessed on 7 May
2020).
Gupta, Manish and Indira Rajaraman (2020), "Is the 14% Revenue Guarantee to States
Justified?", Economic and Political Weekly, 55(47):18-21.
Keen, Michael (2007), "VAT Attacks!", IMF Working Paper No. WP/07/142, Fiscal Affairs
Department, International Monetary Fund (IMF): Washington, D.C.
Mukherjee, S. and R. Kavita Rao (2019), “Fiscal Implications of Introduction of Goods and
Services Tax in India”, Report Submitted to the Fifteenth Finance Commission,
National Institute of Public Finance and Policy (NIPFP), New Delhi.
OECD (2020), "Tax policy and administration responses to COVID-19" Chapter 2 in Revenue
Statistics in Asian and Pacific Economies 2020, OECD Publishing, Paris,
https://doi.org/10.1787/d47d0ae3-en.
Reuters (2020), "Japan tax collections fall most since June, more drops seen as virus bites",
Reuters, https://www.reuters.com/article/us-health-coronavirus-japan-tax/japan-
tax-collections-fall-most-since-june-more-drops-seen-as-virus-bites-
idUSKBN22J1JX (accessed on 7 May 2020).
MORE IN THE SERIES
▪ Badola, S., and Mukherjee, S., (2020).
Factors Influencing Access to Formal
Credit of Unincorporated Enterprises
in India: Analysis of NSSO’s Unit-level
Data, W.P. No. 326 (December).
▪ Bhattacharya, R., and Kapoor, M.,
(2020). Four years of the inflation
targeting framework, W.P. No. 325
(November).
▪ Dubey, Jay Dev, (2020). Income elasticity of demand for health care
and it’s change over time: Across
the income groups and levels of
health expenditure in India, W.P.
No. 324 (October).
Sacchidananda Mukherjee, is Associate
Professor, NIPFP
Email: [email protected]
National Institute of Public Finance and Policy, 18/2, Satsang Vihar Marg, Special Institutional
Area (Near JNU), New Delhi 110067 Tel. No. 26569303, 26569780, 26569784
Fax: 91-11-26852548 www.nipfp.org.in