Embed Size (px)
Citation preview

PANCONTINENTAL OIL & GAS NL – ANNUAL REPORT 2011
For
per
sona
l use
onl
y

ABN 95 003 029 543
DirectorsMr Henry David Kennedy (Non-Executive Chairman)Mr Roy Barry Rushworth (Executive Director & Chief Executive Officer)Mr Ernest Anthony Myers (Executive Finance Director)Mr Anthony Robert Frederick Maslin (Non-Executive Director)
Company SecretaryMrs Vesna Petrovic
Registered Office 288 Stirling StreetPerth WA 6000Telephone: +61 8 9227 3220Fax: +61 8 9227 3211
Share RegisterAdvanced Share Registry Services PO Box 1156 Nedlands WA 6909 Telephone: +61 8 9389 8033 AuditorsRothsay Chartered Accountants152-158 St Georges TerracePerth WA 6000
Internet Address & [email protected]
ASX CodePCL
ContentsChairman’s Review 1
Review of Operations 3
Directors’ Report 18
Auditor’s Independence Declaration 26
Corporate Governance Statement 27
Statement of Comprehensive Income 31
Statement of Financial Position 32
Statement of Changes in Equity 33
Statement of Cash Flows 34
Notes to the Financial Statements 35
Directors’ Declaration 53
Independent Audit Report 54
Additional ASX Information 56
Corporate InformationF
or p
erso
nal u
se o
nly

PANCONTINENTAL OIL & GAS NL – ANNUAL REPORT 2011 1
Offshore East Africa, notably in Mozambique and Tanzania, we continue to see major gas discoveries, and we expect two major LNG developments there in the coming years. However, Pancontinental has a deliberate exploration policy of looking for oil rather than gas, and we believe that we have succeeded in finding oil-prone “sweet spots” in both Kenya and Namibia, although both areas remain to be proven by drilling.
In our L8 area offshore Kenya we have identified and fully mapped, now with 3D seismic, the very large and potentially oil - bearing Mbawa Prospect. This prospect is sufficiently attractive to bring in Tullow and Apache as farminees during the year, and under the stewardship of the new operator, Apache, we are planning to drill Mbawa in 2012.
With the possibility of more than 5 Billion Barrels of oil, Mbawa has the potential to propel Pancontinental into the forefront of Australian petroleum companies and we will be free carried and retain 15% through most of the first Mbawa well by our farminee, Tullow, based on current budgets.
Jointly with UK major BG Group and other UK companies Premier Investments Limited and Cove Energy plc, we accepted 15% interests in Blocks L10A and L10B early in 2011. We are looking to a very aggressive and enhanced exploration programme, with BG Group as operator. In each of these blocks we will undertake 3D seismic in the near term and then a well in each block before mid-2014.
You may be aware of the flurry of exploration activity offshore Namibia in the last two years. We expect that there will be as many as 8 wells drilled offshore Namibia before the end of 2012.
Pancontinental has been watching and waiting on the activities in Namibia for several years. After securing a Reconnaissance Licence in 2007, the company selected and was awarded a very large 17,000 sq km exploration
area offshore northern Namibia in March 2011. This area is
designated as EL 0037. Pancontinental operates this project
The 2010 / 2011 year has been a very good one for Pancontinental.
For some years we have had an African focus and we are seeing our efforts in Africa beginning to pay off. In a sense Pancontinental has been substantially “ahead of the game” in Africa.
In Kenya, we have farmed out the giant Mbawa Prospect to Tullow Kenya B.V. (“Tullow”), a wholly owned subsidiary of Tullow Oil plc, for drilling in 2012, and have defined numerous other large and high potential structures in Licenses L8 and L6. We have also acquired two new exploration licences, L10A & L10B. We have major partners in our Kenyan ventures including Apache Corporation (“Apache”), well known in Australia, and a very experienced offshore operator, Tullow, arguably Africa’s most successful oil explorer of recent years, and BG Group plc (“BG Group”), one of the UK’s ten biggest companies and a major international LNG and oil producer and supplier, and a new entrant to Kenya.
In Namibia, after some years of effort, we have successfully negotiated a very large offshore exploration licence in the Walvis Basin in the north and we signed for the EL0037 licence there in June 2011.
Your CEO and Finance Director carried out lengthy road shows in London and Australian cities and I am pleased to say that the company was very well received in all locations. The exploration and promotional efforts have resulted in an increase in the company’s share price from 4 cents to a peak of more than 14 cents during the year.
For some years your company has had a strategy of exploring in overlooked areas that it considers to have very large reserves potential. East Africa and Namibia are two such areas. We have been working in Kenya and Namibia for about ten years and I am pleased to report that these areas are now the two “hot spots” in African oil exploration, and arguably the two most promising and sought after areas worldwide, alongside offshore Brazil.
Chairman’s Review
For some years we have had an African focus and we are seeing our efforts in Africa beginning to pay off. In a sense Pancontinental has been substantially “ahead of the game” in Africa.
For
per
sona
l use
onl
y

2 PANCONTINENTAL OIL & GAS NL – ANNUAL REPORT 2011
we are now entering, the company plans a further fundraising later in 2011 or early 2012 and the details of this will be released in due course.
While we see dark clouds on the horizon for world economies, we have some reason to believe that the oil and gas industry will remain relatively buoyant and may even become one of the “safe havens” for investment in the coming months and years.
The company welcomed Mr Anthony Maslin to the Board in 2010. Mr Maslin brings extensive experience in financial markets and in the resources industries.
In summary, Pancontinental is beginning to be recognised as a significant, African oriented exploration company and, in the current environment, we are extremely well placed to ride the current wave of activity both in East Africa and in Namibia.
H.D. Kennedy
and has an 85% interest. Again, as in Kenya, the Company has selected this location because there is technical data supporting the concept that the company’s acreage will prove to be oil bearing rather than gas bearing and this may not be the case for other locations offshore Namibia.
Pancontinental is advancing its exploration programme in Namibia, commencing with new mapping of existing data. We then plan 2D or 3D seismic over the most promising leads and prospects.
Our project in Malta continues to cause frustration and we carried on discussion with the Maltese authorities during the year. While we are pursuing a positive outcome for the company, we do not know when we will be able to resume exploration over these areas.
Pancontinental has been active in a corporate sense during the year, raising approximately $5 million through private placements early in 2011. Given the higher level of activity
Chairman’s ReviewF
or p
erso
nal u
se o
nly

PANCONTINENTAL OIL & GAS NL – ANNUAL REPORT 2011 3
Pancontinental Project Interests
Area(km2)
PCL Interest(%)
Operator(%)
Partners(%)
Kenya L6 3,100 40.0% Flow Energy (60%) n/a
Kenya L8 5,115 15.0% Apache (50%) Origin Energy (25%),Tullow (10%)
Kenya L10A 4,962 15.0% BG (40%) Cove (25%), Premier (20%)
Kenya L10B 5,585 15.0% BG (45%) Cove (15%), Premier (25%)
Namibia EL0037 17,295 85.0% PCL (85%) Paragon (15%)
Malta Area 5 * 8,000 80.0% PCL (80%) Sun Resources (20%)
Malta Block 3- Area 4 * 1,500 80.0% PCL (80%) Sun Resources (20%)
EP 424 79 38.462% Strike Oil (61.5%) n/a
EP 110 750 38.462% Strike Oil (61.5%) n/a
EP 104 / R1 736 10.0% Buru Energy (38.95%) Emerald Gas (12.75%), Gulliver (14.8%), Phoenix Resources (10%),
FAR (8%), Indigo Oil (5.5%)
L15 150 12.0% Buru Energy (38.95%) Gulliver (49%), FAR (12%), Indigo Oil (11.5%)
*Malta- Subject to Force Majeure and licence renegotiation
Review of OperationsF
or p
erso
nal u
se o
nly

4 PANCONTINENTAL OIL & GAS NL – ANNUAL REPORT 2011
HighlightsKenya Block L8 – Pancontinental farmed out a 10% interest to Tullow Kenya B.V. (“Tullow”), a wholly owned subsidiary of Tullow Oil plc for drilling the giant Mbawa Prospect. Pancontinental retains 15% interest in L8, from which Tullow will then have an option to earn a further 5%.
The farmin followed another farmout transaction by the then L8 operator Origin Energy Kenya Pty Ltd (“Origin”), a wholly owned subsidiary of Origin Energy Limited to Apache Kenya Limited (“Apache”), a wholly owned subsidiary of Apache Corporation. Apache has taken over as operator and has commenced planning for drilling Mbawa in 2012.
A new report for the Mbawa Prospect gives revised potential (P10) of 4.9 Billion Barrels of Oil in Place plus a gas cap of 284 Bcf at the Tertiary / Cretaceous level and 323 Million Barrels oil in place in the Jurassic (P10).
Kenya Blocks L10A & L10B - Pancontinental (15%) was awarded new licences over exploration Blocks L10A and L10B offshore southern Kenya, alongside BG Group plc (“BG Group”), Premier Oil Investments Limited (“Premier”) and Cove Energy plc (“Cove”).
Namibia EL 0037 – Pancontinental was awarded a full Exploration Licence and Petroleum Agreement over 17,292 sq km offshore northern Namibia. Pancontinental is operator and holds 85%.
Corporate - The Company raised approximately $5 million dollars to further its exploration activities.
Review of Operations
InternationalKENYA
Pancontinental’s Offshore Kenya Strategy.
Kenya’s stable legal and fiscal regimes and Pancontinental’s strong acreage position place the company very favourably in the East African region.
---------------0 Km 20
Mombasa
KENYA
L10A
L10B L10A & L10BPancontinental 15%•5 Play Types•> 10 Leads•3D & 2D late 2011•2 wells 2013 -2014
KENYA
Tanzania
L6
L8
L10A
L10B
L6 - 3,100km2
Flow 60%Pancontinental 40%
L8 – 5,115km2
Apache 50%Origin 25%Pancontinental 15%Tullow 10%
L10A – 4,962km2
BG 40%Cove 25%Premier 20%Pancontinental 15%
L10B – 5,585km2
BG 45%Premier 25%Pancontinental 15%Cove 15%
L10A & L10B
L6 & L8
L6
L8
L6Pancontinental 40%> 10 Leads/Prospects•3D late 2011•1 well 2012 -2013
L8 Mbawa Drilling 2012Pancontinental free carried15%Mbawa Potential----Tertiary / Cretaceous (P10)•4.9 Billion Barrels oil in place plus-•284 Billion Cubic Feet gas in place•Dual flat spots (DHI’s)•Oil slicksJurassic (P10)•323 Million Barrels oil in place or•525 Bcf in place gas cap Tertiary - further potential
PANCONTINENTALOFFSHORE KENYA
For
per
sona
l use
onl
y

PANCONTINENTAL OIL & GAS NL – ANNUAL REPORT 2011 5
KENyABlock L8, offshore Lamu Basin
Pancontinental 15%
L8 covers 5,114.9 sq km offshore Kenya in the Lamu Basin in water depths from 100m to 1,300 m. Pancontinental and its co-venturer (and subsequent merger partner) Afrex Limited (“Afrex”) originated the L6 and L8 projects.
L8 holds the giant Mbawa Prospect, planned for drilling in 2012. A report by former operator Origin enabled Pancontinental to verify the large hydrocarbon volumetric potential of the prospect.
Pancontinental farmed out to Origin in 2005, with Origin fully funding a 2D seismic survey and in 2009 / 2010 Origin increased its interest to 75% by funding an approximate US$10 million 3D seismic survey over the Mbawa Prospect. Pancontinental retained a 25% interest following the 3D survey and has now farmed-down to Tullow and retains 15% through Mbawa drilling.
In L8, the largest of several very substantial exploration objectives is the Mbawa Prospect, an anticlinal structure mapped using the 3D seismic data. Mbawa has potential for both oil and gas at inferred Cretaceous and Jurassic reservoir levels.
The latest 3D survey provides approximately 300 sq km of high quality seismic data over Mbawa and confirmed Pancontinental’s interpretation of the “Flat Spots” seen on earlier 2D seismic and the structure proved to remain robust and very large.
Mbawa coincides with interpreted natural oil slicks derived from sea floor “pockmarks” associated with faulting on the flank of the structure. As well as Mbawa, other prospects in L8 also have high volumetric potential and are also associated with interpreted slicks.
The “slicks” on the sea surface above Mbawa are interpreted to originate from minor natural sea - floor leakage, suggesting the presence of an active petroleum generating system. From the new 3D data the slicks appear to coincide with deep faults and the sea floor “pock marks” (interpreted small expulsion craters), suggesting minor natural oil and / or gas leakage along the fault planes. The interpreted oil slicks on the sea surface support the concept of oil generation, expulsion and migration from the kitchen area and Mbawa itself. Similar natural leakage is seen in major oil and gas provinces elsewhere around the globe.
The interpreted extensive deep oil and gas generating “kitchen” near the Mbawa Prospect extends to the north into area L6 and south into L10A and L10B.
Offshore East Africa has become an industry exploration focus through recent major deepwater gas discoveries and an oil discovery offshore Tanzania and Mozambique.
Further drilling is underway in these areas south of Kenya and drilling is also planned in 2012 offshore Kenya, by Pancontinental in L8 and by Anadarko and Total in deep water.
In its early exploration offshore Kenya, Pancontinental proposed that the prime areas to develop good oil source rocks, and to have these fully mature to generate oil, is the restricted environment where the Tana River delta carried sediments and nutrients into the deep troughs inboard of the Davie Walu Ridge.
Thick Tertiary sediment loading was also conceived to “cook” the younger as well as older source rocks sufficiently to generate oil in the troughs. Since then, the concept of an oil generating system has been supported by the presence of interpreted naturally occurring sea-surface oil slicks coinciding with the postulated oil generating “troughs” and these lie within all of Pancontinental’s exploration blocks.
Pancontinental was awarded the L6 and L8 licences in 2002 and has subsequently farmed these out.
With the 2011 awards of the L10A and L10B licences, Pancontinental has extended its strategy of exploring for oil to the south of L8 and L6. The new blocks cover the same deep Tertiary troughs that the company interprets to be oil-generating in L8 and L6.
Review of Operations
PANCONTINENTAL OFFSHORE KENYA
L10B
L10A
L8
L6Interpreted oil generating troughs (blue)
Tana River sediment and oil source nutrient input into troughs
Davie- Walu Ridge restricting oceanic circulation (mauve)
For
per
sona
l use
onl
y

6 PANCONTINENTAL OIL & GAS NL – ANNUAL REPORT 2011
audit, and also by funding the future work programme on its own behalf and up to an agreed expenditure “cap” of US$ 9 million attributable to Pancontinental’s retained 15% interest.
Pancontinental will retain a 15% interest in L8 through Mbawa drilling, from which Tullow will then have an option to earn a further 5% from Pancontinental by funding any second well to a second agreed “cap” of US$6 million in respect of Pancontinental’s share of well costs. If Tullow does not exercise the option, each of the two parties will fund its own direct share of the well.
Tullow is a leading independent oil and gas exploration and production company. It has a market capitalisation of approximately GBP 12 billion (A$ 19 billion). It is based in London, it is a constituent of the FTSE100 index and it produces more than 37,000 Barrels of oil equivalent per day. It is one of the world’s most successful oil companies of recent years, with extensive exploration acreage and production in 15 countries across Africa and 22 countries worldwide.
The Tullow farmin followed another transaction by the L8 operator Origin and the US major Apache,announced on 16 February 2011. Under the Origin - Tullow agreement, Apache has acquired 50% interest in L8 and has become the licence operator.
Interest holders in PSC Block L8 are:
Apache Corporation 50%
Origin Energy Kenya Pty Ltd 20%
Pancontinental Oil & Gas NL and Afrex Ltd * 15%
Tullow Kenya B.V. 15%
*Afrex Limited is a wholly owned subsidiary of Pancontinental Oil & Gas NL.
Mbawa Prospect Volumetric Assessment
A report by L8 previous operator Origin has given new estimates of the oil and gas volumetric potential of the Mbawa Prospect.
L8 operator Origin, in March 2011, issued the L8 Joint Venture with a first stage technical report on the evaluation of the Mbawa structure based upon Origin’s interpretation of the Mbawa 3D seismic survey data acquired in 2009. The
Mbawa also shows superposed “flat spots” or “DHI’s” on both 2D and 3D seismic data.
The “flat spots” are possible gas-oil and oil-water interfaces at about the level of interpreted Tertiary to Cretaceous reservoir sands. Only drilling is capable of verifying the interpreted seismic characteristics and the oil and gas volumetric potential (if any).
Pancontinental’s interpretation is consistent with a gas column of about 100m overlying an oil column of more than 120m but these can only be validated by further seismic analysis and drilling. True DHI’s are only seen at this depth when the reservoir rocks (in this case sandstone) are thick and highly porous, suggesting a highly productive reservoir system if oil or gas is present.
As well as the main Tertiary- Cretaceous prospect, there are opportunities in large Upper Jurassic / Lower Cretaceous fault blocks, in the Cretaceous and the Tertiary sequences themselves and in a newly identified Upper Jurassic play. Conceptually, several play types could be tested by one well to about 4,000m depth.
A number of offshore prospects with large potential lie within Kenya Block L8, with the Mbawa Prospect being the largest mapped to date. Neighbouring Block L6 (Pancontinental 40%) also has significant potential in a number of prospects and leads.
After Mbawa, the next largest prospect is Nanaa Central with approximately 40% of Mbawa’s volumetric potential. Nanaa Central would provide an additional commercial opportunity after any Mbawa discovery.
Farmout to Tullow
In early 2011, Pancontinental “farmed out” part of its interest in L8 to Tullow and the then L8 operator Origin farmed out to Apache. Tullow has agreed to fund most of Pancontinental’s share of drilling the giant Mbawa Prospect, as estimated under current budgets.
Under the L8 farmout agreement signed with Tullow, Tullow earns a 10% interest by paying US$ 1 million to Pancontinental for reimbursement of past costs, subject to
In early 2011 Pancontinental “farmed out” part of its interest to Tullow and Origin farmed out
to Apache.
Tullow has agreed to fund most of Pancontinental’s share of drilling the giant
Mbawa Prospect.
Review of OperationsF
or p
erso
nal u
se o
nly

PANCONTINENTAL OIL & GAS NL – ANNUAL REPORT 2011 7
While the P10 potential is regarded as the maximum in-place and unrisked potential, corresponding P Mean potentials in place, subject to the same risks as those outlined above for the P10 estimates, are-
Tertiary / Cretaceous potential –
• 2 Billion Barrels (P Mean) oil plus a gas cap of 196 Bcf (P Mean)
Jurassic potential – 138 Million Barrels (P Mean) or
• 231 Bcf (P Mean)
Other results from the report and based upon Pancontinental’s interpretation of it are-
• The Mbawa Prospect is a large faulted anticline divided into a number of “compartments”
• Both Tertiary / Cretaceous and Jurassic closures contain several major culminations and a number of minor culminations
• At the Tertiary / Cretaceous level a major southern culmination contains two superposed “flat spots” or “DHIs” (Direct Hydrocarbon Indicator) consistent with a gas-oil interface above an oil–water interface.
Mbawa Drilling
Several of the major culminations on the overall Mbawa Prospect may be locations for drilling. Initial planning has been undertaken for drilling and now further extensive planning has been commenced by incoming operator Apache. The timing of drilling is subject to a number of factors including equipment lead-times and the availability of a suitable drilling rig.
The accurate location of a drilling site is expected to be announced once incoming operator Apache has verified the 3D interpretation. Water depth over Mbawa is about 800 metres, easily within the range of modern drilling and production equipment. Amplitude-versus-offset (AVO) analysis and special PSDM seismic processing are ongoing.
report stressed that the interpretation was based upon pre-stack time migration (PSTM) processing only and did not include interpretation results from a subsequent pre-stack depth migration (PSDM) which was carried out because of the structural complexity revealed by the PSTM data. The PSDM data was not available at the time of completion of Origin’s report.
While there is no direct evidence that the Mbawa Prospect contains any oil or gas until drilling has taken place, new volumetric estimates contained in the report indicate that, if filled to spill point and subject to risks that include trap integrity and the fact that the offshore Lamu Basin petroleum system is unproven, Mbawa has in-place and unrisked potential to contain at the Tertiary- Cretaceous level –
• up to 4.9 Billion Barrels of oil (P10) plus
• a gas cap of 284 Billion Cubic Feet (P10)
In the report it is estimated that Mbawa has in-place and unrisked potential to contain at the deeper Top Jurassic level –
• up to 323 Million Barrels oil (P10) or
• 525 Billion Cubic Feet gas (P10)
but these are subject to risks that include the fact that there is limited data for reservoir parameters on the East African margin, there is no control on interpretation of Jurassic carbonates and the lack of a commercial discovery of hydrocarbons in Jurassic carbonates on the East African margin.
The geological parameters used in estimating the volumetric potential have been drawn from regional data and modelling of worldwide geological systems and may not necessarily reflect the parameters in place in the Mbawa Prospect. The P10 potential volumes quoted are only possible if the prospect is filled to spill point and the interpretation and estimated parameters prove to be valid. There is no direct evidence that the prospect contains any oil or gas and it is possible that the prospect may be only partially filled or contains no hydrocarbons. Recoverable reserves are lower than in-place volumes and are subject to a number of factors that are not estimated in the quoted volumetric potentials. Only drilling and further assessment can determine the actual volumes (if any) of oil or gas in place or recoverable.
A report by L8 previous operator Origin has given new estimates
of the oil and gas potential of the Mbawa Prospect.
Mbawa coincides with interpreted natural oil
slicks derived from sea floor “pockmarks” and also shows “flat
spots” or “DHI’s” on seismic.
Review of OperationsF
or p
erso
nal u
se o
nly

8 PANCONTINENTAL OIL & GAS NL – ANNUAL REPORT 2011
KENyA
BLOCKS L10A & L10B, OFFSHORE LAMU BASIN
Pancontinental 15%
Offshore Kenya, Pancontinental joined the UK major BG Group and other UK companies Premier and Cove in the award of two new Production Sharing Contracts (“PSCs”) over Blocks L10A and L10B.
The joint venture signed the new PSC’s with the Minister of Energy of Kenya on 16 May 2011. The new areas more than double Pancontinental’s gross acreage position offshore Kenya.
With BG Group as operator, the Joint Venture has commenced an aggressive “fast track” exploration programme leading to drilling in this highly promising exploration province. Pancontinental is commencing exploration activities alongside several of the most successful UK-based companies in the oil and gas sector.
The L10A and L10B Blocks have respective areas of
4,962.03 sq km and 5,585.35 sq km and water depths of 200
to 1,900m, which is within the reach of modern drilling and
development technology.
3D and 2D seismic surveys are planned for late 2011 and
then one well is planned in each block before mid-2014.
The entry of a number of major international companies
alongside Pancontinental offshore Kenya supports
Pancontinental’s long-held view of the significant oil and
gas potential of its Kenyan projects.
The Joint Ventures consist of-
L10A L10B
BG Group plc 40% 45%
Premier Oil Investments Limited 20% 25%
Cove Energy plc 25% 15%
Pancontinental Oil & Gas NL 15% 15%
Review of Operations
LOWER “FLAT SPOT”
TERTIARY / CRETACEOUS “FLAT SPOT”
TILTED JURASSIC FAULT BLOCKS
TERTIARY “FLAT SPOTS”
MBAWA PROSPECT
800m WATER DEPTH
0 Km(approx) 2
TOE THRUST PLAY
TURBIDITE AND CHANNEL SANDS ?
KENYA L8 – MBAWA
For
per
sona
l use
onl
y

PANCONTINENTAL OIL & GAS NL – ANNUAL REPORT 2011 9
Barrels of Oil per Day and has reserves of more than 250 Million Barrels of Oil Equivalent.
Cove is listed in London with a market capitalisation of GBP 510 million (A$815 million). Cove had success with its first well, the Windjammer gas discovery off Mozambique in February 2010. Since then it has shared in more gas discoveries and an oil discovery in the next three wells in the same area. As well as other East African assets, it holds a minority interest in an extensive tract of deeper water acreage offshore Kenya with operator Anadarko Petroleum Corporation.
An initial L10A and L10B review by operator BG Group has identified more than ten strong “leads” for follow-up by 3D and 2D seismic surveys. The leads are geologically varied, with six “play types” identified.
The L10A & L10B operator BG Group is one of the 10 largest companies in the UK with a market capitalisation of around GBP 50 billion (A$80 billion). It is a constituent of the FTSE 100 index and operates in more than 25 countries worldwide.
BG Group is a world leader in natural gas exploration and production, Liquefied Natural Gas (LNG) and gas transmission and distribution and worldwide, producing around 650,000 Barrels of Oil Equivalent per Day. It has an impressive record of finding and commercialising major international hydrocarbon reserves and has drilled two recent gas discoveries offshore Tanzania, south of Kenya.
Premier is amongst the largest UK independent oil and gas companies with a market capitalisation of approximately US$ 3 billion (A$ 3 billion). Premier produces about 45,000
Pancontinental joined the UK major BG Group as well as
Premier and Cove in two new contracts over Blocks L10A and
L10B offshore Kenya.
A number leads have potential including a large Upper Jurassic “reef”, Cretaceous and Tertiary
channel and turbidite sands and Miocene reefs.
Review of Operations
---------------0 Km 20
Mombasa
KENYA
L10A
L10B
KENYA L10A & L10B – LEADS L10A & L10B Pancontinental 15%
• Awarded May 2011• 10,000 km2
• Water depth 200mto 1,800m
• Interpreted oil “kitchen” troughs
• Notable partners-BG Group, PremierOil, Cove Energy
• “Fast Track”explorationprogramme
• 5 Play Types• > 10 Leads• 3D & 2D late 2011• 2 wells 2013 -2014
For
per
sona
l use
onl
y

10 PANCONTINENTAL OIL & GAS NL – ANNUAL REPORT 2011
leads in the eastern part of the blocks, while the 2D survey of 970 linear km will cover other leads, including a Miocene reef trend in the western part of the blocks. The aim of the surveys is to identify the most prospective prospects for drilling. Two wells are required under the licences in the second exploration period commencing in August 2013.
Other planned work includes geological field sampling, gravity field attribute studies, heat flow modelling, seismic test reprocessing, basin modelling and seismic attribute studies.
KENyABLOCK L6, OFFSHORE/ONSHORE LAMU BASINPancontinental 40%
The L6 licence area covers approximately 3,100 sq km. Approximately one quarter of the area lies onshore and the rest extends offshore to 400 metres water depth.
L6 lies in the Lamu Basin, with a deep sedimentary section extending from the Tertiary to at least the Jurassic. A deep central graben in the area is considered to be an oil and gas “source kitchen” and potential hydrocarbon trapping prospects have been identified immediately adjacent to this area.
Several of the leads have a similar character and are on-trend south of the giant Mbawa Prospect in L8 (Pancontinental 15%). These leads are large anticlinal features.
A number of other leads have potential in different parts of the geological section, including a large Upper Jurassic “reef”, Cretaceous and Tertiary channel and turbidite sands and Miocene reefs.
Most of the leads have been selected for further early work including seismic coverage commencing later in 2011 with the aim of bringing these to prospect status.
Forward Work Programme
Following an initial prospectivity review the joint venture has commenced planning for extensive 3D and 2D marine seismic surveys over the main leads. The project operator is currently seeking a seismic vessel for the data acquisition and the general locations of the surveys have been determined. While the 3D acquisition is planned for the east of the areas and 2D in the west, precise locations will be determined in due course.
On current planning the seismic acquisition will commence in late 2011 and processing should be completed mid 2012.
The 3D survey of approximately 2,200 sq km will cover 6
Review of Operations
KENYA L10A & L10B – LEAD EXAMPLES
Miocene reefMiocene reef
Cretaceous Mega‐channel
Upper Jurassic reefTertiary / Upper Cretaceous anticline
Cretaceous Mega‐channel
For
per
sona
l use
onl
y

PANCONTINENTAL OIL & GAS NL – ANNUAL REPORT 2011 11
• The Kiboko and Nyati clusters are large and well situated in water depths from 100 metres to 350 metres;
• The Chui Prospects are large features in near-shore water depths up to 120 metres; and
• The Kudu Prospect, being onshore, is located where a smaller gas or oil discovery could be readily commercialised.
With the recognition of the potential offshore Kenya, the joint venture is seeking a farminee with the aim of acquiring 3D seismic data over the Kifaru Prospect in 2011 and drilling in 2011 / 2012.
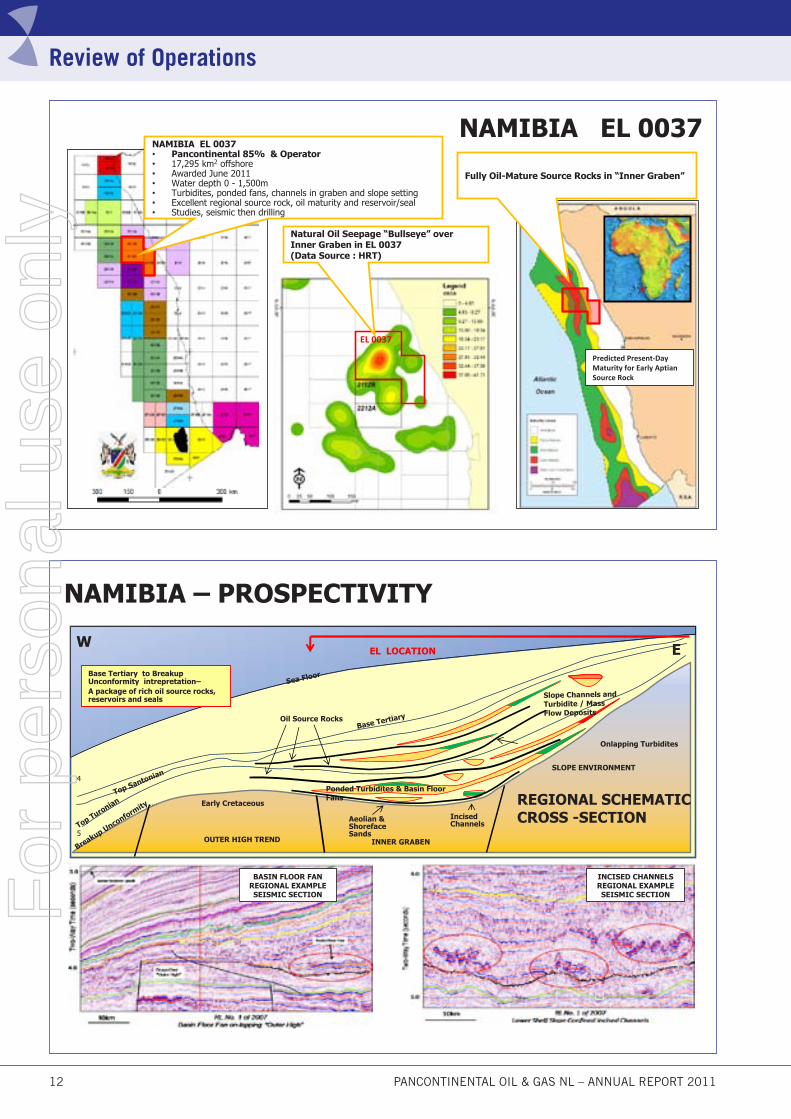
NAMIBIAEL 0037 Offshore Walvis BasinPancontinental 85%Pancontinental was awarded the EL 0037 Exploration Licence (“EL”) by the Ministry of Mines and Energy of Namibia on 28 June 2011 and a corresponding Production Agreement (“PA”) was signed on 4 July 2011 (also effective 28 June 2011).
EL 0037 covers 17,295 sq km over an oil -prospective trend in the Walvis Basin offshore northern Namibia. Pancontinental holds 85% and is operator under a Joint Venture Agreement with Namibian co-venturer Paragon Holdings (Pty) Ltd (“Paragon”) (15%).
The location of the PA and EL was selected over Blocks 2012B, 2112A and 2113B from a 30,000 sq km Reconnaissance Licence awarded to Pancontinental in February 2007.
The EL gives exclusive rights to the holders for a first exploration period of four years followed by two additional periods of two years each and also provisions for the continuation of the exclusive rights under any oil or gas development.
Pancontinental holds the PA and EL 85% with Namibian participant Paragon Holdings 15%. In exchange for certain rights under the Joint Venture Agreement with Paragon signed on 28 March 2011, Pancontinental has agreed to “free carry” Paragon until the commencement of the development of any oil or gas discovery. Paragon is a company based in the Namibian capital Windhoek. Paragon is a leading Namibian
Offshore, sea-surface oil or condensate slicks are interpreted to originate from the sea floor in the south of L6, supporting the interpretation of a working hydrocarbon system in this under-explored region. Kenya has a burdensome energy shortage and any significant hydrocarbons found onshore, including gas, could be readily commercialised.
The attention of the joint venture has shifted from the gas / condensate potential onshore to the larger oil and gas potential offshore. Significant new studies in L6, including those interpreting hydrocarbon migration paths, have highlighted the potential of areas adjacent to the central graben.
Several major prospects in L6 have potential in excess of 100 million barrels recoverable oil or 0.5 trillion cubic feet of gas. Eight prospects have been mapped in five clusters:
• The Kifaru Prospects in the southwest of the block in water depths of 60 metres (Kifaru N) and 100 metres (Kifaru S). These prospects are now one of the main focuses of exploration work;
Major prospects have potential in excess of 100 million barrels
recoverable oil or 0.5 trillion cubic feet of gas. Eight
prospects have been mapped in five clusters
Pancontinental was awarded EL 0037 in Namibia on
28 June 2011
Review of Operations
KIFARUPROSPECT
For
per
sona
l use
onl
y
12 PANCONTINENTAL OIL & GAS NL – ANNUAL REPORT 2011
Review of Operations
Predicted Present‐Day Maturity for Early AptianSource Rock
EL 0037
Fully Oil-Mature Source Rocks in “Inner Graben”
Natural Oil Seepage “Bullseye” overInner Graben in EL 0037(Data Source : HRT)
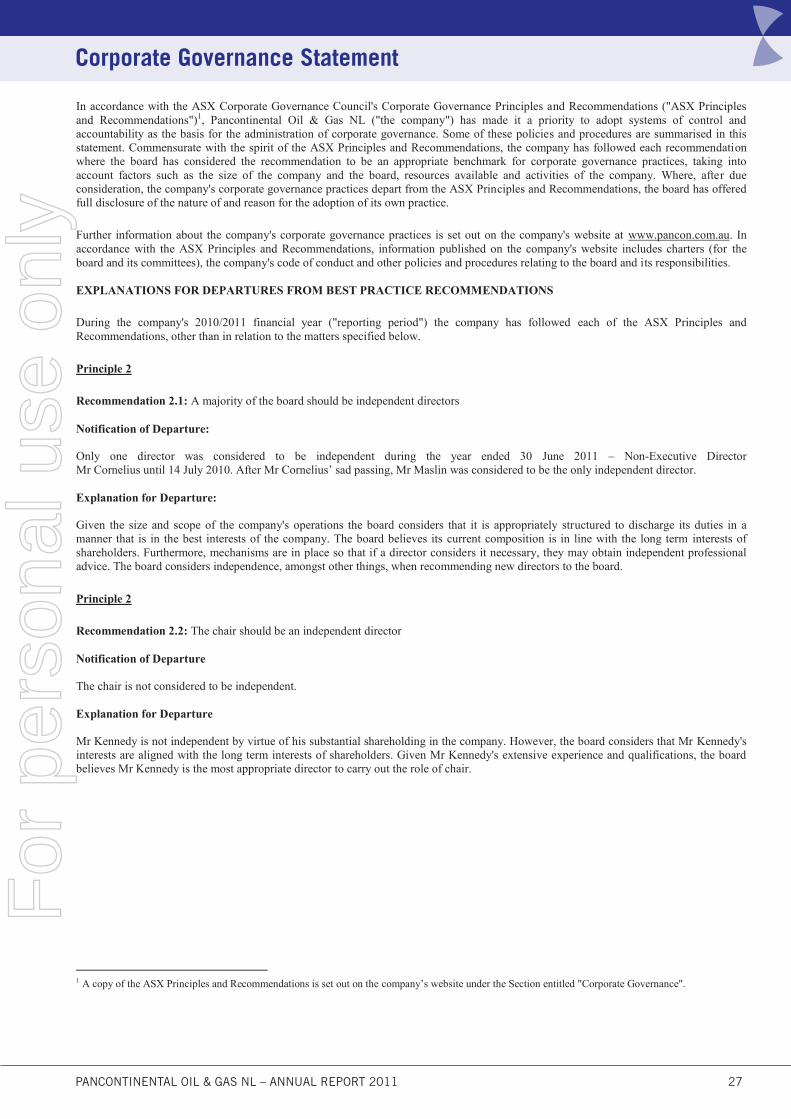
NAMIBIA EL 0037• Pancontinental 85% & Operator• 17,295 km2 offshore• Awarded June 2011• Water depth 0 - 1,500m• Turbidites, ponded fans, channels in graben and slope setting• Excellent regional source rock, oil maturity and reservoir/seal • Studies, seismic then drilling
NAMIBIA EL 0037
NAMIBIA – PROSPECTIVITY
3
4
5Brea
kup unconform
ity
Top TuronianTop Santonian
Base Tertiary
OUTER HIGH TREND INNER GRABEN
SLOPE ENVIRONMENT
Ponded Turbidites & Basin FloorFans
IncisedChannels
Slope Channels andTurbidite / MassFlow Deposits
Oil Source Rocks
Base Tertiary to BreakupUnconformity intrepretation–A package of rich oil source rocks,reservoirs and seals
EL LOCATION
Aeolian & ShorefaceSands
Breakup Unconformity Early Cretaceous
Onlapping Turbidites
BASIN FLOOR FANREGIONAL EXAMPLESEISMIC SECTION
INCISED CHANNELSREGIONAL EXAMPLESEISMIC SECTION
REGIONAL SCHEMATIC CROSS -SECTION
W E
Sea Floor
For
per
sona
l use
onl
y

PANCONTINENTAL OIL & GAS NL – ANNUAL REPORT 2011 13
Review of Operations
NAMIBIA EL 0037SEISMIC CROSS -SECTION
Amplitude Cut-off
High Amplitude Slope Channel / Turbidite Fan Sands
NAMIBIA EL 0037SEISMIC CROSS -SECTION
Flat Event
Channel Sand Sequence
High Amplitude Source Interval
High Amplitude Source Interval
private equity and business management company with diversified mining, retail and media interests.
Offshore Namibia is attracting significant international interest as an emerging oil and gas province in southwest Africa.
Prospectivity offshore Namibia
Pancontinental will explore the ponded basin floor turbidites, slope fans and channels seen under the company’s earlier Reconnaissance Licence. These targets are associated with a restricted graben trough interpreted to hold the rich and mature oil source rocks identified in regional wells.
Targets are associated with a restricted graben
trough interpreted to hold rich and mature
oil source rocks
Offshore Namibia has the potential to hold very large
oil and gas reserves and it is significantly under-explored
It is expected that at least 6 exploration wells will be drilled offshore Namibia before end 2012.
For
per
sona
l use
onl
y

14 PANCONTINENTAL OIL & GAS NL – ANNUAL REPORT 2011
It is intended that 2D and 3D seismic data will be acquired over several prospects and drilling will be considered on the best of these.
MALTA
Area 5 and Block 3 within Area 4, offshore Mediterranean Sea
Pancontinental 80%
Area 5 and Block 3 within Area 4 offshore Malta are held by Pancontinental (80%) and Sun Resources NL (20%). The combined project area is approximately 14,800 sq km in water depths from 100 to 400 metres. The main prospects are in the 200 to 300 metre range. Activities on the Exploration Study Areas (“ESA”) have been suspended since September 2005 under force majeure provisions due to border issues between Malta, Libya and Tunisia.
A number of very large Cretaceous and Tertiary carbonate ‘reef’ leads and prospects have been identified, similar to those hosting large producing oil and gas fields in neighbouring Tunisian and Libyan waters.
In early 2009 operatorship reverted to Pancontinental as Anadarko International Energy Company, who farmed in three years previously, withdrew from the permit due to the lack of progress on the border issue. Since resuming operatorship, Pancontinental has been engaged in communication with the Oil Exploration Department of the Ministry of Resources and Rural Affairs of Malta (“OED”) to refresh the licence title and allow exploration of the area to recommence at some time in the future when the border issues have been resolved.
In late May 2009, without any prior warning, Pancontinental received a letter from the OED claiming that the ESA expired in August 2008. Pancontinental has written to the OED disputing the expiry of the ESA and seeking clarification of the reasons for the OED’s claim and reserving its rights and potential remedies. The OED responded in July 2009 by stating that a July 2008 request via then Operator Anadarko for the grant of a 2 year extension to the term of the ESAs was not acceded to.
Pancontinental has sought legal advice from a firm of Maltese lawyers and had meetings during the year with the Maltese authorities. The company intends to proceed with maintaining its rights under the agreements and resuming exploration over the licence area.
The potential reservoir rocks lay close to the oil source rocks.
Water depths are moderate by modern exploration standards,
with water depths between 0 and 1,500m in the blocks being
readily accessible for exploration.
Offshore Namibia is the part of the plate tectonic “conjugate”
of offshore Brazil, where world-scale oil and gas discoveries
have been made in recent years and it lies on the West African
continental margin adjacent to Angola, where there have also
been many major oil discoveries. The explorations “plays”
in the blocks are similar to some of those containing large oil
and gas reserves offshore elsewhere in West Africa.
Offshore Namibia is an extension of the West African
continental margin and in Pancontinental’s’ opinion offshore
Namibia has the potential to hold very large oil and gas
reserves and it is significantly under-explored. The very large
Kudu Gas Field offshore Namibia is under development
by Tullow, and other companies are actively exploring the
margin for oil.
The sparsely scattered well results show evidence of excellent
oil prone source rocks and Pancontinental interprets that
these will be mature to generate oil in the Inner Graben
covered by Pancontinental’s acreage. Other well results
show excellent reservoir rocks and seals.
Pancontinental’s 85% in the new blocks sees it well placed
amongst some major players offshore Namibia.
A number of major “deals” have been concluded recently
offshore Namibia and it is expected that at least 6 exploration
wells will be drilled offshore Namibia before the end of
2012, and a number of these will be close to Pancontinental’s
acreage.
Forward Work Programme
Pancontinental has commenced gathering data over the new
area and will remap existing seismic and map prospects and
leads for further work.
Offshore Namibia is the part of the plate tectonic “conjugate” of offshore Brazil, where world-
scale oil and gas discoveries have been made
Review of OperationsF
or p
erso
nal u
se o
nly

PANCONTINENTAL OIL & GAS NL – ANNUAL REPORT 2011 15
MOROCCO
Mediterranee Est Block, offshore Mediterranean Sea
Pancontinental 100%- Application
The Joint Venture is awaiting the formal issue of the Reconnaissance Licence by the Minister. There has been no progress of late and the Company believes that there is a low probability of any advance in the foreseeable future; consequently the Company will not report on this project again until there is significant progress (if any).
AUSTRALIA
EP 104 & RL1, ONSHORE CANNING BASIN, WESTERN AUSTRALIA
Pancontinental 10%
Pancontinental holds a 10% interest in both licence EP 104 and an extension over Retention Licence R1 in the Canning
Basin in north-western Western Australia. The Canning Basin has a number of recognised petroleum systems, yet it remains relatively under-explored.
The RL1 area has been excised from the EP 104 exploration area to allow retention of the Point Torment gas discovery and the Stokes Bay 1 area. RL1 was renewed by the Minister of Mines and Petroleum of Western Australia for a period of five years from 8 November 2010.
The EP 104 and RL1 areas are on-trend to the Blina and other nearby oil fields and have similar exploration plays, exploration targets and petroleum systems. The West Kora oil discovery is 18 kilometres southeast and the nearest gas discovery, Point Torment-1, is 4.5 kilometres southeast of the Company’s current focus at Stokes Bay-1.
Stokes Bay-1 was drilled in 2007 to test any updip continuation of the Point Torment gas discovery. Stokes Bay 1 lost circulation of drilling mud into cavernous and vugular porosity in the top 40 to 45 metres of the Nullara Limestone. During operations to control the lost circulation Stokes Bay-1 flowed back mud intermittently.
Review of Operations
MALTA AREA 5 & AREA 4 – BLOCK 3
For
per
sona
l use
onl
y

16 PANCONTINENTAL OIL & GAS NL – ANNUAL REPORT 2011
AUSTRALIA
L15, ONSHORE CANNING BASIN, WESTERN AUSTRALIA
Pancontinental 12%
Pancontinental and several co-venturers were granted Production Licence L15 over the West Kora-1 oil discovery well in the onshore Canning Basin of Western Australia in April 2010. West Kora-1 was drilled in 1984 to a depth of 2606 metres and produced some 20,000 Barrels of oil with an initial rate of 350 BOPD.
The L15 covers two graticular blocks “6054 and 6126” and runs for 21 years from 1 April 2010.
While drilling West Kora-1 the Carboniferous aged Anderson Formation demonstrated a number of oil shows. An extended production test over the interval 1735-1751 metres in 1982 produced some 20,000 barrels of oil. The initial production rate was 350 BOPD with 30% water cut, declining to 15% oil cut / 85% water cut.
In 1992, the interval 1693 to 1696 (the “1700 metre oil sand”) was also perforated. A through-tubing bridge plug failed to
In September / October 2008 further testing attempted to lift sufficient lost drilling mud to induce the flow of formation fluid (oil, gas or water) from the Nullara. Some gas was seen at the wellhead but again no definitive formation fluid was recovered.
After a further testing phase, Pancontinental announced on 12 November 2010 that a coiled tubing unit (CTU) had tested the Stokes Bay-1 well and had recovered saline water interpreted to be formation fluid. The CTU injected nitrogen into the tubing and casing already inside the well bore to lift drilling mud remaining in the well bore and from the Nullara Limestone Formation at the bottom of the well. The coiled tubing unit commenced nitrogen lifting operations on 11 November and these were completed on the 14 November. The coiled tubing was released and the well was left suspended.
The operations recovered some 2,760 barrels of interpreted reservoir fluid consisting of water of high salinity (NaCl 17% compared to local sea water of 7% NaCl) that is interpreted to be reservoir fluid and no hydrocarbons were recovered.
The Joint Venture is now considering the next steps in exploring the licence areas.
Review of Operations
AUSTRALIA – EP 104 / R1 & L15
For
per
sona
l use
onl
y

PANCONTINENTAL OIL & GAS NL – ANNUAL REPORT 2011 17
The EP 110 and EP 424 exploration areas lie in the Flinders Fault Zone trend of the Barrow Sub- Basin near the Roller, Saladin and Skate oil fields and the onshore Tubridgi gas field.
EP 110 is operated in conjunction with EP- 424. The parties in EP-110 have identical equities to those in permit EP-424.
The Baniyas prospect is on-trend to the Roller, Saladin and Skate oil fields. The crest of the Baniyas feature has anomalous seismic amplitudes, consistent with the presence of gas-over-oil or gas-over-water, although it is possible that other factors may be responsible for the anomaly.
Commercial negotiations, conducted over several months, to gain access to the entire Baniyas prospect have reached a point where the operator is of the view that there is little likelihood that the adjoining acreage can be secured.
Following a technical review of the Baniyas potential and because of the absence of success in extending Joint Venture access over all of the Baniyas Prospect, it was decided to consider selling or otherwise disposing of the licences.
AUSTRALIAEP 406, offshore Southern Carnarvon Basin
Pancontinental 5%
Pancontinental has an agreement with Victoria Petroleum NL (“Victoria”) that provides for Victoria to earn a 95% interest in the permit by drilling one well.
The licence is subject to a Marine Park and World Heritage listing and activities are currently suspended. Exploration will commence after renewal of the permit and receipt of the necessary Environment Protection Authority approvals.
NEW VENTURESPancontinental continuously reviews new opportunities in Australia and internationally. During the year a number of new opportunities were assessed.
Pancontinental succeed in being awarded new offshore Kenyan licences L10A and L10B (15%) and offshore Namibian licence EL 0037 (15%) during the year.
A strategic alliance was formed with Jacka Petroleum to examine other prospective opportunities elsewhere in Africa.
isolate water production in the well, considered to be likely from the lower perforated intervals.
Additional Extended Production Tests were conducted in 1992 and 1997 / 1998. The results demonstrated the need for a workover to isolate water production and reinstate oil production and to determine the oil productivity and reserves.
West Kora-1 remains as a completed oil well which is planned to be placed back on production to the existing West Kora Tank Farm production facility following a successful workover and upgrade of the Tank Farm. The aim of the joint venture is to re-establish cash flow from oil production from West Kora-1 and to exploit any further oil potential in the surrounding area.
The L 15 participants are considering a West Kora -1 workover programme. With improvements in technology and significantly higher oil prices, revived production from West Kora-1 could be feasible.
AUSTRALIA
EP 424 and 110, offshore / onshore Carnarvon Basin, Western Australia
Pancontinental 38.462%
The Carnarvon Basin has yielded numerous oil and gas discoveries over many years, commencing with the discovery of the Barrow Island oil field in 1964.
Review of Operations
AUSTRALIA – EP 424 & EP 110
For
per
sona
l use
onl
y

18 PANCONTINENTAL OIL & GAS NL – ANNUAL REPORT 2011
Your directors submit their report for the year ended 30 June 2011.
DIRECTORS
The names and details of the company’s directors in office during the financial year and until the date of this report are as follows. Directors were in office for this entire period unless otherwise stated.
Directors’ Report
Names, qualifications, experience and special responsibilities
Mr Henry David Kennedy MA
(Geology), SEG, PESA, AIG
(Non-Executive Chairman)
Mr Kennedy has had a long association
with Australian and New Zealand resource
companies and as a technical director has
been instrumental in the formation and/or
development of a number of successful listed companies. During
his term as executive director, these companies were involved in
discovery of the Tubridgi gas field, South Pepper, North Herald
and Chervil oil fields in Western Australia and the Kupe South
and Rua oil/gas condensate fields in New Zealand. Mr Kennedy
is currently a non-executive director of Norwest Energy NL (since
April 1997).
Mr Roy Barry Rushworth BSc
(Executive Director, Chief Executive
Officer)
Mr Rushworth has more than twenty five
years experience in petroleum exploration.
He is a graduate of Sydney University, with
a Bachelor of Science Degree in Geology
and Marine Sciences. Commencing with positions in exploration
operations, his career then extended to a period as Chief Geologist
and subsequently Exploration Manager for an Australian listed
company. A number of oil and gas discoveries were made by
the company during that time. More recently, as the General
Manager and Director of Afrex Limited, he was responsible
for acquiring international new venture opportunities for Afrex
Limited and its then co-venturer Pancontinental Oil & Gas NL.
In this position he identified and negotiated projects in Malta,
Kenya and Morocco. Following the merger of Afrex Limited
with Pancontinental in August 2005, he accepted the position of
Director - New Ventures for Pancontinental and is now the Chief
Executive Officer of the company.
Mr Ernest Anthony Myers CPA
(Executive Finance Director)
Mr Myers has over 30 years experience
in the resources industry. Mr Myers is an
accountant (CPA) who has held senior
management and executive roles within
a number of ASX listed companies.
Mr Myers joined Pancontinental in March 2004 as Company
Secretary and was appointed Finance Director in January 2009. He
brings corporate and operational experience in a variety of fields
including project development, feasibility studies and both equity
and debt financing. Prior to his appointment with Pancontinental,
Mr Myers was CFO and Company Secretary of Dragon Mining
Limited for a period of six years during its transition from an
exploration company to a gold producer in Sweden. Mr Myers
has extensive experience in exploration and operational issues,
particularly in Kenya, Tanzania, Namibia and Eritrea. Mr Myers
has been an alternate director of East Africa Resources Limited
since June 2010.
Mr Anthony Robert Frederick Maslin
BBus
(Independent Non-Executive Director)
Mr Maslin is a stockbroker with corporate
experience in both management and
promotion, along with an extensive
understanding of financial markets. Mr
Maslin has been instrumental in the capital raisings and promotion
of several resource development companies. Mr Maslin is also a
director of Buxton Resources Ltd (since November 2010).
Mr Ian Raymond (Inky) Cornelius
(Independent Non-Executive Director)
(Passed away 14 July 2010)
Mr Cornelius worked at the Western Australian Mines Department,
then as Mining Titles Officer of a multi national mining corporation
before going into business as a tenement consultant. He had many
years experience in the resources industry and has had great success
in the exploitation of several mineral deposits. Mr Cornelius was
also a director of East Africa Resources Ltd (since October 2003),
Montezuma Mining Company Limited (since August 2006) and
non-executive director of Alkane Exploration Ltd (since July
2006). On 14 July 2010, the company announced the sad passing
away of director Ian Raymond (Inky) Cornelius.
COMPANy SECRETARy
Mrs Vesna Petrovic BComm, CPA
Mrs Petrovic is a Certified Practicing
Accountant with 10 years’ experience in
the resources sector and has previously
held positions with numerous publicly
listed entities. In particular, Mrs Petrovic
has significant experience with companies
involved in Africa. Mrs Petrovic holds a Bachelor of Commerce,
Major in Accounting and Business Law and has completed
the Graduate Diploma in Applied Corporate Governance from
Chartered Secretaries Australia Ltd.
For
per
sona
l use
onl
y

PANCONTINENTAL OIL & GAS NL – ANNUAL REPORT 2011 19
The relevant interest of each director in the shares and options of the company as at 30 June 2011 is as follows:
Directors’ Interests Ordinary Shares Options over Ordinary Shares
Henry David Kennedy 155,301,968 1,500,000 Roy Barry Rushworth 34,764,181 3,000,000 Ian Raymond (Inky) Cornelius (passed away 14 July 2010) - 1,500,000 Anthony Robert Frederick Maslin - - Ernest Anthony Myers - 1,000,000
Cents
EARNINGS PER SHARE Basic earnings (loss) per share (0.16) Diluted earnings (loss) per share (0.16)
CORPORATE INFORMATION Corporate structure Pancontinental Oil & Gas NL is a no liability company incorporated and domiciled in Australia. Nature of operations and principal activities The principal activities during the year of entities within the consolidated entity were exploration for oil and gas. There have been no significant changes in the nature of those activities during the year. Employees The consolidated entity had no employees as at 30 June 2011, (2010: no employees). The consolidated entity employs the services of specialised consultants where and when needed. OPERATING AND FINANCIAL REVIEW Review of Operations
Offshore Kenya, the L8 joint venture (Pancontinental 15% after farmout) received 3D seismic report results which confirmed the oil and gas potential of the giant Mbawa Prospect. Tullow Kenya B.V. signed an agreement to farmin to Pancontinental’s interest and Apache Corporation also signed an agreement to farmin to joint venture partner Origin Energy’s interest. In Kenya licence area L6 (Pancontinental 40%), focus shifted to offshore prospects and leads. A Farminee is sought for 3D seismic and drilling. Two new exploration licences offshore Kenya, L10A and L10B covering approximately 10,000 sq km, were awarded to Pancontinental and its co-venturers, BG Group plc, Premier Oil Investments Limited and Cove Energy plc (Pancontinental 15%). In Namibia, Pancontinental was awarded Exploration Licence EL 0037 and a corresponding Petroleum Agreement over a large northern area of 17,000 sq km offshore Walvis Basin. Offshore Carnarvon Basin (WA) the EP 424 / EP 110 joint venture continued efforts to acquire additional acreage over an extension of the Baniyas Prospect (Pancontinental 38.462 %). In the EP104 area in the Canning Basin (onshore WA, Pancontinental 10%) the joint venture will undertake an examination of the prospectivity of the licence areas and plan the future exploration programme. Elsewhere in the Canning Basin, the L15 joint venture (Pancontinental 12%) over the West Kora oil field commenced planning for the rehabilitation of the existing production facilities. The company continued negotiations in Malta with the aim of Pancontinental recommencing offshore exploration activities.
Directors’ ReportF
or p
erso
nal u
se o
nly

20 PANCONTINENTAL OIL & GAS NL – ANNUAL REPORT 2011
Group Overview
Pancontinental Oil and Gas NL was incorporated in 1985 and listed on the Australian Securities Exchange in 1986. Performance Indicators
The board closely monitors the group’s operating plans, financial budget and overall performance. Dynamics of the Business
The company continues to develop its International and Australian acreage utilising the skills and experience of the existing operators. Whilst the company is committed to further developing existing projects, emerging opportunities are reviewed on a timely basis. Risk Management
The group takes a proactive approach to risk management. The board is responsible for ensuring that risks and opportunities are identified on a timely basis and that the group's objectives and activities are aligned with the risks and opportunities identified by the board.
The group believes that it is crucial for all board members to be a part of this process, and as such the board has not established a separate risk management committee. The board has a number of mechanisms in place to ensure that its objectives and activities are aligned with the risks identified. These include the following:
Implementation of board approved operating plans and cash flow budgets and board monitoring of progress against these budgets. Reports on specific business risks, including such matters as environmental issues and concerns. The group has advised each director, manager and consultant that they must comply with a set of ethical standards maintaining
appropriate core company values and objectives. Such standards ensure shareholder value is delivered and maintained. Standards cover legal compliance, conflict resolution, privileged information and fair dealing.
The board provides shareholders with information using a comprehensive Continuous Disclosure Policy which includes identifying matters which have a material effect on the underlying security price. ASX announcements, the web page of the company and other media resources are used to convey such information. The board encourages full participation by shareholders at the AGM and shareholders are requested to vote on board and executive remuneration aggregates as well as the Employee Incentive Scheme.
Directors’ ReportF
or p
erso
nal u
se o
nly

PANCONTINENTAL OIL & GAS NL – ANNUAL REPORT 2011 21
Operating Results for the Year Summarised operating results are as follows:
2011 Revenues
$ Results
$ Non-segment and unallocated revenues and results 89,526 (967,031) Consolidated entity revenues and results from ordinary activities before income tax expense 89,526 (967,031)
Shareholder Returns
The group is in the exploration phase and so returns to shareholders are primarily measured through capital growth. 2011 2010 2009 2008 2007 2006 Basic earning per share (cents) (0.16) (0.32) (1.26) (0.36) (0.6) (0.5) Investments for Future Performance
The group continues to evaluate opportunities utilising in-house commercial expertise. Review of Financial Condition
Capital Structure The group has a sound capital structure from which to continue its development programmes. No options were issued to directors during the year. Treasury policy The board has not considered it necessary to establish a separate treasury function because of the size and scope of the group's activities. Liquidity and Funding The group has sufficient liquidity and funding to continue operations into the foreseeable future. All operating plans and budgets are approved by the board and progress is reviewed continuously with reference to the approved plan
and budget. Statement of Compliance
The above report is based on the guidelines in The Group of 100 Incorporated publication Guide to the Review of Operations and Financial Condition. SIGNIFICANT CHANGES IN THE STATE OF AFFAIRS No significant changes in the state of affairs of the company occurred during the financial year. SIGNIFICANT EVENTS AFTER THE BALANCE DATE On 5 July 2011, Pancontinental announced that the Ministry of Mines and Energy of Namibia had signed a Petroleum Agreement (“PA”) and granted an Exploration Licence (“EL”) to Pancontinental over a large area offshore Northern Namibia. The PA and EL cover 17,295 sq km over prospective trends in the Walvis Basin. Pancontinental holds 85% and is Operator under a Joint Venture Agreement with Namibian co-venturer Paragon Holdings (Pty) Ltd (15%).
Apart from the above, no matters or circumstances have arisen since the end of the financial year which significantly affected or may significantly affect the operations of the company, the results of those operations, or the state of affairs of the company in future financial years. LIKELY DEVELOPMENTS AND EXPECTED RESULTS The economic entity expects to maintain the present status and level of operations and hence there are no likely developments in the entity's operations.
Directors’ ReportF
or p
erso
nal u
se o
nly

22 PANCONTINENTAL OIL & GAS NL – ANNUAL REPORT 2011
ENVIRONMENTAL REGULATION AND PERFORMANCE The company's operations are not regulated by a particular environmental regulation under a law of the Commonwealth or of a State or Territory. SHARE OPTIONS Unissued shares At the date of this report there were 13,750,000 unissued ordinary shares under options. Refer to the notes for further details on the options outstanding. Shares issued as a result of the exercise of Options
No options were exercised and no shares were issued as a result during the year. INDEMNIFICATION AND INSURANCE OF DIRECTORS AND OFFICERS Since the end of the previous financial year the company has paid insurance premiums in respect of directors' and officers' liability and legal expenses insurance contracts. The directors have not included details of the nature of the liabilities covered or the amount of the premium paid in respect of the directors and officers and legal expenses insurance contracts as such disclosure is prohibited under the terms of the contract. The premiums were paid in respect of the following officers of the company and its controlled entities:
Mr HD Kennedy, Mr RB Rushworth, Mr IR Cornelius, Mr ARF Maslin, Mr EA Myers and Mrs V Petrovic.
Directors’ ReportF
or p
erso
nal u
se o
nly

PANCONTINENTAL OIL & GAS NL – ANNUAL REPORT 2011 23
REMUNERATION REPORT This report outlines the remuneration arrangements in place for directors and executives of Pancontinental Oil & Gas NL (“the company”). Remuneration philosophy A description of the remuneration structures in place is as follows: The non-executive directors received a fixed fee for their services. They do not receive performance based remuneration. The chief executive officer received a fixed fee for his respective executive services (with no bonus or other performance-based remuneration), and a separate fixed fee for his services as a director. Directors do not receive any termination or retirement benefits. Remuneration committee The full board carries out the role of the remuneration committee. Remuneration structure
In accordance with best practice corporate governance, the structure of non-executive director and senior manager remuneration is separate and distinct. Non-executive director remuneration
Objective The board seeks to set aggregate remuneration at a level which provides the company with the ability to attract and retain directors of the highest calibre, whilst incurring a cost which is acceptable to shareholders. Structure The Constitution and the ASX Listing Rules specify that the aggregate remuneration of non-executive directors shall be determined from time to time by a general meeting. An amount not exceeding the amount determined is then divided between the directors as agreed. The latest determination was at the Annual General Meeting held on 29 November 2007 when shareholders approved an aggregate remuneration of $400,000 per year. The amount of aggregate remuneration sought to be approved by shareholders and the manner in which it is apportioned amongst directors is reviewed annually. The board considers advice from external consultants as well as the fees paid to non-executive directors of comparable companies when undertaking the annual review process. The non-executive directors of the company can participate in the Employee Option Incentive Plan with shareholder approval. The remuneration of executive and non-executive directors for the period ending 30 June 2011 is detailed in Table 1 of this report. Senior manager and executive director remuneration
Objective The board seeks to set aggregate remuneration at a level which provides the company with the ability to attract and retain executives of the highest calibre, whilst incurring a cost which is acceptable to shareholders. Structure In determining the level and make up of executive remuneration, the board takes independent advice from external consultants when necessary.
Fixed remuneration
Objective The level of fixed remuneration is set so as to provide a base level which is both appropriate to the position and is competitive in the market. Structure Fixed primary remuneration is paid on a cash basis and there are no fringe benefits or other costs incurred by the company. Company performance Company performance is reflected in the movement in the company's share price over time. As the company is in an exploration phase, returns to shareholders will primarily come through share price appreciation. The board’s strategy in achieving this aim is to acquire early stage projects which can attract quality joint venture partners.
The company has developed skills in the acquisition of projects and also built strategic alliances with other companies to further develop its project portfolio.
Directors’ ReportF
or p
erso
nal u
se o
nly

24 PANCONTINENTAL OIL & GAS NL – ANNUAL REPORT 2011
Table 1: Director remuneration for the year ended 30 June 2011
Primary benefits Post Employment Equity Total
Value of options as proportion of
Revenue
Salary & Fees Cash STI Superannuation Options (Issued) Henry David Kennedy (Non-Executive Chairman)
2011 50,000 - - - 50,000 -2010 50,003 - - - 50,003 -
Roy Barry Rushworth (Executive Director, Chief Executive Officer)
2011 415,833 - - - 415,833 -2010 344,500 - - - 344.500 -
Ian Raymond (Inky) Cornelius (Non-Executive Director) (Passed away 14 July 2010)
2011 2,000 - - - 2,000 -2010 46,500 - - - 46,500 -
Anthony Robert Frederick Maslin (Non-Executive Director)
2011 25,806 - - - 25,806 -2010 - - - - - -
Ernest Anthony Myers (Executive Finance Director)
2011 48,000 - - - 48,000 -2010 48,000 - - - 48,000 -
Total Remuneration 541,639 - - - 541,639 - Table 2: Options granted as part of remuneration for the year ended 30 June 2011 (in accordance with the Employee Incentive Scheme) Issued
Henry David Kennedy - Roy Barry Rushworth - Ian Raymond (Inky) Cornelius - Anthony Robert Frederick Maslin - Ernest Anthony Myers - Total Options Issued - From 1 July 2003, options granted as part of director and management remuneration have been valued using a Black-Scholes option pricing model, in which the option exercise price, the current level and volatility of the underlying share price, the risk-free interest rate, expected dividends on the underlying shares, the current market price of the underlying shares and the expected life of the options are taken into account. See following table for further details. No options were granted to directors during the year.
Directors’ ReportF
or p
erso
nal u
se o
nly

PANCONTINENTAL OIL & GAS NL – ANNUAL REPORT 2011 25
Fair values of options:
The fair value of each option is estimated on the date of grant using a Black-Scholes option pricing model.
2011 2010 2009 2008 2007 2006 Expected volatility - - - 113% 112% 77.9% Risk-free interest rate - - - 6.42% 5.75% 5.32% Expected life of option - - - 5 years 5 years 5 years
Number of options Grant date Vesting date Weighted average fair value
9,250,000 29 Nov 06 28 May 07 0.06
4,500,000 29 Nov 07 28 May 08 0.05 END OF REMUNERATION REPORT DIRECTORS' MEETINGS
The numbers of meetings of directors (including meetings of committees of directors) held during the year and the number of meetings attended by each director were as follows: Directors'
Meetings
Number of meetings held: 4
Number of meetings attended: Henry David Kennedy 4
Roy Barry Rushworth 4
Ian Raymond (Inky) Cornelius -
Anthony Robert Frederick Maslin 1
Ernest Anthony Myers 4
Notes The directors are of the opinion that it is often more efficient to deal with matters by circular resolutions than by board meetings, and 7 matters were dealt with in such a manner during the year.
ROUNDING The amounts contained in this report and in the financial report have been rounded to the nearest $1 (where rounding is applicable) under the option available to the company under ASIC Class Order 98/0100. The company is an entity to which the Class Order applies. AUDITOR’S INDEPENDENCE DECLARATION
The auditor independence declaration is set out on the following page and reviews part of the Directors’ Report for the year ended 30 June 2011. NON-AUDIT SERVICES Rothsay did not receive any amounts for the provision of non-audit services during the year, although a total of $4,000 was accrued for taxation services. Signed in accordance with a resolution of the Directors.
Ernest Anthony Myers Director Perth 29 September 2011
Directors’ ReportF
or p
erso
nal u
se o
nly

26 PANCONTINENTAL OIL & GAS NL – ANNUAL REPORT 2011
Auditor Independence
AUDITOR INDEPENDENCE The directors received the following declaration from the auditor of Pancontinental Oil & Gas NL:
Auditor's Independence Declaration to the Directors of Pancontinental Oil & Gas NL In accordance with Section 307C of the Corporations Act 2001 (the “Act”) I hereby declare that to the best of my knowledge and belief there have been:
i) no contraventions of the auditor independence requirements of the Act in relation to the audit of the 30 June 2011 annual financial statements; and
ii) no contraventions of any applicable code of professional conduct in relation to the audit.
Mr Graham Swan
Lead Auditor
29 September 2011
Auditor IndependenceF
or p
erso
nal u
se o
nly
PANCONTINENTAL OIL & GAS NL – ANNUAL REPORT 2011 27
Corporate Governance Statement
In accordance with the ASX Corporate Governance Council's Corporate Governance Principles and Recommendations ("ASX Principles and Recommendations")1, Pancontinental Oil & Gas NL ("the company") has made it a priority to adopt systems of control and accountability as the basis for the administration of corporate governance. Some of these policies and procedures are summarised in this statement. Commensurate with the spirit of the ASX Principles and Recommendations, the company has followed each recommendation where the board has considered the recommendation to be an appropriate benchmark for corporate governance practices, taking into account factors such as the size of the company and the board, resources available and activities of the company. Where, after due consideration, the company's corporate governance practices depart from the ASX Principles and Recommendations, the board has offered full disclosure of the nature of and reason for the adoption of its own practice.
Further information about the company's corporate governance practices is set out on the company's website at www.pancon.com.au. In accordance with the ASX Principles and Recommendations, information published on the company's website includes charters (for the board and its committees), the company's code of conduct and other policies and procedures relating to the board and its responsibilities. EXPLANATIONS FOR DEPARTURES FROM BEST PRACTICE RECOMMENDATIONS
During the company's 2010/2011 financial year ("reporting period") the company has followed each of the ASX Principles and Recommendations, other than in relation to the matters specified below.
Principle 2
Recommendation 2.1: A majority of the board should be independent directors
Notification of Departure: Only one director was considered to be independent during the year ended 30 June 2011 – Non-Executive Director Mr Cornelius until 14 July 2010. After Mr Cornelius’ sad passing, Mr Maslin was considered to be the only independent director. Explanation for Departure:
Given the size and scope of the company's operations the board considers that it is appropriately structured to discharge its duties in a manner that is in the best interests of the company. The board believes its current composition is in line with the long term interests of shareholders. Furthermore, mechanisms are in place so that if a director considers it necessary, they may obtain independent professional advice. The board considers independence, amongst other things, when recommending new directors to the board.
Principle 2
Recommendation 2.2: The chair should be an independent director Notification of Departure
The chair is not considered to be independent. Explanation for Departure
Mr Kennedy is not independent by virtue of his substantial shareholding in the company. However, the board considers that Mr Kennedy's interests are aligned with the long term interests of shareholders. Given Mr Kennedy's extensive experience and qualifications, the board believes Mr Kennedy is the most appropriate director to carry out the role of chair.
1 A copy of the ASX Principles and Recommendations is set out on the company’s website under the Section entitled "Corporate Governance".
Corporate Governance StatementF
or p
erso
nal u
se o
nly

28 PANCONTINENTAL OIL & GAS NL – ANNUAL REPORT 2011
Principle 2
Recommendation 2.4: The board should establish a nomination committee Notification of Departure:
The full board fulfils the role of a nomination committee. Explanation for Departure:
The full board considers those matters that would usually be the responsibility of a nomination committee. The board considers that no efficiencies or other benefits would be gained by establishing a separate nomination committee. The board has adopted a nomination committee charter, which it applies when convening as the nomination committee. Principle 4
Recommendation 4.1: The board should establish an audit committee
Recommendation 4.2: Structure of the audit committee
Notification of Departure:
The full board fulfils the role of an audit committee. Explanation for Departure:
The composition of the board is not suitable for the formation of a separate audit committee in accordance with the recommendation. Further, the independent director does not possess the requisite financial expertise recommended in an audit committee. The board has adopted an audit committee charter to assist with its function as an audit committee. The audit committee charter provides that independent directors may meet with the external auditor.
Principle 7
Recommendation 7.2: Implement, manage and report on risk management system Notification of Departure:
The board has not received a formal documented report from management on the effectiveness of their management of the company’s material business risks other than verbal updates at board meetings. Explanation for Departure:
Although a formal report has not been presented to the board, the board has encouraged an increased focus on risk management implementation and reporting by completion of a risk questionnaire and risk register. These documents form the foundation for reporting on the company’s risk profile which is vital in developing and strengthening the company’s risk management policies.
Principle 8
Recommendation 8.1: The board should establish a remuneration committee
Recommendation 8.2: Structure of the remuneration committee Notification of Departure:
The board fulfils the function of a remuneration committee. Explanation for Departure:
Given the size and composition of the board, it is not practicable that a separate committee be formed. To assist it to carry out its function in relation to remuneration matters, the board has adopted a remuneration committee charter.
Corporate Governance StatementF
or p
erso
nal u
se o
nly

PANCONTINENTAL OIL & GAS NL – ANNUAL REPORT 2011 29
COMMITTEE MEETINGS Due to the size of the current board, the functions of the Nomination, Audit and Remuneration Committees were carried out by the full board during the financial year. As such, no separate meetings were held for the Nomination and Remuneration Committees. The board agenda incorporated these items and appropriate discussions were held on each issue at the board meetings.
Details of each of the director's qualifications are set out in the Directors’ Report. All of the directors have substantial industry experience and consider themselves to be financially literate. Mr Myers is a Certified Practising Accountant and therefore meets the tests of financial expertise. OTHER Skills, Experience, Expertise and term of office of each Director A profile of each director containing the skills, experience, expertise and term of office of each director is set out in the Directors' Report. Identification of Independent Directors In considering the independence of directors, the board refers to the criteria for independence as set out in Box 2.1 of the ASX Principles and Recommendations ("Independence Criteria"). To the extent that it is necessary for the board to consider issues of materiality, the board refers to the thresholds for qualitative and quantitative materiality as adopted by the board and contained in the board charter, which is disclosed in full on the company’s website.
Applying the Independence Criteria, the independent director of the company for the year ended 30 June 2011 was Mr Cornelius until his passing on 14 July 2010 and then Mr Maslin was appointed and became the independent director.
Corporate Reporting
ASX Principle 7.3 requires the board to disclose whether it has received assurance from the Chief Executive Officer (or equivalent) and the Chief Financial Officer (or equivalent) that the declaration provided in accordance with section 295A of the Corporations Act is founded on a sound system of risk management and internal control and that the system is operating effectively in all material respects in relation to financial reporting risks. The board confirms that such assurance has been received.
Statement concerning availability of Independent Professional Advice If a director considers it necessary to obtain independent professional advice to properly discharge the responsibility of his/her office as a director, then, provided the director first obtains approval for incurring such expense from the chair, the company will pay the reasonable expenses associated with obtaining such advice. Confirmation of whether performance Evaluation of the Board and its members has taken place and how it was conducted During the reporting period a formal evaluation of the board and its members was not carried out as it was not considered to be a beneficial procedure given the size and composition of the board and the nature of the company's operations. However, the composition of the board and its suitability to carry out the company's objectives is discussed on an as-required basis during regular meetings of the board and any adjustments are made accordingly. Existence and Terms of any Schemes for Retirement Benefits for Executive and Non-Executive Directors
There are no termination or retirement benefits for non-executive directors.
Directors’ Terms in Office
Name Term in officeHenry David Kennedy 12 years
Roy Barry Rushworth 6 years
Ian Raymond Cornelius 18 years
Ernest Anthony Myers 2 years
For additional details regarding board appointments, please refer to the Pancontinental website.
Corporate Governance StatementF
or p
erso
nal u
se o
nly

30 PANCONTINENTAL OIL & GAS NL – ANNUAL REPORT 2011
Diversity – Board Composition The mix of skills and diversity for which the company is looking to achieve in membership of the board is one that is as diverse as practicable given the size and scope of the company’s operations. The company has adopted a Diversity Policy which is available on the company’s website under the Corporate Governance section.
Diversity – Measurable Objectives
The company’s primary objectives with regard to diversity are as follows:
the company’s composition of board, executive, management and employees to be as diverse as practicable; and to provide equal opportunities for all positions within the company and continue the company’s commitment to employment
based on merit.
Primary objectives set by the company with regard to diversity have been met, as described below:
blend of skills – wide range of backgrounds; geology, petroleum exploration, finance and corporate experience; cultural backgrounds – Australian, European and American; gender – both male and female members; and age – the age range spans over 40 years.
The above points relate to the composition of the board, as the company does not have any employees. Diversity – Annual Reporting
The company’s annual reporting on the percentage of females in the organisation is as follows:
% Female
Employees
N/A [no employees]
Executives & Board Members
20%
Corporate Governance StatementF
or p
erso
nal u
se o
nly

PANCONTINENTAL OIL & GAS NL – ANNUAL REPORT 2011 31
Statement of Comprehensive Income YEAR ENDED 30 JUNE 2011 Notes CONSOLIDATED 2011 2010 $ $ Revenue from operating activities Interest received 89,526 33,070 Other - 8,782 Total revenues from operating activities 89,526 41,852 Depreciation and amortisation expenses 2, 6 (1,183) (1,633) Salaries, fees and benefits (322,999) (380,939) Audit fees (45,500) (35,500) Generative exploration expenditure and write off 2 (58,387) (65,542) Annual report costs (17,291) (16,945) ASX fees (35,435) (23,857) Administration, accounting and secretarial fees (240,404) (218,441) Insurance (22,167) (22,420) Legal fees (55,425) (13,493) Share registry costs (20,351) (17,400) Rent and outgoings (92,380) (103,417) Travel (100,998) (45,968) Other revenues and expenses (44,037) (49,537) Provision for loss on investments - (833,414) Profit/(Loss) before Income Tax Expense (967,031) (1,786,654) Income Tax Expense 3 - - Profit/(Loss) for the Period (967,031) (1,786,654) Other Comprehensive Income/(Loss) Other comprehensive income - - Other Comprehensive Income/(Loss) for the Period, Net of Income Tax - - TOTAL COMPREHENSIVE INCOME/(LOSS) FOR THE PERIOD 10 (967,031) (1,786,654) Basic earnings per share (cents per share) 15 (0.16) (0.32) Diluted earnings per share (cents per share) (0.16) (0.32)
The Statement of Comprehensive Income is to be read in conjunction with the Notes to the Financial Statements.
Statement of Comprehensive IncomeF
or p
erso
nal u
se o
nly

32 PANCONTINENTAL OIL & GAS NL – ANNUAL REPORT 2011
Statement of Financial Position AT 30 JUNE 2011 Notes CONSOLIDATED 2011 2010
$ $
CURRENT ASSETS Cash assets 5,710,905 1,639,859 Trade and other receivables 4 44,028 19,318 TOTAL CURRENT ASSETS 5,754,933 1,659,177 NON-CURRENT ASSETS Property, plant and equipment 6 2,404 2,280 Deferred exploration, evaluation and development costs 7 9,879,712 10,129,621 TOTAL NON-CURRENT ASSETS 9,882,116 10,131,901 TOTAL ASSETS 15,637,049 11,791,078 CURRENT LIABILITIES Trade and other payables 8 187,740 106,993 TOTAL CURRENT LIABILITIES 187,740 106,993 TOTAL LIABILITIES 187,740 106,993 NET ASSETS 15,449,309 11,684,085 EQUITY Parent entity interest
Contributed equity 9a 38,166,253 33,433,998 Reserves 10 764,258 1,187,215 Accumulated losses 10 (23,481,202) (22,937,128)
Total parent entity interest in equity 15,449,309 11,684,085 TOTAL EQUITY 15,449,309 11,684,085
The Statement of Financial Position is to be read in conjunction with the Notes to the Financial Statements.
Statement of Financial PositionF
or p
erso
nal u
se o
nly

PANCONTINENTAL OIL & GAS NL – ANNUAL REPORT 2011 33
Statement of Changes in Equity AT 30 JUNE 2011
Consolidated Share Capital Retained Earnings
OptionReserve
TotalEquity
$ $ $ $
Balance at 1 July 2010 33,433,998 (22,937,128) 1,187,215 11,684,085Profit or loss - (967,031) - (967,031)Other comprehensive income/(loss) - - - -Shares issued (net of costs) 4,732,255 - - 4,732,255Share options 422,957 (422,957) -Balance at 30 June 2011 38,166,253 (23,481,202) 764,258 15,449,309 Balance at 1 July 2009 30,361,641 (21,219,786) 1,256,527 10,398,382 Profit or loss - (1,786,654) - (1,786,654) Shares issued (net of costs) 2,238,943 - - 2,238,943 Shares on acquisition 833,414 - - 833,414 Share options - 69,312 (69,312) - Balance at 30 June 2010 33,433,998 (22,937,128) 1,187,215 11,684,085
The above Statement of Changes in Equity is to be read in conjunction with the Notes to the Financial Statements.
Statement of Changes in EquityF
or p
erso
nal u
se o
nly

34 PANCONTINENTAL OIL & GAS NL – ANNUAL REPORT 2011
Statement of Cash Flows YEAR ENDED 30 JUNE 2011 Notes CONSOLIDATED 2011 2010
$ $
CASH FLOWS FROM OPERATING ACTIVITIES Payments to suppliers and employees (1,044,789) (1,043,732)Interest received 89,526 38,805Sundry income – reimbursement of exploration expenditure 1,083,151 283,995Expenditure on exploration interests (789,097) (597,838)NET CASH FLOWS FROM/(USED IN) OPERATING ACTIVITIES 11(a) (661,209) (1,318,770) CASH FLOWS FROM INVESTING ACTIVITIES Purchase of property, plant and equipment 6 - -NET CASH FLOWS FROM/(USED IN) INVESTING ACTIVITIES - - CASH FLOWS FROM FINANCING ACTIVITIES Proceeds from issues of ordinary shares 5,000,000 2,446,575Share issue costs (267,745) (208,831)NET CASH FLOWS FROM/(USED IN) FINANCING ACTIVITIES 4,732,255 2,237,744 NET INCREASE/(DECREASE) IN CASH HELD 4,071,046 918,974Add opening cash brought forward 1,639,859 720,804Effects of exchange rate changes - 81CLOSING CASH CARRIED FORWARD 11(b) 5,710,905 1,639,859
The above Statement of Cash Flows is to be read in conjunction with the Notes to the Financial Statements.
Statement of Cash FlowsF
or p
erso
nal u
se o
nly
PANCONTINENTAL OIL & GAS NL – ANNUAL REPORT 2011 35
Notes to the Financial Statements 1. SUMMARY OF SIGNIFICANT ACCOUNTING POLICIES This financial report was authorised for issue by the directors on 29 September 2011.
Statement of Compliance
This financial report is a general purpose financial report, which has been prepared in accordance with Australian Accounting Standards (AASBs), adopted by the Australian Accounting Standards Board (AASB) and the Corporations Act 2001. International Financial Reporting Standards (IFRSs) form the basis of AASBs adopted by the AASB, and for the purpose of this report are called Australian equivalents to IRFS (AIFRS) to distinguish from previous Australian GAAP. The financial report complies with IFRSs and interpretations adopted by the International Accounting Standards Board.
Basis of preparation
The report has been prepared on the basis of historical costs and except where stated does not take into account changing money values or current valuation of non-current assets. The accounting policies adopted are consistent with those of the previous year. The following specific accounting policies have been consistently applied, unless otherwise stated. (a) Income TaxIncome tax on the profit or loss for the year comprises current and deferred tax. Income tax is recognised in the income statement except to the extent that it relates to items recognised directly in equity, in which case it is recognised in equity. Current tax is the expected tax payable on the taxable income for the year, and any adjustment to tax payable in respect of prior years. Deferred tax is provided using the balance sheet liability method, providing for temporary difference between the carrying amounts of assets and liabilities for financial reporting purposes and the amounts used for taxation purposes. A deferred tax asset is recognised only to the extent that it is probable that future taxable profits will be available against which the asset can be utilised. (b) Exploration Expenses Exploration, evaluation and development costs are accumulated in respect of each separate area of interest. Such costs are carried forward where they are expected to be recouped through successful development and exploitation of the area of interest or alternatively, by its sale, or where activities in the area of interest have not yet reached a stage to allow a reasonable assessment regarding the existence of economically recoverable reserves. (c) Principles of consolidationThe consolidated financial statements are those of the consolidated entity, comprising Pancontinental Oil & Gas NL (the parent entity) and all entities which Pancontinental Oil & Gas NL controlled from time to time during the year and at balance date. Information from the financial statements of subsidiaries is included from the date the parent company obtains control until such time as control ceases. Where there is loss of control of a subsidiary, the consolidated financial statements include the results for the part of the reporting period during which the parent company has control. All intercompany balances and transactions, including unrealised profits arising from intra-group transactions, have been eliminated in full. (d) Foreign currenciesTranslation of foreign currency transactions Transactions in foreign currencies of entities within the consolidated entity are converted to local currency at the rate of exchange ruling at the date of the transaction. Foreign currency monetary items that are outstanding at the reporting date (other than monetary items arising under foreign currency contracts where the exchange rate for that monetary item is fixed in the contract) are translated using the spot rate at the end of the financial year. A monetary item arising under a foreign currency contract outstanding at the reporting date where the exchange rate for the monetary item is fixed in the contract is translated at the exchange rate fixed in the contract. All resulting exchange differences arising on settlement or re-statement are recognised as revenues and expenses for the financial year. Any gains or costs on entering a hedge are deferred and amortised over the life of the contract. (e) Cash and cash equivalentsFor the purposes of the Statement of Cash Flows, cash includes cash on hand and in banks, and money market investments readily convertible to cash within two working days, net of outstanding bank overdrafts. Interest expense is charged as an expense as it accrues.
Notes to the Financial StatementsF
or p
erso
nal u
se o
nly

36 PANCONTINENTAL OIL & GAS NL – ANNUAL REPORT 2011
(f) ReceivablesTrade receivables are recognised and carried at original invoice amount less a provision for any uncollectible debts. An estimate for doubtful debts is made when collection of the full amount is no longer probable. Bad debts are written-off as incurred. Receivables from related parties are recognised and carried at the nominal amount due. Bills of exchange and promissory notes are measured at the lower of cost and net realisable value. (g) InvestmentsInvestments in controlled entities are carried in the company’s financial statements at the lower of cost and recoverable amount. (h) Recoverable AmountThe carrying amounts of non-current assets valued on the cost basis, other than exploration and evaluation expenditure carried forward are reviewed to determine whether they are in excess of their recoverable amount at reporting date. If the carrying amount of a non-current asset exceeds its recoverable amount, the asset is written down to the lower amount. The write down is expensed in the reporting period in which it occurs. (i) Property, plant and equipmentCost and valuationProperty, plant and equipment is measured at cost. Depreciation Depreciation is provided on a straight line basis on all property, plant and equipment.
Major depreciation rates are: 2011 2010
Plant and equipment: 30% 30%
(j) Joint venturesInterests in the joint venture operations are brought to account by including in the respective classifications, the share of individual assets employed and share of liabilities and expenses incurred. In the company’s financial statements, investments in joint venture operations were carried at the lower of cost and recoverable amount. (k) Going concernThe directors consider that the going concern basis for the consolidated entity is appropriate and recognise that additional funding is required to ensure the consolidated entity can continue its operations for the twelve month period from the date of this financial report and to fund the continued development of the consolidated entity’s exploration assets. This basis has been determined after consideration of the following factors: The ability to issue additional share capital under the Corporations Act 2001, if required, by a share purchase plan, share placement
or rights issue; The option of farming out all or part of the consolidated entity’s exploration projects; and The ability, if required to dispose of interests in exploration and development assets. Accordingly, the directors believe that the consolidated entity will obtain sufficient cash inflows to enable it to continue as a going concern and that it is appropriate to adopt that basis of accounting in the preparation of the financial statements.
(l) PayablesLiabilities for trade creditors and other amounts are carried at cost which is the fair value of the consideration to be paid in the future for goods and services received, whether or not billed to the consolidated entity. Payables to related parties are carried at the principal amount. Deferred cash settlements are recognised at the present value of the outstanding consideration payable on the acquisition of an asset discounted at prevailing commercial borrowing rates. (m) ProvisionsProvisions are recognised when the economic entity has a legal, equitable or constructive obligation to make a future sacrifice of economic benefits to other entities as a result of past transactions or other past events, it is probable that a future sacrifice of economic benefits will be required and a reliable estimate can be made of the amount of the obligation. (n) Contributed equityIssued and paid up capital is recognised at the fair value of the consideration received by the company. Any transaction costs arising on the issue of ordinary shares are recognised directly in equity as a reduction of the share proceeds received.
Notes to the Financial StatementsF
or p
erso
nal u
se o
nly

PANCONTINENTAL OIL & GAS NL – ANNUAL REPORT 2011 37
(o) Revenue recognitionRevenue is recognised to the extent that it is probable that the economic benefits will flow to the entity and the revenue can be reliably measured. The following specific recognition criteria must also be met before revenue is recognised: Rendering of ServicesWhere the contract outcome can be reliably measured, control of the right to be compensated for the services and the stage of completion can be reliably measured. Stage of completion is measured by reference to the labour hours incurred to date as a percentage of total estimated labour hours for each contract. Where the contract outcome cannot be reliably measured, revenue is recognised only to the extent that costs have been incurred. Interest RevenueControl of the right to receive the interest payment. Interest revenue is recognised as it accrues, taking into account the effective yield on the financial asset. (p) TaxesTax-effect accounting is applied using the income statement liability method whereby income tax is regarded as an expense and is calculated on the accounting profit after allowing for permanent differences. To the extent timing differences occur between the time items are recognised in the financial statements and when items are taken into account in determining taxable income, the net related taxation benefit or liability, calculated at current rates, is disclosed as a future income tax benefit or a provision for deferred income tax. The net future income tax benefit relating to tax losses and timing differences is not carried forward as an asset unless the benefit is virtually certain of being realised. Where assets are revalued no provision for potential capital gains tax has been made. Goods and Services Tax (GST)
Revenues, expenses and assets are recognised net of the amount of GST except: where the GST incurred on a purchase of goods and services is not recoverable from the taxation authority, in which case the GST is
recognised as part of the cost of acquisition of the asset or as part of the expense item as applicable; and receivables and payables are stated with the amount of GST included.
The net amount of GST recoverable from, or payable to, the taxation authority is included as part of receivables or payables in the Statement of Financial Position. Cash flows are included in the Statement of Cash Flows on a gross basis and the GST component of cash flows arising from investing and financing activities, which is recoverable from, or payable to, the taxation authority, are classified as operating cash flows. Commitments and contingencies are disclosed net of the amount of GST recoverable from, or payable to, the taxation authority. (q) Employee benefitsProvision is made for employee benefits accumulated as a result of employees rendering services up to the reporting date. These benefits include wages and salaries, annual leave, sick leave and long service leave. Liabilities arising in respect of wages and salaries, annual leave, sick leave and any other employee benefits expected to be settled within twelve months of the reporting date are measured at their nominal amounts based on remuneration rates which are expected to be paid when the liability is settled. Employee benefit expenses and revenues arising in respect of the following categories: wages and salaries, non-monetary benefits, annual leave, long service leave, sick leave and other leave benefits; and other types of employee benefits
are charged against profits on a net basis in their respective categories. (r) Earnings per shareBasic EPS is calculated as net profit attributable to members, adjusted to exclude costs of servicing equity (other than dividends) and preference share dividends, divided by the weighted average number of ordinary shares, adjusted for any bonus element. Diluted EPS is calculated as net profit attributable to members, adjusted for: costs of servicing equity (other than dividends); the after tax effect of dividends and interest associated with dilutive potential ordinary shares that have been recognised as expenses;
and other non-discretionary changes in revenues or expenses during the period that would result from the dilution of potential ordinary
shares;
divided by the weighted average number of ordinary shares and dilutive potential ordinary shares, adjusted for any bonus element. (s) Comparatives Where necessary, comparatives have been reclassified and repositioned for consistency with current year disclosures.
Notes to the Financial StatementsF
or p
erso
nal u
se o
nly

38 PANCONTINENTAL OIL & GAS NL – ANNUAL REPORT 2011
(t) Financial InstrumentsSee financial instruments note for compliance notes with AASB 7, financial instruments : disclosures. (u) New accounting standards and interpretationsThe financial report is presented in Australian dollars which is the company’s functional currency. The following standards, amendments to standards and interpretations have been identified as those which may impact the entity in the period of initial application.
AASB 9: Financial Instruments (December 2010) (applicable for annual reporting periods commencing on or after 1 January 2013)
This Standard is applicable retrospectively and includes revised requirements for the classification and measurement of financial instruments, as well as recognition and derecognition requirements for financial instruments. The Company has not yet determined any potential impact on the financial statements.
The key changes made to accounting requirements include: simplifying the classifications of financial assets into those carried at amortised cost and those carried at fair value; simplifying the requirements for embedded derivatives; removing the tainting rules associated with held-to-maturity assets; removing the requirements to separate and fair value embedded derivatives for financial assets carried at amortised cost; allowing an irrevocable election on initial recognition to present gains and losses on investments in equity instruments that are not
held for trading in other comprehensive income. Dividends in respect of these investments that are a return on investment can be recognised in profit or loss and there is no impairment or recycling on disposal of the instrument;
requiring financial assets to be reclassified where there is a change in an entity’s business model as they are initially classified based on: (a) the objective of the entity’s business model for managing the financial assets; and (b) the characteristics of the contractual cash flows; and
requiring an entity that chooses to measure a financial liability at fair value to present the portion of the change in its fair value due to changes in the entity’s own credit risk in other comprehensive income, except when that would create an accounting mismatch. If such a mismatch would be created or enlarged, the entity is required to present all changes in fair value (including the effects of changes in the credit risk of the liability) in profit or loss.
AASB 124: Related Party Disclosures (applicable for annual reporting periods commencing on or after 1 January 2011)
This Standard removes the requirement for government-related entities to disclose details of all transactions with the government and other government-related entities and clarifies the definition of a “related party” to remove inconsistencies and simplify the structure of the Standard. No changes are expected to materially affect the Company.
AASB 1053: Application of Tiers of Australian Accounting Standards and AASB 2010–2: Amendments to Australian Accounting Standards arising from Reduced Disclosure Requirements [AASB 1, 2, 3, 5, 7, 8, 101, 102, 107, 108, 110, 111, 112, 116, 117, 119, 121, 123, 124, 127, 128, 131, 133, 134, 136, 137, 138, 140, 141, 1050 & 1052 and Interpretations 2, 4, 5, 15, 17, 127, 129 & 1052] (applicable for annual reporting periods commencing on or after 1 July 2013)
AASB 1053 establishes a revised differential financial reporting framework consisting of two tiers of financial reporting requirements for those entities preparing general purpose financial statements: Tier 1: Australian Accounting Standards; and Tier 2: Australian Accounting Standards – Reduced Disclosure Requirements.
Tier 2 of the framework comprises the recognition, measurement and presentation requirements of Tier 1, but contains significantly fewer disclosure requirements. The following entities are required to apply Tier 1 reporting requirements (ie full IFRS): for-profit private sector entities that have public accountability; and the Australian Government and state, territory and local governments.
Since the Company is a for-profit private sector entity that has public accountability, it does not qualify for the reduced disclosure requirements for Tier 2 entities.
AASB 2010–2 makes amendments to Australian Accounting Standards and Interpretations to give effect to the reduced disclosure requirements for Tier 2 entities. It achieves this by specifying the disclosure paragraphs that a Tier 2 entity need not comply with as well as adding specific “RDR” disclosures.
AASB 2009–12: Amendments to Australian Accounting Standards [AASBs 5, 8, 108, 110, 112, 119, 133, 137, 139, 1023 & 1031 and Interpretations 2, 4, 16, 1039 & 1052] (applicable for annual reporting periods commencing on or after 1 January 2011)
This Standard makes a number of editorial amendments to a range of Australian Accounting Standards and Interpretations, including amendments to reflect changes made to the text of IFRSs by the IASB. The Standard also amends AASB 8 to require entities to exercise judgment in assessing whether a government and entities known to be under the control of that government are considered a single customer for the purposes of certain operating segment disclosures. The amendments are not expected to impact the Company.
Notes to the Financial StatementsF
or p
erso
nal u
se o
nly

PANCONTINENTAL OIL & GAS NL – ANNUAL REPORT 2011 39
AASB 2009–14: Amendments to Australian Interpretation – Prepayments of a Minimum Funding Requirement [AASB Interpretation 14] (applicable for annual reporting periods commencing on or after 1 January 2011)
This Standard amends Interpretation 14 to address unintended consequences that can arise from the previous accounting requirements when an entity prepays future contributions into a defined benefit pension plan.
This Standard is not expected to impact the Company.
AASB 2010–4: Further Amendments to Australian Accounting Standards arising from the Annual Improvements Project [AASB 1, AASB 7, AASB 101 & AASB 134 and Interpretation 13] (applicable for annual reporting periods commencing on or after 1 January 2011)
This Standard details numerous non-urgent but necessary changes to Accounting Standards arising from the IASB’s annual improvements project. Key changes include: clarifying the application of AASB 108 prior to an entity’s first Australian-Accounting-Standards financial statements; adding an explicit statement to AASB 7 that qualitative disclosures should be made in the context of the quantitative disclosures to
better enable users to evaluate an entity’s exposure to risks arising from financial instruments; amending AASB 101 to the effect that disaggregation of changes in each component of equity arising from transactions recognised in
other comprehensive income is required to be presented, but is permitted to be presented in the statement of changes in equity or in the notes;
adding a number of examples to the list of events or transactions that require disclosure under AASB 134; and making sundry editorial amendments to various Standards and Interpretations.
This Standard is not expected to impact the Company.
AASB 2010–5: Amendments to Australian Accounting Standards [AASB 1, 3, 4, 5, 101, 107, 112, 118, 119, 121, 132, 133, 134, 137, 139, 140, 1023 & 1038 and Interpretations 112, 115, 127, 132 & 1042] (applicable for annual reporting periods beginning on or after1 January 2011)
This Standard makes numerous editorial amendments to a range of Australian Accounting Standards and Interpretations, including amendments to reflect changes made to the text of IFRSs by the IASB. However, these editorial amendments have no major impact on the requirements of the respective amended pronouncements.
AASB 2010–6: Amendments to Australian Accounting Standards – Disclosures on Transfers of Financial Assets [AASB 1 & AASB 7] (applicable for annual reporting periods beginning on or after 1 July 2011)
This Standard adds and amends disclosure requirements about transfers of financial assets, especially those in respect of the nature of the financial assets involved and the risks associated with them. Accordingly, this Standard makes amendments to AASB 1: First-time Adoption of Australian Accounting Standards, and AASB 7: Financial Instruments: Disclosures, establishing additional disclosure requirements in relation to transfers of financial assets.
This Standard is not expected to impact the Company.
AASB 2010–7: Amendments to Australian Accounting Standards arising from AASB 9 (December 2010) [AASB 1, 3, 4, 5, 7, 101, 102, 108, 112, 118, 120, 121, 127, 128, 131, 132, 136, 137, 139, 1023 & 1038 and Interpretations 2, 5, 10, 12, 19 & 127] (applies to periods beginning on or after 1 January 2013)
This Standard makes amendments to a range of Australian Accounting Standards and Interpretations as a consequence of the issuance of AASB 9: Financial Instruments in December 2010. Accordingly, these amendments will only apply when the entity adopts AASB 9.
As noted above, the Company has not yet determined any potential impact on the financial statements from adopting AASB 9.
AASB 2010–8: Amendments to Australian Accounting Standards – Deferred Tax: Recovery of Underlying Assets [AASB 112] (applies to periods beginning on or after 1 January 2012)
This Standard makes amendments to AASB 112: Income Taxes.
The amendments brought in by this Standard introduce a more practical approach for measuring deferred tax liabilities and deferred tax assets when investment property is measured using the fair value model under AASB 140: Investment Property.
Under the current AASB 112, the measurement of deferred tax liabilities and deferred tax assets depends on whether an entity expects to recover an asset by using it or by selling it. The amendments introduce a presumption that an investment property is recovered entirely through sale. This presumption is rebutted if the investment property is held within a business model whose objective is to consume substantially all of the economic benefits embodied in the investment property over time, rather than through sale.
The amendments brought in by this Standard also incorporate Interpretation 121 into AASB 112.
The amendments are not expected to impact the Company.
Notes to the Financial StatementsF
or p
erso
nal u
se o
nly

40 PANCONTINENTAL OIL & GAS NL – ANNUAL REPORT 2011
AASB 2010–9: Amendments to Australian Accounting Standards – Severe Hyperinflation and Removal of Fixed Dates for First-time Adopters [AASB 1] (applies to periods beginning on or after 1 July 2011)
This Standard makes amendments to AASB 1: First-time Adoption of Australian Accounting Standards.
The amendments brought in by this Standard provide relief for first-time adopters of Australian Accounting Standards from having to reconstruct transactions that occurred before their date of transition to Australian Accounting Standards.
Furthermore, the amendments brought in by this Standard also provide guidance for entities emerging from severe hyperinflation either to resume presenting Australian-Accounting-Standards financial statements or to present Australian-Accounting-Standards financial statements for the first time.
This Standard is not expected to impact the Company.
AASB 2010–10: Further Amendments to Australian Accounting Standards – Removal of Fixed Dates for First-time Adopters [AASB 2009–11 & AASB 2010–7] (applies to periods beginning on or after 1 January 2013)
This Standard makes amendments to AASB 2009–11: Amendments to Australian Accounting Standards arising from AASB 9, and AASB 2010–7: Amendments to Australian Accounting Standards arising from AASB 9 (December 2010).
The amendments brought in by this Standard ultimately affect AASB 1: First-time Adoption of Australian Accounting Standards and provide relief for first-time adopters from having to reconstruct transactions that occurred before their transition date.
[The amendments to AASB 2009–11 will only affect early adopters of AASB 2009–11 (and AASB 9: Financial Instruments that was issued in December 2009) as it has been superseded by AASB 2010–7.]
This Standard is not expected to impact the Company.
None of the other amendments or Interpretations are expected to affect the accounting policies of the Company.
Notes to the Financial StatementsF
or p
erso
nal u
se o
nly

PANCONTINENTAL OIL & GAS NL – ANNUAL REPORT 2011 41
2. DEPRECIATION AND WRITE OFF Notes CONSOLIDATED
2011 2010
$ $
ExpensesDepreciation of non-current assets: Office furniture and equipment 1,183 1,633 Generative exploration and write off: Exploration, evaluation and development costs 58,387 65,542
3. INCOME TAX CONSOLIDATED
2011 2010
$ $
(a) Income Tax (Benefit)/Expense
The prima facie tax, using tax rates applicable in the country of operation, on profit and extraordinary items differs from the income tax provided in the financial statements as follows:
Prima facie tax on profit from ordinary activities (290,109) (535,996) Tax effect of permanent differences:
Other items (net) - 55,879 Amount not brought to account as a carried forward future income tax benefit 290,109 480,117 Income tax expense attributable to ordinary activities - -
(b) Future Income Tax Benefit not taken into account
The potential future income tax benefit calculated at 30% in respect of :
Adjustments to carry forward tax losses
- -
Tax Losses not brought to account 5,267,832 4,929,565 Total 5,267,832 4,929,565 This future income tax benefit will only be obtained if:
(a) future assessable income is derived of a nature and of an amount sufficient to enable the benefit to be realised;
(b) the conditions for deductibility imposed by tax legislation continue to be complied with; and
(c) no changes in tax legislation adversely affect the consolidated entity in realising the benefit.
4. RECEIVABLES (CURRENT) CONSOLIDATED
2011 2010
$ $
Sundry receivables 44,028 19,318 Total 44,028 19,318
(a) Terms and conditions
(i) Trade debtors are non-interest bearing and generally on 30 day terms.
(ii) Sundry debtors and other receivables are non-interest bearing and have repayment terms between 30 and 90 days.
Notes to the Financial StatementsF
or p
erso
nal u
se o
nly
42 PANCONTINENTAL OIL & GAS NL – ANNUAL REPORT 2011
5. INTERESTS IN SUBSIDIARIES
Name Country of incorporation
Percentage of equity interest held by the consolidated entity
Investment
2011 2010 2011 2010 % % $ $ Starstrike Resources Ltd * British Virgin Islands 100 100 380,000 380,000 Provision for diminution in value of investment (380,000) (380,000) Loan to Starstrike Resources Ltd 50,096 44,764 Provision for loss on loan to Starstrike Resources Ltd - (44,764) Euro Pacific Energy Pty Ltd Australia 100 100 2 2 Provision for diminution in value of investment (2) (2) Loan to Euro Pacific Energy Pty Ltd (165,048) (165,881) Provision for loss on loan to Euro Pacific Energy Pty Ltd - - Afrex Ltd * Saint Lucia 100 100 10,584,107 10,584,106 Provision for diminution in value of investment (4,489,014) (4,461,793) Loan to Afrex Ltd 699,121 592,702 Provision for loss on loan to Afrex Ltd - - Total 6,679,262 6,549,134
*Indicates companies not audited by Rothsay Chartered Accountants.
6. PROPERTY, PLANT AND EQUIPMENT CONSOLIDATED
2011 2010
$ $
Office equipment At cost 50,737 49,429 Less: Accumulated depreciation (48,333) (47,149) Total written down amount 2,404 2,280
Reconciliations Reconciliations of the carrying amounts of property, plant and equipment Office equipment Carrying amount opening balance 2,280 3,913 Additions 1,307 - Depreciation expense (1,183) (1,633) Total written down amount 2,404 2,280
Notes to the Financial StatementsF
or p
erso
nal u
se o
nly

PANCONTINENTAL OIL & GAS NL – ANNUAL REPORT 2011 43
7. DEFERRED EXPLORATION, EVALUATION AND DEVELOPMENT COSTS CONSOLIDATED
2011 2010
$ $
Exploration, evaluation and development costs carried forward Pre-production: exploration and evaluation phases: Carrying amount at 1 July 10,129,621 9,765,421 Expenditure during the year 836,297 388,648 Exploration expenditure written off (3,055) (24,448) Recovery of past exploration expenditure * (1,083,151) - Carrying amount at 30 June 9,879,712 10,129,621 The ultimate recoupment of costs carried forward for exploration and evaluation phases is dependent on the successful development and commercial exploitation or sale of the respective mining areas. * The Company received reimbursement for past exploration costs during the financial year with regard to its Kenyan blocks L8, L10A and L10B. 8. TRADE and OTHER PAYABLES (CURRENT) CONSOLIDATED
2011 2010
$ $
Trade creditors 187,740 106,993 Total 187,740 106,993 9. CONTRIBUTED EQUITY CONSOLIDATED
2011 2010
$ $
(a) Issued and paid up capital Ordinary shares fully paid 38,166,253 33,433,998 Total 38,166,253 33,433,998
(b) Movements in shares on issue 2011 2010
Number of shares $ Number of
shares $ Beginning of the financial year 592,286,658 33,433,998 510,050,826 30,361,641 Issued during the year: public equity raising (net costs) 68,493,151 4,732,255 82,235,832 2,238,943 shares on acquisition - - - 833,414 End of the financial year 660,779,809 38,166,253 592,286,658 33,433,998
Notes to the Financial StatementsF
or p
erso
nal u
se o
nly
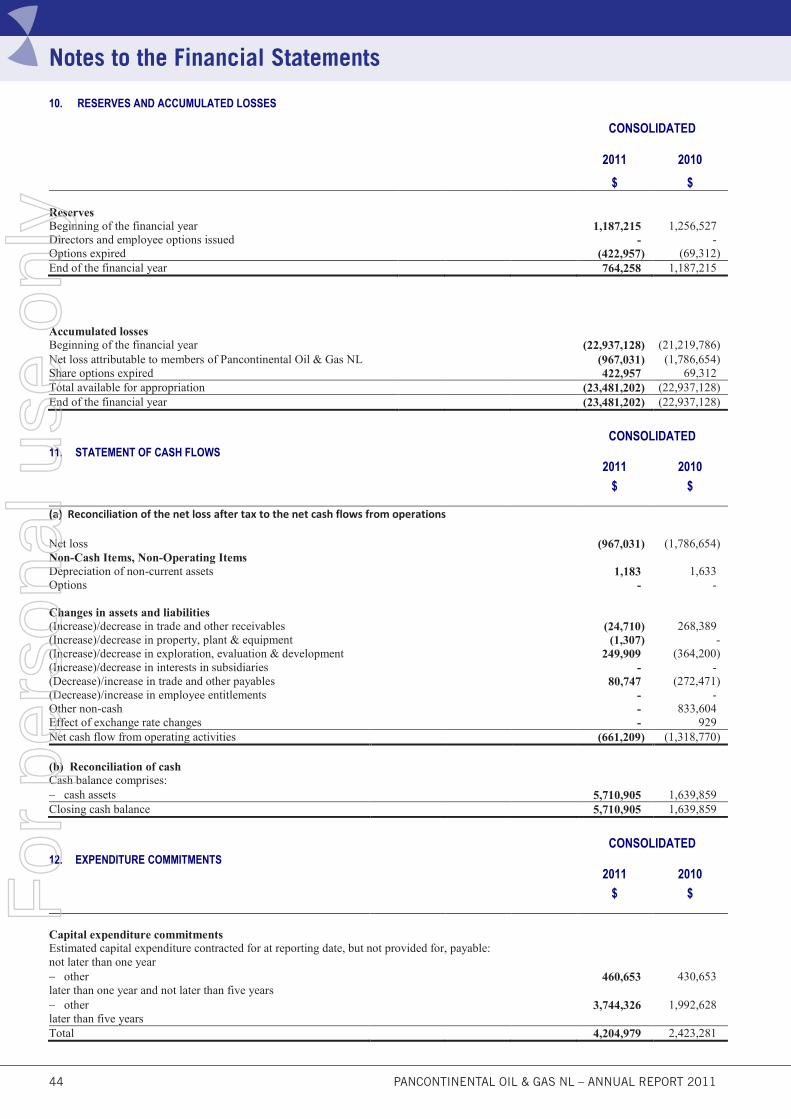
44 PANCONTINENTAL OIL & GAS NL – ANNUAL REPORT 2011
10. RESERVES AND ACCUMULATED LOSSES CONSOLIDATED
2011 2010
$ $ Reserves Beginning of the financial year 1,187,215 1,256,527 Directors and employee options issued - - Options expired (422,957) (69,312) End of the financial year 764,258 1,187,215
Accumulated lossesBeginning of the financial year (22,937,128) (21,219,786) Net loss attributable to members of Pancontinental Oil & Gas NL (967,031) (1,786,654) Share options expired 422,957 69,312 Total available for appropriation (23,481,202) (22,937,128) End of the financial year (23,481,202) (22,937,128)
11. STATEMENT OF CASH FLOWS CONSOLIDATED
2011 2010
$ $
(a) Reconciliation of the net loss after tax to the net cash flows from operations
Net loss (967,031) (1,786,654) Non-Cash Items, Non-Operating Items Depreciation of non-current assets 1,183 1,633 Options - -
Changes in assets and liabilities(Increase)/decrease in trade and other receivables (24,710) 268,389 (Increase)/decrease in property, plant & equipment (1,307) - (Increase)/decrease in exploration, evaluation & development 249,909 (364,200) (Increase)/decrease in interests in subsidiaries
- -
(Decrease)/increase in trade and other payables 80,747 (272,471) (Decrease)/increase in employee entitlements - - Other non-cash - 833,604 Effect of exchange rate changes - 929 Net cash flow from operating activities (661,209) (1,318,770)
(b) Reconciliation of cashCash balance comprises: cash assets 5,710,905 1,639,859 Closing cash balance 5,710,905 1,639,859
12. EXPENDITURE COMMITMENTS CONSOLIDATED
2011 2010 $ $
Capital expenditure commitments
Estimated capital expenditure contracted for at reporting date, but not provided for, payable: not later than one year other 460,653 430,653 later than one year and not later than five years other 3,744,326 1,992,628 later than five years Total 4,204,979 2,423,281
Notes to the Financial StatementsF
or p
erso
nal u
se o
nly

PANCONTINENTAL OIL & GAS NL – ANNUAL REPORT 2011 45
13. EMPLOYEE BENEFITS
Employee Share Scheme Information with respect to the number of options under the employee share incentive scheme is as follows: 2011 2010
Number of
options
Weightedaverage
exercise priceNumber of
options
Weighted average
exercise priceBalance at beginning of year 23,250,000 0.09 27,225,000 0.10 expired (9,500,000) 0.09 (3,975,000) 0.15 Balance at end of year 13,750,000 0.08 23,250,000 0.09
Options held at the end of the reporting periodThe following table summarises information about options held by directors and employees as at 30 June 2011:
Number of options Grant date Expiry date Weighted average exercise price
9,250,000 29 Nov 06 28 Nov 11 0.0960 4,500,000 29 Nov 07 28 Nov 12 0.0590
14. SUBSEQUENT EVENTS On 5 July 2011, Pancontinental announced that the Ministry of Mines and Energy of Namibia had signed a Petroleum Agreement (“PA”) and granted an Exploration Licence (“EL”) to Pancontinental over a large area offshore Northern Namibia. The PA and EL cover 17,295 sq km over prospective trends in the Walvis Basin. Pancontinental holds 85% and is Operator under a Joint Venture Agreement with Namibian co-venturer Paragon Holdings (Pty) Ltd (15%).
Apart from the above, no matters or circumstances have arisen since the end of the financial year which significantly affected or may significantly affect the operations of the company, the results of those operations, or the state of affairs of the company in future financial years.
15. EARNINGS PER SHARE
CONSOLIDATED
2011 2010
$$
The following reflects the income and share data used in the calculations of basic and diluted earnings per share: Net profit (967,031) (1,786,654) Adjustments: Earnings used in calculating basic and diluted earnings per share (967,031) (1,786,654) Number of shares Number of shares Weighted average number of ordinary shares used in calculating basic earnings per share 605,985,288 556,906,878 Effect of dilutive securities: Share options 13,750,000 - Adjusted weighted average number of ordinary shares used in calculating diluted earnings per share 619,735,288 556,906,878
16. AUDITORS' REMUNERATION
CONSOLIDATED
2011 2010
$ $ Amounts received or due and receivable by Rothsay for: an audit or review of the financial report of the entity and any other entity in the consolidated entity 45,500 35,500 other services in relation to the entity and any other entity in the consolidated entity 4,000 - 49,500 35,500
Notes to the Financial StatementsF
or p
erso
nal u
se o
nly

46 PANCONTINENTAL OIL & GAS NL – ANNUAL REPORT 2011
17. DIRECTOR AND EXECUTIVE DISCLOSURES (a) Details of Specified Directors and Specified Executives (i) Specified DirectorsHenry David Kennedy Non-Executive Chairman Roy Barry Rushworth Executive Director, Chief Executive Officer Ian Raymond (Inky) Cornelius Non-Executive Director (passed away 14 July 2010) Ernest Anthony Myers Executive Finance Director Anthony Robert Frederick Maslin Non-Executive Director (ii) Specified ExecutivesVesna Petrovic Company Secretary
Total remuneration for all non-executive directors, last voted upon by shareholders at the 2007 AGM, is not to exceed $400,000 per annum and is set with reference to fees paid to other non-executive directors of comparable companies. Non-executive and executive directors do not receive performance related remuneration but they are eligible to participate in the Employee Option Scheme approved by shareholders. Directors do not receive any termination or retirement benefits. (b) Remuneration of Specified Directors /Officers
Primary Post Employment Equity Other TotalSalary& Fees
Cash Bonus
Non Monetary benefits
Superannuation Retirement benefits
Options Bonuses
Specified Directors/OfficersHenry David Kennedy
2011 50,000 - - - - - - 50,0002010 50,003 - - - - - - 50,003
Roy Barry Rushworth 2011 415,833 - - - - - - 415,833 2010 344,500 - - - - - - 344,500 Ian Raymond (Inky) Cornelius (Passed away 14 July 2010)
2011 2,000 - - - - - - 2,000 2010 46,500 - - - - - - 46,500
Anthony Robert Frederick Maslin 2011 25,806 - - - - - - 25,8062010 - - - - - - - -
Ernest Anthony Myers 2011 48,000 - - - - - - 48,0002010 48,000 - - - - - - 48,000
Vesna Petrovic 2011 - - - - - - - -2010 - - - - - - - -
Total Remuneration: Specified Directors /Officers2011 541,639 - - - - - - 541,6392010 489,003 - - - - - - 489,003
Mrs Petrovic received no direct remuneration from the company for her services as company secretary however during the year the company paid fees to Resource Services International (Aust) Pty Limited totalling $238,000 (2010: $216,000) for the provision of corporate, accounting and administration services. Mrs Petrovic is employed by Resource Services International (Aust) Pty Limited. See Note 20 for further information.
Notes to the Financial StatementsF
or p
erso
nal u
se o
nly

PANCONTINENTAL OIL & GAS NL – ANNUAL REPORT 2011 47
(c) Remuneration options: Granted and vested during the year Terms & Conditions for Each Grant
Granted Number
Grant Date Value per option at
grant date ($)
Exercise Price per share ($)
First Exercise Date
Last Exercise Date
Specified DirectorsHenry David Kennedy - - - - - - Roy Barry Rushworth - - - - - - Ian Raymond (Inky) Cornelius (passed away 14 July 2010) - - - - - - Anthony Robert Frederick Maslin - - - - - - Ernest Anthony Myers - - - - - - Total - - - - - -
(d) Option holdings of specified directors and specified executives
Balance at beginning of period
Granted as Remuneration
Options Exercised/(Expired)
Net Change Other Balance at end of period
1 July 2010 30 June 2011Specified DirectorsHenry David Kennedy 2,250,000 - (750,000) - 1,500,000Roy Barry Rushworth 4,500,000 - (1,500,000) - 3,000,000Ian Raymond (Inky) Cornelius (passed away 14 July 2010) 2,250,000 - (750,000) - 1,500,000Anthony Robert Frederick Maslin - - - - -Ernest Anthony Myers 2,000,000 - (1,000,000) - 1,000,000Total 11,000,000 - (4,000,000) - 7,000,000
(e) Shareholdings of Specified Directors and Specified Executives
Ordinary Shares held in Pancontinental Oil & Gas NL Balance
1 July 2010Acquisitions
(Disposals)Balance
30 June 2011
Specified DirectorsHenry David Kennedy 155,301,968 - 155,301,968 Roy Barry Rushworth 34,764,181 - 34,764,181 Ian Rayond (Inky) Cornelius - - - Anthony Robert Frederick Maslin - - - Ernest Anthony Myers - - -
Total 190,066,149 - 190,066,149
Notes to the Financial StatementsF
or p
erso
nal u
se o
nly

48 PANCONTINENTAL OIL & GAS NL – ANNUAL REPORT 2011
18. SEGMENT INFORMATION
Segment accounting policies The economic entity operates predominately in the petroleum exploration industry in the Australasian-Pacific and the North and East African geographic region, however internal reporting is conducted on an entity wide basis. As such, segment information is presented on the same basis as that used for internal reporting purposes provided to the chief operating decision maker. The chief operating decision maker has been identified as the board of directors who make strategic decisions.
19. FINANCIAL INSTRUMENTS
Financial risk management
Overview:
The company and group have exposure to the following risks from their use of financial instruments:
(a) credit risk
(b) liquidity risk
(c) market risk
This note presents information about the company’s and group’s exposure to each of the above risks, their objectives, policies and processes for measuring and managing risk, and the management of capital.
The board of directors has overall responsibility for the establishment and oversight of the risk management framework. Management monitors and manages the financial risks relating to the operations of the group through regular reviews of the risks.
(a) Credit risk:
Credit risk is the risk of financial loss to the group if a customer or counterparty to a financial instrument fails to meet its contractual obligations, and arises principally from the group’s receivables from joint venture re-charges and recuperations of cost. For the company it arises from receivables due from subsidiaries and re-charges to joint venture partners.
(i) Trade and other receivables:
The group operates predominantly in the oil and gas exploration sector, it does not have trade receivables and is therefore not exposed to credit risk in relation to trade receivables.
The company’s and group’s exposure to credit risk is influenced directly and indirectly by the individual characteristics of each joint venture. The balance of any outstanding amounts is monitored and payments are received promptly from joint venture partners.
The company has established an allowance for impairment that represents their estimate of incurred losses in respect of intra-group loans. The management does not expect any counterparty to fail to meet its obligations.
Geographically, there is no concentration of credit risk.
Notes to the Financial StatementsF
or p
erso
nal u
se o
nly

PANCONTINENTAL OIL & GAS NL – ANNUAL REPORT 2011 49
19. FINANCIAL INSTRUMENTS (cont’d)
Exposure to credit risk
The carrying amount of the company’s and group’s financial assets represents the maximum credit exposure. The maximum exposure to credit risk at the reporting date was:
Consolidated Carrying amountNote 2011 2010
$ $Trade and other receivables 4 44,028 19,318 Cash and cash equivalents 5,710,905 1,639,859
Total 5,754,933 1,659,177
Impairment losses:
None of the company’s or group’s receivables are past due at 30 June 2011, (2010: nil).
An impairment write down in respect of inter-group loans and shares was recognised during the current year from an analysis of the subsidiaries respective financial positions. The total impairment write down recognised through impairment of loans to subsidiaries and shares held in subsidiaries during the current period was $17,542 (2010: $858,947).
Whilst the loans were not payable at 30 June 2011 a provision for impairment based/reversed on the subsidiaries financial position was carried forward from previous periods. The balance of this provision may vary due to performance of a subsidiary in a given year.
(b) Liquidity risk:
Liquidity risk is the risk that the group will not be able to meet its financial obligations as they fall due. The group’s approach to managing liquidity is to ensure, as far as possible, that it will always have sufficient liquidity to meet its liabilities when due, under both normal and stressed conditions, without incurring unacceptable losses or risking damage to the group’s reputation.
The group manages liquidity risk by maintaining adequate cash reserves through continuously monitoring forecast and actual cash flows. (c) Market risk:
Market risk is the risk that changes in market prices, such as foreign exchange rates, interest rates and equity prices will affect the group’s income or the value of its holdings of financial instruments. The objective of market risk management is to manage and control market risk exposures within acceptable parameters, while optimising the return. (i) Currency risk:
The group is exposed to currency risk on investments, and foreign currency denominated purchases in a currency other than the respective functional currencies of group entities, primarily the Australian dollar (AUD). The other currency that these transactions are denominated in is the (USD).
The group has not entered into any derivative financial instruments to hedge such transactions and anticipated future receipts or payments that are denominated in a foreign currency.
Notes to the Financial StatementsF
or p
erso
nal u
se o
nly

50 PANCONTINENTAL OIL & GAS NL – ANNUAL REPORT 2011
19. FINANCIAL INSTRUMENTS (cont’d)
Exposure to currency risk:
The group’s exposure to foreign currency risk at balance date was as follows, based on notional amounts:
30 June 2011 30 June 2010
AUD AUD USD Total AUD USD Total
Trade and other receivables 19,318 - 19,318 19,318 - 19,318
Trade and other payables (187,740) - (187,740) (106,993) - (106,993)
Net balance sheet exposure (168,422) - (168,422) (87,675) - (87,675)
The following significant exchange rates applied during the year:
Average rate Reporting date spot rate
2011 2010 2011 2010
AUD : USD 0.989 0.882 1.060 0.856
Sensitivity analysis:
A 10 percent strengthening of the Australian dollar against the USD at 30 June would have increased (decreased) equity and profit or loss by the amounts shown below. This analysis assumes that all other variables, in particular interest rates, remain constant. The analysis is performed on the same basis for 2010.
Effect in AUD Consolidated
Equity Profit or loss
30 June 2011
10% strengthening - -
30 June 2010
10% strengthening - -
A 10 percent weakening of the Australian dollar against the USD at 30 June would have had the equal but opposite effect on the above currencies to the amounts shown above, on the basis that all other variables remain constant.
Interest rate risk:
At balance date the group had minimal exposure to interest rate risk, through its cash and equivalents held within financial institution.
Consolidated Carrying Amount30 June 2011 30 June 2010
Variable rate instruments
Cash and cash equivalents 5,710,905 1,639,859
Fair value sensitivity analysis for fixed rate instruments:
The company and group do not account for any fixed rate financial assets at fair value through profit or loss. Therefore, a change in interest rates at reporting date would not affect profit or loss or equity.
Notes to the Financial StatementsF
or p
erso
nal u
se o
nly
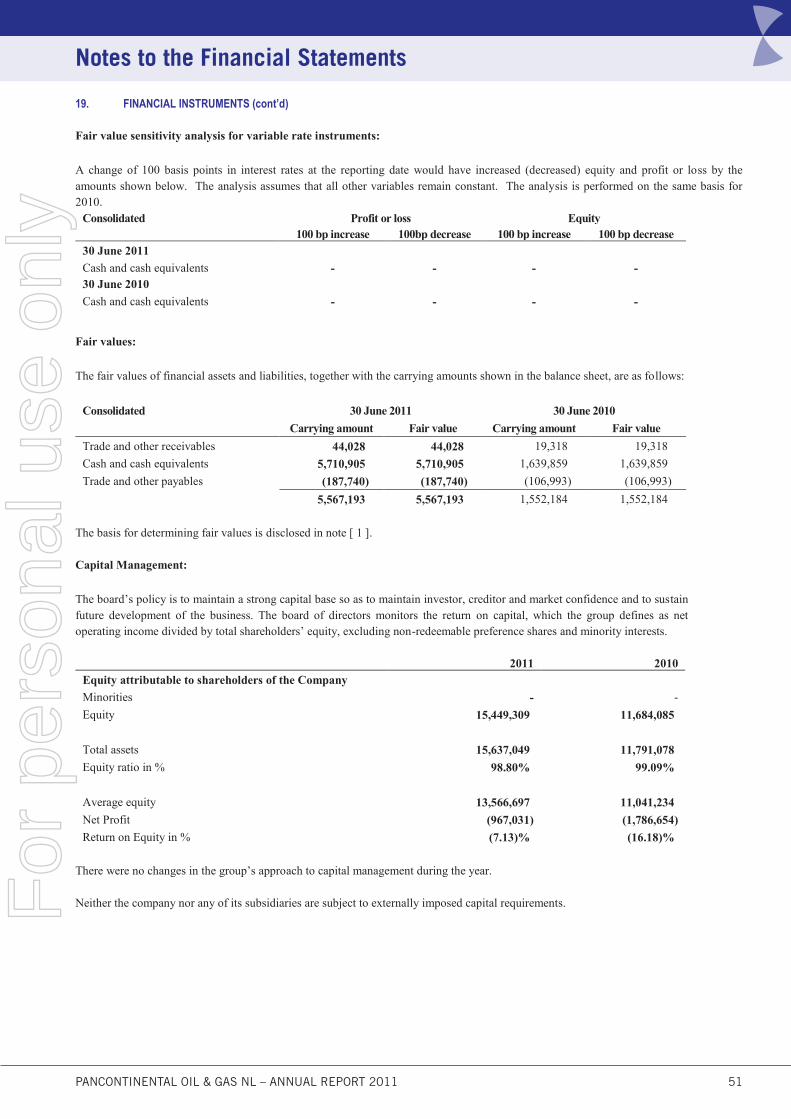
PANCONTINENTAL OIL & GAS NL – ANNUAL REPORT 2011 51
19. FINANCIAL INSTRUMENTS (cont’d) Fair value sensitivity analysis for variable rate instruments:
A change of 100 basis points in interest rates at the reporting date would have increased (decreased) equity and profit or loss by the amounts shown below. The analysis assumes that all other variables remain constant. The analysis is performed on the same basis for 2010.
Consolidated Profit or loss Equity 100 bp increase 100bp decrease 100 bp increase 100 bp decrease30 June 2011
Cash and cash equivalents - - - -30 June 2010
Cash and cash equivalents - - - -
Fair values:
The fair values of financial assets and liabilities, together with the carrying amounts shown in the balance sheet, are as follows:
Consolidated 30 June 2011 30 June 2010
Carrying amount Fair value Carrying amount Fair value
Trade and other receivables 44,028 44,028 19,318 19,318
Cash and cash equivalents 5,710,905 5,710,905 1,639,859 1,639,859
Trade and other payables (187,740) (187,740) (106,993) (106,993)
5,567,193 5,567,193 1,552,184 1,552,184
The basis for determining fair values is disclosed in note [ 1 ].
Capital Management:
The board’s policy is to maintain a strong capital base so as to maintain investor, creditor and market confidence and to sustain future development of the business. The board of directors monitors the return on capital, which the group defines as net operating income divided by total shareholders’ equity, excluding non-redeemable preference shares and minority interests.
2011 2010Equity attributable to shareholders of the Company
Minorities - -
Equity 15,449,309 11,684,085
Total assets 15,637,049 11,791,078
Equity ratio in % 98.80% 99.09%
Average equity 13,566,697 11,041,234
Net Profit (967,031) (1,786,654)
Return on Equity in % (7.13)% (16.18)%
There were no changes in the group’s approach to capital management during the year.
Neither the company nor any of its subsidiaries are subject to externally imposed capital requirements.
Notes to the Financial StatementsF
or p
erso
nal u
se o
nly

52 PANCONTINENTAL OIL & GAS NL – ANNUAL REPORT 2011
20. RELATED PARTY
(a) During the year the company paid fees to Resource Services International Limited, a company in which Mr Kennedy has a financial interest, for consulting services. The amount paid to was $50,000 (2010: $50,003). Refer note 17.
(b) During the year the company paid fees to Goldtrek Pty Ltd, trustee for the Lewis Trust, of which Mr Cornelius is a beneficiary, for consulting services. The amount paid to Goldtrek Pty Ltd was $2,000 (2010: $46,500). Refer note 17.
(c) During the year the company paid fees to Resource Services International (Aust) Pty Limited, a company of which Mr Myers is a director, to cover the provision of corporate, accounting and administration services. The amount paid to Resource Services International (Aust) Pty Limited was $238,000 (2010: $216,000). Amounts were billed based on normal market rates for such services and were due and payable under normal payment terms. The fees are not related to the management of the company, therefore no amounts are attributable to directors, and have not been included in directors’ remuneration.
(d) The company has effected Directors and Officers Liability Insurance.
21. PARENT INFORMATION
The Group has applied amendments to the Corporations Act (2001) which remove the requirement for the Group to lodge parent entity financial statements. Parent entity financial statements have been replaced by the specific parent entity disclosures below.
AT 30 JUNE 2011 2011 2010
$ $
STATEMENT OF COMPREHENSIVE INCOME Profit/(Loss) for the period (914,717) (1,768,817)
TOTAL COMPREHENSIVE INCOME/(LOSS) (914,717) (1,768,817)
2011 2010
$ $
STATEMENT OF FINANCIAL POSITION Assets Current assets 5,710,905 1,628,116
TOTAL ASSETS 15,520,246 11,623,962 Liabilities Current liabilities 185,740 106,993 TOTAL LIABILITIES 185,740 106,993 Equity
Contributed equity 38,166,253 33,433,998 Reserves 764,258 1,187,215 Accumulated losses (23,596,005) (23,104,245)
TOTAL EQUITY 15,334,506 11,516,969
Notes to the Financial StatementsF
or p
erso
nal u
se o
nly

PANCONTINENTAL OIL & GAS NL – ANNUAL REPORT 2011 53
Directors' Declaration
In accordance with a resolution of the directors of Pancontinental Oil & Gas NL, I state that:
(1) In the opinion of the directors:
(a) the financial statements and notes of the company and of the consolidated entity are in accordance with the Corporations Act 2001, including:
(i) giving a true and fair view of the company's and consolidated entity's financial position as at 30 June 2011 and of their performance for the year ended on that date; and
(ii) complying with Accounting Standards and Corporations Regulations 2001; and
(b) there are reasonable grounds to believe that the company will be able to pay its debts as and when they become due and payable.
(2) This declaration has been made after receiving the declarations required to be made to the directors in accordance with section 295A of the Corporations Act 2001 for the financial period ending 30 June 2011.
On behalf of the Board
Ernest Anthony Myers Director Perth 29 September 2011
Directors’ DeclarationF
or p
erso
nal u
se o
nly

54 PANCONTINENTAL OIL & GAS NL – ANNUAL REPORT 2011
Independent Audit ReportF
or p
erso
nal u
se o
nly
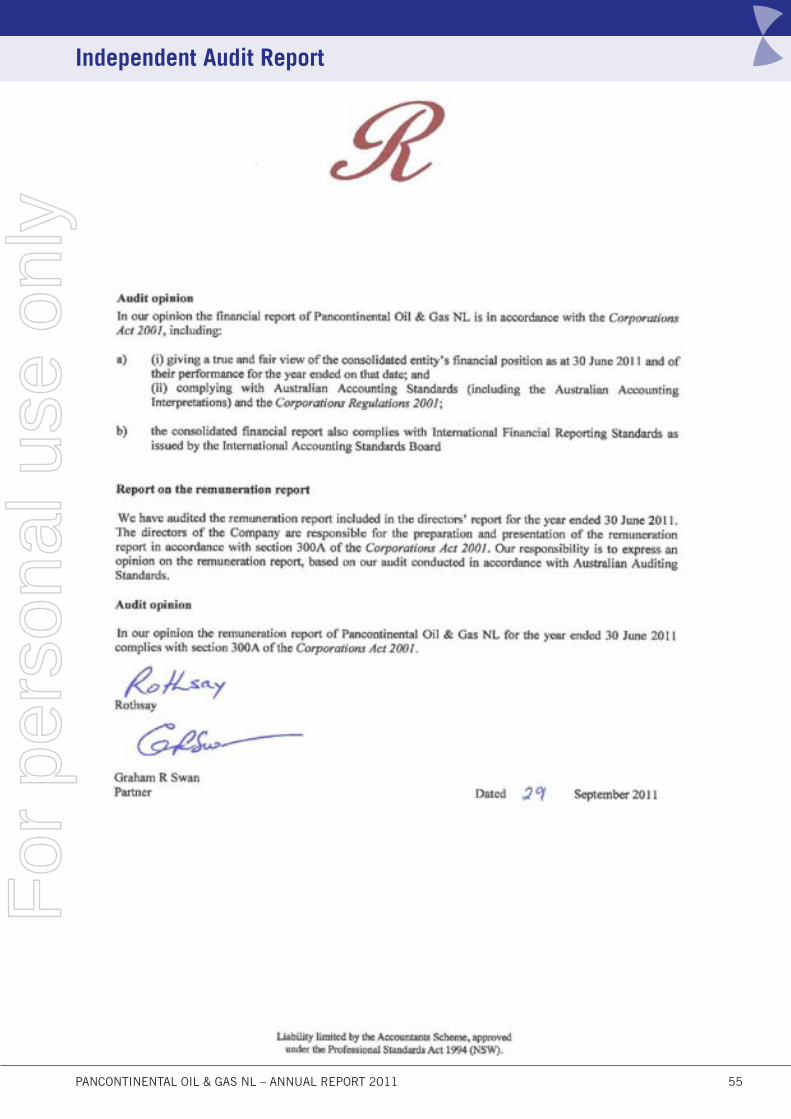
PANCONTINENTAL OIL & GAS NL – ANNUAL REPORT 2011 55
Independent Audit ReportF
or p
erso
nal u
se o
nly

56 PANCONTINENTAL OIL & GAS NL – ANNUAL REPORT 2011
ASX Additional Information
Additional information required by the ASX Ltd and not shown elsewhere in this report is as follows. The information is current as at
30 September 2011.
(a) Distribution of equity securities
The number of shareholders, by size of holding, in each class of share are:
Ordinary shares Number of holders Number of shares1 - 1,000 377 87,884 1,001 - 5,000 152 486,703 5,001 - 10,000 212 1,805,322 10,001 - 100,000 1070 49,221,701 100,001 and over 640 609,178,199
2,451 660,779,809The number of shareholders holding less than a marketable parcel of shares are: 543 651,281
(b) Twenty largest shareholders
The names of the twenty largest holders of quoted shares are: Listed ordinary shares
Number of shares Percentage of ordinary shares
1 Sundowner International Limited 132,171,113 20.002 2 Indago Resources Limited 58,212,292 8.810 3 HSBC Custody Nominees 33,574,366 5.081 4 CM Skye Trustees Limited 25,706,511 3.890 5 J P Morgan Nominees Australia 22,552,382 3.413 6 Citicorp Nominees Pty Limited 13,396,253 2.027 7 Mr Roy Barry Rushworth 9,057,670 1.371 8 CIMB Securities (Singapore) 8,100,000 1.226 9 Mr Robert Albert Boas 7,525,000 1.139 10 National Nominees Limited 6,808,345 1.030 11 Mrs Helen Joy Alexander 6,600,000 0.999 12 M & M Family Pty Ltd 5,500,000 0.832 13 Mr Peter John Brunton 5,130,825 0.776 14 Gascorp Australia Pty Ltd 5,000,000 0.757 15 RBC Dexia Investor Services 4,794,520 0.726 16 Mr William John Tyler & Mrs Sybil Tyler 3,500,000 0.530 17 Huxide Pty Limited 3,200,000 0.484 18 Mr Bradley William Green 3,000,000 0.454 19 Mr Michael Alexander Slivkoff & Mrs Nora Slivkoff 3,000,000 0.454 20 Calm Holdings Pty Ltd 3,000,000 0.454 359,829,277 54.455
ASX Additional InformationF
or p
erso
nal u
se o
nly

PANCONTINENTAL OIL & GAS NL – ANNUAL REPORT 2011 57
(c) Voting rights
All ordinary shares (whether fully paid or not) carry one vote per share without restriction.
(d) Substantial Shareholders
Number of Shares The details of substantial shareholders as disclosed in substantial shareholder notices received by the
Company are set out below:
Sundowner International Limited, Indago Resources Limited and HSBC Custody Nominees
223,957,771
Roy Barry Rushworth and CM Skye Trustees Limited as trustee for the Mulberry Trust 34,764,181
(e) Permit Schedule
Permits and Licence Interests Permit reference Interest
Petroleum prospects
Western Australia L15 12 %
EP 104 (R1) 10 %
EP 110 38.462%
EP 424 38.462%
Malta Area 5**
Block 3 of Area 4**
80%
80% Kenya L6
L8
L10A
L10B
40%
15%
15%
15%
Namibia EL 0037 85%
Morocco Mediterranee Est. Block** 100% - diluting to 80%
**In suspension
ASX Additional Information
Western Australia L15 12 %
EP 104 (R1) 10 %
EP 110 38.462%
EP 424 38.462%
Malta Area 5** 80%
Block 3 of Area 4** 80%
Kenya L6 40%
L8 15%
L10A 15%
L10B 15%
Namibia EL 0037 85%
Morocco Mediterranee Est. Block** 100% - diluting to 80%
**In suspension
For
per
sona
l use
onl
y

288 Stirling StreetPerth WA 6000Telephone: +61 8 9227 3220Fax: +61 8 9227 3211
For
per
sona
l use
onl
y
![THE JOURNAL OF EXPERI~NTAL MEDICINE, Vol. 84, No. 6, pp ... · [Reprinted from THE JOURNAL OF EXPERI~NTAL MEDICINE, December 1, 1946, Vol. 84, No. 6, pp. X3-606] STUDIES ON MALARIAL](https://img.pdfslide.us/doc/110x75/5d50e2a288c99347518b6359/the-journal-of-experintal-medicine-vol-84-no-6-pp-reprinted-from.jpg)


![i c a l e& E xp rime o f l i n ntal Journal of a l t a h n ... · Pinworm of pediatric appendicitis continued to be a rare surgical presentation it is frequency 1.52% [12]. Pinworm](https://img.pdfslide.us/doc/110x75/5e803bc64a456010ed42e303/i-c-a-l-e-e-xp-rime-o-f-l-i-n-ntal-journal-of-a-l-t-a-h-n-pinworm-of-pediatric.jpg)