Embed Size (px)
Citation preview
INTERIM DIRECTORS’ REPORT AS AT 30 JUNE 2018
Panariagroup Industrie Ceramiche S.p.A.
Panariagroup Industrie Ceramiche S.p.A. – Via Panaria Bassa 22/A – 41034 Finale Emilia (MO) Tax I.D., VAT No. 01865640369 www.panariagroup.it
___________________________________
1
Panariagroup is an Italian multinational leader in innovation and beauty. OUR MISSION We specialise in the manufacturing and sale of ceramic tiles to promote beauty and innovation. • Our team generates sustainable value for shareholders, employees and business partners, in compliance with the company’s corporate environment. • Our focus is on research and innovation to serve the beauty and quality of our products. • Our goal is to meet our private and professional clients’ high expectations of wellness and aesthetics, in both buildings and architecture. OUR VALUES TECHNOLOGICAL LEADERSHIP We constantly invest in research, technologies and state‐of‐the‐art facilities to meet every architectural and interior design need with innovative solutions, capable of becoming the industry benchmark. AESTHETIC QUALITY AND EXCELLENCE We tenaciously pursue industrial excellence, from quality raw materials to process efficiency, to obtain products that combine absolute aesthetic value with the highest level of technical performance. RESPONSIBILITY We always place people and quality of life at the centre of our attention, with safe, environmentally‐sustainable products and by operating with the utmost respect for those who work with us. RELIABILITY The guarantee of a Group which, from its family roots in the ceramic district of Sassuolo to its listing on the Milan Stock Exchange, has grown to become a solid international company, which operates throughout the world whilst maintaining an Italian core. Panariagroup is a leading manufacturer of ceramics tiles for floors and walls. It has over 1,700 employees, 10,000 customers, 6 manufacturing plants (3 in Italy, 2 in Portugal and 1 in the United States) and a presence, through its broad and extensive sales network, in over 130 countries worldwide. Specialising in the production of porcelain tiles and laminate, the Group is positioned in the premium and luxury market through its nine brand names: Panaria, Lea, Cotto d’Este, Blustyle, Fiordo, Florida Tile, Margres, Love Tiles and Bellissimo, which are capable of satisfying a diversified customer base that is attentive to the technical and aesthetic quality of its products.
___________________________________
2
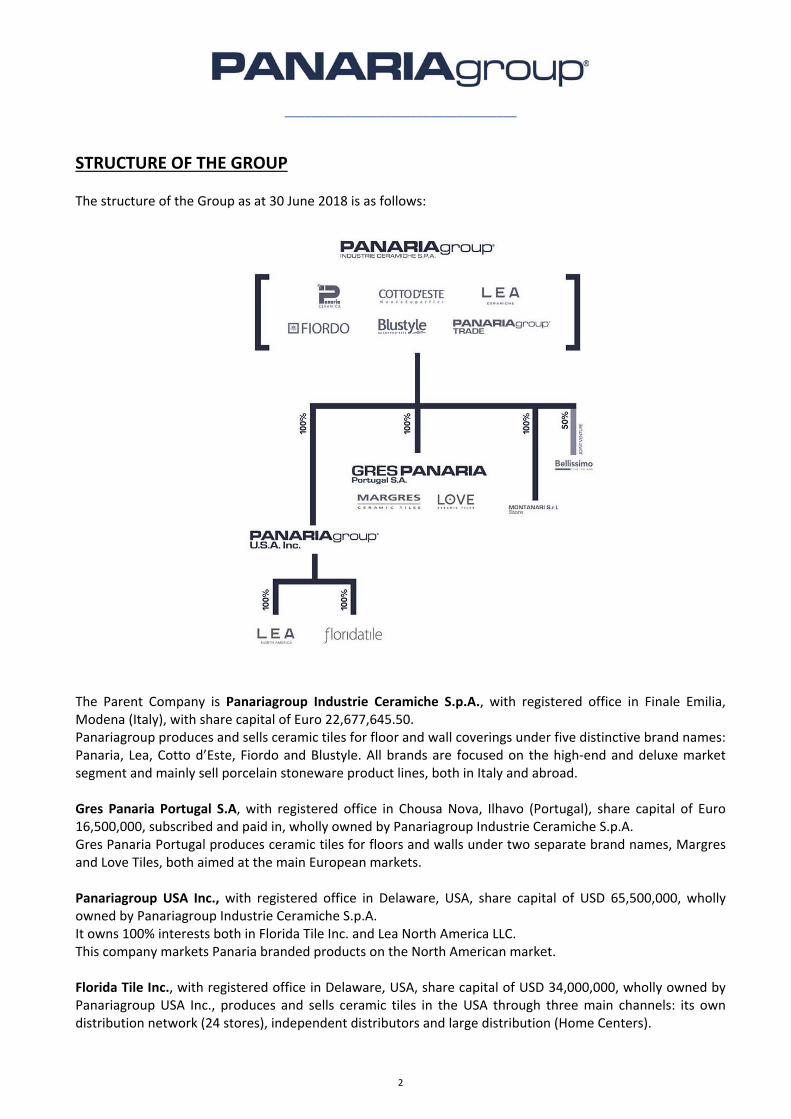
STRUCTURE OF THE GROUP The structure of the Group as at 30 June 2018 is as follows:
The Parent Company is Panariagroup Industrie Ceramiche S.p.A., with registered office in Finale Emilia, Modena (Italy), with share capital of Euro 22,677,645.50. Panariagroup produces and sells ceramic tiles for floor and wall coverings under five distinctive brand names: Panaria, Lea, Cotto d’Este, Fiordo and Blustyle. All brands are focused on the high‐end and deluxe market segment and mainly sell porcelain stoneware product lines, both in Italy and abroad. Gres Panaria Portugal S.A, with registered office in Chousa Nova, Ilhavo (Portugal), share capital of Euro 16,500,000, subscribed and paid in, wholly owned by Panariagroup Industrie Ceramiche S.p.A. Gres Panaria Portugal produces ceramic tiles for floors and walls under two separate brand names, Margres and Love Tiles, both aimed at the main European markets. Panariagroup USA Inc., with registered office in Delaware, USA, share capital of USD 65,500,000, wholly owned by Panariagroup Industrie Ceramiche S.p.A. It owns 100% interests both in Florida Tile Inc. and Lea North America LLC. This company markets Panaria branded products on the North American market. Florida Tile Inc., with registered office in Delaware, USA, share capital of USD 34,000,000, wholly owned by Panariagroup USA Inc., produces and sells ceramic tiles in the USA through three main channels: its own distribution network (24 stores), independent distributors and large distribution (Home Centers).
___________________________________
3
Lea North America LLC., with registered office in Delaware, USA, share capital of USD 20,000, wholly owned by Panariagroup USA Inc. This company markets Lea branded products on the North American market. Montanari Ceramiche S.r.l., with registered office in Finale Emilia (Italy), share capital of Euro 48,000, wholly owned by Panariagroup Industrie Ceramiche S.p.A. This company runs a retail outlet for ceramic tiles. Furthermore, the Group participates in a Joint Venture Company (JVC) based in the Indian state of Gujarat. This company is 50% held by Panariagroup and 50% by AGL India Ltd, a leading manufacturer in the Indian market.
___________________________________
4
DIRECTORS AND OFFICERS
Board of Directors
Name Office
Emilio Mussini Chairman of the Board and Managing Director
Paolo Mussini Deputy Chairman and Managing Director
Andrea Mussini Deputy Chairman
Giuliano Pini Managing Director
Giuliano Mussini Director
Silvia Mussini Director
Daniele Prodi Director
Francesca Bazoli Independent Director
Sonia Bonfiglioli Independent Director
Tiziana Ferrari Independent Director
Board of Statutory Auditors
Name Office
Sergio Marchese Chairman of the Board of Statutory Auditors
Piergiovanni Ascari Standing Auditor
Francesca Muserra Standing Auditor
Independent Auditors EY S.p.A.
___________________________________
5
Interim Directors’ Report on the Condensed Consolidated Half‐year Financial Statements for 2018 Results of the first half of 2018 Dear Shareholders,
During the first half of 2018, world trade highlighted signs of uncertainty, with an overall reduction of growth
estimates.
The GDP trend reported a significant increase in Russia and Brazil, in line with expectations. Growth
continued both in China and India, while was below expectations in the United States and United Kingdom.
Due to geo‐political reasons, African countries and most of those in the Gulf Area recorded a significant
decline in the economic cycle.
The economic expansion in the Euro zone remained substantially unchanged.
Albeit positive, global perspectives are subject to protectionist policies risks and global trade, although
expanding, has reported a slowdown. The risk is increasing that global exchanges and business of companies
acting on international markets be hampered by the worsening of trade tensions between the United States
and the main economic partners.
In the Euro area, growth continued, albeit at a slower pace compared to expectations at end 2017. The Board
of the ECB is expecting to reduce net purchases of securities by the end of the year (quantitative easing), but
to keep interest rates at current low levels.
In Italy, in the second quarter, production recorded a slight slowdown, while the business in the services
segment continued to increase. In overall, the GDP dynamics reported a progress that is 1% lower than in
2017, with downward risks connected to the weakness of the manufacturing segment.
In the first half of 2018, the Italian ceramics industry reported a significant reduction in sales.
A less dynamic macro‐economic context, compared to expectations at end of 2017, led to the achievement
of lower results for the Group, in the first half of the year, compared to the same period of the previous year.
___________________________________
6
Briefly, the economic results for the period are the following:
Consolidated net revenues amounted to Euro 192.2 million (Euro 206.4 million as at 30 June 2017).
Gross operating profit amounted to Euro 12.4 million (Euro 27.6 million as at 30 June 2017).
Net operating profit amounted to Euro 1.7 million (Euro 15.9 million as at 30 June 2017).
Consolidated net profit amounted to Euro 0.8 million (Euro 9.8 million at 30 June 2017). Lower revenues, compared to the first half of 2017, amounted to Euro 14.2 million in the first half of 2018 and were determined, in the amount of Euro 7.5 million, by the trend of the EUR/USD exchange rates and, in the amount of Euro 6.7 million, by an actual drop in turnover. The US currency recorded 12.1% depreciation, from an average exchange rate of 1.0830 in the first half of 2017, to an average exchange rate of 1.2140 in the first half of 2018. It should be noted that the turnover in the first half of 2018, at equal exchange rates with respect to the first half of 2017, would have been Euro 199.7 million, with a 3.3% reduction in sales. Also the Italian ceramics sector reported a 3,3% reduction in the first half, compared to the first half of 2017. The drop in sales concerned the Italian and the US Business Units, both reporting a fall (net of exchange rate effect) of 4% and 5%, respectively. Conversely, the Portuguese Business Unit reported a remarkable recovery in the second quarter (+12%), achieving a positive result and recording an overall growth of 4%, compared to the first half of 2017. Albeit reporting unstable trends among the various geographical areas, in the second quarter some recovery signs can be detected in the domestic and European markets and an improvement in the second half of the year might be reasonably expected. Various factors contributed to the drop in operating margins; some are external factors and others are determined by the policies implemented by the Group in the achievement of trade targets and the reduction in Net Working Capital. The external factors that have penalised the operating result were the already mentioned depreciation of the US currency and the significant increase in gas tariffs for the European Business Units. Due to sales lower than expected, in view of maintaining the stock level at adequate turnover ratios, some facilities had to slowdown their production with consequent increase in the average production costs, especially for the fixed and semi‐variable component. In the first half of the year, in order to introduce the new presented collections faster, Italian brands charge prices broadly unchanged, in light of a better product mix and in terms of size and greater value in the trim. To counter a sectoral slowdown, we incurred higher costs for the assistance and for the control of the positions, through greater investments in the showrooms of the best customers. Moreover, the commercial investment activity continued on the new Contract & Key Account division, focused on the market of the large projects; this division can’t reach thebe in break even in this start‐up phase, but it will reduce its deficit in the second half.
___________________________________
7
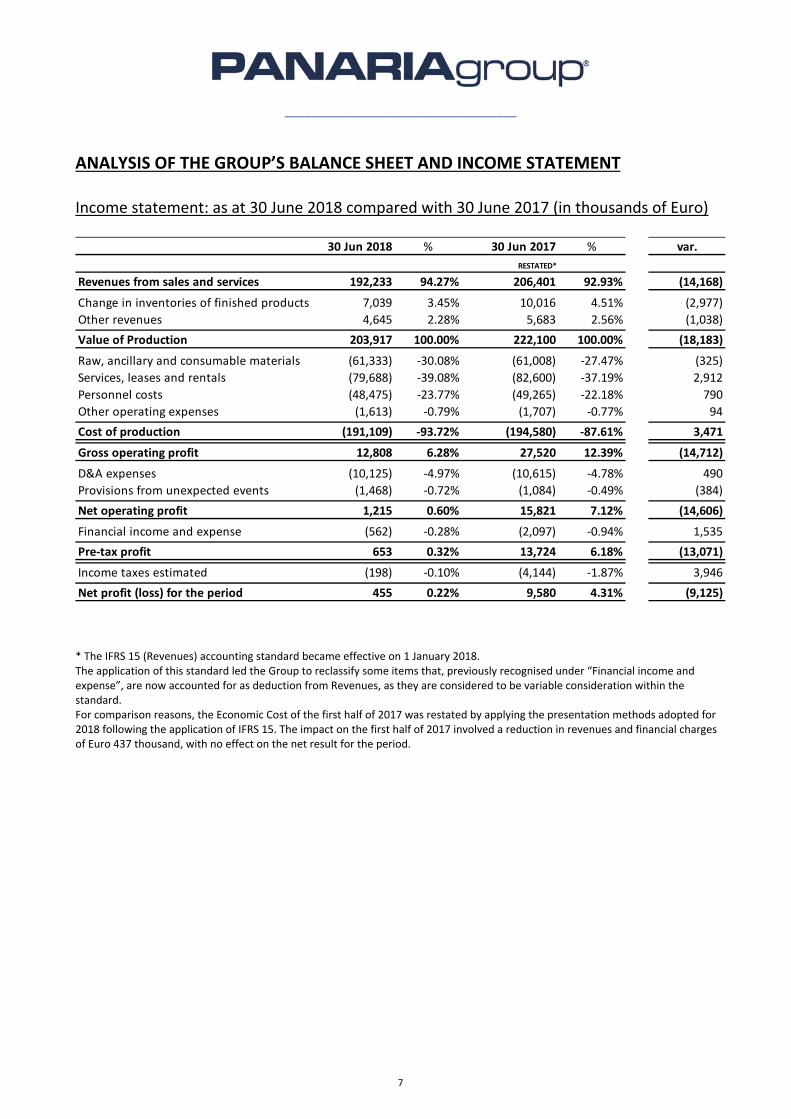
ANALYSIS OF THE GROUP’S BALANCE SHEET AND INCOME STATEMENT
Income statement: as at 30 June 2018 compared with 30 June 2017 (in thousands of Euro)
30 Jun 2018 % 30 Jun 2017 % var.
RESTATED*
Revenues from sales and services 192,233 94.27% 206,401 92.93% (14,168)
Change in inventories of finished products 7,039 3.45% 10,016 4.51% (2,977)
Other revenues 4,645 2.28% 5,683 2.56% (1,038)
Value of Production 203,917 100.00% 222,100 100.00% (18,183)
Raw, ancillary and consumable materials (61,333) ‐30.08% (61,008) ‐27.47% (325)
Services, leases and rentals (79,688) ‐39.08% (82,600) ‐37.19% 2,912
Personnel costs (48,475) ‐23.77% (49,265) ‐22.18% 790
Other operating expenses (1,613) ‐0.79% (1,707) ‐0.77% 94
Cost of production (191,109) ‐93.72% (194,580) ‐87.61% 3,471
Gross operating profit 12,808 6.28% 27,520 12.39% (14,712)
D&A expenses (10,125) ‐4.97% (10,615) ‐4.78% 490
Provisions from unexpected events (1,468) ‐0.72% (1,084) ‐0.49% (384)
Net operating profit 1,215 0.60% 15,821 7.12% (14,606)
Financial income and expense (562) ‐0.28% (2,097) ‐0.94% 1,535
Pre‐tax profit 653 0.32% 13,724 6.18% (13,071)
Income taxes estimated (198) ‐0.10% (4,144) ‐1.87% 3,946
Net profit (loss) for the period 455 0.22% 9,580 4.31% (9,125) * The IFRS 15 (Revenues) accounting standard became effective on 1 January 2018. The application of this standard led the Group to reclassify some items that, previously recognised under “Financial income and expense”, are now accounted for as deduction from Revenues, as they are considered to be variable consideration within the standard. For comparison reasons, the Economic Cost of the first half of 2017 was restated by applying the presentation methods adopted for 2018 following the application of IFRS 15. The impact on the first half of 2017 involved a reduction in revenues and financial charges of Euro 437 thousand, with no effect on the net result for the period.
___________________________________
8
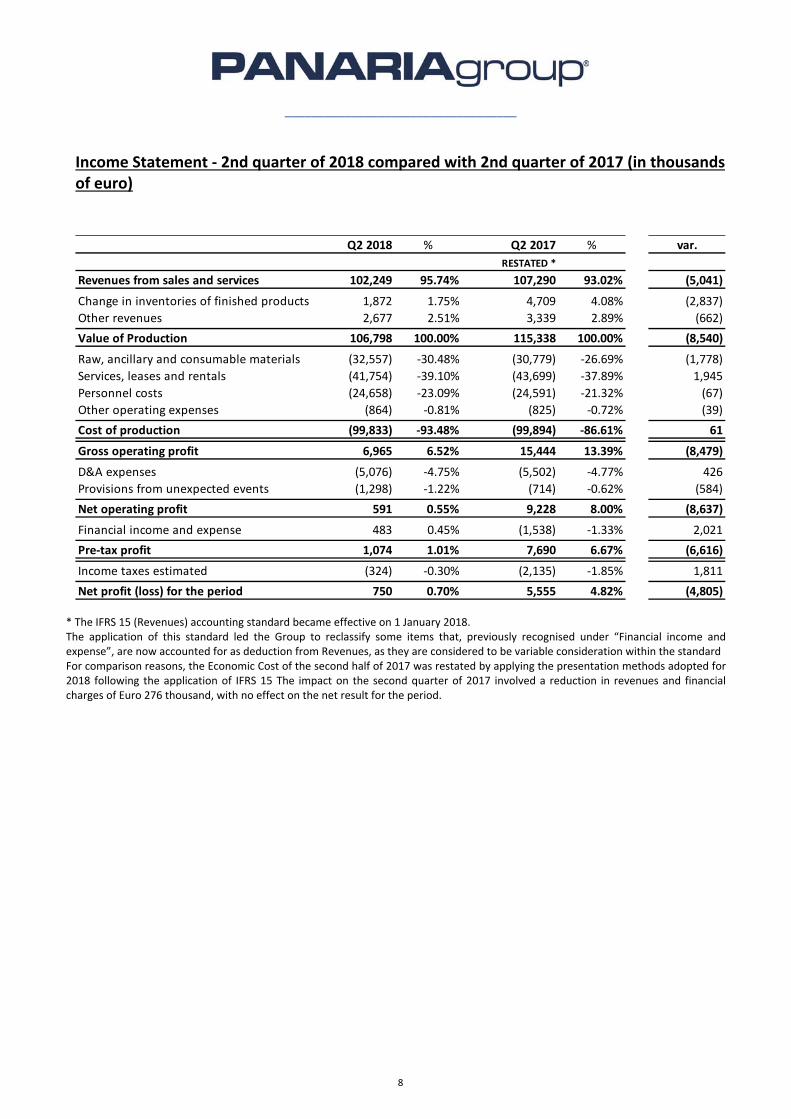
Income Statement ‐ 2nd quarter of 2018 compared with 2nd quarter of 2017 (in thousands of euro)
Q2 2018 % Q2 2017 % var.
RESTATED *
Revenues from sales and services 102,249 95.74% 107,290 93.02% (5,041)
Change in inventories of finished products 1,872 1.75% 4,709 4.08% (2,837)
Other revenues 2,677 2.51% 3,339 2.89% (662)
Value of Production 106,798 100.00% 115,338 100.00% (8,540)
Raw, ancillary and consumable materials (32,557) ‐30.48% (30,779) ‐26.69% (1,778)
Services, leases and rentals (41,754) ‐39.10% (43,699) ‐37.89% 1,945
Personnel costs (24,658) ‐23.09% (24,591) ‐21.32% (67)
Other operating expenses (864) ‐0.81% (825) ‐0.72% (39)
Cost of production (99,833) ‐93.48% (99,894) ‐86.61% 61
Gross operating profit 6,965 6.52% 15,444 13.39% (8,479)
D&A expenses (5,076) ‐4.75% (5,502) ‐4.77% 426
Provisions from unexpected events (1,298) ‐1.22% (714) ‐0.62% (584)
Net operating profit 591 0.55% 9,228 8.00% (8,637)
Financial income and expense 483 0.45% (1,538) ‐1.33% 2,021
Pre‐tax profit 1,074 1.01% 7,690 6.67% (6,616)
Income taxes estimated (324) ‐0.30% (2,135) ‐1.85% 1,811
Net profit (loss) for the period 750 0.70% 5,555 4.82% (4,805) * The IFRS 15 (Revenues) accounting standard became effective on 1 January 2018. The application of this standard led the Group to reclassify some items that, previously recognised under “Financial income and expense”, are now accounted for as deduction from Revenues, as they are considered to be variable consideration within the standard For comparison reasons, the Economic Cost of the second half of 2017 was restated by applying the presentation methods adopted for 2018 following the application of IFRS 15 The impact on the second quarter of 2017 involved a reduction in revenues and financial charges of Euro 276 thousand, with no effect on the net result for the period.
___________________________________
9
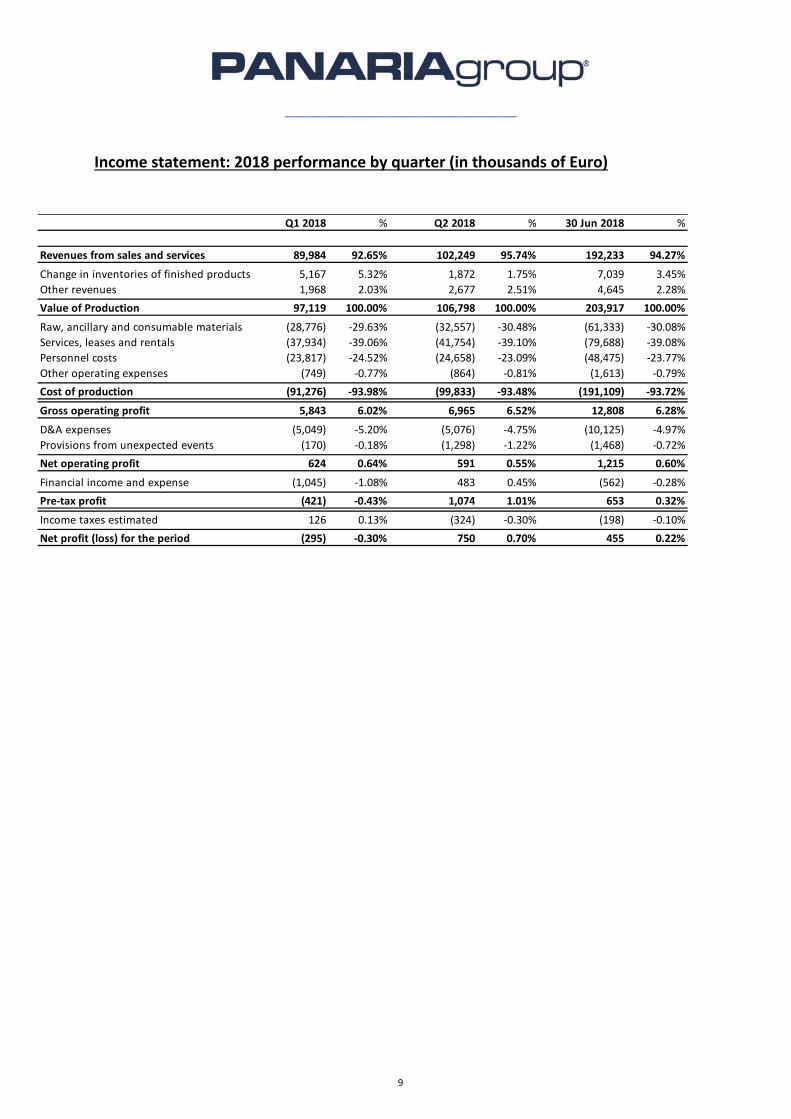
Income statement: 2018 performance by quarter (in thousands of Euro)
Q1 2018 % Q2 2018 % 30 Jun 2018 %
Revenues from sales and services 89,984 92.65% 102,249 95.74% 192,233 94.27%
Change in inventories of finished products 5,167 5.32% 1,872 1.75% 7,039 3.45%
Other revenues 1,968 2.03% 2,677 2.51% 4,645 2.28%
Value of Production 97,119 100.00% 106,798 100.00% 203,917 100.00%
Raw, ancillary and consumable materials (28,776) ‐29.63% (32,557) ‐30.48% (61,333) ‐30.08%
Services, leases and rentals (37,934) ‐39.06% (41,754) ‐39.10% (79,688) ‐39.08%
Personnel costs (23,817) ‐24.52% (24,658) ‐23.09% (48,475) ‐23.77%
Other operating expenses (749) ‐0.77% (864) ‐0.81% (1,613) ‐0.79%
Cost of production (91,276) ‐93.98% (99,833) ‐93.48% (191,109) ‐93.72%
Gross operating profit 5,843 6.02% 6,965 6.52% 12,808 6.28%
D&A expenses (5,049) ‐5.20% (5,076) ‐4.75% (10,125) ‐4.97%
Provisions from unexpected events (170) ‐0.18% (1,298) ‐1.22% (1,468) ‐0.72%
Net operating profit 624 0.64% 591 0.55% 1,215 0.60%
Financial income and expense (1,045) ‐1.08% 483 0.45% (562) ‐0.28%
Pre‐tax profit (421) ‐0.43% 1,074 1.01% 653 0.32%
Income taxes estimated 126 0.13% (324) ‐0.30% (198) ‐0.10%
Net profit (loss) for the period (295) ‐0.30% 750 0.70% 455 0.22%
___________________________________
10
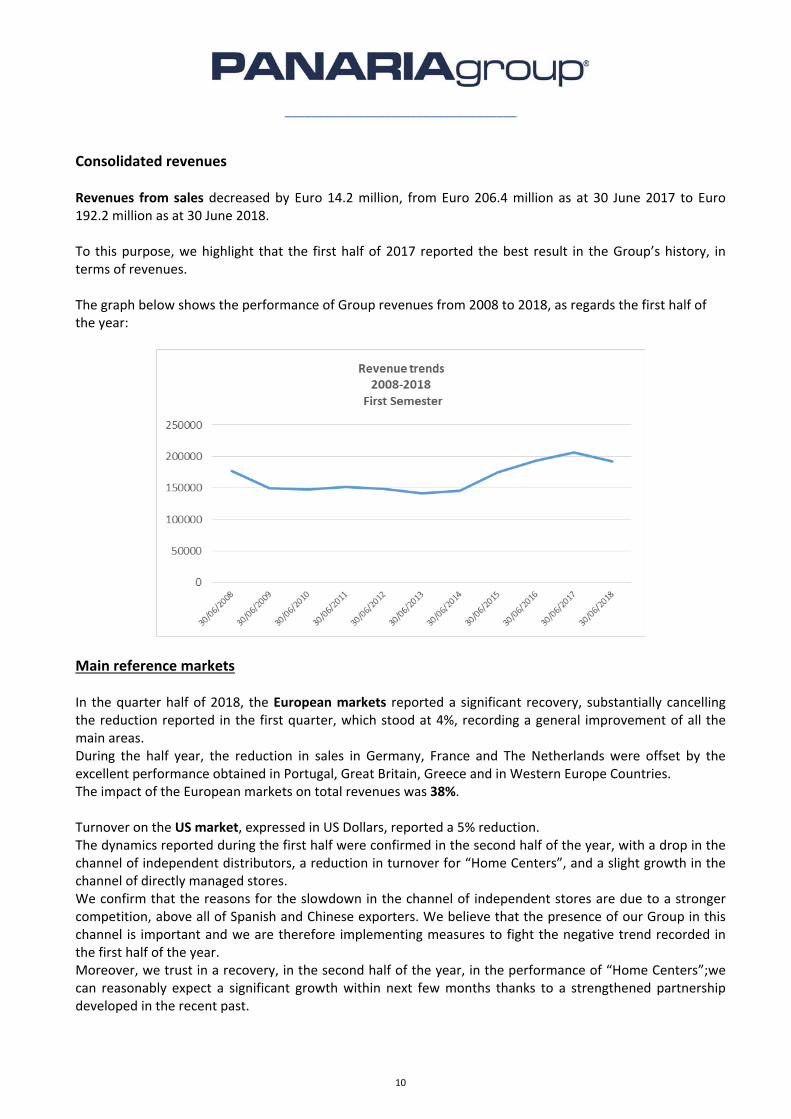
Consolidated revenues Revenues from sales decreased by Euro 14.2 million, from Euro 206.4 million as at 30 June 2017 to Euro 192.2 million as at 30 June 2018. To this purpose, we highlight that the first half of 2017 reported the best result in the Group’s history, in terms of revenues. The graph below shows the performance of Group revenues from 2008 to 2018, as regards the first half of the year:
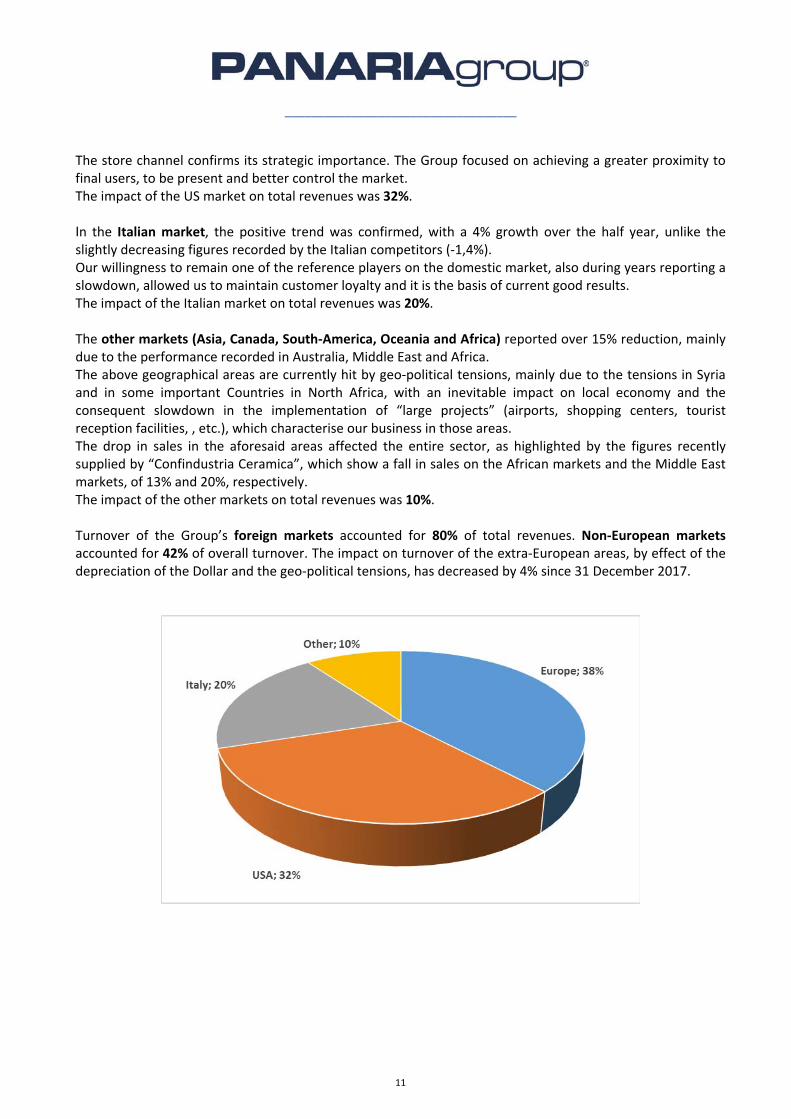
Main reference markets In the quarter half of 2018, the European markets reported a significant recovery, substantially cancelling the reduction reported in the first quarter, which stood at 4%, recording a general improvement of all the main areas. During the half year, the reduction in sales in Germany, France and The Netherlands were offset by the excellent performance obtained in Portugal, Great Britain, Greece and in Western Europe Countries. The impact of the European markets on total revenues was 38%. Turnover on the US market, expressed in US Dollars, reported a 5% reduction. The dynamics reported during the first half were confirmed in the second half of the year, with a drop in the channel of independent distributors, a reduction in turnover for “Home Centers”, and a slight growth in the channel of directly managed stores. We confirm that the reasons for the slowdown in the channel of independent stores are due to a stronger competition, above all of Spanish and Chinese exporters. We believe that the presence of our Group in this channel is important and we are therefore implementing measures to fight the negative trend recorded in the first half of the year. Moreover, we trust in a recovery, in the second half of the year, in the performance of “Home Centers”;we can reasonably expect a significant growth within next few months thanks to a strengthened partnership developed in the recent past.
___________________________________
11
The store channel confirms its strategic importance. The Group focused on achieving a greater proximity to final users, to be present and better control the market. The impact of the US market on total revenues was 32%. In the Italian market, the positive trend was confirmed, with a 4% growth over the half year, unlike the slightly decreasing figures recorded by the Italian competitors (‐1,4%). Our willingness to remain one of the reference players on the domestic market, also during years reporting a slowdown, allowed us to maintain customer loyalty and it is the basis of current good results. The impact of the Italian market on total revenues was 20%. The other markets (Asia, Canada, South‐America, Oceania and Africa) reported over 15% reduction, mainly due to the performance recorded in Australia, Middle East and Africa. The above geographical areas are currently hit by geo‐political tensions, mainly due to the tensions in Syria and in some important Countries in North Africa, with an inevitable impact on local economy and the consequent slowdown in the implementation of “large projects” (airports, shopping centers, tourist reception facilities, , etc.), which characterise our business in those areas. The drop in sales in the aforesaid areas affected the entire sector, as highlighted by the figures recently supplied by “Confindustria Ceramica”, which show a fall in sales on the African markets and the Middle East markets, of 13% and 20%, respectively. The impact of the other markets on total revenues was 10%. Turnover of the Group’s foreign markets accounted for 80% of total revenues. Non‐European markets accounted for 42% of overall turnover. The impact on turnover of the extra‐European areas, by effect of the depreciation of the Dollar and the geo‐political tensions, has decreased by 4% since 31 December 2017.
___________________________________
12
Performance of the Group's Divisions The Italian Business Unit recorded an overall drop in turnover by 4%, with non‐homogeneous trends in the various Divisions. The Lea Division performed well, while Panariagroup Trade was negatively impacted by the difficult macro‐economic context in the areas in which it operates. We expect an improvement in results in the second half of the year and we are witnessing signs of greater dynamics in order acquisitions. The Portuguese Business Unit has successfully overcome the slowdown occurred in the first quarter and in June a total 4% growth was reported, generated by both Brands (Margres and Love Tiles). The domestic market confirmed a growth and the leadership of Gres Panaria Portugal ensures a progressively growing presence on the market. The US Business Unit reported a fall in turnover, in US Dollars, of around 5%. It should be recalled, once again, that the negative impact concerned above all the sales channels of Independent Distributors and Home Centers, while the positive performance of directly managed stores remained unchanged. In a changing market context, the increased imports from Countries that are more aggressive as regards sales prices, forced us to review our commercial policies. Forecasts for turnover in the second half of 2018 are partially recovering thanks to the expected growth in the “Home Center” channel, as well as to the action plans implemented in the other distribution channels and the competitiveness of the new Florida Tile product range. Operating results Gross operating profit came to Euro 12.8 million, representing 6.3% of the value of production (Euro 27.6 million as at 30 June 2017, or 12.4% of the value of production). The drop in margins concerned all the Group Business Units, albeit to a different extent and for different reasons. As stated above, profitability reported in the Italian Business Unit was affected, in part, by the drop in sales volumes, and also by a renovated and most valuable product mix, that in the launch phase, has charged lower prices than the standard positioning defined. Another factor that had a significant impact was the use of the production capacity, albeit not at optimal levels, which determined the natural increase in production costs. The increase in gas tariffs, the weakness of the US Dollar and the start‐up costs of the new “Contract & Key Account” Commercial Division also contributed to the worsening of the operating results. The Portuguese Business Unit confirmed its good profitability, but it did not succeed in obtaining good results for the first half of 2017. The main cause of the worsening is the significant increase in gas tariffs, an important component of production costs. Moreover, during the first half, start‐up costs were borne for the new production line, entirely charged to the Income Statement. The benefits from higher productivity related to the new plant facility are expected in the second half of the year. Lastly, the weakness of the US Dollar also had a negative impact, while reducing margins on exports made in this currency.
___________________________________
13
The main reason for the reduction of profitability in the US Business Unit is the insufficient utilisation of its production capacity, with higher fixed costs. In any case, this capacity permitted to maintain stock levels unchanged. Moreover, in a year where a drop in sales is reported, the strengthening of the business structure, implemented in the previous two years and aimed at supporting development programs, led to an increase in the impact of these costs. To this purpose, actions to reduce and streamline these expenses have already been implemented. Net operating profit amounted to Euro 1.2 million (Euro 15.9 million as at 30 June 2017). Amortisation and depreciation were overall in line with 2017 and they had an impact of 5.7% on the value of production. The balance of financial income and charges reported an improvement of Euro 1.6 million, compared to the first half of 2017. The positive change is almost exclusively due to the “exchange gains and losses”, which was negative by Euro 1.1 million in June 2017, while it is positive by Euro 0.3 million in June 2018. The impact on the value of production, equal to 0.3%, remains on very low levels, thanks to market interest rates and the continuous and careful management of treasury. Consolidated net result was a profit of Euro 0.5 million (Euro 9.8 million as at 30 June 2017).
___________________________________
14
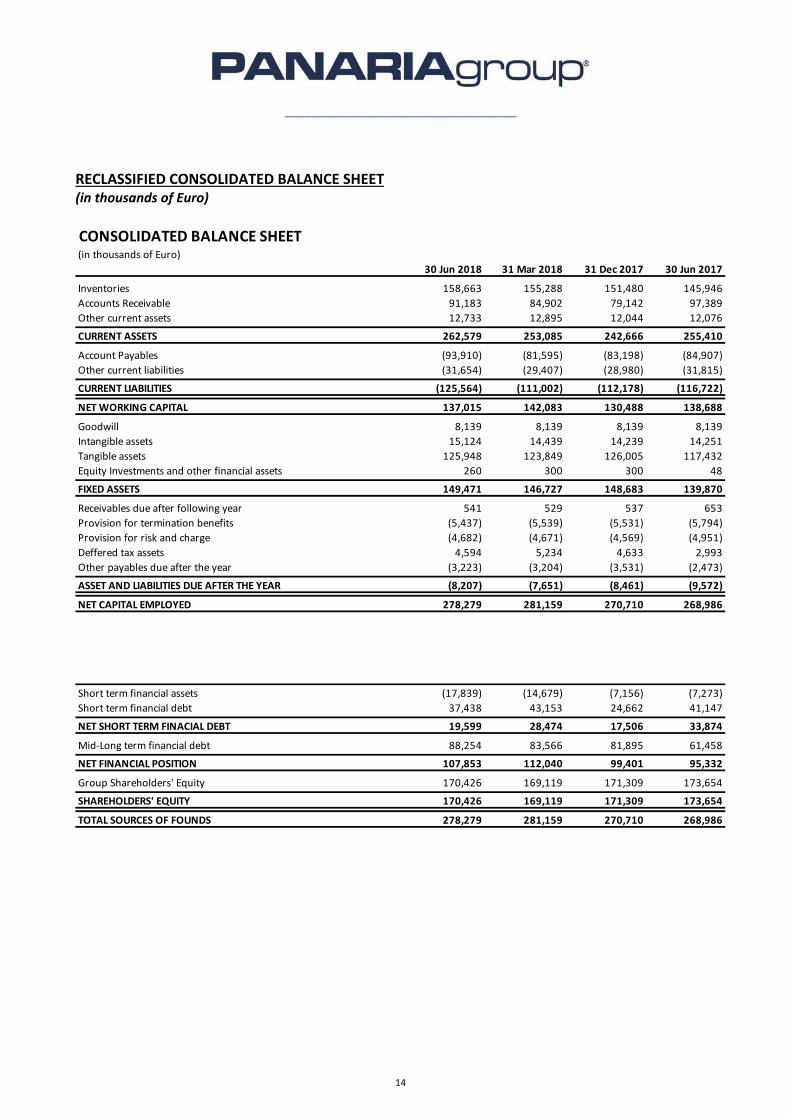
RECLASSIFIED CONSOLIDATED BALANCE SHEET (in thousands of Euro)
CONSOLIDATED BALANCE SHEET (in thousands of Euro)
30 Jun 2018 31 Mar 2018 31 Dec 2017 30 Jun 2017
Inventories 158,663 155,288 151,480 145,946
Accounts Receivable 91,183 84,902 79,142 97,389
Other current assets 12,733 12,895 12,044 12,076
CURRENT ASSETS 262,579 253,085 242,666 255,410
Account Payables (93,910) (81,595) (83,198) (84,907)
Other current liabilities (31,654) (29,407) (28,980) (31,815)
CURRENT LIABILITIES (125,564) (111,002) (112,178) (116,722)
NET WORKING CAPITAL 137,015 142,083 130,488 138,688
Goodwill 8,139 8,139 8,139 8,139
Intangible assets 15,124 14,439 14,239 14,251
Tangible assets 125,948 123,849 126,005 117,432
Equity Investments and other financial assets 260 300 300 48
FIXED ASSETS 149,471 146,727 148,683 139,870
Receivables due after following year 541 529 537 653
Provision for termination benefits (5,437) (5,539) (5,531) (5,794)
Provision for risk and charge (4,682) (4,671) (4,569) (4,951)
Deffered tax assets 4,594 5,234 4,633 2,993
Other payables due after the year (3,223) (3,204) (3,531) (2,473)
ASSET AND LIABILITIES DUE AFTER THE YEAR (8,207) (7,651) (8,461) (9,572)
NET CAPITAL EMPLOYED 278,279 281,159 270,710 268,986
Short term financial assets (17,839) (14,679) (7,156) (7,273)
Short term financial debt 37,438 43,153 24,662 41,147
NET SHORT TERM FINACIAL DEBT 19,599 28,474 17,506 33,874
Mid‐Long term financial debt 88,254 83,566 81,895 61,458
NET FINANCIAL POSITION 107,853 112,040 99,401 95,332
Group Shareholders' Equity 170,426 169,119 171,309 173,654
SHAREHOLDERS' EQUITY 170,426 169,119 171,309 173,654
TOTAL SOURCES OF FOUNDS 278,279 281,159 270,710 268,986
___________________________________
15
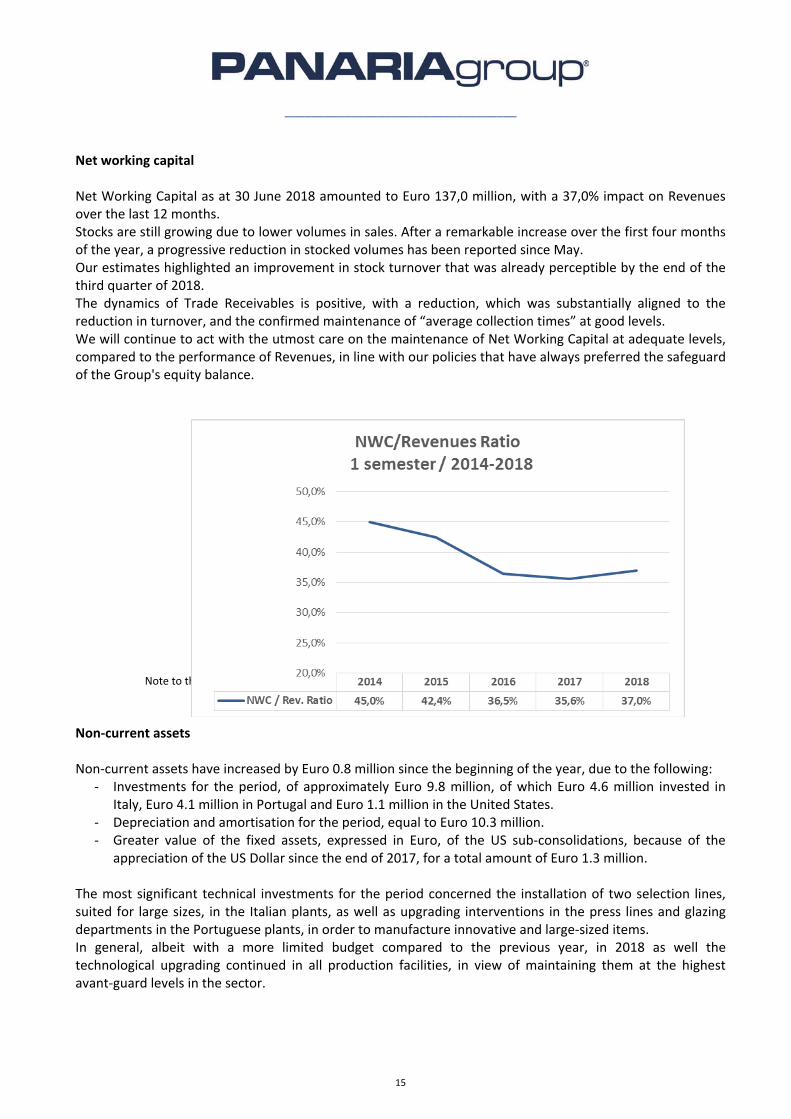
Net working capital Net Working Capital as at 30 June 2018 amounted to Euro 137,0 million, with a 37,0% impact on Revenues over the last 12 months. Stocks are still growing due to lower volumes in sales. After a remarkable increase over the first four months of the year, a progressive reduction in stocked volumes has been reported since May. Our estimates highlighted an improvement in stock turnover that was already perceptible by the end of the third quarter of 2018. The dynamics of Trade Receivables is positive, with a reduction, which was substantially aligned to the reduction in turnover, and the confirmed maintenance of “average collection times” at good levels. We will continue to act with the utmost care on the maintenance of Net Working Capital at adequate levels, compared to the performance of Revenues, in line with our policies that have always preferred the safeguard of the Group's equity balance.
Note to the Graph ‐ Revenues over the last 12 months have been considered while determining the ratio.
Non‐current assets Non‐current assets have increased by Euro 0.8 million since the beginning of the year, due to the following:
‐ Investments for the period, of approximately Euro 9.8 million, of which Euro 4.6 million invested in Italy, Euro 4.1 million in Portugal and Euro 1.1 million in the United States.
‐ Depreciation and amortisation for the period, equal to Euro 10.3 million. ‐ Greater value of the fixed assets, expressed in Euro, of the US sub‐consolidations, because of the
appreciation of the US Dollar since the end of 2017, for a total amount of Euro 1.3 million. The most significant technical investments for the period concerned the installation of two selection lines, suited for large sizes, in the Italian plants, as well as upgrading interventions in the press lines and glazing departments in the Portuguese plants, in order to manufacture innovative and large‐sized items. In general, albeit with a more limited budget compared to the previous year, in 2018 as well the technological upgrading continued in all production facilities, in view of maintaining them at the highest avant‐guard levels in the sector.
___________________________________
16
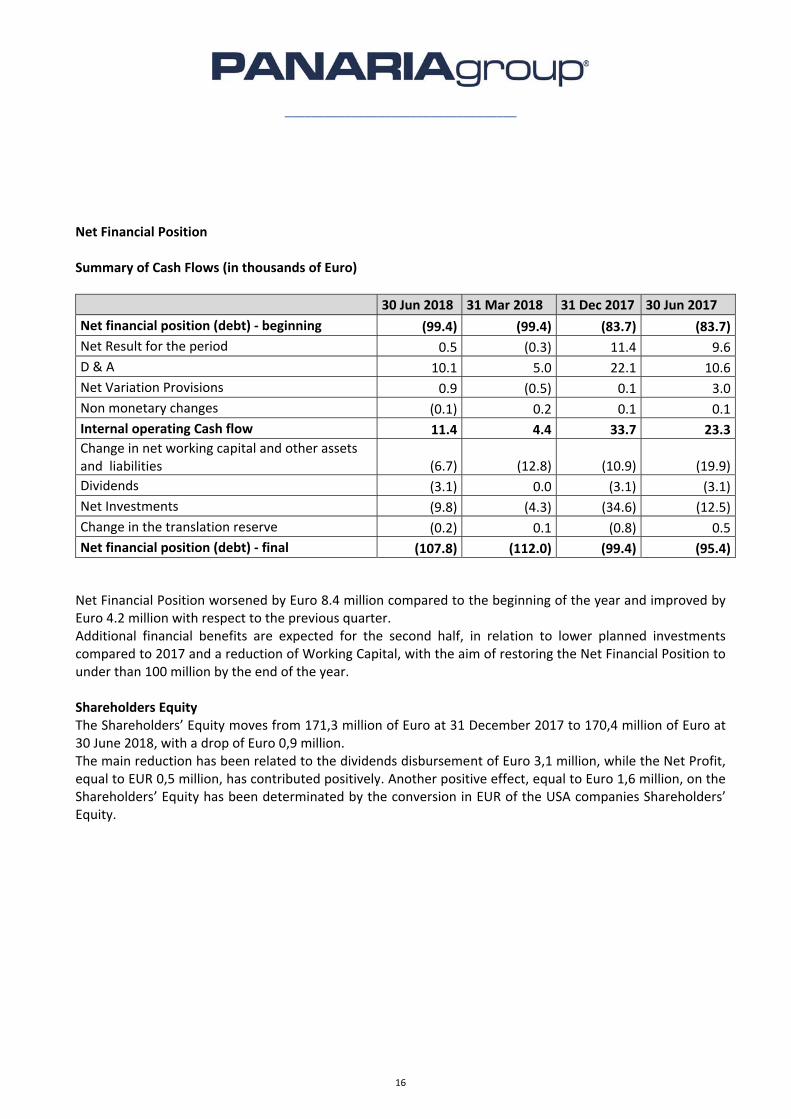
Net Financial Position Summary of Cash Flows (in thousands of Euro)
30 Jun 2018 31 Mar 2018 31 Dec 2017 30 Jun 2017
Net financial position (debt) ‐ beginning (99.4) (99.4) (83.7) (83.7)
Net Result for the period 0.5 (0.3) 11.4 9.6
D & A 10.1 5.0 22.1 10.6
Net Variation Provisions 0.9 (0.5) 0.1 3.0
Non monetary changes (0.1) 0.2 0.1 0.1
Internal operating Cash flow 11.4 4.4 33.7 23.3
Change in net working capital and other assets and liabilities (6.7) (12.8) (10.9) (19.9)
Dividends (3.1) 0.0 (3.1) (3.1)
Net Investments (9.8) (4.3) (34.6) (12.5)
Change in the translation reserve (0.2) 0.1 (0.8) 0.5
Net financial position (debt) ‐ final (107.8) (112.0) (99.4) (95.4) Net Financial Position worsened by Euro 8.4 million compared to the beginning of the year and improved by Euro 4.2 million with respect to the previous quarter. Additional financial benefits are expected for the second half, in relation to lower planned investments compared to 2017 and a reduction of Working Capital, with the aim of restoring the Net Financial Position to under than 100 million by the end of the year. Shareholders Equity The Shareholders’ Equity moves from 171,3 million of Euro at 31 December 2017 to 170,4 million of Euro at 30 June 2018, with a drop of Euro 0,9 million. The main reduction has been related to the dividends disbursement of Euro 3,1 million, while the Net Profit, equal to EUR 0,5 million, has contributed positively. Another positive effect, equal to Euro 1,6 million, on the Shareholders’ Equity has been determinated by the conversion in EUR of the USA companies Shareholders’ Equity.
___________________________________
17
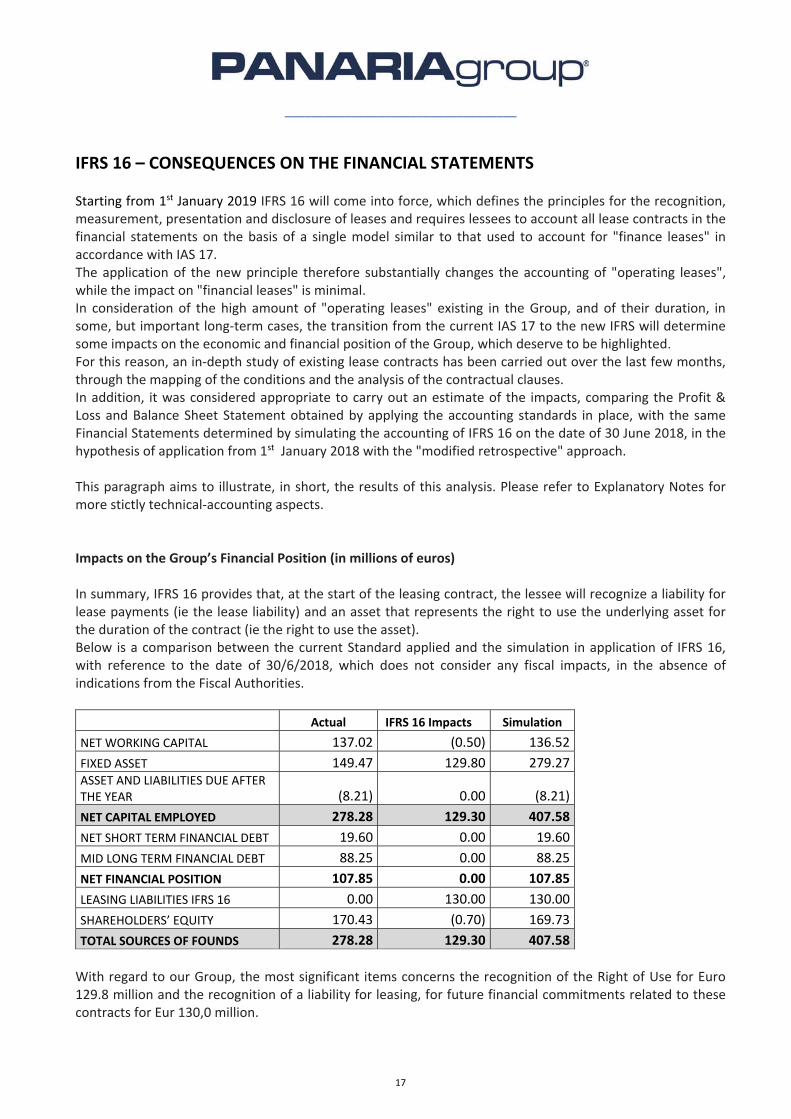
IFRS 16 – CONSEQUENCES ON THE FINANCIAL STATEMENTS Starting from 1st January 2019 IFRS 16 will come into force, which defines the principles for the recognition, measurement, presentation and disclosure of leases and requires lessees to account all lease contracts in the financial statements on the basis of a single model similar to that used to account for "finance leases" in accordance with IAS 17. The application of the new principle therefore substantially changes the accounting of "operating leases", while the impact on "financial leases" is minimal. In consideration of the high amount of "operating leases" existing in the Group, and of their duration, in some, but important long‐term cases, the transition from the current IAS 17 to the new IFRS will determine some impacts on the economic and financial position of the Group, which deserve to be highlighted. For this reason, an in‐depth study of existing lease contracts has been carried out over the last few months, through the mapping of the conditions and the analysis of the contractual clauses. In addition, it was considered appropriate to carry out an estimate of the impacts, comparing the Profit & Loss and Balance Sheet Statement obtained by applying the accounting standards in place, with the same Financial Statements determined by simulating the accounting of IFRS 16 on the date of 30 June 2018, in the hypothesis of application from 1st January 2018 with the "modified retrospective" approach. This paragraph aims to illustrate, in short, the results of this analysis. Please refer to Explanatory Notes for more stictly technical‐accounting aspects. Impacts on the Group’s Financial Position (in millions of euros) In summary, IFRS 16 provides that, at the start of the leasing contract, the lessee will recognize a liability for lease payments (ie the lease liability) and an asset that represents the right to use the underlying asset for the duration of the contract (ie the right to use the asset). Below is a comparison between the current Standard applied and the simulation in application of IFRS 16, with reference to the date of 30/6/2018, which does not consider any fiscal impacts, in the absence of indications from the Fiscal Authorities.
Actual IFRS 16 Impacts Simulation
NET WORKING CAPITAL 137.02 (0.50) 136.52
FIXED ASSET 149.47 129.80 279.27 ASSET AND LIABILITIES DUE AFTER THE YEAR (8.21) 0.00 (8.21)
NET CAPITAL EMPLOYED 278.28 129.30 407.58
NET SHORT TERM FINANCIAL DEBT 19.60 0.00 19.60
MID LONG TERM FINANCIAL DEBT 88.25 0.00 88.25
NET FINANCIAL POSITION 107.85 0.00 107.85
LEASING LIABILITIES IFRS 16 0.00 130.00 130.00
SHAREHOLDERS’ EQUITY 170.43 (0.70) 169.73
TOTAL SOURCES OF FOUNDS 278.28 129.30 407.58
With regard to our Group, the most significant items concerns the recognition of the Right of Use for Euro 129.8 million and the recognition of a liability for leasing, for future financial commitments related to these contracts for Eur 130,0 million.
___________________________________
18
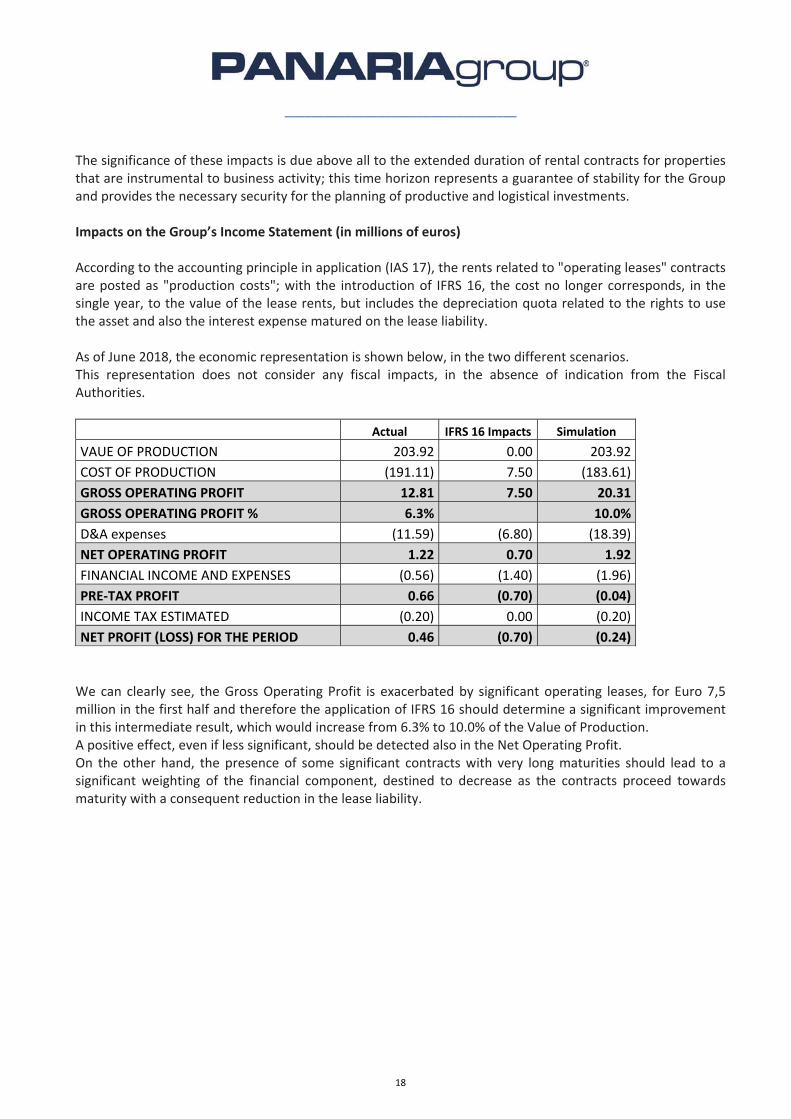
The significance of these impacts is due above all to the extended duration of rental contracts for properties that are instrumental to business activity; this time horizon represents a guarantee of stability for the Group and provides the necessary security for the planning of productive and logistical investments. Impacts on the Group’s Income Statement (in millions of euros) According to the accounting principle in application (IAS 17), the rents related to "operating leases" contracts are posted as "production costs"; with the introduction of IFRS 16, the cost no longer corresponds, in the single year, to the value of the lease rents, but includes the depreciation quota related to the rights to use the asset and also the interest expense matured on the lease liability. As of June 2018, the economic representation is shown below, in the two different scenarios. This representation does not consider any fiscal impacts, in the absence of indication from the Fiscal Authorities.
Actual IFRS 16 Impacts Simulation
VAUE OF PRODUCTION 203.92 0.00 203.92
COST OF PRODUCTION (191.11) 7.50 (183.61)
GROSS OPERATING PROFIT 12.81 7.50 20.31
GROSS OPERATING PROFIT % 6.3% 10.0%
D&A expenses (11.59) (6.80) (18.39)
NET OPERATING PROFIT 1.22 0.70 1.92
FINANCIAL INCOME AND EXPENSES (0.56) (1.40) (1.96)
PRE‐TAX PROFIT 0.66 (0.70) (0.04)
INCOME TAX ESTIMATED (0.20) 0.00 (0.20)
NET PROFIT (LOSS) FOR THE PERIOD 0.46 (0.70) (0.24)
We can clearly see, the Gross Operating Profit is exacerbated by significant operating leases, for Euro 7,5 million in the first half and therefore the application of IFRS 16 should determine a significant improvement in this intermediate result, which would increase from 6.3% to 10.0% of the Value of Production. A positive effect, even if less significant, should be detected also in the Net Operating Profit. On the other hand, the presence of some significant contracts with very long maturities should lead to a significant weighting of the financial component, destined to decrease as the contracts proceed towards maturity with a consequent reduction in the lease liability.
___________________________________
19
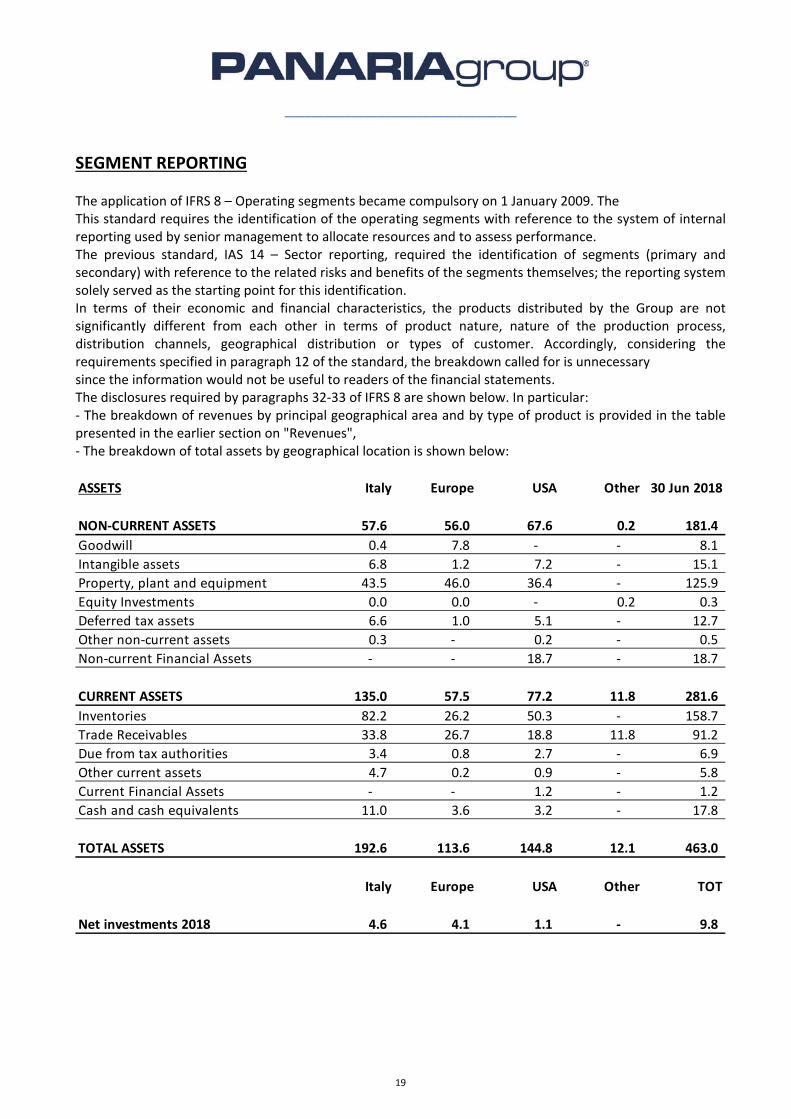
SEGMENT REPORTING The application of IFRS 8 – Operating segments became compulsory on 1 January 2009. The This standard requires the identification of the operating segments with reference to the system of internal reporting used by senior management to allocate resources and to assess performance. The previous standard, IAS 14 – Sector reporting, required the identification of segments (primary and secondary) with reference to the related risks and benefits of the segments themselves; the reporting system solely served as the starting point for this identification. In terms of their economic and financial characteristics, the products distributed by the Group are not significantly different from each other in terms of product nature, nature of the production process, distribution channels, geographical distribution or types of customer. Accordingly, considering the requirements specified in paragraph 12 of the standard, the breakdown called for is unnecessary since the information would not be useful to readers of the financial statements. The disclosures required by paragraphs 32‐33 of IFRS 8 are shown below. In particular: ‐ The breakdown of revenues by principal geographical area and by type of product is provided in the table presented in the earlier section on "Revenues", ‐ The breakdown of total assets by geographical location is shown below:
ASSETS Italy Europe USA Other 30 Jun 2018
NON‐CURRENT ASSETS 57.6 56.0 67.6 0.2 181.4
Goodwill 0.4 7.8 ‐ ‐ 8.1
Intangible assets 6.8 1.2 7.2 ‐ 15.1
Property, plant and equipment 43.5 46.0 36.4 ‐ 125.9
Equity Investments 0.0 0.0 ‐ 0.2 0.3
Deferred tax assets 6.6 1.0 5.1 ‐ 12.7
Other non‐current assets 0.3 ‐ 0.2 ‐ 0.5
Non‐current Financial Assets ‐ ‐ 18.7 ‐ 18.7
CURRENT ASSETS 135.0 57.5 77.2 11.8 281.6
Inventories 82.2 26.2 50.3 ‐ 158.7
Trade Receivables 33.8 26.7 18.8 11.8 91.2
Due from tax authorities 3.4 0.8 2.7 ‐ 6.9
Other current assets 4.7 0.2 0.9 ‐ 5.8
Current Financial Assets ‐ ‐ 1.2 ‐ 1.2
Cash and cash equivalents 11.0 3.6 3.2 ‐ 17.8
TOTAL ASSETS 192.6 113.6 144.8 12.1 463.0
Italy Europe USA Other TOT
Net investments 2018 4.6 4.1 1.1 ‐ 9.8
___________________________________
20
RESEARCH AND DEVELOPMENT ACTIVITIES In the course of this year, the project of the new Research and Development division is being completed; the best coordination between the demand of brands to present collections that are increasingly performing and of great aesthetic impact, with the technological complexity of our production lines, is beginning to bear fruit. Less development time, less waste of production spaces, better execution of the design, will allow us to maintain our premium positioning over time, but at the same time, these factors will allow us to keep research costs under control. Next September at Cersaie of Bologna (the world’s most important fair of the sector) will be presented ranges of large plates of great refinement and saleability, that will contribute to the growth of margins. The technology upgrading carried out in our plants will allow us to keep high the innovation rate on the product, in order to guarantee us supremacy in the high/deluxe end of the ceramic tile market and, at the same time, in order to gradually reduce the unit production costs.
TRANSACTIONS WITH PARENT COMPANIES, AFFILIATES AND RELATED PARTIES
With reference to the condensed half‐yearly consolidated financial statements for 2018, related party transactions are detailed in the explanatory notes. Furthermore, in compliance with CONSOB Communication DEM/6064293 of 28 July 2006, it’s reported that the related party transactions described in the explanatory notes almost all relate to the lease of industrial premises used by the Parent Company for the conduct of its business.
___________________________________
21
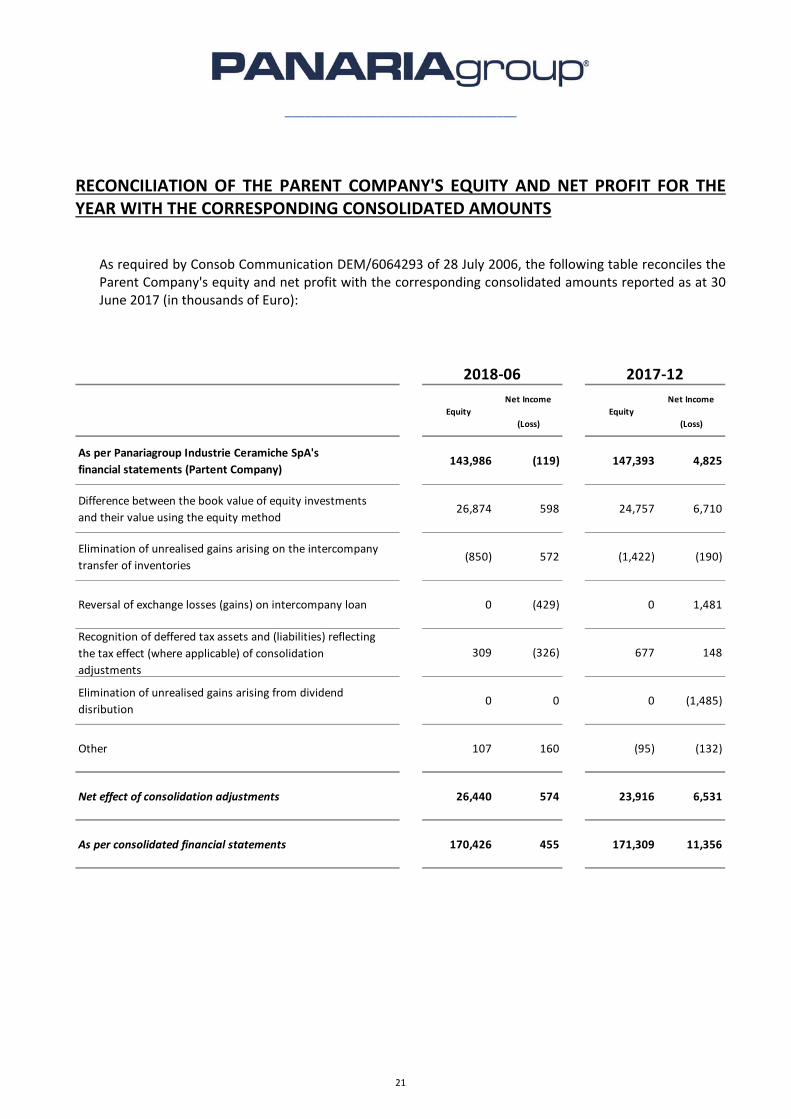
RECONCILIATION OF THE PARENT COMPANY'S EQUITY AND NET PROFIT FOR THE YEAR WITH THE CORRESPONDING CONSOLIDATED AMOUNTS
As required by Consob Communication DEM/6064293 of 28 July 2006, the following table reconciles the Parent Company's equity and net profit with the corresponding consolidated amounts reported as at 30 June 2017 (in thousands of Euro):
Equity
Net Income
(Loss)
Equity
Net Income
(Loss)
As per Panariagroup Industrie Ceramiche SpA's
financial statements (Partent Company)143,986 (119) 147,393 4,825
Difference between the book value of equity investments
and their value using the equity method26,874 598 24,757 6,710
Elimination of unrealised gains arising on the intercompany
transfer of inventories (850) 572 (1,422) (190)
Reversal of exchange losses (gains) on intercompany loan 0 (429) 0 1,481
Recognition of deffered tax assets and (liabilities) reflecting
the tax effect (where applicable) of consolidation
adjustments
309 (326) 677 148
Elimination of unrealised gains arising from dividend
disribution 0 0 0 (1,485)
Other 107 160 (95) (132)
Net effect of consolidation adjustments 26,440 574 23,916 6,531
As per consolidated financial statements 170,426 455 171,309 11,356
2017‐122018‐06
___________________________________
22
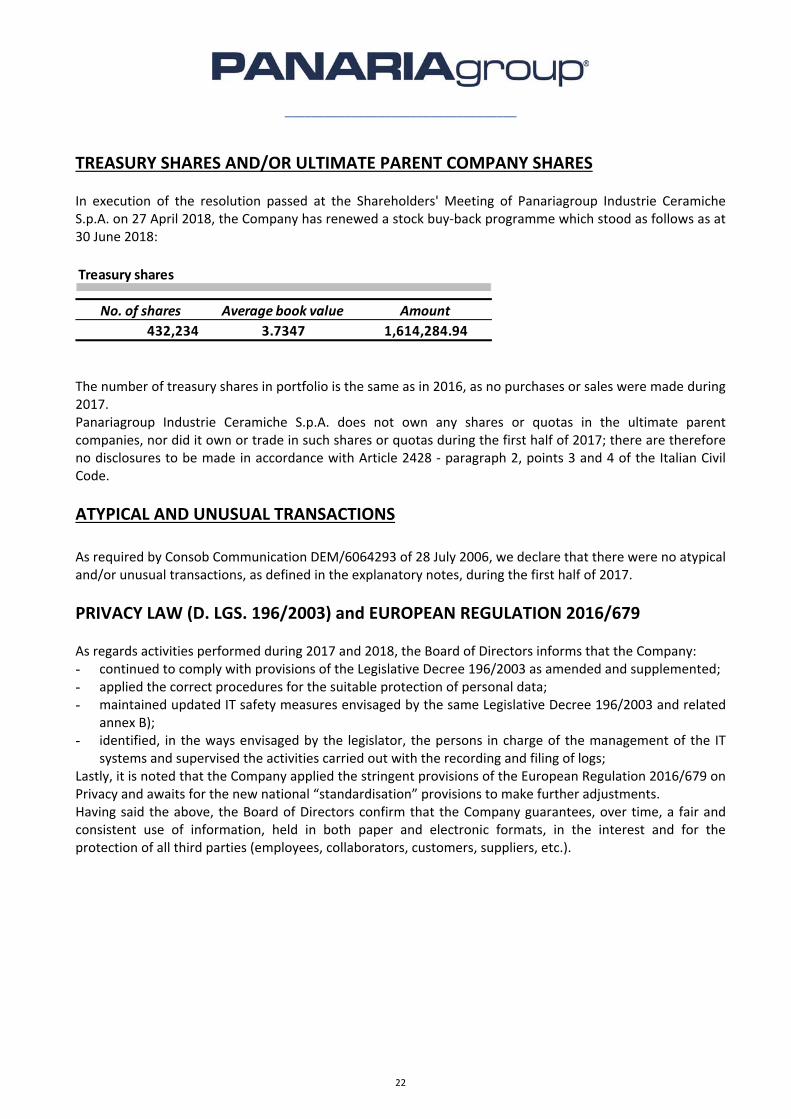
TREASURY SHARES AND/OR ULTIMATE PARENT COMPANY SHARES In execution of the resolution passed at the Shareholders' Meeting of Panariagroup Industrie Ceramiche S.p.A. on 27 April 2018, the Company has renewed a stock buy‐back programme which stood as follows as at 30 June 2018:
Treasury shares
No. of shares Average book value Amount
432,234 3.7347 1,614,284.94 The number of treasury shares in portfolio is the same as in 2016, as no purchases or sales were made during 2017. Panariagroup Industrie Ceramiche S.p.A. does not own any shares or quotas in the ultimate parent companies, nor did it own or trade in such shares or quotas during the first half of 2017; there are therefore no disclosures to be made in accordance with Article 2428 ‐ paragraph 2, points 3 and 4 of the Italian Civil Code.
ATYPICAL AND UNUSUAL TRANSACTIONS
As required by Consob Communication DEM/6064293 of 28 July 2006, we declare that there were no atypical and/or unusual transactions, as defined in the explanatory notes, during the first half of 2017.
PRIVACY LAW (D. LGS. 196/2003) and EUROPEAN REGULATION 2016/679 As regards activities performed during 2017 and 2018, the Board of Directors informs that the Company: - continued to comply with provisions of the Legislative Decree 196/2003 as amended and supplemented; - applied the correct procedures for the suitable protection of personal data; - maintained updated IT safety measures envisaged by the same Legislative Decree 196/2003 and related
annex B); - identified, in the ways envisaged by the legislator, the persons in charge of the management of the IT
systems and supervised the activities carried out with the recording and filing of logs; Lastly, it is noted that the Company applied the stringent provisions of the European Regulation 2016/679 on Privacy and awaits for the new national “standardisation” provisions to make further adjustments. Having said the above, the Board of Directors confirm that the Company guarantees, over time, a fair and consistent use of information, held in both paper and electronic formats, in the interest and for the protection of all third parties (employees, collaborators, customers, suppliers, etc.).
___________________________________
23
BUSINESS OUTLOOK The half‐year just ended, albeit with a minimal positive result, performed worse than expected. In the next half year, we are convinced we can ensure better results in term of margins, both compared to the first half of 2018 and to the second half of 2017. We will operate a strict control of production and distribution costs in all the Italian and foreign Business Unit, without undermining the value of our offer, in order to recover as soon as possible the Group's competitiveness and to recover the clearly positive trend that had characterized the prior three‐years. The sector is in a phase of important change, which favours the emergence of aggregation phenomena both from a production and distribution point of view and which generate stronger and more organized players compared to the past. In this sense we believe that the Group can better deploy its strength thanks to the better coordination of the many initiatives launched in recent years on the development plan of the distribution channels“Contract & Key Account”, Private Label and Home Centers), and on the level of technological development and research, which allows us a prominent role in the segment of large slabs in laminated stoneware available in different thicknesses, formats and finishes.
REPORT ON CORPORATE GOVERNANCE AND THE OWNERSHIP STRUCTURE In compliance with the disclosure requirements of Borsa Italiana Spa and Consob, Panariagroup Industrie Ceramiche Spa has prepared the “Report on Corporate Governance and the Ownership Structure”‚ which can be consulted on its website www.panariagroup.com in the section entitled Company Documents (as required by art. 123‐bis of Law Decree 58 of 24 February 1998). Risk management
___________________________________
24
RISK MANAGEMENT In compliance with all reporting requirements for listed companies, the Law 262/2005 has amended the Issuers Regulations by introducing a requirement for the Directors of such companies to identify, assess and manage risks relating to the Company's activities. The main types of risk that have been identified are as follows: GENERAL ECONOMIC RISK As every operator, Panariagroup is subject to the risk resulting from the non predictability of market trends and, therefore, any significant negative changes in economic conditions might determine an impact on the Group’s state of affairs. We therefore believe that a balanced distribution of turnover over the various geographical areas is a key factor to mitigate this risk. CREDIT AND LIQUIDITY RISK The Group's exposure to credit and liquidity risk is analysed in the explanatory notes accompanying these financial statements, which include the information required by IFRS 7. RISK OF DEPENDENCE ON KEY PERSONNEL The Group's performance depends, among other things, on the competence and skills of its managers, as well as the ability to ensure continuity in the running of operations. Since several of the principal managers of Panariagroup are shareholders in Panariagroup Industrie Ceramiche S.p.A. ‐ through Finpanaria S.p.A., which holds approximately 70% of the share capital ‐ it is reasonable to assume that the possibility of the Group's principal managers leaving the company is remote. Should this happen, however, it could have a negative impact on the activities and results of Panariagroup.
MARKET RISK COMPETITION RISK The main producers of ceramic materials for floor and wall coverings worldwide, besides Italian firms, are: (i) producers in emerging markets, who are particularly competitive price‐wise and target the lower end of the market; (ii) European producers, some of whom are able to compete at the higher end of the market, with average prices that are lower than those of Italian companies, due to lower production costs. Our Group believes that its positioning in the high‐end luxury market segment, which is difficult for low‐cost producers to enter, the renown of its trademarks, the wide range of product lines offered and the particular care and attention given to design, all represent competitive advantages over the products offered by such competitors. Increased competition could negatively impact the Group's economic and financial results in the medium to long term. RAW MATERIAL PRICE RISK The raw materials used in the production of ceramics for floor and wall coverings such as gas, electricity and clay accounted for more than 25.0% of the value of production in both 2016 and 2017. Therefore, their increase, which is not currently expected, could have a negative impact on the financial results of the Group in the short term.
___________________________________
25
ENVIRONMENTAL PROTECTION, PERSONNEL COSTS AND REGULATIONS RELATING TO THE SECTOR The production and sale of ceramic materials for floor and wall coverings is not currently subject to specific sector regulations. On the other hand, environmental protection regulations are especially relevant given the use made of certain chemical compounds, particularly with regard to the treatment of such materials, emissions control and waste disposal. The Group keenly monitors environmental and personnel risks, and any situations arising in connection with operations are treated in compliance with the regulations. With regards to its personnel, Panariagroup protects the health and safety of its employees in compliance with current regulations governing health and safety in the workplace. The average workforce in the first half of 2018 consisted of 1.740 persons, an increase of 35 employees compared with the average figure for 2017.
___________________________________
26
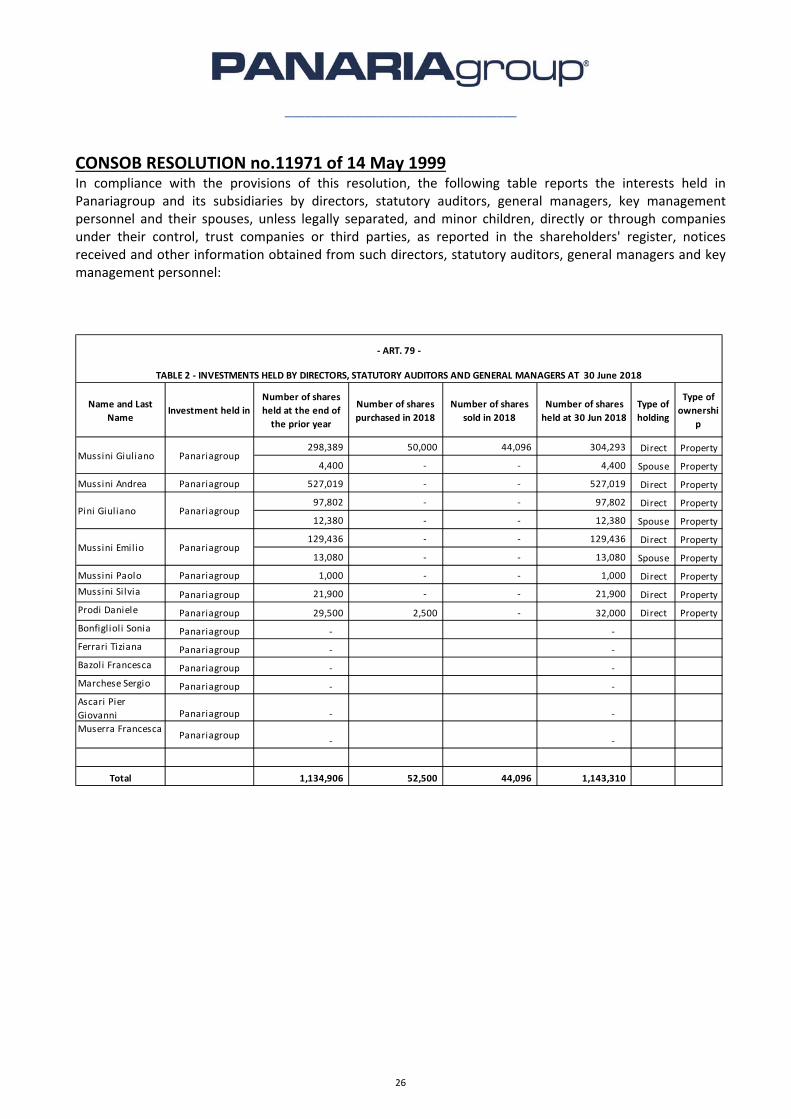
CONSOB RESOLUTION no.11971 of 14 May 1999 In compliance with the provisions of this resolution, the following table reports the interests held in Panariagroup and its subsidiaries by directors, statutory auditors, general managers, key management personnel and their spouses, unless legally separated, and minor children, directly or through companies under their control, trust companies or third parties, as reported in the shareholders' register, notices received and other information obtained from such directors, statutory auditors, general managers and key management personnel:
Name and Last
NameInvestment held in
Number of shares
held at the end of
the prior year
Number of shares
purchased in 2018
Number of shares
sold in 2018
Number of shares
held at 30 Jun 2018
Type of
holding
Type of
ownershi
p
298,389 50,000 44,096 304,293 Direct Property
4,400 ‐ ‐ 4,400 Spouse Property
Mussini Andrea Panariagroup 527,019 ‐ ‐ 527,019 Direct Property
97,802 ‐ ‐ 97,802 Direct Property
12,380 ‐ ‐ 12,380 Spouse Property
129,436 ‐ ‐ 129,436 Direct Property
13,080 ‐ ‐ 13,080 Spouse Property
Mussini Paolo Panariagroup 1,000 ‐ ‐ 1,000 Direct Property
Mussini Silvia Panariagroup 21,900 ‐ ‐ 21,900 Direct Property
Prodi Daniele Panariagroup 29,500 2,500 ‐ 32,000 Direct Property
Bonfiglioli Sonia Panariagroup ‐ ‐
Ferrari Tiziana Panariagroup ‐ ‐
Bazoli Francesca Panariagroup ‐ ‐
Marchese Sergio Panariagroup ‐ ‐
Ascari Pier
Giovanni Panariagroup ‐ ‐
Muserra FrancescaPanariagroup
‐ ‐
Total 1,134,906 52,500 44,096 1,143,310
Mussini Emilio Panariagroup
‐ ART. 79 ‐
TABLE 2 ‐ INVESTMENTS HELD BY DIRECTORS, STATUTORY AUDITORS AND GENERAL MANAGERS AT 30 June 2018
Mussini Giuliano Panariagroup
Pini Giuliano Panariagroup
___________________________________
27
SIGNIFICANT OCCURRED AFTER THE END OF THE HALF YEAR No significant events are to be reported.
WARNINGS The consolidated financial statements for the year ended 30 June 2018 have been prepared in accordance with the International Financial Reporting Standards (IFRS) issued by the International Accounting Standards Board (IASB) and officially approved by the European Union, as well as with the instructions issued in implementation of article 9 of Legislative Decree 38/2005. The term IFRS is understood as including all of the international accounting standards (IAS), suitably revised, and all of the interpretations by the International Financial Reporting Interpretations Committee (IFRIC), previously named the Standing Interpretations Committee (SIC). After the European Regulation no. 1606 took effect in July 2002 and beginning with the financial statements of the first half of 2005, the Group adopted the IFRS standards issued by the International Accounting Standards Board officially approved by the European Union. The accounting policies and financial statement formats used in preparing these financial statements do not differ from those applied in the financial statements for the year ended 31 December 2017, with the exception of those international accounting standards which entered into effect as at 01 January 2018 and which are illustrated in the section of the financial statements named "Accounting standards, amendments and interpretations applicable as at 01 January 2018"; refer to this section for more information. The application of these standards did not produce any significant effects. As regards the provisions on the conditions applied to the listing of parent companies, incorporated companies or companies regulated under the laws of countries outside of the European Union and which have a significant impact on the consolidated financial statements, it should be noted that: ‐ As at 30 June 2018 three of the companies controlled by Panariagroup come under these regulations: Panariagroup USA Inc., Florida Tile Inc. and Lea North America LLC. ‐ Adequate procedures have been adopted to ensure thorough compliance with the new rules (art. 36 of Market Regulations issued by Consob).
___________________________________
28
PERFORMANCE MESASURES Explanatory notes and directors’ report, include some performance indicators in order to present a better evaluation of financial and economic performance of the Group. As regards those indicators, on 3 December 2015, CONSOB issued Communication no. 92543/15, which gives force to the Guidelines issued on 5 October 2015, by the European Securities and Markets Authority (ESMA) concerning the presentation of alternative performance measures in regulated information disclosed or prospectuses published as from 3 July 2016. These Guidelines, which update the previous CESR Recommendation (CESR/05‐178b), are intended to promote the usefulness and transparency of alternative performance indicators included in regulated information or prospectuses within the scope of application of Directive 2003/71/EC in order to improve their comparability, reliability and comprehensibility. Accordingly, in line with the regulations cited above, the criteria used to construct these indicators are as follows: ‐ Gross operating margin: this is made up of the pre‐tax result before financial income and expenses, depreciation and amortisation, provisions and impairment charges on assets made during the period and provisions; ‐ Net operating margin: this is made up of the pre‐tax result before financial income and expenses; ‐ Pre‐tax profit (loss): this is made up of the result for the period before income taxes. ‐ Net Working Capital: this is made up of the inventory, account receivable, other current assets, net of account payables and other current liabilities. ‐ Net Financial Position: this is made up of cash and financial credit, net of bank short and medium‐long terms financial debts and leasing.
___________________________________
29
ATTACHMENTS Reconciliation between the reclassified balance sheet and the IFRS‐format balance sheet as at 30
June 2018
Reconciliation between the reclassified balance sheet and the IFRS‐format balance sheet as at 31 December 2017
Reconciliation between the summary of cash flows and the IFRS‐format cash flow statement
The Chairman Sassuolo, 03 August 2018
Mussini Emilio

___________________________________
30
ASSETS 30‐June‐2018 RIF 30‐June‐2018 RIF
NON‐CURRENT ASSETS 181,426 Inventories 158,663 AC1
Goodwill 8,139 ANC1 Receivables from customers 91,183 AC2
Intangible assets 15,124 ANC2 Other current assets 12,733 AC3+AC4+AC5‐(*)
Property, plant and equipment 125,948 ANC3 CURRENT ASSETS 262,579
Equity Investments 260 ANC4
Deferred tax assets 12,699 ANC5 Payables due to suppliers (93,910) PC1
Other non‐current assets 541 ANC6 Other current liabilities (31,654) PC2+PC3
Non‐current Financial Assets 18,715 ANC7 CURRENT LIABILITIES (125,564)
CURRENT ASSETS 281,579 NET WORKING CAPITAL 137,015
Inventories 158,663 AC1
Receivables from customers 91,183 AC2 Goodwill 8,139 ANC1
Due from tax authorities 6,925 AC3 Intangible assets 15,124 ANC2
Other current assets 5,808 AC4 Property, plant and equipment 125,948 ANC3
Current Financial Assets 1,161 AC5 Equity Investments 260 ANC4+ANC7 ‐ (**)
Cash and cash equivalents 17,839 AC6 FIXED ASSETS 149,471
TOTAL ASSETS 463,005
Receivables due beyond 12 months 541 ANC6
Liabilities for employee benefits (5,437) PNC1
LIABILITIES AND EQUITY 30‐June‐2018 Provision for risk and charge (4,682) PNC3
Provision for deferred taxes 4,594 ANC5+PNC2
EQUITY 170,426 PN Other liabilities due beyond 12 months (3,223) PNC4
Share capital 22,678 ASSET AND LIABILITIES DUE BEYOND 12 MONTHS (8,207)
Reserves 147,293
Net profit (loss) for the year 455 NET CAPITAL EMPLOYED 278,279
NON‐CURRENT LIABILITIES 128,416
Liabilities for employee benefits 5,437 PNC1 Short term financial assets (17,839) AC6
Deferred tax liabilities 8,105 PNC2 Short term financial indebtedness 37,438 PC4+PC5 ‐ (*)
Provisions for risks and charges 4,682 PNC3
Other non‐current liabilities 3,223 PNC4 NET SHORT TERM FINACIAL INDEBTEDNESS 19,599
Due to banks 85,996 PNC5
Due to other sources of finance 20,973 PNC6 Mid‐Long term financial debt 88,254 PNC5+PNC6 ‐ (**)
CURRENT LIABILITIES 164,163 NET MID‐LONG TERM FINACIAL INDEBTEDNESS 88,254
Payables due to suppliers 93,910 PC1
Due to tax authorities 3,534 PC2 NET FINANCIAL POSITION 107,853
Other current liabilities 28,120 PC3
Due to banks 36,213 PC4 Group Shareholders' Equity 170,426 PN
Due to other sources of finance 2,386 PC5
SHAREHOLDERS' EQUITY 170,426
TOTAL LIABILITIES AND EQUITY 463,005
TOTAL SOURCES OF FOUNDS 278,279
(*) CURRENT PORTION OF IRB 1,161
Classified under current assets in the IFRS satatement of financial position
Included in the short‐term financial indebtedness in the reclassified statement of financial position
(**) NON ‐ CURRENT PORTION OF IRB 18,715
Classified under financial assets in the IFRS statement of financial position
Included in the long‐term financial indebtedness in the reclassified statement of financial position
Reconciliation IFRS Statement of Financial Position/Reclassified Statement of Financial Position
Figures at 30 June 2018
STATEMENT OF FINANCIAL POSITION ‐ IFRS RECLASSIFIED STATEMENT OF FINANCIAL POSITION
___________________________________
31
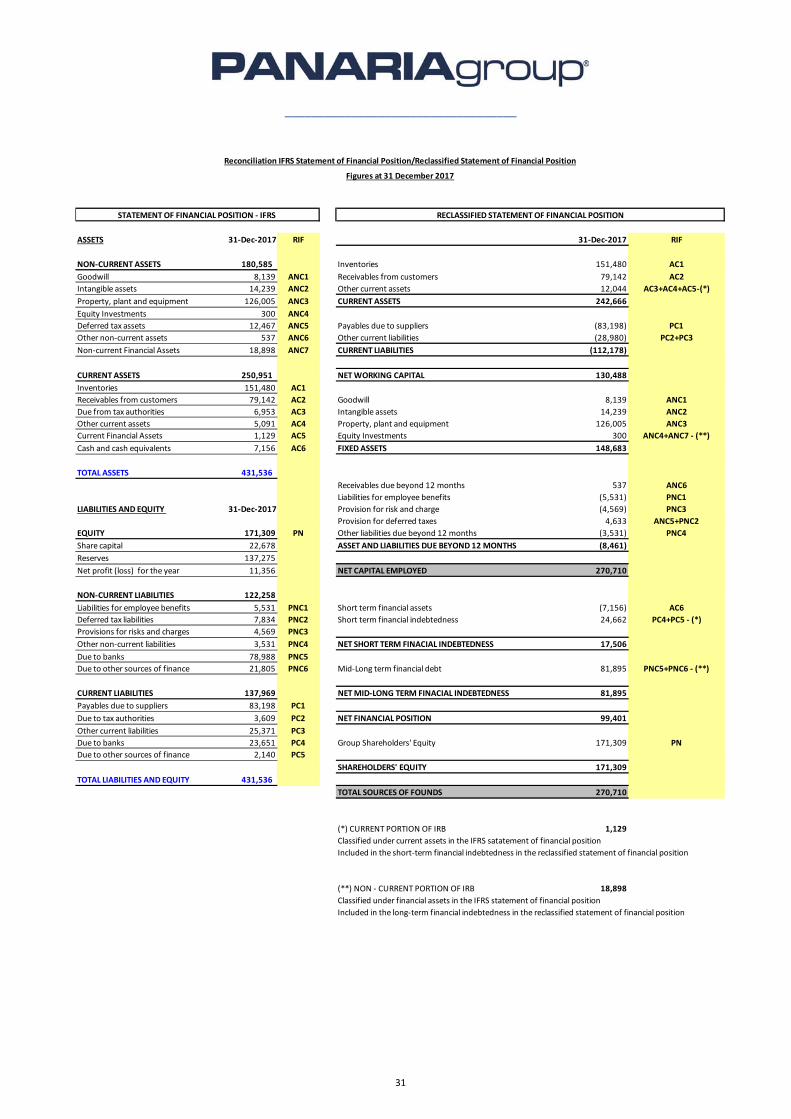
ASSETS 31‐Dec‐2017 RIF 31‐Dec‐2017 RIF
NON‐CURRENT ASSETS 180,585 Inventories 151,480 AC1
Goodwill 8,139 ANC1 Receivables from customers 79,142 AC2
Intangible assets 14,239 ANC2 Other current assets 12,044 AC3+AC4+AC5‐(*)
Property, plant and equipment 126,005 ANC3 CURRENT ASSETS 242,666
Equity Investments 300 ANC4
Deferred tax assets 12,467 ANC5 Payables due to suppliers (83,198) PC1
Other non‐current assets 537 ANC6 Other current liabilities (28,980) PC2+PC3
Non‐current Financial Assets 18,898 ANC7 CURRENT LIABILITIES (112,178)
CURRENT ASSETS 250,951 NET WORKING CAPITAL 130,488
Inventories 151,480 AC1
Receivables from customers 79,142 AC2 Goodwill 8,139 ANC1
Due from tax authorities 6,953 AC3 Intangible assets 14,239 ANC2
Other current assets 5,091 AC4 Property, plant and equipment 126,005 ANC3
Current Financial Assets 1,129 AC5 Equity Investments 300 ANC4+ANC7 ‐ (**)
Cash and cash equivalents 7,156 AC6 FIXED ASSETS 148,683
TOTAL ASSETS 431,536
Receivables due beyond 12 months 537 ANC6
Liabilities for employee benefits (5,531) PNC1
LIABILITIES AND EQUITY 31‐Dec‐2017 Provision for risk and charge (4,569) PNC3
Provision for deferred taxes 4,633 ANC5+PNC2
EQUITY 171,309 PN Other liabilities due beyond 12 months (3,531) PNC4
Share capital 22,678 ASSET AND LIABILITIES DUE BEYOND 12 MONTHS (8,461)
Reserves 137,275
Net profit (loss) for the year 11,356 NET CAPITAL EMPLOYED 270,710
NON‐CURRENT LIABILITIES 122,258
Liabilities for employee benefits 5,531 PNC1 Short term financial assets (7,156) AC6
Deferred tax liabilities 7,834 PNC2 Short term financial indebtedness 24,662 PC4+PC5 ‐ (*)
Provisions for risks and charges 4,569 PNC3
Other non‐current liabilities 3,531 PNC4 NET SHORT TERM FINACIAL INDEBTEDNESS 17,506
Due to banks 78,988 PNC5
Due to other sources of finance 21,805 PNC6 Mid‐Long term financial debt 81,895 PNC5+PNC6 ‐ (**)
CURRENT LIABILITIES 137,969 NET MID‐LONG TERM FINACIAL INDEBTEDNESS 81,895
Payables due to suppliers 83,198 PC1
Due to tax authorities 3,609 PC2 NET FINANCIAL POSITION 99,401
Other current liabilities 25,371 PC3
Due to banks 23,651 PC4 Group Shareholders' Equity 171,309 PN
Due to other sources of finance 2,140 PC5
SHAREHOLDERS' EQUITY 171,309
TOTAL LIABILITIES AND EQUITY 431,536
TOTAL SOURCES OF FOUNDS 270,710
(*) CURRENT PORTION OF IRB 1,129
Classified under current assets in the IFRS satatement of financial position
Included in the short‐term financial indebtedness in the reclassified statement of financial position
(**) NON ‐ CURRENT PORTION OF IRB 18,898
Classified under financial assets in the IFRS statement of financial position
Included in the long‐term financial indebtedness in the reclassified statement of financial position
Reconciliation IFRS Statement of Financial Position/Reclassified Statement of Financial Position
Figures at 31 December 2017
STATEMENT OF FINANCIAL POSITION ‐ IFRS RECLASSIFIED STATEMENT OF FINANCIAL POSITION
___________________________________
32
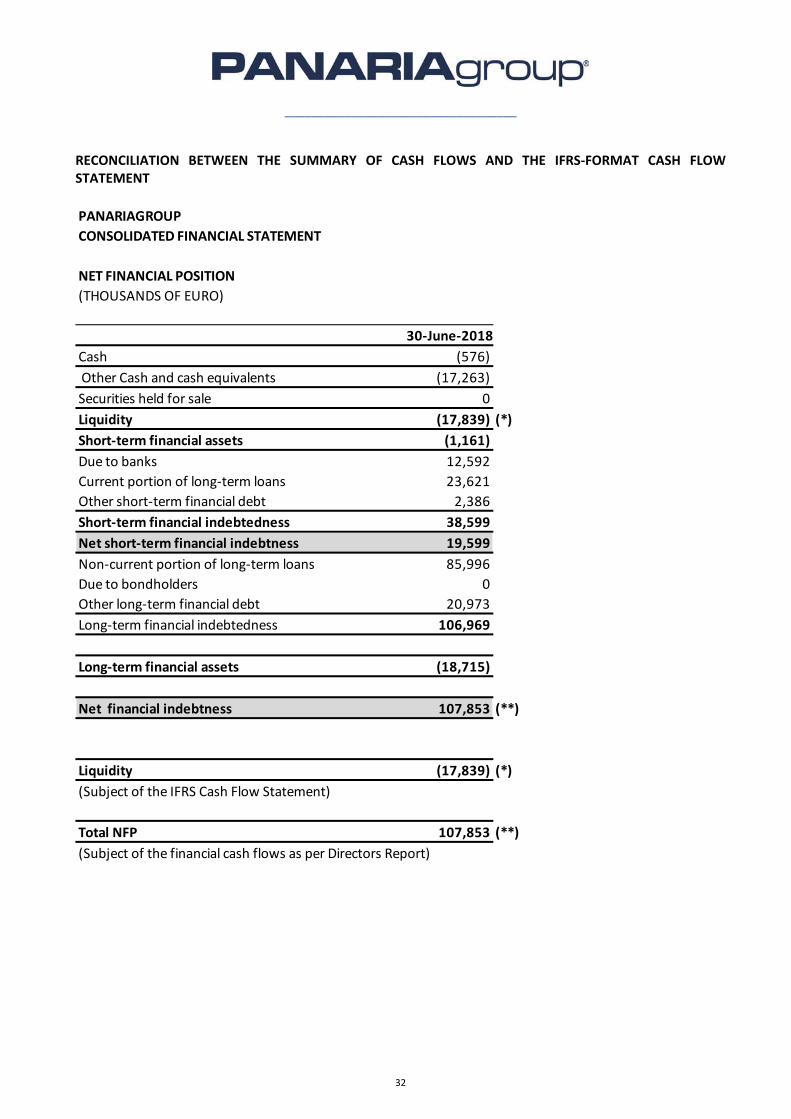
RECONCILIATION BETWEEN THE SUMMARY OF CASH FLOWS AND THE IFRS‐FORMAT CASH FLOW STATEMENT
PANARIAGROUP
CONSOLIDATED FINANCIAL STATEMENT
NET FINANCIAL POSITION
(THOUSANDS OF EURO)
30‐June‐2018
Cash (576)
Other Cash and cash equivalents (17,263)
Securities held for sale 0
Liquidity (17,839) (*)
Short‐term financial assets (1,161)
Due to banks 12,592
Current portion of long‐term loans 23,621
Other short‐term financial debt 2,386
Short‐term financial indebtedness 38,599
Net short‐term financial indebtness 19,599
Non‐current portion of long‐term loans 85,996
Due to bondholders 0
Other long‐term financial debt 20,973
Long‐term financial indebtedness 106,969
Long‐term financial assets (18,715)
Net financial indebtness 107,853 (**)
Liquidity (17,839) (*)
(Subject of the IFRS Cash Flow Statement)
Total NFP 107,853 (**)
(Subject of the financial cash flows as per Directors Report)
___________________________________
33
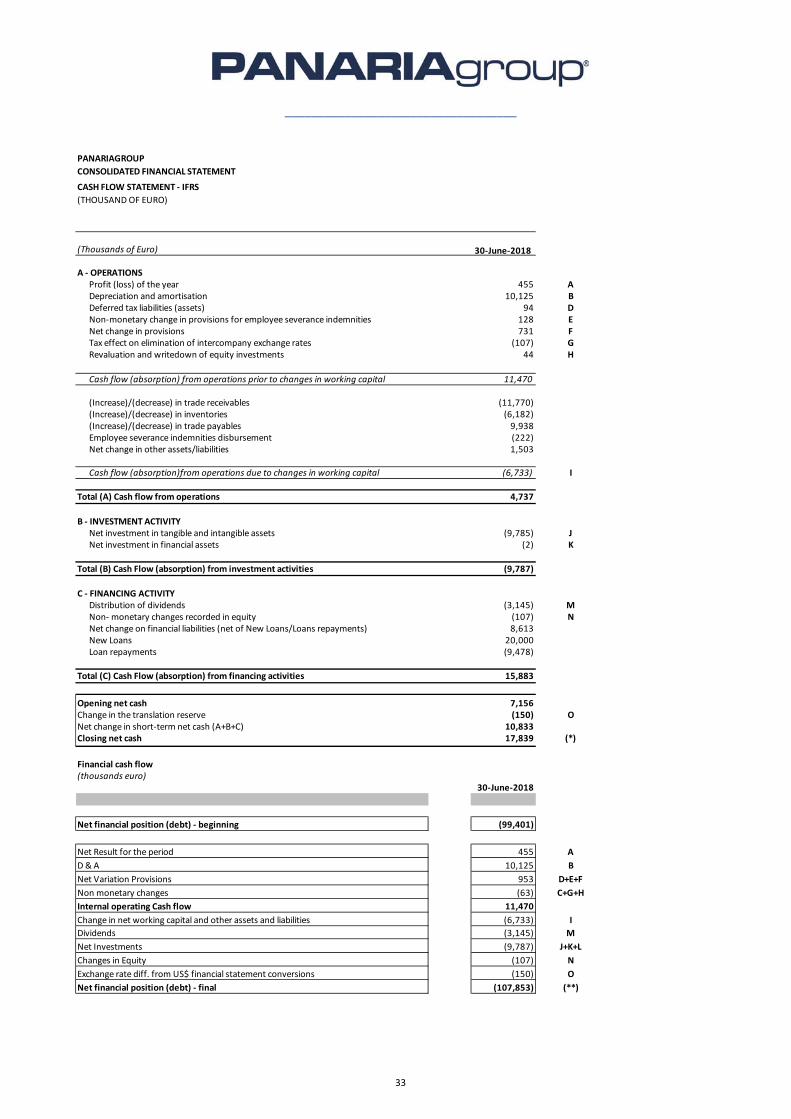
PANARIAGROUP
CONSOLIDATED FINANCIAL STATEMENT
CASH FLOW STATEMENT ‐ IFRS
(THOUSAND OF EURO)
(Thousands of Euro) 30‐June‐2018
A ‐ OPERATIONS Profit (loss) of the year 455 A Depreciation and amortisation 10,125 B Deferred tax liabilities (assets) 94 D Non‐monetary change in provisions for employee severance indemnities 128 E Net change in provisions 731 F Tax effect on elimination of intercompany exchange rates (107) G Revaluation and writedown of equity investments 44 H
Cash flow (absorption) from operations prior to changes in working capital 11,470
(Increase)/(decrease) in trade receivables (11,770) (Increase)/(decrease) in inventories (6,182) (Increase)/(decrease) in trade payables 9,938 Employee severance indemnities disbursement (222) Net change in other assets/liabilities 1,503
Cash flow (absorption)from operations due to changes in working capital (6,733) I
Total (A) Cash flow from operations 4,737
B ‐ INVESTMENT ACTIVITY Net investment in tangible and intangible assets (9,785) J Net investment in financial assets (2) K
Total (B) Cash Flow (absorption) from investment activities (9,787)
C ‐ FINANCING ACTIVITY Distribution of dividends (3,145) M Non‐ monetary changes recorded in equity (107) N Net change on financial liabilities (net of New Loans/Loans repayments) 8,613 New Loans 20,000 Loan repayments (9,478)
Total (C) Cash Flow (absorption) from financing activities 15,883
Opening net cash 7,156 Change in the translation reserve (150) ONet change in short‐term net cash (A+B+C) 10,833 Closing net cash 17,839 (*)
Financial cash flow(thousands euro)
30‐June‐2018
Net financial position (debt) ‐ beginning (99,401)
Net Result for the period 455 A
D & A 10,125 B
Net Variation Provisions 953 D+E+F
Non monetary changes (63) C+G+H
Internal operating Cash flow 11,470
Change in net working capital and other assets and liabilities (6,733) I
Dividends (3,145) M
Net Investments (9,787) J+K+L
Changes in Equity (107) N
Exchange rate diff. from US$ financial statement conversions (150) O
Net financial position (debt) ‐ final (107,853) (**)