Embed Size (px)
Citation preview

PAN AFRICAN RESOURCESROADSHOWMIAMI / LONDON - FEBRUARY / MARCH 2016

2
DISCLAIMER
This presentation is provided on a confidential basis.
The name 'Presenter' refers to Pan African Resources PLC and its advisors, subsidiaries or affiliated companies.
This presentation has not been filed, lodged, registered or approved in any jurisdiction and recipients of this document should keep themselves informed of and comply with and observeall applicable legal and regulatory requirements.
Statements or assumptions in this presentation as to future matters may prove to be incorrect. The Presenter makes no representation or warranty as to the accuracy of suchstatements or assumptions. Circumstances may change and the contents of this presentation may become outdated as a result, and the Presenter has no obligation to update thepresentation or correct any inaccuracies or omissions in this presentation.
Recipients should not treat this presentation as advice relating to legal, taxation or investment matters and are advised to consult their own professional advisers.
This presentation may not be reproduced in whole or in part, nor may any of its contents be divulged to any third party without the prior consent in writing of the Presenter.
The recipient acknowledges that neither it nor the Presenter intends that the Presenter act or be responsible as a fiduciary to the recipient, its management, stockholders, creditors orany other person. Each of the recipient and the Presenter, by accepting and providing this presentation respectively, expressly disclaims any fiduciary relationship and agrees that therecipient is responsible for making its own independent judgments with respect to any transaction and any other matters regarding this presentation.
Furthermore, the information contained in this presentation may also qualify as “inside information” as defined in the Securities Services Act, 36 of 2004 (“SSA”). In terms of the SSA,it is a criminal offence for a person who knows that he or she has inside information to –
• deal directly or indirectly or through an agent for his or her own account, or for the account of another person, in listed securities to which the inside information relates;• disclose the inside information to another other than in the proper course of a person’s employment, profession or duties; and• encourage or cause another person to deal or discourage or stop another person from dealing in the listed securities to which the inside information relates.
The Presenter makes no representations as to the actual value which may be received in connection with a transaction nor the legal, tax or accounting effects of consummating atransaction. Unless the expressly contemplated hereby, the information in this presentation does not take into account the effects of a possible transaction or transactions involving anactual or potential change of control, which may have significant valuation and other effects. The Presenter shall not have any liability for any loss suffered due to reliance being placedon this presentation, the information contained herein or the oral presentations referred to.
This presentation is for information purposes only and does not constitute an offer or invitation to subscribe for or purchase any securities, and neither this presentation nor anythingcontained therein nor the fact of its distribution shall form the basis or be relied on in connection with or act as any inducement to enter into any contract or commitment whatsoever.

33
CONTENT OF PRESENTATION• Company Overview
• 2016 Interim Key Features
• Barberton Mines
• Evander Mines
• Phoenix Platinum
• Why Pan African Resources?

COMPANY OVERVIEWTHE AFRICAN FOCUSED PRECIOUS METALS PRODUCER
55
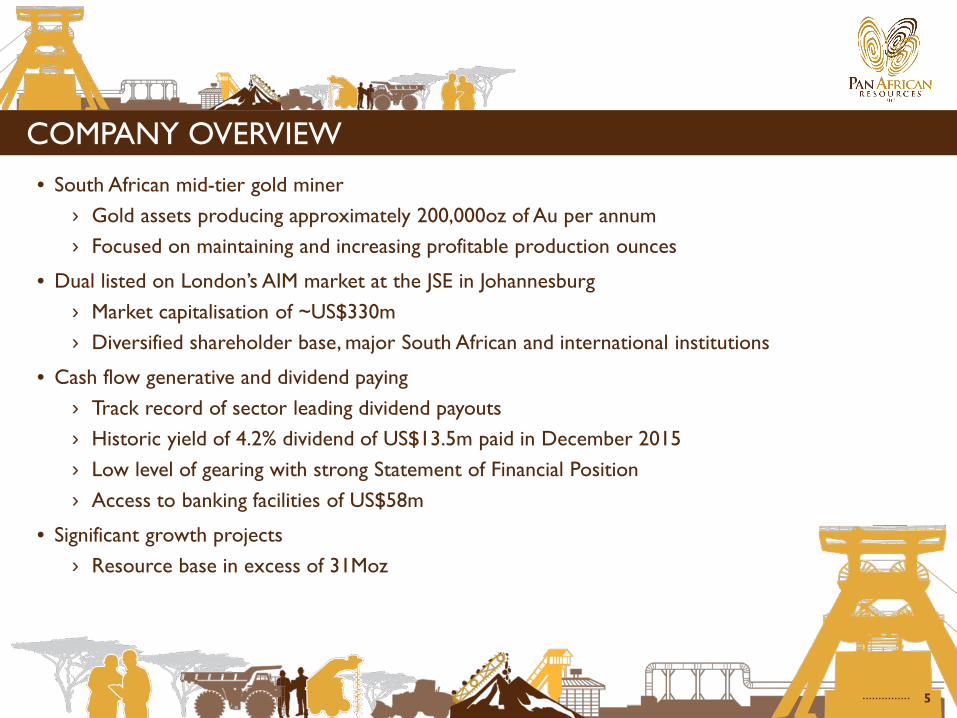
COMPANY OVERVIEW• South African mid-tier gold miner
› Gold assets producing approximately 200,000oz of Au per annum› Focused on maintaining and increasing profitable production ounces
• Dual listed on London’s AIM market at the JSE in Johannesburg› Market capitalisation of ~US$330m› Diversified shareholder base, major South African and international institutions
• Cash flow generative and dividend paying› Track record of sector leading dividend payouts› Historic yield of 4.2% dividend of US$13.5m paid in December 2015› Low level of gearing with strong Statement of Financial Position› Access to banking facilities of US$58m
• Significant growth projects› Resource base in excess of 31Moz
6
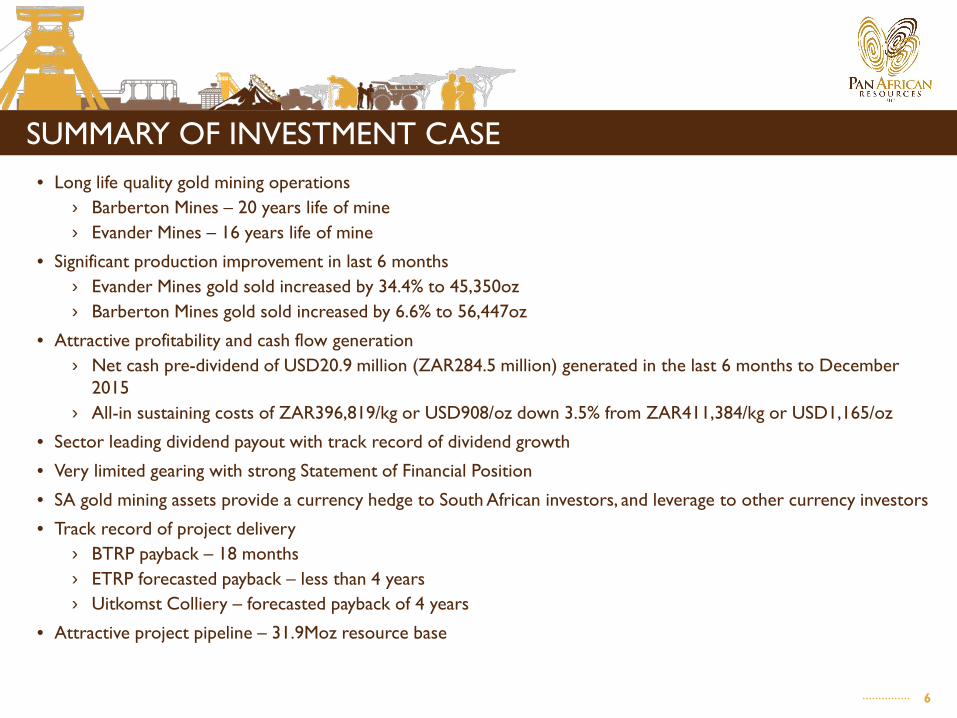
SUMMARY OF INVESTMENT CASE• Long life quality gold mining operations
› Barberton Mines – 20 years life of mine› Evander Mines – 16 years life of mine
• Significant production improvement in last 6 months› Evander Mines gold sold increased by 34.4% to 45,350oz› Barberton Mines gold sold increased by 6.6% to 56,447oz
• Attractive profitability and cash flow generation› Net cash pre-dividend of USD20.9 million (ZAR284.5 million) generated in the last 6 months to December
2015› All-in sustaining costs of ZAR396,819/kg or USD908/oz down 3.5% from ZAR411,384/kg or USD1,165/oz
• Sector leading dividend payout with track record of dividend growth
• Very limited gearing with strong Statement of Financial Position
• SA gold mining assets provide a currency hedge to South African investors, and leverage to other currency investors
• Track record of project delivery› BTRP payback – 18 months› ETRP forecasted payback – less than 4 years› Uitkomst Colliery – forecasted payback of 4 years
• Attractive project pipeline – 31.9Moz resource base
77
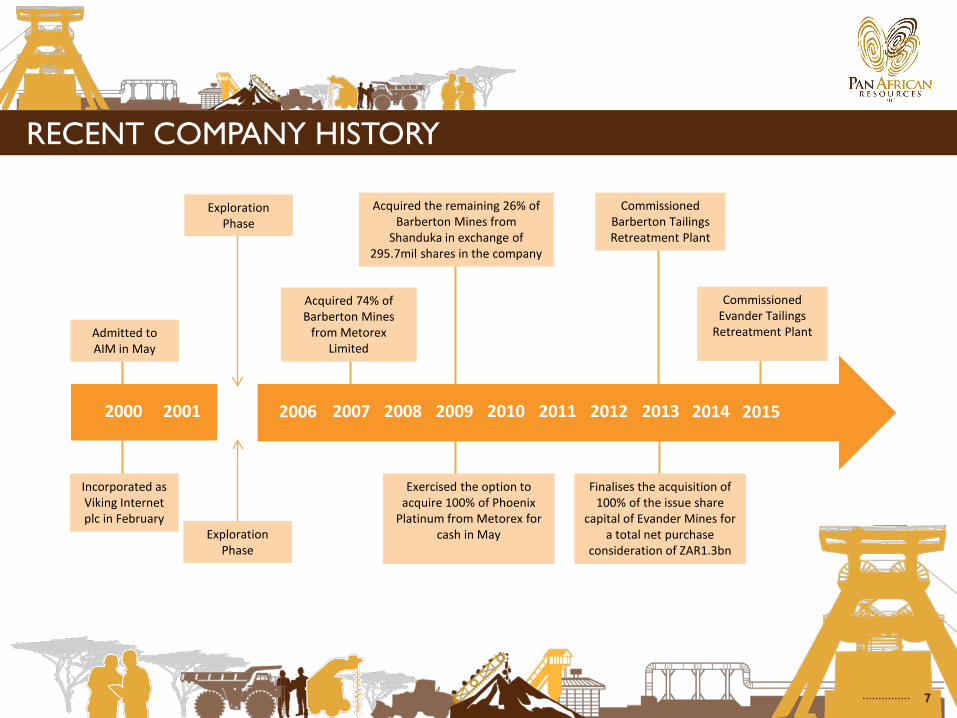
RECENT COMPANY HISTORY
2000 2001 2007 2012 201320092008 2010 2011
Admitted to AIM in May
Incorporated as Viking Internet plc in February
Acquired 74% of Barberton Mines
from Metorex Limited
Exercised the option to acquire 100% of Phoenix
Platinum from Metorex for cash in May
Acquired the remaining 26% of Barberton Mines from
Shanduka in exchange of 295.7mil shares in the company
Finalises the acquisition of 100% of the issue share
capital of Evander Mines for a total net purchase
consideration of ZAR1.3bn
Commissioned Barberton Tailings Retreatment Plant
2014 2015
CommissionedEvander Tailings
Retreatment Plant
Exploration Phase
2006
Exploration Phase
88
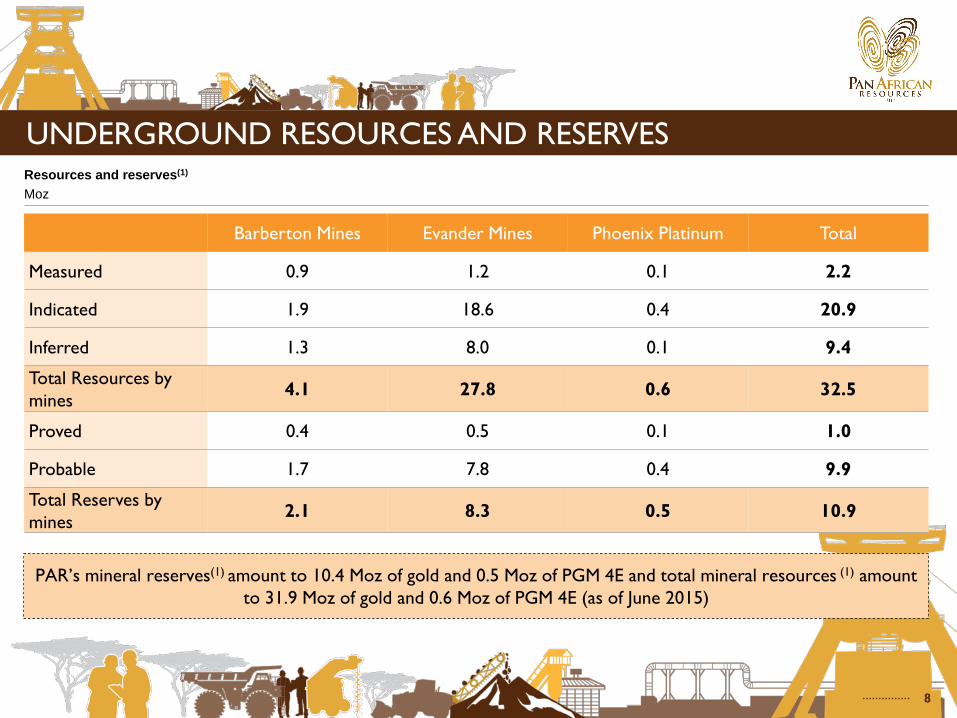
UNDERGROUND RESOURCES AND RESERVESResources and reserves(1)
Moz
Barberton Mines Evander Mines Phoenix Platinum Total
Measured 0.9 1.2 0.1 2.2
Indicated 1.9 18.6 0.4 20.9
Inferred 1.3 8.0 0.1 9.4
Total Resources bymines 4.1 27.8 0.6 32.5
Proved 0.4 0.5 0.1 1.0
Probable 1.7 7.8 0.4 9.9
Total Reserves by mines 2.1 8.3 0.5 10.9
PAR’s mineral reserves(1) amount to 10.4 Moz of gold and 0.5 Moz of PGM 4E and total mineral resources (1) amount to 31.9 Moz of gold and 0.6 Moz of PGM 4E (as of June 2015)

9
RESERVES AND RESOURCES
Note: Contained attributable gold production, proven and probable reserves and measured, indicated and inferred resources as publicly reported by each companySource: Company reports, FactSet
Acacia
AngloGold
Barrick Gold
Beadell
Centamin
Evolution
Goldcorp
Harmony
Kinross
Newcrest
Newmont
Pan African
RandgoldRegis
Yamana
Endeavour
0
50x
100x
150x
200x
250x
300x
350x
400x
450x
0 50x 100x 150x 200x 250x 300x 350x 400x
EV/r
eser
ve
EV/resource
Bubble size represents enterprise value (‘EV’) in relation to reserves and resources
10
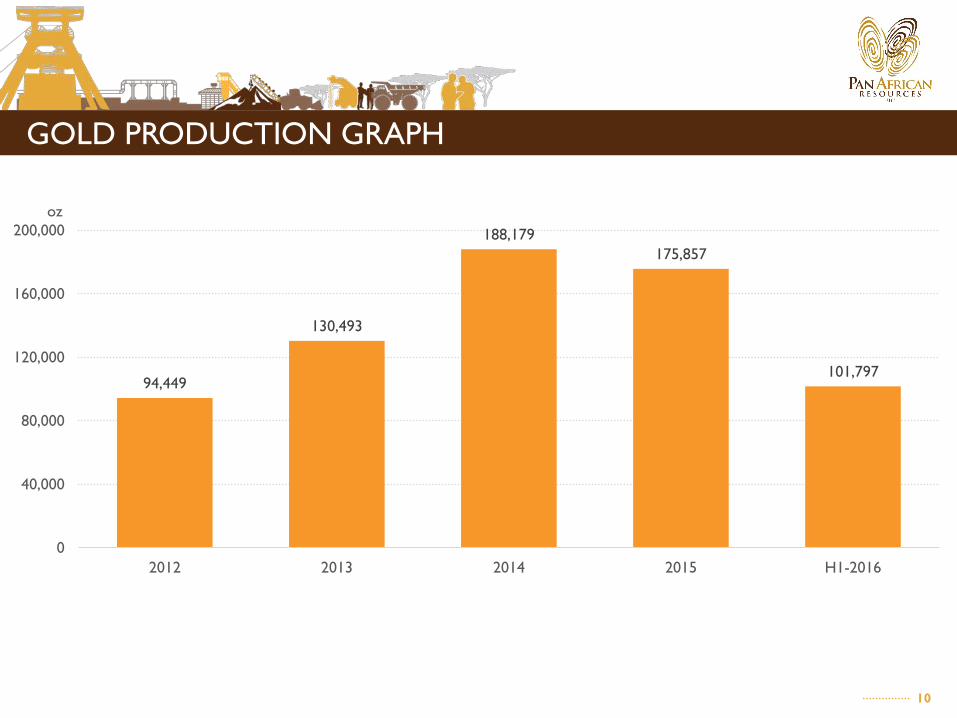
GOLD PRODUCTION GRAPH
94,449
130,493
188,179175,857
101,797
0
40,000
80,000
120,000
160,000
200,000
2012 2013 2014 2015 H1-2016
oz

2016 INTERIMKEY FEATURES

1212
2016 INTERIM KEY FEATURES• Financial highlights:
› Profit increased by 129.4% to ZAR227.6 million (USD16.7 million)› EBITDA increased by 81.6% to ZAR418.7 million (USD30.8 million)› Dividend paid – ZAR210 million (USD13.5 million), historical dividend yield of 4.2%
• Operational highlights:› Group gold sold increased by 17.4% to 101,797oz› Group gold cash cost decreased by 7.9% to ZAR323,730/kg (USD740/oz)› All-in sustaining cost decreased by 3.5% to ZAR396,819/kg (USD908/oz)› ETRP commissioned and produced 3,708oz of gold at 0.3g/t from tailings sources
• Other highlights:› BIOX® recoveries restored to previous recovery levels › Acquisition of Uitkomst Colliery – subject to S11. Immediately cash flow generative
• Safety – regression in accident rates (LTIFR, RIFR)› Measures put in place to address and improve
✔
✔
✔

BARBERTON MINES BACK TO PREVIOUS DEPENDABILITY

1414
OVERVIEW OF BARBERTON MINES• Barberton Mines is located c.370km east of Johannesburg and 47km south-east of Nelspruit, South
Africa
• Barberton Mines comprises of the following assets:› Fairview Mine: Total mining area of 3,034Ha› New Consort Mine: Total mining area of 2,521Ha› Sheba Mine: Total mining area of 1,705 Ha
• Operations include the Barberton Tailings Retreatment Plant (‘BTRP’) which was completed during 2013
• Total production capacity of 115koz per annum
• Barberton Mines and BTRP have LOM of over 20 years and 15 years respectively
• The MRC is one of the richest orebodies in the world
• Potential for MRC to continue at depth

1515
BARBERTON MINES
BARBERTON MINES
• Gold sold increased to 56,447oz (2014: 52,942oz)
• Underground and surface tonnage increased to 139,430t (2014: 126,713t)
• Barberton remains a low cash cost producer at ZAR297,877/kg (2014: ZAR312,502/kg)
• USD cash cost at USD681/oz (2014: USD885/oz)
BARBERTON TAILINGS RETREATMENT PLANT
• Gold production at BTRP increased by 9.6% to 12,830oz (2014: 11,710oz)
• BTRP achieved plant recoveries of 64% (2014: 51%)
• BTRP cash cost very competitive at ZAR160,665/kg (2014: ZAR162,203/kg)
• USD cash cost at USD367/oz (2014: USD459/oz)

16
BARBERTON MINES INTERIM HIGHLIGHTS
FAIRVIEW MINE – 10 HIGHEST GRADE UNDERGROUND GOLD OPERATIONS
Mine Country Major ownerAu grade
g/tOre Reserves,
000’ tonnes*Contained Au,
000’ ozt
Fire Creek United States Klondex Mines 44.1 170 172
MRC South Africa Pan African Resources 32.0 848 871
Macassa (South mine) Canada Kirkland Lake Gold 22.2 1,330 950
Kedrovka Russia Zapadnaya God 22 380 269
Turquoise Ridge United States Barrick Gold 16.9 10,932 5,943
Toguraci Indonesia Newcrest Mining 16 1,000 514
Orcopampa Peru Buenaventura 15.8 630 321
Dvolnoye Russia Kinross Gold 15 2,137 1,028
Pinson United States Atna Resources 13.8 353 157
Midas United States Klondex Mines 12.9 220 92
Pimenton Chile Cerro Grande 11.1 138 49
* Ore reserves are Proven + Probable, except Kedrovka, where A + B categories calculatedhttp://www.mining.com/the-worlds-highest-grade-gold-mines/Source: Mining.com -

17
BARBERTON MINES UNDERGROUND RESOURCE UPDATE
30%
40%
30%
Measured Indicated Inferred
20153.10Moz (9.0Mt @ 10.71g/t)
29%
32%
39%
20142.9Moz (8.9Mt @ 10.00g/t)

18
BARBERTON MINES UNDERGROUND RESERVE UPDATE
29%
71%
Proved Probable
20151.4Moz (4.3Mt @ 10.11g/t)
33%
67%
20141.2Moz (3.9Mt @ 9.31g/t)

19
BARBERTON MINES PRODUCTION
0.0
2.0
4.0
6.0
8.0
10.0
12.0
0
30,000
60,000
90,000
120,000
150,000
180,000
2011 2012 2013 2014 2015
Fairview 60,405 54,986 53,623 48,488 55,421
Sheba 55,650 55,340 53,559 45,386 47,549
Consort 38,559 45,780 42,407 32,839 36,460
Head grade 10.7 9.9 10.4 11.4 10.6
PRODUCTION STATISTICSTonnes
UNDERGROUND AND SURFACE HEAD GRADE (EXCLUDING BTRP) g/t

20
BIOX® RECOVERIES
97 96 92 89 84 91 97 95 96 94 96 96 97 96 96 97 98 98 98 99 98 980
20
40
60
80
100
Mar Apr May Jun Jul Aug Sep Oct Nov Dec Jan Feb Mar Apr May Jun Jul Aug Sep Oct Nov Dec
2014 2015
BIOX® RECOVERIES%
EVANDER MINES MUCH IMPROVED PERFORMANCE

2222
OVERVIEW OF EVANDER MINES• Evander was first developed in 1955 by The Union Corporation and consisted of 8 independent
shafts
• Currently only No. 7 Shaft and No. 8 Shaft are operational, with the rest on care and maintenance
• Located approximately 120km south-east of Johannesburg in Mpumalanga
• Evander’s mineral assets comprise a set of mineral resources that range from prefeasibility studies to a producing mine
• Evander No. 8 Shaft and surface operations are currently generating strong cash flows
• The principal economical horizon mined at Evander Mines is the Kimberley Reef, an offshoot of the Witwatersrand basin
• Total production capacity of 95koz (105koz incl ETRP)
• Evander Mines has a LOM of 17 years
2323
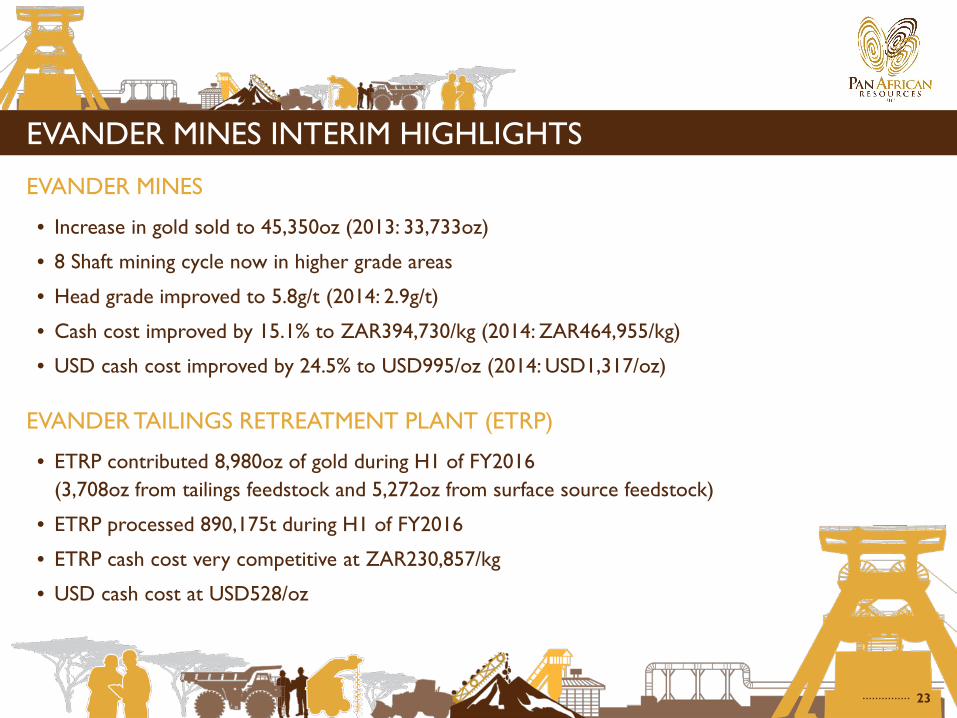
EVANDER MINES INTERIM HIGHLIGHTS
EVANDER MINES
• Increase in gold sold to 45,350oz (2013: 33,733oz)
• 8 Shaft mining cycle now in higher grade areas
• Head grade improved to 5.8g/t (2014: 2.9g/t)
• Cash cost improved by 15.1% to ZAR394,730/kg (2014: ZAR464,955/kg)
• USD cash cost improved by 24.5% to USD995/oz (2014: USD1,317/oz)
EVANDER TAILINGS RETREATMENT PLANT (ETRP)
• ETRP contributed 8,980oz of gold during H1 of FY2016(3,708oz from tailings feedstock and 5,272oz from surface source feedstock)
• ETRP processed 890,175t during H1 of FY2016
• ETRP cash cost very competitive at ZAR230,857/kg
• USD cash cost at USD528/oz

24
EVANDER MINES UNDERGROUND RESOURCE UPDATE
5%
64%
31%
Measured Indicated Inferred
201525.9Moz (83.5Mt @ 9.66g/t)
5%
61%
34%
201427.9Moz (91.3Mt @ 10.00g/t)
25
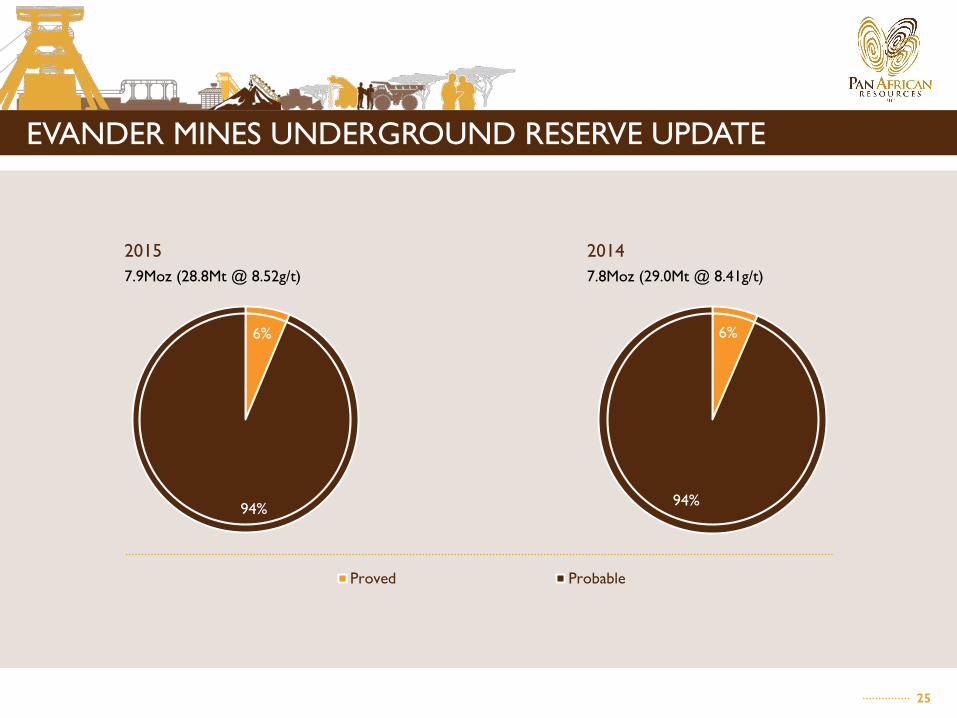
EVANDER MINES UNDERGROUND RESERVE UPDATE
6%
94%
Proved Probable
20157.9Moz (28.8Mt @ 8.52g/t)
6%
94%
20147.8Moz (29.0Mt @ 8.41g/t)

26
0
5
10
15
20
Jan
Feb
Mar
Apr
May Jun Jul
Aug Sep
Oct
Nov
Dec Jan
Feb
Mar
Apr
May Jun Jul
Aug Sep
Oct
Nov
Dec Jan
Feb
Mar
Apr
May Jun Jul
Aug Sep
Oct
Nov
Dec
2013 2014 2015
Head grade Face grade
1. Face grade - the mineralised rock in g/t graded over the face width2. Head grade - the tonnes delivered to the plant in g/t graded over all the tonnage sources delivered, namely mineralised rock from stopes,
waste from stopes (gully tonnes), waste from development ends, and tonnes from on reef development ends
EVANDER UNDERGROUND GRADE PROFILEEVANDER 8 SHAFT PRODUCTION - GRADEg/t

27
EVANDER UNDERGROUND TONNAGE PROFILE
0
10,000
20,000
30,000
40,000
50,000
Jan
Feb
Mar
Apr
May Jun Jul
Aug Sep
Oct
Nov
Dec Jan
Feb
Mar
Apr
May Jun Jul
Aug Sep
Oct
Nov
Dec Jan
Feb
Mar
Apr
May Jun Jul
Aug Sep
Oct
Nov
Dec
2013 2014 2015
EVANDER 8 SHAFT PRODUCTIONTonnes
28
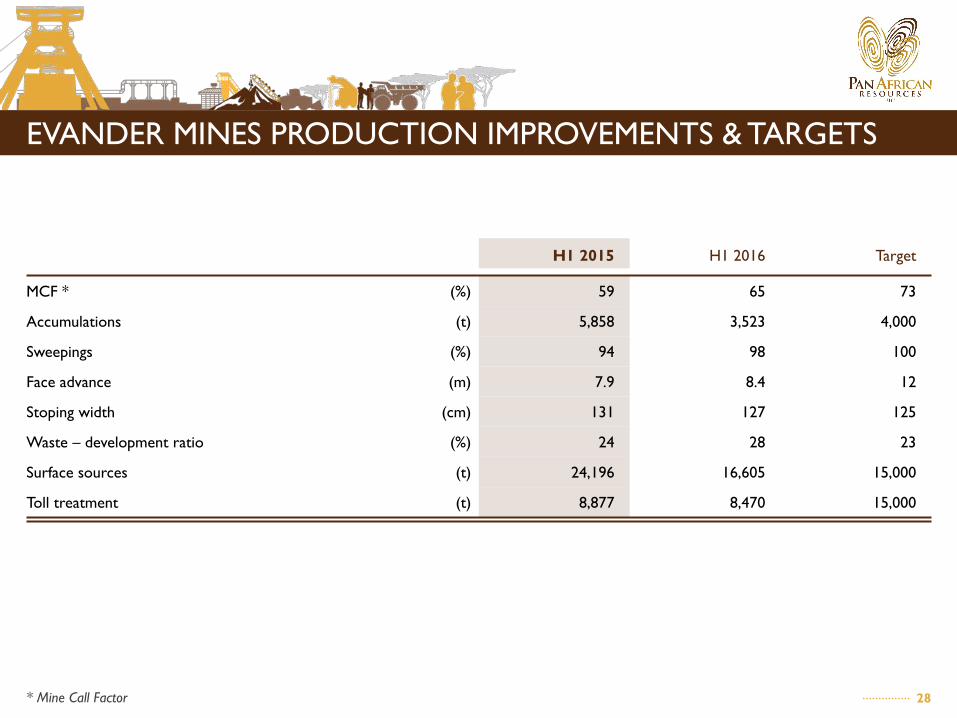
EVANDER MINES PRODUCTION IMPROVEMENTS & TARGETS
H1 2015 H1 2016 Target
MCF * (%) 59 65 73
Accumulations (t) 5,858 3,523 4,000
Sweepings (%) 94 98 100
Face advance (m) 7.9 8.4 12
Stoping width (cm) 131 127 125
Waste – development ratio (%) 24 28 23
Surface sources (t) 24,196 16,605 15,000
Toll treatment (t) 8,877 8,470 15,000
* Mine Call Factor
PHOENIX PLATINUM REMAINS STRATEGIC ENTRY POINT INTO PLATINUM
3030
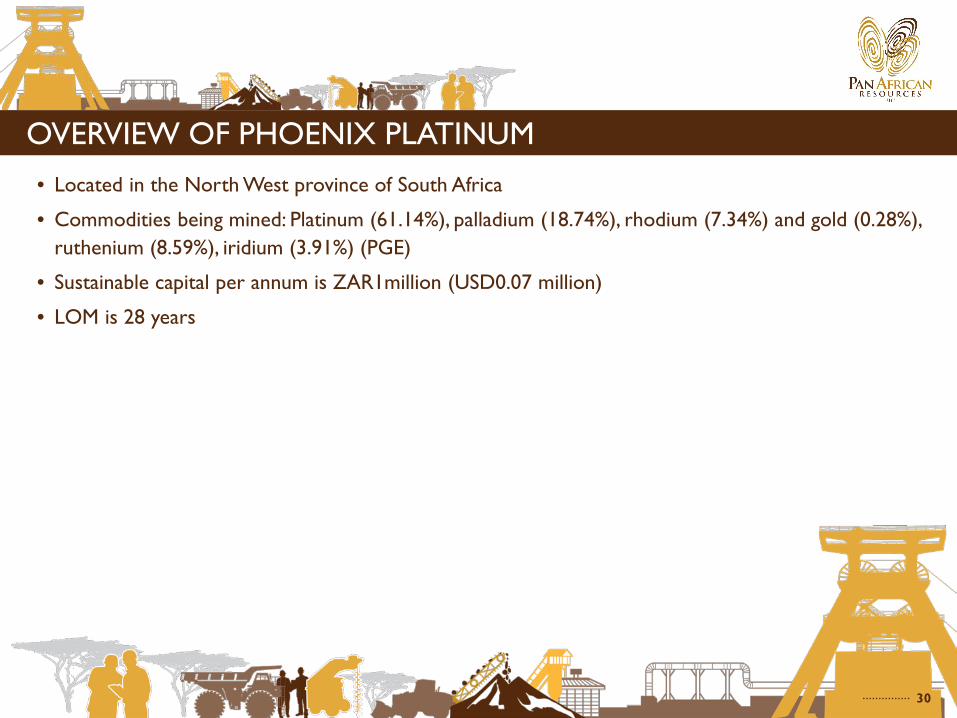
OVERVIEW OF PHOENIX PLATINUM• Located in the North West province of South Africa
• Commodities being mined: Platinum (61.14%), palladium (18.74%), rhodium (7.34%) and gold (0.28%), ruthenium (8.59%), iridium (3.91%) (PGE)
• Sustainable capital per annum is ZAR1million (USD0.07 million)
• LOM is 28 years
3131
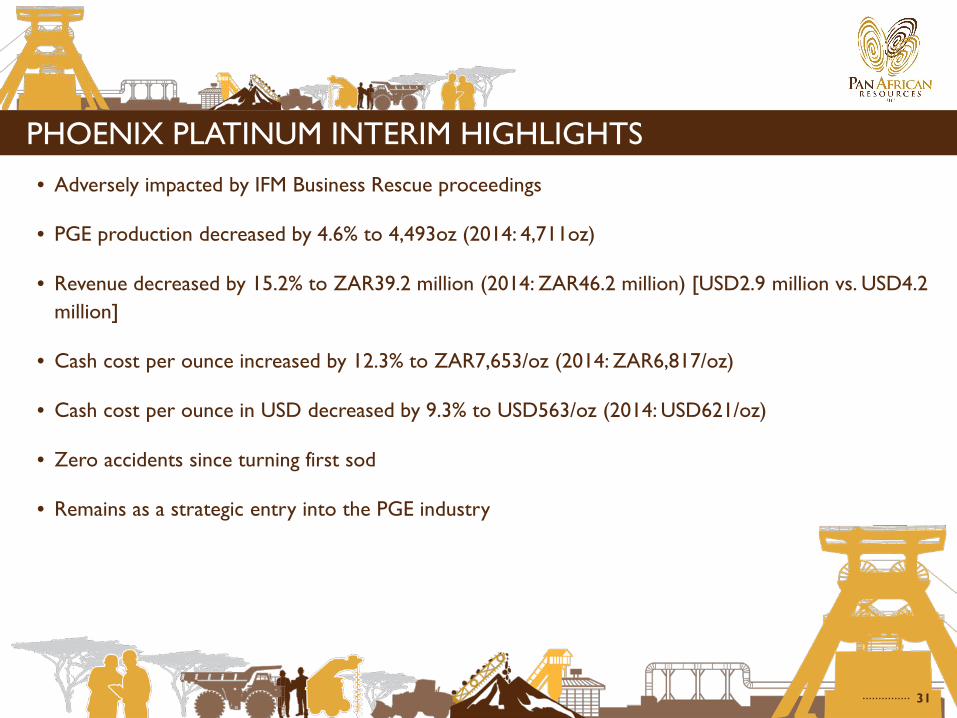
PHOENIX PLATINUM INTERIM HIGHLIGHTS• Adversely impacted by IFM Business Rescue proceedings
• PGE production decreased by 4.6% to 4,493oz (2014: 4,711oz)
• Revenue decreased by 15.2% to ZAR39.2 million (2014: ZAR46.2 million) [USD2.9 million vs. USD4.2 million]
• Cash cost per ounce increased by 12.3% to ZAR7,653/oz (2014: ZAR6,817/oz)
• Cash cost per ounce in USD decreased by 9.3% to USD563/oz (2014: USD621/oz)
• Zero accidents since turning first sod
• Remains as a strategic entry into the PGE industry
WHY PAN AFRICAN RESOURCES?
33
GOLD PRICE
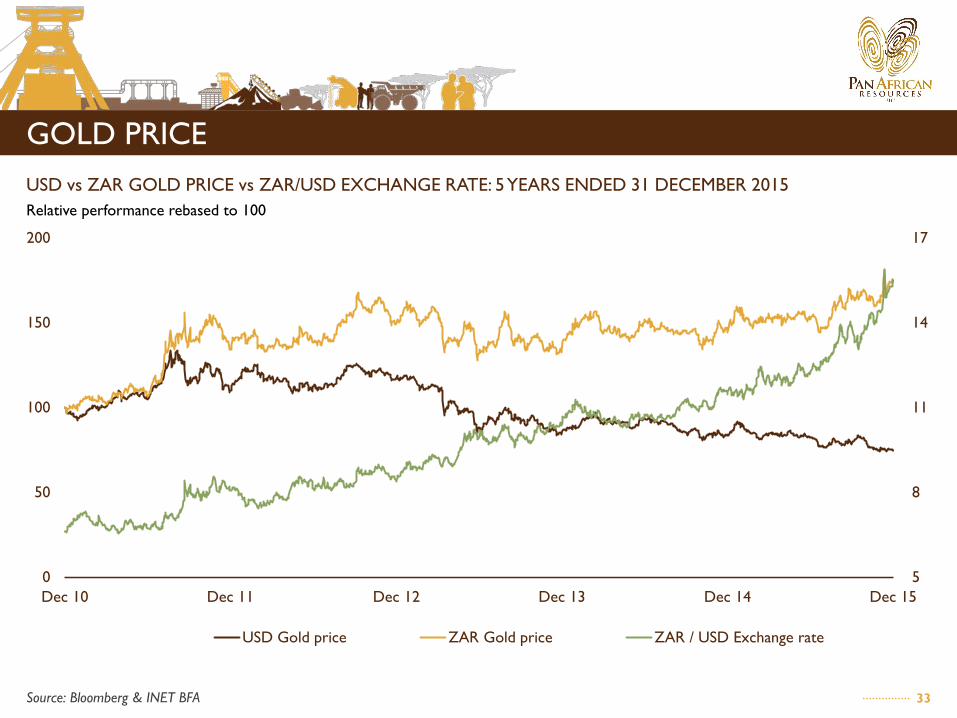
5
8
11
14
17
0
50
100
150
200
Dec 10 Dec 11 Dec 12 Dec 13 Dec 14 Dec 15
USD Gold price ZAR Gold price ZAR / USD Exchange rate
Source: Bloomberg & INET BFA
USD vs ZAR GOLD PRICE vs ZAR/USD EXCHANGE RATE: 5 YEARS ENDED 31 DECEMBER 2015Relative performance rebased to 100
34
GROUP COSTS
0
50
100
150
200
250
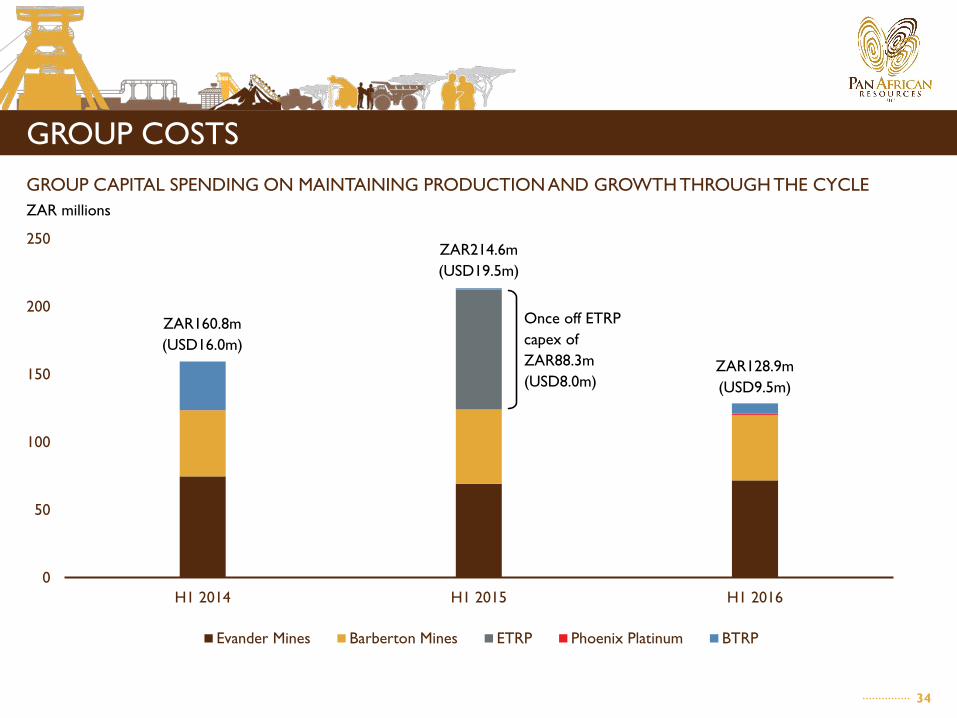
H1 2014 H1 2015 H1 2016
Evander Mines Barberton Mines ETRP Phoenix Platinum BTRP
GROUP CAPITAL SPENDING ON MAINTAINING PRODUCTION AND GROWTH THROUGH THE CYCLE ZAR millions
ZAR160.8m (USD16.0m)
ZAR214.6m (USD19.5m)
ZAR128.9m (USD9.5m)
Once off ETRP capex ofZAR88.3m (USD8.0m)

35
USD16.7m
~USD24.6m
~USD28.9m
10
20
30
40
50
0
200
400
600
Current results @ ZAR485,215/kg Relative earnings @ ZAR550,000/kg Relative earnings @ ZAR600,000/kg
ZAR Earnings USD Earnings
66.9%
113.8%
47.3% 73.1%
ZAR DEPRECIATION
ILLUSTRATIVE EFFECTS OF ZAR DEPRECIATION ON INTERIM EARNINGS
EARNINGSZAR millions
EARNINGSUSD millions
ZAR227.6m
~ZAR379.8m
~ZAR486.5m

36
5
7
9
11
13
15
17
19
0
50
100
150
200
250
300
Feb 11 Feb 12 Feb 13 Feb 14 Feb 15 Feb 16
Pan African Resources FTSE / JSE Gold price index ZAR/USD Exchange rate
PAN SHARE PRICE RELATIVE TO MARKET: 5 YEARS ENDED 17 FEBRUARY 2016Relative performance rebased to 100
SHARE PRICE PERFORMANCE - GOLD
Source: Bloomberg & INET BFA
EXCHANGE RATEZAR/USD

37
DIVIDENDS
* Foregone dividend to fund the acquisition of Evander Gold Mines
0
50
100
150
200
250
300
2011 2012* 2013 2014 2015
ZAR95.6mUSD11.9m
DIVIDEND PAIDZAR/USD millions
ZAR nilUSD nil
ZAR240.3mUSD23.0m
ZAR258mUSD22.3m
ZAR210mUSD13.5m
38
MARKET LEADING DIVIDEND YIELD
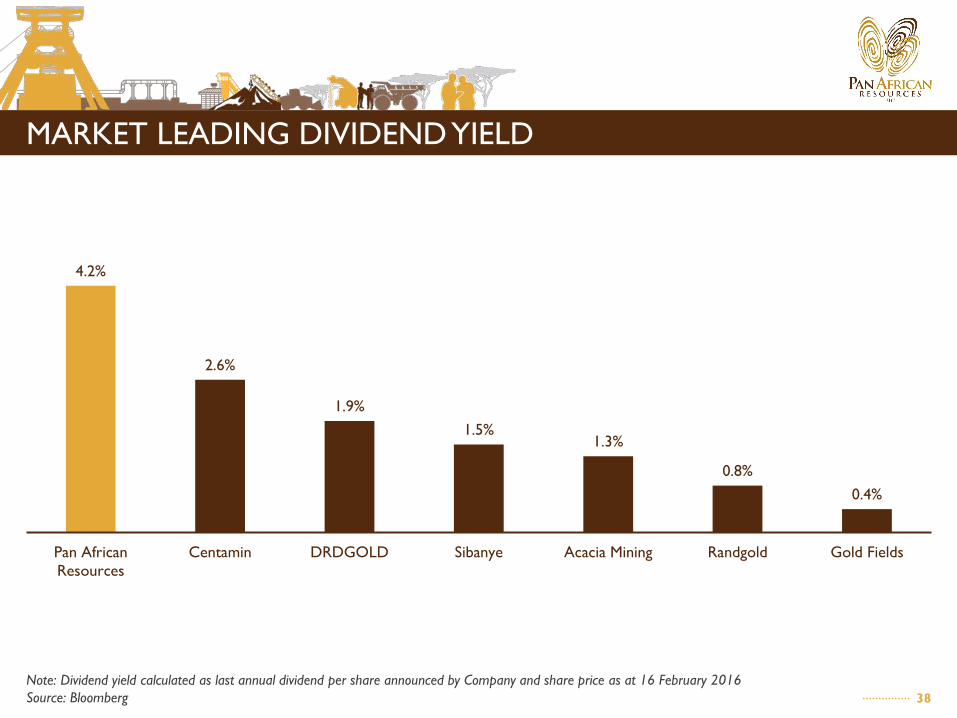
4.2%
2.6%
1.9%1.5%
1.3%
0.8%0.4%
Pan AfricanResources
Centamin DRDGOLD Sibanye Acacia Mining Randgold Gold Fields
Note: Dividend yield calculated as last annual dividend per share announced by Company and share price as at 16 February 2016Source: Bloomberg

39
CONSERVATIVE GEARING / DEBT RATIO
Pan African Resources
Sibanye
Centamin
Acacia MiningDRD Gold
Gold Fields
Randgold
AngloGold
Goldcorp
Newmont
Newcrest
Barrick
Endeavour
0.0
0.1
0.2
0.3
0.4
0.0 0.2 0.4 0.6 0.8 1.0 1.2 1.4
Deb
t ra
tio
Gearing ratio
Note (1): Gearing is total debt / shareholder equity as per latest company disclosureNote (2): Debt ratio is total debt / total assets as per latest company disclosureNote (3): As publicly reported by each company
CONSERVATIVE GEARING / DEBT RATIO1,2,3

40
DISCIPLINED CAPITAL ALLOCATION DECISIONS
ProjectInvestment capital/
purchase price (ZARm) Forecasted payback period
Phoenix CTRP 308.9* Forecasting 10 years payback on current PGM basket prices
BTRP 325.7 Paid back in 18 months
ETRP 174.3 Forecasting less than 4 years payback
Uitkomst Colliery 200.0 Forecasting 4 years payback
* Recorded ZAR125 million impairment for Phoenix during FY2013

41
PREMIUM TO NET ASSET VALUE PER SHARE
113%
36%
23%
16%
90%
0%
20%
40%
60%
80%
100%
120%
0
1,000
2,000
3,000
4,000
5,000
6,000
7,000
8,000
2012 2013 2014 2015 19 Feb 2016*Market Capitalisation Net Asset Value Premium to NAV per share
* For Illustrative purposes we kept the Net Asset Value at 19 February 2016 the same as at 31 December 2015.
ZA
R m
illio
n

42
RESOURCE AND RESERVE VALUATION COMPARABLES
Note: Contained attributable gold production, proven and probable reserves and measured, indicated and inferred resources as publicly reported by each companySource: Company reports, FactSet
Acacia
AngloGold
Barrick Gold
Beadell
Centamin
Evolution
Goldcorp
Harmony
Kinross
Newcrest
Newmont
Pan African
RandgoldRegis
Yamana
Endeavour
0
50x
100x
150x
200x
250x
300x
350x
400x
450x
0 50x 100x 150x 200x 250x 300x 350x 400x
EV/r
eser
ve
EV/resource
Bubble size represents enterprise value (‘EV’) in relation to reserves and resources

43
STANDARD BANK TRANSACTION
STANDARD BANK TRANSACTION – STRUCTURE AFTER DEAL
MabinduDevelopment
Trust
CIC(Jadeite)
New PAR Investment
Shanduka Gold
PAR
49.5% 33.6% 16.9%
23.83%
44
OTHER ASSETS
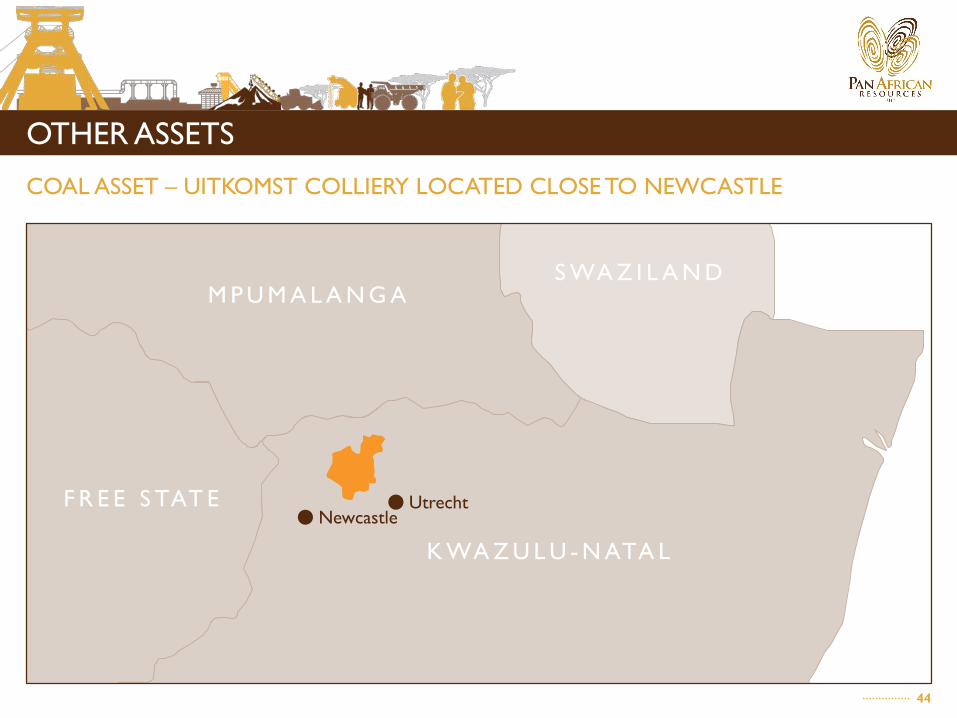
COAL ASSET – UITKOMST COLLIERY LOCATED CLOSE TO NEWCASTLE
M P U M A L A N G A
F R E E S TAT E
K WA Z U L U - N ATA L
S WA Z I L A N D
NewcastleUtrecht

4545
OTHER ASSETS
COAL ASSET – UITKOMST COLLIERY
• Average run-of-mine coal mined per month : 50,000 tonnes
• Average saleable coal produced per month : 34,000 tonnes
• Number of plant employees : 110
• Number of contractors : 300
• Approximate sustaining capital per year : ZAR10m (USD0.6m)
• Approximate profit and cash flow after tax per year : ZAR30-35m (USD1.9m-USD2.3m)
• Current cash available : ZAR25 million (USD1.6m)
• Coal price API4 per tonne: : USD52
• Exchange rate ZAR/USD : ZAR15.50
• Coal API4 ZAR price per tonne : ZAR806
• Life of mine : 28 years
46
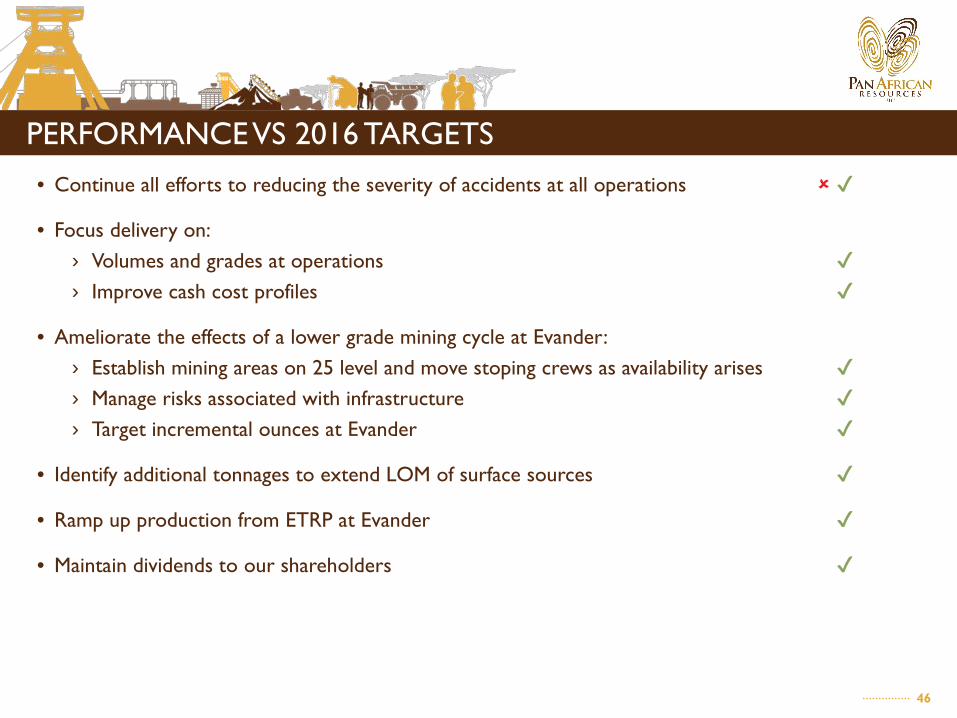
PERFORMANCE VS 2016 TARGETS• Continue all efforts to reducing the severity of accidents at all operations ✔
• Focus delivery on:› Volumes and grades at operations ✔› Improve cash cost profiles ✔
• Ameliorate the effects of a lower grade mining cycle at Evander:› Establish mining areas on 25 level and move stoping crews as availability arises ✔› Manage risks associated with infrastructure ✔› Target incremental ounces at Evander ✔
• Identify additional tonnages to extend LOM of surface sources ✔
• Ramp up production from ETRP at Evander ✔
• Maintain dividends to our shareholders ✔

THANK YOU