Embed Size (px)
Citation preview
Palo Verde Nuclear Generating StationPalo Verde Nuclear Generating Station
Mark FallonSection Leader, Palo Verde Communications
Mark FallonSection Leader, Palo Verde Communications
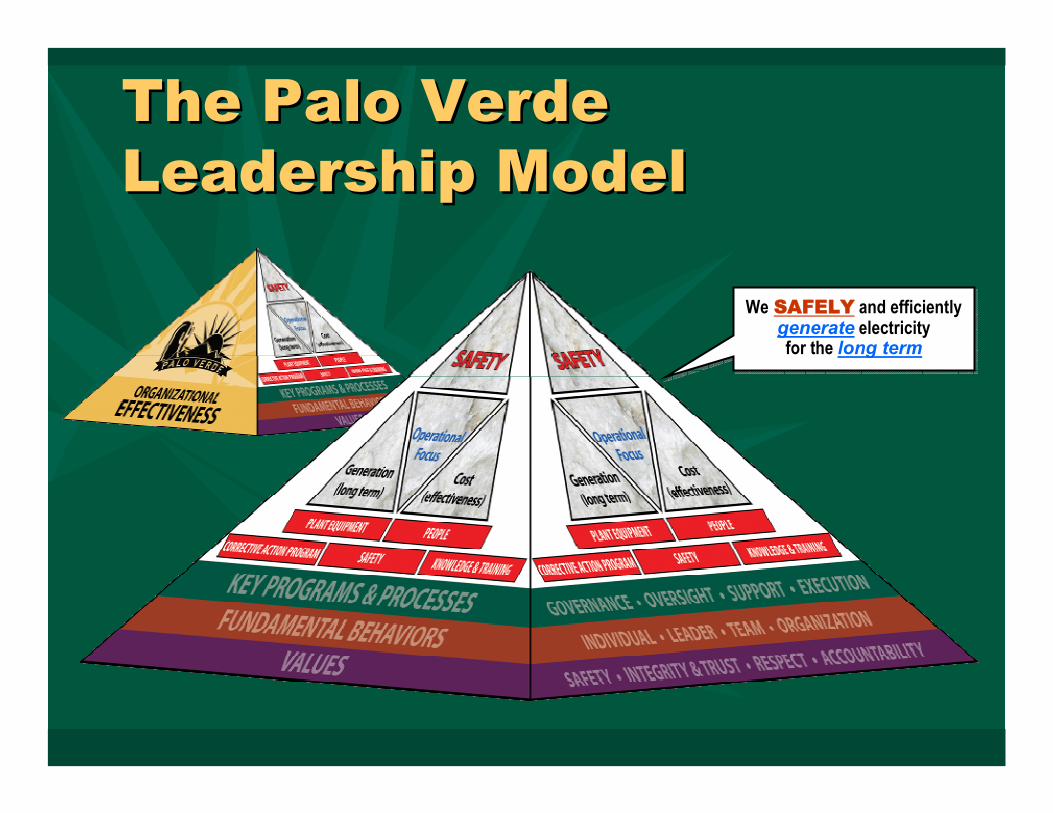
The Palo Verde Leadership ModelThe Palo Verde Leadership Model
We SAFELY and efficientlygenerate electricityfor the long term

U.S. Industrial Safety Accident RateU.S. Industrial Safety Accident Rate
0.12
2.20
3.30
Nuclear Power Plants Utilities Manufacturing
Sources: Nuclear (World Association of Nuclear Operators), 2006 Data for Electric Utilities and Manufacturing (U.S. Bureau of Labor Statistics)
ISAR = Number of accidents resulting in lost work, restricted work, or fatalities per 200,000 worker hours. Electric utilities and manufacturing do not include fatality data.
76.1872.89
56.4253.76
42.0441.71
39.3539.22
37.1535.62
32.9232.45
29.7328.29
24.9319.66
18.2717.54
16.8614.8
13.456.18
5.254.043.8
3.122.152.031.91
47.4
0 10 20 30 40 50 60 70 80
FranceLithuaniaSlovakiaBelguimUkraineSwedenSloveniaArmenia
SwitzerlandHungary
Korea RPBulgaria
Czech RPFinland
GermanyJapan
UNITED STATESSpain
RomaniaRussia
CanadaUnited Kingdom
ArgentinaSouth Africa
MexicoNetherlands
BrazilChinaIndia
Pakistan
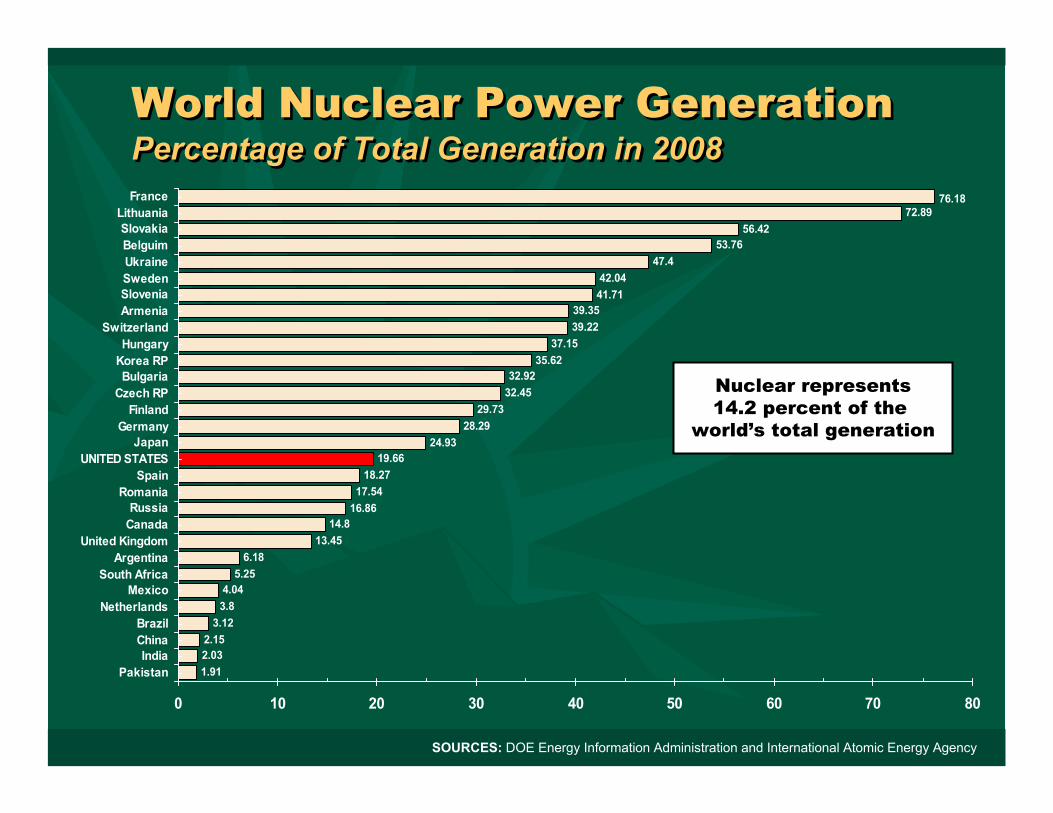
World Nuclear Power Generation Percentage of Total Generation in 2008World Nuclear Power Generation Percentage of Total Generation in 2008
SOURCES: DOE Energy Information Administration and International Atomic Energy Agency
Nuclear represents14.2 percent of the
world’s total generation
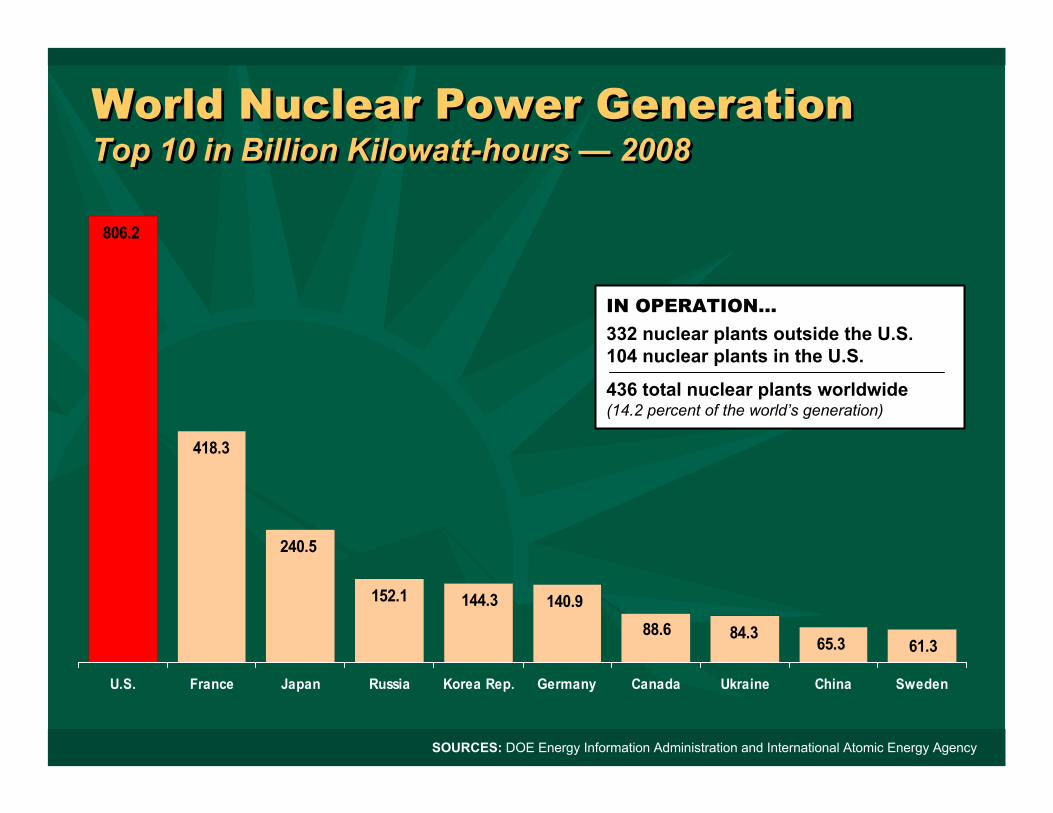
World Nuclear Power GenerationTop 10 in Billion Kilowatt-hours — 2008World Nuclear Power GenerationTop 10 in Billion Kilowatt-hours — 2008
806.2
418.3
240.5
152.1 144.3 140.988.6 84.3 65.3 61.3
U.S. France Japan Russia Korea Rep. Germany Canada Ukraine China Sweden
SOURCES: DOE Energy Information Administration and International Atomic Energy Agency
IN OPERATION…332 nuclear plants outside the U.S.104 nuclear plants in the U.S.
436 total nuclear plants worldwide(14.2 percent of the world’s generation)
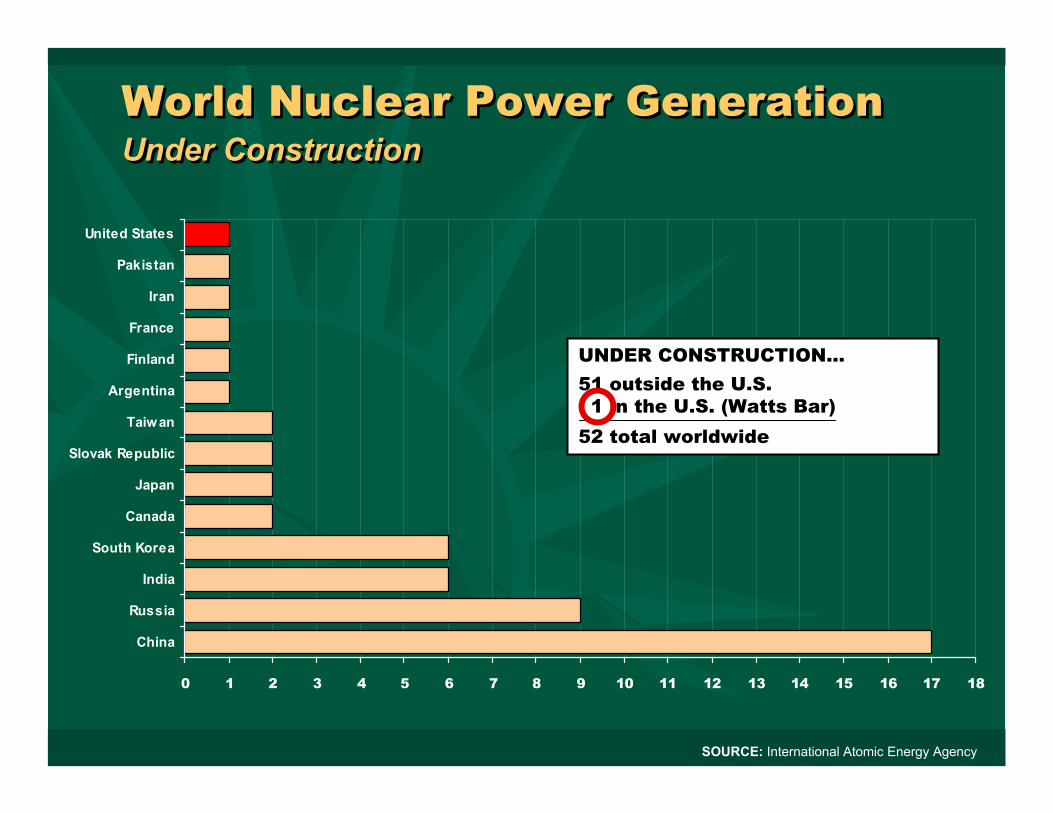
0 1 2 3 4 5 6 7 8 9 10 11 12 13 14 15 16 17 18
China
Russia
India
South Korea
Canada
Japan
Slovak Republic
Taiwan
Argentina
Finland
France
Iran
Pakistan
United States
UNDER CONSTRUCTION…51 outside the U.S.1 in the U.S. (Watts Bar)
52 total worldwide
SOURCE: International Atomic Energy Agency
World Nuclear Power GenerationUnder ConstructionWorld Nuclear Power GenerationUnder Construction

World Nuclear Power GenerationProposed by 2030World Nuclear Power GenerationProposed by 2030
0 10 20 30 40 50 60 70 80 90 100
ChinaRussia
South AfricaUkraine
USAIndiaUAEItaly
VietnamTaiwanPolandBrazil
IndonesiaThailand
United KingdomCanada
SwitzerlandBangladesh
BelarusCzech Rep
HungaryKazakhstan
LithuaniaM exico
PakistanArgent ina
ArmeniaEgypt
FinlandFrance
IranIsraelJapan
RomaniaSlovakiaSlovenia
Turkey
SOURCES: Nuclear Energy Institute, World Nuclear Association
295 expected worldwide by 2030 19 in the U.S.
303,405 total megawatts
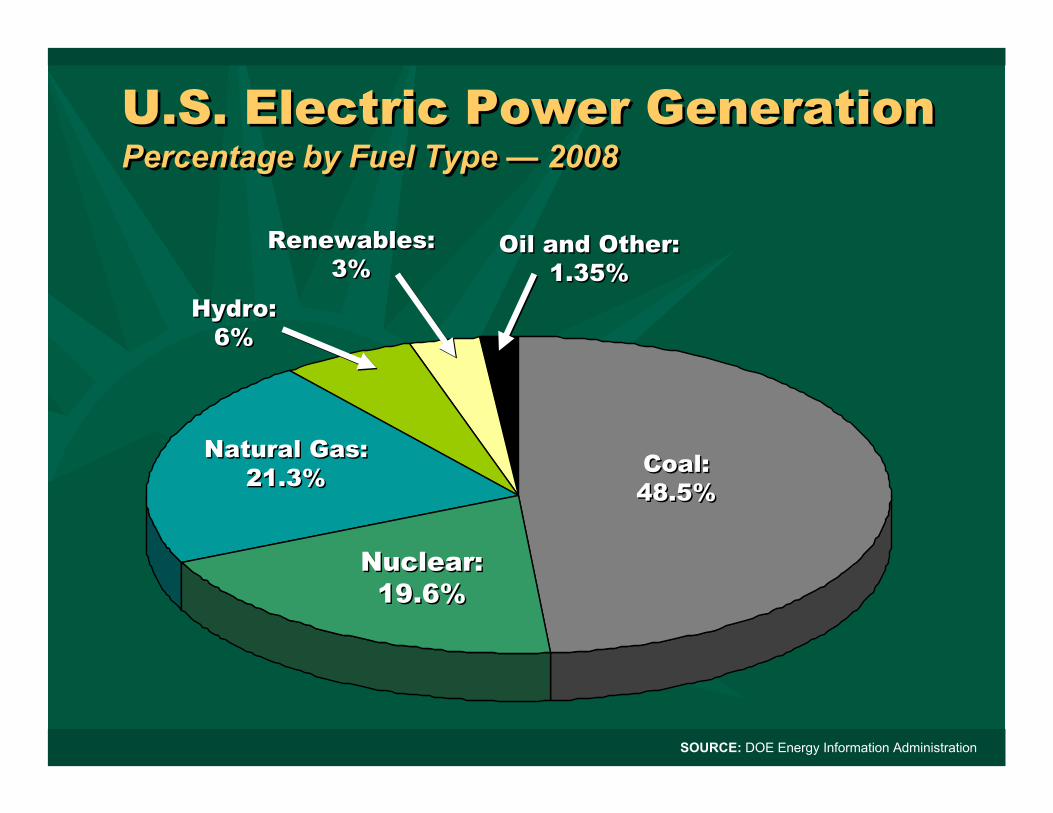
U.S. Electric Power GenerationPercentage by Fuel Type — 2008U.S. Electric Power GenerationPercentage by Fuel Type — 2008
Coal: 48.5%Coal: 48.5%
Nuclear: 19.6%
Nuclear: 19.6%
Renewables:3%
Renewables:3%
Oil and Other:1.35%
Oil and Other:1.35%
Natural Gas: 21.3%
Natural Gas: 21.3%
Hydro: 6%
Hydro: 6%
SOURCE: DOE Energy Information Administration
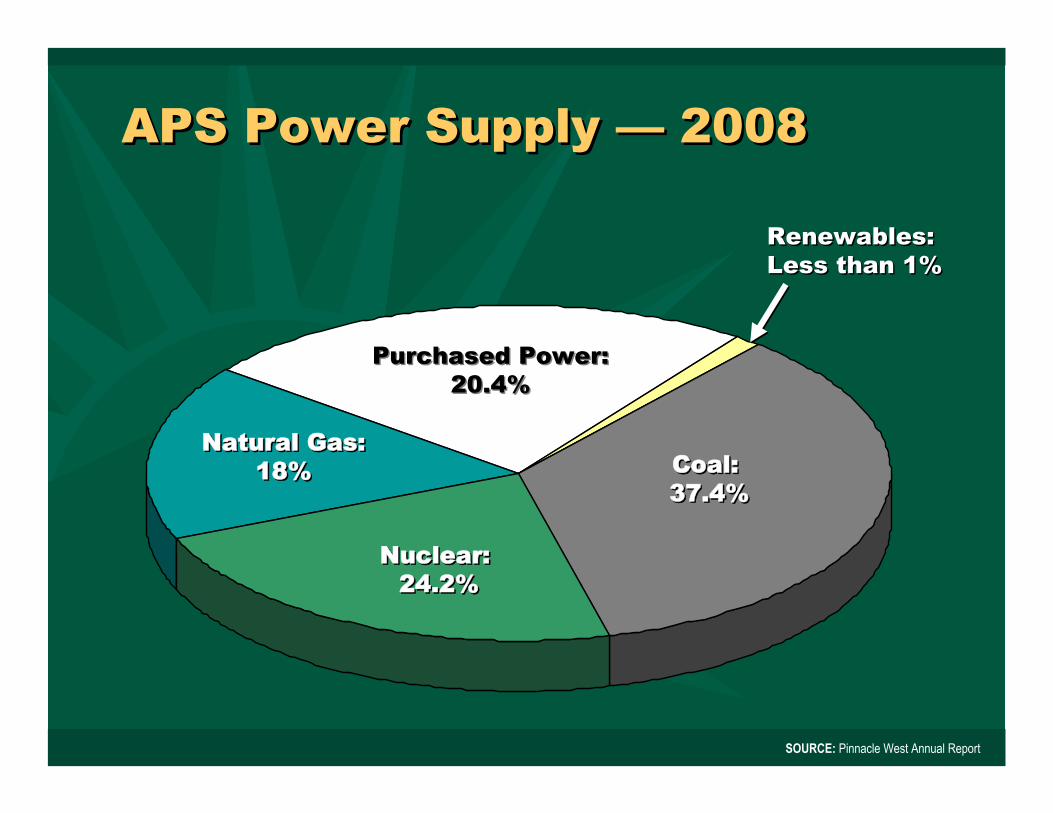
APS Power Supply — 2008APS Power Supply — 2008
Coal:37.4%Coal:37.4%
Nuclear:24.2%
Nuclear:24.2%
Renewables:Less than 1%Renewables:Less than 1%
Natural Gas:18%
Natural Gas:18%
Purchased Power:20.4%
Purchased Power:20.4%
SOURCE: Pinnacle West Annual Report
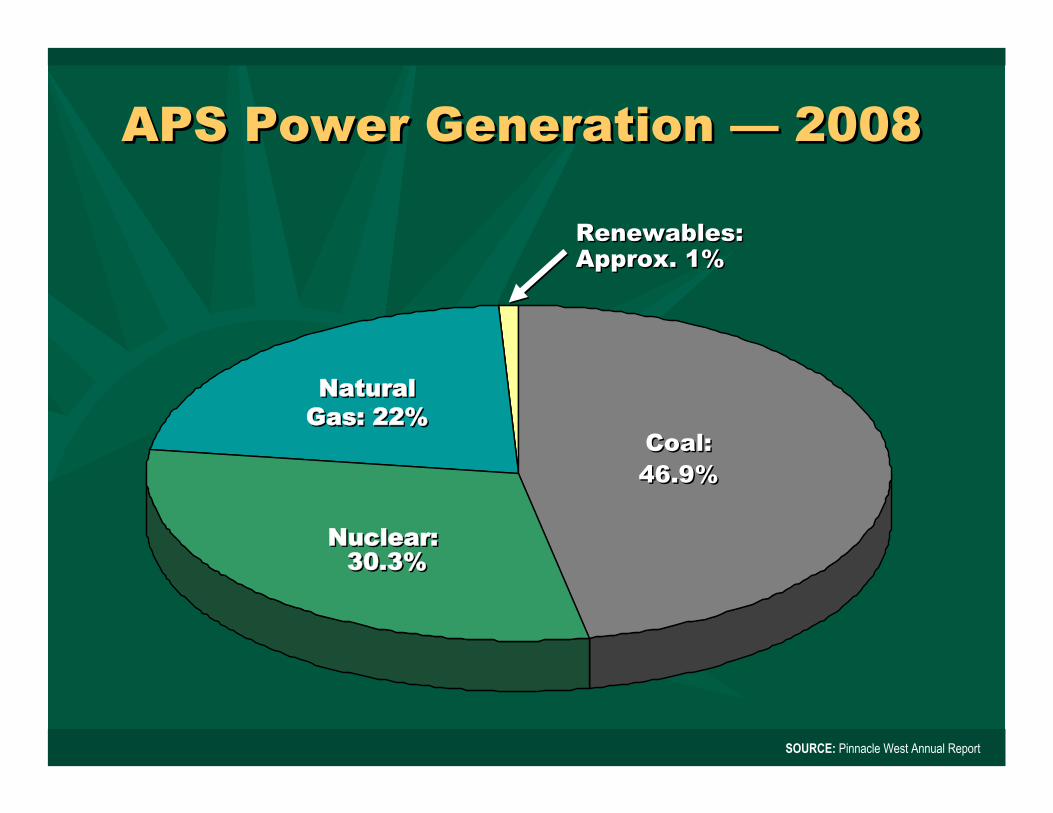
APS Power Generation — 2008APS Power Generation — 2008
Coal:46.9%Coal:46.9%
Nuclear:30.3%
Nuclear:30.3%
Renewables:Approx. 1%Renewables:Approx. 1%
Natural Gas: 22%Natural
Gas: 22%
SOURCE: Pinnacle West Annual Report
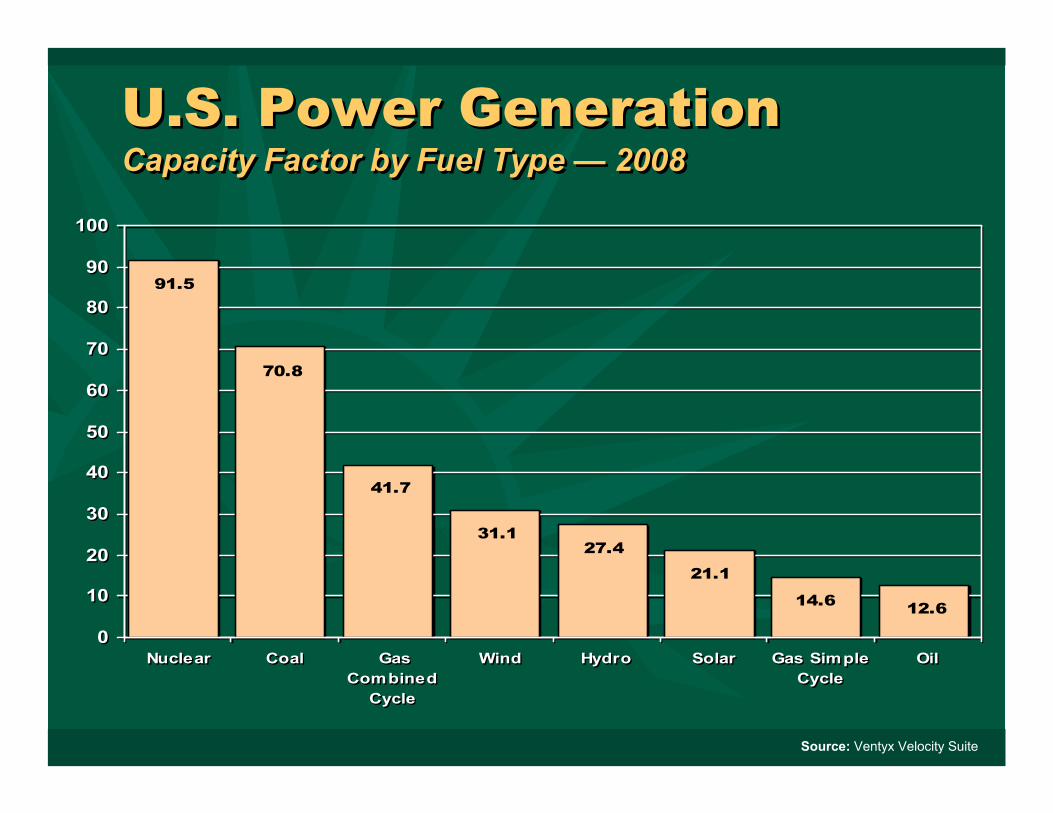
U.S. Power GenerationCapacity Factor by Fuel Type — 2008U.S. Power GenerationCapacity Factor by Fuel Type — 2008
12.614.6
21.127.4
31.1
41.7
70.8
91.5
0
10
20
30
40
50
60
70
80
90
100
Nuclear Coal GasCombined
Cycle
Wind Hydro Solar Gas SimpleCycle
Oil
12.614.6
21.127.4
31.1
41.7
70.8
91.5
0
10
20
30
40
50
60
70
80
90
100
Nuclear Coal GasCombined
Cycle
Wind Hydro Solar Gas SimpleCycle
Oil
Source: Ventyx Velocity Suite
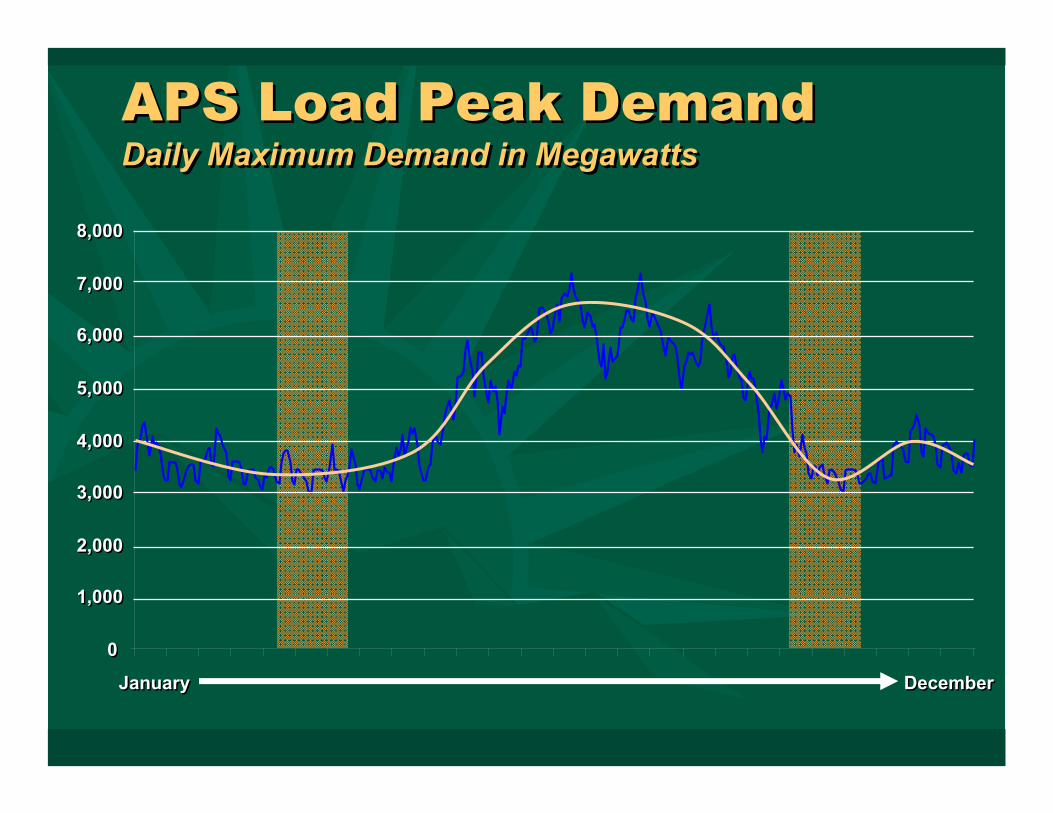
APS Load Peak DemandDaily Maximum Demand in MegawattsAPS Load Peak DemandDaily Maximum Demand in Megawatts
00
1,0001,000
2,0002,000
3,0003,000
4,0004,000
5,0005,000
6,0006,000
7,0007,000
8,0008,000
JanuaryJanuary DecemberDecember
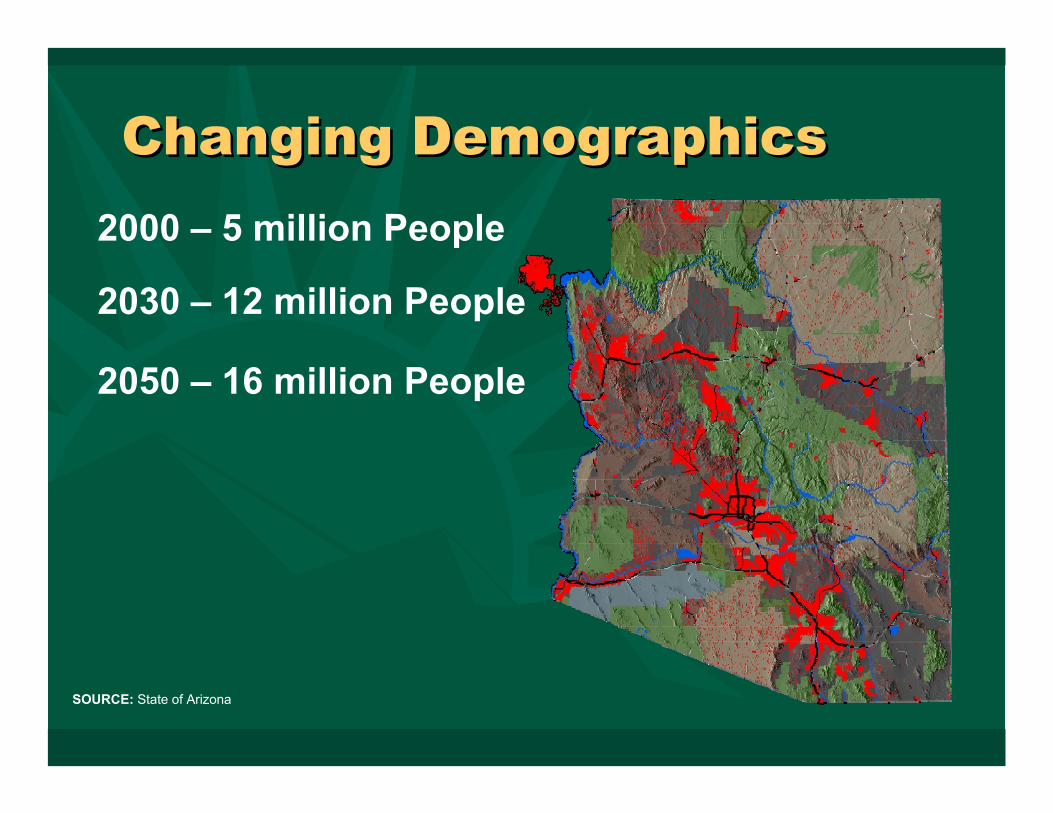
Changing DemographicsChanging Demographics2000 – 5 million People
2030 – 12 million People
2050 – 16 million People
SOURCE: State of Arizona
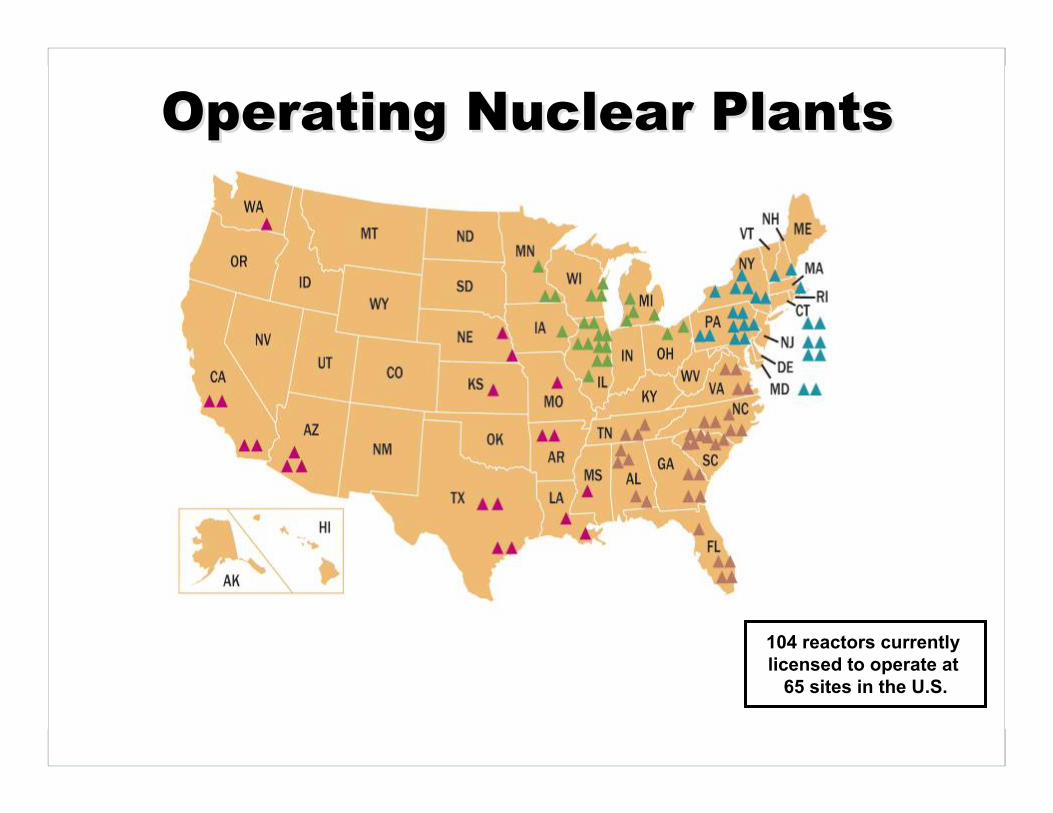
Operating Nuclear PlantsOperating Nuclear Plants
104 reactors currently licensed to operate at
65 sites in the U.S.
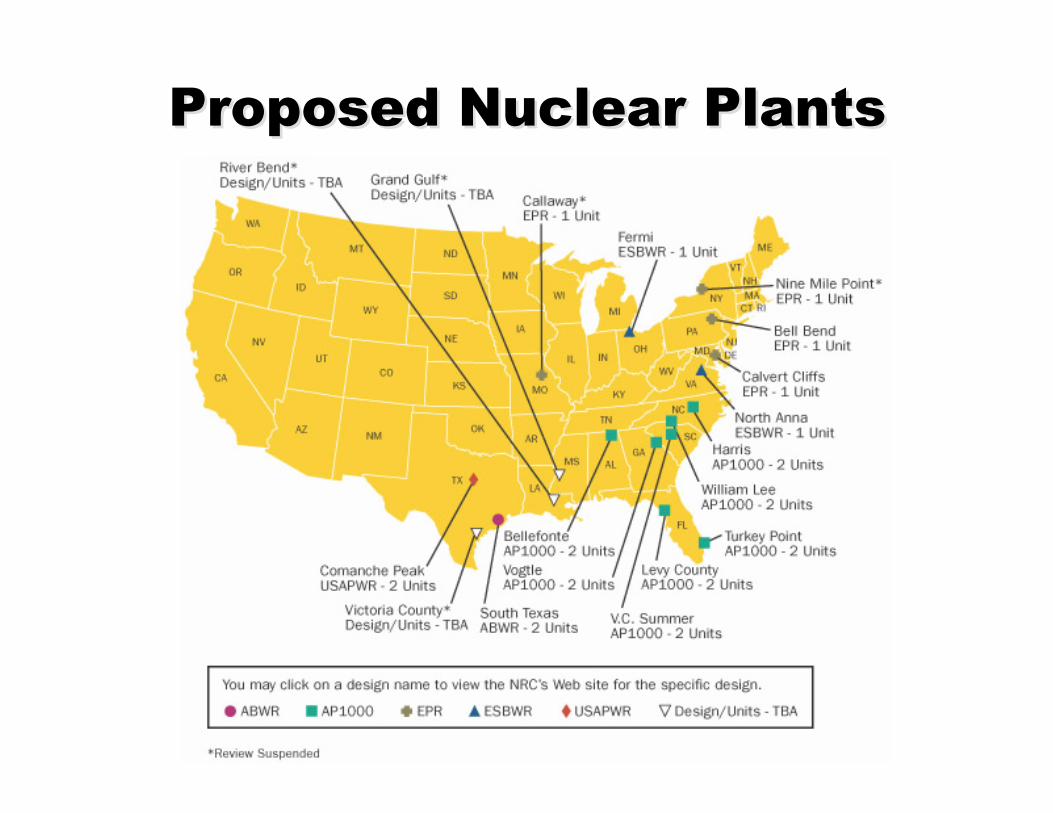
Proposed Nuclear PlantsProposed Nuclear Plants
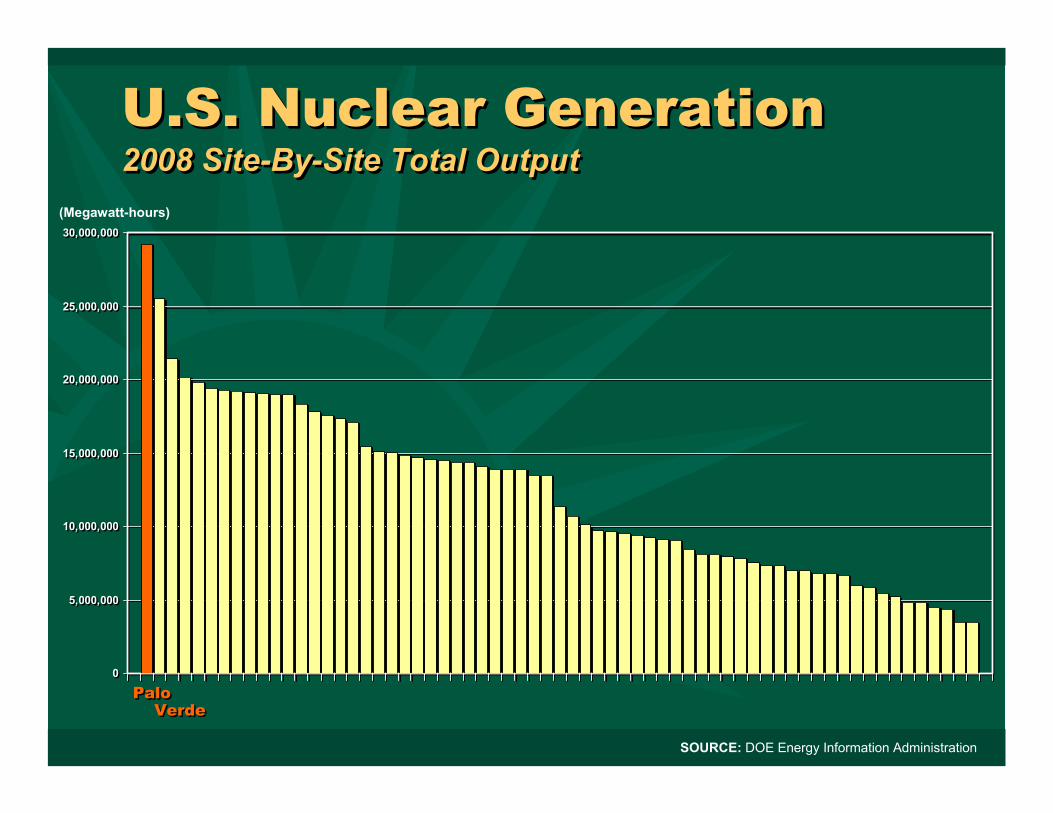
U.S. Nuclear Generation2008 Site-By-Site Total OutputU.S. Nuclear Generation2008 Site-By-Site Total Output
0
5,000,000
10,000,000
15,000,000
20,000,000
25,000,000
30,000,000
0
5,000,000
10,000,000
15,000,000
20,000,000
25,000,000
30,000,000
Palo Verde
Palo Verde
(Megawatt-hours)
SOURCE: DOE Energy Information Administration
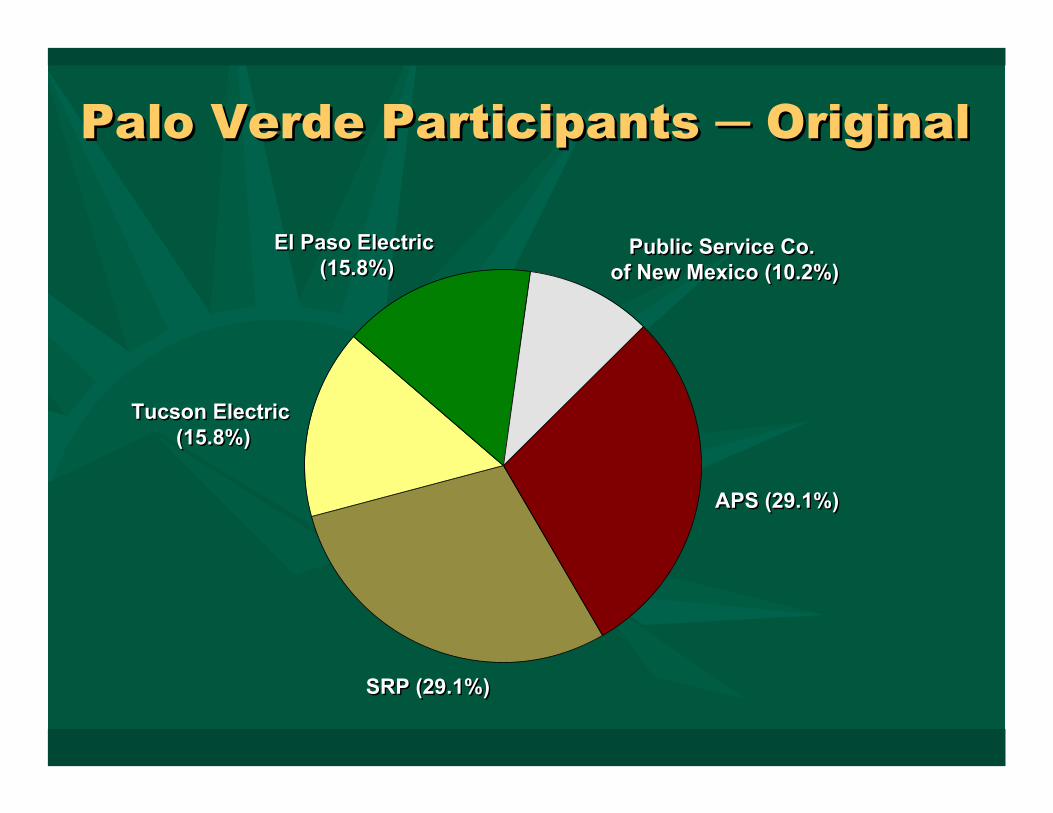
Palo Verde Participants ─ OriginalPalo Verde Participants ─ Original
APS (29.1%)APS (29.1%)
SRP (29.1%)SRP (29.1%)
Tucson Electric (15.8%)
Tucson Electric (15.8%)
El Paso Electric (15.8%)
El Paso Electric (15.8%)
Public Service Co. of New Mexico (10.2%)
Public Service Co. of New Mexico (10.2%)
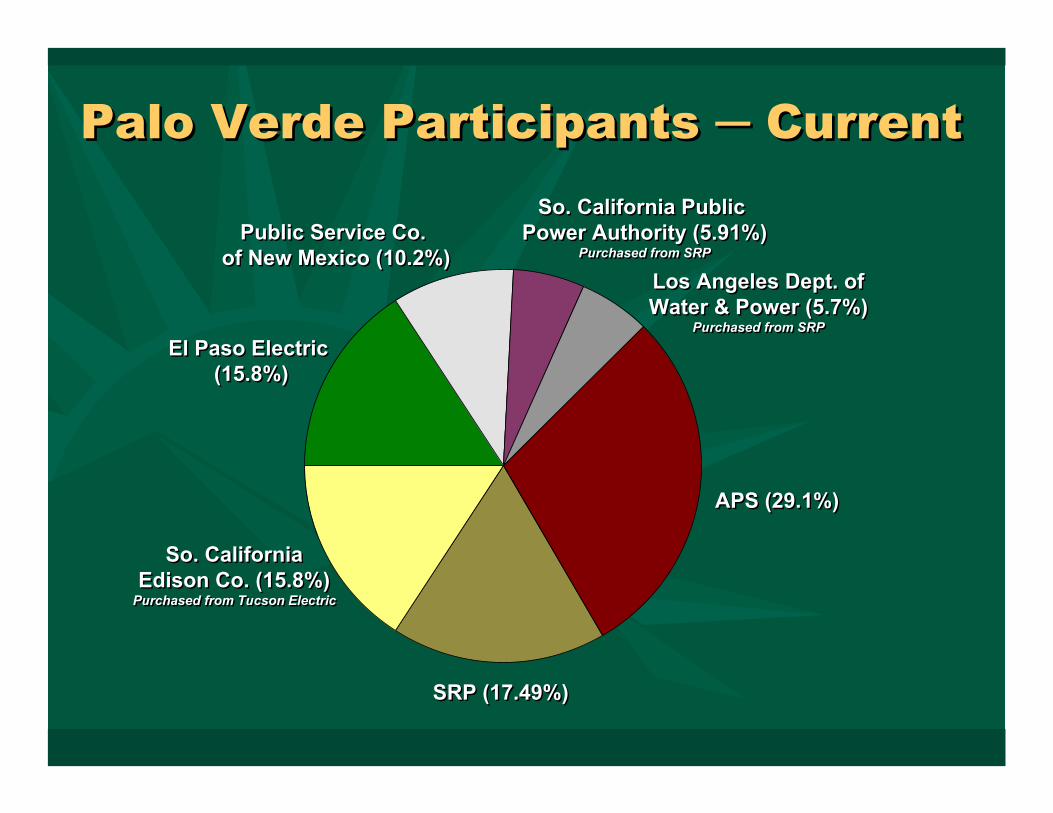
APS (29.1%)APS (29.1%)
SRP (17.49%)SRP (17.49%)
So. CaliforniaEdison Co. (15.8%)
Purchased from Tucson Electric
So. CaliforniaEdison Co. (15.8%)
Purchased from Tucson Electric
El Paso Electric (15.8%)
El Paso Electric (15.8%)
Public Service Co. of New Mexico (10.2%)
Public Service Co. of New Mexico (10.2%)
So. California Public Power Authority (5.91%)
Purchased from SRP
So. California Public Power Authority (5.91%)
Purchased from SRP
Los Angeles Dept. ofWater & Power (5.7%)
Purchased from SRP
Los Angeles Dept. ofWater & Power (5.7%)
Purchased from SRP
Palo Verde Participants ─ CurrentPalo Verde Participants ─ Current
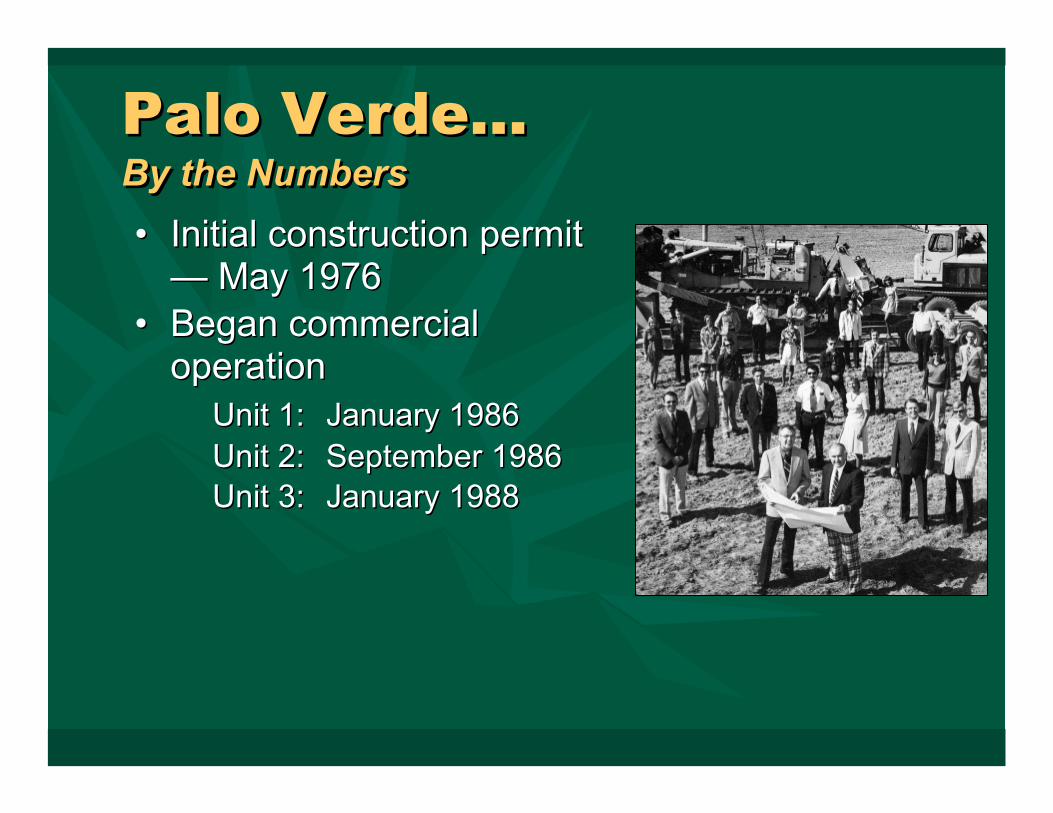
Palo Verde…By the NumbersPalo Verde…By the Numbers• Initial construction permit
— May 1976• Began commercial
operationUnit 1: January 1986Unit 2: September 1986Unit 3: January 1988
• Initial construction permit — May 1976
• Began commercial operation
Unit 1: January 1986Unit 2: September 1986Unit 3: January 1988
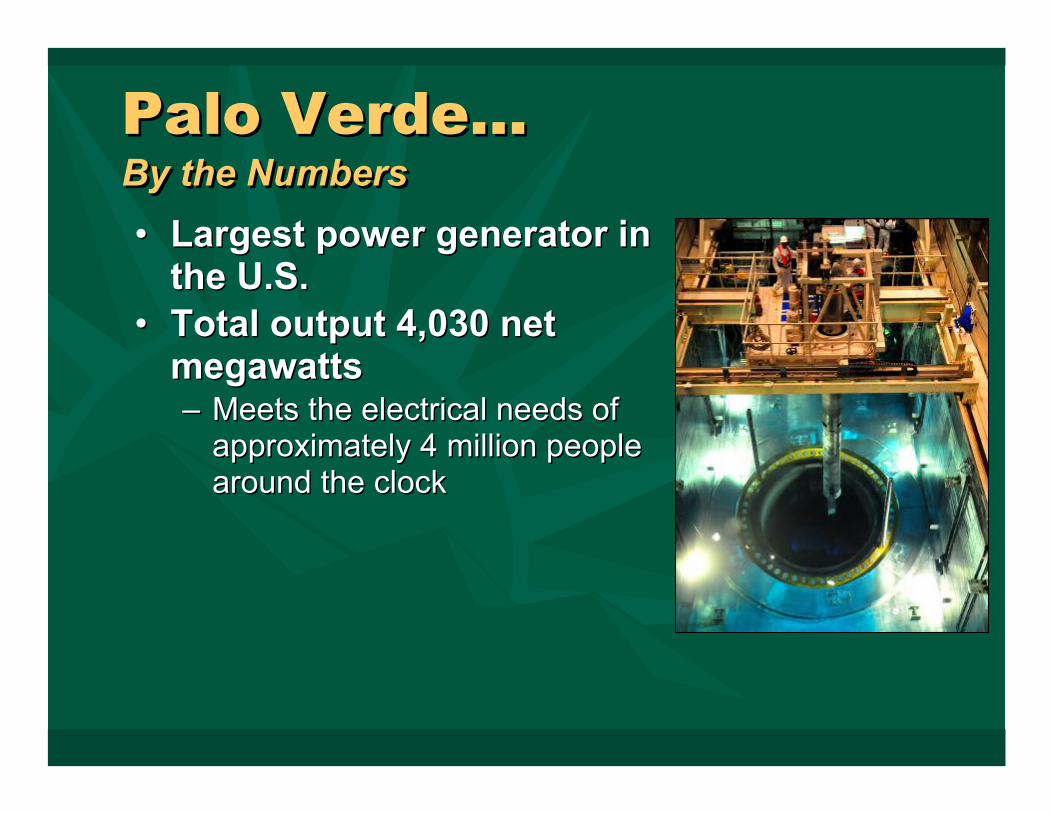
Palo Verde…By the NumbersPalo Verde…By the Numbers• Largest power generator in
the U.S.• Total output 4,030 net
megawatts– Meets the electrical needs of
approximately 4 million people around the clock
• Largest power generator in the U.S.
• Total output 4,030 net megawatts– Meets the electrical needs of
approximately 4 million people around the clock
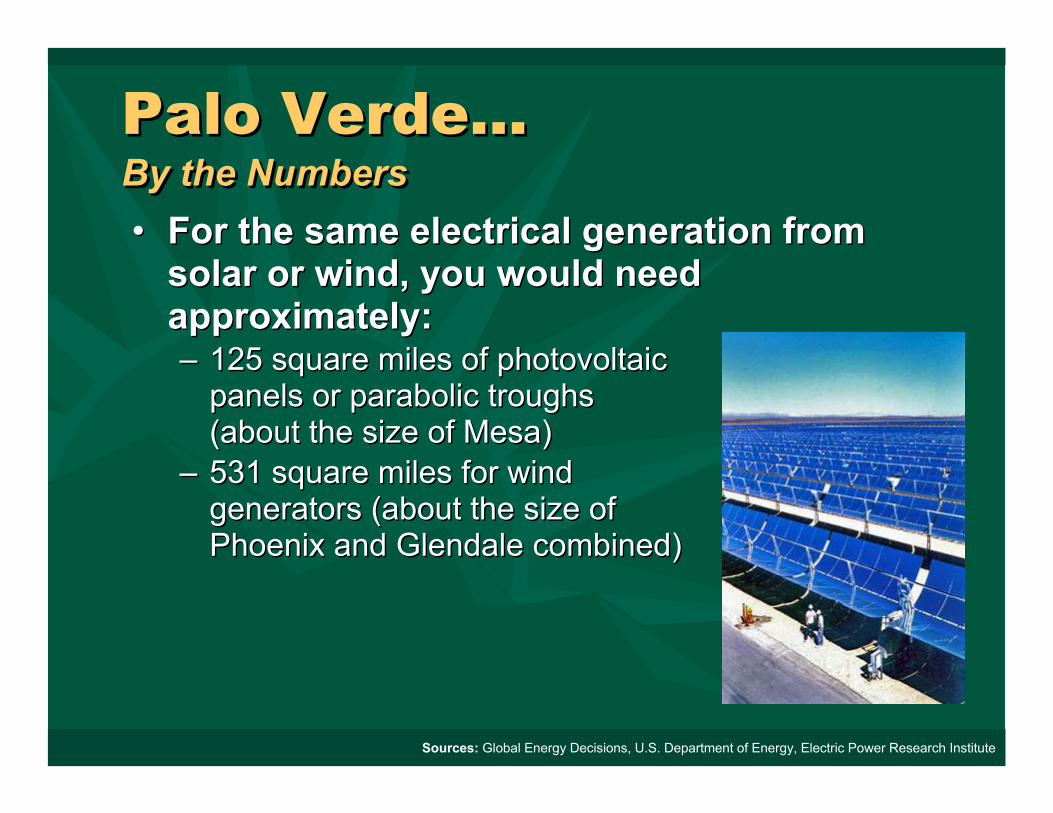
• For the same electrical generation from solar or wind, you would need approximately:– 125 square miles of photovoltaic
panels or parabolic troughs (about the size of Mesa)
– 531 square miles for wind generators (about the size of Phoenix and Glendale combined)
• For the same electrical generation from solar or wind, you would need approximately:– 125 square miles of photovoltaic
panels or parabolic troughs (about the size of Mesa)
– 531 square miles for wind generators (about the size of Phoenix and Glendale combined)
Sources: Global Energy Decisions, U.S. Department of Energy, Electric Power Research Institute
Palo Verde…By the NumbersPalo Verde…By the Numbers
0.0
2.0
4.0
6.0
8.0
10.0
12.0
14.0
16.0
18.0
1995 1996 1997 1998 1999 2000 2001 2002 2003 2004 2005 2006 2007 2008
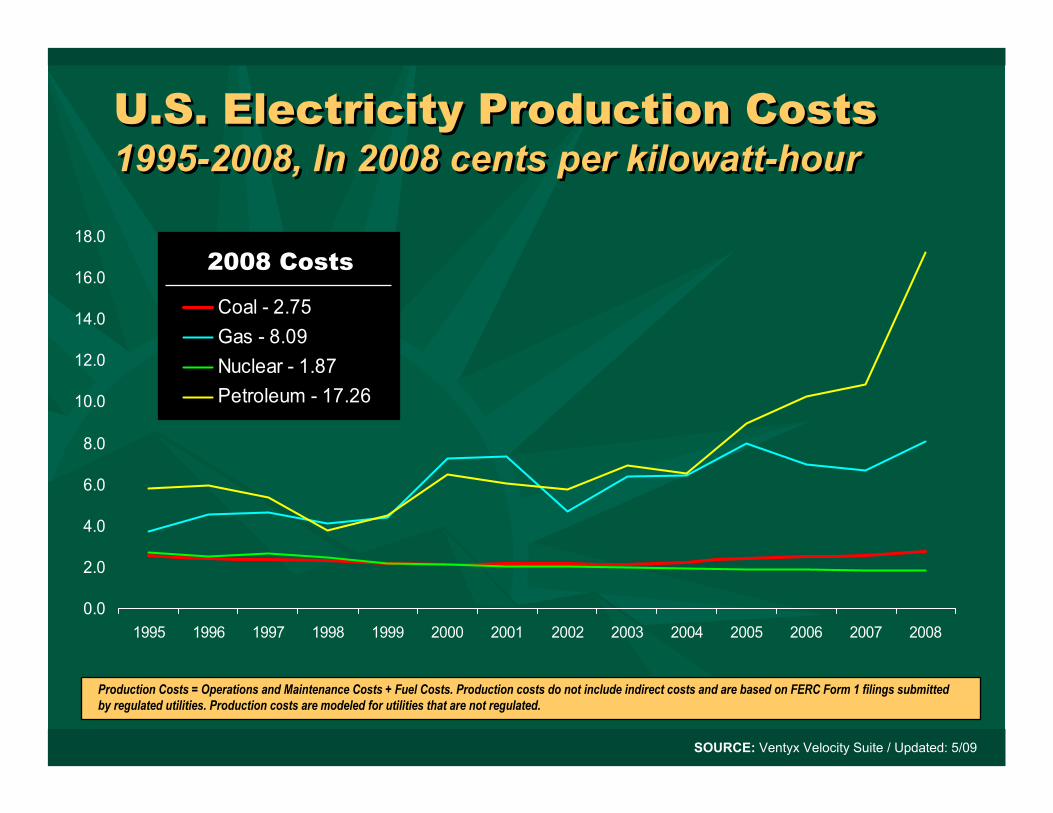
Coal - 2.75Gas - 8.09Nuclear - 1.87Petroleum - 17.26
U.S. Electricity Production Costs1995-2008, In 2008 cents per kilowatt-hourU.S. Electricity Production Costs1995-2008, In 2008 cents per kilowatt-hour
Production Costs = Operations and Maintenance Costs + Fuel Costs. Production costs do not include indirect costs and are based on FERC Form 1 filings submitted by regulated utilities. Production costs are modeled for utilities that are not regulated.
SOURCE: Ventyx Velocity Suite / Updated: 5/09
2008 Costs
Other Economic BenefitsOther Economic Benefits• Total estimated annual impact of $1.8 billion
in Arizona• Largest single commercial taxpayer in
Arizona, including nearly $50 million in property taxes annually
• Local purchases of materials and services• Palo Verde employees donate
approximately $1 million annually to local charities
• Approximately 3,000 employees
• Total estimated annual impact of $1.8 billion in Arizona
• Largest single commercial taxpayer in Arizona, including nearly $50 million in property taxes annually
• Local purchases of materials and services• Palo Verde employees donate
approximately $1 million annually to local charities
• Approximately 3,000 employees
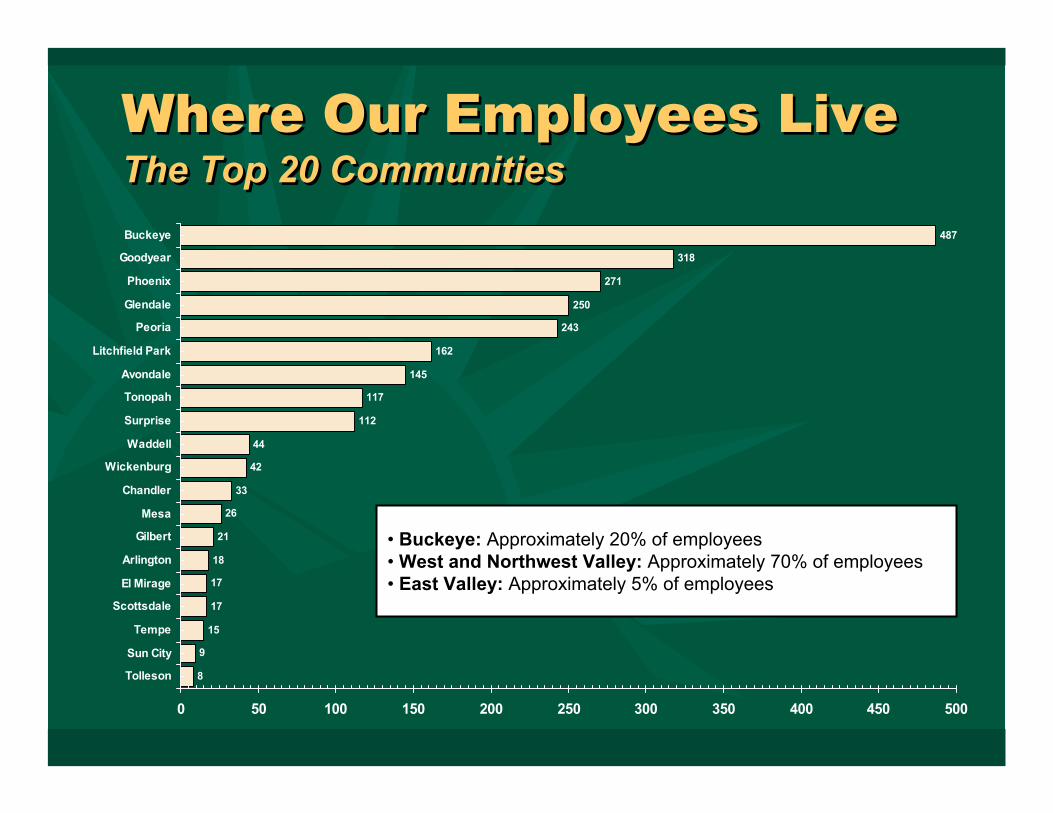
Where Our Employees LiveThe Top 20 CommunitiesWhere Our Employees LiveThe Top 20 Communities
487
318
271
250
162
145
117
112
44
42
33
26
21
18
17
17
15
9
8
243
0 50 100 150 200 250 300 350 400 450 500
Buckeye
Goodyear
Phoenix
Glendale
Peoria
Litchfield Park
Avondale
Tonopah
Surprise
Waddell
Wickenburg
Chandler
Mesa
Gilbert
Arlington
El Mirage
Scottsdale
Tempe
Sun City
Tolleson
• Buckeye: Approximately 20% of employees• West and Northwest Valley: Approximately 70% of employees• East Valley: Approximately 5% of employees
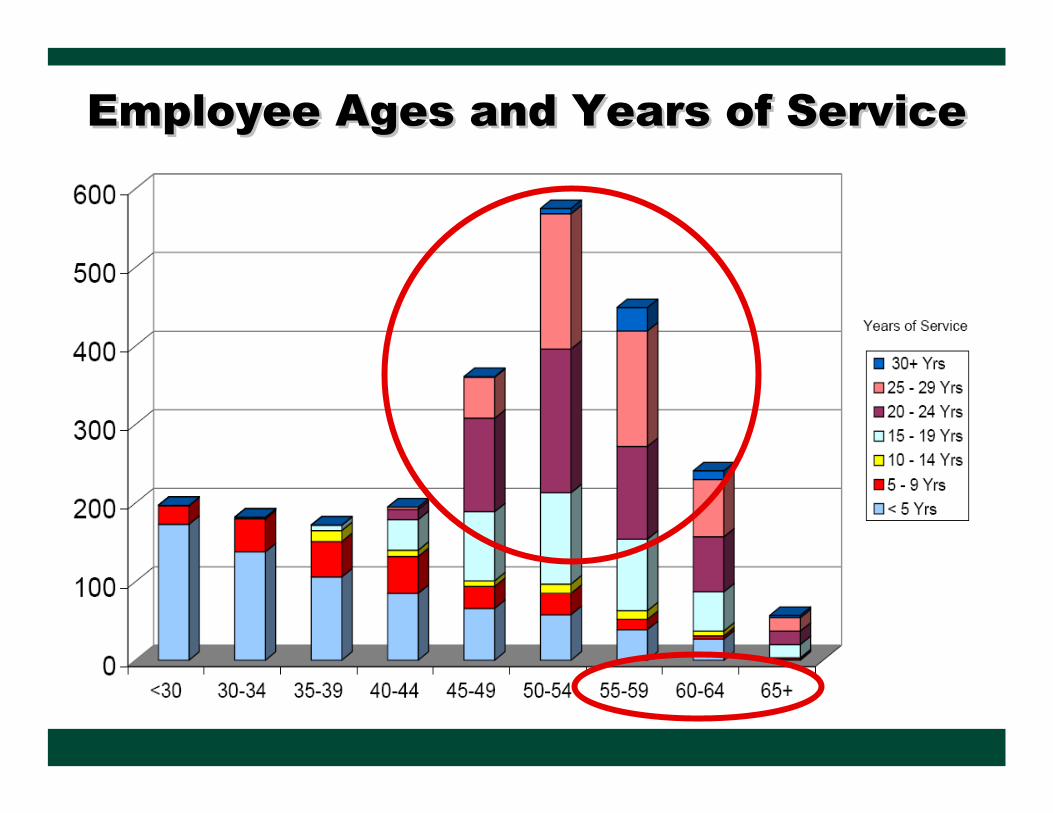
Employee Ages and Years of ServiceEmployee Ages and Years of Service

Hiring and Development Model…Hiring for OUR FutureHiring and Development Model…Hiring for OUR Future
Planning for OUR future includes:
Workforce Planning
Initial and Targeted Hires
Performance Management
Development and Retention
Compensation and Rewards
Metrics / Effectiveness Reviews
70% - 90%
10% -30%

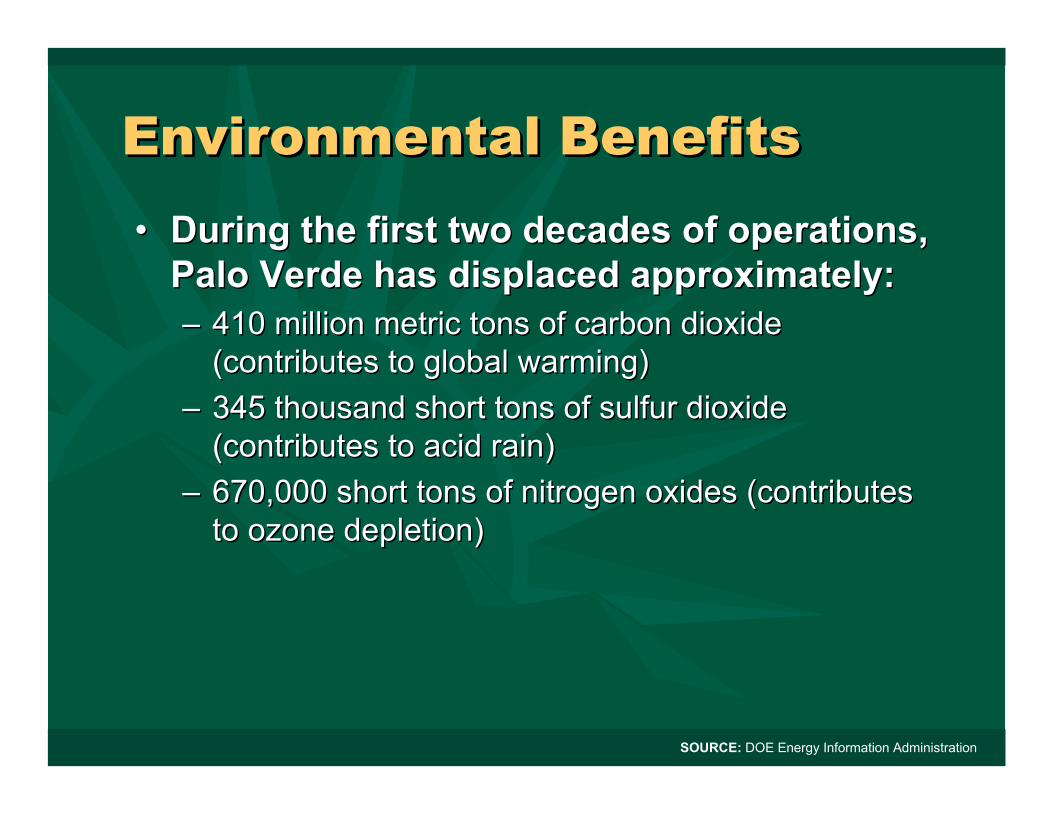
Environmental BenefitsEnvironmental Benefits• During the first two decades of operations,
Palo Verde has displaced approximately:– 410 million metric tons of carbon dioxide
(contributes to global warming) – 345 thousand short tons of sulfur dioxide
(contributes to acid rain)– 670,000 short tons of nitrogen oxides (contributes
to ozone depletion)
• During the first two decades of operations, Palo Verde has displaced approximately:– 410 million metric tons of carbon dioxide
(contributes to global warming) – 345 thousand short tons of sulfur dioxide
(contributes to acid rain)– 670,000 short tons of nitrogen oxides (contributes
to ozone depletion)
SOURCE: DOE Energy Information Administration
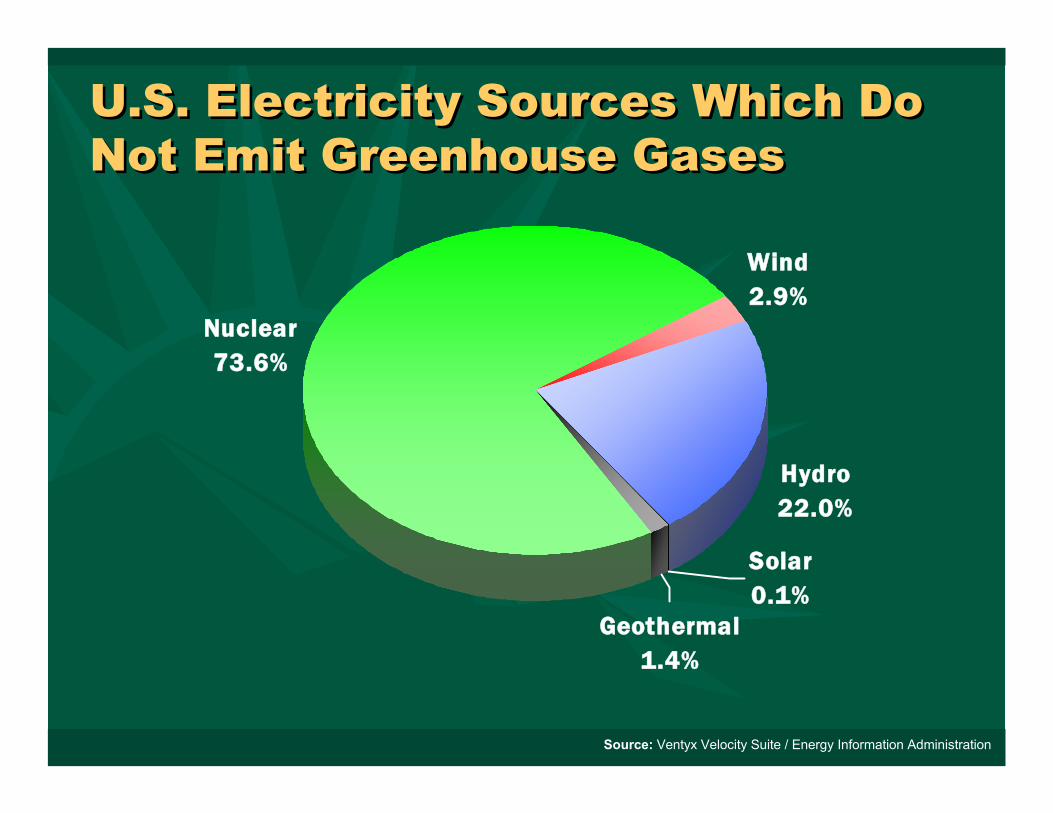
U.S. Electricity Sources Which Do Not Emit Greenhouse GasesU.S. Electricity Sources Which Do Not Emit Greenhouse Gases
Nuclear73.6%
Wind2.9%
Geothermal1.4%
Solar0.1%
Hydro22.0%
Source: Ventyx Velocity Suite / Energy Information Administration
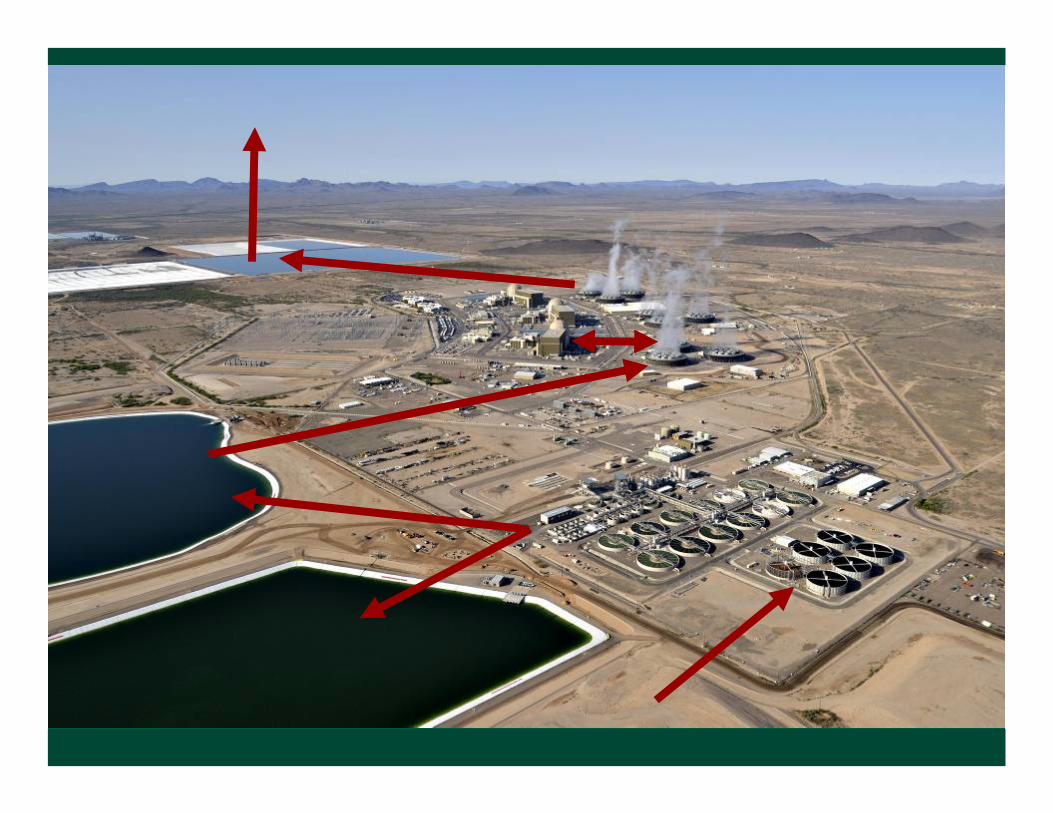
Conserving WaterConserving Water• Unlike other sites, Palo
Verde has no lake, ocean or river ― so recycled wastewater is utilized– City of Phoenix’s 91st Ave Wastewater
Treatment Facility– Tolleson Wastewater Treatment
Facility
• Unlike other sites, Palo Verde has no lake, ocean or river ― so recycled wastewater is utilized– City of Phoenix’s 91st Ave Wastewater
Treatment Facility– Tolleson Wastewater Treatment
Facility
Conserving WaterConserving Water• Palo Verde’s Water
Reclamation Facility can recycle up to 90 million gallons of wastewater daily– Average daily cooling water usage
during the summer is 80 million gallons
– Average daily water usage for the year is 65 million gallons
– This is about the same total cooling water use as a coal-fired power plant per megawatt-hour
• Palo Verde’s Water Reclamation Facility can recycle up to 90 million gallons of wastewater daily– Average daily cooling water usage
during the summer is 80 million gallons
– Average daily water usage for the year is 65 million gallons
– This is about the same total cooling water use as a coal-fired power plant per megawatt-hour
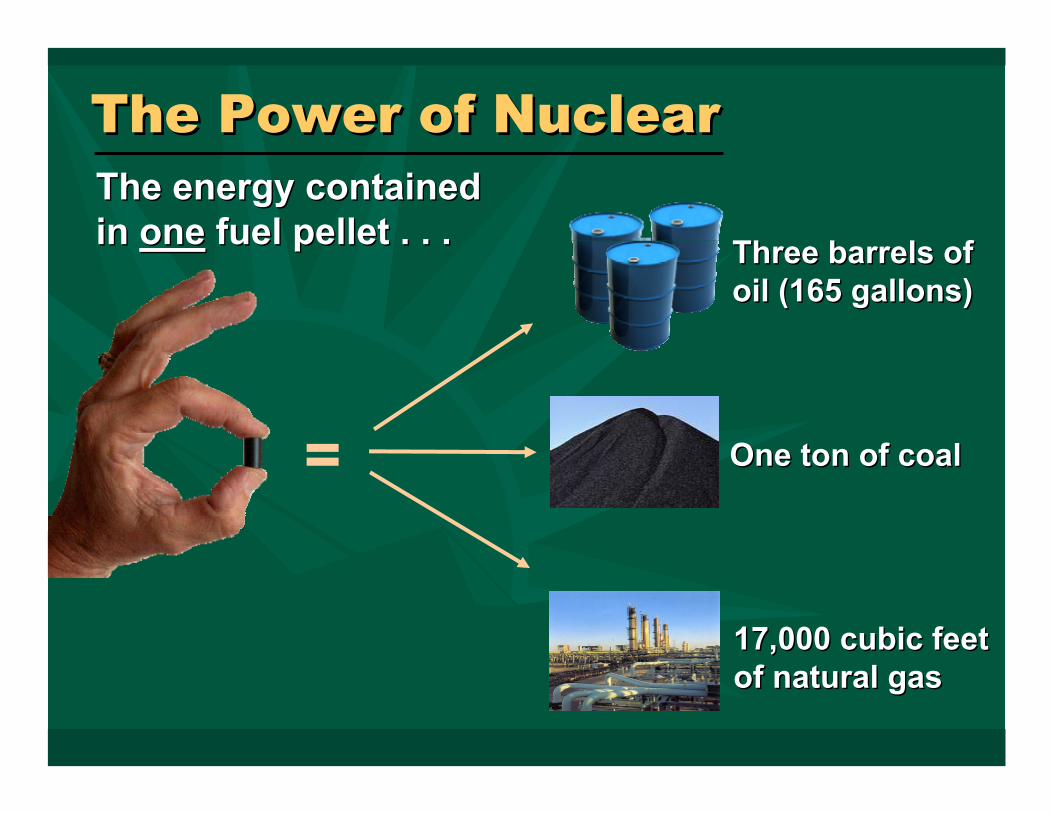
The Power of NuclearThe Power of Nuclear
=
Three barrels of oil (165 gallons)Three barrels of oil (165 gallons)
17,000 cubic feet of natural gas17,000 cubic feet of natural gas
One ton of coalOne ton of coal
The energy contained in one fuel pellet . . .The energy contained in one fuel pellet . . .

Monthly Fuel Cost to U.S. UtilitiesCents per kilowatt-hour 1995-2008Monthly Fuel Cost to U.S. UtilitiesCents per kilowatt-hour 1995-2008
SOURCE: Ventyx Velocity Suite / Updated: 5/09
Coal
Gas
Oil - Heavy
Uranium0.0
2.0
4.0
6.0
8.0
10.0
12.0
14.0
16.0
18.0
1995 1996 1997 1998 1999 2000 2001 2002 2003 2004 2005 2006 2007 2008 2009
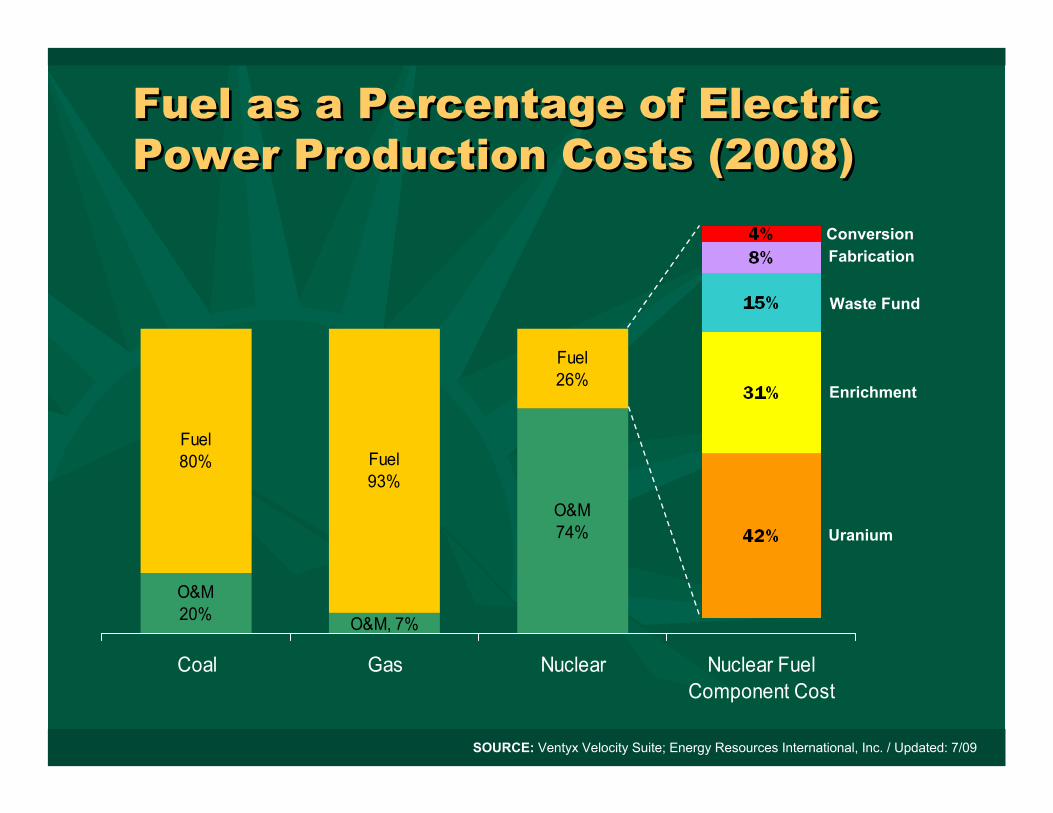
O&M20%
O&M74%
Fuel80% Fuel
93%
Fuel26%
O&M, 7%
Coal Gas Nuclear Nuclear FuelComponent Cost
Fuel as a Percentage of Electric Power Production Costs (2008)Fuel as a Percentage of Electric Power Production Costs (2008)
ConversionFabrication
Waste Fund
Enrichment
Uranium
SOURCE: Ventyx Velocity Suite; Energy Resources International, Inc. / Updated: 7/09
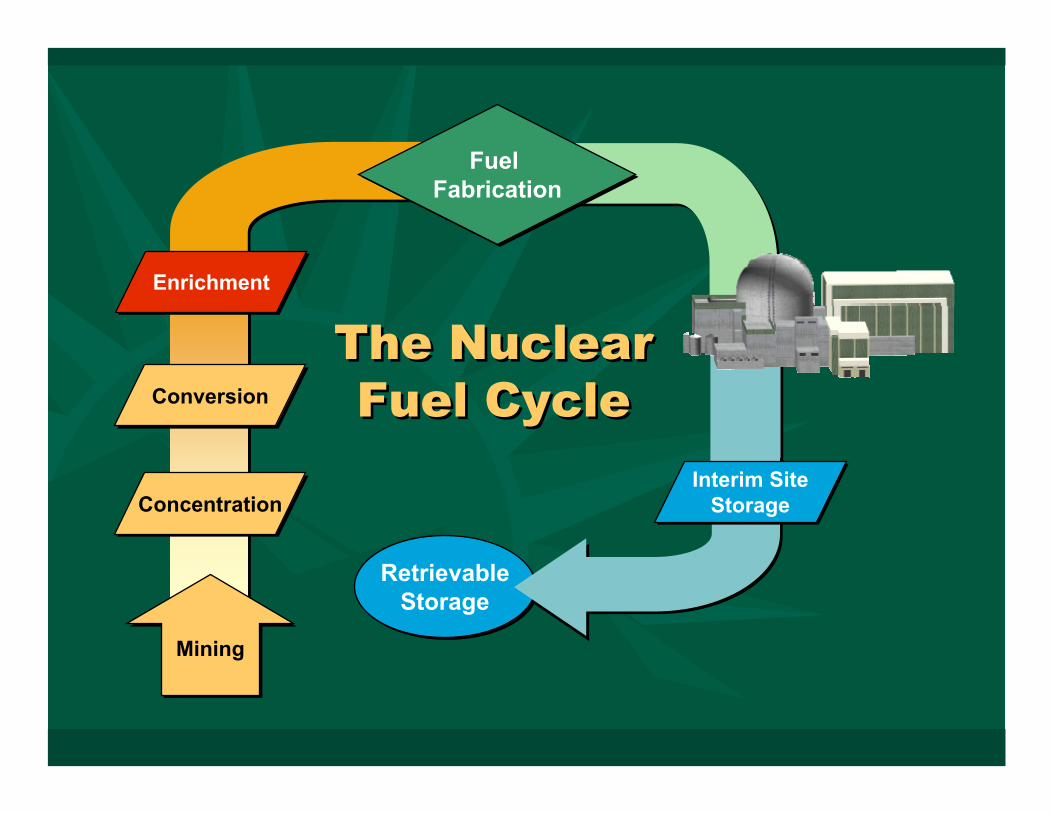
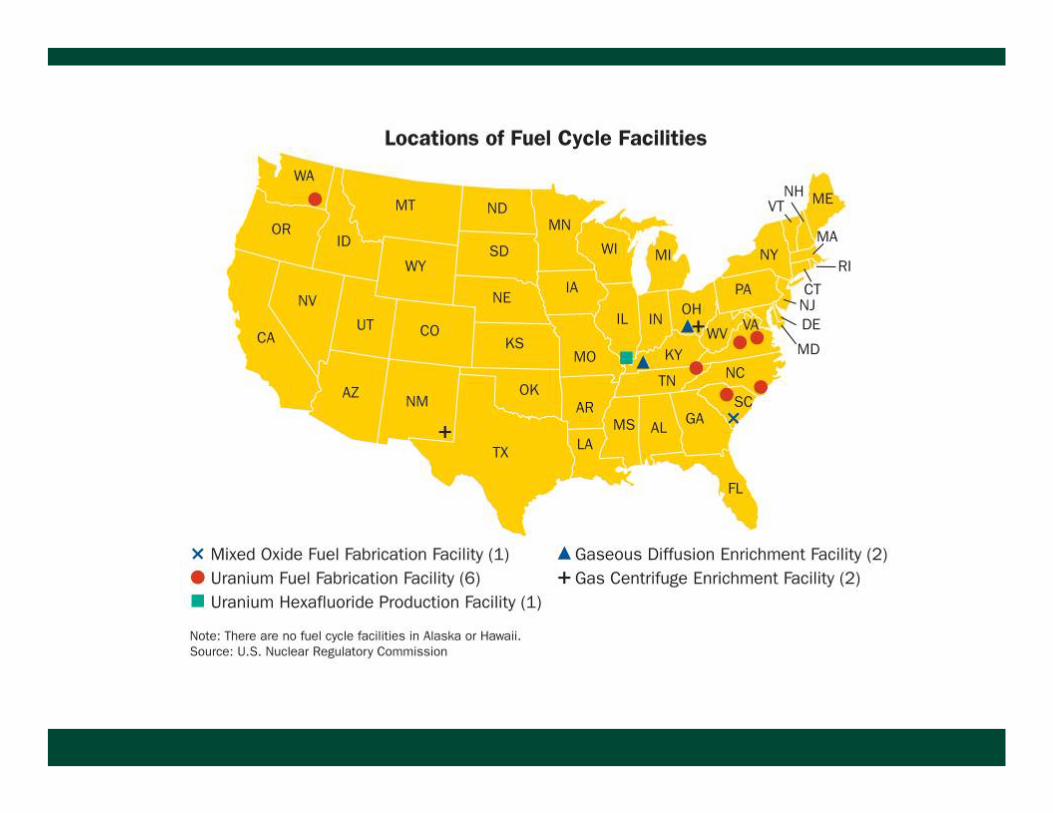
MiningMining
ConcentrationConcentration
ConversionConversion
EnrichmentEnrichment
Fuel Fabrication
Fuel Fabrication
RetrievableStorage
RetrievableStorage
Interim SiteStorage
Interim SiteStorage
The Nuclear Fuel Cycle
The Nuclear Fuel Cycle
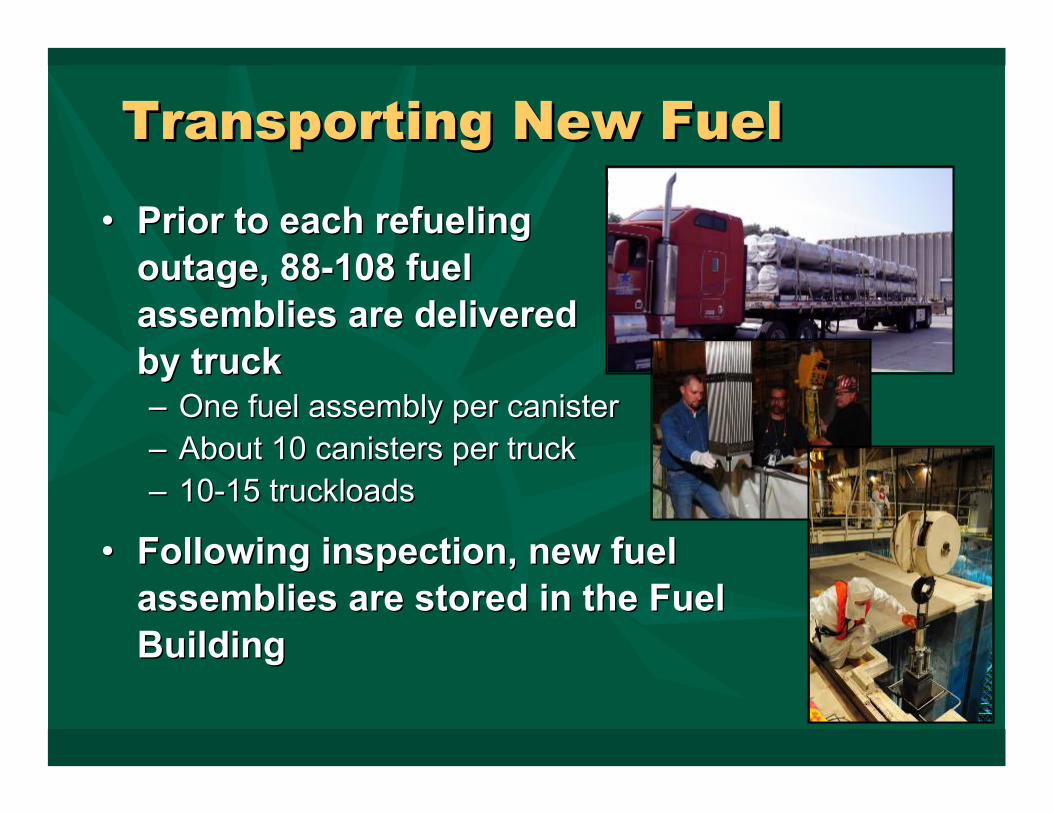
Transporting New FuelTransporting New Fuel
• Prior to each refueling outage, 88-108 fuel assemblies are delivered by truck– One fuel assembly per canister– About 10 canisters per truck– 10-15 truckloads
• Following inspection, new fuel assemblies are stored in the Fuel Building
• Prior to each refueling outage, 88-108 fuel assemblies are delivered by truck– One fuel assembly per canister– About 10 canisters per truck– 10-15 truckloads
• Following inspection, new fuel assemblies are stored in the Fuel Building
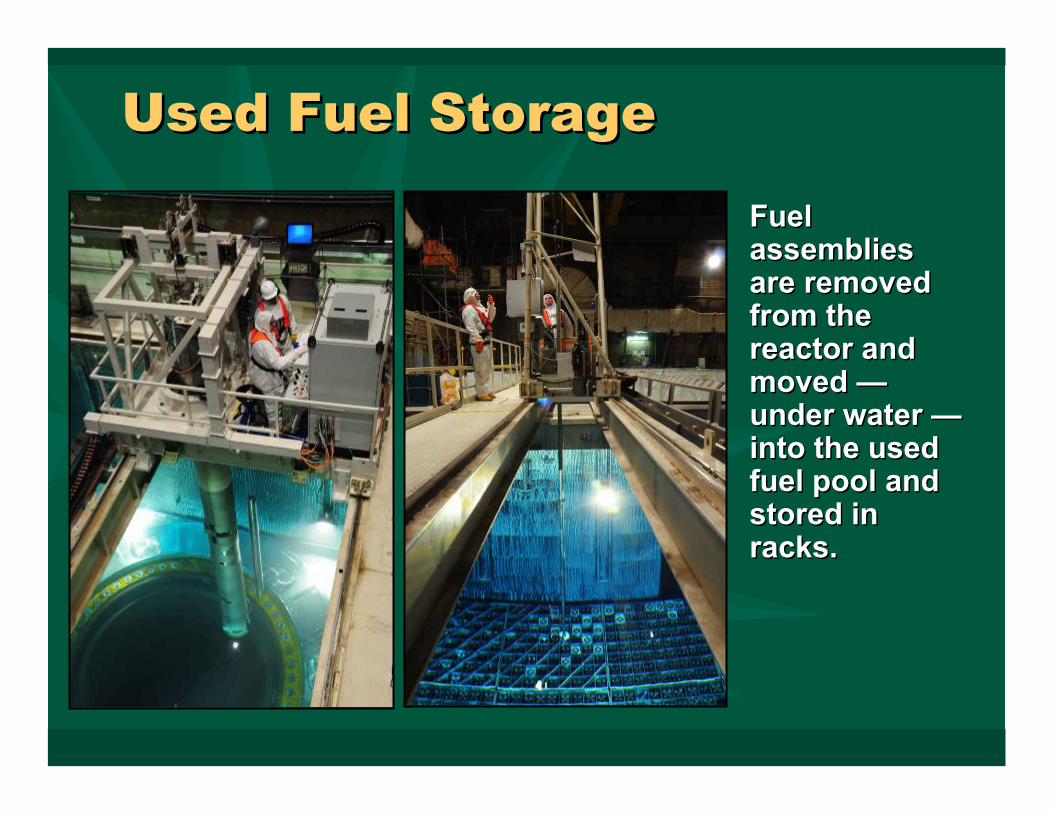
Used Fuel StorageUsed Fuel Storage
Fuel assemblies are removed from the reactor and moved —under water —into the used fuel pool and stored in racks.
Fuel assemblies are removed from the reactor and moved —under water —into the used fuel pool and stored in racks.
On-Site Dry Fuel StorageOn-Site Dry Fuel Storage• Palo Verde Goal: Always have full core
offload capability– Spent fuel pools have reached maximum capacity– Established additional dry fuel storage facility
Fuel is sealed inside leak-tight steel canisterSteel canister inside concrete caskCasks sit on concrete pads outdoors
– Storage facility has full security measures
• Palo Verde Goal: Always have full core offload capability– Spent fuel pools have reached maximum capacity– Established additional dry fuel storage facility
Fuel is sealed inside leak-tight steel canisterSteel canister inside concrete caskCasks sit on concrete pads outdoors
– Storage facility has full security measures
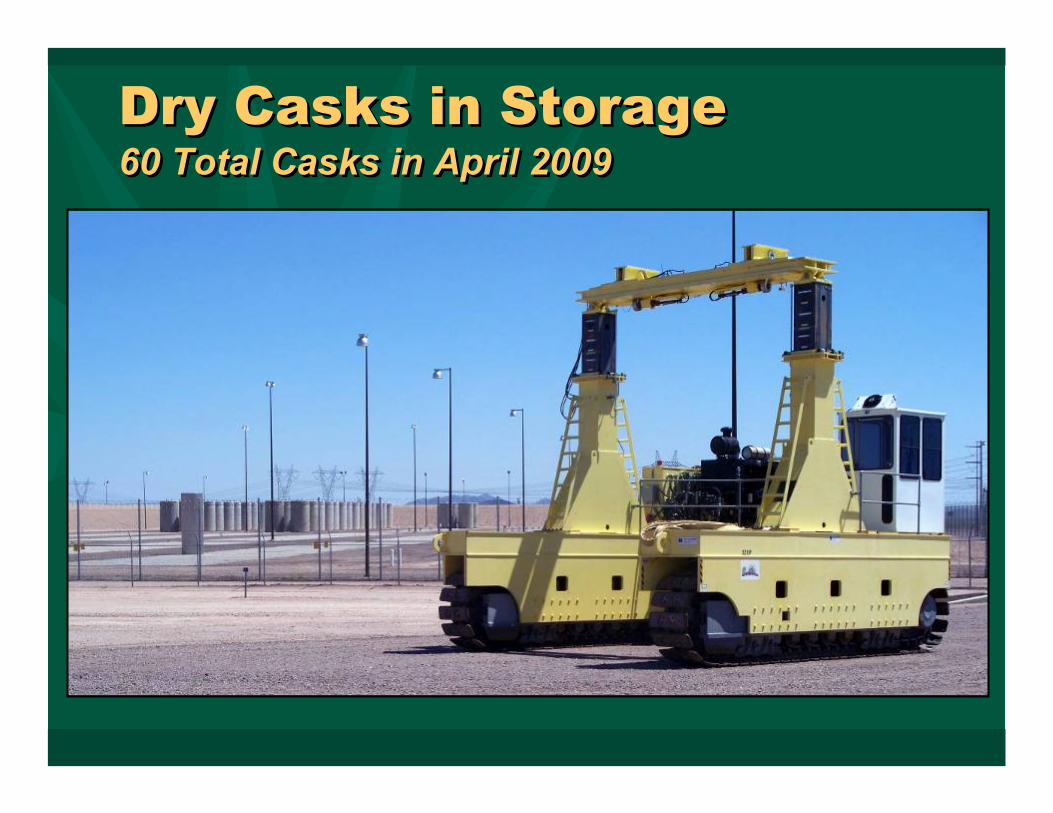
Dry Casks in Storage60 Total Casks in April 2009Dry Casks in Storage60 Total Casks in April 2009
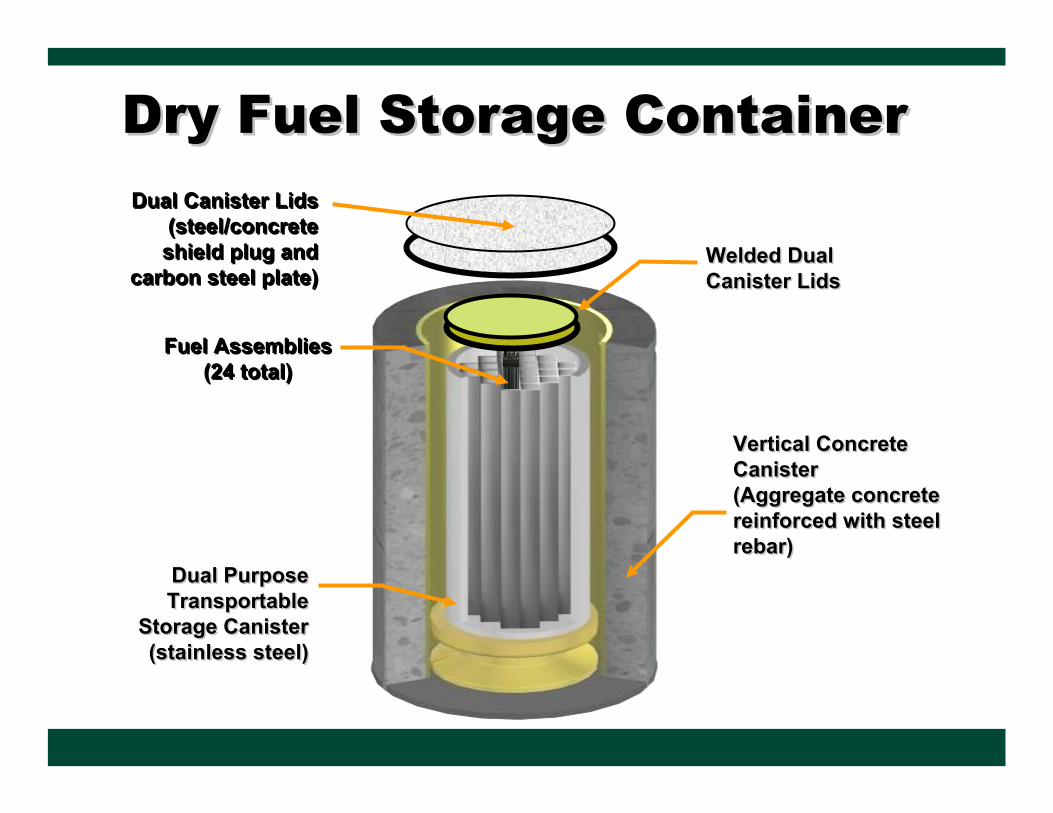
Vertical Concrete Canister(Aggregate concrete reinforced with steel rebar)
Vertical Concrete Canister(Aggregate concrete reinforced with steel rebar)
Dual PurposeTransportable
Storage Canister(stainless steel)
Dual PurposeTransportable
Storage Canister(stainless steel)
Welded DualCanister LidsWelded DualCanister Lids
Fuel Assemblies(24 total)
Fuel Assemblies(24 total)
Dual Canister Lids(steel/concrete shield plug and
carbon steel plate)
Dual Canister Lids(steel/concrete shield plug and
carbon steel plate)
Dry Fuel Storage ContainerDry Fuel Storage Container
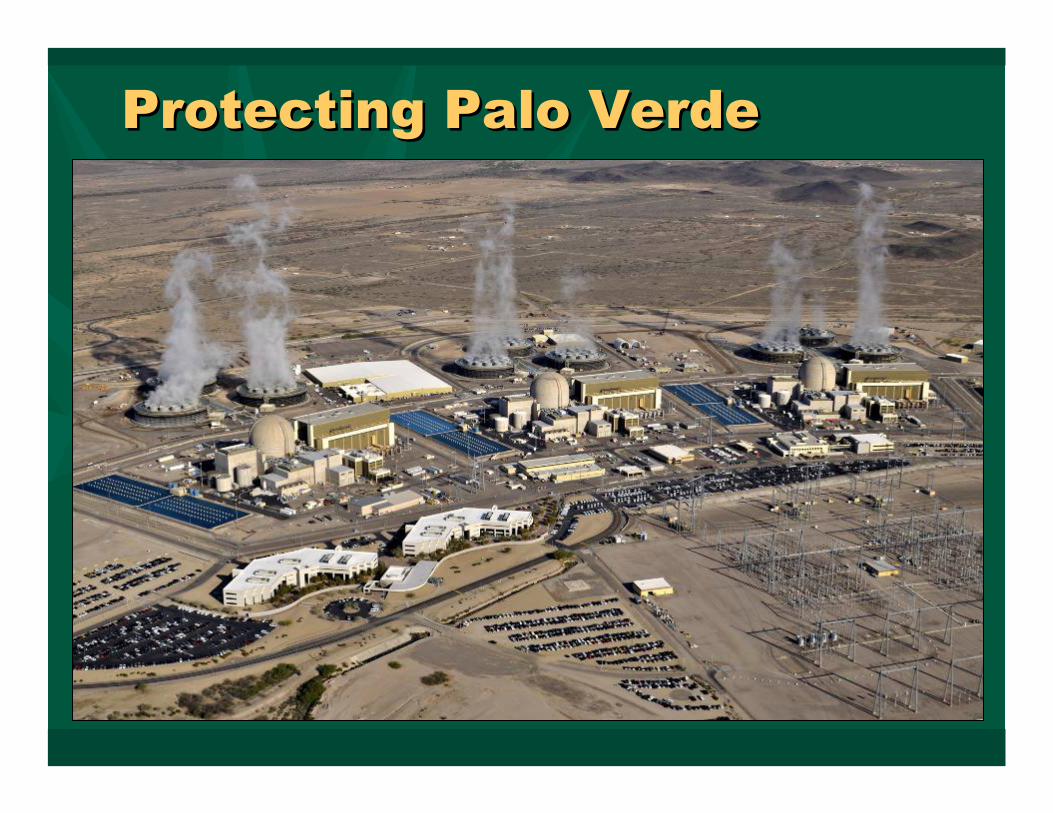
Protecting Palo VerdeProtecting Palo Verde
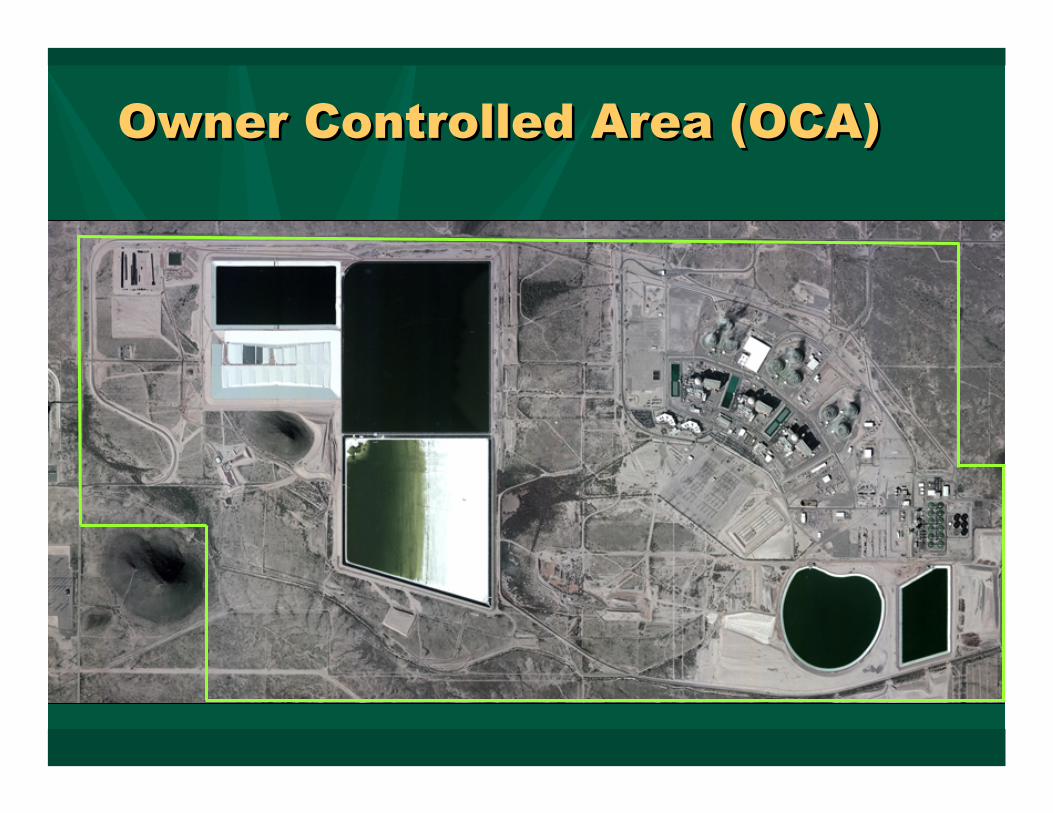
Owner Controlled Area (OCA)Owner Controlled Area (OCA)
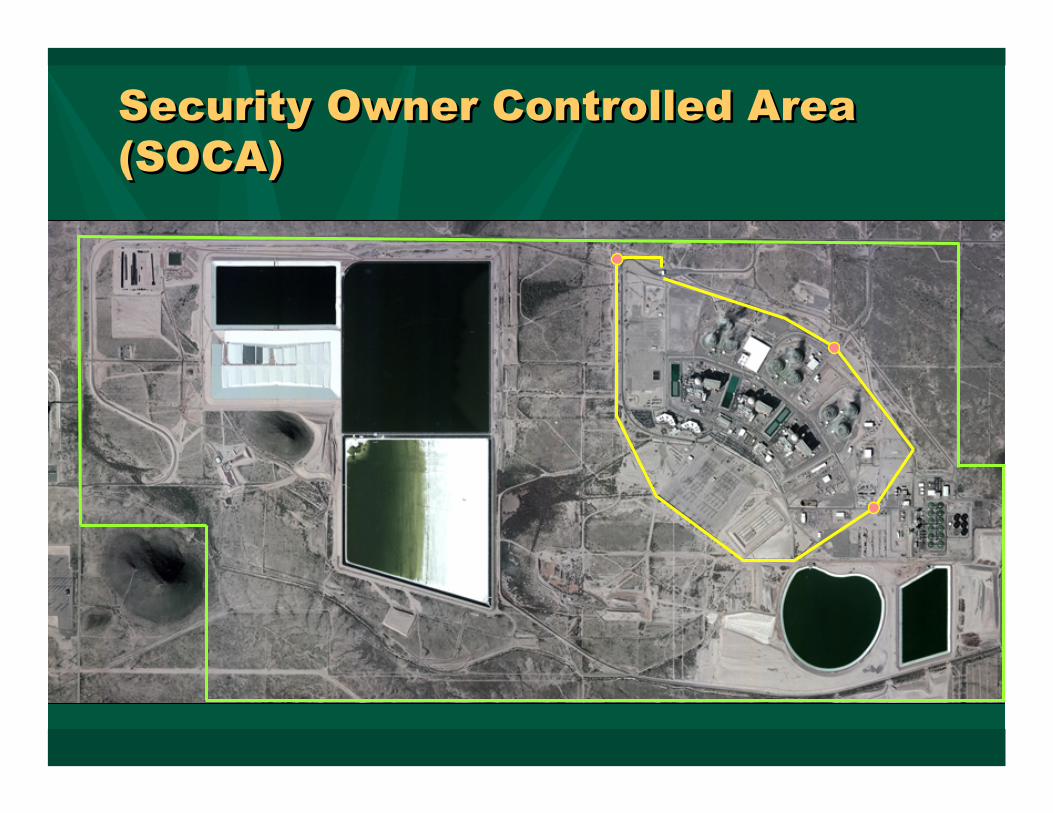
Security Owner Controlled Area (SOCA)Security Owner Controlled Area (SOCA)
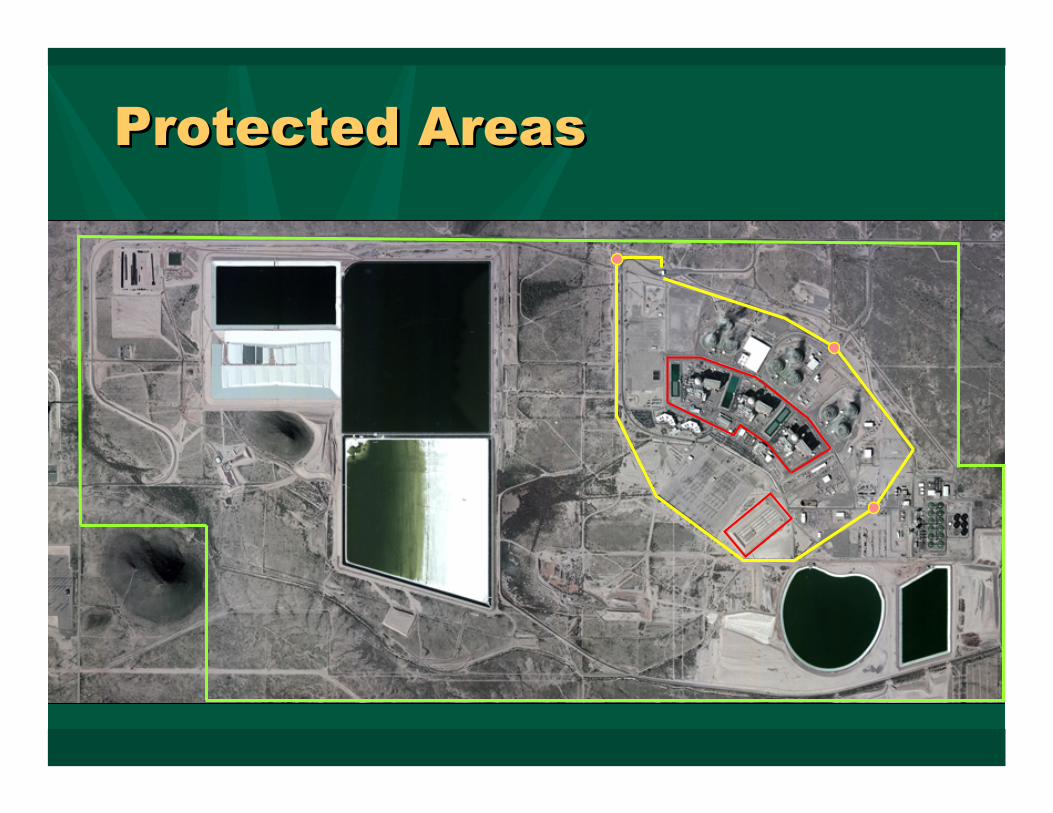
Protected AreasProtected Areas
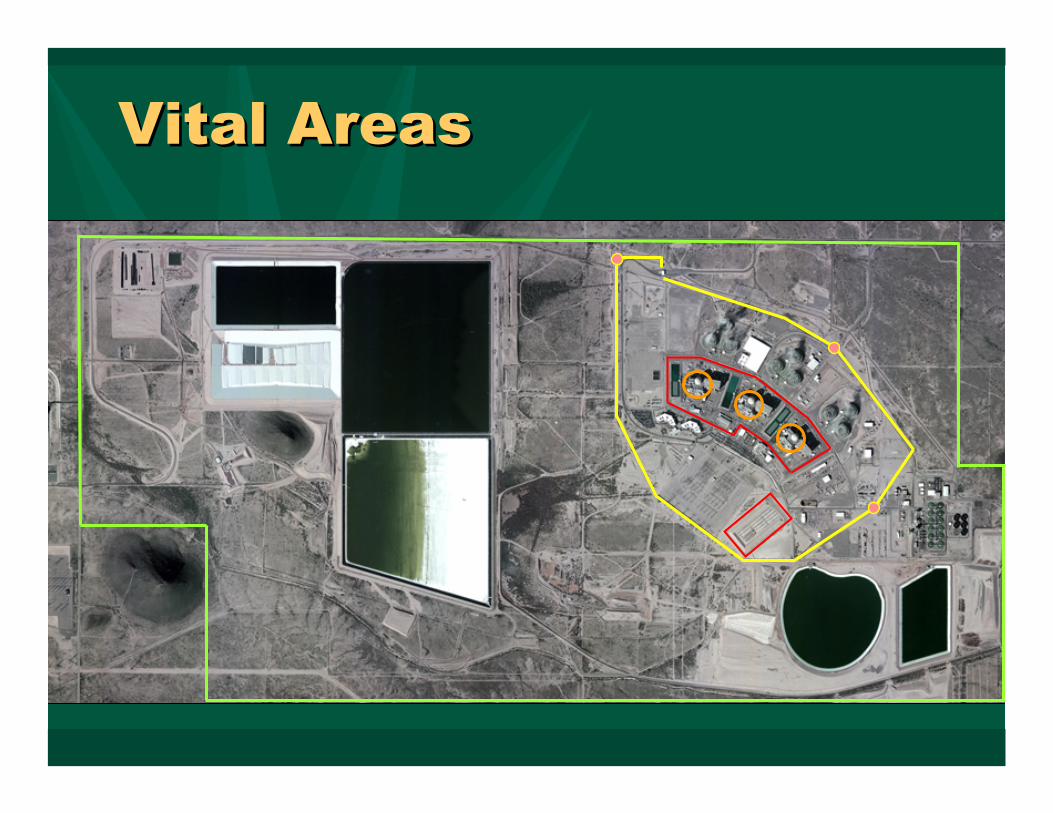
Vital AreasVital Areas
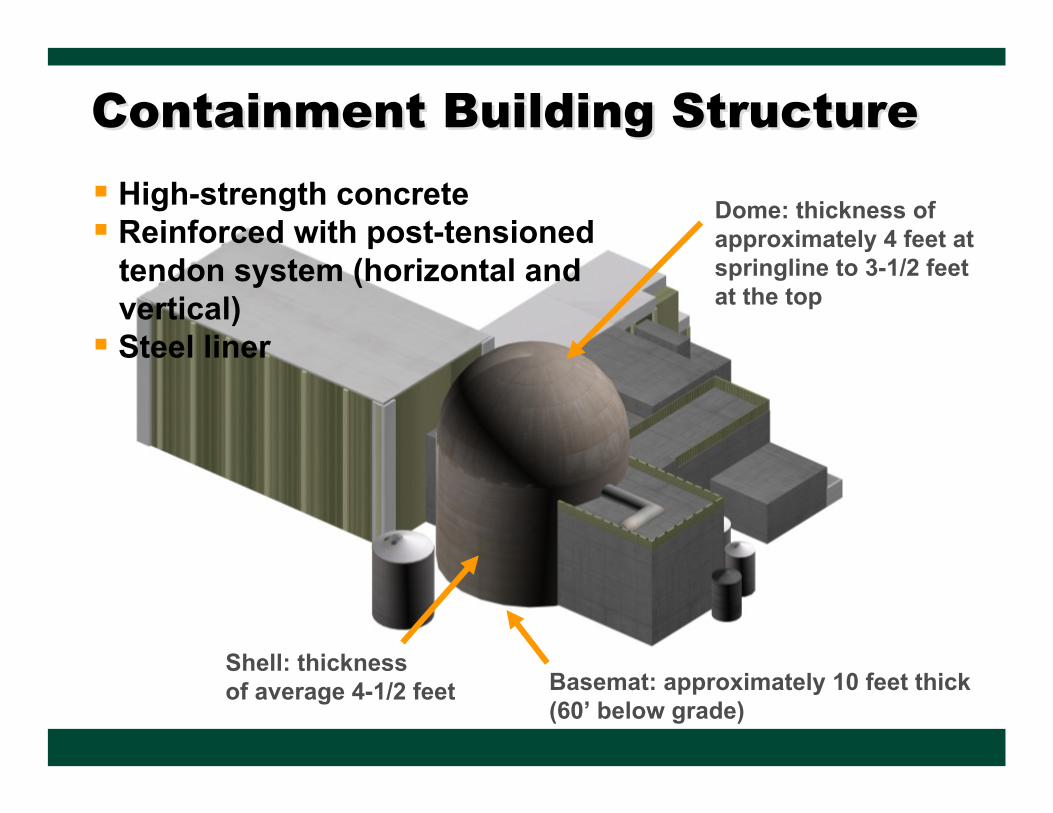
Containment Building StructureContainment Building Structure
Basemat: approximately 10 feet thick (60’ below grade)
Dome: thickness of approximately 4 feet at springline to 3-1/2 feet at the top
Shell: thicknessof average 4-1/2 feet
High-strength concreteReinforced with post-tensioned tendon system (horizontal and vertical)Steel liner
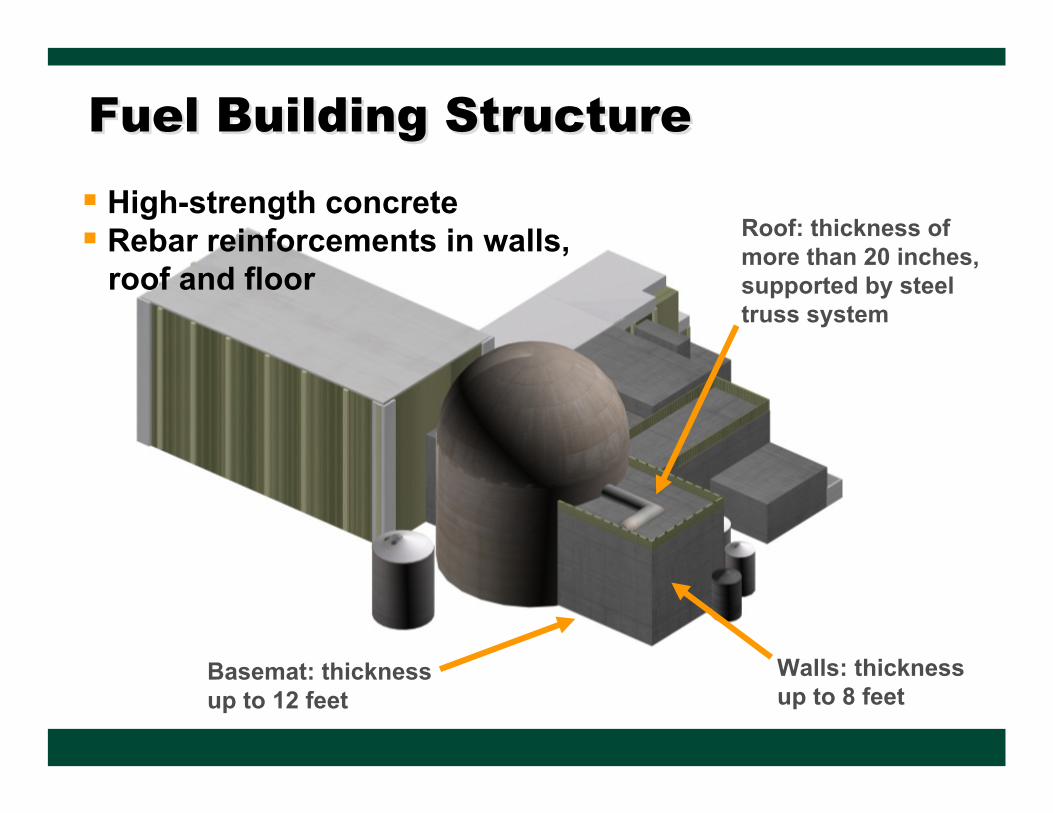
Fuel Building StructureFuel Building Structure
Basemat: thickness up to 12 feet
High-strength concrete Rebar reinforcements in walls, roof and floor
Roof: thickness of more than 20 inches, supported by steel truss system
Walls: thicknessup to 8 feet
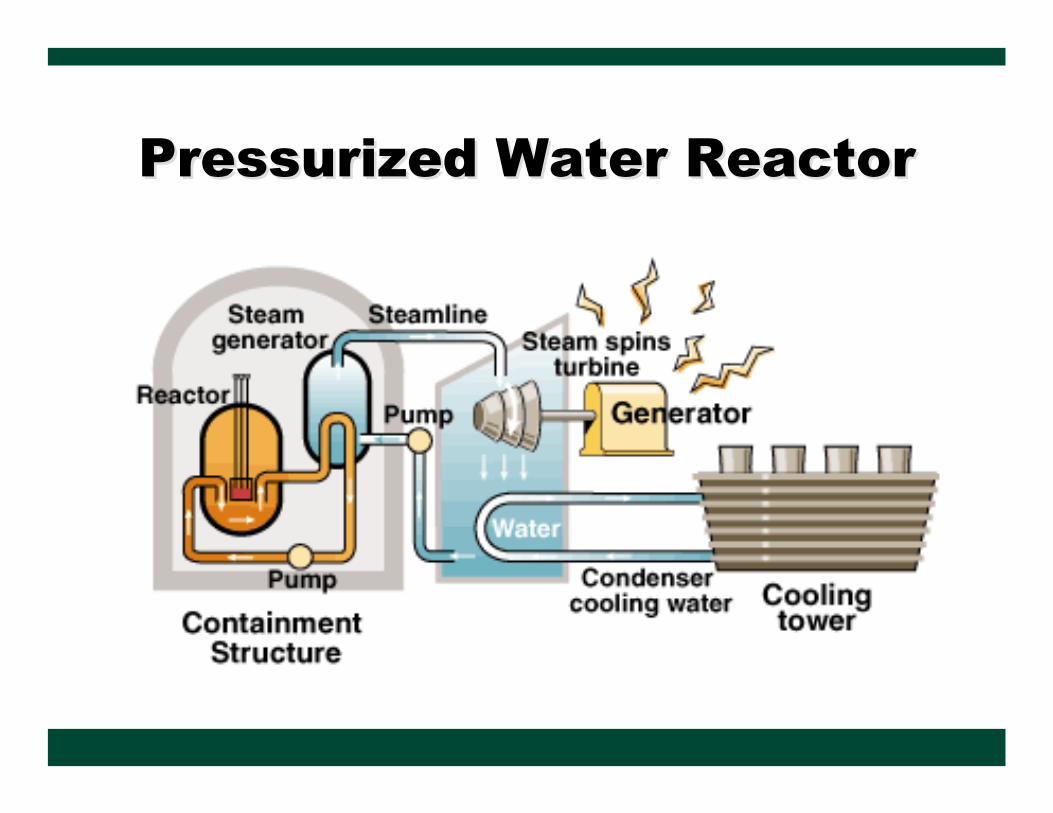
Pressurized Water ReactorPressurized Water Reactor
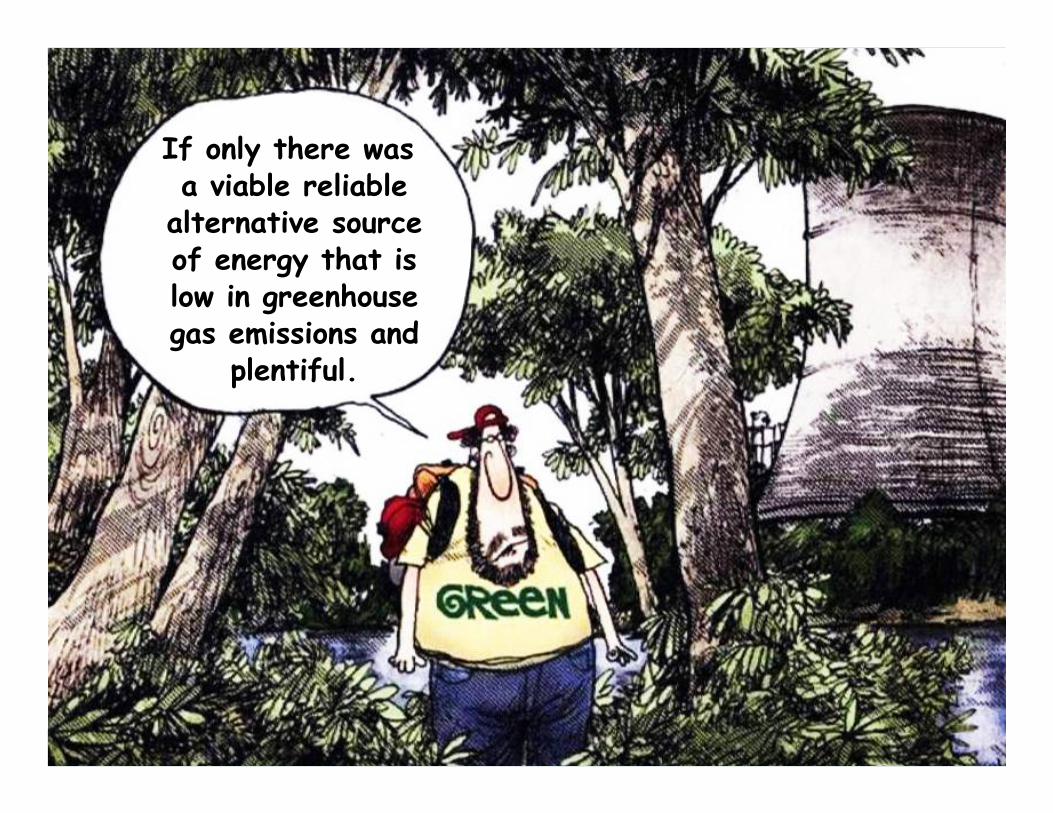
If only there was a viable reliable
alternative sourceof energy that islow in greenhousegas emissions and
plentiful.

Questions and
Discussion
Questions and
Discussion