Embed Size (px)
Citation preview
TECHNICAL NOTE | June 2016 | 1
TECHNICAL NOTE
PALM RISK ASSESSMENT METHODOLOGY: PRIORITIZING AREAS, LANDSCAPES, AND MILLS SARAH LAKE, ANNE ROSENBARGER, AND CAROLINE WINCHESTER
CONTENTSExecutive Summary....................................................... 1
1. Background. .............................................................. 2
2. Methodology. ............................................................ 3
2.1 Assigning Scores .................................................... 5
2.2 Output ..................................................................... 7
3. Use Cases. ................................................................ 8
4. Mitigating Factors and Overall Limitations. ............... 9
5. Conclusion. ............................................................. 10
Glossary. ..................................................................... 12
Suggested Citation: Suggestion Citation: Lake, S., A. Rosenbarger, C. Winchester, 2016. “PALM Risk Assessment Methodology” Technical Note. Washington, D.C.: World Resources Institute. Available online at: www.wri.org/publication/palm-risk-assessment-methodology.
Technical notes document the research or analytical methodology underpinning a publication, interactive application, or tool.
EXECUTIVE SUMMARYAgriculture is the largest driver of deforestation in the tropics.1 In recent years, both companies and countries have committed to sustainable, “deforestation-free” pro-duction of agricultural raw materials, including palm oil, beef, soy, and pulp and paper. Traders and buyers of these commodities need to understand how their supply chain contributes to deforestation and how to mitigate associ-ated reputational, operational, and financial risks. Linking supply chains to deforestation requires tracing the supply chain to the point of origin in order to understand where and how products are sourced. Many buyers have invested significantly in traceability over the past few years, espe-cially in the case of palm oil. However, due to the size and complexity of these supply chains, the most successful efforts so far have reached back only to the palm oil mill rather than to the farm. A large palm oil buyer’s supply chain may include hundreds if not thousands of mills spanning multiple countries, which in turn source from thousands of farms.
2 |
WRI has developed a method for assessing the deforesta-tion risk associated with a specific mill. The PALM Risk Assessment Tool (PALM Tool) can be applied across an entire supply chain to generate a relative risk ranking of all mills. This information can support decision-making by buyers and traders as they prioritize engagements and interventions within their supply chain. Potential uses by companies include the ability to:
▪ assess reputational risks from past and potential future deforestation-related activities;
▪ prioritize high-risk mills or geographies for auditing, mitigation, and supplier engagement;
▪ prioritize high-risk mills or geographies for further investment in farm-level traceability; and
▪ create incentives for high-risk mills to improve performance.
The PALM Tool methodology draws on best available geospatial data to assess both past impact and potential for future impact associated with “deforestation-related activities” within the sourcing area of a palm oil mill. Deforestation-related activities include fires and tree-cover loss over time and in various land-cover classifica-tions such as peatlands, primary forests, and high carbon density areas. Comparing across a set of mills, the PALM Tool then generates a relative risk ranking (high, medium, low) for each mill.
Table ES–1 | Summary
OVERALL PURPOSE Rank mills based on environmental risk factors to inform sustainable sourcing strategy and prioritize supplier engagement
PAST FACTORS REVIEWED Tree cover loss; tree cover loss in peatlands, primary forest, protected areas, and high carbon density areas; fire activity
PROJECTED FACTORS REVIEWED
Area comprising peatland, primary forest, protected area, and high carbon density area; rate of fire activity; rate of tree cover loss
OMITTED FACTORS Social issues (land rights, resource rights, free, prior and informed consent, labor practices); high carbon stock areas; high conservation value areas
MITIGATING FACTORS Certification; traceability to the farm; site assessments; existing sustainable sourcing policies
LIMITATIONS Resolution and timeliness of remotely sensed data; sourcing area not directly associated with a mill
Assessment results offer a preliminary indication of rela-tive risk and should not be taken as a definitive or absolute measure of deforestation activity in an area. Site audits and other relevant information such as certification status can be used as needed to validate and deepen assessment results. Due to data availability constraints, the PALM Tool does not currently consider risk factors relating to governance, human rights, and biodiversity. These factors may be integrated into the Tool as better data become available.
1. BACKGROUNDPalm oil is the sixth-largest oil seed commodity2 and offers the highest yields per hectare of any oil seed crop.3 Land clearing to make way for new oil palm plantations is a major driver of tropical deforestation,4 especially in Indonesia and Malaysia, where more than 80 percent of palm oil is produced,5 and increasingly in Africa and Latin America. Palm oil is a relatively inexpensive, efficient source of oil that satisfies global demand from sectors including food, cosmetics, and biofuels. Production has grown rapidly, with the total area under harvest more than doubling in Indonesia over the 10 years between 1997 and 2007.6 Many national governments in Asia and, increasingly, in Africa and Latin America are actively promoting palm oil production and export as a key economic growth strategy. The Food and Agriculture Organization of the United Nations (FAO) estimates that global palm oil production will increase by more than 37 percent by 2020 from 2014, when it will account for one-third of all vegetable oil produced.7
TECHNICAL NOTE | June 2016 | 3
PALM RISK ASSESSMENT METHODOLOGY: PRIORITIZING AREAS, LANDSCAPES, AND MILLS
Palm oil production has expanded to cover more than 16 million hectares of land, accounting for as much as 80 percent of all plantation expansion in Asia during the 1990s.8 Among its other environmental impacts, palm oil production often contributes significantly to greenhouse gas emissions through the clearance of forest land and the draining and development of carbon-rich peatlands.
Deforestation creates reputational, operational, and finan-cial risks that threaten the profitability of palm oil produc-ers, traders, and buyers. Companies may lose customers’ trust and negatively affect their brand when they are asso-ciated with environmentally damaging behavior. Finan-cially, companies risk stranding assets if environmental scrutiny reveals that development of company land would lead to deforestation. Companies also risk losing financial support from lenders and investors who are committed to environmental sustainability. Given the risks involved in deforestation, many leading palm oil buyers, traders, and producers have pledged to eliminate deforestation from their supply chains, avoid conversion of high-carbon peat-lands, preserve biodiversity, and respect all human rights.
However, these actors lack the information to identify where palm oil production may be connected to deforesta-tion, and whether it is present in their supply chains. In addition to the complexity of global supply chains, until recently, data on the state of the world’s forests was out of date, available only at a local scale, and of too coarse a resolution for fine-grained supply chain insights. Global Forest Watch (GFW) provides the near-real time, high-resolution data necessary to identify deforestation glob-ally. This document describes an approach based on the globally significant and locally relevant data from GFW to assess the deforestation-related environmental risks associated with palm oil production, as described in Box 1. The method does not consider other forms of risk in the social and economic spheres, for example, land rights and labor practices. In the future, once adequate sources of data can be identified or developed, this method can be expanded to incorporate economic and social factors that are essential to holistic sustainable sourcing.
2. METHODOLOGY The methodology leverages best available geospatial data to analyze the risk that deforestation-related activities (tree clearing and burning) have occurred or will occur within the sourcing area of a specific palm oil mill. Mills must source from palm plantations within a 24-hour drive time in order to preserve the oil quality. Thus, the sourc-ing area has been estimated as land within a 50 km radius of the mill location until further refinements can be made, based on the presence and condition of road networks.
Box 1 | Impacts of Deforestation
Deforestation has broad environmental implications. Carbon emis-sions, air quality, and biodiversity are all directly impacted by the health of forests. For example, peatland is commonly drained and burned for palm oil plantations,9 releasing on average 55 metric tons of CO
2 per hectare each year.10 The fires used to clear peat-
lands create hazardous haze that is linked to 110,000 deaths per year in Southeast Asia.11 The clearance of peatlands and use of fire, together with the loss of forest areas, can be devastating for biodi-versity. Since 2001, forests that are home to rare and endangered species have lost more than 1.2 million hectares of tree cover.12 In Southeast Asia, where palm oil production is most common, this has further endangered orangutans, the Sumatran tiger, Sumatran elephant, and Sumatran rhino, among many other species.13 In addition to deforestation, therefore, this methodology examines the amount of peatlands cleared and remaining, the use of fire for clearing, and the health and intactness of primary forests known to house a diverse range of flora and fauna.

4 |
Sources: WRI and FoodReg. 2016. “Palm Oil Mills.” Access through Global Forest Watch. http://data.globalforestwatch.org/datasets/ed8d5951b2a4482a9e62c4fe0bc23b5f_27.Hansen, M.C., P.V. Potapov, R. Moore, M. Hancher, S.A. Turubanova, A. Tyukavina, D. Thau, S.V. Stehman, S.J. Goetz, T.R. Loveland, A. Kommareddy, A. Egorov, L. Chini, C.O. Justice, and J.R.G. Townshend. 2013. “High-Resolution Global Maps of 21st-Century Forest Cover Change.” Science 342: 850–53. Data available from: earthenginepartners.appspot.com/science-2013-global-forest. IUCN and UNEP-WCMC. 2016. “The World Database on Protected Areas (WDPA).” [On-line], Cambridge, UK: UNEP-WCMC. Available at: www.protectedplanet.net. Accessed through Global Forest Watch in May 2016. www.globalforestwatch.org. Margono, B. 2014. “Primary Forest Cover Loss in Indonesia over 2000–2012.” Nature Climate Change. doi:10.1038/nclimate2277.NASA. 2016. “NASA Fire Information for Resource Management System (FIRMS).”Indonesian Ministry of Agriculture and Wetlands International. 2011. Peatland areas data prepared by World Resources Institute in 2015.Saatchi, S.S., N.L. Harris, S. Brown, M. Lefsky, E. Mitchard, W. Salas, B. Zutta, W. Buermann, S. Lewis, S. Hagen, S. Petrova, L. White, M. Silman, and A. Morel. 2011. “Benchmark Map of Forest Carbon Stocks in Tropical Regions across Three Continents.” Proceedings of the National Academy of Sciences 108(24): 9899–9904. DOI: 10.1073/pnas.1019576108.
Table 1 | Data Sources
NAME DESCRIPTION SOURCE GLOBAL/INDONESIA RESOLUTION TIME NOTES
Palm Oil Mills
The location of palm oil mills from the Known Sources data-base, palm oil traders, and palm oil buyers
WRI and FoodReg (2016)
Global Point data 2015
LINK: http://blog.globalforestwatch.org/2015/12/mill-data-a-step-towards-achieving-transparency-in-the-palm-oil-sector/
Primary forest 2000
The location of intact and degraded primary forests across Indonesia for the year 2000
Margono (2014) Indonesia only (Intact forest landscapes used outside Indonesia)
30 m 2000
LINK: http://gfw2-data.s3.amazonaws.com/forest_cover/zip/idn_primary.tif.aux.zip
Tree cover 2000
The extent of tree cover as defined by percent tree cover (canopy density)
Hansen (2014) Global 30 m 2000 Includes only tree cover above 30% density
LINK: http://data.globalforestwatch.org/datasets/7876b225f8034a0ebba79fad4afb80ad
Archived active fires (NASA)
NASA active fire locations dis-play NASA active fire alerts from January 2013 to the present
NASA (2016) Global 1 km 2001–2013
Includes only fires at greater than 30% confi-dence, as measured by brightness14
LINK: http://data.globalforestwatch.org/datasets/de1fe5832831464cbd64aaa8f2d54781_0
Protected areas
Legally protected areas accord-ing to various designations that are managed to achieve conservation objectives
IUCN and UNEP-WCMC (2016)
Global Varies by country
Varies by protected area
LINK: http://www.protectedplanet.net/
Tropical forest car-bon stocks
Carbon stock in live biomass Saatchi et al. (2011) Humid tropics 30 m 2011 High carbon density defined as greater than 20 tons per hectare
LINK: http://icesat.gsfc.nasa.gov/icesat/glas.php
Peatland Peatland in Indonesia and Malaysia
Indonesian Ministry of Agriculture and Wetlands Interna-tional (2011)
Indonesia and Malaysia (Carbon density greater than 20 tons per hectare used outside Indonesia and Malaysia)
1:250,000 2011 Includes peat of all depths
LINK: http://gfw2-data.s3.amazonaws.com/country/idn/zip/idn_peat_lands.zip
Tree cover loss
Identify tree cover loss on an annual basis
Hansen (2015) Global 30 m 2013 Includes only tree cover loss above 30% density
LINK: gfw2-data/country/idn/zip/idn_tree_cover_loss.tiff.zip

TECHNICAL NOTE | June 2016 | 5
PALM RISK ASSESSMENT METHODOLOGY: PRIORITIZING AREAS, LANDSCAPES, AND MILLS
The methodology uses two indices: past deforestation-related impacts and potential for future deforestation-related impacts. Understanding past impact is important for understanding reputational risks and compliance with zero deforestation policies, whereas understanding potential for future impact is useful for prioritizing supply chain interventions.
Each index comprises a set of indicators that capture dif-ferent elements of deforestation-related impact. For past impacts, we examine tree cover loss in various contexts, including tree cover loss in primary forest areas and tree cover loss in peatlands. Additionally, the methodology considers fire activity as a risk factor associated with clearing land for palm oil production. The index on future impact emphasizes the area of remaining environmental value, such as the area of peatlands or the area of primary forest present in a mill’s sourcing area. Indicators of the past rate of tree cover loss and fire activity are included, given that past trends can suggest the likelihood of future tree cover loss or fires; preliminary research indicates that the best predictor of tree cover loss in a year is the rate of tree cover loss that occurred in the two previous years.15
Indicator CalculationsEach past indicator is assessed based on activity between 2009 and 2012. The 2009 cutoff date was chosen to correspond with common cutoffs used in company com-mitments, certification schemes, and multi-stakeholder agreements including the Consumer Goods Forum and the Roundtable for Sustainable Palm Oil.
For indicators of future impacts, each indicator is calculated as a proportion of the area within the mill sourcing area. The indicator on the rate of tree cover loss is calculated as an average rate of loss over the previous two years of
Table 2 | Indices of Deforestation Impact (50 km Radius around a Mill)
available tree cover loss data, as measured in hectares per year. If the risk assessment is run for 2015, the previous two years will include 2013 and 2014. The same calculations will be applied for the rate of fire activity in the previous two years. In future use of this methodology, recent behavior will refer to the two years prior to the present year, while past behavior will continue to extend to 2009.
2.1 Assigning ScoresThe methodology calculates the average value of each indicator for the full mill set, then assesses how far above or below the average level of risk a particular mill, or set of mills, falls on each indicator. Using standard deviations, 95 percent of all mills will fall within two standard devia-tions above or below the average of each indicator. Based on where a mill falls within that range, it is assigned a score and a rank. Mills far below average are given a score of 1 (the lowest possible risk) and ranked “low” as shown in Table 3, while mills far above average are given a score of 5 and ranked “high risk.” If the value for any indicator is zero, in the case that indicator is automatically given a score of 1 and ranked as low.
INDEX 1: PAST IMPACTS (2009–2012) INDEX 2: POTENTIAL FOR FUTURE IMPACT (2013–2014)
Rate of tree cover loss Proportion of area in primary forest
Tree cover loss in primary forest Proportion of area in peatland
Tree cover loss in peatlands Proportion of area in protected areas
Tree cover loss in protected areas Proportion of area of high carbon density
Tree cover loss in carbon-dense areas Rate of fire activity in previous two years
Rate of fire activity Rate of tree cover loss in previous two years
RAW VALUES (Z SCORES) SCORES LEGEND
1 or greater 5 High
.5 to .99 4 Medium High
−.49 to −.49 3 Medium
−.5 to −.99 2 Medium Low
−1 or lower 1 Low
Table 3 | Risk-Scoring System for Indicators
6 |
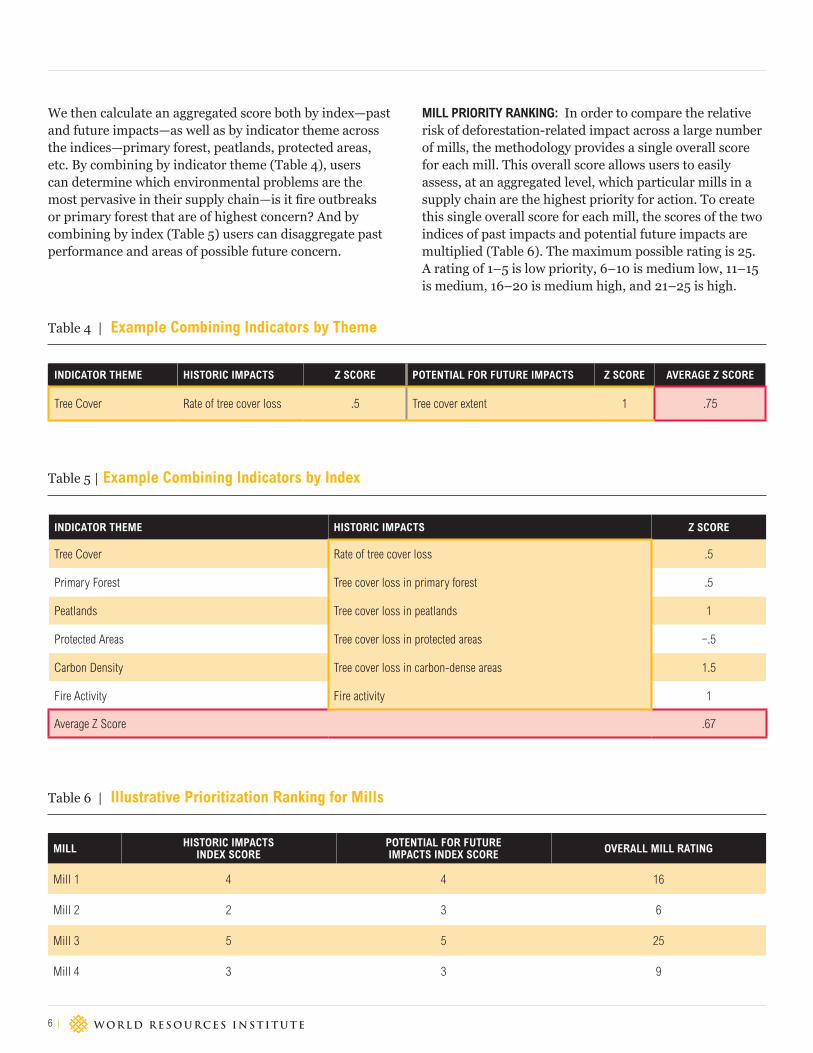
We then calculate an aggregated score both by index—past and future impacts—as well as by indicator theme across the indices—primary forest, peatlands, protected areas, etc. By combining by indicator theme (Table 4), users can determine which environmental problems are the most pervasive in their supply chain—is it fire outbreaks or primary forest that are of highest concern? And by combining by index (Table 5) users can disaggregate past performance and areas of possible future concern.
Table 4 | Example Combining Indicators by Theme
Table 5 | Example Combining Indicators by Index
INDICATOR THEME HISTORIC IMPACTS Z SCORE POTENTIAL FOR FUTURE IMPACTS Z SCORE AVERAGE Z SCORE
Tree Cover Rate of tree cover loss .5 Tree cover extent 1 .75
MILL PRIORITY RANKING: In order to compare the relative risk of deforestation-related impact across a large number of mills, the methodology provides a single overall score for each mill. This overall score allows users to easily assess, at an aggregated level, which particular mills in a supply chain are the highest priority for action. To create this single overall score for each mill, the scores of the two indices of past impacts and potential future impacts are multiplied (Table 6). The maximum possible rating is 25. A rating of 1–5 is low priority, 6–10 is medium low, 11–15 is medium, 16–20 is medium high, and 21–25 is high.
INDICATOR THEME HISTORIC IMPACTS Z SCORE
Tree Cover Rate of tree cover loss .5
Primary Forest Tree cover loss in primary forest .5
Peatlands Tree cover loss in peatlands 1
Protected Areas Tree cover loss in protected areas −.5
Carbon Density Tree cover loss in carbon-dense areas 1.5
Fire Activity Fire activity 1
Average Z Score .67
MILL HISTORIC IMPACTS INDEX SCORE
POTENTIAL FOR FUTURE IMPACTS INDEX SCORE OVERALL MILL RATING
Mill 1 4 4 16
Mill 2 2 3 6
Mill 3 5 5 25
Mill 4 3 3 9
Table 6 | Illustrative Prioritization Ranking for Mills

TECHNICAL NOTE | June 2016 | 7
PALM RISK ASSESSMENT METHODOLOGY: PRIORITIZING AREAS, LANDSCAPES, AND MILLS
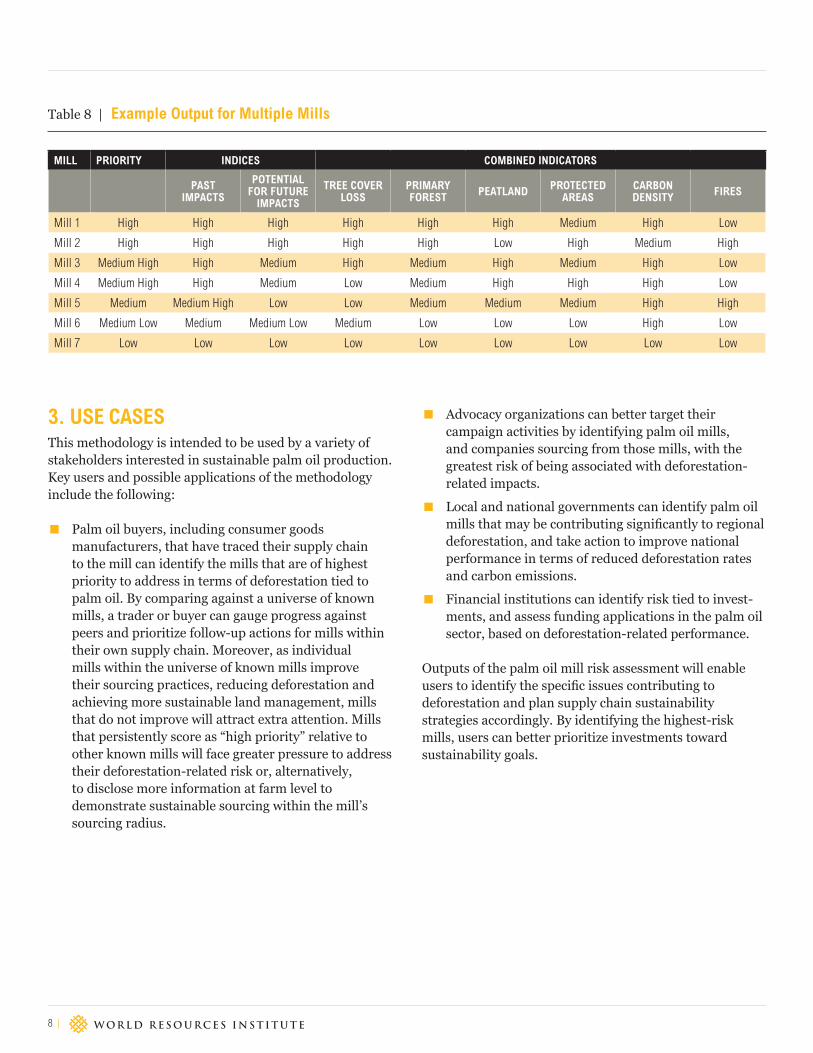
2.2 OutputThe results of the assessment are provided in a table for each mill, a table summarizing all mills analyzed, and a map showing the distribution of mills, color-coded by rank (Table 7). When applied to a set of mills, aggregate
analysis will be displayed for the entire mill data set, (Table 5 and Table 8). These tables allow users to view risk and priority across all mills within a company's supply chain.
Table 7 | Mill Results
MILL PRIORITY RATING: MEDIUM HIGH (SCORE OF 18) Past Impacts: High Risk Potential for Future Impacts: Medium Risk
PAST IMPACTS: HIGH POTENTIAL FOR FUTURE IMPACTS: MEDIUM
INDICATOR RANK AMOUNT INDICATOR RANK AMOUNT
Rate of tree cover loss High X ha lost/yearRate of tree cover loss last two years
Medium X ha lost/year
Tree cover loss on primary forest Medium X ha of primary forest lost Area in primary forest LowX % of total area comprised of primary forest
Tree cover loss on peat High X ha of peat area lost Area in peat MediumX % of total area comprised of peat
Tree cover loss on protected areas Low X ha of protected area lost Area in protected areas MediumX % of total area comprised of protected areas
Tree cover loss on carbon dense areas
High X ha of carbon dense area lost Area of high carbon density HighX % of total area comprised of carbon dense areas
Fire activity High # fires/ha/yearRate of fire activity last two years
Medium # fires/ha/year
COMBINED INDICATOR RANK
Tree cover Medium High
Primary Forest Medium Low
Peatland Medium High
Protected Areas Low
Carbon Density High
Fire High
8 |
3. USE CASESThis methodology is intended to be used by a variety of stakeholders interested in sustainable palm oil production. Key users and possible applications of the methodology include the following:
▪ Palm oil buyers, including consumer goods manufacturers, that have traced their supply chain to the mill can identify the mills that are of highest priority to address in terms of deforestation tied to palm oil. By comparing against a universe of known mills, a trader or buyer can gauge progress against peers and prioritize follow-up actions for mills within their own supply chain. Moreover, as individual mills within the universe of known mills improve their sourcing practices, reducing deforestation and achieving more sustainable land management, mills that do not improve will attract extra attention. Mills that persistently score as “high priority” relative to other known mills will face greater pressure to address their deforestation-related risk or, alternatively, to disclose more information at farm level to demonstrate sustainable sourcing within the mill’s sourcing radius.
Table 8 | Example Output for Multiple Mills
MILL PRIORITY INDICES COMBINED INDICATORS
PAST IMPACTS
POTENTIAL FOR FUTURE
IMPACTS
TREE COVER LOSS
PRIMARY FOREST PEATLAND PROTECTED
AREASCARBON DENSITY FIRES
Mill 1 High High High High High High Medium High Low
Mill 2 High High High High High Low High Medium High
Mill 3 Medium High High Medium High Medium High Medium High Low
Mill 4 Medium High High Medium Low Medium High High High Low
Mill 5 Medium Medium High Low Low Medium Medium Medium High High
Mill 6 Medium Low Medium Medium Low Medium Low Low Low High Low
Mill 7 Low Low Low Low Low Low Low Low Low
▪ Advocacy organizations can better target their campaign activities by identifying palm oil mills, and companies sourcing from those mills, with the greatest risk of being associated with deforestation-related impacts.
▪ Local and national governments can identify palm oil mills that may be contributing significantly to regional deforestation, and take action to improve national performance in terms of reduced deforestation rates and carbon emissions.
▪ Financial institutions can identify risk tied to invest-ments, and assess funding applications in the palm oil sector, based on deforestation-related performance.
Outputs of the palm oil mill risk assessment will enable users to identify the specific issues contributing to deforestation and plan supply chain sustainability strategies accordingly. By identifying the highest-risk mills, users can better prioritize investments toward sustainability goals.

TECHNICAL NOTE | June 2016 | 9
PALM RISK ASSESSMENT METHODOLOGY: PRIORITIZING AREAS, LANDSCAPES, AND MILLS
4. MITIGATING FACTORS AND OVERALL LIMITATIONSThe risk assessment results reflect estimates using best available regional and global data. Other factors excluded from the methodology may affect the risk rating and prioritization of a mill. In particular, certification of a mill may drastically lower the risk, given that certification schemes require stricter standards, site visits, and verifica-tion according to a set of principles and criteria.16 Defores-tation-related activity may occur in areas around the mill but, if certified, the mill may source from low-impact areas within the radius.17 Similarly, traders and buyers may have completed site assessments of palm oil mills that provide more accurate and timely information than is available from the risk model. If site assessments have been com-pleted that contradict the risk report, the site assessments may better reflect the likelihood of deforestation-related activity. Further, the proposed risk model assumes sourcing from within a 50 km radius around each mill. If a buyer has completed traceability to the plantations supplying the mill, such site-level data provide a more accurate and complete assessment of risk. Future versions of this methodology hope to include the mitigating factors in their scoring and prioritization, as well as to incorpo-rate new data sources as they become available (see Box 2 for full data notes).This analysis can identify the areas in which tree cover loss, fires, and related environmental impacts occur, but cannot directly attribute these activities and impacts to the owners of concession areas or mills. Mill owners are not responsible for all activity within the radii and many radii overlap because of the proximity of mills to one another. Further site-level investigation is required to establish causality.
The method focuses on the risk of deforestation and excludes many other relevant social and environmental risk factors due to lack of readily available data. For example, considerations of human rights, local and indig-enous communities, and social wellbeing are omitted from this approach. Formal analysis of deforestation on high carbon stock (HCS) areas is excluded from this assessment because no methodology exists for mapping HCS areas at a regional or global scale. A coarse-scale assessment of areas with high carbon density is included as indicative of valuable forest areas, but this approach must be refined according to a finalized HCS methodology.
The methodology relies in part on satellite imagery that has known limitations with regard to accuracy. Although satellite data provide the benefit of consistent and low-cost assessment across large areas, in-field verification of activities can provide a more accurate result on a local scale. As such, this tool is best used as a first step in under-standing deforestation impacts and risks, which can be followed by deeper assessments and field work.
Moreover, we do not recommend using the assessment results to exclude suppliers but rather to help prioritize engagement with high-risk producers. Given the growth in domestic markets and emerging economies, a large demand still exists for unsustainable palm oil. If international buyers exclude producers flagged as high risk according to this methodology, those high-risk producers can continue to sell to less sustainable markets. Instead, buyers can work with producers and processors to improve practices and increase the overall supply of sustainable palm oil in global markets.
The scoring and ranking of mills is calculated relative to the mill database created by WRI in partnership with FoodReg. This mill database does not represent all palm oil mills in the world, and thus the resulting scores are shaped by the roughly 800 mills in the WRI database. It is estimated that over 2,000 mills exist globally but, as of the date of this publication, the WRI database is the most complete georeferenced data source for palm oil mills. As more mills are mapped, they will be added to the database.

10 |
Box 2 | Data Notes
Tree cover loss—All tree cover loss is calculated using a tree cover density greater than 30 percent. This is due to data inaccuracies that occur for tree cover at or below a 30 percent density. For a full explanation of the limitations of the tree cover loss data, visit: http://earthenginepartners.appspot.com/science-2013-global-forest/download_v1.2.html
Carbon density—High carbon density areas are defined as areas with above-ground carbon at or above 20 tons of carbon per hectare. This threshold is based on research by Gunarso et al. (2013)19 and draws on 2014 carbon data created by Woods Hole Research Institute.
Fire activity—Only high-confidence fires are used in this analysis. High-confidence fires are more commonly associated with fires used for forest clearance as opposed to smaller-scale fires, such as cook fires or grass-burning fires. High-confidence fires are defined as having brightness equal to or greater than 330 Kelvin and a confidence value greater than 30 percent.20
When data are unavailable—The data layers for peatland and primary forest are available only within Indonesia and Malaysia. When using the risk model outside of these two countries, alternative data layers are substituted. For primary forests, intact forest landscapes are used as a substitute, and for peatlands, high carbon density areas are used as a substitute. These alternative datasets will be used as long as the originally selected datasets remain unavailable globally.
5. CONCLUSIONThis methodology has been designed to address palm oil production. We aim to expand it to address other forest commodities, such as soy and beef, as adequate industry data are made public in coming years. Within the palm oil industry, this risk assessment became possible thanks to the recent release of WRI’s publicly available mill dataset.18 Without the availability of mill data it would be much more difficult, if not impossible, to effectively assess the deforestation risk incurred by traders, buyers, and consumer goods manufacturers in sourcing palm oil. Future advances in the transparency of palm oil mill data will help downstream companies more accurately assess and prioritize engagement with producers in their supply chain to reduce deforestation.
Beyond this methodology, greater transparency of palm oil mill data, as well as farm data, and data on commodity trade flows are essential to address the full deforestation impacts of palm oil. With increased transparency through-out the palm oil sector, various stakeholders can identify the places and companies most closely linked to defor-estation and take the necessary action to protect forest landscapes. Transparency helps to distinguish the leaders from the laggards and illuminates the good practices of companies taking action to eliminate deforestation from their supply chains.
TECHNICAL NOTE | June 2016 | 11
PALM RISK ASSESSMENT METHODOLOGY: PRIORITIZING AREAS, LANDSCAPES, AND MILLS
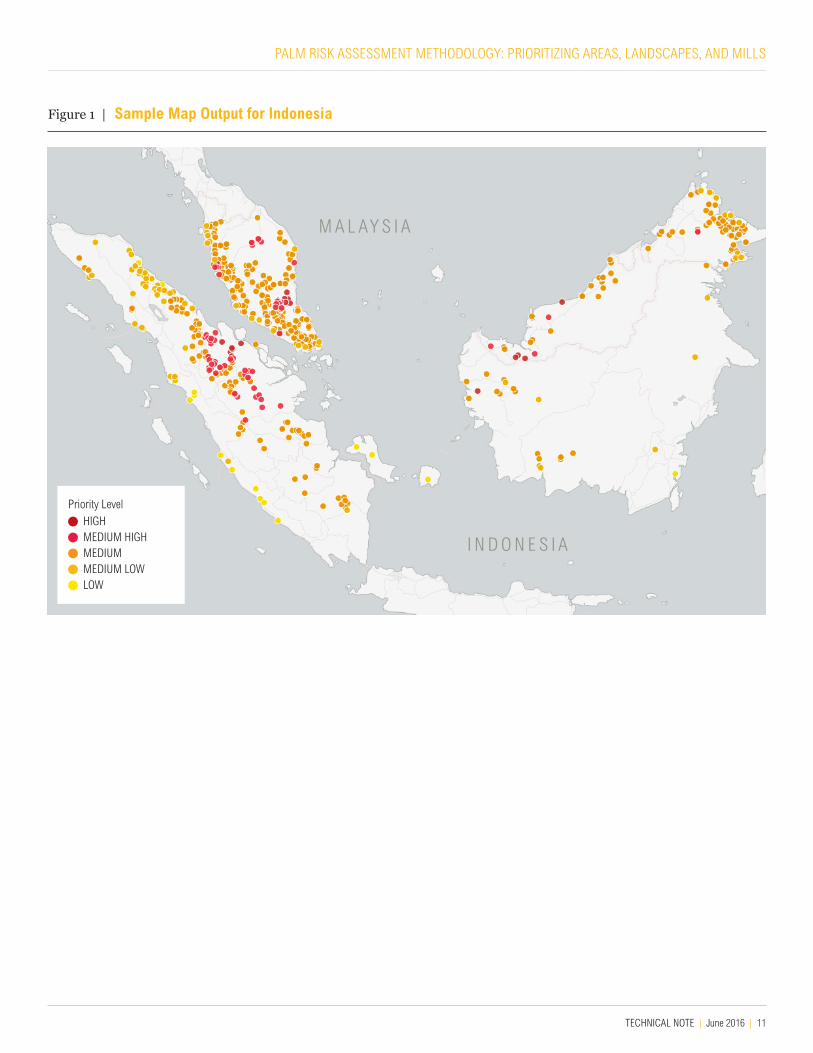
Figure 1 | Sample Map Output for Indonesia
M A L AY S I A
I N D O N E S I A
Priority Level
HIGH MEDIUM HIGH MEDIUM MEDIUM LOW LOW

12 |
GLOSSARYGFW Global Forest Watch
HCS High carbon stock areas
Indicator A measure of impact
Index A collection of indicators
Score The number of standard deviations a value is from the average value
Sourcing area/radius A circle of 50km radius surrounding a mill
Value The numerical calculation of an indicator

TECHNICAL NOTE | June 2016 | 13
PALM RISK ASSESSMENT METHODOLOGY: PRIORITIZING AREAS, LANDSCAPES, AND MILLS
ENDNOTES1. Boucher, D., P. Elias, K. Lininger, C. May-Tobin, S. Roquemore, and
E. Saxon. 2011. “The Root of the Problem: What’s Driving Tropical Deforestation Today?” Cambridge, MA: Union of Concerned Scientists. Available online at: http://www.ucsusa.org/sites/default/files/legacy/assets/documents/global_warming/UCS_RootoftheProblem_DriversofDeforestation_FullReport.pdf.
2. USDA (United States Department of Agriculture). “Major Oilseeds World Supply and Distribution.” Washington, D.C.: USDA, Foreign Agricultural Service. Available online at: http://apps.fas.usda.gov/psdonline/psdReport.aspx?hidReportRetrievalName=Table+01%3a+Major+Oilseeds%3a+World+Supply+and+Distribution+(Commodity+View)&hidReportRetrievalID=531&hidReportRetrievalTemplateID=5.
3. OECD-FAO. 2015. “OECD-FAO Agricultural Outlook 2015–2024.” Paris, France and Rome, Italy: Organisation for Economic Co-operation and Development and Food and Agriculture Organization of the United Nations. Available online at: http://dx.doi.org/10.1787/agr_outlook-2015-8-en.
4. Boucher, D., P. Elias, K. Lininger, C. May-Tobin, S. Roquemore, and E. Saxon. 2011. “The Root of the Problem: What’s Driving Tropical Deforestation Today?” Cambridge, MA: Union of Concerned Scientists. Available online at: http://www.ucsusa.org/sites/default/files/legacy/assets/documents/global_warming/UCS_RootoftheProblem_DriversofDeforestation_FullReport.pdf.
5. FAO Stat. 2012. “Oil Palm Production: Countries by Commodity.” Available online at: faostat.fao.org.
6. FAO Stat. 2014. “Oil Palm: Area Harvested.” Available online at: faostat.fao.org.
7. OECD-FAO. 2015. “OECD-FAO Agricultural Outlook 2015-2024.” Paris, France and Rome, Italy: Organisation for Economic Co-operation and Development and Food and Agriculture Organization of the United Nations. Available online at: http://www.fao.org/fileadmin/templates/est/COMM_MARKETS_MONITORING/Oilcrops/Documents/OECD_Reports/Ch5StatAnnex.pdf.
8. Boucher, D., P. Elias, K. Lininger, C. May-Tobin, S. Roquemore, and E. Saxon. 2011. “The Root of the Problem: What’s Driving Tropical Deforestation Today?” Cambridge, MA: Union of Concerned Scientists. Available online at: http://www.ucsusa.org/sites/default/files/legacy/assets/documents/global_warming/UCS_RootoftheProblem_DriversofDeforestation_FullReport.pdf.
9. Goodman, L., and K. Mulik. 2015. “Clearing the Air: Palm Oil, Peat Destruction, and Air Pollution.” Cambridge, MA: Union of Concerned Scientists. Available online at: http://www.ucsusa.org/sites/default/files/attach/2015/03/clearing-the-air-ucs-2015.pdf.
10. Harris, N., and S. Sargent. 2016. “Destruction of Tropical Peat is an Overlooked Source of Emissions.” Global Forest Watch Blog, April 18. Available online at: http://blog.globalforestwatch.org/2016/04/destruction-of-tropical-peat-is-an-overlooked-source-of-emissions/.
11. Goodman, L., and K. Mulik. 2015. “Clearing the Air: Palm Oil, Peat Destruction, and Air Pollution.” Cambridge, MA: Union of Concerned Scientists. Available online at: http://www.ucsusa.org/sites/default/files/attach/2015/03/clearing-the-air-ucs-2015.pdf.
12. Jones, B., C. Ciciarelli, E. Dinerstein, and M. Anderson. 2015. “Forests Housing Rare and Endangered Species Lost 1.2 Million Hectares of Trees Since 2001.” Global Forest Watch Blog, May 6. Available online at: http://blog.globalforestwatch.org/2015/05/forests-housing-rare-and-endangered-species-lost-1-2-million-hectares-of-trees-since-2001/.
13. World Wildlife Fund. 2016. “Endangered Species Threatened by Unsustainable Palm Oil Production.” Washington, D.C.: WWF. Available online at: http://www.worldwildlife.org/stories/endangered-species-threatened-by-unsustainable-palm-oil-production.
14. Morton, D., R. DeFries, J. T. Randerson, L. Giglio, W. Schroeder, and G. van der Werf. 2008. Agricultural intensification increases deforestation fire activity in Amazonia. Global Change Biology 14:2262-2276.
15. Daemeter Consulting. 2016. Email communication to WRI from Daemeter Consulting in Bogor, Indonesia.
16. Roundtable for Sustainable Palm Oil. 2014. “RSPO Principles and Criteria for the Production of Sustainable Palm Oil.” Kuala Lumpur, Malaysia: RSPO.
17. See, for example, The Forest Trust “An Approach for Transforming the Palm Oil Industry.” Nyon, Switzerland: The Forest Trust. Available online at: http://www.tft-earth.org/wp-content/uploads/2014/05/TFT_Lessons_Learned_in_Palm_Oil_2013.pdf.
18. WRI Mill Dataset. http://data.globalforestwatch.org/datasets/ed8d5951b2a4482a9e62c4fe0bc23b5f_27. Additional information on the data available at: http://www.wri.org/blog/2015/12/palm-oil-mill-data-step-towards-transparency.
19. Gunarso, P., M.E. Hartoyo, F. Agus & T.J. Killeen. 2013. Oil palm and land use change in Indonesia, Malaysia and Papua New Guinea. In: Killeen, T.J. & J. Goon (eds.). 2013. Reports from the Technical Panels of the 2nd Greenhouse Gas Working Group of the Roundtable on Sustainable Palm Oil (RSPO). RSPO, Kuala Lumpur, Malaysia.
20. Morton, D.C., R.S. Defries, J.T. Randerson, L. Giglio, W. Schroeder, and G.R. Van Der Werf. 2008. “Agricultural Intensification Increases Deforestation Fire Activity in Amazonia.” Global Change Biology, 14(10): 2262–2275.
Copyright 2016 World Resources Institute. This work is licensed under the Creative Commons Attribution 4.0 International License. To view a copy of the license, visit http://creativecommons.org/licenses/by/4.0/
10 G Street, NE | Washington, DC 20002 | www.WRI.org
GLOBAL FOREST WATCH CLIMATE: SUMMARY OF METHODS AND DATA
ABOUT WRI World Resources Institute is a global research organization that turns big ideas into action at the nexus of environment, economic opportunity and human well-being.
Our ChallengeNatural resources are at the foundation of economic opportunity and human well-being. But today, we are depleting Earth’s resources at rates that are not sustainable, endangering economies and people’s lives. People depend on clean water, fertile land, healthy forests, and a stable climate. Livable cities and clean energy are essential for a sustainable planet. We must address these urgent, global challenges this decade.
Our VisionWe envision an equitable and prosperous planet driven by the wise manage-ment of natural resources. We aspire to create a world where the actions of government, business, and communities combine to eliminate poverty and sustain the natural environment for all people.
Our ApproachCOUNT ITWe start with data. We conduct independent research and draw on the latest technology to develop new insights and recommendations. Our rigorous analysis identifies risks, unveils opportunities, and informs smart strategies. We focus our efforts on influential and emerging economies where the future of sustainability will be determined.
CHANGE ITWe use our research to influence government policies, business strategies, and civil society action. We test projects with communities, companies, and government agencies to build a strong evidence base. Then, we work with partners to deliver change on the ground that alleviates poverty and strength-ens society. We hold ourselves accountable to ensure our outcomes will be bold and enduring.
SCALE ITWe don’t think small. Once tested, we work with partners to adopt and expand our efforts regionally and globally. We engage with decision-makers to carry out our ideas and elevate our impact. We measure success through government and business actions that improve people’s lives and sustain a healthy environment.
ABOUT THE AUTHORSSarah Lake is a Research Associate with Global Forest Watch Commodities.
Contact: [email protected]
Anne Rosenbarger is the Southeast Asia Commodities Engagement Manager for Global Forest Watch Commodities.
Contact: [email protected]
Caroline Winchester is a Research Assistant with Global Forest Watch Commodities.
Contact: [email protected]
ACKNOWLEDGMENTSThis publication was made possible by the World Resources Institute’s Forests Program and the Global Forest Watch Partnership. The authors would like to thank the following people for their insight, review, and assistance: Sarah Sargent, Fred Stolle, Crystal Davis, Andika Putraditama, Lyndsey Dowell, Jane Lloyd, Ryan Sarsfield, Elizabeth Baer, Rachael Petersen, Paul Reig, Samantha Putt del Pino, Gary Paoli, Mike Senior, Veronique Bovee, Anders Lindhe, Sarah Mann, Karla Renschler, Octavia Payne, and James Anderson.