Embed Size (px)
Citation preview

Paling Yards Wind Farm
Noise Impact Assessment
Report Number 640.10127-R1
18 December 2014
Union Fenosa Wind Australia Pty Ltd
Suite 403, 68 York Street
Sydney NSW 2000
Version: Revision 5

Union Fenosa Wind Australia Pty Ltd Paling Yards Wind Farm Noise Impact Assessment
Report Number 640.10127-R1 18 December 2014
Revision 5 Page 2
SLR Consulting Australia Pty Ltd
Paling Yards Wind Farm
Noise Impact Assessment
PREPARED BY:
SLR Consulting Australia Pty Ltd ABN 29 001 584 612
Suite 6, 131 Bulleen Road Balwyn North VIC 3104 Australia
T: 61 3 9249 9400 F: 61 3 9249 9499
E: [email protected] www.slrconsulting.com
DOCUMENT CONTROL
Reference Status Date Prepared Checked Authorised
640.10127-R1 Revision 5 18 December 2014 Philip Setton Gustaf Reutersward Gustaf Reutersward
640.10127-R1 Revision 4 7 October 2014 Philip Setton Gustaf Reutersward Gustaf Reutersward
640.10127-R1 Revision 3 20 November 2012 Philip Setton Gustaf Reutersward Gustaf Reutersward
640.10127-R1 Revision 2 19 November 2012 Philip Setton Gustaf Reutersward Gustaf Reutersward
640.10127-R1 Revision 1 9 November 2012 Philip Setton Gustaf Reutersward Gustaf Reutersward
640.10127-R1 Revision 0 8 November 2012 Philip Setton Gustaf Reutersward Gustaf Reutersward

Union Fenosa Wind Australia Pty Ltd Paling Yards Wind Farm Noise Impact Assessment
Report Number 640.10127-R1 18 December 2014
Revision 5 Page 3
EXECUTIVE SUMMARY
SLR Consulting Australia Pty Ltd
SLR Consulting Australia Pty Ltd (SLR Consulting) has completed a noise impact assessment of
Paling Yards Wind Farm. The methodology and criteria used in the assessment are supported by the
South Australian Environmental Protection Authority (SA EPA) Environment Noise Guidelines for Wind Farms (February 2003), World Health Organization (WHO) limits, construction noise guidelines (DECC Interim Construction Noise Guideline 2009) and blasting impact.
Simultaneous noise monitoring and wind monitoring was conducted at 8 locations during the period 7
th June 2011 through to 24
th June 2011 to determine baseline conditions and establish criteria for
surrounding residential receivers.
Noise predictions were made for receptors within a 6 km of a proposed WTG. WTG noise has been predicted using an indicative layout of 59 WTG’s and an assumed mix of 3 turbine types and assessed against relevant criteria prescribed by the SA EPA Guideline and World Health Organisation (WHO) goals where appropriate.
The final layout submitted for approval consists of 55 WTG’s after the removal of turbines P2, P6, P7 and P11 for ecological considerations. The removed turbines were not close to any of the assessment receptors and therefore the 59 WTG layout considered in this Noise Impact Assessment is sufficiently representative and perhaps slightly conservative at locations to the west of the wind farm.
All non-project involved receptors were found to be below the relevant noise criteria. Some project involved receptors are predicted to slightly exceed the WHO noise criteria, however, these locations are used for a very limited part of the year only and it is proposed to enter into a noise agreement regulating their use and that these will not be used should post construction noise testing definitively show an exceedance of the criteria.
The project is yet to select and finalise the WTG layout and WTG makes/models. Upon finalising the layout and WTG models a revised noise prediction and assessment will be completed in which the noise impact mitigation techniques listed in Section 9.3 will be investigated thoroughly to produce a fully compliant layout.
WTG vibration levels have been evaluated and based upon overseas research available were found to be acceptable.
Construction noise and vibration impacts have been assessed and the ‘worst case’ scenarios modelled were found to be generally acceptable.
Blasting impact has been assessed and found to be acceptable. With a maximum instantaneous charge (MIC) of up to 20 kg, the airblast overpressure is anticipated to be below the acceptable level of 115 dB Linear for all existing residences. Similarly, vibration levels are anticipated to be well below the acceptable criteria.
Construction traffic noise impact has been assessed and the ‘worst case’ maximum construction traffic generated scenario would increase existing traffic noise levels along local roads by up to 4-7 dBA but due to the typically large setback of dwellings from the road network would result in noise level that would be considered acceptable under the ECRTN and RNP.
Subsequent to a request by the Department of Planning, due consideration has been paid to a number of the additional requirements of the proposed Draft NSW Planning Guidelines Wind Farms – Appendix B: NSW Wind Farm Noise Guidelines released in December 2011. These include consideration to separate daytime and night-time periods and alternative methods of evaluation for Special Audible Character.

Union Fenosa Wind Australia Pty Ltd Paling Yards Wind Farm Noise Impact Assessment
Report Number 640.10127-R1 18 December 2014
Revision 5 Page 4
TABLE OF CONTENTS
SLR Consulting Australia Pty Ltd
1 INTRODUCTION ............................................................................................................................ 8
2 THE PROJECT .............................................................................................................................. 8
3 WIND FARM ASSESSMENT METHODOLOGY ........................................................................... 9
3.1 Acceptability Limit Criteria .................................................................................................... 9
3.2 Wind Farm Noise Level Prediction....................................................................................... 9
3.3 Ambient Noise Monitoring .................................................................................................... 9
3.4 Assessment Procedure ......................................................................................................10
4 ENVIRONMENTAL NOISE CRITERIA ........................................................................................11
4.1 Introduction ........................................................................................................................11
4.2 Applicable Noise Policies and Guidelines ..........................................................................11
4.3 SA EPA Wind Farm Noise Guidelines ...............................................................................12
4.4 NSW Industrial Noise Policy (INP) .....................................................................................13
4.5 World Health Organisation Guidelines ...............................................................................14
4.6 Construction Noise Guidelines ...........................................................................................15
4.7 Vibration Guidelines ...........................................................................................................16
4.8 Blasting Criteria ..................................................................................................................17
4.9 Traffic Noise .......................................................................................................................18
5 GENERAL SITE DESCRIPTION .................................................................................................19
5.1 Characteristics of the site ...................................................................................................19
5.2 Dwelling Locations .............................................................................................................20
6 PROPOSED WIND FARM LAYOUT ............................................................................................22
6.1 WTG Type and Details .......................................................................................................22
6.2 Assessment of Tonality and Infrasound .............................................................................23
7 OPERATION NOISE LEVELS .....................................................................................................24
7.1 Introduction ........................................................................................................................24
7.2 Wind Turbine Noise ...........................................................................................................24
7.3 Vestas V112 Detailed Tonality assessment ......................................................................27

Union Fenosa Wind Australia Pty Ltd Paling Yards Wind Farm Noise Impact Assessment
Report Number 640.10127-R1 18 December 2014
Revision 5 Page 5
TABLE OF CONTENTS
SLR Consulting Australia Pty Ltd
8 BACKGROUND LEVELS AND NOISE LIMITS ...........................................................................28
8.1 Measurement Locations .....................................................................................................28
8.2 Measurement Details .........................................................................................................30
8.3 Night Period Analysis .........................................................................................................31
8.5 Location 9 – Paling Yards ..................................................................................................32
8.6 Location 8 – Quobleigh ......................................................................................................33
8.7 Location 7 – Mingary Park .................................................................................................34
8.8 Location 4 – Lucas Grove ..................................................................................................35
8.9 Location 6 ...........................................................................................................................36
8.10 Location 115 – Maxwelton .................................................................................................37
8.11 Location 128 .......................................................................................................................38
8.12 Location 10 .........................................................................................................................39
9 ACOUSTIC ASSESSMENT OF PROPOSED WIND FARM ........................................................40
9.1 Atmospheric stability and wind profile ................................................................................41
9.2 Temperature Inversions .....................................................................................................41
9.3 Adaptive Management .......................................................................................................42
9.4 Wind Turbine Vibration ......................................................................................................42
9.4.1 Ground borne.........................................................................................................42
9.4.2 Air borne ................................................................................................................43
9.5 Substation Transformer Noise Levels ................................................................................43
9.6 Transmission Line Noise (Corona Noise) ..........................................................................44
10 NSW DRAFT WIND FARM GUIDELINES ...................................................................................45
10.1 Daytime vs. Night-time Background Noise ........................................................................45
10.2 Special Audible Characteristics .........................................................................................46
10.2.1 Low Frequency Noise ............................................................................................46
10.2.2 Tonality ..................................................................................................................46
10.2.3 Amplitude Modulation ............................................................................................46
11 ASSESSMENT OF CONSTRUCTION NOISE & VIBRATION LEVELS ......................................48
11.1 Project Construction Noise ................................................................................................48
11.2 Ambient Background Noise Levels ....................................................................................48

Union Fenosa Wind Australia Pty Ltd Paling Yards Wind Farm Noise Impact Assessment
Report Number 640.10127-R1 18 December 2014
Revision 5 Page 6
TABLE OF CONTENTS
SLR Consulting Australia Pty Ltd
11.3 Noise Modelling Parameters ..............................................................................................49
11.4 Normal Working Hours Operation ......................................................................................50
11.5 Outside Normal Operating Hours Operation ......................................................................50
11.5.1 Concrete Batching Plants ......................................................................................51
11.6 Construction Vibration Assessment ...................................................................................51
11.7 Blasting ..............................................................................................................................52
11.7.1 Blasting Assessment .............................................................................................52
11.8 Traffic Noise .......................................................................................................................53
11.8.1 Night-time deliveries ..............................................................................................53
12 CONCLUSION .............................................................................................................................54
13 CLOSURE ....................................................................................................................................54
TABLES
Table 1 WHO Guideline values for environmental noise in specific environments 14 Table 2 Noise at Residences Using Quantitative Assessment 15 Table 3 Preferred and maximum values for continuous and impulsive vibration 16 Table 4 Blast Emission Building Damage Assessment Criteria (AS 2187) 17 Table 5 Road Traffic Noise Criteria 18 Table 6 Surrounding Receivers (Map Datum and Coordinate System Zone 55, GDA94) 21 Table 7 WTG Manufacturers Data 22 Table 8 WTG Sound Power Curves 22 Table 9 Audible tonality assessment to IEC 61400-11 23 Table 10 WTG LAeq noise level (dBA) at Vref,10m = 8 m/s, V100m = 11.5m/s 24 Table 11 Measurement Locations 28 Table 12 Wind mast details 30 Table 13 Measurement Details for each Location 30 Table 14 Noise Criteria Exceedances 40 Table 15 Predicted ‘worst case’ 200 MVA switching substation noise 44 Table 16 Background Noise Regression Curves and Correlation Coefficient 45 Table 17 NSW Draft Wind Farm Guidelines Exceedances – Night-time Criteria 45 Table 18 Summary of Rating Background Levels (RBL’s) for Monitoring Locations 48 Table 19 Typical Construction Equipment 49 Table 20 Construction Noise Levels – Noise Affected Receivers 50 Table 21 Night Construction Noise Levels – Noise Affected Receivers 50 Table 22 Concrete Batch Plant Noise Level Prediction 51 Table 23 Typical Vibration Emission Levels from Construction Plant 52 Table 24 Construction Traffic Noise 53

Union Fenosa Wind Australia Pty Ltd Paling Yards Wind Farm Noise Impact Assessment
Report Number 640.10127-R1 18 December 2014
Revision 5 Page 7
TABLE OF CONTENTS
SLR Consulting Australia Pty Ltd
FIGURES
Figure 1 Location of proposed Paling Yards Wind Farm 19 Figure 2 Dwelling Locations and Indicative WTG Layout 20 Figure 3 Predicted Noise Levels Contour Map, LAeq, vref=8m/s 26 Figure 4 Paling Yards Measurement Location 32 Figure 5 Background Noise Measurements and Noise Criteria Curve – Location 9 32 Figure 6 Quobleigh Background Noise Measurement Location 33 Figure 7 Background Noise Measurements and Noise Criteria Curve – Location 8 33 Figure 8 Mingary Park Background Noise Measurement Location 34 Figure 9 Background Noise Measurements and Noise Criteria Curve – Location 7 34 Figure 10 Lucas Grove Background Noise Measurement Location 35 Figure 11 Background Noise Measurements and Noise Criteria Curve – Location 4 35 Figure 12 Location 6 Background Noise Measurement Location 36 Figure 13 Background Noise Measurements and Noise Criteria Curve – Location 6 36 Figure 14 Maxwelton Background Noise Measurement Location 37 Figure 15 Background Noise Measurements and Noise Criteria Curve – Location 115 37 Figure 16 Location 128 Background Noise Measurement Location 38 Figure 17 Background Noise Measurements and Noise Criteria Curve – Location 128 38 Figure 18 Location 10 Background Noise Measurement Location 39 Figure 19 Background Noise Measurements and Noise Criteria Curve – Location 10 39 Figure 20 Concrete Batching Plant Location 51
APPENDICES
Appendix A Assessment graphs Appendix B WTG Sound Power Data Appendix C Distances to Turbines Appendix D Acoustic Terminology Appendix E Turbine Coordinates and Type Allocation Table Appendix F Background Noise Monitoring Appendix G NSW Draft Wind Farm Guidelines Analysis

Union Fenosa Wind Australia Pty Ltd Paling Yards Wind Farm Noise Impact Assessment
Report Number 640.10127-R1 18 December 2014
Revision 5 Page 8
SLR Consulting Australia Pty Ltd
1 INTRODUCTION
SLR Consulting Australia Pty Ltd (SLR Consulting), has been engaged by Union Fenosa Wind Australia Pty Ltd (Union Fenosa) as the acoustical consultants for the proposed Paling Yards Wind Farm.
This report describes the methodology and findings of the Noise Impact Study (NIS) for the proposed Paling Yards Wind Farm forming part of the Environmental Impact Assessment for the proposed project.
Detailed in this report are the main aspects of the proposed wind farm project, the acoustic criteria, the background noise measurements and the predicted noise levels at all potentially impacted receivers from the operation of the proposed wind farm. It also addresses the acoustic impact of the wind farm during the construction phase, including blasting and transportation noise.
2 THE PROJECT
The proposed Paling Yards Wind Farm will comprise a number of elements, including:
Up to 55 individual wind turbines, although a 59 WTG layout is evaluated in this Noise Impact Assessment;
Internal unsealed tracks for turbine access;
Upgrades to local road infrastructure;
An underground electrical and communication cable network linking turbines to each other and the proposed substation;
A temporary concrete batching plant to supply concrete for the foundations of the turbines and other associated structures;
Potential for obstacle lighting to selected turbines;
Removal of small portions of native vegetation within the site and en route to the substation;
A wind farm and substation control room and facilities building;
An electrical substation and overland connection to the transmission line; and
A connection to the Mt Piper to Bannaby 500 kV transmission line which bypasses the north and east of the site.
A full description of the Wind Farm layout, including all turbine and receptor locations, can be found in Section 5.

Union Fenosa Wind Australia Pty Ltd Paling Yards Wind Farm Noise Impact Assessment
Report Number 640.10127-R1 18 December 2014
Revision 5 Page 9
SLR Consulting Australia Pty Ltd
3 WIND FARM ASSESSMENT METHODOLOGY
3.1 Acceptability Limit Criteria
The methodology and acceptability limit criteria that have been applied to this study are based upon the South Australia Environment Protection Authority (SA EPA) Noise Guidelines for Wind Farms (February 2003) (SA EPA Guidelines). The principal acceptability limit criteria is that the wind farm LA90(10 min) noise should not exceed the greater of an amenity limit of 35 dBA or the pre-existing background noise by more than 5 dBA (for any given wind speed).
The project requirements and wind farm acceptability limit criteria are discussed in more detail in Section 7.3.
3.2 Wind Farm Noise Level Prediction
The noise emission model used in this study to predict wind farm noise levels at sensitive receptors is based on ISO 9613-2:1996 as implemented in the SoundPLAN computer noise model. The model predicts noise levels through spherical spreading and includes the effect of air absorption (as per ISO 9613), ground attenuation and shielding.
Predicted LAeq noise levels were calculated based upon sound power levels determined in accordance to the recognised standard IEC-61400-11:2002 (Wind Turbine Generator Systems - Part 11: Acoustic Noise Measurement Techniques), where available,
for the wind range 6 to 10 m/s.
The noise character of Wind Turbine Generator (WTG) noise emissions is also assessed for any special audible characteristics, such as tonality or low frequency content, which would be deemed more annoying or offensive. If characteristics such as tonality are identified then the predicted noise level would be penalised by the addition of 5 dBA. It should be noted that the characteristic noise level modulation of WTGs, commonly referred to as ‘swish’, is considered to be a fundamental part of wind farm noise and is taken into account by the SA EPA Guideline assessment procedure.
3.3 Ambient Noise Monitoring
In order to establish the intrusive noise limit, background noise monitoring is required to establish the pre-existing ambient noise environment as a function of wind speed. As wind speed increases the ambient noise level at most receivers generally also increases as natural sources such as wind in trees begin to dominate. The variation of background noise with wind speed is usually quite site specific and related to various physical characteristics such as topographic shielding and the extent and height of exposed vegetation.
Noise monitoring is completed for a period of approximately 2 weeks and correlated to synchronous wind speed and direction data at the wind farm monitoring mast. The captured data is screened for validity, with data monitored during periods of rain or where the average wind speed at the microphone position likely exceeded 5 m/s being discarded from the data set. Other data that was obviously affected by external noise sources (eg. pond pumps, grass mowing, birds at dawn, frogs etc) was also removed from the data set. A regression analysis of all valid data is used to determine a line of ‘best fit’ from which the noise limit is established.

Union Fenosa Wind Australia Pty Ltd Paling Yards Wind Farm Noise Impact Assessment
Report Number 640.10127-R1 18 December 2014
Revision 5 Page 10
SLR Consulting Australia Pty Ltd
3.4 Assessment Procedure
In general, the assessment procedure contains the following steps:
1 Predict and plot the LAeq 35 dBA noise level contour from the wind farm under reference conditions. Receivers outside the contour are considered to be within acceptable wind farm noise levels.
2 Establish the pre-existing background noise level at each of the relevant assessment receivers within the LAeq 35 dBA noise level contour through background noise monitoring.
3 Predict wind farm noise levels at all relevant assessment receivers for the wind range from cut-in of the WTG to approximately 10 m/s.
4 Assess the acceptability of wind farm noise at each relevant assessment receiver to the established limits.
In addition, where the assessment of a receiver has predicted unacceptable wind farm noise levels, a process of noise mitigation and alternative wind farm layouts is considered and Steps 3 and 4 are repeated until an acceptable arrangement is developed.
A brief explanation and description of the acoustic terminology used in this report is included in Appendix D.

Union Fenosa Wind Australia Pty Ltd Paling Yards Wind Farm Noise Impact Assessment
Report Number 640.10127-R1 18 December 2014
Revision 5 Page 11
SLR Consulting Australia Pty Ltd
4 ENVIRONMENTAL NOISE CRITERIA
4.1 Introduction
The New South Wales (NSW) Government Department of Planning and Infrastructure (DPI) has issued information on the required inputs into the Environmental Assessment (EA). The environmental assessment requirements issued by the Director-General (DGRs) in relation to the noise impacts of the proposed Paling Yard Wind Farm are as follows:
Include a comprehensive noise assessment of all phases and components of the project including, but not limited to turbine operation, the operation of the electrical substation, corona and/or Aeolian noise from the transmission line, construction noise (focusing on high noise-generating activities and any works proposed outside of standard construction hours), traffic noise during construction and operation, and vibration generating activities (including blasting) during construction and/or operation. The assessment must identify noise/vibration sensitive locations (including approved but not yet developed dwellings), baseline conditions based on monitoring results, the levels and character of noise (eg tonality, impulsiveness etc) generated by noise sources, noise/vibration criteria, modelling assumptions and worst case and representative noise/vibration impacts;
In relation to wind turbine operation, determine the noise impacts under operating meteorological conditions (ie wind speeds from cut in to rated power), including impacts under meteorological conditions that exacerbate impacts (including varying atmospheric stability classes and the Van den Berg effect for wind turbines). The probability of such occurrences must be quantified;
Include monitoring to ensure that there is adequate wind speed/profile data and ambient background noise data that is representative for all sensitive receptors;
Provide justification for the nominated average background noise level used in the assessment process, considering any significant difference between day time and night time background noise levels;
Identify any risks with respect to low frequency or infra-noise;
If any noise agreements with residents are proposed for areas where noise criteria cannot be met, provide sufficient information to enable a clear understanding of what has been agreed and what criteria have been used to frame any such agreements;
Clearly outline the noise mitigation, monitoring and management measures that would be applied to the project. This must include an assessment of the feasibility, effectiveness and reliability of the proposed measures and any residual impacts after these measures have been incorporated; and
Include a contingency strategy that provides for additional noise attenuation should higher noise levels than those predicted result following commissioning and/or noise agreements with landowners not eventuate.
The assessment must be undertaken consistent with the following guidelines for each aspect of the project.
4.2 Applicable Noise Policies and Guidelines
To address the DGR’s, this report assesses the proposed Paling Yards Wind Farm against the requirements of each of the following:
Wind Turbines - the South Australian Environment Protection Authority’s Wind Farms - Environmental Noise Guidelines (2003);
Electrical Substation – NSW Industrial Noise Policy (EPA 2000)
Site Establishment and Construction – Interim Construction Noise Guidelines (DECC, 2009);
Traffic Noise – Environmental Criteria for Road Traffic Noise (NSW EPA, 1999); and

Union Fenosa Wind Australia Pty Ltd Paling Yards Wind Farm Noise Impact Assessment
Report Number 640.10127-R1 18 December 2014
Revision 5 Page 12
SLR Consulting Australia Pty Ltd
Vibration – Assessing Vibration: A Technical Guideline (DECC, 2006).
Wind turbine noise has also been assessed against the World Health Organisation Guidelines for project involved locations.
Further, in December 2011, the NSW Department of Planning and Infrastructure (DPI) released the Draft NSW Planning Guidelines Wind Farms – Appendix B: NSW Wind Farm Noise Guidelines (Draft Guidelines). Whilst no supplementary DGRs have been issued for the Paling Yards Wind Farm requiring consideration of the Draft Guidelines, this assessment also considers the requirements of the Draft Guidelines to the extent practicable (See Section 10).
4.3 SA EPA Wind Farm Noise Guidelines
The South Australia EPA Noise Guidelines for Wind Farms (SA EPA Guidelines) recommends the following noise criteria for new wind farms,
“The predicted equivalent noise level (LAeq, 10min), adjusted for tonality in accordance with these guidelines, should not exceed:
35 dBA, or
the background noise level by more than 5 dBA,
whichever is the greater, at all relevant receivers for each integer wind speed from cut-in to rated power of the WTG.”
The SA EPA Guidelines also provide information on measuring the background noise levels, locations and requirements on the number of valid data points to be obtained and the methodology for excluding invalid data points. It also outlines the process for determining lines of best fit for the background data, and determination of the noise limit.
The SA EPA Guidelines explicitly state that the “swish” or normal modulation noise from wind turbines is a fundamental characteristic of such turbines; however, it specifies that tonal or annoying characteristics of turbine noise should be penalised.
A 5 dBA penalty should be applied to the measured noise level if an “authorised” officer determines that tonality is an issue and that tonality should be assessed in a way acceptable to the EPA.
The SA EPA Guidelines do not require an assessment for the potential of low frequency noise or infrasound, but states that recent turbine designs do not appear to generate significant levels of infrasound, as the earlier turbine models did.
The SA EPA Guidelines accept that wind farm developers commonly enter into agreements with private landowners in which they are provided compensation. The SA EPA Guidelines are accordingly only intended to be applied to premises that do not have an agreement with the wind farm developers. The guideline lists that there is unlikely to be unreasonable interference if:
a formal agreement is documented between the parties
the agreement clearly outlines to the landowner the expected impact of the noise from the wind farm and its effect on the landowner’s amenity
the likely impact of exposure will not result in adverse health impacts (e.g. the level does not result in sleep disturbance)
Union Fenosa Wind Australia Pty Ltd Paling Yards Wind Farm Noise Impact Assessment
Report Number 640.10127-R1 18 December 2014
Revision 5 Page 13
SLR Consulting Australia Pty Ltd
The proponent Union Fenosa has discussed the possible noise implications with the involved residents on whose property the turbines would be located (project involved properties). The following dwellings are located on the project involved properties 7, 7A, 8, 8A, 9, 9A and 9B. Of these, dwellings 7A, 8A, 9A and 9B are secondary dwellings within the project involved properties of Paling Yards, Quobleigh and Mingary Park, respectively (the secondary dwellings). Based on discussions between Union Fenosa and the landowners it is understood these secondary dwellings are not permanent residences and are only used for part of the year as rental cottages or as temporary houses during shearing season.
The owners of the project involved properties have been provided copies of this Noise Impact Assessment for their information, and have been advised that SA EPA Guidelines may be exceeded under certain turbine configurations.
Union Fenosa proposes to enter into noise agreements with the owners of the project involved properties prior to construction. These agreements would specify that:
a Union Fenosa would ensure that the properties met the World Health Organisation noise guidelines (see Section 4.5); and,
b Union Fenosa would implement an adaptive management approach which could include the use of building treatments and turbine operation / management strategies if operational noise causes significant impact to the amenity of involved residents.
In addition, it is proposed that the noise agreements will make specific provision for ‘secondary dwellings’ so as to ensure that no adverse health impacts result to any person as a result of turbine noise impacts. Based on discussions between Union Fenosa and the landowners it is understood these secondary dwellings are not permanent residences and are only used for part of the year as rental cottages or as temporary houses during shearing season. Specific provisions may include documenting the agreement of the landowners to not to allow any of the secondary dwellings to be occupied if post construction noise testing show that the turbine noise is in breach of the WHO criteria. As an alternative, acoustic treatments to the secondary dwellings or adaptive management techniques may be considered. These are discussed further in Section 9.3.
The noise agreements would only be required for those turbine configurations where the SA EPA Guidelines would be exceeded for a particular project involved property.
4.4 NSW Industrial Noise Policy (INP)
The NSW Industrial Noise Policy (INP) requirements include site selection for background measurements, description of the site, the equipment used, graphing of results and amenity noise criteria during each of the three periods (Day, Evening and Night).
The proposed site for the Paling Yards Wind Farm is in a rural area and therefore the Amenity Criteria for rural residential receivers, as detailed in Table 2.1 in the NSW INP, is applicable.
The criteria vary as a function of time of day. The Day, Evening and Night Periods are defined as,
Day Period 7:00 am - 6:00 pm 8:00 am - 6:00 pm (Sundays and Public Holidays)
Evening Period 6:00 pm - 10:00 pm
Night Period 10:00 pm - 7:00 am 10:00 pm - 8:00 am (Sundays and Public Holidays)

Union Fenosa Wind Australia Pty Ltd Paling Yards Wind Farm Noise Impact Assessment
Report Number 640.10127-R1 18 December 2014
Revision 5 Page 14
SLR Consulting Australia Pty Ltd
The Amenity Criteria (LAeq level) for the residential noise sensitive locations for the Paling Yards Wind Farm project are,
Day Period 50 dBA
Evening Period 45 dBA
Night Period 40 dBA
The Intrusiveness Criterion in the INP is based on the rating background level (RBL), where the Criterion is,
LAeq, 15 min ≤ RBL + 5 dBA
This is almost identical to the SA EPA Guidelines (Section 4.3), the difference being the measurement interval (15 and 10 minute) and the determination of the background noise level (rating level, based on the 10
th percentile of measured background levels, or using a line of best fit through
the data points).
The INP states where the measured RBL is less than 30 dBA, then the RBL is considered to be 30 dBA.
In summary it is evident that the non project involved residential receivers assessed under the SA EPA Wind Farm Guideline will generally comply to INP amenity criteria. Furthermore, intrusiveness is covered by the SA EPA Wind Farm Guideline.
4.5 World Health Organisation Guidelines
As discussed in Section 4.3, the proponent intends to enter into noise agreements with the owners of project-involved residences in accordance with World Health Organisation (WHO) guidelines, as it is necessary to ensure that the project does not result in an ‘unreasonable interference’ with the amenity of these areas or cause any adverse health effects.
The WHO publication ‘Guidelines for Community Noise’ identifies the main health risks associated with noise and derives acceptable environmental noise limits for various activities and environments.
The appropriate guideline limits are listed in Table 1 below.
Table 1 WHO Guideline values for environmental noise in specific environments
Specific Environment
Critical Health Effect(s) LAeq
(dBA)
Time base
(hours)
LAMax
(dBA, Fast)
Outdoor living area Serious Annoyance, daytime & evening
Moderate annoyance, daytime & evening
55
50
16
16
-
-
Dwelling indoors
Inside bedrooms
Speech Intelligibility & moderate annoyance, daytime & evening
Sleep disturbance, night-time
35
30
16
8
45
Outside bedrooms Sleep disturbance – window open, night-time 45 8 60
For the assessment of the dwellings on the project involved properties the adopted external criteria of 45 dBA or the level given by the SA EPA Guideline criteria, where higher, will be adopted. Effectively this becomes 45 dBA or background + 5 dBA, whichever is the higher.

Union Fenosa Wind Australia Pty Ltd Paling Yards Wind Farm Noise Impact Assessment
Report Number 640.10127-R1 18 December 2014
Revision 5 Page 15
SLR Consulting Australia Pty Ltd
4.6 Construction Noise Guidelines
The Department of Environment, Climate Change and Water (DECCW) issued the “Interim Construction Noise Guideline” in July 2009. The main objectives of the guideline are stated in Section 1.3, a portion of which is presented below:
promote a clear understanding of ways to identify and minimise noise from construction works.
focus on applying all ‘feasible’ and ‘reasonable’ work practices to minimise construction noise impacts.
encourage construction to be undertaken only during the recommended standard hours unless approval is given for works that cannot be undertaken during these hours.
The guideline sets out Noise Management Levels (NMLs) at residences, and how they are to be applied, as presented in Table 2. This approach intends to provide respite for residents exposed to excessive construction noise outside the recommended standard hours whilst allowing construction during the recommended standard hours without undue constraints.
Table 2 Noise at Residences Using Quantitative Assessment
Time of Day Management Level LAeq(15minute)
1
How to Apply
Recommended standard hours:
Monday to Friday 7.00 am to 6.00 pm
Saturday 8.00 am to 1.00 pm
No work on Sundays or public holidays
Noise affected RBL + 10 dBA
The noise affected level represents the point above which there may be some community reaction to noise.
Where the predicted or measured LAeq(15minute) is greater than the noise affected level, the proponent should apply all feasible and reasonable work practices to minimise noise.
The proponent should also inform all potentially impacted residents of the nature of works to be carried out, the expected noise levels and duration, as well as contact details.
Highly noise affected 75 dBA
The highly noise affected level represents the point above which there may be strong community reaction to noise.
Where noise is above this level, the proponent should consider very carefully if there is any other feasible and reasonable way to reduce noise to below this level.
If no quieter work method is feasible and reasonable, and the works proceed, the proponent should communicate with the impacted residents by clearly explaining the duration and noise level of the works, and by describing any respite periods that will be provided.
Outside recommended standard hours
Noise affected RBL + 5 dBA
A strong justification would typically be required for works outside the recommended standard hours.
The proponent should apply all feasible and reasonable work practices to meet the noise affected level.
Where all feasible and reasonable practices have been applied and noise is more than 5 dBA above the noise affected level, the proponent should negotiate with the community.
Note 1: Noise levels apply at the property boundary that is most exposed to construction noise. If the property boundary is more than 30 m from the residence, the location for measuring or predicting noise levels is at the most noise-affected point within 30 m of the residence.

Union Fenosa Wind Australia Pty Ltd Paling Yards Wind Farm Noise Impact Assessment
Report Number 640.10127-R1 18 December 2014
Revision 5 Page 16
SLR Consulting Australia Pty Ltd
4.7 Vibration Guidelines
Impacts from vibration can be considered both in terms of effects on building occupants (human comfort) and the effects on the building structure (building damage). Of these considerations, the human comfort limits are the most stringent. Therefore, for occupied buildings, if compliance with human comfort limits is achieved, it will follow that compliance will be achieved with the building damage objectives.
The DECCW’s Assessing Vibration: A Technical Guideline provides acceptable values for continuous and impulsive vibration based upon guidelines contained in BS 6472–1992, Evaluation of human exposure to vibration in buildings (1–80 Hz). Both preferred and maximum vibration limits are defined for various locations and are shown in Table 3, with the preferred night-time PPV criteria of 0.2 mm/s being the most relevant to the project.
Table 3 Preferred and maximum values for continuous and impulsive vibration
Location Assessment period
1
Preferred values
RMS acceleration m/s2
Maximum values
RMS acceleration m/s2
Peak Velocity PPV
mm/s
z-axis x- and y-axes
z-axis x- and y-axes
Preferred Maximum
Continuous vibration
Critical areas2 Day- or night-time
0.0050 0.0036 0.010 0.0072 0.14 0.28
Residences Daytime 0.010 0.0071 0.020 0.014 0.28 0.56
night-time 0.007 0.005 0.014 0.010 0.20 0.40
Offices, schools, educational
institutions and places of worship
Day- or night-time
0.020 0.014 0.040 0.028 0.56 1.1
Workshops Day- or night-time
0.04 0.029 0.080 0.058 1.1 2.2
Impulsive vibration
Critical areas2 Day- or night-time
0.0050 0.0036 0.010 0.0072 0.14 0.28
Residences Daytime 0.30 0.21 0.60 0.42 8.6 17.0
night-time 0.010 0.0071 0.020 0.014 2.8 5.6
Offices, schools, educational
institutions and places of worship
Day- or night-time
0.64 0.46 1.28 0.92 18.0 36.0
Workshops Day- or night-time
0.64 0.46 1.28 0.92 18.0 36.0
1 Daytime is 7.00 am to 10.00 pm and night-time is 10.00 pm to 7.00 am
2 Examples include hospital operating theatres and precision laboratories where sensitive operations are occurring. There may be cases where sensitive equipment or delicate tasks require more stringent criteria than the human comfort criteria specified above. Stipulation of such criteria is outside the scope of this policy, and other guidance documents (e.g. relevant standards) should be referred to. Source: BS 6472–1992
These limits relate to a long-term (16 hours for daytime), continuous exposure to vibration sources. Where vibration is intermittent, a higher level of vibration is typically acceptable.
Union Fenosa Wind Australia Pty Ltd Paling Yards Wind Farm Noise Impact Assessment
Report Number 640.10127-R1 18 December 2014
Revision 5 Page 17
SLR Consulting Australia Pty Ltd
In regard to potential building damage, the German Standard DIN4150 recommends a limit of 10 mm/s PPV within any building and the British Standard BS7385: Part 2 - 1993 sets a limit within buildings which depends upon the vibration frequency, but is as low as 7.5 mm/s PPV (at 4.5Hz). For the purposes of ensuring a reasonable factor of safety a conservative limit of approximately 5 mm/s PPV has been applied for this project.
4.8 Blasting Criteria
The ground vibration and airblast levels which cause concern or discomfort to residents are generally lower than the relevant building damage limits.
The DECCW advocates the use of the Australian and New Zealand Environment Conservation Council (ANZECC) guideline “Technical basis for guidelines to minimise annoyance due to blasting overpressure and ground vibration” for assessing potential residential disturbance arising from blast emissions. The ANZECC guidelines for control of blasting impact at residences are as follows:
The recommended maximum level for airblast is 115 dB Linear. The level of 115 dB Linear may be exceeded on up to 5% of the total number of blasts over a period of 12 months. The level should not exceed 120 dB Linear at any time.
The recommended maximum for ground vibration is 5 mm/s, Peak Vector Sum (PVS) vibration velocity. It is recommended however, that 2 mm/s (PVS) be considered as the long term regulatory goal for the control of ground vibration. The PVS level of 5 mm/s may be exceeded on up to 5% of the total number of blasts over a period of 12 months. The level should not exceed 10 mm/s at any time.
Blasting should generally only be permitted during the hours of 9:00 am to 5:00 pm Monday to Saturday. Blasting should not take place on Sundays and public holidays.
Blasting should generally take place no more than once per day.
The Australian Standard 2187.2-1993 “Explosives - Storage, Transport and Use. Part 2: Use of Explosives” does not present human comfort criteria for ground vibration from blasting. It does however make mention of human comfort level for airblast in saying “a limit of 120 dB for human comfort is commonly used”. This is consistent with the ANZECC guidelines.
AS 2187.2-1993 nominates building damage assessment criteria as presented in Table 4.
Table 4 Blast Emission Building Damage Assessment Criteria (AS 2187)
Building Type Vibration Level Airblast Level
(dB re 20 µPa)
Sensitive (and Heritage) PVS 5 mm/s 133 dB(Linear) Peak
Residential PVS 10 mm/s 133 dB(Linear) Peak
Commercial/Industrial PVS 25 mm/s 133 dB(Linear) Peak
Union Fenosa Wind Australia Pty Ltd Paling Yards Wind Farm Noise Impact Assessment
Report Number 640.10127-R1 18 December 2014
Revision 5 Page 18
SLR Consulting Australia Pty Ltd
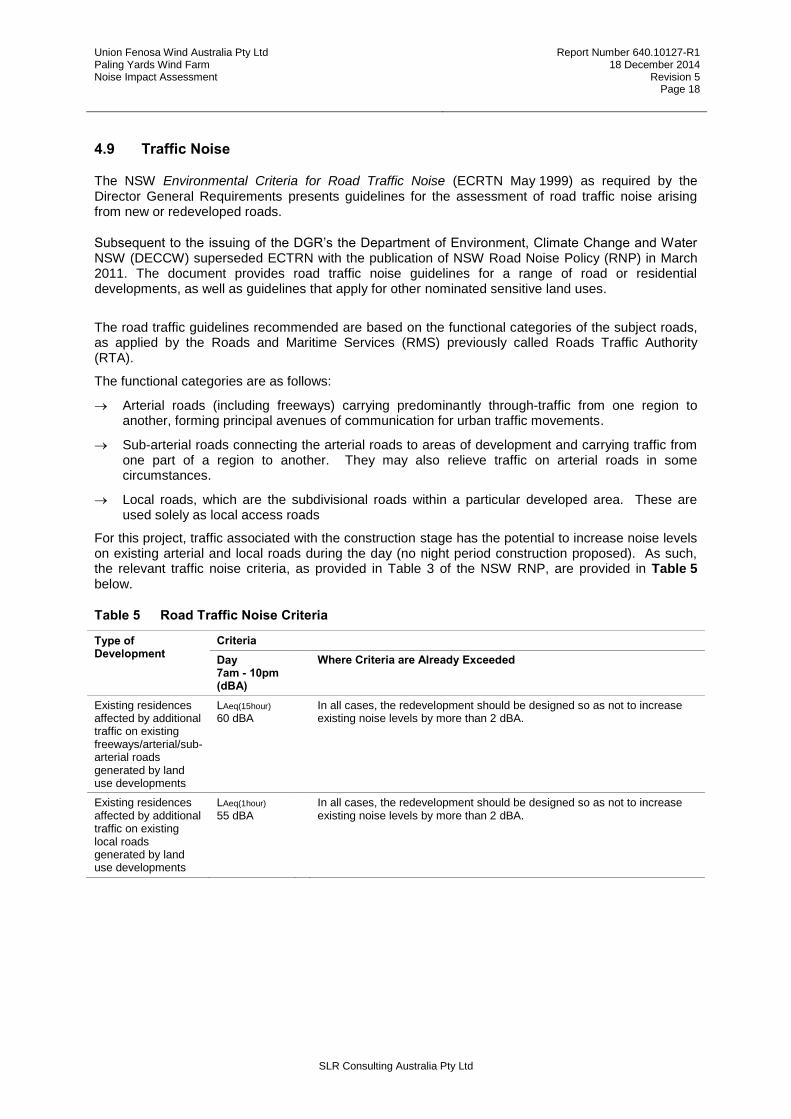
4.9 Traffic Noise
The NSW Environmental Criteria for Road Traffic Noise (ECRTN May 1999) as required by the Director General Requirements presents guidelines for the assessment of road traffic noise arising from new or redeveloped roads.
Subsequent to the issuing of the DGR’s the Department of Environment, Climate Change and Water NSW (DECCW) superseded ECTRN with the publication of NSW Road Noise Policy (RNP) in March 2011. The document provides road traffic noise guidelines for a range of road or residential developments, as well as guidelines that apply for other nominated sensitive land uses.
The road traffic guidelines recommended are based on the functional categories of the subject roads, as applied by the Roads and Maritime Services (RMS) previously called Roads Traffic Authority (RTA).
The functional categories are as follows:
Arterial roads (including freeways) carrying predominantly through-traffic from one region to another, forming principal avenues of communication for urban traffic movements.
Sub-arterial roads connecting the arterial roads to areas of development and carrying traffic from one part of a region to another. They may also relieve traffic on arterial roads in some circumstances.
Local roads, which are the subdivisional roads within a particular developed area. These are used solely as local access roads
For this project, traffic associated with the construction stage has the potential to increase noise levels on existing arterial and local roads during the day (no night period construction proposed). As such, the relevant traffic noise criteria, as provided in Table 3 of the NSW RNP, are provided in Table 5 below.
Table 5 Road Traffic Noise Criteria
Type of Development
Criteria
Day 7am - 10pm (dBA)
Where Criteria are Already Exceeded
Existing residences affected by additional traffic on existing freeways/arterial/sub-arterial roads generated by land use developments
LAeq(15hour) 60 dBA
In all cases, the redevelopment should be designed so as not to increase existing noise levels by more than 2 dBA.
Existing residences affected by additional traffic on existing local roads generated by land use developments
LAeq(1hour) 55 dBA
In all cases, the redevelopment should be designed so as not to increase existing noise levels by more than 2 dBA.

Union Fenosa Wind Australia Pty Ltd Paling Yards Wind Farm Noise Impact Assessment
Report Number 640.10127-R1 18 December 2014
Revision 5 Page 19
SLR Consulting Australia Pty Ltd
5 GENERAL SITE DESCRIPTION
The proposed Paling Yards Wind Farm site is located approximately 60 km north of Goulburn and 35 km north-east of Crookwell, in NSW. To the west lies the Abercrombie River National Park and to the east is Mount Werong State Forest. The proposed wind farm covers approximately 3893 hectares.
The location of Paling Yards Wind Farm is shown in Figure 1 below.
Figure 1 Location of proposed Paling Yards Wind Farm
5.1 Characteristics of the site
The proposed project site incorporates 2 landowners. A noise assessment has been carried out for all dwellings within 6 kilometres of a turbine under SA EPA Guidelines.
For project involved receptor locations, those who have agreements with Union Fenosa about turbines on their land, a noise assessment has been carried out under WHO Guidelines to ensure there is no unreasonable impact on amenity. (See Section 4.2 below for details of each of these assessment methodologies)
Topographically, the proposed site runs along a plateau, bisected by Goulburn Oberon Rd. This plateau is approximately 800 m to 1000 m above sea level. The surrounding district is primarily used for agricultural (grazing) purposes with areas surrounding project site covered in native vegetation.
The Abercrombie River is to the south of the project site and plateaus in a steep gully. All properties surrounding the proposed Wind Farm site have an ambient background noise environment that is determined by pre-dominantly natural sources which are largely wind influenced.
Prevailing winds are easterlies and westerlies. The district receives approximately 700 mm – 800 mm of rainfall annually.

Union Fenosa Wind Australia Pty Ltd Paling Yards Wind Farm Noise Impact Assessment
Report Number 640.10127-R1 18 December 2014
Revision 5 Page 20
SLR Consulting Australia Pty Ltd
5.2 Dwelling Locations
Properties are situated on either side of Goulburn-Oberon Rd (Also known as Abercrombie Rd) and predominantly to the south, as well as a cluster on a plateau to the east of the wind turbines.
The assessment locations include all dwellings located within 6 km of a proposed WTG. Figure 2 shows the nearby dwellings assessed for the project in white and locations where baseline noise monitoring was completed are denoted in blue. The indicative turbine positions are shown in red, wind masts locations are shown in orange. (Refer to Section 8.1 - Measurement Locations)
Figure 2 Dwelling Locations and Indicative WTG Layout
Table 6 lists all receiver locations, their positions and identifies those that are project involved. Other dwellings located beyond 6 km of a proposed WTG are not considered within this assessment, primarily as WTG noise is unlikely to be audible at these distances and compliance to noise criteria is more critical at closer receivers.

Union Fenosa Wind Australia Pty Ltd Paling Yards Wind Farm Noise Impact Assessment
Report Number 640.10127-R1 18 December 2014
Revision 5 Page 21
SLR Consulting Australia Pty Ltd
Table 6 Surrounding Receivers (Map Datum and Coordinate System Zone 55, GDA94)
Location East (m) North (m) Location East (m) North (m)
1 759405 6228570 115 761553 6220052
2 760521 6224074 116 761946 6219796
2A 760453 6223577 117 762928 6217831
3 758065 6222550 118 763826 6215060
4 757528 6222283 119 764059 6214251
5 757652 6222233 120 762729 6215059
6 758725 6221219 121 762418 6214140
6A 759168 6220843 122 761829 6213571
7* 755733 6219927 123 759010 6212248
7A* 754852 6219783 124 762906 6213740
8* 752720 6217349 125 758644 6214826
8A* 752775 6217645 126 755608 6213611
9* 752455 6215508 127 760498 6214494
9A* 752297 6215538 128 753128 6211506
9B* 752581 6215711 129 763229 6216854
10 745869 6215678 130 763712 6216648
11 742104 6215447 131 763704 6216081
12 744181 6213996 132 764803 6216225
13 744279 6213071 133 764539 6215996
14 741601 6212297 134 757264 6212656
15 743708 6212250 135 755459 6213072
16 742570 6211923 136 761256 6214418
17 743420 6210570 137 763294 6213540
18 743420 6210570 142 757075 6208414
19 743160 6209175 143 757485 6210384
20 743375 6208668 144 757915 6209813
21 749190 6209529 145 757995 6209968
22 750230 6208962 146 758156 6210003
23 749326 6208543 147 758097 6209945
29 755333 6211123 149 758486 6223537
30 756669 6209876 l^ 759962 6213024
31 757574 6210107 n^ 754842 6215362
33 757449 6208284 p^ 761552 6215874
114 761708 6220400
Note: * Denotes that the location is involved with the project
Note: ^ Denotes that the location is not identified as an official dwelling
The distances between the surrounding receivers and WTG’s are compiled in Appendix C.

Union Fenosa Wind Australia Pty Ltd Paling Yards Wind Farm Noise Impact Assessment
Report Number 640.10127-R1 18 December 2014
Revision 5 Page 22
SLR Consulting Australia Pty Ltd
6 PROPOSED WIND FARM LAYOUT
6.1 WTG Type and Details
The WTG manufacturer and model has not yet been finalised, and accordingly it is necessary to evaluate a selection of models that may comprise a layout. The final layout submitted for approval consists of 55 WTG’s after the removal of turbines P2, P6, P7 and P11 for ecological considerations, however, the layout assessed in this report is a 59 turbine layout and comprises of the following turbine types which are currently under consideration by the proponent.
14 X Vestas V90 1.8/2.0MW
14 X Vestas V100 1.8/2.0MW
31 X Vestas V112 3.0MW
The number of each type of turbine was determined from iterative predictive assessments of preliminary layouts. All turbines are three bladed, upwind, pitch regulated and active yaw. A detailed description of the layout, including which turbine type is assumed for each location is provided in Appendix E.
Should an alternative selection of turbines be ultimately made and/or the final layout of the Wind Farm differ from that assessed in this report, a revised noise impact assessment prediction will be completed prior to construction commencing.
Table 7 and Table 8 summarise the relevant turbine input data used for noise level prediction.
Table 7 WTG Manufacturers Data
Make, model, power Vestas V90 1.8/2.0MW
Vestas V100 1.8/2.0MW
Vestas V112 3.0MW
Rotor diameter 90 m 100 m 112 m
Hub height 95 m 95 m 94 m
Cut-in wind speed 4 m/s 3 m/s 3 m/s
Rated wind speed 12 m/s 20 m/s 12 m/s
Rotor speed 9.0 – 14.9 rpm 14.9 rpm 4.4 – 17.7 rpm
‘Standard Mode’ Sound Power Level, LWA,ref
103.7 dBA 105.0 dBA 106.0 dBA
Table 8 WTG Sound Power Curves
Wind Turbine Model Wind speed Vs (10m AGL) (m/s)
3 4 5 6 7 8 9 10 11 12
Vestas V90 2.0MW
94.3 99.7 102.2 104.0 103.7 103.5 103.5
Vestas V100 1.8MW 94.0 96.2 100.1 103.9 105.0 105.0 105.0
Vestas V112 3MW
96.8 100.4 104.8 106.9 106.5 105.9 105.5 105.4 105.5
Noise emissions for the proposed WTG’s have been provided by the WTG manufacturers and have either been independently tested according to International Standard IEC 61400-11 or are warranted noise levels calculated in accordance with the International Standard. Copies of the certification test or manufacturers documentation that give the sound power level variation with wind speed, frequency spectra and tonality assessment have been provided by Union Fenosa and will be made available to the DP&I on request.

Union Fenosa Wind Australia Pty Ltd Paling Yards Wind Farm Noise Impact Assessment
Report Number 640.10127-R1 18 December 2014
Revision 5 Page 23
SLR Consulting Australia Pty Ltd
6.2 Assessment of Tonality and Infrasound
WTG manufacturers are obliged to conduct independent tests in accordance with IEC 61400-11. A part of this assessment is to conduct a tonal audibility test. The tonal audibility ∆Lt,a is typically assessed using the methodology outlined in Joint Nordic Method Version 2 – Objective Method for Assessing the Audibility of Tones in Noise.
The warranted tonal audibility data ∆LA,k values have been supplied by the WTG manufacturers as follows:
Table 9 Audible tonality assessment to IEC 61400-11
Wind speed m/s Tonality ∆LA,k for turbine type
Vestas V90 Vestas V100 Vestas V112
3
4
5 -3.9
6 -5.26 -10.4 -1.97
7 -8.36 -10.7 -3.04
8 -6.79 -10.2 -13.27
9 -5.7 -5.2 -11.88
10 -7.32 -5.2 -9.19
11 -9.3
A more detailed assessment of tonality has been undertaken for the V112 model, which has the highest ΔLA,k values for this layout. This analysis is presented in Section 7.3.
Infrasound is not tested as an obligatory part of IEC 61400-11. It is noted that, in general, modern WTG’s do not exhibit significant infrasound emissions. Refer to Section 7.4.2 for a more detailed discussion.

Union Fenosa Wind Australia Pty Ltd Paling Yards Wind Farm Noise Impact Assessment
Report Number 640.10127-R1 18 December 2014
Revision 5 Page 24
SLR Consulting Australia Pty Ltd
7 OPERATION NOISE LEVELS
7.1 Introduction
As discussed in Section 3.2, a three-dimensional computer noise model was used to predict LAeq
noise levels from all WTG’s at all surrounding residential dwellings.
The ISO 9613 noise model incorporates a ‘hard ground’ assumption and includes one-third octave band calculated effects for air absorption, ground attenuation and topographic shielding. It is noted that ISO 9613 equations predict for average downwind propagation conditions and also hold for average propagation under a well-developed moderate ground-based temperature inversion.
The estimated accuracy of the prediction model is approximately ±3 dBA.
7.2 Wind Turbine Noise
For indicative purposes the WTG noise levels from the proposed WTG layout was calculated for the reference wind condition of 8 m/s at 10m AGL. The resulting WTG noise levels for each receiver are listed in Table 10. The predicted noise contour plot is presented in Figure 3.
Table 10 WTG LAeq noise level (dBA) at Vref,10m = 8 m/s, V100m = 11.5m/s
Receiver Name Predicted Noise Level Receiver Name Predicted Noise Level
1 - 115 22.3
2 - 116 17.1
2A - 117 -
3 25.6 118 -
4 30.2 119 -
5 30.8 120 -
6 30.9 121 -
6A 27 122 -
7* 45 123 -
7A* 48.1 124 -
8* 44.7 125 21.3
8A* 45.3 126 22.1
9* 44.9 127 15.3
9A* 45.6 128 25
9B* 45.5 129 -
10 27.5 130 -
11 - 131 -
12 20.7 132 -
13 23.5 133 -
14 - 134 21.2
15 5.1 135 22.1
16 - 136 16.8
17 - 137 -
18 - 142 -
19 - 143 -

Union Fenosa Wind Australia Pty Ltd Paling Yards Wind Farm Noise Impact Assessment
Report Number 640.10127-R1 18 December 2014
Revision 5 Page 25
SLR Consulting Australia Pty Ltd
Receiver Name Predicted Noise Level Receiver Name Predicted Noise Level
20 - 144 -
21 18.3 145 -
22 8 146 -
23 - 147 -
29 14.2 149 16.5
30 - l^ 7.6
31 - n^ 34.1
33 - p^ 24.2
114 18.3
Note that ‘*’ denotes a project involved property
Note that ‘-‘ denotes a result lower than 0 dB i.e. is below the normal range of hearing
Note that ‘^’ denotes a location of building not identified as an official dwelling
Furthermore, noise levels from the proposed wind farm were calculated for all integer wind speeds in the range of 5 to 10 m/s (at 10m AGL) at all surrounding assessment receivers within 6 km of a turbine. Whilst the rated wind speed of the WTG’s is typically 13 to 14 m/s, published manufacturers sound power level test data (IEC 61400-11) has only been generated as high as 10 m/s. It should be noted that noise produced by WTG’s begins to ‘plateau off’ at higher wind speeds and because of the higher masking background noise level at higher wind speeds, noise impacts and compliance are not critical at these speeds. The assessed wind range sufficiently covers the most noise critical operational conditions.
To compare predicted noise levels with the assessment criteria, the wind speed data, normally
measured at 10 m AGL, was extrapolated to a hub height of 100 m using the logarithmic profile law.1 (Refer to Section 9.1) The assessment graphs of WTG operational noise levels were prepared for and are depicted in Appendix A.
1 (Section 8 Data reduction procedures, page 20, International Standard IEC61400-11 ©IEC:2002+A1:2006 (E) ‘Wind Turbine Generator Systems – Part 11: Acoustic noise measurement techniques’).

Union Fenosa Wind Australia Pty Ltd Paling Yards Wind Farm Noise Impact Assessment
Report Number 640.10127-R1 18 December 2014
Revision 5 Page 26
SLR Consulting Australia Pty Ltd
Figure 3 Predicted Noise Levels Contour Map, LAeq, vref=8m/s

Union Fenosa Wind Australia Pty Ltd Paling Yards Wind Farm Noise Impact Assessment
Report Number 640.10127-R1 18 December 2014
Revision 5 Page 27
SLR Consulting Australia Pty Ltd
7.3 Vestas V112 Detailed Tonality assessment
IEC 61400-11:2002 is the measurement standard used for determining the sound power in one-third octave bands for wind turbines, as measured in the near field. In addition, the standard uses narrow band analysis to quantify tones in the measured sound power spectrum. The result of this test is the tonal audibility criterion ∆LA,k. In general, ∆LA,k values greater than -3 should be reported as per the standard.
The origin of the ∆LA,k test can be found in the Objective Method for Assessing the Audibility of Tones in Noise, Joint Nordic Method developed by DELTA. While not fully explained in the IEC 61400-11
standard, the tonality penalty is determined according to the following formula.2
𝑓𝑜𝑟 ∆𝐿𝑡𝑎 < 4𝑑𝐵: 𝑘 = 0 𝑑𝐵
𝑓𝑜𝑟 4 ≤ ∆𝐿𝑡𝑎 ≤ 10𝑑𝐵: 𝑘 = ∆𝐿𝑡𝑎 − 4
𝑓𝑜𝑟 ∆𝐿𝑡𝑎 > 10𝑑𝐵: 𝑘 = 6𝑑𝐵
Note: k is not restricted to integer values
Examining the Vestas V112 data provided by the manufacturer3 ∆LA,k is less than 4 dB at all wind speeds and therefore does not attract a penalty under the Joint Nordic Method.
In addition to this test a one-third octave band test was completed using the noise levels as predicted by the model. Levels were assessed against the description of tonality as defined in the NSW Industrial Noise Policy. The policy states that the presence of excessive tonality is defined as when the level of one-third octave band measured in the equivalent noise level Leq(10 minute) exceeds the level of the adjacent bands on both sides by:
5 dB or more if the centre frequency of the band containing the tone is above 400Hz
8 dB or more if the centre frequency of the band containing the tone is 160 to 400Hz inclusive
15 dB or more if the centre frequency of the band containing the tone is below 160Hz
The predicted noise level in one third octave bands did not meet the descriptions as stated above and would therefore be deemed ‘non tonal’ in the field.
2 Source: Equation 4 from Objective Method for Assessing the Audibility of Tones in Noise. Joint Nordic Method – Version 2. AV 1952/99 14 April 2000, pg 5. 3 Source: Garad Hassan report, GLGH-4286 12 09255 258-A-00001-B dated 20 August 2012

Union Fenosa Wind Australia Pty Ltd Paling Yards Wind Farm Noise Impact Assessment
Report Number 640.10127-R1 18 December 2014
Revision 5 Page 28
SLR Consulting Australia Pty Ltd
8 BACKGROUND LEVELS AND NOISE LIMITS
8.1 Measurement Locations
The locations for the background noise measurements were selected based on the potential for acoustic impact to the nearest receivers, as recommended by Table 3.1 of the NSW INP. The SA EPA Guidelines recommend that the measurement locations should be located at least 5 metres from a reflecting surface (other than the ground) and within 20 metres of a residence.
Monitoring equipment was generally placed in the vicinity of the residence at a suitable location that would be protected from the prevailing wind direction in order to protect the microphone from excessive wind induced noise effects. Care was taken not to place the equipment in locations that would be adversely affected by extraneous noise sources.
Background noise monitoring locations were selected based on the predicted wind farm noise level from the preliminary layout at reference conditions.
The relative proximity of some receiver locations to one another and their similar wind exposure and surrounding environment meant that background noise monitoring could be conducted at one representative location and be considered indicative of other similar locations.
Monitoring was commenced at 8 locations around the proposed wind farm site. For the purposes of assessment, receivers nearest to a particular background monitoring site were allocated to that location. The background noise monitoring locations, along with locations allocated to that site, are listed in Table 11. Refer to Figure 4 for a map showing background locations.
Table 11 Measurement Locations
Location Indicative of Notes / Similar
Characteristic for wind induced noise
9
9
9A
9B
11
12
13
14
15
16
17
18
19
20
n
Geographic proximity, similar region, exposure to wind
8
8
8A
Geographic proximity, similar region, exposure to wind
7
7
7A
Geographic proximity, similar region, exposure to wind
4
1
2
2A
3
4
5
149
Geographic proximity, similar region, exposure to wind
6 6 6A
Geographic proximity, similar region, exposure to wind

Union Fenosa Wind Australia Pty Ltd Paling Yards Wind Farm Noise Impact Assessment
Report Number 640.10127-R1 18 December 2014
Revision 5 Page 29
SLR Consulting Australia Pty Ltd
115
114
115
116
117
118
119
120
121
124
129
130
131
132
133
136
137
p
Geographic proximity, similar region, exposure to wind
128
21
22
23
29
30
31
33
128
134
142
143
144
145
146
147
l
Geographic proximity, similar region, exposure to wind
10
10
122
123
125
126
127
135
Geographic proximity, similar region, exposure to wind
It is anticipated that further baseline background noise monitoring will be conducted before project commissioning in order to obtain further comprehensive and representative data.
At each location noise monitoring equipment was placed in the vicinity of the residence and the position of the monitoring equipment was documented with photographs.
A weather station was deployed at Location 9 for the period of the survey. This data was used to identify and exclude any data collected during rain periods, which may have affected the background noise levels. The measured data for rain confirmed that the monitoring period was generally dry and as a result only a small number of data points were rejected due to rain.
Any periods of data that were clearly affected by extraneous noise sources (eg pumps, insects, birds, etc) were removed from the analysis data set.
The SA EPA Guidelines require measurements to be conducted in 10 minute intervals, while the NSW INP request 15 minute interval data. Given that almost all wind data, including the wind farm site monitored data, is in 10 minute intervals, this period was used for all measurements.
Simultaneous noise monitoring and wind monitoring was conducted during the period 7th June 2011
through to 24th June 2011. Wind speed was monitored 3 wind masts throughout the proposed site.
Wind speed for a given background monitoring location was allocated to the wind mast nearest to that location. Where the receptor was approximately equidistant to two wind masts, the background noise was correlated to the wind mast with the highest correlation coefficient (R
2 value).

Union Fenosa Wind Australia Pty Ltd Paling Yards Wind Farm Noise Impact Assessment
Report Number 640.10127-R1 18 December 2014
Revision 5 Page 30
SLR Consulting Australia Pty Ltd
Table 12 Wind mast details
Wind speed at a height of 100 m AGL was derived using the wind profile power law from the data measured on each wind mast at 20 m and 60 m AGL. Wind shear for each 10-minute period was used to calculate this value. Local noise data was then correlated to the 100 m AGL extrapolated wind speed.
Wind Mast Easting Northing Nearest Background Locations
PY1 752098 6217660 9,8,10,128
PY4 757109 6218007 7,4,6,115
PY5 754257 6219651 -
8.2 Measurement Details
The measurement location, monitoring period, equipment type and serial number of the noise loggers used for all testing are summarised in Table 13, along with the number of valid data points for each location.
The SA EPA Guidelines require a set of approximately 2,000 valid data points. All data points below the cut-in wind speed of the proposed turbines and any adversely affected data should be excluded. The cut-in wind speed for the proposed turbines is 3 m/s.
The measured background noise levels (LA90) are then plotted against the extrapolated 100 metre wind speed to obtain a background versus wind speed characteristic for each location.
The line of best fit for the data set is then determined, as required by the SA EPA Guideline, using a linear, second order (quadratic) or third order (cubic) polynomial. The Guideline requires that the correlation coefficient (R
2 value) for each line type be reported and the line of best fit with the highest
correlation coefficient used. At each location the cubic polynomial gave the highest correlation and was therefore used for the line of best fit. The SA EPA Guideline does not specify a minimum acceptable correlation coefficient, although we note that almost all correlation coefficients are between 0.52 and 0.65 which is reasonably consistent and in our experience suggests reasonably good correlation.
Table 13 Measurement Details for each Location
Measurement Location
Measurement Period
Noise Logger Model
# Serial number
Total No. of monitoring intervals
No. of valid data points
Correlation Coefficient (R
2)
All Night Linear Quad. Cubic
Location 9
7th June 2011- 24th June 2011
ARL EL-316 16-203-530
2439 2264 865 0.5325 0.5348 0.5372
Location 8
7th June 2011- 24th June 2011
ARL EL-316 16-004-033
2438 2264 865 0.5324 0.5354 0.5354
Location 7±
7th June 2011- 19th June 2011
ARL EL-316 16-306-044
1680 1585 637 0.5828 0.5836 0.5836
Location 4±
7th June 2011- 23th June 2011
ARL EL-316 16-306-040
2258 1061 374 0.524 0.526 0.5288
Location 6 7th June 2011- 24th June 2011
ARL EL-316 16-203-528
2415 2233 859 0.5215 0.5223 0.5236

Union Fenosa Wind Australia Pty Ltd Paling Yards Wind Farm Noise Impact Assessment
Report Number 640.10127-R1 18 December 2014
Revision 5 Page 31
SLR Consulting Australia Pty Ltd
Measurement Location
Measurement Period
Noise Logger Model
# Serial number
Total No. of monitoring intervals
No. of valid data points
Correlation Coefficient (R
2)
All Night Linear Quad. Cubic
Location 115± 7th June 2011- 15th June 2011
ARL NGARA 878049
1108 1064 417 0.6292 0.6521 0.6521
Location 128 7th June 2011- 24th June 2011
ARL EL-316 16-207-041
2436 2264 865 0.5475 0.5514 0.5515
Location 10
7th June 2011- 24th June 2011
ARL EL-316 16-203-526
2432 2244 865 0.242 0.2661 0.2683
Note that ‘±’ denotes a location with fewer than 2000 monitoring intervals
Measurement data at three of the monitoring locations fell short of the preferred 2000 intervals (due to battery depletion or muffling of the measurement microphone for part of the measurement period) however, as more than 50% of the data had been collected and the correlation coefficient was relatively good (greater than 58%) the result for the full period was deemed as still statistically relevant.
8.3 Night Period Analysis
A reduced data set was created for the night period (10:00 pm to 7:00 am). The resulting data sets typically included 400 to 800 data points and were fitted with a cubic polynomial regression line of best fit.
The regression line for night-only data is generally lower than that for all data by between 1 dB to 5 dB and varies considerably from location to location. Lower night data is attributed to two main factors. Firstly that extraneous noise sources (animals, traffic etc) are lower during the night period and secondly that the wind shear for the night period is usually greater compared to the day period. This results in lower ground level wind speeds for a given hub height reference wind speed, when compared to that during the day period., and hence lower wind related background noise levels.
The resulting effect on project involved receptors’ criteria with consideration to only the lower night period background data is generally minimal with the criteria being exactly the same (criteria is a constant 35 dBA as background noise regression lines are always less than 30 dBA) or marginally higher at high wind speeds where compliance is more easily achieved.
The criteria for project uninvolved receptors with consideration to only the night period background data is generally marginally lower at higher wind speeds. As this is typically not the most critical wind range for compliance the net effect of night data based criteria is negligible with regards to compliance.

Union Fenosa Wind Australia Pty Ltd Paling Yards Wind Farm Noise Impact Assessment
Report Number 640.10127-R1 18 December 2014
Revision 5 Page 32
SLR Consulting Australia Pty Ltd
8.5 Location 9 – Paling Yards
The property of Paling Yards is located within the proposed wind farm site. The residence is set back approximately 500 m from Golburn-Oberon Rd. The nearest proposed turbine to this location is approximately 620 m away.
This residence is occupied by one of the landowners that make up part of the proposed Paling Yards Wind Farm site and is therefore considered ‘project involved’.
Figure 4 Paling Yards Measurement Location
The results of the background noise monitoring taken in June 2011, showing the data points, line of best fit and criteria curve for that group is shown in Figure 5.
Figure 5 Background Noise Measurements and Noise Criteria Curve – Location 9
Order Equation R2
Linear y = 1.5648x + 21.093
0.5325
Quadratic
y = -0.0269x2 + 2.1216x + 18.429
0.5348
Cubic
y = -0.0062x3 +0.1734x2
+0.1239x +24.509
0.5372
Order Used: Cubic
20
25
30
35
40
45
50
55
2 4 6 8 10 12 14 16 18
Bac
kgro
un
d N
ois
e L
eve
l, L9
0, d
BA
Wind Speed (Hub Height), m/s
B/G
Day Limit
BG Night
Night Limit
WHO Criteria

Union Fenosa Wind Australia Pty Ltd Paling Yards Wind Farm Noise Impact Assessment
Report Number 640.10127-R1 18 December 2014
Revision 5 Page 33
SLR Consulting Australia Pty Ltd
8.6 Location 8 – Quobleigh
The property of Quobleigh is located within the proposed wind farm site. The residence is located near Golburn Oberon Rd, north of location 9. The nearest proposed turbine to this location is 500 m away.
This residence is occupied by one of the landowners that make up part of the proposed Paling Yards Wind Farm site and is therefore considered ‘project involved’.
Figure 6 Quobleigh Background Noise Measurement Location
The results of the background noise monitoring taken in June 2011, showing the data points, line of best fit and criteria curve for that group is shown in Figure 7.
Figure 7 Background Noise Measurements and Noise Criteria Curve – Location 8
Order Equation R2
Linear y = 1.7238x + 25.757
0.5325
Quadratic
y = -0.033x2 + 2.4012x + 22.547
0.5348
Cubic
y = 0.0009x3 - 0.0602x2 + 2.6712x + 21.732
0.5372
Order Used:
Cubic
30
35
40
45
50
55
60
65
2 4 6 8 10 12 14 16 18
Bac
kgro
un
d N
ois
e L
eve
l, L9
0, d
BA
Wind Speed (Hub Height), m/s
B/G
Day Limit
BG Night
Night Limit
WHO Criteria
Data - Night Only
Data - All

Union Fenosa Wind Australia Pty Ltd Paling Yards Wind Farm Noise Impact Assessment
Report Number 640.10127-R1 18 December 2014
Revision 5 Page 34
SLR Consulting Australia Pty Ltd
8.7 Location 7 – Mingary Park
The property of Mingary Park is located within the proposed wind farm site. The residence is located near Golburn Oberon Rd, north east of location 8. The nearest proposed turbine to this location is 540m away.
This residence is occupied by one of the landowners that make up part of the proposed Paling Yards Wind Farm site and is therefore considered ‘project involved’.
Figure 8 Mingary Park Background Noise Measurement Location
The results of the background noise monitoring taken in June 2011, showing the data points, line of best fit and criteria curve for that group is shown in Figure 9.
Figure 9 Background Noise Measurements and Noise Criteria Curve – Location 7
Order Equation R2
Linear y = 1.4609x + 24.824
0.5828
Quadratic
y = -.0142x2 + .7731x + 23.235
0.5836
Cubic
y = 9E-5x3 -0.0171x2 + 1.803x + 23.142
0.5836
Order Used:
Cubic
25
30
35
40
45
50
55
60
2 4 6 8 10 12 14 16 18
Bac
kgro
un
d N
ois
e L
eve
l, L9
0, d
BA
Wind Speed (Hub Height), m/s
B/G
Day Limit
BG Night
Night Limit
WHO Criteria
Data - Night Only
Data - All

Union Fenosa Wind Australia Pty Ltd Paling Yards Wind Farm Noise Impact Assessment
Report Number 640.10127-R1 18 December 2014
Revision 5 Page 35
SLR Consulting Australia Pty Ltd
8.8 Location 4 – Lucas Grove
The property of Lucas Grove is located near Golburn Oberon Rd, north east of location 7. It sits atop of same ridgeline as the proposed wind farm. The nearest turbine to this location is 2 km away.
The time trace of background noise for Location 4 showed a sharp decrease in level after the 15th of
June 2011 (Refer to Appendix F).The resulting noise data clearly did not correlate to the wind speed data and did not vary in a manner typical of background noise measurements. It is presumed that the logger’s microphone was muffled or blocked for this period and as such this section of data has been excluded from the regression analysis.
Figure 10 Lucas Grove Background Noise Measurement Location
The results of the background noise monitoring taken in June 2011, showing the data points, line of best fit and criteria curve for that group is shown in Figure 11.
Figure 11 Background Noise Measurements and Noise Criteria Curve – Location 4
Order Equation R2
Linear 1.5971x +
19.187 0.524
Quadratic -0.0299x2 + 2.2539x + 15.833
0.5264
Cubic
-0.0082x3 + 0.2436x2 - 0.6209x + 25.209
0.5288
Order Used:
Cubic
20
25
30
35
40
45
50
55
2 4 6 8 10 12 14 16 18
Bac
kgro
un
d N
ois
e L
eve
l, L9
0, d
BA
Wind Speed (Hub Height), m/s
B/G
Day Limit
BG Night
Night Limit
WHO Criteria
Data - Night Only
Data - All

Union Fenosa Wind Australia Pty Ltd Paling Yards Wind Farm Noise Impact Assessment
Report Number 640.10127-R1 18 December 2014
Revision 5 Page 36
SLR Consulting Australia Pty Ltd
8.9 Location 6
Location 6 is located near Golburn Oberon Rd, south east of Location 4, north of the proposed wind farm. The nearest proposed turbine to this location is 2.3 km away.
Figure 12 Location 6 Background Noise Measurement Location
The results of the background noise monitoring taken in June 2011, showing the data points, line of best fit and criteria curve for that group is shown in Figure 13.
Figure 13 Background Noise Measurements and Noise Criteria Curve – Location 6
Order Equation R2
Linear 1.6847x +
19.359 05215
Quadratic 0.0165x^2 + 1.312x +
21.307 0.5223
Cubic
0.0046x^3 - 0.142x^2 + 3.0064x + 15.764
0.5236
Order Used:
Cubic
20
25
30
35
40
45
50
55
2 4 6 8 10 12 14 16 18
Bac
kgro
un
d N
ois
e L
eve
l, L9
0, d
BA
Wind Speed (Hub Height), m/s
B/G
Day Limit
BG Night
Night Limit
WHO Criteria
Data - Night
Data - All

Union Fenosa Wind Australia Pty Ltd Paling Yards Wind Farm Noise Impact Assessment
Report Number 640.10127-R1 18 December 2014
Revision 5 Page 37
SLR Consulting Australia Pty Ltd
8.10 Location 115 – Maxwelton
The property of Maxwelton is located off Jerrong Rd, east of location 7. It sits at the top of the ridgeline that runs parallel to the north end of the proposed wind farm. The nearest proposed turbine to this location is 4.1 km away.
Due to a premature battery depletion at Location 115, data was only recorded until the 15th
of June 2011 at which point the logger ceased to function. While this yielded fewer than 2000 data points (refer to Table 13), the existing data shows good correlation between background noise and wind speed (R
2>0.65).
Figure 14 Maxwelton Background Noise Measurement Location
The results of the background noise monitoring taken in June 2011, showing the data points, line of best fit and criteria curve for that group is shown in Figure 15.
Figure 15 Background Noise Measurements and Noise Criteria Curve – Location 115
Order Equation R2
Linear y =
2.1157x + 20.167
06292
Quadratic
y = 0.1114x2
+4.5764x + 7.545
0.6521
Cubic
y = 0.0005x3 -0.1276x2
+4.7461x + 6.9904
0.6521
Order Used:
Cubic
30
35
40
45
50
55
60
65
2 4 6 8 10 12 14 16 18
Bac
kgro
un
d N
ois
e L
eve
l, L9
0, d
BA
Wind Speed (Hub Height), m/s
B/G
Day Limit
BG Night
Night Limit
WHO Criteria
Data - Night
Data - All

Union Fenosa Wind Australia Pty Ltd Paling Yards Wind Farm Noise Impact Assessment
Report Number 640.10127-R1 18 December 2014
Revision 5 Page 38
SLR Consulting Australia Pty Ltd
8.11 Location 128
Location 128 is located off Taralga Rd, south of location 9. It sits at the top of the ridgeline south of the proposed wind farm. The nearest proposed turbine to this location is 2.9 km away.
Figure 16 Location 128 Background Noise Measurement Location
The results of the background noise monitoring taken in June 2011, showing the data points, line of best fit and criteria curve for that group is shown in Figure 17.
Figure 17 Background Noise Measurements and Noise Criteria Curve – Location 128
Order Equation R2
Linear y = 1.8587x + 15.112
0.5475
Quadratic
y = 0.0404x2 + 1.0312x + 19.027
0.5514
Cubic
y = 0.0014x3 - 0.0034x2 + 1.4653x + 17.717
0.5515
Order Used:
Cubic
20
25
30
35
40
45
50
55
2 4 6 8 10 12 14 16 18
Bac
kgro
un
d N
ois
e L
eve
l, L9
0, d
BA
Wind Speed (Hub Height), m/s
B/G
Day Limit
BG Night
Night Limit
WHO Criteria
Data - Night
Data - All
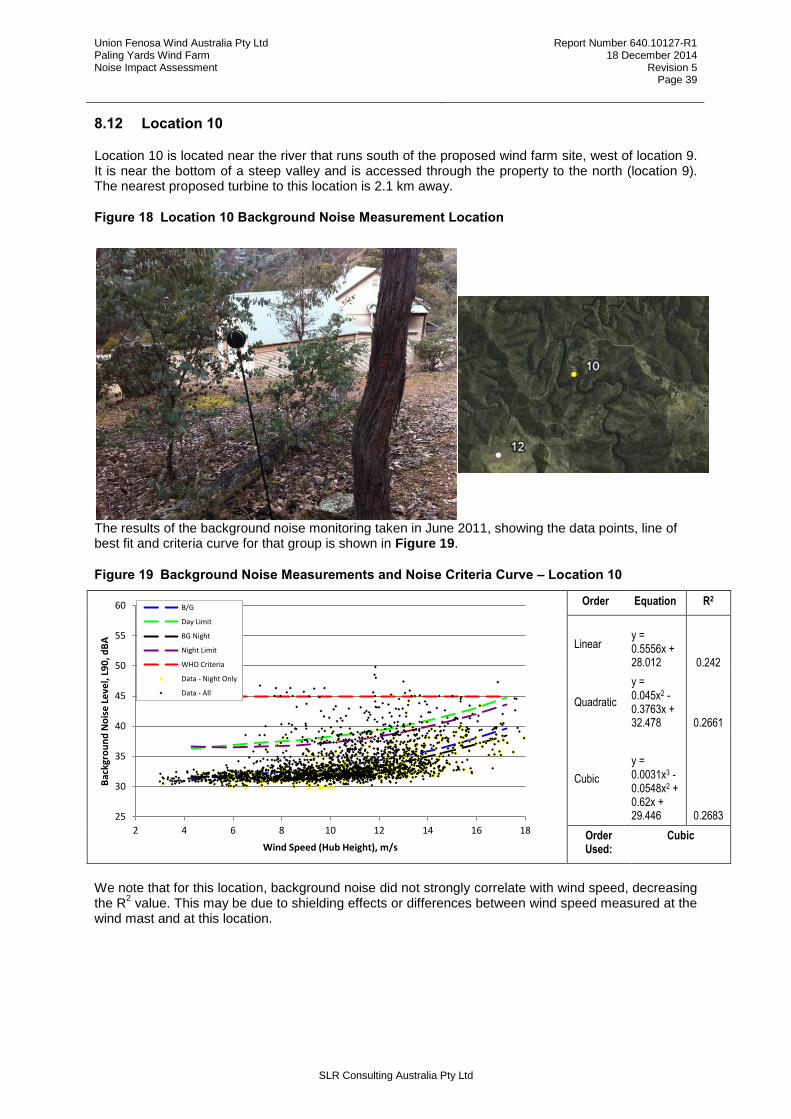
Union Fenosa Wind Australia Pty Ltd Paling Yards Wind Farm Noise Impact Assessment
Report Number 640.10127-R1 18 December 2014
Revision 5 Page 39
SLR Consulting Australia Pty Ltd
8.12 Location 10
Location 10 is located near the river that runs south of the proposed wind farm site, west of location 9. It is near the bottom of a steep valley and is accessed through the property to the north (location 9). The nearest proposed turbine to this location is 2.1 km away.
Figure 18 Location 10 Background Noise Measurement Location
The results of the background noise monitoring taken in June 2011, showing the data points, line of best fit and criteria curve for that group is shown in Figure 19.
Figure 19 Background Noise Measurements and Noise Criteria Curve – Location 10
Order Equation R2
Linear y = 0.5556x + 28.012 0.242
Quadratic
y = 0.045x2 - 0.3763x + 32.478 0.2661
Cubic
y = 0.0031x3 - 0.0548x2 + 0.62x + 29.446 0.2683
Order Used:
Cubic
We note that for this location, background noise did not strongly correlate with wind speed, decreasing the R
2 value. This may be due to shielding effects or differences between wind speed measured at the
wind mast and at this location.
25
30
35
40
45
50
55
60
2 4 6 8 10 12 14 16 18
Bac
kgro
un
d N
ois
e L
eve
l, L9
0, d
BA
Wind Speed (Hub Height), m/s
B/G
Day Limit
BG Night
Night Limit
WHO Criteria
Data - Night Only
Data - All

Union Fenosa Wind Australia Pty Ltd Paling Yards Wind Farm Noise Impact Assessment
Report Number 640.10127-R1 18 December 2014
Revision 5 Page 40
SLR Consulting Australia Pty Ltd
9 ACOUSTIC ASSESSMENT OF PROPOSED WIND FARM
An assessment of the acceptability of wind farm noise levels at all receivers located within a distance of 6 km of the proposed wind farm was made in accordance with the SA EPA Guideline criteria and the pre-existing background noise level regression analysis detailed in Section 7.3.
As outlined in Section 4.3, the proponent Union Fenosa intends to enter into noise agreements with some project involved residences prior to construction. Under the SA EPA Guidelines these project involved residences are not required to comply to the 35 dBA or ‘background + 5 dBA’ limits. However, it is necessary to ensure that the project does not result in an ‘unreasonable interference’ with the amenity of these areas or cause any adverse health effects. Therefore for the assessment of the project involved residences the external criteria of 45 dBA (as per the WHO guidelines) or the level given by the SA EPA Guideline criteria, where higher, will be adopted. Effectively this becomes 45 dBA or background + 5 dBA, whichever is the higher. (See Section 4.5 for details)
Predicted external noise levels will be further mitigated by the shielding effects of the building, with the anticipated internal noise levels similarly reduced by the façade of the dwelling.
It should be further noted that all predicted noise levels are considered to be conservative with the model assuming ‘hard ground’, average downwind propagation from all WTG’s to each receiver or a well-developed moderate ground based temperature inversion, a scenario which is not able to be re-created in reality.
Predicted noise levels for a wind speed of 8 m/s are shown in Table 10 (See Section 7.2.)
The assessment figures contained in Appendix A depict the predicted WTG noise level curves for the proposed WTG layout, superimposed over SA EPA Guideline Criteria and WHO based noise limits.
All non-project involved receivers were below the SA EPA Guideline criteria and are therefore deemed to comply. Furthermore, all receptors (including the project involved receivers) would achieve their respective criteria with consideration to the night-time only regression line based limits. In addition, most non project involved receivers are predicted to be below the background noise regression line.
For project involved residences, Table 14 below shows the exceedances for each location.
Table 14 Noise Criteria Exceedances
Location Exceedance at Hub Height Wind Speed MAX
4.3 5.7 7.2 8.6 10.0 11.5 12.9 14.3 15.8 17.2
7A* 2.4 3.4 3.3 3.1 3.0 2.0 0.6 3.4
9A*
0.8 0.6 0.4 0.4 0.4 0.1 0.8
9B*
0.7 0.5 0.4 0.3 0.3 0.1 0.6
8*
0.3
0.3
8A*
0.2
0.2
9* 0.1 0.1
7* 0.1 0.1
For locations 7, 8 and 9, the exceedance occurs only at one wind speed and is less than 0.5 dB in magnitude. This can be considered a minor exceedance and is unlikely to cause any additional effect on the amenity of the area or health of the occupants.
As outlined in Section 4.3, locations, 7A, 8A, 9A and 9B are project involved secondary dwellings and it is proposed that the noise agreements will make specific provision for these secondary dwellings to ensure that no adverse health impacts to any person as a result of WTG noise.

Union Fenosa Wind Australia Pty Ltd Paling Yards Wind Farm Noise Impact Assessment
Report Number 640.10127-R1 18 December 2014
Revision 5 Page 41
SLR Consulting Australia Pty Ltd
9.1 Atmospheric stability and wind profile
The wind velocity at a location can be represented by a vertical profile (gradient) that generally is at a minimum at ground level and increases with altitude. The wind velocity profile is primarily determined by physical factors such as surface roughness and topographic (relief) effects, which are reasonably constant over time, however can also be affected by more variable local atmospheric conditions including atmospheric stability and turbulence.
Atmospheric stability is determined by the total heat flux to the ground, primarily being the sum of incoming solar and outgoing thermal radiation and heat exchanged with the air. During clear summer days (incoming radiation dominates) air is heated from below and rises, causing significant thermal mixing, vertical air movements and turbulence. This process limits large variations in the vertical wind velocity profile.
During clear nights when outgoing radiation dominates, air is cooled from below, air density is greatest closer to the ground and minimal thermal mixing occurs. This leads to a stable atmosphere where horizontal layers of air are largely decoupled and allows for a higher wind velocity gradient.
The noise assessment methodology outlined in the SA EPA Guidelines, as in many other similar wind farm noise assessment methodologies, by necessity rely on the independently verified reference sound power data available for specific wind turbines measured at a manufacturer's test site. The measurement procedure has been standardised (IEC 61400-11) to require sound power data to be measured coincidentally with reference wind speed measurements at an altitude of 10 metres.
As discussed in Section 7.2 the SA EPA Guideline methodology has been adapted to the alternative reference wind speed at a height of 100 metres AGL which is more representative of hub height wind speed. Accordingly the turbine sound power level data has been amended to the appropriate 100 m AGL wind speed. This approach goes some way to alleviating the variability that changing wind profiles has with respect to a 10 metre reference height.
While the assessed layout meets the requirements of the SA EPA Guidelines, some uncertainty remains as to the likely noise conditions that will result under specific atmospheric conditions over time. The SA EPA Guidelines noise limits are generally set within the requirements of the WHO Guidelines that relate to health impacts, and it is highly unlikely that the remaining uncertainty could lead to health impacts. However, it is possible that under certain conditions the amenity of existing dwellings could be reduced notwithstanding compliance with SA EPA Guidelines. These conditions are likely to be variable and intermittent, and not result in a long-term loss in amenity.
An adaptive management approach could be implemented if undue noise impacts are identified during WTG operation that are related to elevated WTG noise levels during stable atmosphere conditions. Refer to Section 4.3 for more details.
9.2 Temperature Inversions
Temperature inversion is an atmospheric condition in which temperature increases with height above ground. Such conditions may increase noise levels by focussing sound wave propagation paths at a single point. Temperature inversions occurring within the lowest 50m to 100m of atmosphere can affect noise levels measured on the ground. Temperature inversions are most commonly caused by radiative cooling of the ground at night leading to cooling of the air in contact with the ground. Such conditions are especially prevalent on cloudless nights with little wind.
The SA EPA Guidelines do not require or suggest temperature inversions be included during wind farm noise assessments. The NSW INP states that temperature inversions be included in an assessment if they are deemed to be a prevalent feature of the environment, which generally requires they occur for greater than 30% of the total night-time during winter (approximately two nights per week between 6:00 pm and 7:00 am). Currently there is insufficient data available to accurately determine the prevalence of temperature inversions.

Union Fenosa Wind Australia Pty Ltd Paling Yards Wind Farm Noise Impact Assessment
Report Number 640.10127-R1 18 December 2014
Revision 5 Page 42
SLR Consulting Australia Pty Ltd
Conventional approaches to assessing noise propagation under temperature inversion conditions require knowledge of the temperature gradient and assume that the noise source is located below the temperature inversion, typically near to the ground. The effect of temperature inversions on noise propagation from highly elevated noise sources, such as WTG’s is therefore not typical of other sources.
WTG’s for the Paling Yards Wind Farm project are located on top of elevated ridges. The hub height (assumed acoustic centre of the WTG) is located typically located 80 m (or more) higher than receiver locations on the surrounding area. It is therefore unlikely that conventional temperature inversion conditions, in the lower 100m of the atmosphere, would significantly affect noise propagation from such an elevated source.
A further consideration must be that temperature inversions require little to no wind in order to minimise atmospheric mixing and hence develop. During calm conditions the WTGs are unlikely to operate, as their cut-in speed is typically 3m/s.
Notwithstanding the above, an adaptive management approach (See Section 9.3) could be implemented if undue noise impacts are identified during WTG operation that are related to temperature inversion effects.
9.3 Adaptive Management
If undue WTG noise impacts are identified during operations due to temperature inversion, atmospheric stability or other reasons, then an ‘adaptive management’ approach can be implemented to mitigate or remove the impact. This process could include;
Receiving and documenting noise impact complaint through ‘hotline’ or other means.
Investigating the nature of the reported impact.
Identifying exactly what conditions or times lead to undue impacts.
Operating WTG’s in a reduced ‘noise optimised’ mode during identified times and conditions (sector management).
Providing acoustic upgrades (glazing, façade, masking noise etc) to affected dwellings.
Turning off WTG’s that are identified as causing the undue impact.
9.4 Wind Turbine Vibration
Vibration or more specifically the oscillatory movement of receptor structures could potentially propagate from a source (in this case a wind farm) through either a ground path (ground borne vibration) or an airborne path as sound which could couple with lightweight structures and produce a movement in the structure.
9.4.1 Ground borne
Ground borne vibration levels attenuate with distance with varying amounts dependant upon such variables as frequency and geotechnical parameters. There are a few documented research reports with regards to wind farm generated ground vibration.
The Snow Report (Low Frequency Noise & Vibration Measurements at a Modern Wind Farm, ETSU W/13/01392/REP, D J Snow, 1997) describes measurements taken at a wind farm consisting of eleven 450 kW WTG’s, where noise and vibration measurements were taken at increasingly distant points up to 1 kilometre. Low frequency vibration was determined down to 0.1 Hz with varying wind speeds and on/off operation. The research found that the absolute level of vibration signals measured at any frequency at 100 metres from the nearest WTG were significantly below the most stringent criteria given by BS 6472:1992 Evaluation of human exposure to vibration in buildings (1Hz to 80Hz). Furthermore vibration in the 0.5Hz to 1Hz range remained at similar levels when the wind farm was not operating, suggesting that the vibration measured may have been due to other (ambient) sources.

Union Fenosa Wind Australia Pty Ltd Paling Yards Wind Farm Noise Impact Assessment
Report Number 640.10127-R1 18 December 2014
Revision 5 Page 43
SLR Consulting Australia Pty Ltd
Detailed Microseismic and Infrasound Monitoring of Low Frequency Noise and Vibrations from Wind Farms were undertaken by the Applied and Environmental Geophysics Group of Keele University as part of a comprehensive report giving ‘Recommendations on The Siting of Wind Farm in the Vicinity the Eskdalemuir, Scotland’. The Eskadelmuir Seismic Array (EKA) is in the southern uplands of Scotland and is sited on a very quiet magnetic and seismic environment with twin 9 km long lines of seismometer instrumentation which are sensitive enough to pick up nuclear explosions from up to 15,000 km away. It should be noted that the objective of the study was to measure vibration levels many orders of magnitude lower than project criteria detailed in Section 0
The Eskdalemuir report details results taken from St Breock Downs wind farm (possibly the same measurements taken in the Snow Report). From the documented seismic vibration measurements taken at 25 metres from a single WTG a peak particle velocity (PPV) of approximately 8x10
-5 mm/s
has been calculated. This is approximately 2500 orders of magnitude lower than project criteria. Whilst we note that turbines proposed for Paling Yards Wind Farm are larger than those measured above we are confident that ground vibration will be completely imperceptible at surrounding receptors. Furthermore, our own experience and observations at other operating wind farms has not indicated perceptible ground vibration at any distance from turbines.
9.4.2 Air borne
A good deal of misunderstanding and attention has been given in recent times to low frequency noise and infrasound generated by wind farms. Infrasound at sufficient levels has the potential to be perceived as vibration or alternatively cause the movement of lightweight structures which then in turn are perceived as vibration. It should be noted that the sometimes audible cyclical modulation of aerodynamic noise, the ‘swish swish’ of blades, is often mistakenly identified as low frequency noise, where it actually is the low frequency modulation of audible noise.
The subject is most complex, dealing with frequencies that are sub audible, requiring alternative frequency weighting scales, specialist measurement equipment and techniques, and evaluating the variance of hearing sensitivity in a population at low frequency. Furthermore, it will depend on many variables including turbine type and size, wind conditions (including turbulence), propagation distance, building structure and materials, room sizing and positioning within room.
Comprehensive review, measurement testing and evaluation are offered in numerous technical reports investigating infrasound and low frequency noise from wind farms including;
A Review of Published Research on Low Frequency Noise and its Effects - Report for Defra by Dr Geoff Leventhall assisted by Dr Peter Pelmear and Dr Stephen Benton - 2002 (refer http://www.defra.gov.uk/environment/quality/noise/research/lowfrequency/documents/lowfreqnoise.pdf )
The Measurement of Low Frequency Noise at Three UK Wind Farms - report for DTI by Hayes McKenzie Partnership – 2006 (refer http://www.berr.gov.uk/files/file31270.pdf)
Wind turbines & Infrasound 2006 - Report for Canadian Wind Energy Association (CanWEA) by Howe Gastmeier Chapnik Limited (HGC Engineering) - 2006 (refer http://www.canwea.ca/images/uploads/File/CanWEA_Infrasound_Study_Final.pdf)
Wind Farms Technical Paper – Environmental Noise – report for Clean Energy Council Australia by Sonus Pty Ltd – 2010 (refer http://www.cleanenergycouncil.org.au/cec/mediaevents/media-releases/November2010/sonus-report.html )
The consensus drawn by all investigations is that infrasound noise emissions from modern WTG’s are significantly below the recognised threshold of perception for acoustic energy within this range.
9.5 Substation Transformer Noise Levels
The appropriate noise criteria for Substation Noise are provided in NSW INP (See Section 4.2 and 4.4). Australian Standard AS 60076 Part 10 2009: “Power Transformers – Determination of sound

Union Fenosa Wind Australia Pty Ltd Paling Yards Wind Farm Noise Impact Assessment
Report Number 640.10127-R1 18 December 2014
Revision 5 Page 44
SLR Consulting Australia Pty Ltd
levels” indicates that the 200 MVA transformer facility may produce sound power levels up to 99 dB. The dominant frequency of such a transformer is 100 Hz.
Noise predictions for transformer substations have been made using CONCAWE algorithms assuming an absolute ‘worst case’ meteorology enhancement condition of downwind 3 m/s and Pasquill Stability Class F temperature inversion. The results are presented in Table 15 for the nearest receptor locations, along with the appropriate NSW INP limit (See Section 10 for RBL derivation).
Table 15 Predicted ‘worst case’ 200 MVA switching substation noise
NSW Industrial Noise Policy Criteria
Location Predicted Noise Level, Leq dB(A)
RBL (Night) Noise Limit (Amenity Criteria)
Complies?
8A 35.3 40 45 Yes
8 33.4 40 45 Yes
2A 29.5 28 33 Yes
7A 27.8 37 42 Yes
9 26.8 35 40 Yes
9A 26.7 35 40 Yes
9.6 Transmission Line Noise (Corona Noise)
Corona noise is caused by the partial breakdown of the insulation properties of air surrounding the conducting wires. It generally only occurs in humid conditions, as provided by fog or rain. A minimum line potential of 70 kV or higher is required to generate corona noise depending on the electrical design. Corona noise does not occur on domestic distribution lines.
Corona noise has two major components, a low frequency tone associated with the frequency of the AC supply (100 Hz for 50 Hz source) and broadband noise. The tonal component of the noise is related to the point along the electric waveform at which the air begins to conduct. This varies with each cycle and consequently the frequency of the emitted tone is subject to great fluctuations. Corona noise can be characterised as broadband ‘crackling’ or ‘buzzing’ and is generally only a feature during foggy or raining conditions.
We have previously measured corona noise (reference GEHA Report 045-109/2 dated 9 November 2004) at a site near Officer in outer Melbourne, Victoria. We found it possible to measure corona noise at close distances, at high frequencies only, as other noise sources, namely traffic and birds, caused some interference at times. A 500 kV line was measured during damp foggy conditions.
At a distance of 30m along the ground from the line an Leq noise level of approximately 44 dBA was measured. At a distance of 100m the corona noise was calculated to be approximately 39 dBA.
Assuming a minimum RBL value of 30 dBA, the minimum intrusive criteria as determined by the NSW Industrial Noise Policy (INP) would be 35 dBA. We therefore conservatively estimate that the minimum criteria level of 35 dBA would be complied with at a distance of 240 metres.
The proposed route for the transmission lines has not been finalised but it is expected that it will traverse largely remote and uninhabited land. It is anticipated that sufficient buffer distances will render the occasional corona noise inaudible at residential receivers.

Union Fenosa Wind Australia Pty Ltd Paling Yards Wind Farm Noise Impact Assessment
Report Number 640.10127-R1 18 December 2014
Revision 5 Page 45
SLR Consulting Australia Pty Ltd
10 NSW DRAFT WIND FARM GUIDELINES
In December 2011 the NSW Department of Planning and Infrastructure released the Draft NSW Planning Guidelines Wind Farms – Appendix B: NSW Wind Farm Noise Guidelines.
Whilst the guidelines are yet to be finalised (and may be subject to change) and no supplementary DGRs have been issued requiring consideration of the proposed draft guidelines, the Department of Planning and Infrastructure has that during the interim period due consideration should be given to a number of the additional requirements of the proposed draft guideline. These are presented below.
10.1 Daytime vs. Night-time Background Noise
The background noise data was reprocessed to define background noise curves for the daytime period (7.00 am to 10.00 pm) and night-time period (10.00 pm to 7.00 am) as defined by the draft guideline. The corresponding 3
rd order regression curve and correlation coefficient are presented in
Table 16 below.
Table 16 Background Noise Regression Curves and Correlation Coefficient
Location Daytime Daytime R2 Night-time Night-time R
2
Location 9 -0.0072x^3 + 0.2096x^2 - 0.368x + 27.401 R² = 0.538
0.0115x^3 - 0.4504x^2 + 7.252x - 2.7754 R² = 0.6022
Location 8 0.0015x^3 - 0.0811x^2 + 2.8258x + 22.128 R² = 0.546
0.0088x^3 - 0.3386x^2 + 5.9214x + 8.6209 R² = 0.5443
Location 7 0.0058x^3 - 0.2184x^2 + 3.9291x + 17.384 R² = 0.6598
-0.0047x^3 + 0.1255x^2 + 0.6831x + 23.498 R² = 0.5417
Location 4 -0.004x^3 + 0.098x^2 + 0.9419x + 20.74 R² = 0.538
0.0162x^3 - 0.6073x^2 + 8.8977x - 10.159 R² = 0.5951
Location 6 0.0019x^3 - 0.0462x^2 + 1.9084x + 19.844 R² = 0.5268
0.0162x^3 - 0.587x^2 + 8.4844x - 5.8308 R² = 0.5231
Location 115 0.0053x^3 - 0.2857x^2 + 6.3246x + 2.2794 R² = 0.6613
-0.0139x^3 + 0.3565x^2 - 0.4233x + 24.338 R² = 0.6245
Location 128 -0.0008x^3 + 0.034x^2 + 1.401x + 17.703 R² = 0.5775
0.0174x^3 - 0.4591x^2 + 5.5582x + 5.0001 R² = 0.5604
Location 10 0.0026x^3 - 0.0444x^2 + 0.6459x + 29.228 R² = 0.2725
0.0007x^3 + 0.0364x^2 - 0.5221x + 33.175 R² = 0.4057
Daytime regression curves were typically 0.5 to 1dB higher than the regression curve based on the full data set. Night-time regression curves were typically 1 to 2 dB lower than the regression curves based on the full data set.
The new background noise curves were used to update the noise limit curves for all receptors and all predicted results were assessed against these criteria. There were no exceedances of the daytime only or night-time only criteria for non-project involved receivers. The maximum exceedance for project-involved receivers was determined by the 45 dBA criteria, rather than the Background + 5 criteria and so is identical to the maximum exceedance presented in Table 14 (See Section 9).
Table 17 below shows the exceedances for project involved locations for the night-time criteria. Note that this is determined as 45 dBA or Background + 5 dBA, as per WHO guidelines.
Table 17 NSW Draft Wind Farm Guidelines Exceedances – Night-time Criteria
Location Exceedance at Hub Height Wind Speed MAX
4.3 5.7 7.2 8.6 10.0 11.5 12.9 14.3 15.8 17.2
7A* 2.4 3.4 3.3 3.1 3.0 3.0 1.4 3.4
9A*
0.8 0.6 0.4 0.4 0.4 0.4 0.8

Union Fenosa Wind Australia Pty Ltd Paling Yards Wind Farm Noise Impact Assessment
Report Number 640.10127-R1 18 December 2014
Revision 5 Page 46
SLR Consulting Australia Pty Ltd
9B*
0.7 0.5 0.4 0.3 0.3 0.3 0.6
8*
0.3
0.3
8A*
0.2
0.2
9* 0.1 0.1
7* 0.1 0.1
The maximum exceedance for each of these locations is the same as for the original assessment; however, the exceedances at other wind speeds have very slightly increased. Comments regarding noise levels at these locations with respect to their use throughout the year can be found in Section 9.
10.2 Special Audible Characteristics
The Draft NSW Guidelines have been developed with the fundamental characteristics of wind turbine noise taken into consideration including reasonable levels of swish, modulation, discrete tones and low frequency noise.
The Draft NSW Guidelines introduce recommendations for procedures to assess excessive levels of special audible character and these procedures (if adopted) are to be used to evaluate noise character from an operational wind farm. Notwithstanding the above, the proposed procedures have been adapted to evaluate the predicted likelihood of excessive levels of special audible character.
10.2.1 Low Frequency Noise
An assessment of the potential for low frequency noise was completed with C-weighted noise levels predicted for the assessed layout.
A criteria of 65 dBC daytime and 60 dBC night-time as proposed by the Draft NSW Guidelines was used to determine if further investigation into low frequency noise was warranted.
The results from the SoundPlan model predict that wind turbine noise would only exceed 60 dBC for one receiver location, Location 7A, the predicted exceedance was 0.8 dBC. A full set of results for this analysis is shown in Appendix G. This is a relatively small exceedance of the critera, however, as post-construction monitoring is already planned for this location (See Section 9), it is recommended that low frequency noise is investigated at that time.
10.2.2 Tonality
The simplified 1/3 octave band method for assessing tonality as proposed by the Draft NSW Guidelines was completed for the assessed layout using the same method evaluated in Section 7.3.
The tonality tests showed no presence of tonality in the predicted results. A full set of results for this analysis is shown in Appendix G.
10.2.3 Amplitude Modulation
Amplitude modulation (AM) refers to the cyclical modulation of audible aerodynamic noise from WTGs. The modulation typically occurs at rate corresponding to blade passing frequency which is approximately once per second (i.e. ~1 Hz). This is not to be confused with infrasound, that is, sound waves at frequencies below the range of human hearing; rather it refers to the fluctuation of noise level in the audible range.
Noise from a wind turbine typically includes an inherent level of amplitude modulation, often referred to as ‘swish’ and the criteria in the Draft NSW Guidelines have been determined with the inherent characteristics of wind turbine noise – including reasonable levels of amplitude modulation – taken into consideration. The Draft NSW Guidelines propose an excessive level of modulation is taken to be a variation of greater than 4 dBA at the blade passing.

Union Fenosa Wind Australia Pty Ltd Paling Yards Wind Farm Noise Impact Assessment
Report Number 640.10127-R1 18 December 2014
Revision 5 Page 47
SLR Consulting Australia Pty Ltd
The issue of AM of WTG noise is now the subject of considerable research and investigation and whilst ‘normal’ amplitude modulation (swish) is generally well characterised and the source mechanism better understood, the hypothesised potential causes of excessive (Other) AM are somewhat more complex and not well understood.
Research into AM undertaken by Salford University in 2007, found that out of the total number of operational wind farms investigated (133) in the UK approximately 20% at some point had registered a noise complaint(s); but AM was considered to be a factor in noise complaints at only 3% of the sites and a possible factor at 6% of the sites. Furthermore, the periods when AM complaints were registered at four wind farms determined that the necessary conditions were relatively infrequent. From this it appears that whatever the actual number of occurrences of potential excessive AM, it only occurs at a minority of wind farm sites for a small amount of the time.
There currently is no means to predict the eventuality, severity or frequency of occurrence of excessive AM and the proposed Draft NSW Guideline methodology is limited to the assessment of operational wind farms. Research evidence would suggest that excessive AM has only been confirmed at a small number of wind farm sites and when it occurs it is relatively infrequent.
Nevertheless, should excessive AM be found to be a problem with the wind farm, it would be possible to limit the impact on the residents through adaptive management techniques (See also Section 9.3).

Union Fenosa Wind Australia Pty Ltd Paling Yards Wind Farm Noise Impact Assessment
Report Number 640.10127-R1 18 December 2014
Revision 5 Page 48
SLR Consulting Australia Pty Ltd
11 ASSESSMENT OF CONSTRUCTION NOISE & VIBRATION LEVELS
11.1 Project Construction Noise The appropriate criteria for construction noise are provided in the Interim Construction Noise Guidelines (DECC, 2009) (See Sections 4.2 and 4.6).
Construction activities include;
construction of access roads,
establishment of turbine tower foundations and electrical substation,
digging of trenches to accommodate underground power cables,
erection of turbine towers and assembly of WTG’s.
The equipment required to complete the above tasks will typically include:
bucket loader, rock breaker, drill rig, excavator/grader, bulldozer, dump trucks,, vibratory roller flat bed truck, concrete truck
cranes, fork lift, and various 4WD and service vehicles.
The anticipated construction period is anticipated to be less than 18 to 24 months, with civil works expected to span approximately 12 to 15 months, however, due to the large area of the wind farm site, intensive works will be located within a distance of potential impact for each surrounding residential receiver for only very short and intermittent periods of time.
It is anticipated that most construction will occur during standard construction hours and it is therefore considered appropriate that construction noise levels up to 10 dBA above the RBL’s would be acceptable. Construction noise levels greater than 10 dBA above RBL could be considered as ‘noise affected’ as defined by the Policy. At levels greater than 75 dBA receptors would be considered ‘highly noise affected’ by construction noise as defined by the Policy.
11.2 Ambient Background Noise Levels
Noise monitoring data presented in Section 7.3 was used to determine the RBL for each period in accordance with the DECCW Guidelines. Table 18 shows the RBL for each monitoring location.
Table 18 Summary of Rating Background Levels (RBL’s) for Monitoring Locations
RBL (dBA)
Measurement Location
Day
(0700 h – 1800 h)
Evening
(1800 h – 2200 h)
Night
(2200 h – 0700 h)
9 33 34 35
8 41 41 40
7 38 39 37
4 28 29 28
6 32 36 34
115 40 43 41
128 30 30 28
10 32 31 32

Union Fenosa Wind Australia Pty Ltd Paling Yards Wind Farm Noise Impact Assessment
Report Number 640.10127-R1 18 December 2014
Revision 5 Page 49
SLR Consulting Australia Pty Ltd
11.3 Noise Modelling Parameters
In order to calculate the noise levels at the various noise sensitive receiver locations from construction equipment associated with the project, a SoundPLAN (Version 7) environmental computer model was developed.
The computer model predicts noise levels by taking into account such factors as the source sound power levels and locations of sound, distance attenuation, ground absorption, air absorption and shielding attenuation, as well as meteorological conditions, including wind effects. The noise model uses prediction algorithms in accordance with the Conservation of Clean Air and Water Europe (CONCAWE) prediction methodology which allows for conservative ‘worst case’ meteorological propagation conditions.
Sound power levels used to derive the predicted construction noise were based on data provided in the SLR Consulting noise source database. Computer noise models of typical construction scenarios were developed which included all anticipated mobile equipment for the activity operating simultaneously at full load. Table 19 shows typical sound power levels of equipment used in wind farm construction.
Table 19 Typical Construction Equipment
Equipment Octave band mid frequency - Leq Sound Power Levels dB
63 125 250 500 1 K 2 k 4 K dBA
Excavator 121 126 111 107 106 101 96 113
Grader 118 124 115 114 115 114 113 120
Dump Truck 111 105 108 106 107 104 99 111
Rock Breaker 113 115 117 122 121 120 118 126
Concrete Truck 104 101 96 95 94 93 91 100
Front End Loader 120 117 101 101 92 88 88 104
Crane 108 105 109 107 111 105 97 113
Bulldozer 113 119 110 109 110 109 108 115
Concrete Batching 100 97 92 91 90 89 87 96
Delivery Trucks 118 110 99 104 99 95 91 105
4WD vehicles 96 92 88 84 84 80 75 88
To examine the possible worst case construction noise impacts for all nearby receivers, four different construction scenarios were modelled at each turbine location and the highest noise levels for each receiver predicted. These are:
Construction of Access Roads
Establishment of Turbine Foundations
Trench Excavation
WTG Erection and Assembly

Union Fenosa Wind Australia Pty Ltd Paling Yards Wind Farm Noise Impact Assessment
Report Number 640.10127-R1 18 December 2014
Revision 5 Page 50
SLR Consulting Australia Pty Ltd
11.4 Normal Working Hours Operation
Table 20 shows the predicted construction level for those receivers who are deemed noise affected, together with the Rating Background Level (RBL) obtained during the background noise monitoring campaign and applicable noise limit for the daytime period.
Table 20 Construction Noise Levels – Noise Affected Receivers
Location Construction Activity RBL Limit
Construction of Access Roads
Establishment of Turbine Tower Foundations
Trench Excavation
WTG Erection & Assembly
Day Day (RBL+10)
7A 56 48 62 50 41 51
8A 51 45 58 46 41 51
9B 53 46 59 47 33 43
9A 52 45 58 46 33 43
9 50 44 57 44 33 43
8 49 42 56 44 41 51
7 52 45 58 46 41 51
The highlighted cells would be classified as ‘noise affected’ when turbine foundation civil works are located nearby and should the operation of a rock breaker be necessary, however, due to the anticipated short period of localised works this would likely be considered acceptable. Operation of the rock-breaker is dependent upon the geotechnical conditions of the foundation site and would be operated intermittently at most. Consideration for mitigation measures such as localised shrouding may be needed if adverse conditions are experienced if and when operating the rock-breaker at the most exposed positions.
No predicted levels exceed 75 dBA and therefore no receptors would be considered as being ‘highly noise affected’ as defined by the policy.
In consideration that the predicted levels represent ‘worst case’ construction scenarios and are within limits which would be considered acceptable, it is unlikely that construction noise within normal operating hours will cause any unnecessary impact.
11.5 Outside Normal Operating Hours Operation
The only operation likely to occur at night is the erection of WTG’s, as low wind conditions are preferable while the towers are being erected by large cranes. Table 23 below shows all noise affected receivers for this construction activity for the night period.
Table 21 Night Construction Noise Levels – Noise Affected Receivers
Location Construction Activity RBL Limit
WTG Erection & Assembly Night Night (RBL+ 5)
7A 50 40 45
8A 46 40 45
9B 47 35 40
9A 46 35 40
9 44 35 40
7 46 40 45

Union Fenosa Wind Australia Pty Ltd Paling Yards Wind Farm Noise Impact Assessment
Report Number 640.10127-R1 18 December 2014
Revision 5 Page 51
SLR Consulting Australia Pty Ltd
While no predicted levels exceed 75 dBA and therefore no receptors would be considered as being highly noise affected, tower erection near these locations should occur during the daytime, if possible. We note that the affected locations are the secondary dwellings discussed in Section 4.3 and as such may not be occupied during this stage of construction.
11.5.1 Concrete Batching Plants
A portable concrete batching plant (combined Sound Power Level of 115 dBA) will be required to supply concrete onsite. The proposal location of this batching plant is shown in Figure 20 below.
Using the existing SoundPlan noise model, predicted noise levels for the proposed batch plant site at the nearest affected properties were calculated under worst case conditions. These results are shown in Table 22, along with the RBL and night-time limit (the lowest noise limit) for each location.
Figure 20 Concrete Batching Plant Location
Table 22 Concrete Batch Plant Noise Level Prediction
All locations are predicted to be below the night-time noise limit and most locations are predicted to be below the relevant rating background level for that location.
11.6 Construction Vibration Assessment
The activities and equipment with the potential to generate the highest levels of ground vibration are the operation of the vibratory roller during construction of access roads and the operation of the rock breaker during establishment of turbine tower foundations. Typical vibration levels from these sources are presented in Table 23.
Location Predicted Noise Level, dBA RBL - Night Night Limit
8A 41 40 45
8 39 40 45
7A 37.7 40 45
7 32.7 40 45
9 28.7 35 40
9A 28.6 35 40
n 26.7 35 40
9B 20.5 35 40

Union Fenosa Wind Australia Pty Ltd Paling Yards Wind Farm Noise Impact Assessment
Report Number 640.10127-R1 18 December 2014
Revision 5 Page 52
SLR Consulting Australia Pty Ltd
Table 23 Typical Vibration Emission Levels from Construction Plant
Activity PPV Vibration Level (mm/s) at Distance
10m 20m 30m
4-Tonne Vibratory Roller 2.0 - 2.4 0.4 - 1.2 0.2 - 0.8
Hydraulic Hammer (30t) 3 1.5 1.0
It is evident that given the large distances between receptors and structures where construction works are likely to be undertaken (refer to Appendix C), the building damage and human comfort vibration criteria will easily be met during construction.
11.7 Blasting
11.7.1 Blasting Assessment
Blasting may be required in some areas to clear large rock outcrops to prepare turbine foundations.
The proposed wind farm site is a green field site where no previous blasting or blast monitoring has been conducted and therefore no specific site laws exist. We have therefore adopted a site law derived from measurement data at a different site to give an indicative result.
The 5% site laws for ground vibration and airblast are:
Ground Vibration PVS (5%) = 16202 (SD1)-2.03
Airblast SPL(5%) = 189.3 - 31.8 log (SD2)
where PVS (5%) and SPL (5%) are the levels of ground vibration (Peak Vector Sum - mm/s) and airblast (dB Linear) respectively, above which 5% of the total population (of data points) will lie, assuming that the population has the same statistical distribution as the underlying measured sample.
SD1 and SD2 are the ground vibration and airblast scaled distances, where:
SD1=Distance
√MIC= (m.kg-0.5) and SD2=
Distance
√MIC3 = (m.kg-0.33)
Based on the blast emissions site laws, calculations were also conducted to indicate the allowable MIC’s for compliance with the general EPA Human Comfort criteria of 115 dB Linear (airblast) and 5 mm/s (ground vibration).
The closest anticipated distance between blasting and residences would be approximately 400 metres (7A). At this distance, based on a site constant Ka of 15, the predicted maximum MIC of up to 20 kg is likely to produce an airblast overpressure below the acceptable level of 115 dB Linear. An MIC of 20 kg is expected to result in a vibration level (Peak Vector Sum) of 0.011 mm/s, well within the recommended maximum level of 5 mm/s in the ANZECC Guidelines.
It is evident that the anticipated blasting is likely to meet all human comfort limits and building damage assessment criteria are easily met. All other sources of vibration would be less then above.
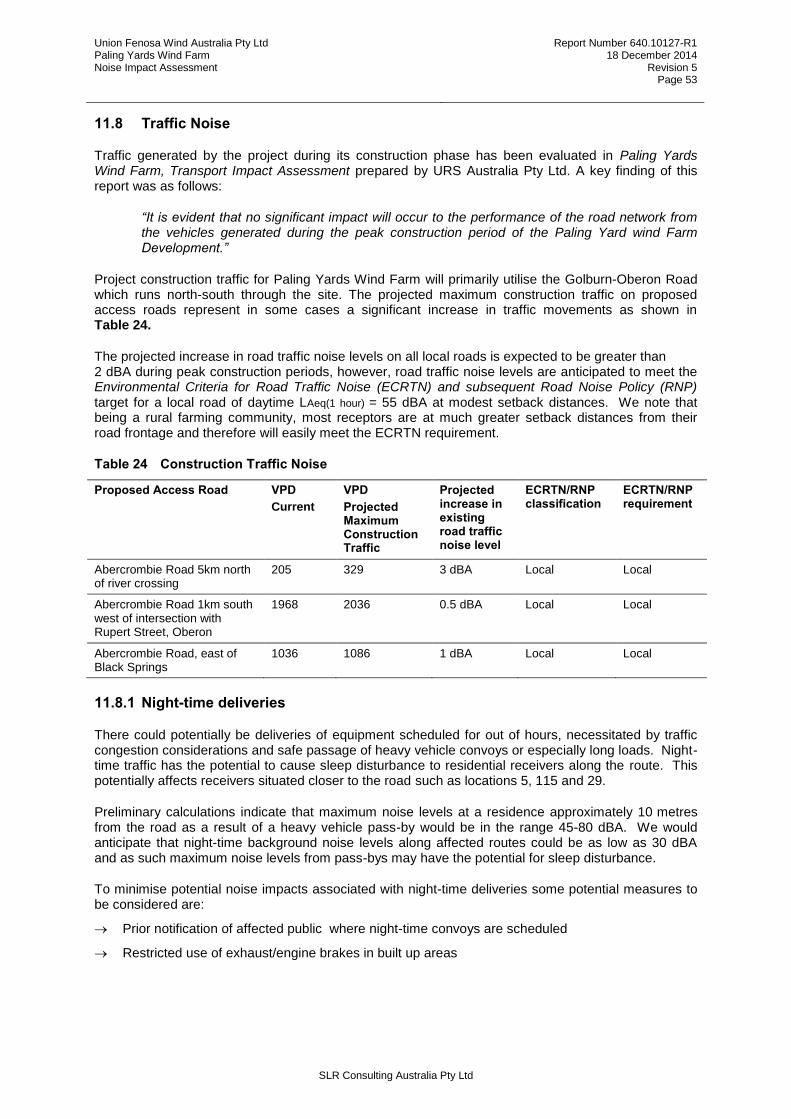
Union Fenosa Wind Australia Pty Ltd Paling Yards Wind Farm Noise Impact Assessment
Report Number 640.10127-R1 18 December 2014
Revision 5 Page 53
SLR Consulting Australia Pty Ltd
11.8 Traffic Noise
Traffic generated by the project during its construction phase has been evaluated in Paling Yards Wind Farm, Transport Impact Assessment prepared by URS Australia Pty Ltd. A key finding of this report was as follows:
“It is evident that no significant impact will occur to the performance of the road network from the vehicles generated during the peak construction period of the Paling Yard wind Farm Development.”
Project construction traffic for Paling Yards Wind Farm will primarily utilise the Golburn-Oberon Road which runs north-south through the site. The projected maximum construction traffic on proposed access roads represent in some cases a significant increase in traffic movements as shown in Table 24.
The projected increase in road traffic noise levels on all local roads is expected to be greater than 2 dBA during peak construction periods, however, road traffic noise levels are anticipated to meet the Environmental Criteria for Road Traffic Noise (ECRTN) and subsequent Road Noise Policy (RNP) target for a local road of daytime LAeq(1 hour) = 55 dBA at modest setback distances. We note that being a rural farming community, most receptors are at much greater setback distances from their road frontage and therefore will easily meet the ECRTN requirement.
Table 24 Construction Traffic Noise
Proposed Access Road VPD
Current
VPD
Projected Maximum Construction Traffic
Projected increase in existing road traffic noise level
ECRTN/RNP classification
ECRTN/RNP requirement
Abercrombie Road 5km north of river crossing
205 329 3 dBA Local Local
Abercrombie Road 1km south west of intersection with Rupert Street, Oberon
1968 2036 0.5 dBA Local Local
Abercrombie Road, east of Black Springs
1036 1086 1 dBA Local Local
11.8.1 Night-time deliveries
There could potentially be deliveries of equipment scheduled for out of hours, necessitated by traffic congestion considerations and safe passage of heavy vehicle convoys or especially long loads. Night-time traffic has the potential to cause sleep disturbance to residential receivers along the route. This potentially affects receivers situated closer to the road such as locations 5, 115 and 29.
Preliminary calculations indicate that maximum noise levels at a residence approximately 10 metres from the road as a result of a heavy vehicle pass-by would be in the range 45-80 dBA. We would anticipate that night-time background noise levels along affected routes could be as low as 30 dBA and as such maximum noise levels from pass-bys may have the potential for sleep disturbance.
To minimise potential noise impacts associated with night-time deliveries some potential measures to be considered are:
Prior notification of affected public where night-time convoys are scheduled
Restricted use of exhaust/engine brakes in built up areas

Union Fenosa Wind Australia Pty Ltd Paling Yards Wind Farm Noise Impact Assessment
Report Number 640.10127-R1 18 December 2014
Revision 5 Page 54
SLR Consulting Australia Pty Ltd
12 CONCLUSION
Noise from wind turbines for the proposed Paling Yards Wind Farm has been predicted and assessed against the relevant criteria prescribed by the SA EPA Guideline and World Health Organisation (WHO) goals where appropriate using the indicative layout and an assumed mix of turbines. An evaluation of night-time baseline data was also included.
All non-project involved receptors were found to be below the noise criteria stipulated in SA EPA Guidelines. Some project involved receptors are predicted to slightly exceed the WHO noise criteria, however these locations are used for part of the year only and it is proposed to enter into a noise agreement regulating their use and that these will not be used should post construction noise testing definitively show an exceedance of the criteria.
The project is yet to select and finalise the WTG layout and WTG makes/models. Upon finalising the layout and WTG models a revised noise prediction and assessment will be completed in which the noise impact mitigation techniques listed in Section 9.3 will be investigated thoroughly to produce a fully compliant layout.
WTG vibration levels have been evaluated and based upon overseas research available were found to be acceptable.
Construction noise and vibration impacts have been assessed and the ‘worst case’ scenarios modelled were found to be generally acceptable.
Blasting impact has been assessed and found to be acceptable. With a maximum instantaneous charge (MIC) of up to 20 kg, the airblast overpressure is anticipated to be below the acceptable level of 115 dB Linear for all existing residences. Similarly, vibration levels are anticipated to be well below the acceptable criteria.
Construction traffic noise impact has been assessed and the ‘worst case’ maximum construction traffic generated scenario would increase existing traffic noise levels along local roads by up to 4-7 dBA but due to the typically large setback of dwellings from the road network would result in noise level that would be considered acceptable under the ECRTN and RNP.
Subsequent to a request by the Department of Planning, due consideration has been paid to a number of the additional requirements of the proposed Draft NSW Planning Guidelines Wind Farms – Appendix B: NSW Wind Farm Noise Guidelines released in December 2011. These include consideration to separate daytime and night-time periods and alternative methods of evaluation for Special Audible Character.
13 CLOSURE
This report has been prepared by SLR Consulting Australia Pty Ltd with all reasonable skill, care and diligence, and taking account of the manpower and resources devoted to it by agreement with the client. Information reported herein is based on the interpretation of data collected and has been accepted in good faith as being accurate and valid.
This report is for the exclusive use of Union Fenosa Wind Australia Pty Ltd. No warranties or guarantees are expressed or should be inferred by any third parties. This report may not be relied upon by other parties without written consent from SLR Consulting.
SLR Consulting disclaims any responsibility to the client and others in respect of any matters outside the agreed scope of the work.


![08123301994 [Telkomsel] dj paling hits, dj paling ngetop, dj indonesia](https://img.pdfslide.us/doc/110x75/589e1b5d1a28ab605b8b5a4f/08123301994-telkomsel-dj-paling-hits-dj-paling-ngetop-dj-indonesia.jpg)