Embed Size (px)
Citation preview
RESIDUAL MOISTURE MEASUREMENT AND CONTROL SYSTEM IN STENTER
PALI TEXTILE CLUSTER
BEE, 2010
Detailed Project Report on Residual Moisture measurement and
Control system in Stenter
Textile SME Cluster, Pali, Rajasthan (India)
New Delhi: Bureau of Energy Efficiency;
Detail Project Report No.: PAL/TXT/MCS/10
For more information Telephone +91-11-26179699
Bureau of Energy Efficiency (BEE) Fax+91-11-26178352
(Ministry of Power, Government of India) Websites: www.bee-india.nic.in
4th Floor, Sewa Bhawan Email: [email protected]/
R. K. Puram, New Delhi –110066 [email protected]
Acknowledgement
We sincerely appreciate the efforts of industry, energy auditors, equipment manufacturers,
technology providers, consultants and other experts in the area of energy conservation for
joining hands with Bureau of Energy Efficiency (BEE), Ministry of Power, Government of
India for preparing the Detailed Project Report (DPR) under BEE SME Program in SMEs
clusters. We appreciate the support of suppliers/vendors for providing the adoptable energy
efficient equipments/technical details to the SMEs.
We have received very encouraging feedback for the BEE SME Program in various SME
Clusters. Therefore, it was decided to bring out the DPR for the benefits of SMEs. We
sincerely thank the officials of BEE, Executing Agencies and ISTSL for all the support and
cooperation extended for preparation of the DPR. We gracefully acknowledge the diligent
efforts and commitments of all those who have contributed in preparation of the DPR.
CONTENTS
List of Annexures…………………………………………………………………………...……….vii
List of Figures…………………………………………………………………………………..…...vii
List of Tables…………………………………………………………………………...……….......viii
List of abbreviations………………..……………………..………………...…..…....……………viii
Executive summary………….…………..……..………………….......…...…….………………..ix
About Bee’s SME Program…………………..…...……………..……………………. ………….x
1.0 INTRODUCTION ...................................................................................................... 1
1.1 Brief Introduction about Cluster ................................................................................. 1
1.1.1 Energy usages pattern .............................................................................................. 2
1.1.2 Classification of Units ............................................................................................... 3
1.1.3 Production process of Textile dyeing and finishing.................................................... 4
1.2 Energy performance in existing situation .................................................................. 8
1.2.1 Average production ................................................................................................... 8
1.2.2 Fuel consumption ..................................................................................................... 8
1.2.3 Specific Energy Consumption (SEC) ........................................................................ 8
1.3 Identification of technology/equipment .....................................................................10
1.3.1 Description of technology/ equipment ......................................................................10
1.3.2 Role in process ........................................................................................................12
1.3.3 Energy audit methodology .......................................................................................14
1.3.4 Design and operating parameters specification .......................................................15
1.3.5 Operating efficiency analysis ...................................................................................16
1.4 Barriers in adoption of proposed technology/equipment ..........................................16
1.4.1 Technological Barrier ...............................................................................................17
1.4.2 Financial Barrier ......................................................................................................17
1.4.3 Skilled manpower ....................................................................................................18
1.4.4 Other barrier (If any) ................................................................................................18
2.0 PROPOSED EQUIPMENT ......................................................................................19
2.1 Detailed description of technology proposed............................................................19
2.1.1 Equipment specification ...........................................................................................21
2.1.2 Suitability over existing equipment ...........................................................................21
2.1.3 Superiority over existing equipment .........................................................................21
2.1.4 Availability of equipment ..........................................................................................21
2.1.5 Source of equipment ................................................................................................21
2.1.6 Technical specification of equipment .......................................................................22
2.1.7 Terms and conditions in sales of equipment ............................................................22
2.1.8 Process down time during implementation ...............................................................22
2.2 Life cycle assessment and risks analysis .................................................................22
2.3 Suitable Unit for Implementation of Proposed Technology .......................................22
3.0 ECONOMIC BENEFITS FROM PROPOSED EQUIPMENT ....................................23
3.1 Technical benefit .....................................................................................................23
3.1.1 Fuel saving ..............................................................................................................23
3.1.2 Electricity saving ......................................................................................................23
3.1.3 Improvement in product quality ................................................................................23
3.1.4 Increase in production .............................................................................................23
3.1.5 Reduction in raw material ........................................................................................23
3.1.6 Reduction in other losses.........................................................................................23
3.2 Monetary benefits ....................................................................................................23
3.3 Social benefits .........................................................................................................24
3.3.1 Improvement in working environment in the plant ....................................................24
3.3.2 Improvement in workers skill ....................................................................................24
3.4 Environmental benefits ............................................................................................24
3.4.1 Reduction in effluent generation ..............................................................................24
3.4.2 Reduction in GHG emission .....................................................................................24
3.4.3 Reduction in other emissions like SOX .....................................................................24
4.0 INSTALLATION OF PROPOSED EQUIPMENT .....................................................25
4.1 Cost of equipment implementation ...........................................................................25
4.1.1 Equipments cost ......................................................................................................25
4.1.2 Erection, commissioning and other misc. cost .........................................................25
4.2 Arrangements of funds ............................................................................................25
4.2.1 Entrepreneur’s contribution ......................................................................................25
4.2.2 Loan amount. ...........................................................................................................25
4.2.3 Terms & conditions of loan ......................................................................................25
4.3 Financial indicators ..................................................................................................25
4.3.1 Cash flow analysis ...................................................................................................25
4.3.2 Simple payback period ............................................................................................26
4.3.3 Net Present Value (NPV) .........................................................................................26
4.3.4 Internal rate of return (IRR) ......................................................................................26
4.3.5 Return on investment (ROI) .....................................................................................26
4.4 Sensitivity analysis ...................................................................................................27
4.5 Procurement and Implementation Schedule ............................................................27
vii
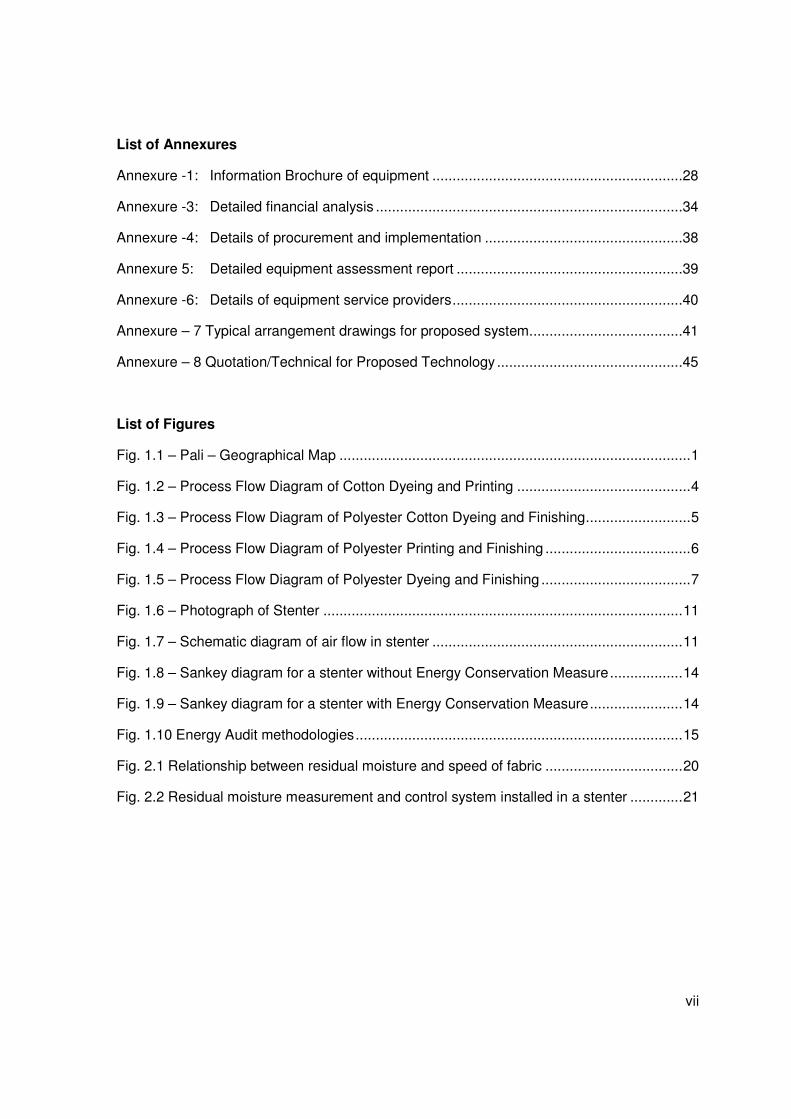
List of Annexures
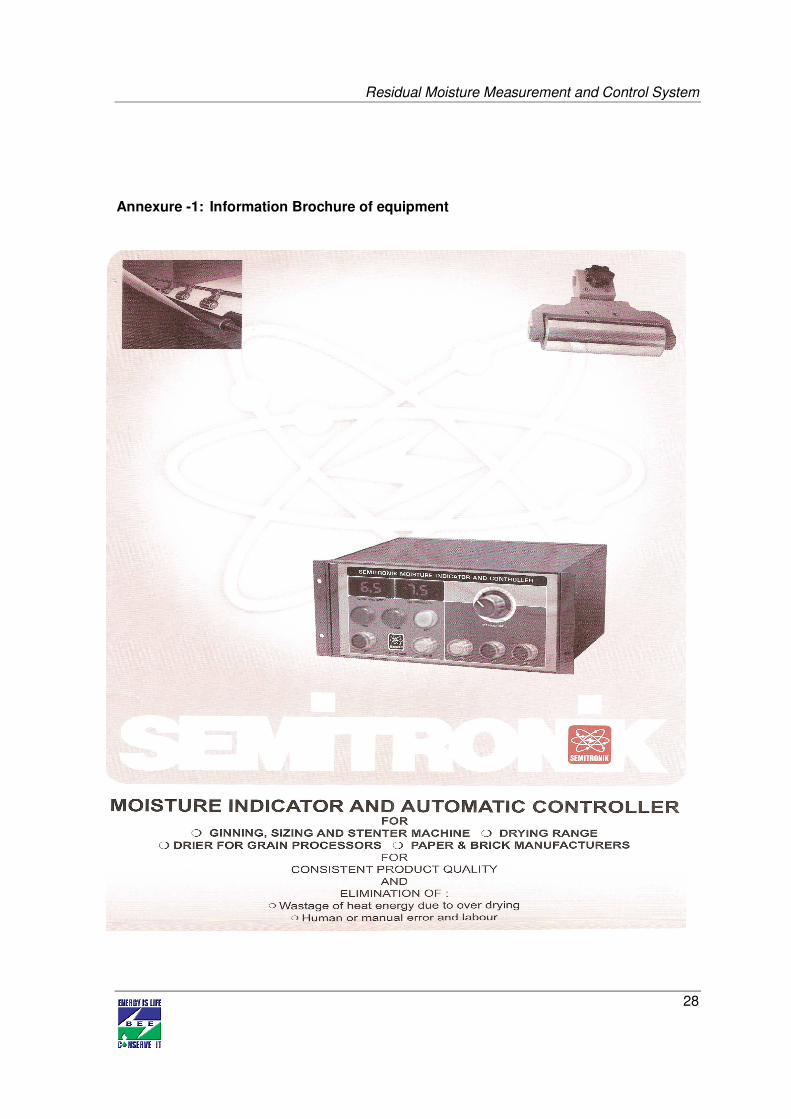
Annexure -1: Information Brochure of equipment ..............................................................28
Annexure -3: Detailed financial analysis ............................................................................34
Annexure -4: Details of procurement and implementation .................................................38
Annexure 5: Detailed equipment assessment report ........................................................39
Annexure -6: Details of equipment service providers .........................................................40
Annexure – 7 Typical arrangement drawings for proposed system ......................................41
Annexure – 8 Quotation/Technical for Proposed Technology ..............................................45
List of Figures
Fig. 1.1 – Pali – Geographical Map ....................................................................................... 1
Fig. 1.2 – Process Flow Diagram of Cotton Dyeing and Printing ........................................... 4
Fig. 1.3 – Process Flow Diagram of Polyester Cotton Dyeing and Finishing .......................... 5
Fig. 1.4 – Process Flow Diagram of Polyester Printing and Finishing .................................... 6
Fig. 1.5 – Process Flow Diagram of Polyester Dyeing and Finishing ..................................... 7
Fig. 1.6 – Photograph of Stenter ......................................................................................... 11
Fig. 1.7 – Schematic diagram of air flow in stenter .............................................................. 11
Fig. 1.8 – Sankey diagram for a stenter without Energy Conservation Measure .................. 14
Fig. 1.9 – Sankey diagram for a stenter with Energy Conservation Measure ....................... 14
Fig. 1.10 Energy Audit methodologies ................................................................................. 15
Fig. 2.1 Relationship between residual moisture and speed of fabric .................................. 20
Fig. 2.2 Residual moisture measurement and control system installed in a stenter ............. 21
viii
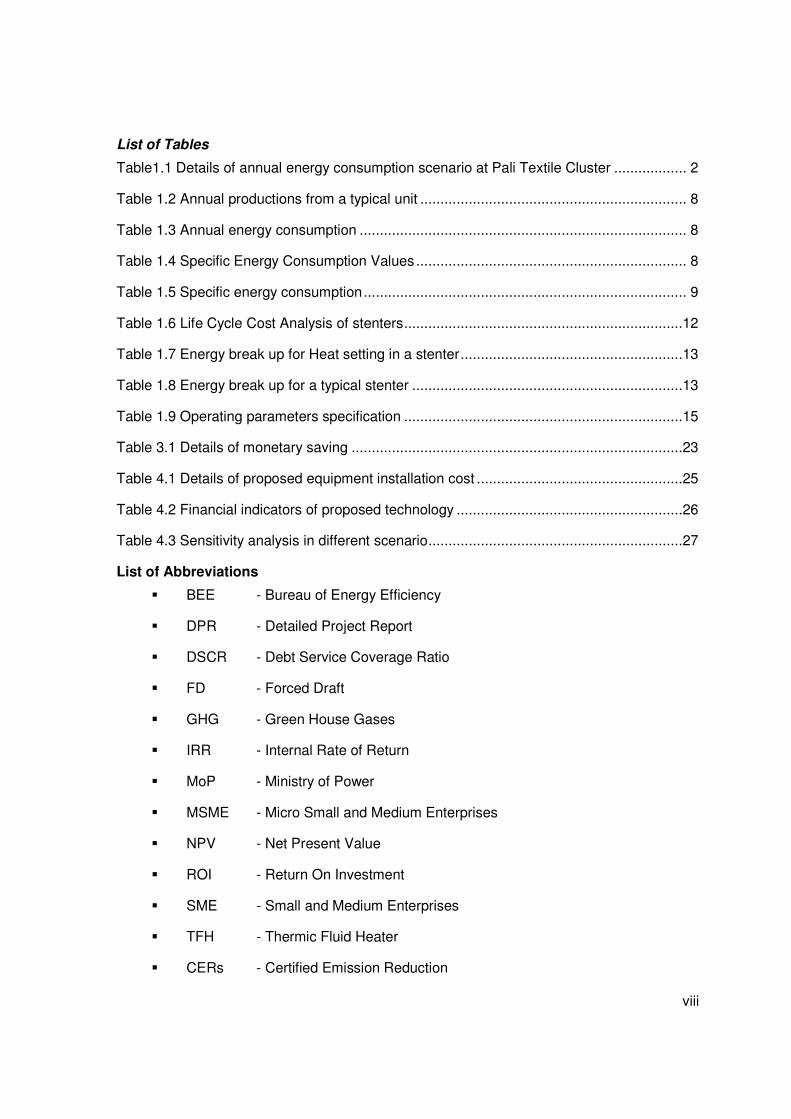
List of Tables
Table1.1 Details of annual energy consumption scenario at Pali Textile Cluster .................. 2
Table 1.2 Annual productions from a typical unit .................................................................. 8
Table 1.3 Annual energy consumption ................................................................................. 8
Table 1.4 Specific Energy Consumption Values ................................................................... 8
Table 1.5 Specific energy consumption ................................................................................ 9
Table 1.6 Life Cycle Cost Analysis of stenters .....................................................................12
Table 1.7 Energy break up for Heat setting in a stenter .......................................................13
Table 1.8 Energy break up for a typical stenter ...................................................................13
Table 1.9 Operating parameters specification .....................................................................15
Table 3.1 Details of monetary saving ..................................................................................23
Table 4.1 Details of proposed equipment installation cost ...................................................25
Table 4.2 Financial indicators of proposed technology ........................................................26
Table 4.3 Sensitivity analysis in different scenario ...............................................................27
List of Abbreviations
� BEE - Bureau of Energy Efficiency
� DPR - Detailed Project Report
� DSCR - Debt Service Coverage Ratio
� FD - Forced Draft
� GHG - Green House Gases
� IRR - Internal Rate of Return
� MoP - Ministry of Power
� MSME - Micro Small and Medium Enterprises
� NPV - Net Present Value
� ROI - Return On Investment
� SME - Small and Medium Enterprises
� TFH - Thermic Fluid Heater
� CERs - Certified Emission Reduction
ix
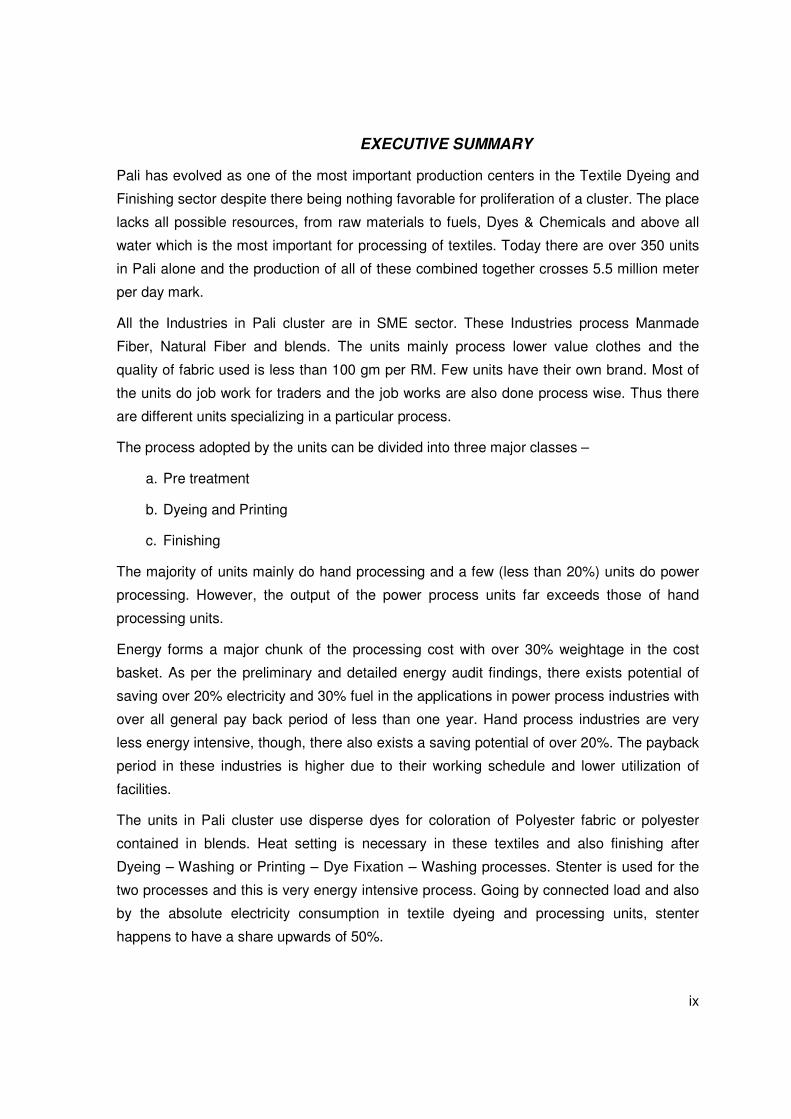
EXECUTIVE SUMMARY
Pali has evolved as one of the most important production centers in the Textile Dyeing and
Finishing sector despite there being nothing favorable for proliferation of a cluster. The place
lacks all possible resources, from raw materials to fuels, Dyes & Chemicals and above all
water which is the most important for processing of textiles. Today there are over 350 units
in Pali alone and the production of all of these combined together crosses 5.5 million meter
per day mark.
All the Industries in Pali cluster are in SME sector. These Industries process Manmade
Fiber, Natural Fiber and blends. The units mainly process lower value clothes and the
quality of fabric used is less than 100 gm per RM. Few units have their own brand. Most of
the units do job work for traders and the job works are also done process wise. Thus there
are different units specializing in a particular process.
The process adopted by the units can be divided into three major classes –
a. Pre treatment
b. Dyeing and Printing
c. Finishing
The majority of units mainly do hand processing and a few (less than 20%) units do power
processing. However, the output of the power process units far exceeds those of hand
processing units.
Energy forms a major chunk of the processing cost with over 30% weightage in the cost
basket. As per the preliminary and detailed energy audit findings, there exists potential of
saving over 20% electricity and 30% fuel in the applications in power process industries with
over all general pay back period of less than one year. Hand process industries are very
less energy intensive, though, there also exists a saving potential of over 20%. The payback
period in these industries is higher due to their working schedule and lower utilization of
facilities.
The units in Pali cluster use disperse dyes for coloration of Polyester fabric or polyester
contained in blends. Heat setting is necessary in these textiles and also finishing after
Dyeing – Washing or Printing – Dye Fixation – Washing processes. Stenter is used for the
two processes and this is very energy intensive process. Going by connected load and also
by the absolute electricity consumption in textile dyeing and processing units, stenter
happens to have a share upwards of 50%.
x
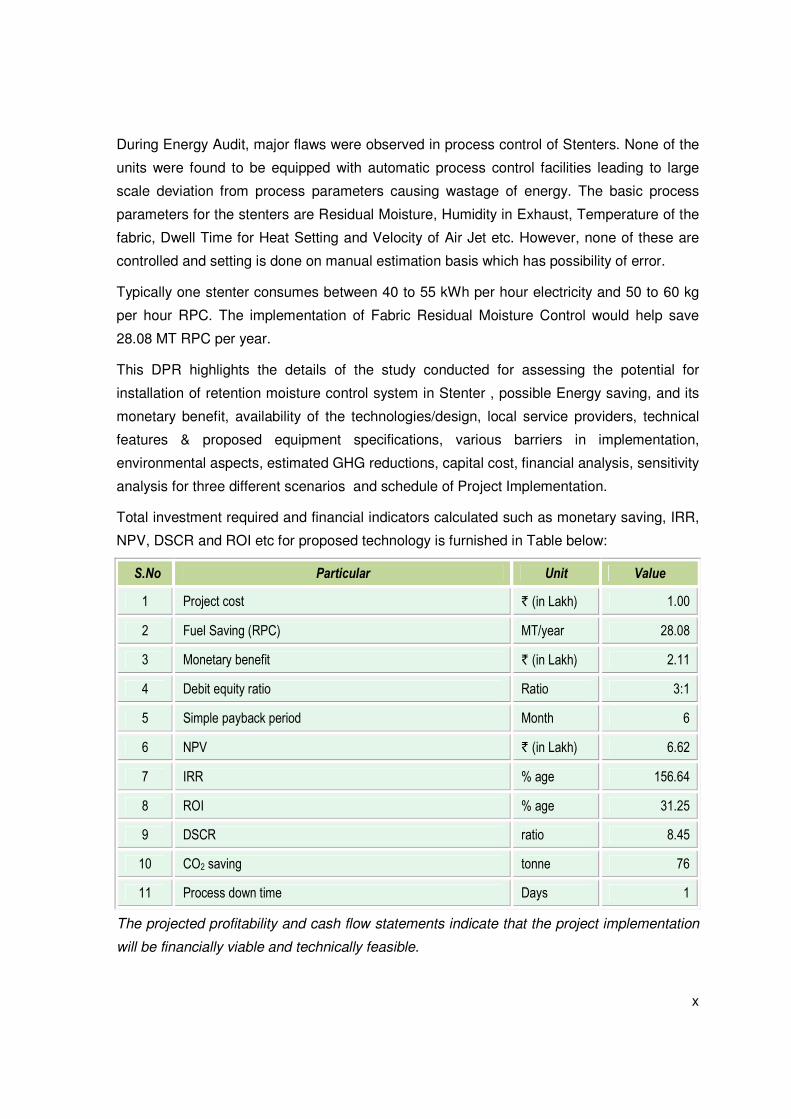
During Energy Audit, major flaws were observed in process control of Stenters. None of the
units were found to be equipped with automatic process control facilities leading to large
scale deviation from process parameters causing wastage of energy. The basic process
parameters for the stenters are Residual Moisture, Humidity in Exhaust, Temperature of the
fabric, Dwell Time for Heat Setting and Velocity of Air Jet etc. However, none of these are
controlled and setting is done on manual estimation basis which has possibility of error.
Typically one stenter consumes between 40 to 55 kWh per hour electricity and 50 to 60 kg
per hour RPC. The implementation of Fabric Residual Moisture Control would help save
28.08 MT RPC per year.
This DPR highlights the details of the study conducted for assessing the potential for
installation of retention moisture control system in Stenter , possible Energy saving, and its
monetary benefit, availability of the technologies/design, local service providers, technical
features & proposed equipment specifications, various barriers in implementation,
environmental aspects, estimated GHG reductions, capital cost, financial analysis, sensitivity
analysis for three different scenarios and schedule of Project Implementation.
Total investment required and financial indicators calculated such as monetary saving, IRR,
NPV, DSCR and ROI etc for proposed technology is furnished in Table below:
S.No Particular Unit Value
1 Project cost ` (in Lakh) 1.00
2 Fuel Saving (RPC) MT/year 28.08
3 Monetary benefit ` (in Lakh) 2.11
4 Debit equity ratio Ratio 3:1
5 Simple payback period Month 6
6 NPV ` (in Lakh) 6.62
7 IRR % age 156.64
8 ROI % age 31.25
9 DSCR ratio 8.45
10 CO2 saving tonne 76
11 Process down time Days 1
The projected profitability and cash flow statements indicate that the project implementation
will be financially viable and technically feasible.
xi
ABOUT BEE’S SME PROGRAM
Bureau of Energy Efficiency (BEE) is implementing a BEE-SME Programme to improve the
energy performance in 25 selected SMEs clusters. Pali Textile Cluster is one of them. The
BEE’s SME Programme intends to enhance the energy efficiency awareness by
funding/subsidizing need based studies in SME clusters and giving energy conservation
recommendations. For addressing the specific problems of these SMEs and enhancing
energy efficiency in the clusters, BEE will be focusing on energy efficiency, energy
conservation and technology up gradation through studies and pilot projects in these SMEs
clusters.
Major activities in the BEE -SME program are furnished below:
Activity 1: Energy Use and Technology Audit
The energy use technology studies would provide information on technology status, best
operating practices, gaps in skills and knowledge on energy conservation opportunities,
energy saving potential and new energy efficient technologies, etc for each of the sub sector
in SMEs.
Activity 2: Capacity Building of Stake Holders in Cluster on Energy Efficiency
In most of the cases SME entrepreneurs are dependent on the locally available
technologies, service providers for various reasons. To address this issue BEE has also
undertaken capacity building of local service providers and entrepreneurs/ managers of
SMEs on energy efficiency improvement in their units as well as clusters. The local service
providers will be trained in order to be able to provide the local services in setting of energy
efficiency projects in the clusters
Activity 3: Implementation of Energy Efficiency Measures
To implement the technology up gradation projects in clusters, BEE has proposed to
prepare the technology based detailed project reports (DPRs) for a minimum of five
technologies in three capacities for each technology.
Activity 4: Facilitation of Innovative Financing Mechanisms for Implementation of
Energy Efficiency Projects
The objective of this activity is to facilitate the uptake of energy efficiency measures through
innovative financing mechanisms without creating market distortion.
Residual Moisture measurement and control system in Stenter
1
1.0 INTRODUCTION
1.1 Brief Introduction about Cluster
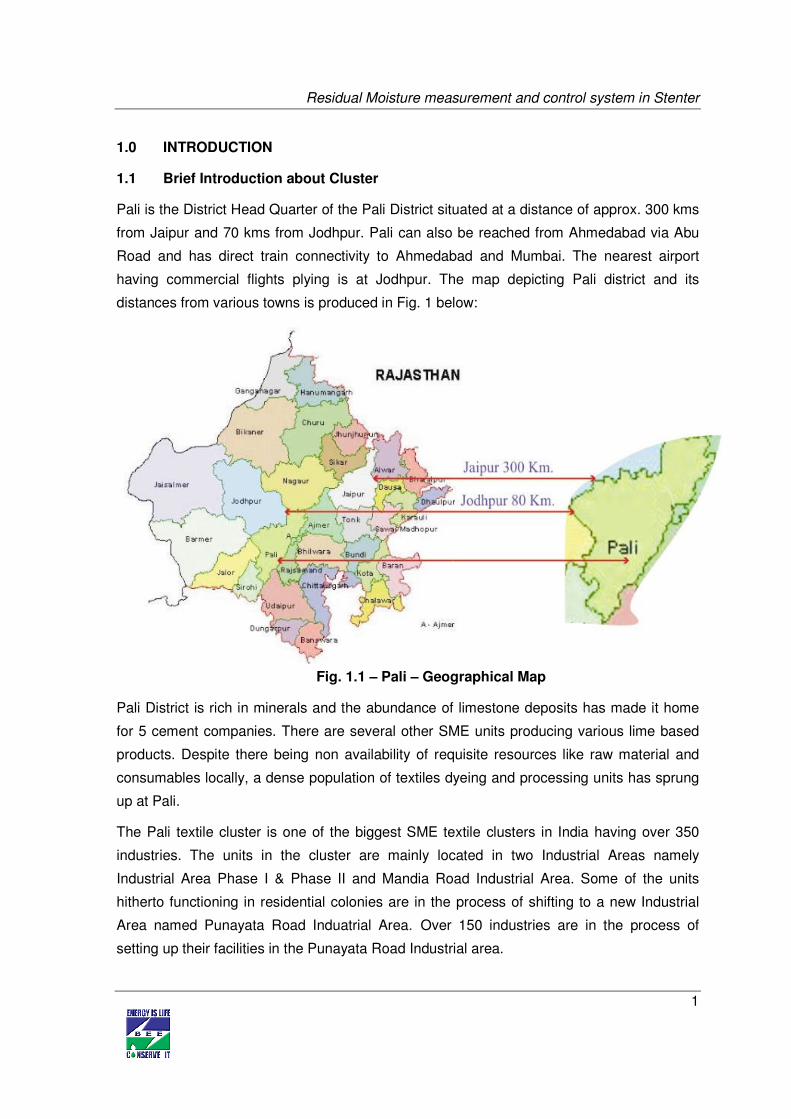
Pali is the District Head Quarter of the Pali District situated at a distance of approx. 300 kms
from Jaipur and 70 kms from Jodhpur. Pali can also be reached from Ahmedabad via Abu
Road and has direct train connectivity to Ahmedabad and Mumbai. The nearest airport
having commercial flights plying is at Jodhpur. The map depicting Pali district and its
distances from various towns is produced in Fig. 1 below:
Fig. 1.1 – Pali – Geographical Map
Pali District is rich in minerals and the abundance of limestone deposits has made it home
for 5 cement companies. There are several other SME units producing various lime based
products. Despite there being non availability of requisite resources like raw material and
consumables locally, a dense population of textiles dyeing and processing units has sprung
up at Pali.
The Pali textile cluster is one of the biggest SME textile clusters in India having over 350
industries. The units in the cluster are mainly located in two Industrial Areas namely
Industrial Area Phase I & Phase II and Mandia Road Industrial Area. Some of the units
hitherto functioning in residential colonies are in the process of shifting to a new Industrial
Area named Punayata Road Induatrial Area. Over 150 industries are in the process of
setting up their facilities in the Punayata Road Industrial area.
Residual Moisture Measurement and Control System
2
Balotra, Jodhpur and Bhilwara are other textile clusters in Rajasthan. These clusters work
on more or less similar processes and use same machines, though their output differs.
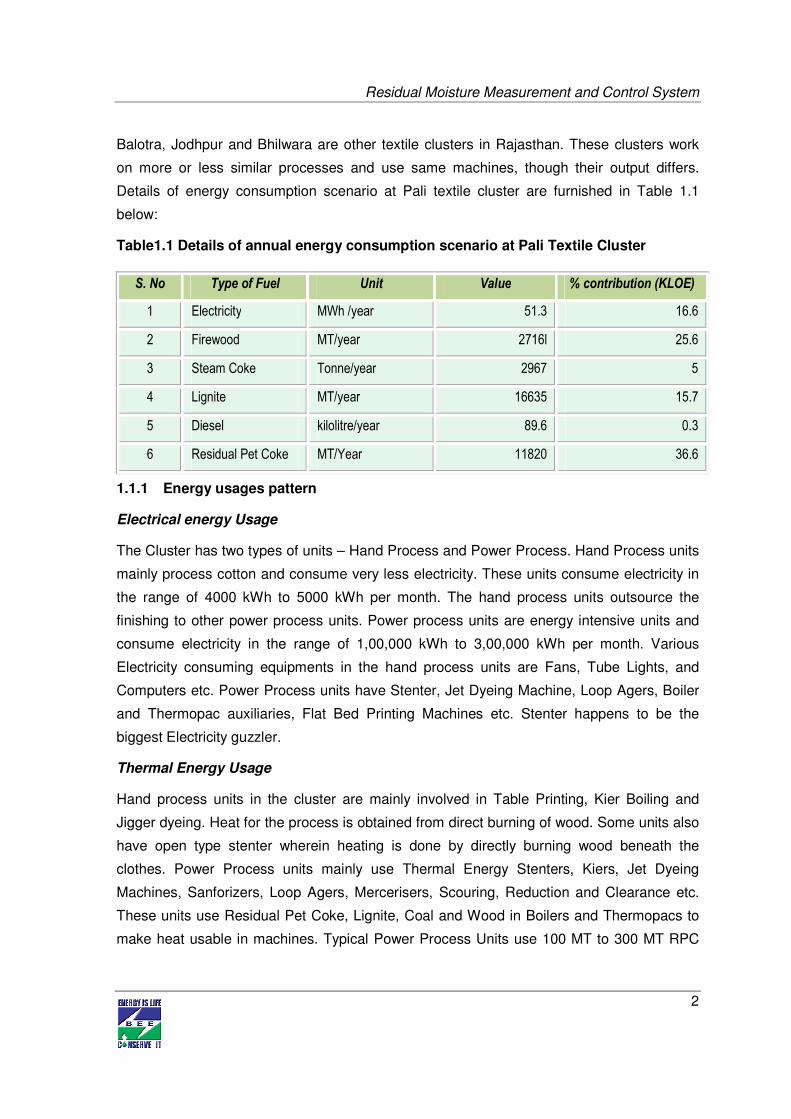
Details of energy consumption scenario at Pali textile cluster are furnished in Table 1.1
below:
Table1.1 Details of annual energy consumption scenario at Pali Textile Cluster
1.1.1 Energy usages pattern
Electrical energy Usage
The Cluster has two types of units – Hand Process and Power Process. Hand Process units
mainly process cotton and consume very less electricity. These units consume electricity in
the range of 4000 kWh to 5000 kWh per month. The hand process units outsource the
finishing to other power process units. Power process units are energy intensive units and
consume electricity in the range of 1,00,000 kWh to 3,00,000 kWh per month. Various
Electricity consuming equipments in the hand process units are Fans, Tube Lights, and
Computers etc. Power Process units have Stenter, Jet Dyeing Machine, Loop Agers, Boiler
and Thermopac auxiliaries, Flat Bed Printing Machines etc. Stenter happens to be the
biggest Electricity guzzler.
Thermal Energy Usage
Hand process units in the cluster are mainly involved in Table Printing, Kier Boiling and
Jigger dyeing. Heat for the process is obtained from direct burning of wood. Some units also
have open type stenter wherein heating is done by directly burning wood beneath the
clothes. Power Process units mainly use Thermal Energy Stenters, Kiers, Jet Dyeing
Machines, Sanforizers, Loop Agers, Mercerisers, Scouring, Reduction and Clearance etc.
These units use Residual Pet Coke, Lignite, Coal and Wood in Boilers and Thermopacs to
make heat usable in machines. Typical Power Process Units use 100 MT to 300 MT RPC
S. No Type of Fuel Unit Value % contribution (KLOE)
1 Electricity MWh /year 51.3 16.6
2 Firewood MT/year 2716l 25.6
3 Steam Coke Tonne/year 2967 5
4 Lignite MT/year 16635 15.7
5 Diesel kilolitre/year 89.6 0.3
6 Residual Pet Coke MT/Year 11820 36.6
Residual Moisture Measurement and Control System
3
(85 MTOE to 256 MTOE) per month. The hand process units use 3 MT to 15 MT wood per
month.
1.1.2 Classification of Units
The Textile units in the Pali Cluster can be categorized into two types based on availability
of machinery in the units –
� Hand Process Units and
� Power Process Units
Pali Textile Cluster mainly consists of hand process units and over 250 out of a total
population of 350 units are hand process units. These units are mainly owned by artisans or
traditional colormen (Rangrej).
On the basis of type of cloth processed, the units can be classified as
� Cotton (Natural fiber) Processing Units
� Synthetic clothes (Manmade fibers) Processing Units
Based on output, the units can be classified as
� Dyeing Units
� Printing units
� Finishing Units
Scale of Operation
Most of the units in the Pali textile cluster are micro units. All the units are in Micro, Small or
Medium sector with none of the units being in large scale sector.
Products Manufactured
Different types of products manufactured in Pali Textile Cluster. The marketed products are:
� Sarees (Lower Price Range)
� Rubia Blouse Clothes
� Lungies
� Turbans
� African Prints
Residual Moisture Measurement and Control System
4
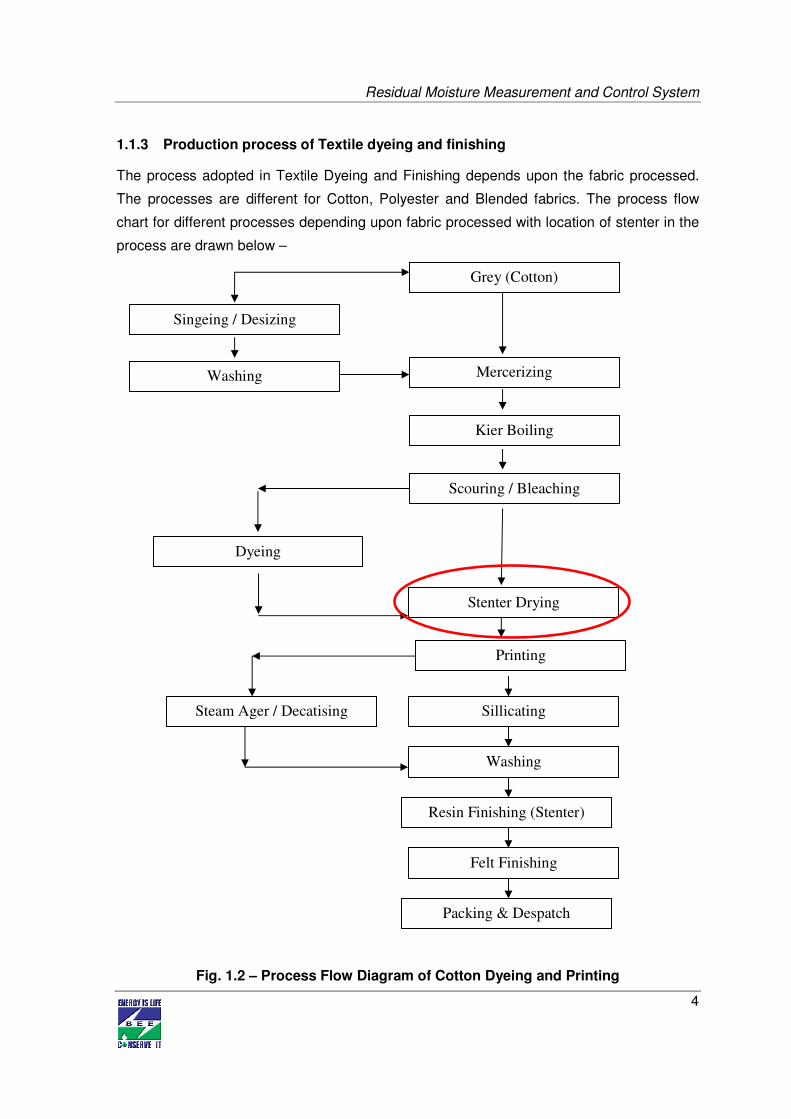
1.1.3 Production process of Textile dyeing and finishing
The process adopted in Textile Dyeing and Finishing depends upon the fabric processed.
The processes are different for Cotton, Polyester and Blended fabrics. The process flow
chart for different processes depending upon fabric processed with location of stenter in the
process are drawn below –
Fig. 1.2 – Process Flow Diagram of Cotton Dyeing and Printing
Stenter Drying
Printing
Sillicating
Washing
Resin Finishing (Stenter)
Felt Finishing
Packing & Despatch
Grey (Cotton)
Mercerizing
Kier Boiling
Singeing / Desizing
Washing
Scouring / Bleaching
Dyeing
Steam Ager / Decatising
Residual Moisture Measurement and Control System
5
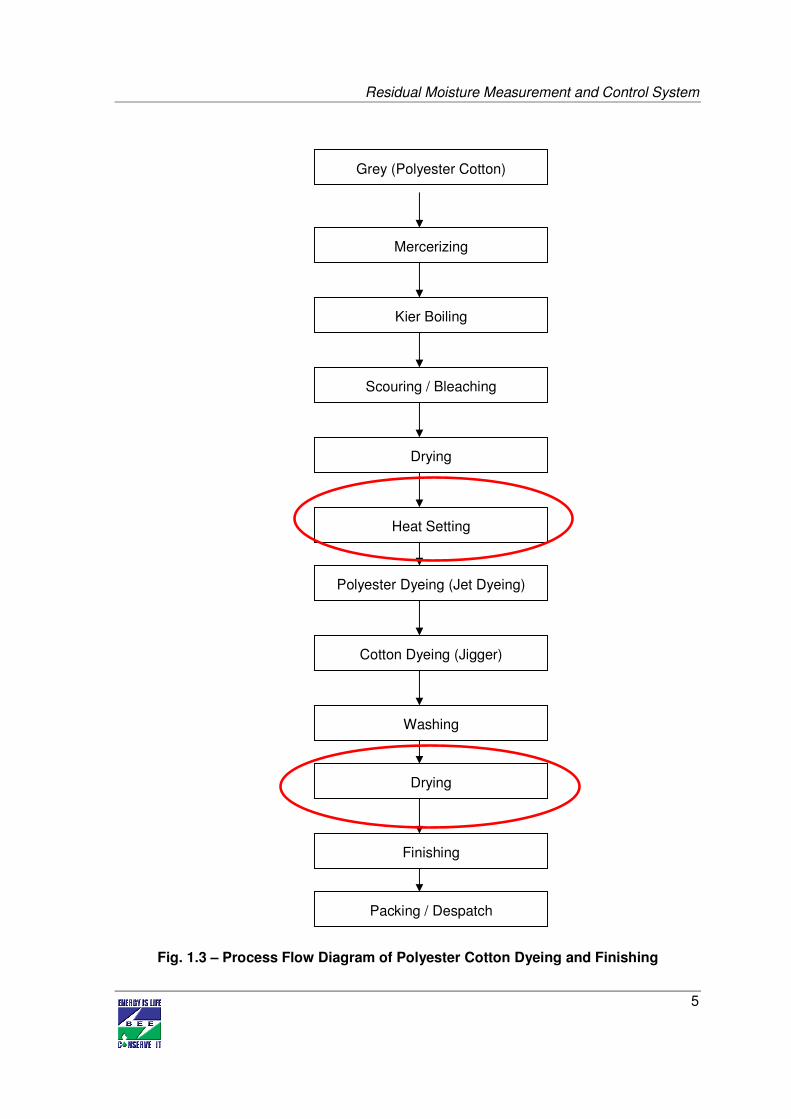
Fig. 1.3 – Process Flow Diagram of Polyester Cotton Dyeing and Finishing
Grey (Polyester Cotton)
Mercerizing
Kier Boiling
Scouring / Bleaching
Drying
Polyester Dyeing (Jet Dyeing)
Cotton Dyeing (Jigger)
Heat Setting
Drying
Washing
Finishing
Packing / Despatch
Residual Moisture Measurement and Control System
6
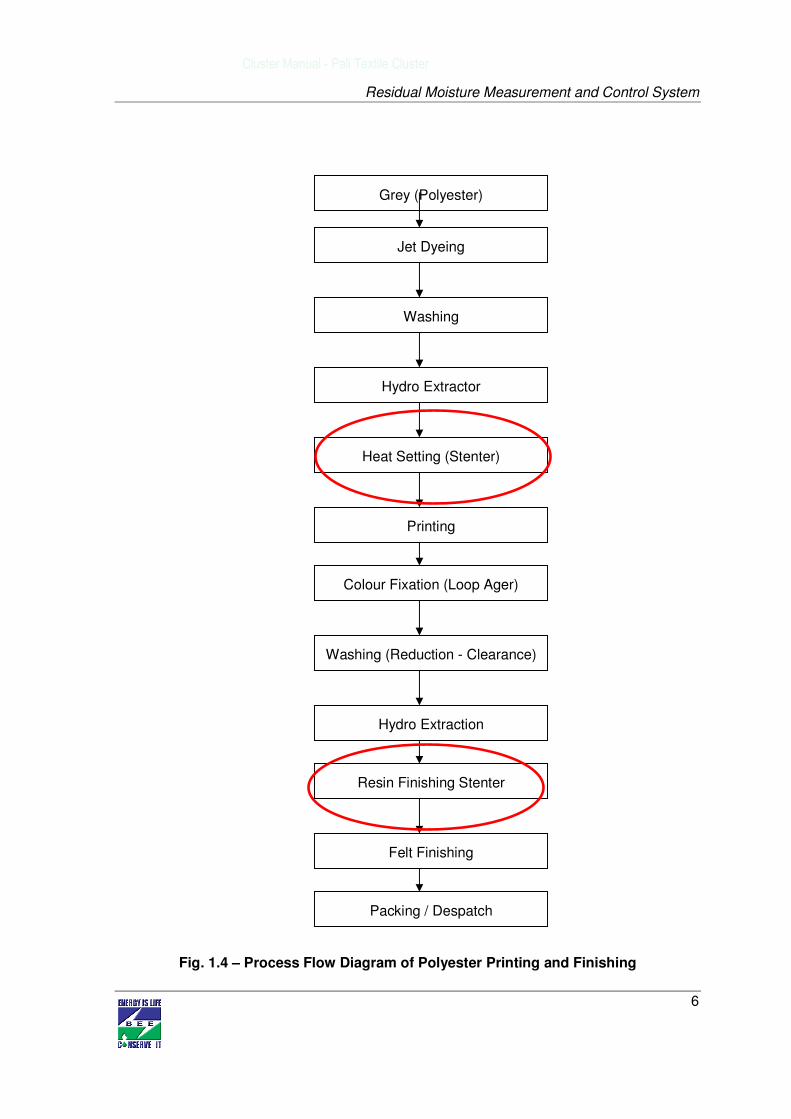
Fig. 1.4 – Process Flow Diagram of Polyester Printing and Finishing
Grey (Polyester)
Jet Dyeing
Washing
Hydro Extractor
Heat Setting (Stenter)
Colour Fixation (Loop Ager)
Washing (Reduction - Clearance)
Printing
Resin Finishing Stenter
Hydro Extraction
Felt Finishing
Packing / Despatch
Cluster Manual - Pali Textile Cluster
Residual Moisture Measurement and Control System
7
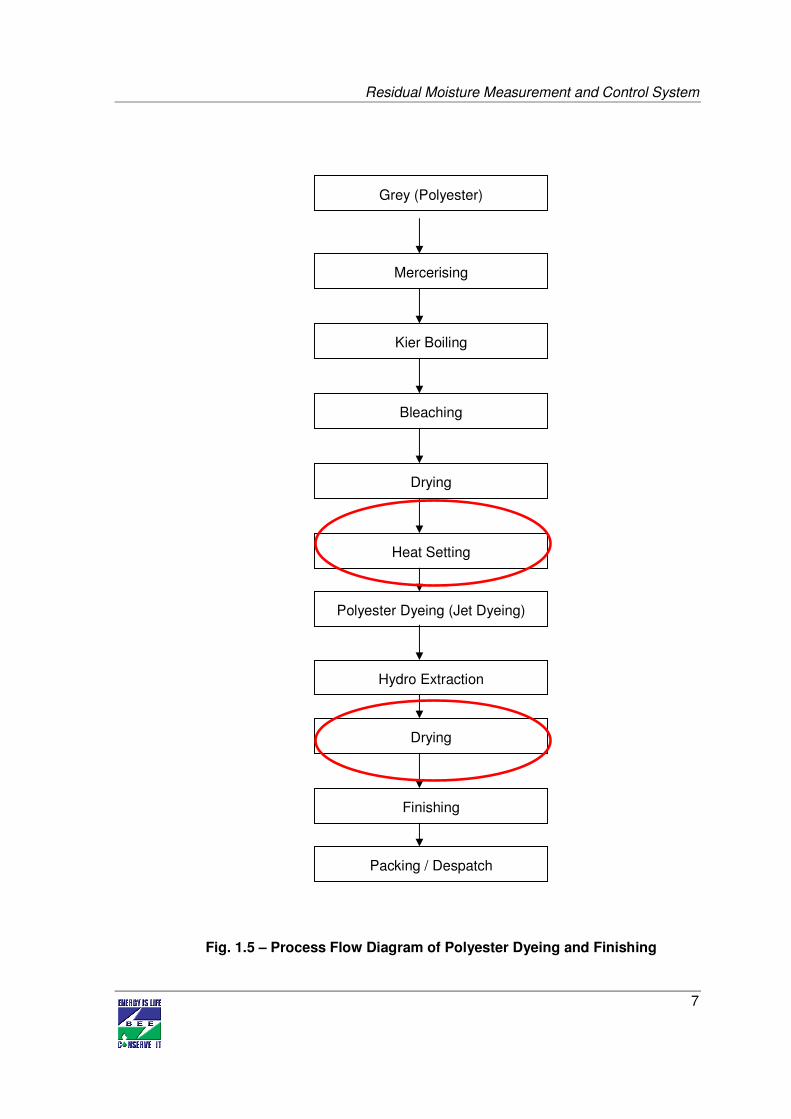
Fig. 1.5 – Process Flow Diagram of Polyester Dyeing and Finishing
Grey (Polyester)
Mercerising
Kier Boiling
Bleaching
Drying
Polyester Dyeing (Jet Dyeing)
Heat Setting
Drying
Hydro Extraction
Finishing
Packing / Despatch
Residual Moisture Measurement and Control System
8
1.2 Energy performance in existing situation
1.2.1 Average production
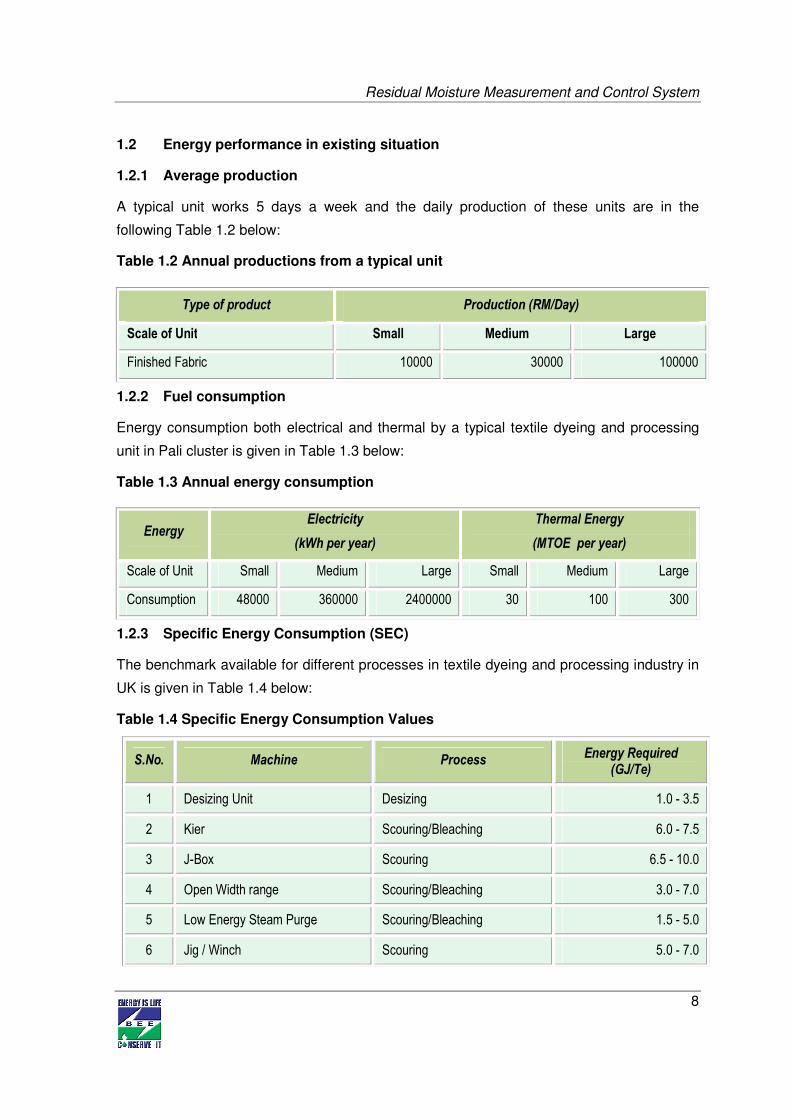
A typical unit works 5 days a week and the daily production of these units are in the
following Table 1.2 below:
Table 1.2 Annual productions from a typical unit
1.2.2 Fuel consumption
Energy consumption both electrical and thermal by a typical textile dyeing and processing
unit in Pali cluster is given in Table 1.3 below:
Table 1.3 Annual energy consumption
1.2.3 Specific Energy Consumption (SEC)
The benchmark available for different processes in textile dyeing and processing industry in
UK is given in Table 1.4 below:
Table 1.4 Specific Energy Consumption Values
S.No. Machine Process Energy Required
(GJ/Te)
1 Desizing Unit Desizing 1.0 - 3.5
2 Kier Scouring/Bleaching 6.0 - 7.5
3 J-Box Scouring 6.5 - 10.0
4 Open Width range Scouring/Bleaching 3.0 - 7.0
5 Low Energy Steam Purge Scouring/Bleaching 1.5 - 5.0
6 Jig / Winch Scouring 5.0 - 7.0
Type of product Production (RM/Day)
Scale of Unit Small Medium Large
Finished Fabric 10000 30000 100000
Energy Electricity
(kWh per year)
Thermal Energy
(MTOE per year)
Scale of Unit Small Medium Large Small Medium Large
Consumption 48000 360000 2400000 30 100 300
Residual Moisture Measurement and Control System
9
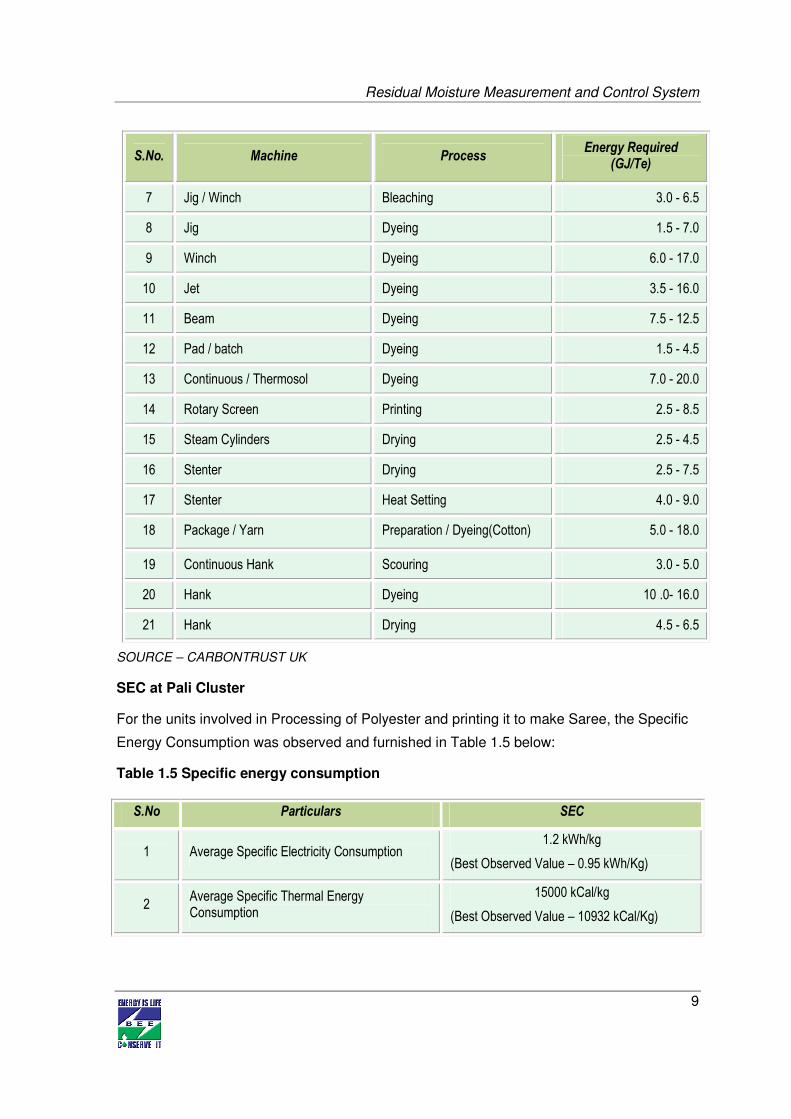
S.No. Machine Process Energy Required
(GJ/Te)
7 Jig / Winch Bleaching 3.0 - 6.5
8 Jig Dyeing 1.5 - 7.0
9 Winch Dyeing 6.0 - 17.0
10 Jet Dyeing 3.5 - 16.0
11 Beam Dyeing 7.5 - 12.5
12 Pad / batch Dyeing 1.5 - 4.5
13 Continuous / Thermosol Dyeing 7.0 - 20.0
14 Rotary Screen Printing 2.5 - 8.5
15 Steam Cylinders Drying 2.5 - 4.5
16 Stenter Drying 2.5 - 7.5
17 Stenter Heat Setting 4.0 - 9.0
18 Package / Yarn Preparation / Dyeing(Cotton) 5.0 - 18.0
19 Continuous Hank Scouring 3.0 - 5.0
20 Hank Dyeing 10 .0- 16.0
21 Hank Drying 4.5 - 6.5
SOURCE – CARBONTRUST UK
SEC at Pali Cluster
For the units involved in Processing of Polyester and printing it to make Saree, the Specific
Energy Consumption was observed and furnished in Table 1.5 below:
Table 1.5 Specific energy consumption
S.No Particulars SEC
1 Average Specific Electricity Consumption 1.2 kWh/kg
(Best Observed Value – 0.95 kWh/Kg)
2 Average Specific Thermal Energy Consumption
15000 kCal/kg
(Best Observed Value – 10932 kCal/Kg)
Residual Moisture Measurement and Control System
10
1.3 Identification of technology/equipment
1.3.1 Description of technology/ equipment
Pretreatment of textiles and also Dyeing, Printing, washing etc. involve use of water which
needs to be removed from fabric before undertaking final finishing or thermosol process or
heat setting. Stenters are mainly used in textile finishing for heat-setting, drying, thermosol
processes and finishing. Thus Stenter is one of the most common machinery found in a
textile dyeing and finishing industry.
It can be roughly estimated that, in fabric finishing, each textile substrate is treated on
average 2.5 times in a stenter. Pali has a population of more than 100 stenters installed in
industries. The stenters available in Pali are both open and closed type. These stenters are
used for assigning requisite finish, temperature stability and dye curing.
In Cotton Dyeing, stenter is used after pretreatment and dyeing as a finishing process. In
Cotton Printing, Stenter is used before printing but after pretreatment. In case of Polyester
or PC Dyeing, stenter is used twice, once for heat setting and then again for final finish.
Similarly, in case of Polyester and PC Blend Printing, stenter is used twice, once for heat
setting and then for final finishing after dye curing.
Stenter happens to be the largest Energy Consuming Machinery available in a textile Dyeing
and Finishing Industry. For a 5 Chamber Stenter, the connected load is approx 90 HP and
the Thermal Energy Consumption rating is 4.0 lakh kCal per hour. The major Electrical
Energy load happens to be that of 10 no. of fans provided for circulation of hot air having
motor rating of 7.5 HP each.
Thermal Energy required for stenters is supplied by Thermopac. The hot thermal fluid at a
temperature of 235°C to 300°C is pumped to the stenter with the help of a continuous
running pump. The blowers blow air onto a grid of heat exchanger tubes containing hot
thermic fluid which then is guided onto the fabric through nozzles. The blower motors are
generally two speed motors for controlling speed of the blower. Some of the new Stenters
have been provided with VFD for control of speed. Some units have installed VFD as retrofit
to the stenter blower motors.
The temperature in each compartment is controlled in modern stenters with the help of a
motor operated flow control valve which bypasses hot fluid if temperature in a chamber
exceeds preset temperature. Varying the speed of the motor rotating the endless chain can
also vary the speed of the fabric.
Residual Moisture Measurement and Control System
11
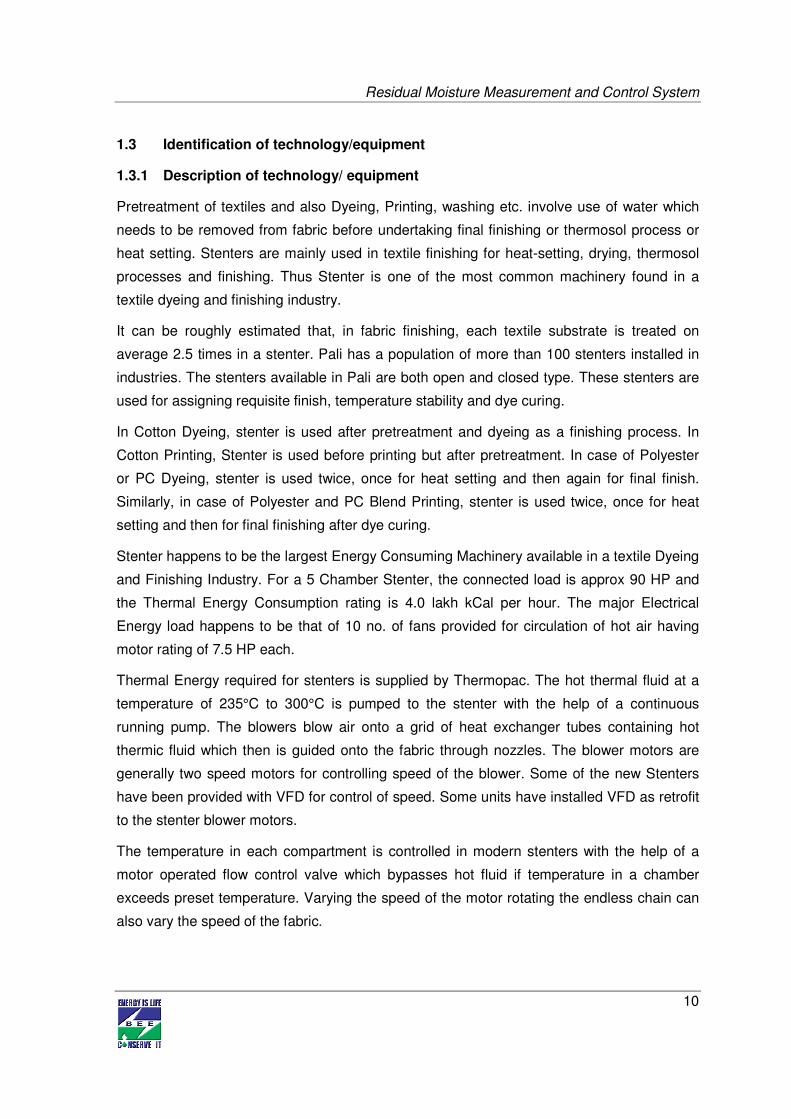
To give a –surely rough - assessment energy consumption of energetic optimized stenters is
in the range of 3500 - 4500 kJ per kg of textile. However energy consumption depends
strongly on the process that is carried out.
A typical stenter is depicted in the following photograph:-
Fig. 1.6 – Photograph of Stenter
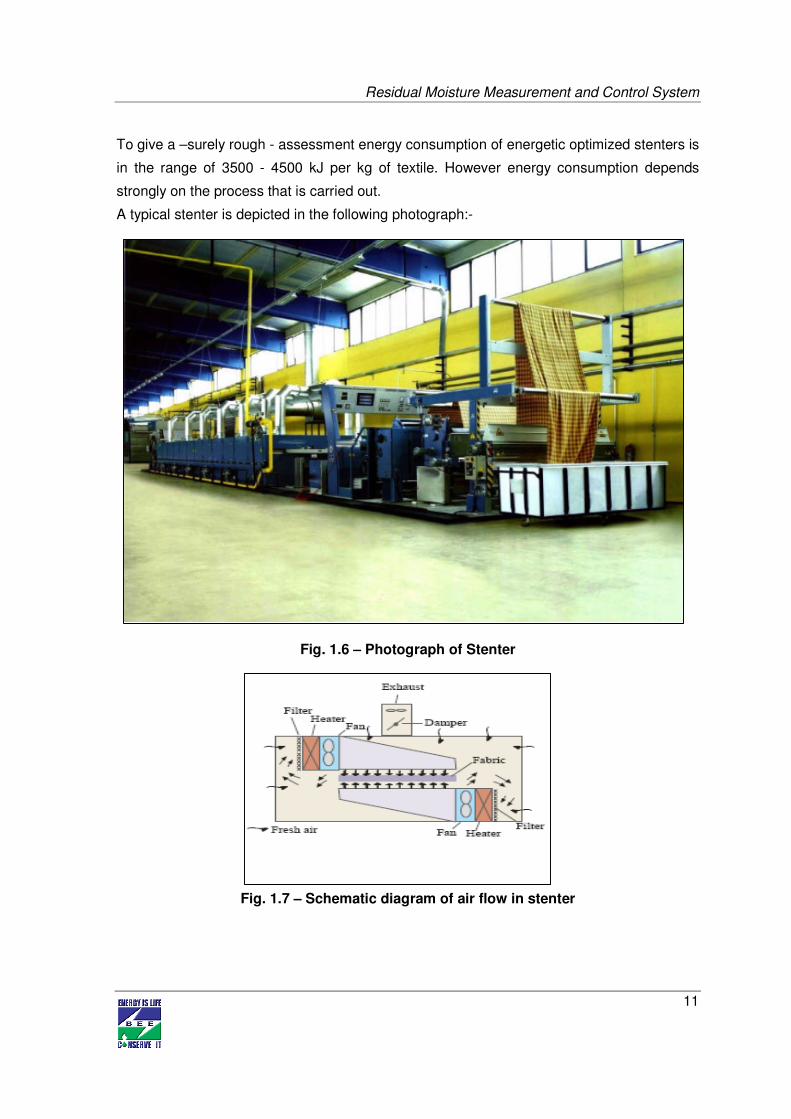
Fig. 1.7 – Schematic diagram of air flow in stenter
Residual Moisture Measurement and Control System
12
1.3.2 Role in process
Textile stenters have two main purposes – convection drying so as to remove the moisture
in the fabric and secondly to provide fabric width control. During the previous stages of
processing the fabric is subjected to length wise tension to varying degrees resulting in
shrinkage in width. In the stenter, width control is achieved with the aid of a series of clips or
pins mounted on a pair of endless chains. Apart from these functions, stenters are also used
for the following purposes:
a. Dry-heating process like, heat setting of synthetic fabrics and their blends
b. Dry curing process namely, resin finishing with built-in catalysts
In Pali, Stenter is used for drying as well as finishing of Cotton and also for Heat Setting as
well as Finishing of Polyester and PC Blend. Stenter is indispensable for Dyeing and
Printing of polyester and Blends. Cotton fabric is processed on open stenter. Stenter is
generally not used for Drying purpose as drying is done in open air by hanging the fabric in
sun. Mechanical dewatering process is also used in case of Polyester and PC Blend. All the
stenters are equipped with 3 bowl mangles for dewatering which is used if any chemical is
applied with water as carrier.
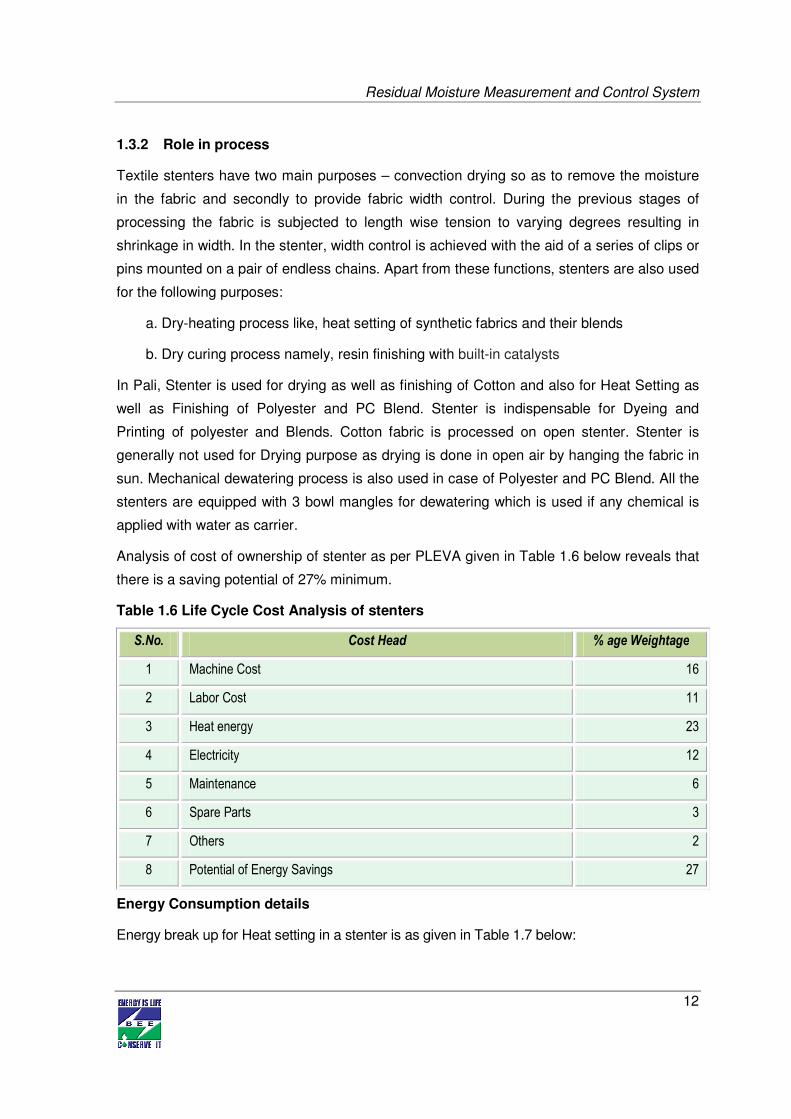
Analysis of cost of ownership of stenter as per PLEVA given in Table 1.6 below reveals that
there is a saving potential of 27% minimum.
Table 1.6 Life Cycle Cost Analysis of stenters
S.No. Cost Head % age Weightage
1 Machine Cost 16
2 Labor Cost 11
3 Heat energy 23
4 Electricity 12
5 Maintenance 6
6 Spare Parts 3
7 Others 2
8 Potential of Energy Savings 27
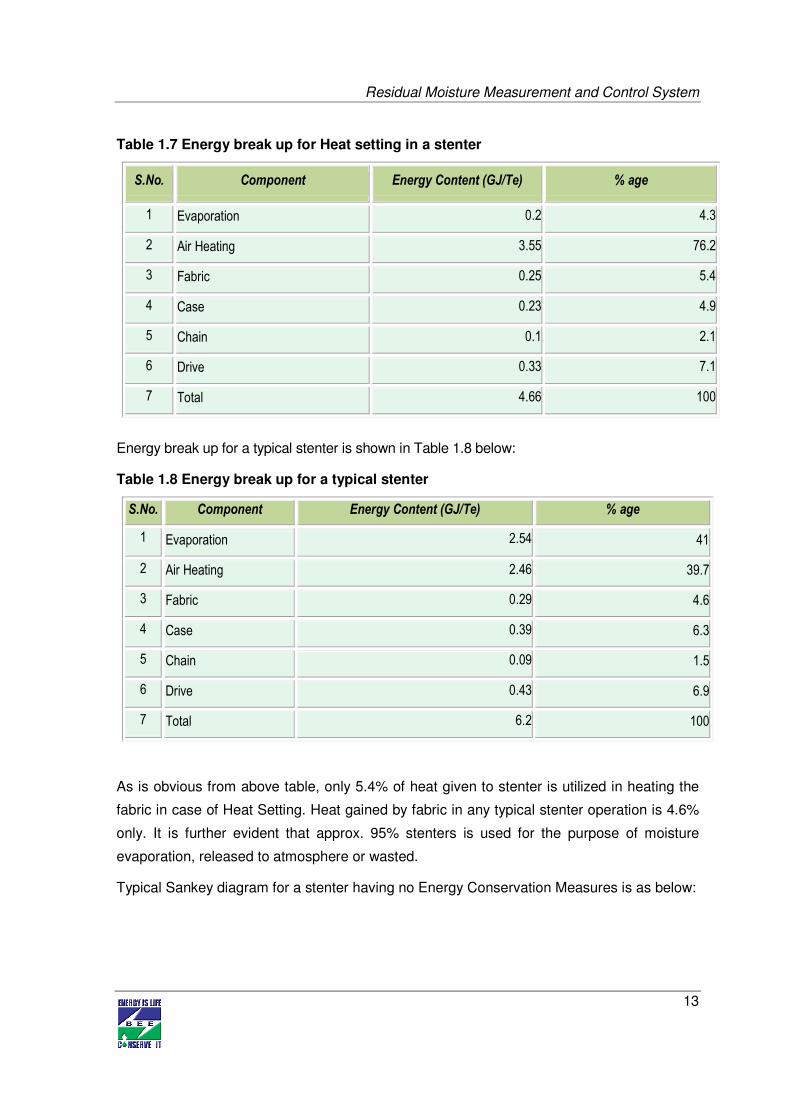
Energy Consumption details
Energy break up for Heat setting in a stenter is as given in Table 1.7 below:
Residual Moisture Measurement and Control System
13
Table 1.7 Energy break up for Heat setting in a stenter
S.No. Component Energy Content (GJ/Te) % age
1 Evaporation 0.2 4.3
2 Air Heating 3.55 76.2
3 Fabric 0.25 5.4
4 Case 0.23 4.9
5 Chain 0.1 2.1
6 Drive 0.33 7.1
7 Total 4.66 100
Energy break up for a typical stenter is shown in Table 1.8 below:
Table 1.8 Energy break up for a typical stenter
S.No. Component Energy Content (GJ/Te) % age
1 Evaporation 2.54 41
2 Air Heating 2.46 39.7
3 Fabric 0.29 4.6
4 Case 0.39 6.3
5 Chain 0.09 1.5
6 Drive 0.43 6.9
7 Total 6.2 100
As is obvious from above table, only 5.4% of heat given to stenter is utilized in heating the
fabric in case of Heat Setting. Heat gained by fabric in any typical stenter operation is 4.6%
only. It is further evident that approx. 95% stenters is used for the purpose of moisture
evaporation, released to atmosphere or wasted.
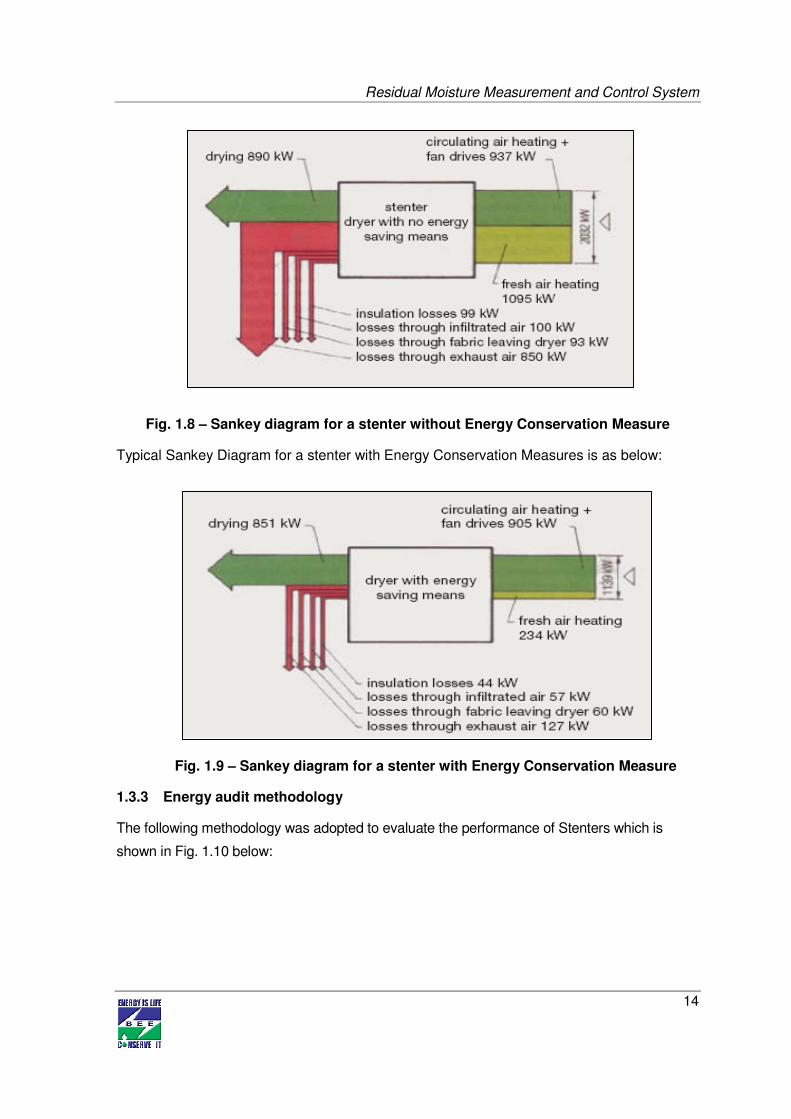
Typical Sankey diagram for a stenter having no Energy Conservation Measures is as below:
Residual Moisture Measurement and Control System
14
Fig. 1.8 – Sankey diagram for a stenter without Energy Conservation Measure
Typical Sankey Diagram for a stenter with Energy Conservation Measures is as below:
Fig. 1.9 – Sankey diagram for a stenter with Energy Conservation Measure
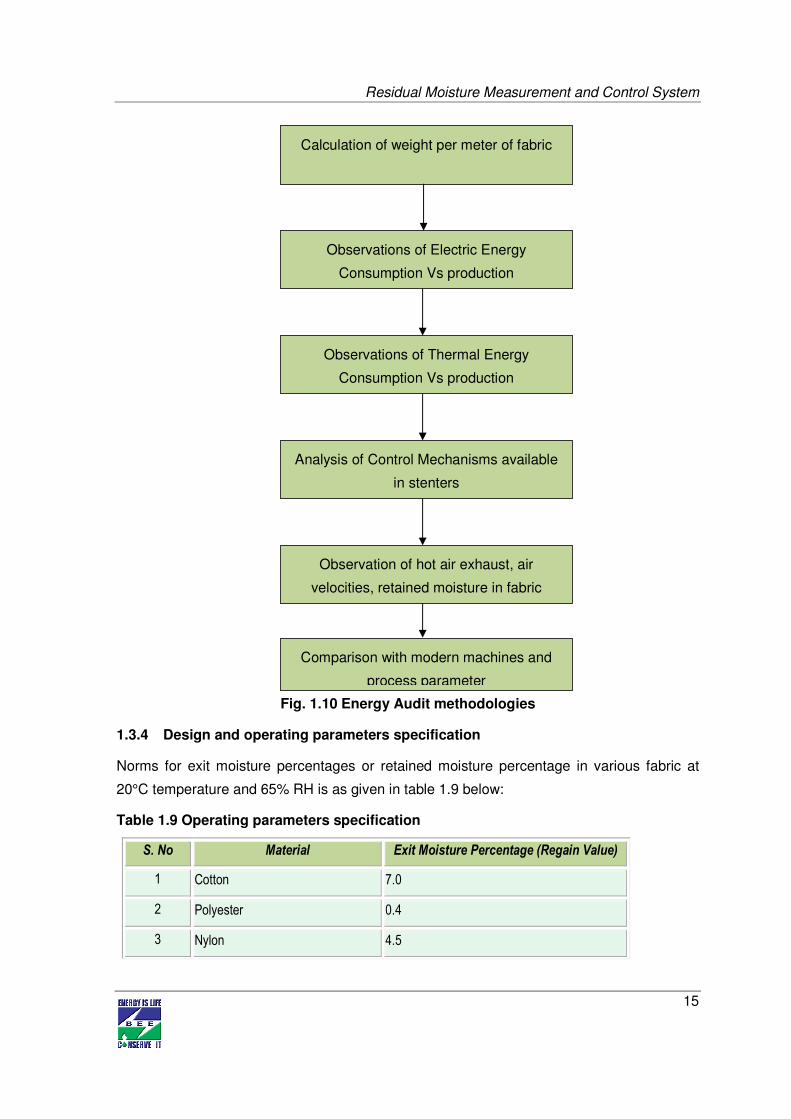
1.3.3 Energy audit methodology
The following methodology was adopted to evaluate the performance of Stenters which is
shown in Fig. 1.10 below:
Residual Moisture Measurement and Control System
15
Calculation of weight per meter of fabric
Observations of Electric Energy
Consumption Vs production
Observations of Thermal Energy
Consumption Vs production
Analysis of Control Mechanisms available
in stenters
Observation of hot air exhaust, air
velocities, retained moisture in fabric
Comparison with modern machines and
process parameter
Fig. 1.10 Energy Audit methodologies
1.3.4 Design and operating parameters specification
Norms for exit moisture percentages or retained moisture percentage in various fabric at
20°C temperature and 65% RH is as given in table 1.9 below:
Table 1.9 Operating parameters specification
S. No Material Exit Moisture Percentage (Regain Value)
1 Cotton 7.0
2 Polyester 0.4
3 Nylon 4.5
Residual Moisture Measurement and Control System
16
4 Viscose 12.5
5 Wool 16.0
6 Polyester Cotton Blend (2:1) 2.5
7 Polyester Wool Blend (2:1) 5.5
It is obvious from the above that retained moisture percentage in cotton has to be 7% and
that for Polyester has to be 4%. Only one stenter in Pali has system to ensure that retained
moisture percentage is as per the norms. In all other stenters, the retained moisture
percentage was observed to be less than the norms indicating that the fabric is getting over
dried.
1.3.5 Operating efficiency analysis
As is obvious from Table 1.8, 41% of total energy given to stenter is utilized in evaporation
of moisture. Thus 1% over drying would mean 2.5% more heat requirements and 4% more
fuel requirements (considering Thermopac efficiency to be 70% and distribution losses to be
10%).
1.4 Barriers in adoption of proposed technology/equipment
BEE promoted SME programme has the unique distinction of addressing all the identifiable
barriers in adoption of Energy Efficiency Improvement technologies in SME sectors.
Following actions have been taken in Pali Textile Cluster to remove the barriers:-
• Kick off Seminar to create awareness
• Energy Audit (Detailed and Preliminary) in over 78 units
• Capability building and involvement of institutional financers, local service
providers and also domestic equipment manufacturers.
• Design and distribution of dissemination material containing most of the
measures.
• Design and distribution of Cluster Manual containing technology gap assessment
and cost benefit analysis of proposed Energy Conservation measures.
• Involvement of Industry Association, Department of Industries and local
administration.
However, for the sake of identifying possible barriers to adoption of the proposed
technologies, the following may be considered.
Residual Moisture Measurement and Control System
17
1.4.1 Technological Barrier
• The proposed technology, being generic in nature, is readily available.
• Non-availability of technology or aversion to adoption for any other reason does not
seem to be the case here as most of the units in power process segment in Pali are
already having VFDs in ID Fans, Stenter Fans etc. It is only lack of knowledge and
comfort of proven guaranteed results that has been keeping the entrepreneurs away
from adopting this technology.
• Stenter manufacturers are offering the proposed technology as a standard add on to
new systems. Even agencies working in optimization and control system for textile
sector offer the product. However, the proposition is not being presented with
guaranteed cost benefit analysis to the entrepreneurs. The entrepreneurs are in
Micro, Small and medium sector and they do not have trained or educated
manpower.
• There is a severe paucity of quality technical consultants in the cluster. This also
inhibits adoption of technology as there is nobody to convince the entrepreneurs.
• Non availability of local after sales service provider for the equipments is a major
obstacle to adoption of any new and modern technology involving electronics.
• The majority of the textile unit owners / entrepreneurs do not have in-depth
technical expertise nor do they have technically qualified manpower. This is a major
barrier in acquiring knowledge about any innovation in the sector.
• The entrepreneurs in the MSME sector are averse to investment risks and tend to
invest in proven technology only. Adoption of technology is higher in bigger units and
these bigger units also become agents for demonstration and hence replication. Lack
of any bigger unit in the cluster also is an impediment to adoption of newer
technology.
1.4.2 Financial Barrier
• The applicability of the proposition is in power process units only. These units have
very healthy financial position. Lack of finances is not the reason for non adoption of
the proposed technology. However, availability of easy finances and also financial
incentives would trigger and also accelerate adoption of the technology.
• Implementation of the proposed project activity requires approx ` 1.0 lakh investment
per machine and can be managed by internal resources. However, the units have
upto 4 Stenters and hence investment of ` 4 lakh in one go would be a problem.
Residual Moisture Measurement and Control System
18
• The investment decisions normally favour creation of additional facility and
investment for Energy Efficiency Improvement features last in the priority of
entrepreneurs. Consequently, interventions like the one undertaken by BEE are
necessary for promoting adoption of technologies.
• The subjective approach of the banks in deciding on grant of loans to entrepreneurs
and also lack of pre declared formalities required for availing loan is the biggest
impediment. On adherence to a time bound dispensation of the loan application is
also an obstacle as the a new document is asked for ever time the entrepreneur
visits the bank and the bank would refuse in the last moment citing untenable reason
leaving the entrepreneur in the lurch. Facilitating delivery of finances is more
important than packaging the finances.
• Most of the units in Pali textile cluster are debt free enterprises and the situation is
ideal for any bank or financial institution to do advances. With end to economic slow
down within sight, the demands are likely to pick up and the units would require
scaling up their operations and also perking up their facility to meet enhanced
demand. The inherent benefit of increase in profitability by precise process control is
also up for taking.
1.4.3 Skilled manpower
The cluster very badly needs skilled manpower. There is no trained Dye Master, no trained
electrician, no trained boiler operator or no trained maintenance man. The existing
manpower has grown by on the job learning and has learnt the traditional methods of dyeing
and processing. Propagation of learning of new technology is absolutely necessary.
1.4.4 Other barrier (If any)
Creation of Energy Champions is necessary to trigger large-scale adoption of proposed
technologies. This is possible by sponsoring adoption of such technologies through financial
help and also mitigation of investment risks through a mechanism that guarantees the
savings. An ESCO can as well be involved in the process.
Residual Moisture Measurement and Control System
19
2.0 PROPOSED EQUIPMENT
2.1 Detailed description of technology proposed
Background
Background
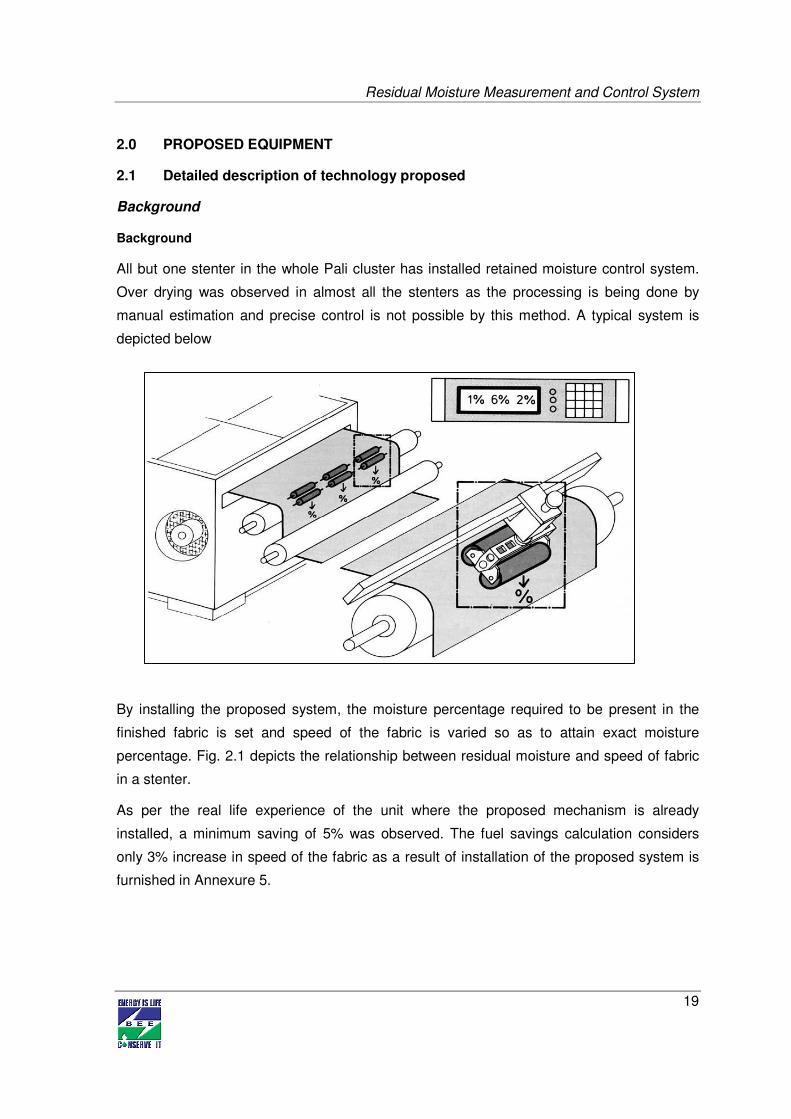
All but one stenter in the whole Pali cluster has installed retained moisture control system.
Over drying was observed in almost all the stenters as the processing is being done by
manual estimation and precise control is not possible by this method. A typical system is
depicted below
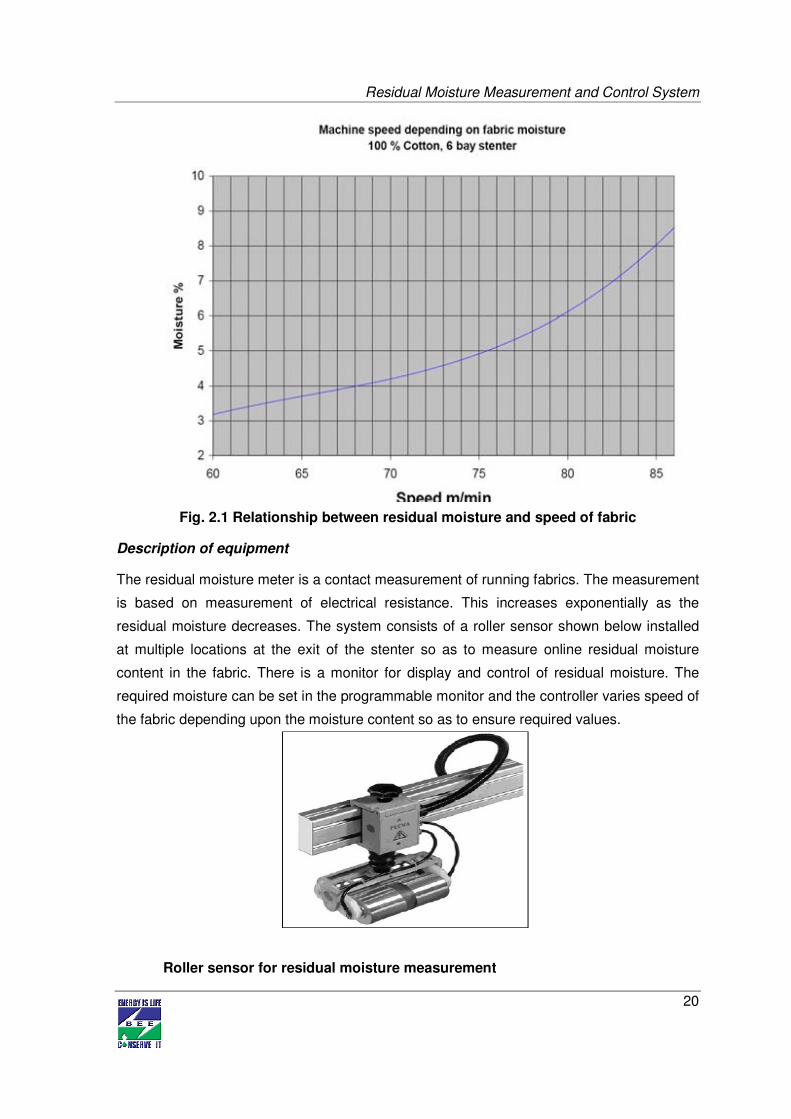
By installing the proposed system, the moisture percentage required to be present in the
finished fabric is set and speed of the fabric is varied so as to attain exact moisture
percentage. Fig. 2.1 depicts the relationship between residual moisture and speed of fabric
in a stenter.
As per the real life experience of the unit where the proposed mechanism is already
installed, a minimum saving of 5% was observed. The fuel savings calculation considers
only 3% increase in speed of the fabric as a result of installation of the proposed system is
furnished in Annexure 5.
Residual Moisture Measurement and Control System
20
Fig. 2.1 Relationship between residual moisture and speed of fabric
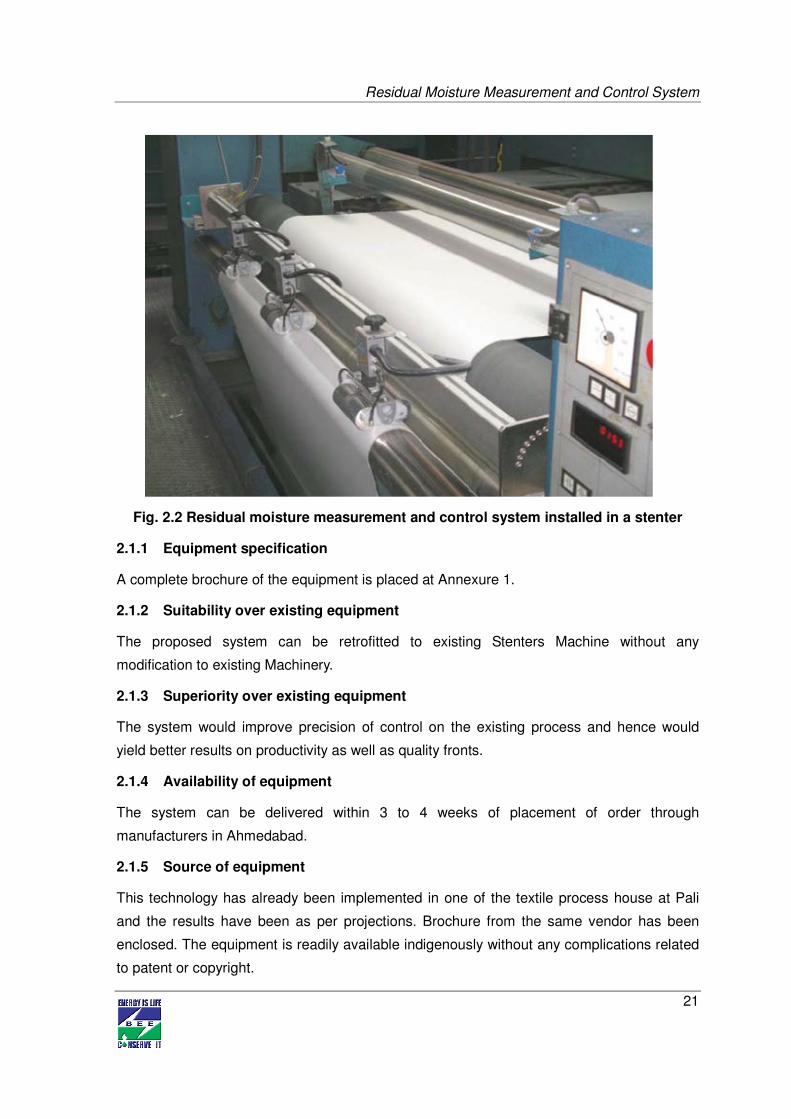
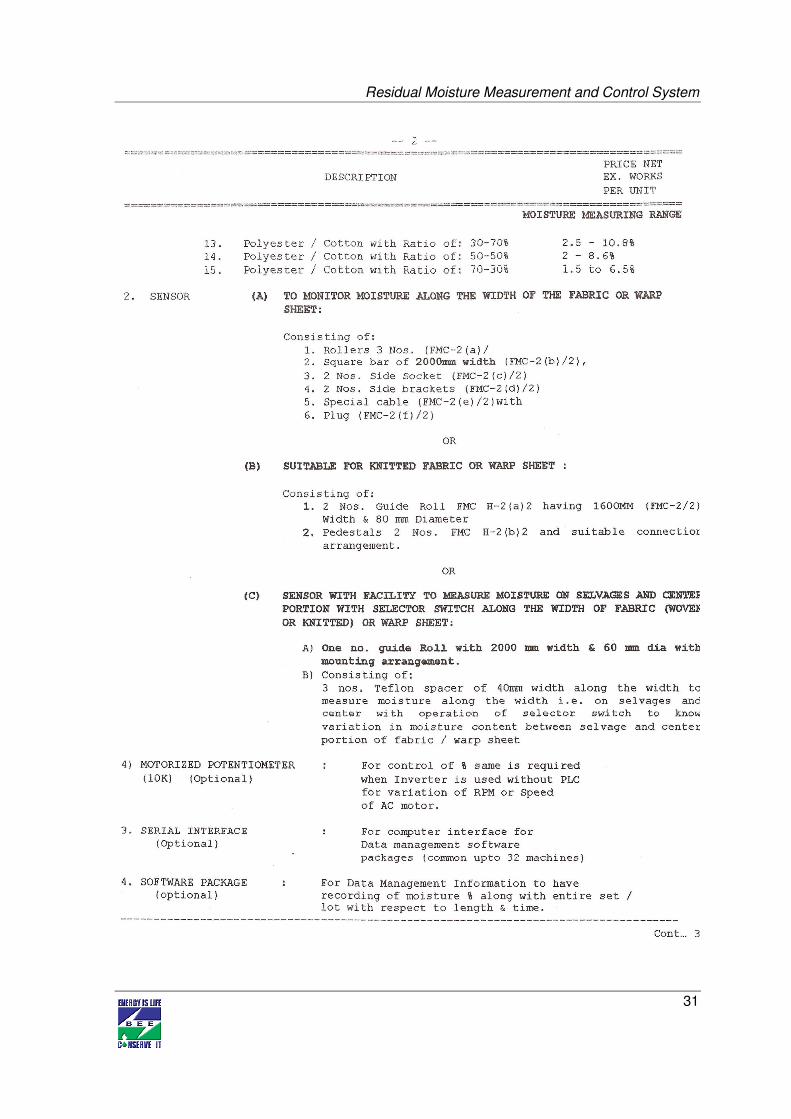
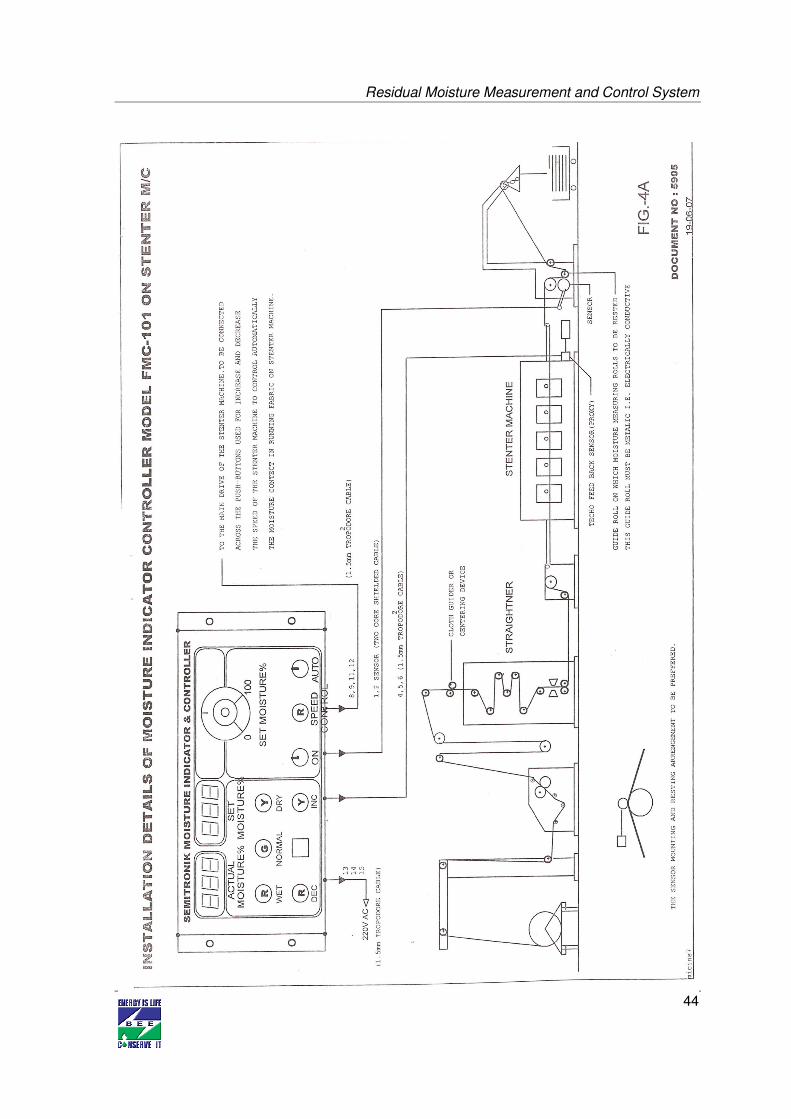
Description of equipment
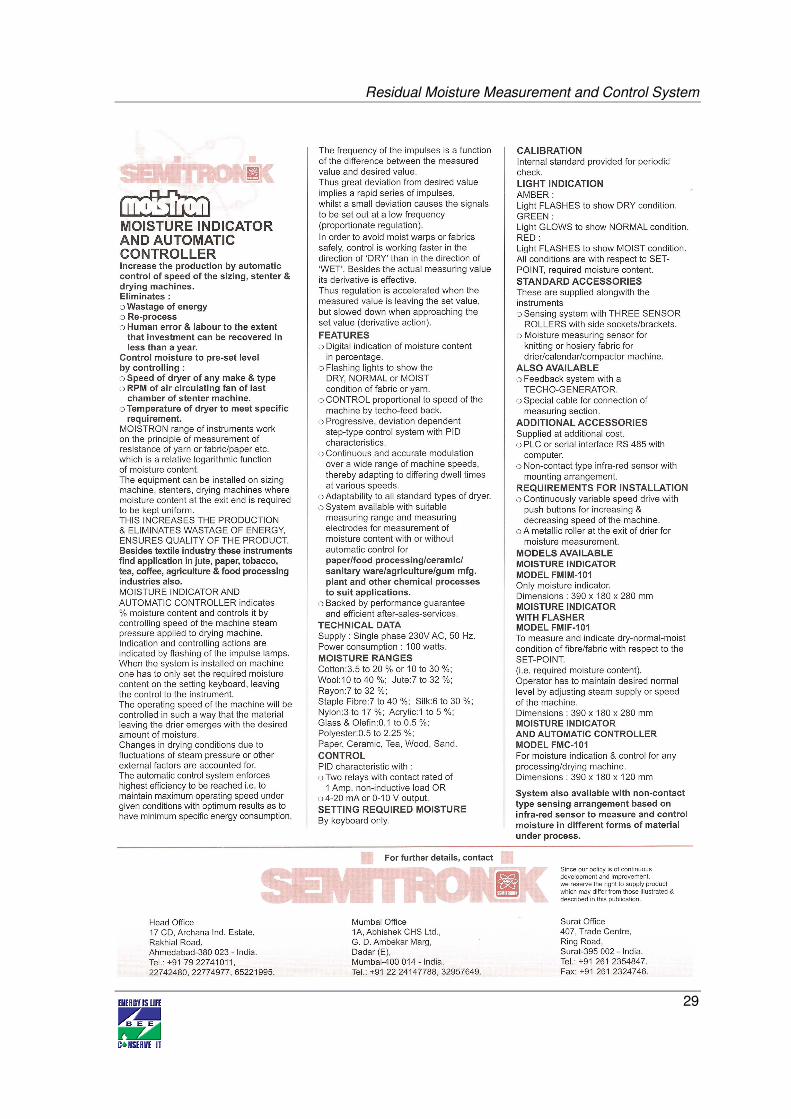
The residual moisture meter is a contact measurement of running fabrics. The measurement
is based on measurement of electrical resistance. This increases exponentially as the
residual moisture decreases. The system consists of a roller sensor shown below installed
at multiple locations at the exit of the stenter so as to measure online residual moisture
content in the fabric. There is a monitor for display and control of residual moisture. The
required moisture can be set in the programmable monitor and the controller varies speed of
the fabric depending upon the moisture content so as to ensure required values.
Roller sensor for residual moisture measurement
Residual Moisture Measurement and Control System
21
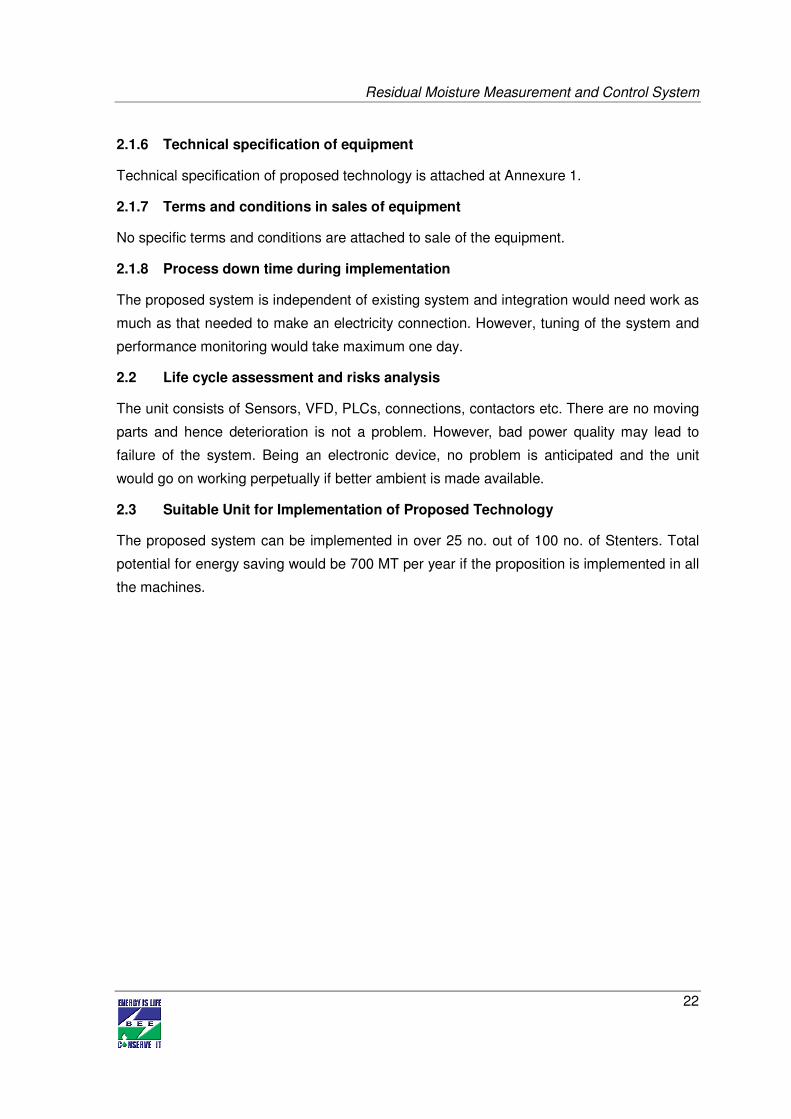
Fig. 2.2 Residual moisture measurement and control system installed in a stenter
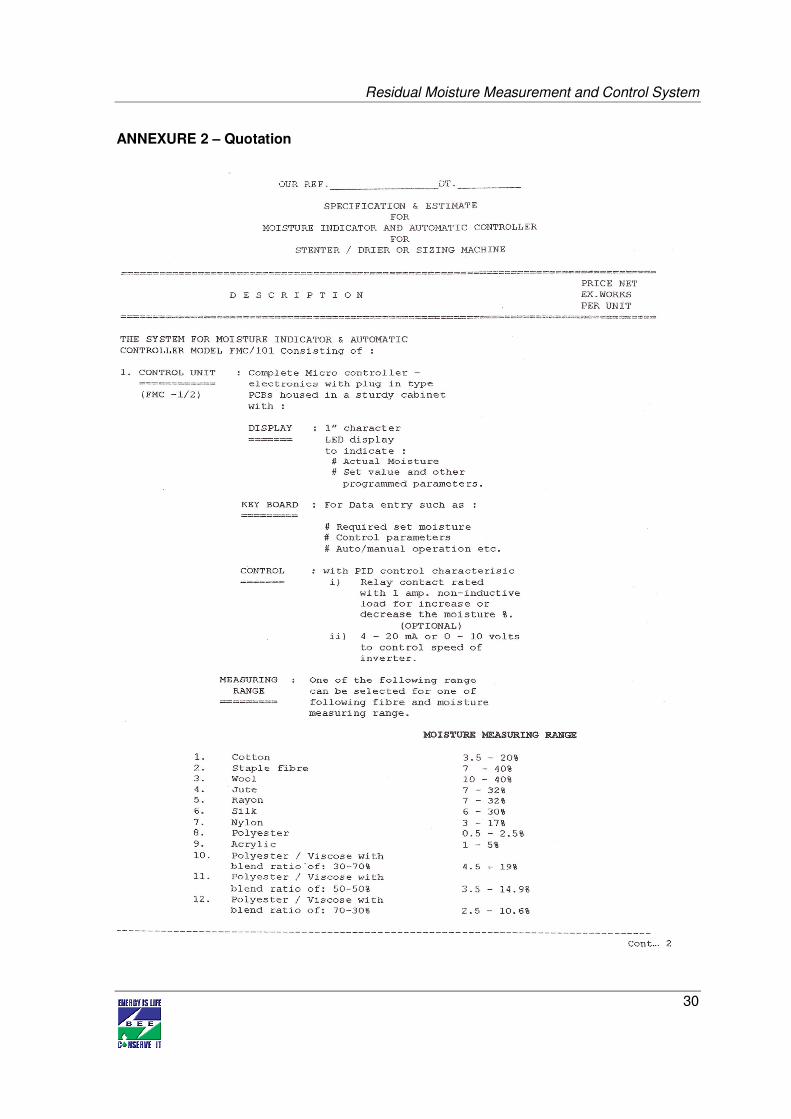
2.1.1 Equipment specification
A complete brochure of the equipment is placed at Annexure 1.
2.1.2 Suitability over existing equipment
The proposed system can be retrofitted to existing Stenters Machine without any
modification to existing Machinery.
2.1.3 Superiority over existing equipment
The system would improve precision of control on the existing process and hence would
yield better results on productivity as well as quality fronts.
2.1.4 Availability of equipment
The system can be delivered within 3 to 4 weeks of placement of order through
manufacturers in Ahmedabad.
2.1.5 Source of equipment
This technology has already been implemented in one of the textile process house at Pali
and the results have been as per projections. Brochure from the same vendor has been
enclosed. The equipment is readily available indigenously without any complications related
to patent or copyright.
Residual Moisture Measurement and Control System
22
2.1.6 Technical specification of equipment
Technical specification of proposed technology is attached at Annexure 1.
2.1.7 Terms and conditions in sales of equipment
No specific terms and conditions are attached to sale of the equipment.
2.1.8 Process down time during implementation
The proposed system is independent of existing system and integration would need work as
much as that needed to make an electricity connection. However, tuning of the system and
performance monitoring would take maximum one day.
2.2 Life cycle assessment and risks analysis
The unit consists of Sensors, VFD, PLCs, connections, contactors etc. There are no moving
parts and hence deterioration is not a problem. However, bad power quality may lead to
failure of the system. Being an electronic device, no problem is anticipated and the unit
would go on working perpetually if better ambient is made available.
2.3 Suitable Unit for Implementation of Proposed Technology
The proposed system can be implemented in over 25 no. out of 100 no. of Stenters. Total
potential for energy saving would be 700 MT per year if the proposition is implemented in all
the machines.
Residual Moisture Measurement and Control System
23
3.0 ECONOMIC BENEFITS FROM PROPOSED EQUIPMENT
3.1 Technical benefit
3.1.1 Fuel saving
The proposition would help save 28.08 MT RPC fuel per year in every stenter. A detail of
fuel saving calculation is given in Annexure 5.
3.1.2 Electricity saving
No electricity saving is envisaged out of implementation of the proposed system.
3.1.3 Improvement in product quality
The system comes with precision process control protocol and hence product quality would
certainly improve.
3.1.4 Increase in production
Precise process control will certainly improve production; however, the quantum of
improvement will depend upon extant level of inefficiency.
3.1.5 Reduction in raw material
Raw material consumption is same even after the implementation of proposed technology.
3.1.6 Reduction in other losses
None
3.2 Monetary benefits
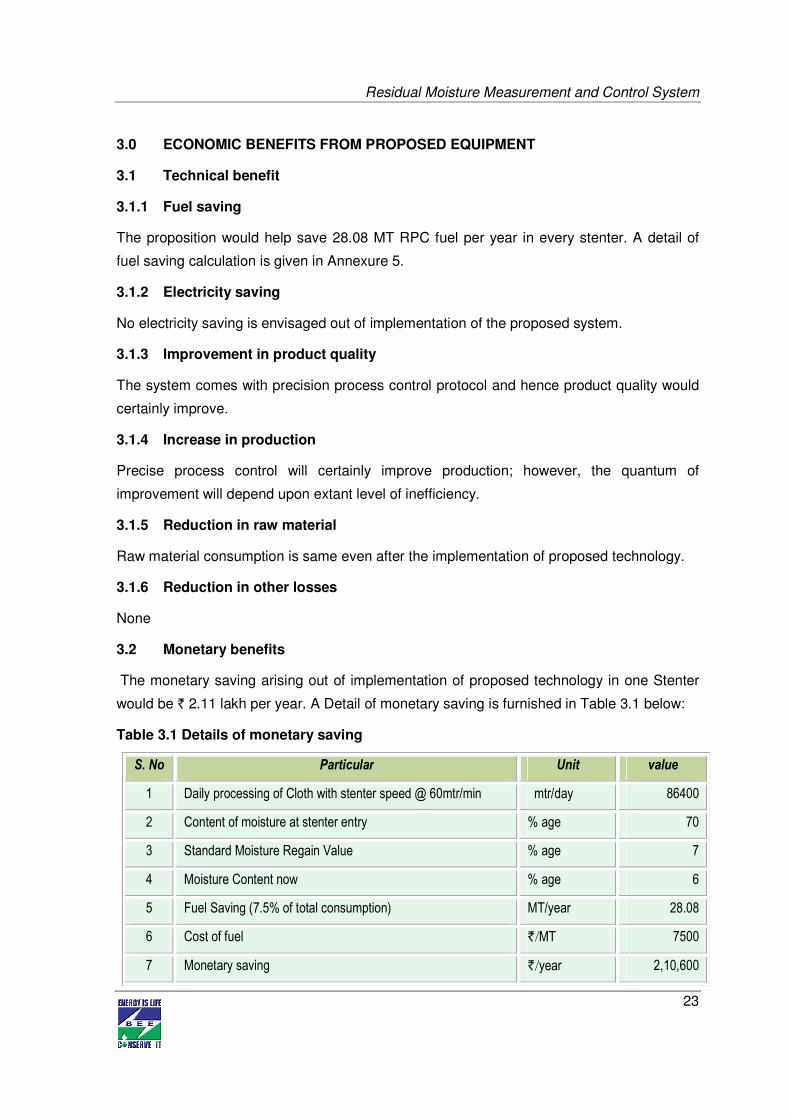
The monetary saving arising out of implementation of proposed technology in one Stenter
would be ` 2.11 lakh per year. A Detail of monetary saving is furnished in Table 3.1 below:
Table 3.1 Details of monetary saving
S. No Particular Unit value
1 Daily processing of Cloth with stenter speed @ 60mtr/min mtr/day 86400
2 Content of moisture at stenter entry % age 70
3 Standard Moisture Regain Value % age 7
4 Moisture Content now % age 6
5 Fuel Saving (7.5% of total consumption) MT/year 28.08
6 Cost of fuel `/MT 7500
7 Monetary saving `/year 2,10,600
Residual Moisture Measurement and Control System
24
3.3 Social benefits
3.3.1 Improvement in working environment in the plant
Proposed equipment reduces the GHG emission by reducing fuel consumption.
3.3.2 Improvement in workers skill
Not contributing to any improvement in skill sets of workers. However, the automation would
eliminate human intervention in precision control of process thereby reducing workload of
the frontline workers. No retrenchment of labor is envisaged because of implementation of
the proposed system.
3.4 Environmental benefits
3.4.1 Reduction in effluent generation
The fuel saving will have equivalent mitigation in terms of SPM and other pollutants
otherwise likely to be released in the atmosphere.
3.4.2 Reduction in GHG emission
The equivalent saving in GHG emission for every Stenter would be 76 per year as per
UNEP GHG Calculator.
3.4.3 Reduction in other emissions like SOX
NIL
Residual Moisture Measurement and Control System
25
4.0 INSTALLATION OF PROPOSED EQUIPMENT
4.1 Cost of equipment implementation
4.1.1 Equipments cost
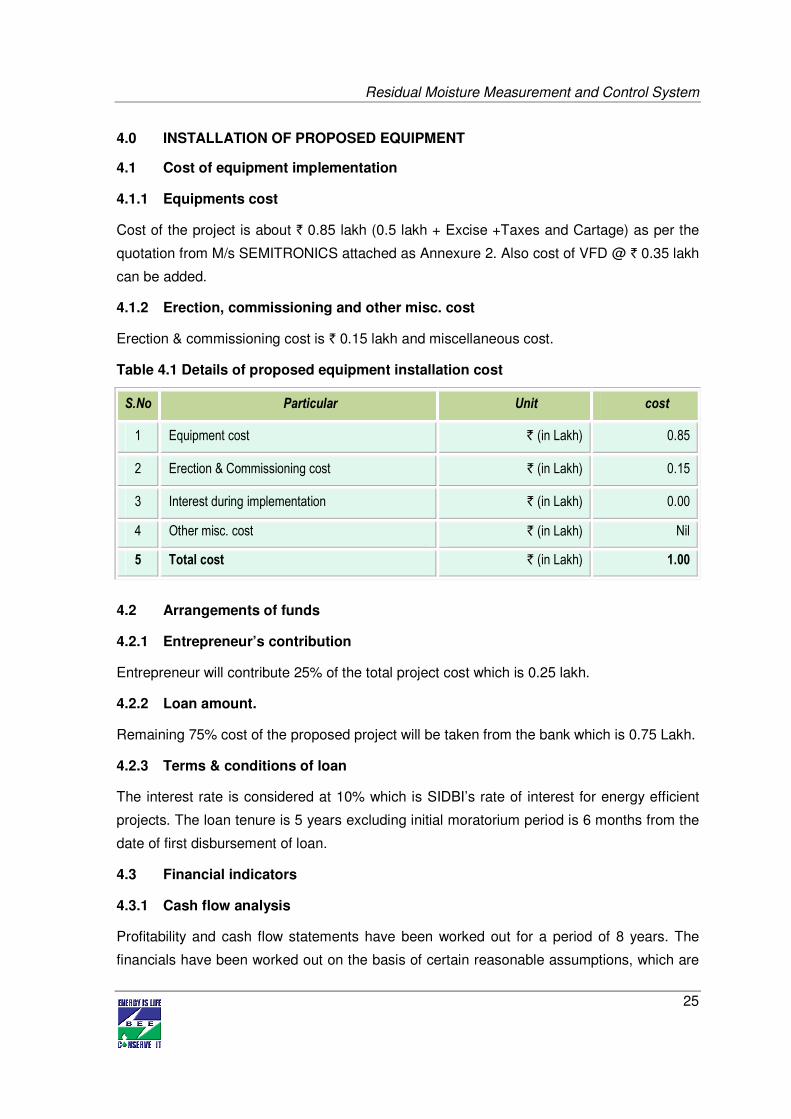
Cost of the project is about ` 0.85 lakh (0.5 lakh + Excise +Taxes and Cartage) as per the
quotation from M/s SEMITRONICS attached as Annexure 2. Also cost of VFD @ ` 0.35 lakh
can be added.
4.1.2 Erection, commissioning and other misc. cost
Erection & commissioning cost is ` 0.15 lakh and miscellaneous cost.
Table 4.1 Details of proposed equipment installation cost
S.No Particular Unit cost
1 Equipment cost ` (in Lakh) 0.85
2 Erection & Commissioning cost ` (in Lakh) 0.15
3 Interest during implementation ` (in Lakh) 0.00
4 Other misc. cost ` (in Lakh) Nil
5 Total cost ` (in Lakh) 1.00
4.2 Arrangements of funds
4.2.1 Entrepreneur’s contribution
Entrepreneur will contribute 25% of the total project cost which is 0.25 lakh.
4.2.2 Loan amount.
Remaining 75% cost of the proposed project will be taken from the bank which is 0.75 Lakh.
4.2.3 Terms & conditions of loan
The interest rate is considered at 10% which is SIDBI’s rate of interest for energy efficient
projects. The loan tenure is 5 years excluding initial moratorium period is 6 months from the
date of first disbursement of loan.
4.3 Financial indicators
4.3.1 Cash flow analysis
Profitability and cash flow statements have been worked out for a period of 8 years. The
financials have been worked out on the basis of certain reasonable assumptions, which are
Residual Moisture Measurement and Control System
26
outlined below. The cost of equipment considered is inclusive of hot water storage tanks
also.
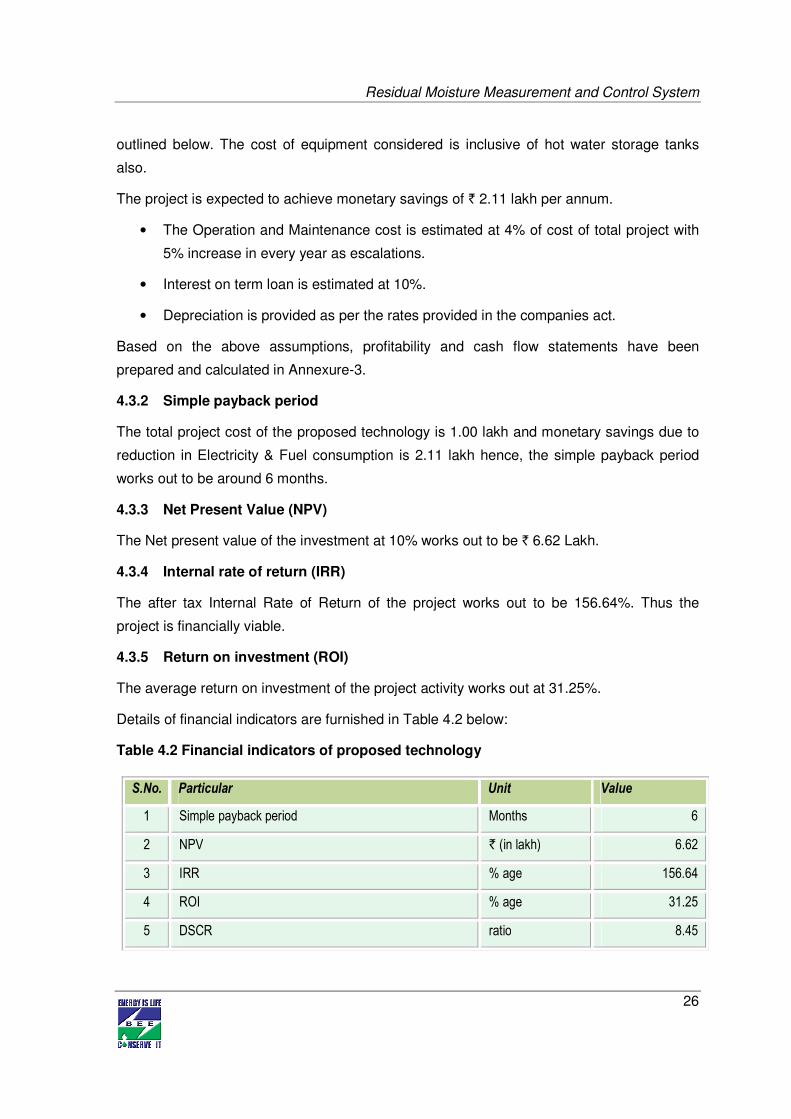
The project is expected to achieve monetary savings of ` 2.11 lakh per annum.
• The Operation and Maintenance cost is estimated at 4% of cost of total project with
5% increase in every year as escalations.
• Interest on term loan is estimated at 10%.
• Depreciation is provided as per the rates provided in the companies act.
Based on the above assumptions, profitability and cash flow statements have been
prepared and calculated in Annexure-3.
4.3.2 Simple payback period
The total project cost of the proposed technology is 1.00 lakh and monetary savings due to
reduction in Electricity & Fuel consumption is 2.11 lakh hence, the simple payback period
works out to be around 6 months.
4.3.3 Net Present Value (NPV)
The Net present value of the investment at 10% works out to be ` 6.62 Lakh.
4.3.4 Internal rate of return (IRR)
The after tax Internal Rate of Return of the project works out to be 156.64%. Thus the
project is financially viable.
4.3.5 Return on investment (ROI)
The average return on investment of the project activity works out at 31.25%.
Details of financial indicators are furnished in Table 4.2 below:
Table 4.2 Financial indicators of proposed technology
S.No. Particular Unit Value
1 Simple payback period Months 6
2 NPV ` (in lakh) 6.62
3 IRR % age 156.64
4 ROI % age 31.25
5 DSCR ratio 8.45
Residual Moisture Measurement and Control System
27
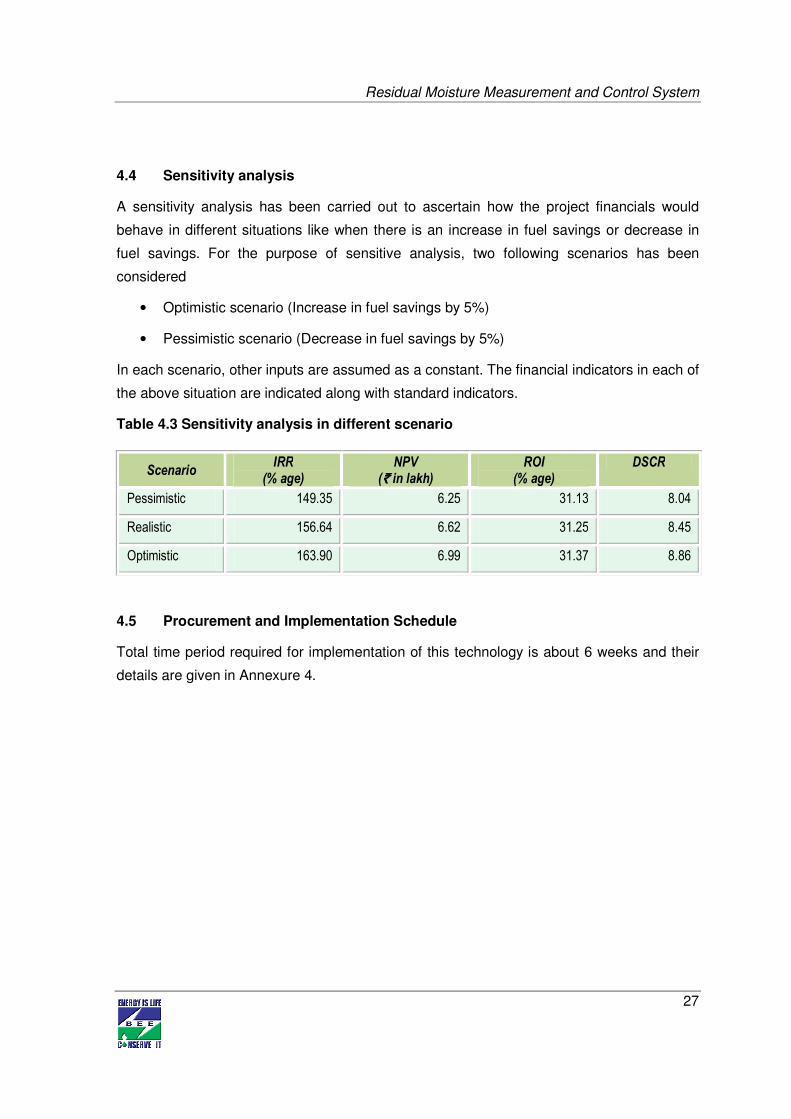
4.4 Sensitivity analysis
A sensitivity analysis has been carried out to ascertain how the project financials would
behave in different situations like when there is an increase in fuel savings or decrease in
fuel savings. For the purpose of sensitive analysis, two following scenarios has been
considered
• Optimistic scenario (Increase in fuel savings by 5%)
• Pessimistic scenario (Decrease in fuel savings by 5%)
In each scenario, other inputs are assumed as a constant. The financial indicators in each of
the above situation are indicated along with standard indicators.
Table 4.3 Sensitivity analysis in different scenario
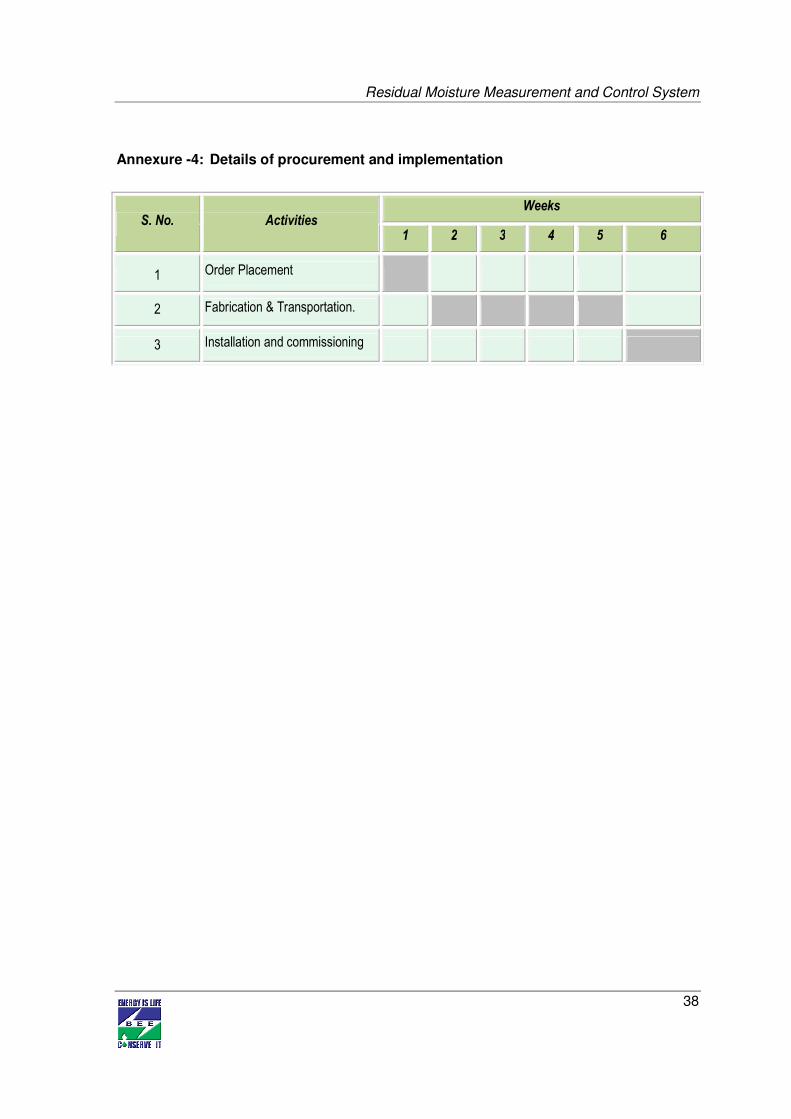
4.5 Procurement and Implementation Schedule
Total time period required for implementation of this technology is about 6 weeks and their
details are given in Annexure 4.
Scenario IRR
(% age) NPV
(`̀̀̀ in lakh) ROI
(% age) DSCR
Pessimistic 149.35 6.25 31.13 8.04
Realistic 156.64 6.62 31.25 8.45
Optimistic 163.90 6.99 31.37 8.86
Residual Moisture Measurement and Control System
28
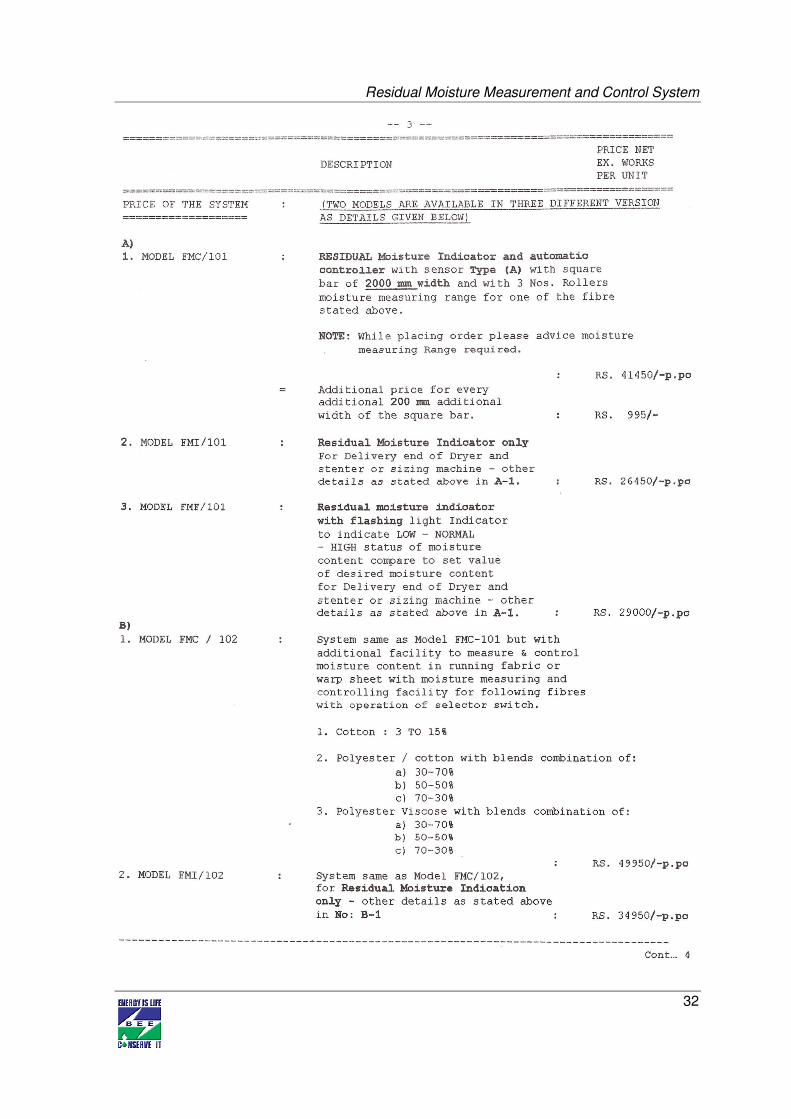
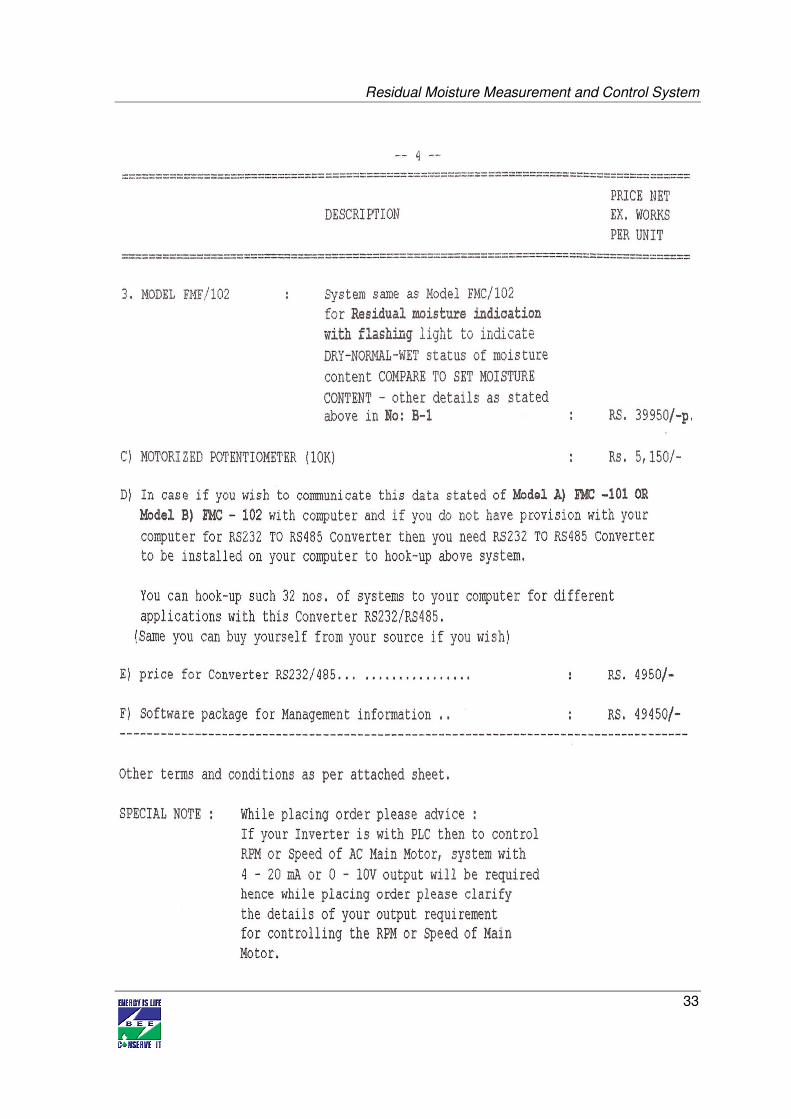
Annexure -1: Information Brochure of equipment
Residual Moisture Measurement and Control System
29
Residual Moisture Measurement and Control System
30
ANNEXURE 2 – Quotation
Residual Moisture Measurement and Control System
31
Residual Moisture Measurement and Control System
32
Residual Moisture Measurement and Control System
33
Residual Moisture Measurement and Control System
34
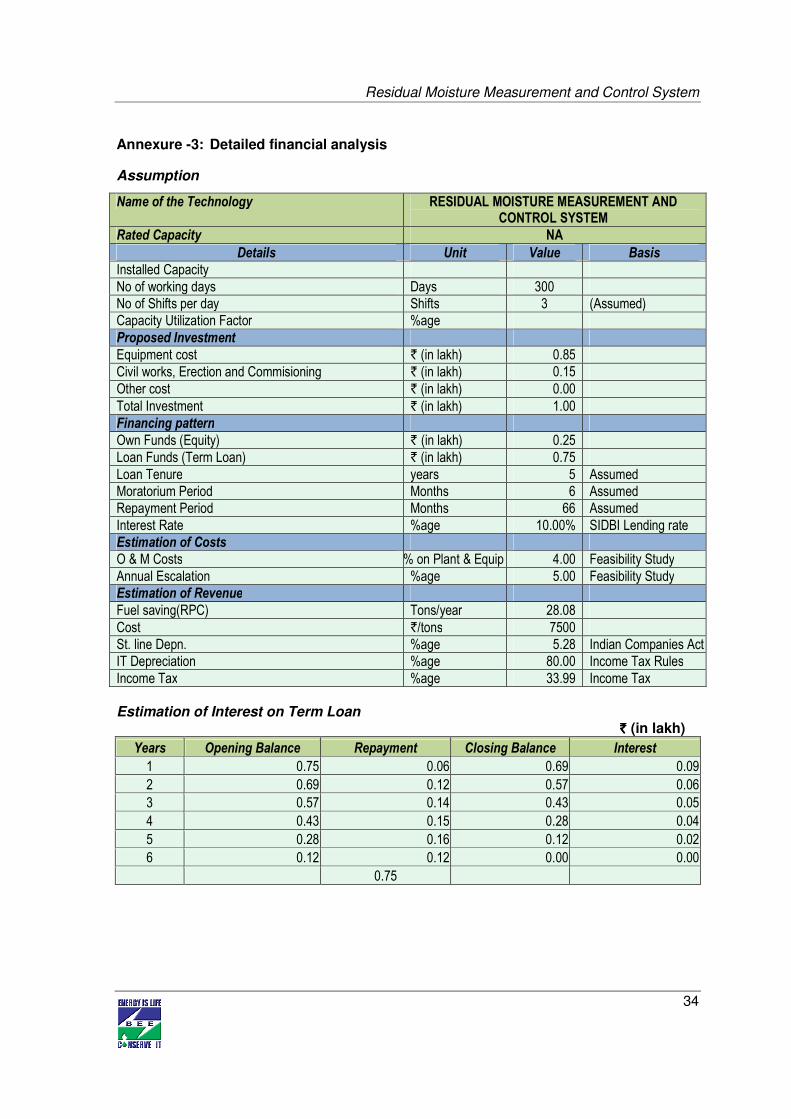
Annexure -3: Detailed financial analysis
Assumption
Name of the Technology RESIDUAL MOISTURE MEASUREMENT AND CONTROL SYSTEM
Rated Capacity NA
Details Unit Value Basis
Installed Capacity
No of working days Days 300
No of Shifts per day Shifts 3 (Assumed)
Capacity Utilization Factor %age
Proposed Investment
Equipment cost ` (in lakh) 0.85
Civil works, Erection and Commisioning ` (in lakh) 0.15
Other cost ` (in lakh) 0.00
Total Investment ` (in lakh) 1.00
Financing pattern
Own Funds (Equity) ` (in lakh) 0.25
Loan Funds (Term Loan) ` (in lakh) 0.75
Loan Tenure years 5 Assumed
Moratorium Period Months 6 Assumed
Repayment Period Months 66 Assumed
Interest Rate %age 10.00% SIDBI Lending rate
Estimation of Costs
O & M Costs % on Plant & Equip 4.00 Feasibility Study
Annual Escalation %age 5.00 Feasibility Study
Estimation of Revenue
Fuel saving(RPC) Tons/year 28.08
Cost `/tons 7500
St. line Depn. %age 5.28 Indian Companies Act
IT Depreciation %age 80.00 Income Tax Rules
Income Tax %age 33.99 Income Tax
Estimation of Interest on Term Loan `̀̀̀ (in lakh)
Years Opening Balance Repayment Closing Balance Interest
1 0.75 0.06 0.69 0.09
2 0.69 0.12 0.57 0.06
3 0.57 0.14 0.43 0.05
4 0.43 0.15 0.28 0.04
5 0.28 0.16 0.12 0.02
6 0.12 0.12 0.00 0.00
0.75
Residual Moisture Measurement and Control System
35
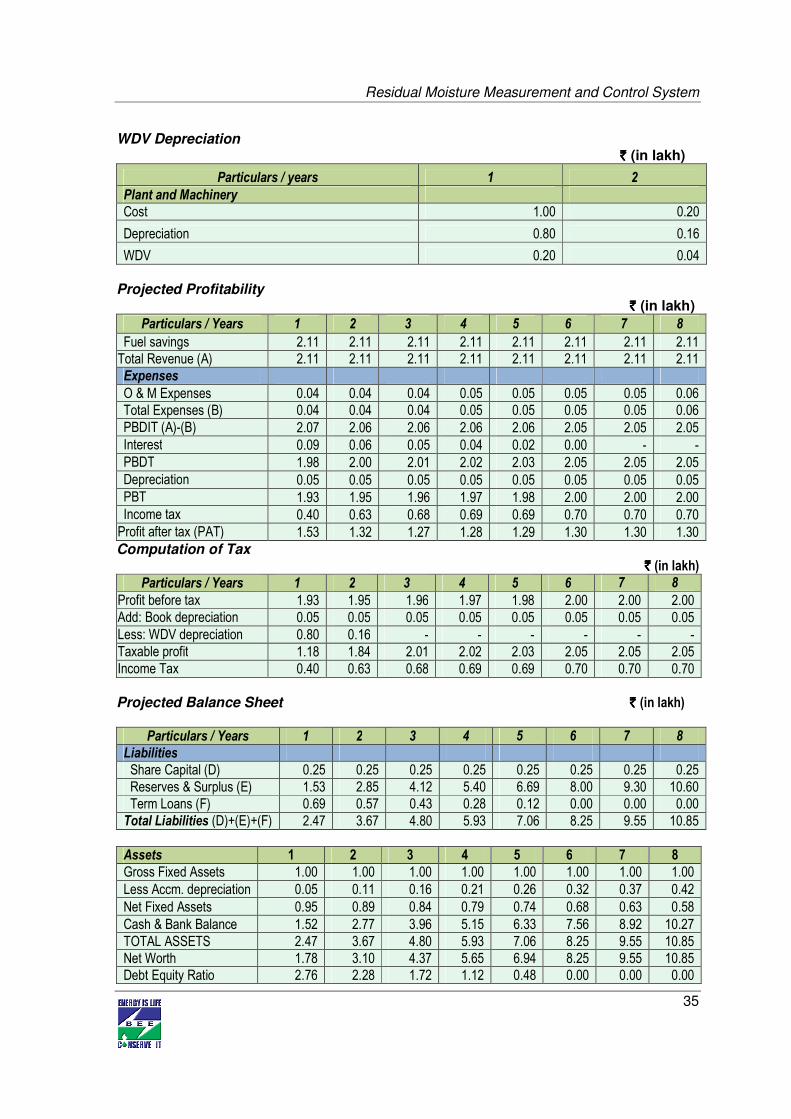
WDV Depreciation `̀̀̀ (in lakh)
Particulars / years 1 2
Plant and Machinery Cost 1.00 0.20
Depreciation 0.80 0.16
WDV 0.20 0.04
Projected Profitability `̀̀̀ (in lakh)
Particulars / Years 1 2 3 4 5 6 7 8
Fuel savings 2.11 2.11 2.11 2.11 2.11 2.11 2.11 2.11
Total Revenue (A) 2.11 2.11 2.11 2.11 2.11 2.11 2.11 2.11
Expenses
O & M Expenses 0.04 0.04 0.04 0.05 0.05 0.05 0.05 0.06
Total Expenses (B) 0.04 0.04 0.04 0.05 0.05 0.05 0.05 0.06
PBDIT (A)-(B) 2.07 2.06 2.06 2.06 2.06 2.05 2.05 2.05
Interest 0.09 0.06 0.05 0.04 0.02 0.00 - -
PBDT 1.98 2.00 2.01 2.02 2.03 2.05 2.05 2.05
Depreciation 0.05 0.05 0.05 0.05 0.05 0.05 0.05 0.05
PBT 1.93 1.95 1.96 1.97 1.98 2.00 2.00 2.00
Income tax 0.40 0.63 0.68 0.69 0.69 0.70 0.70 0.70
Profit after tax (PAT) 1.53 1.32 1.27 1.28 1.29 1.30 1.30 1.30
Computation of Tax `̀̀̀ (in lakh)
Particulars / Years 1 2 3 4 5 6 7 8
Profit before tax 1.93 1.95 1.96 1.97 1.98 2.00 2.00 2.00
Add: Book depreciation 0.05 0.05 0.05 0.05 0.05 0.05 0.05 0.05
Less: WDV depreciation 0.80 0.16 - - - - - -
Taxable profit 1.18 1.84 2.01 2.02 2.03 2.05 2.05 2.05
Income Tax 0.40 0.63 0.68 0.69 0.69 0.70 0.70 0.70
Projected Balance Sheet `̀̀̀ (in lakh)
Particulars / Years 1 2 3 4 5 6 7 8
Liabilities
Share Capital (D) 0.25 0.25 0.25 0.25 0.25 0.25 0.25 0.25
Reserves & Surplus (E) 1.53 2.85 4.12 5.40 6.69 8.00 9.30 10.60
Term Loans (F) 0.69 0.57 0.43 0.28 0.12 0.00 0.00 0.00
Total Liabilities (D)+(E)+(F) 2.47 3.67 4.80 5.93 7.06 8.25 9.55 10.85
Assets 1 2 3 4 5 6 7 8
Gross Fixed Assets 1.00 1.00 1.00 1.00 1.00 1.00 1.00 1.00
Less Accm. depreciation 0.05 0.11 0.16 0.21 0.26 0.32 0.37 0.42
Net Fixed Assets 0.95 0.89 0.84 0.79 0.74 0.68 0.63 0.58
Cash & Bank Balance 1.52 2.77 3.96 5.15 6.33 7.56 8.92 10.27
TOTAL ASSETS 2.47 3.67 4.80 5.93 7.06 8.25 9.55 10.85
Net Worth 1.78 3.10 4.37 5.65 6.94 8.25 9.55 10.85
Debt Equity Ratio 2.76 2.28 1.72 1.12 0.48 0.00 0.00 0.00
Residual Moisture Measurement and Control System
36
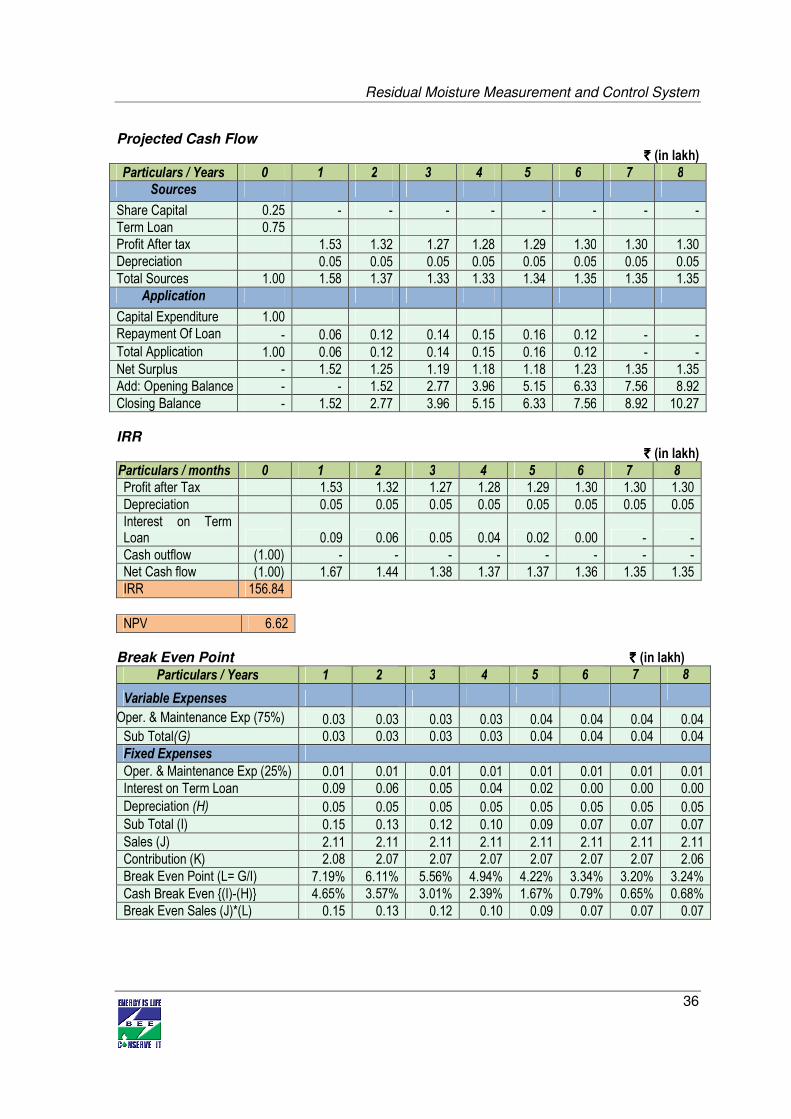
Projected Cash Flow `̀̀̀ (in lakh)
Particulars / Years 0 1 2 3 4 5 6 7 8
Sources
Share Capital 0.25 - - - - - - - -
Term Loan 0.75
Profit After tax 1.53 1.32 1.27 1.28 1.29 1.30 1.30 1.30
Depreciation 0.05 0.05 0.05 0.05 0.05 0.05 0.05 0.05
Total Sources 1.00 1.58 1.37 1.33 1.33 1.34 1.35 1.35 1.35
Application
Capital Expenditure 1.00
Repayment Of Loan - 0.06 0.12 0.14 0.15 0.16 0.12 - -
Total Application 1.00 0.06 0.12 0.14 0.15 0.16 0.12 - -
Net Surplus - 1.52 1.25 1.19 1.18 1.18 1.23 1.35 1.35
Add: Opening Balance - - 1.52 2.77 3.96 5.15 6.33 7.56 8.92
Closing Balance - 1.52 2.77 3.96 5.15 6.33 7.56 8.92 10.27
IRR
`̀̀̀ (in lakh)
Particulars / months 0 1 2 3 4 5 6 7 8
Profit after Tax 1.53 1.32 1.27 1.28 1.29 1.30 1.30 1.30
Depreciation 0.05 0.05 0.05 0.05 0.05 0.05 0.05 0.05
Interest on Term Loan 0.09 0.06 0.05 0.04 0.02 0.00 - -
Cash outflow (1.00) - - - - - - - -
Net Cash flow (1.00) 1.67 1.44 1.38 1.37 1.37 1.36 1.35 1.35
IRR 156.84%
NPV 6.62
Break Even Point `̀̀̀ (in lakh)
Particulars / Years 1 2 3 4 5 6 7 8
Variable Expenses
Oper. & Maintenance Exp (75%) 0.03 0.03 0.03 0.03 0.04 0.04 0.04 0.04
Sub Total(G) 0.03 0.03 0.03 0.03 0.04 0.04 0.04 0.04
Fixed Expenses
Oper. & Maintenance Exp (25%) 0.01 0.01 0.01 0.01 0.01 0.01 0.01 0.01
Interest on Term Loan 0.09 0.06 0.05 0.04 0.02 0.00 0.00 0.00
Depreciation (H) 0.05 0.05 0.05 0.05 0.05 0.05 0.05 0.05
Sub Total (I) 0.15 0.13 0.12 0.10 0.09 0.07 0.07 0.07
Sales (J) 2.11 2.11 2.11 2.11 2.11 2.11 2.11 2.11
Contribution (K) 2.08 2.07 2.07 2.07 2.07 2.07 2.07 2.06
Break Even Point (L= G/I) 7.19% 6.11% 5.56% 4.94% 4.22% 3.34% 3.20% 3.24%
Cash Break Even {(I)-(H)} 4.65% 3.57% 3.01% 2.39% 1.67% 0.79% 0.65% 0.68%
Break Even Sales (J)*(L) 0.15 0.13 0.12 0.10 0.09 0.07 0.07 0.07
Residual Moisture Measurement and Control System
37
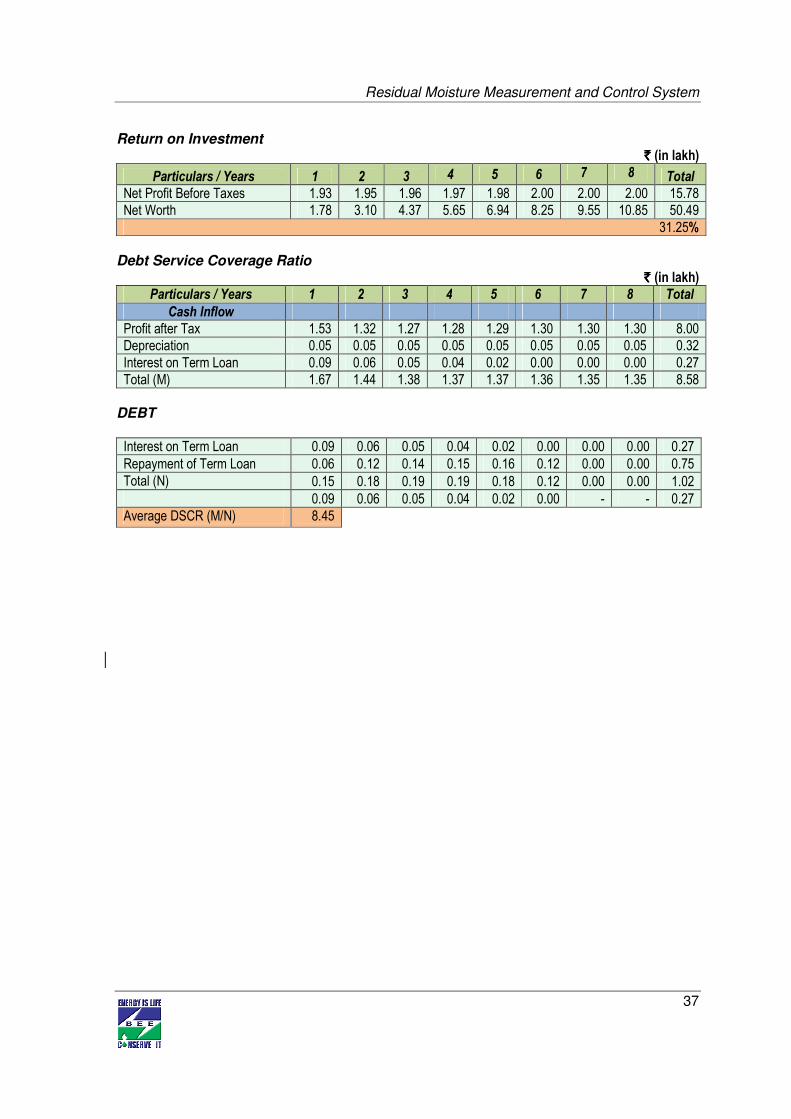
Return on Investment `̀̀̀ (in lakh)
Particulars / Years 1 2 3 4 5 6 7 8 Total
Net Profit Before Taxes 1.93 1.95 1.96 1.97 1.98 2.00 2.00 2.00 15.78
Net Worth 1.78 3.10 4.37 5.65 6.94 8.25 9.55 10.85 50.49
31.25%
Debt Service Coverage Ratio
` ` ` ` (in lakh)
Particulars / Years 1 2 3 4 5 6 7 8 Total
Cash Inflow
Profit after Tax 1.53 1.32 1.27 1.28 1.29 1.30 1.30 1.30 8.00
Depreciation 0.05 0.05 0.05 0.05 0.05 0.05 0.05 0.05 0.32
Interest on Term Loan 0.09 0.06 0.05 0.04 0.02 0.00 0.00 0.00 0.27
Total (M) 1.67 1.44 1.38 1.37 1.37 1.36 1.35 1.35 8.58
DEBT
Interest on Term Loan 0.09 0.06 0.05 0.04 0.02 0.00 0.00 0.00 0.27
Repayment of Term Loan 0.06 0.12 0.14 0.15 0.16 0.12 0.00 0.00 0.75
Total (N) 0.15 0.18 0.19 0.19 0.18 0.12 0.00 0.00 1.02
0.09 0.06 0.05 0.04 0.02 0.00 - - 0.27
Average DSCR (M/N) 8.45
Residual Moisture Measurement and Control System
38
Annexure -4: Details of procurement and implementation
S. No. Activities Weeks
1 2 3 4 5 6
1 Order Placement
2 Fabrication & Transportation.
3 Installation and commissioning
Residual Moisture Measurement and Control System
39
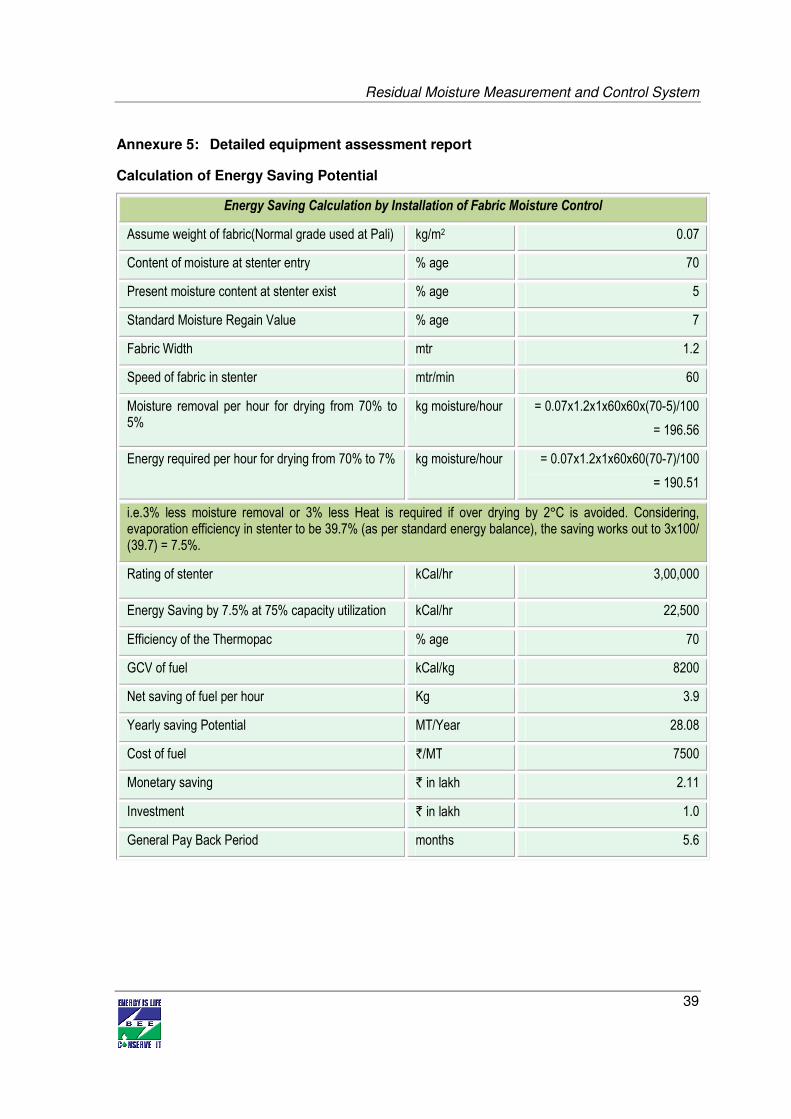
Annexure 5: Detailed equipment assessment report
Calculation of Energy Saving Potential
Energy Saving Calculation by Installation of Fabric Moisture Control
Assume weight of fabric(Normal grade used at Pali) kg/m2 0.07
Content of moisture at stenter entry % age 70
Present moisture content at stenter exist % age 5
Standard Moisture Regain Value % age 7
Fabric Width mtr 1.2
Speed of fabric in stenter mtr/min 60
Moisture removal per hour for drying from 70% to 5%
kg moisture/hour = 0.07x1.2x1x60x60x(70-5)/100
= 196.56
Energy required per hour for drying from 70% to 7% kg moisture/hour = 0.07x1.2x1x60x60(70-7)/100
= 190.51
i.e.3% less moisture removal or 3% less Heat is required if over drying by 2°C is avoided. Considering, evaporation efficiency in stenter to be 39.7% (as per standard energy balance), the saving works out to 3x100/ (39.7) = 7.5%.
Rating of stenter kCal/hr 3,00,000
Energy Saving by 7.5% at 75% capacity utilization kCal/hr 22,500
Efficiency of the Thermopac % age 70
GCV of fuel kCal/kg 8200
Net saving of fuel per hour Kg 3.9
Yearly saving Potential MT/Year 28.08
Cost of fuel `/MT 7500
Monetary saving ` in lakh 2.11
Investment ` in lakh 1.0
General Pay Back Period months 5.6
Residual Moisture Measurement and Control System
40
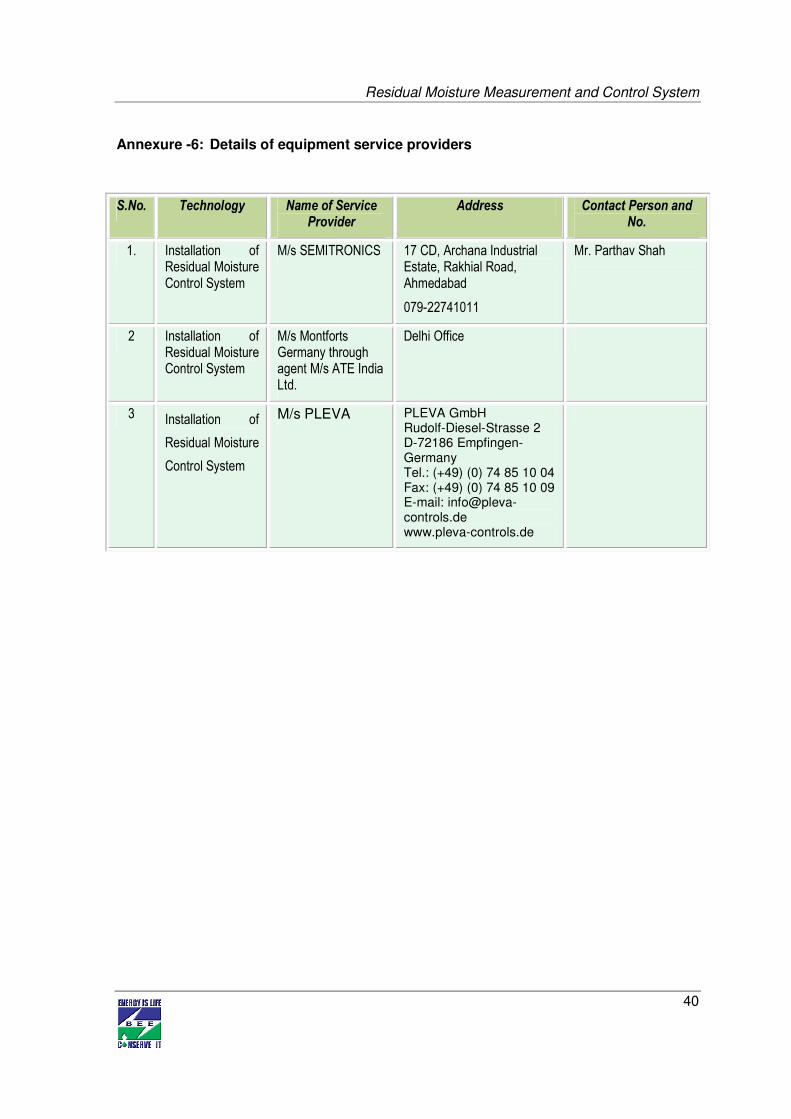
Annexure -6: Details of equipment service providers
S.No. Technology Name of Service Provider
Address Contact Person and No.
1. Installation of Residual Moisture Control System
M/s SEMITRONICS 17 CD, Archana Industrial Estate, Rakhial Road, Ahmedabad
079-22741011
Mr. Parthav Shah
2 Installation of Residual Moisture Control System
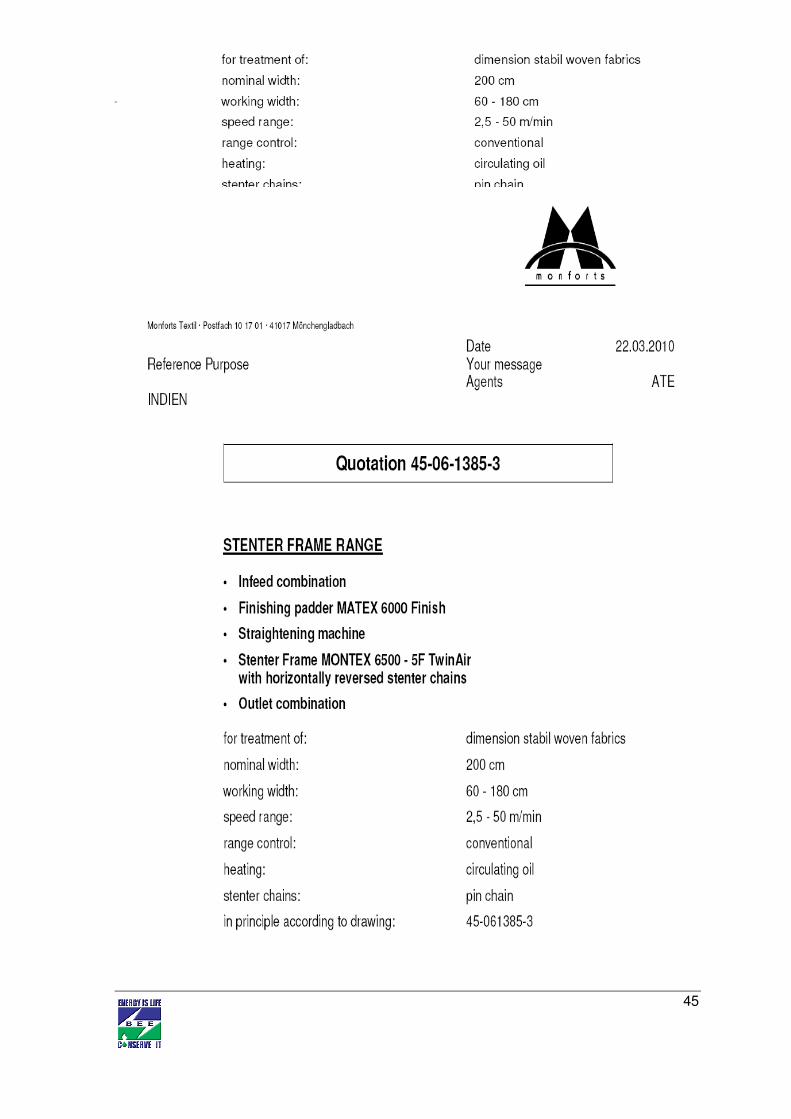
M/s Montforts Germany through agent M/s ATE India Ltd.
Delhi Office
3 Installation of
Residual Moisture
Control System
M/s PLEVA PLEVA GmbH Rudolf-Diesel-Strasse 2 D-72186 Empfingen-Germany Tel.: (+49) (0) 74 85 10 04 Fax: (+49) (0) 74 85 10 09 E-mail: [email protected] www.pleva-controls.de
Residual Moisture Measurement and Control System
41
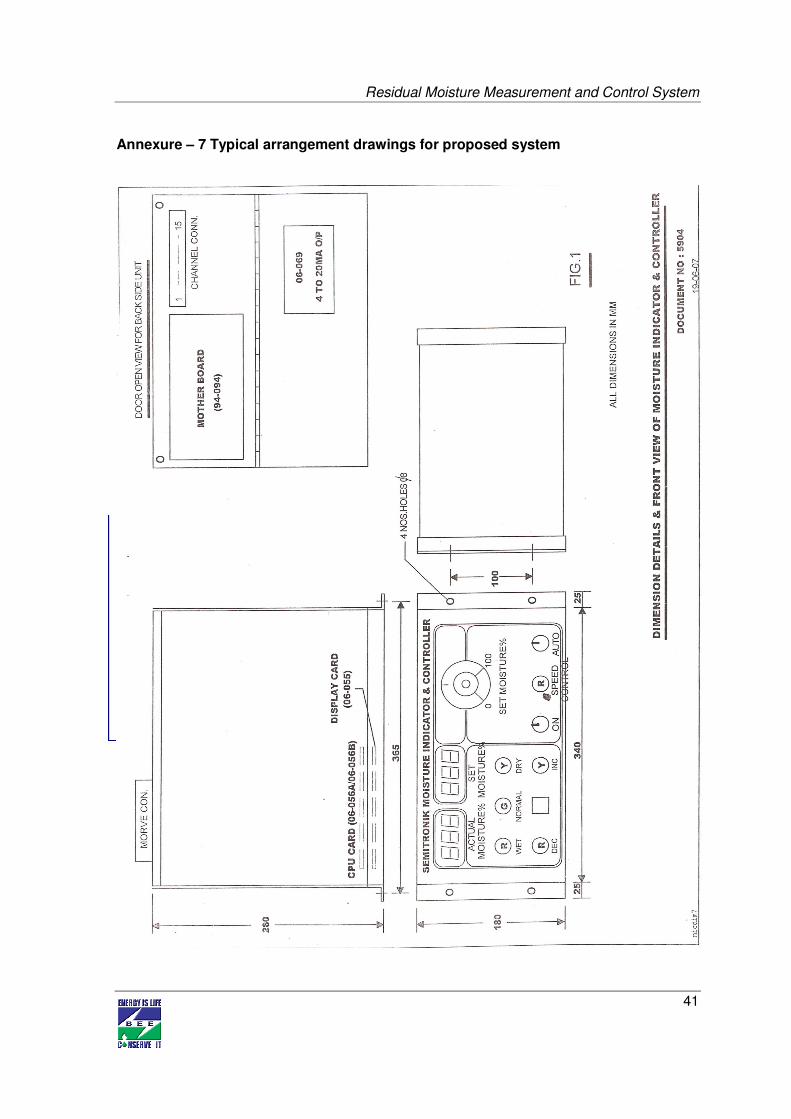
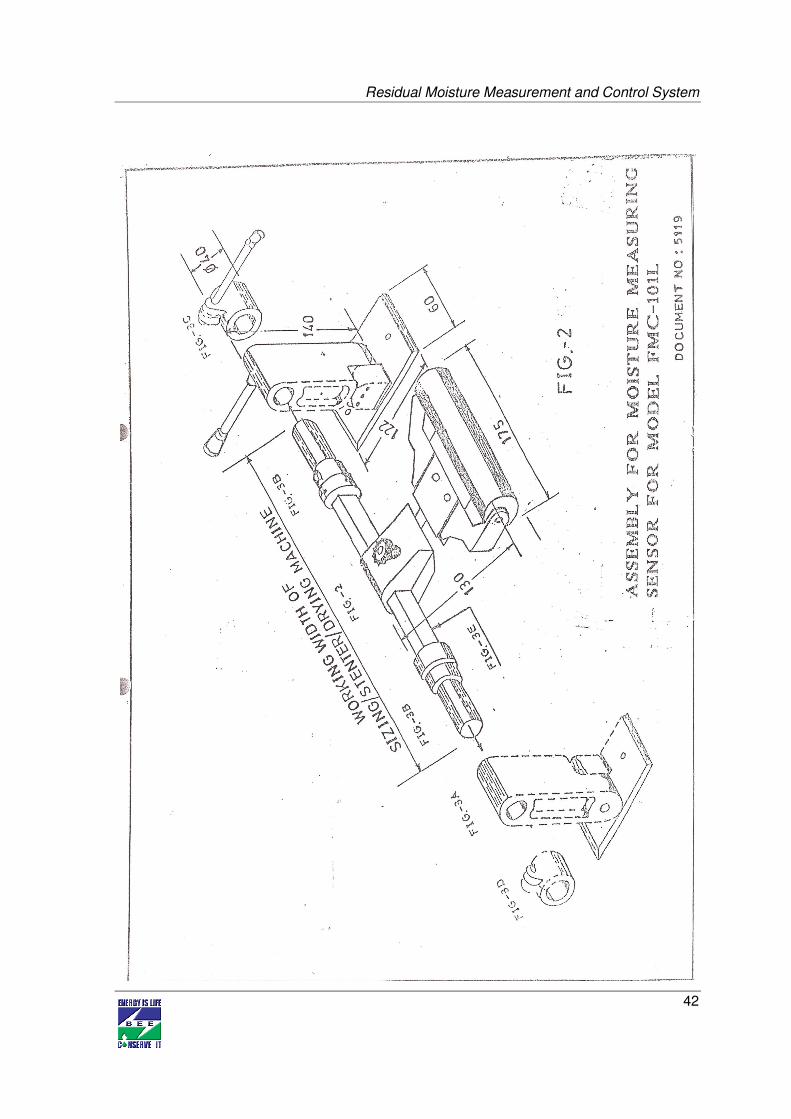
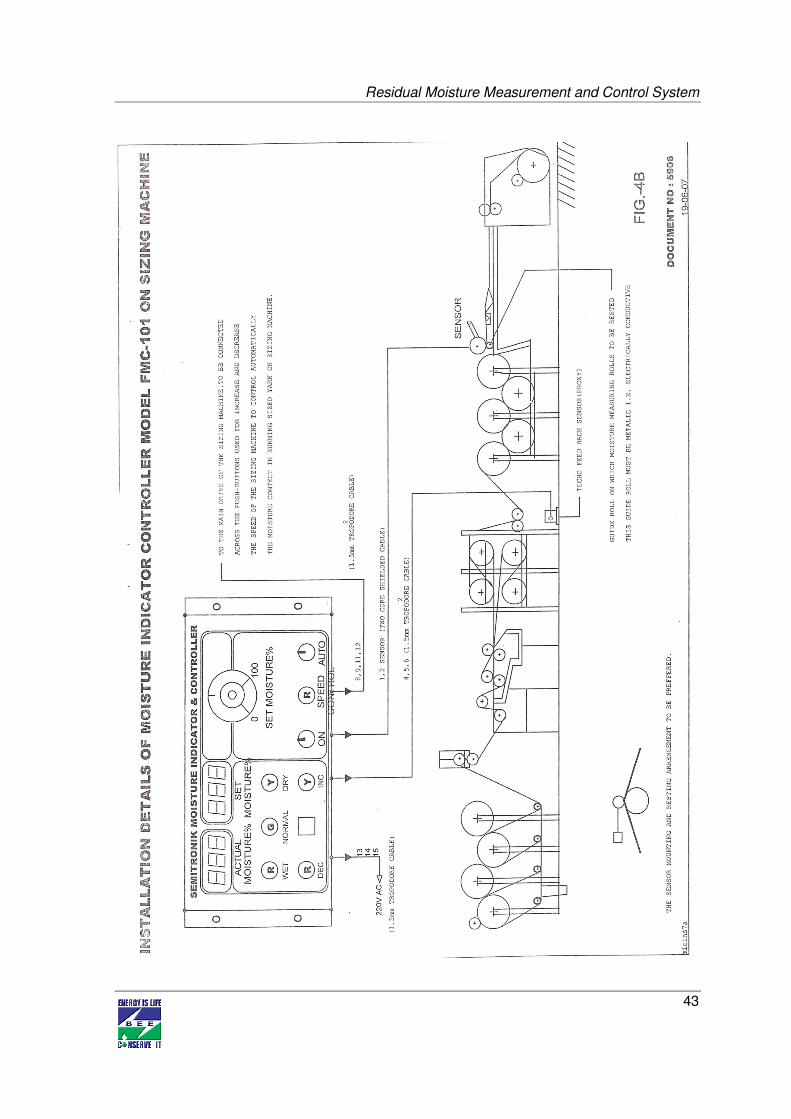
Annexure – 7 Typical arrangement drawings for proposed system
Residual Moisture Measurement and Control System
42
Residual Moisture Measurement and Control System
43
Residual Moisture Measurement and Control System
44
Residual Moisture Measurement and Control System
45
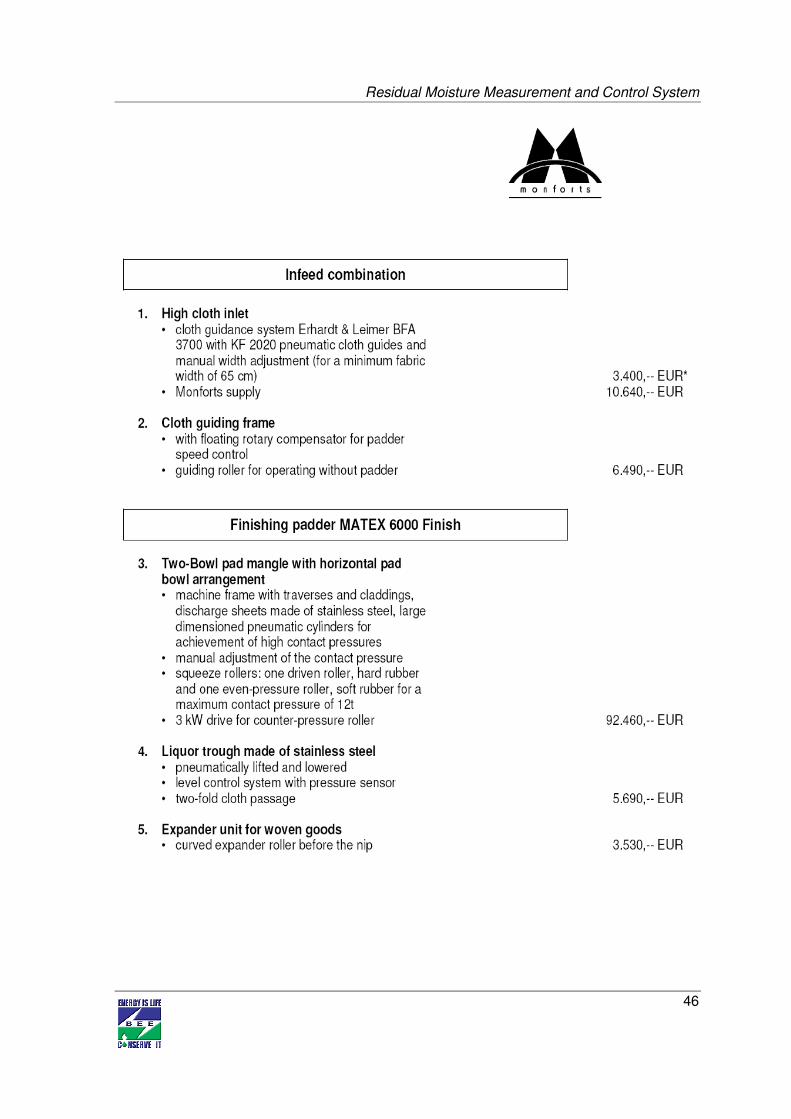
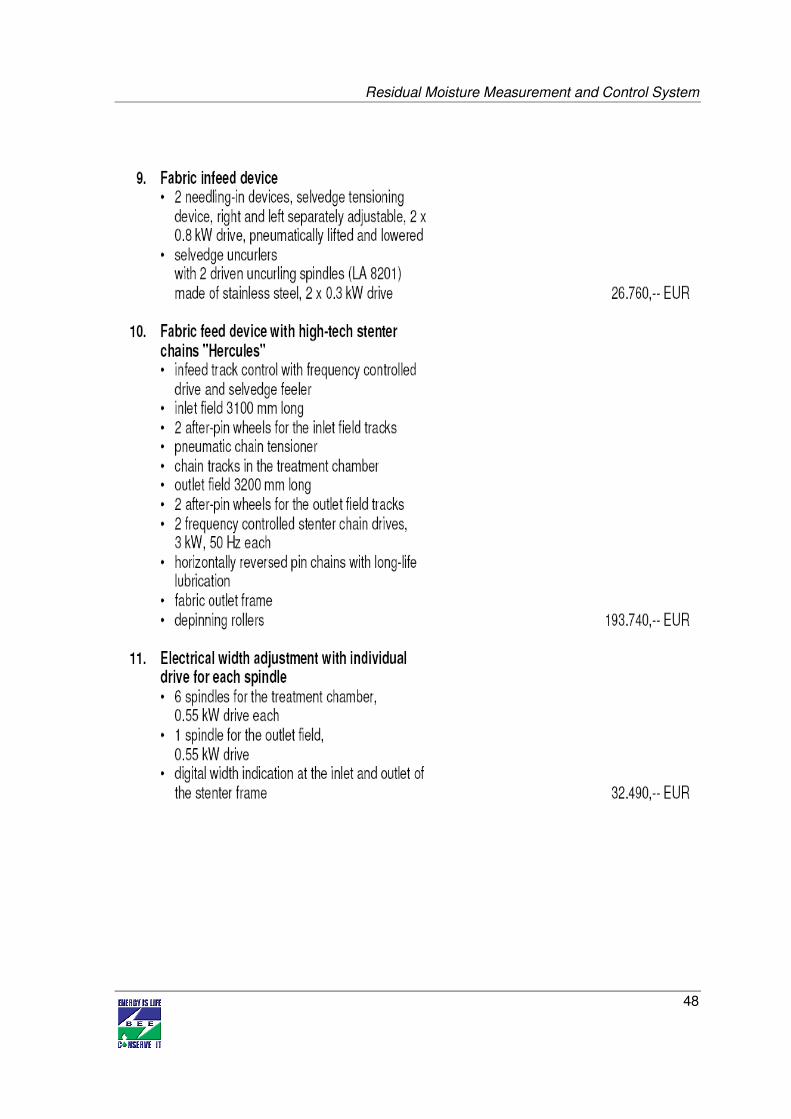
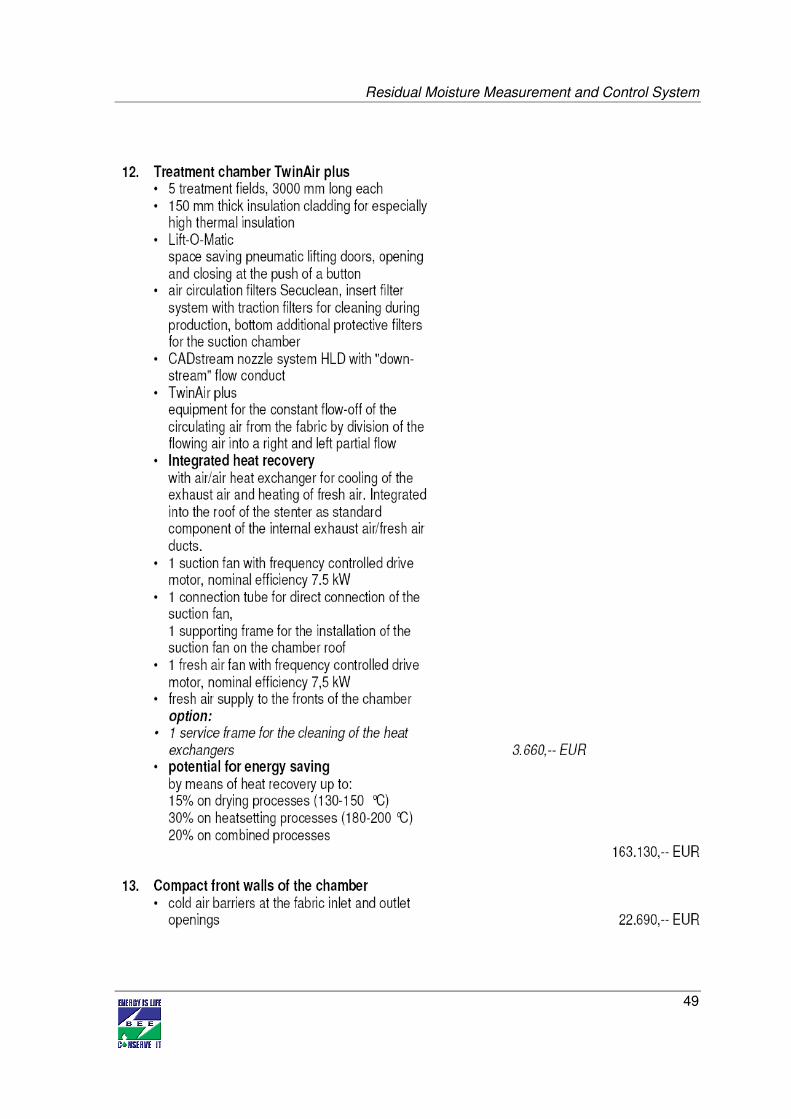
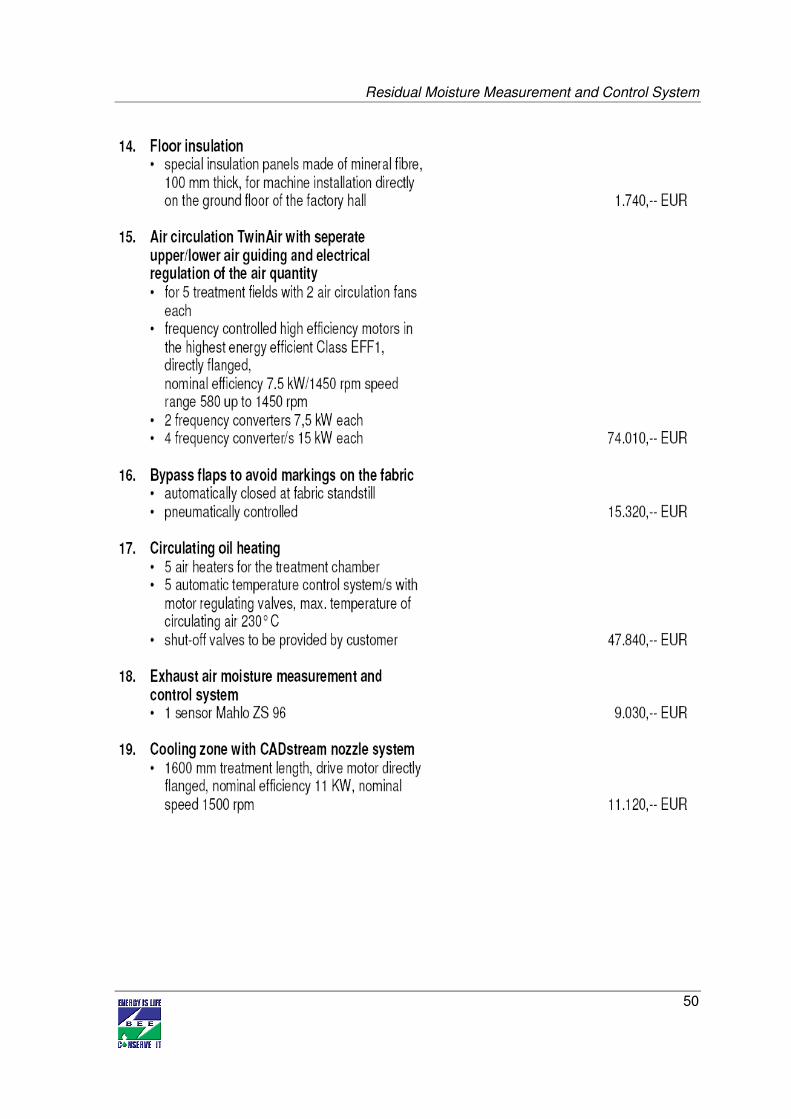
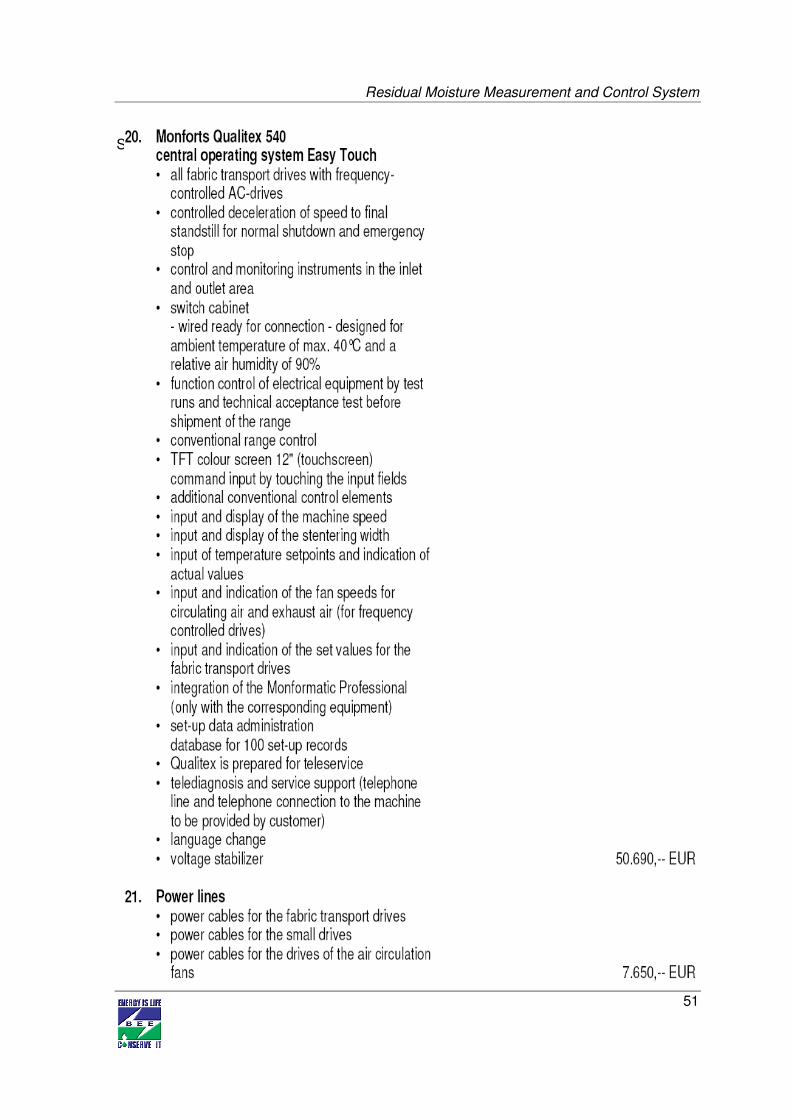
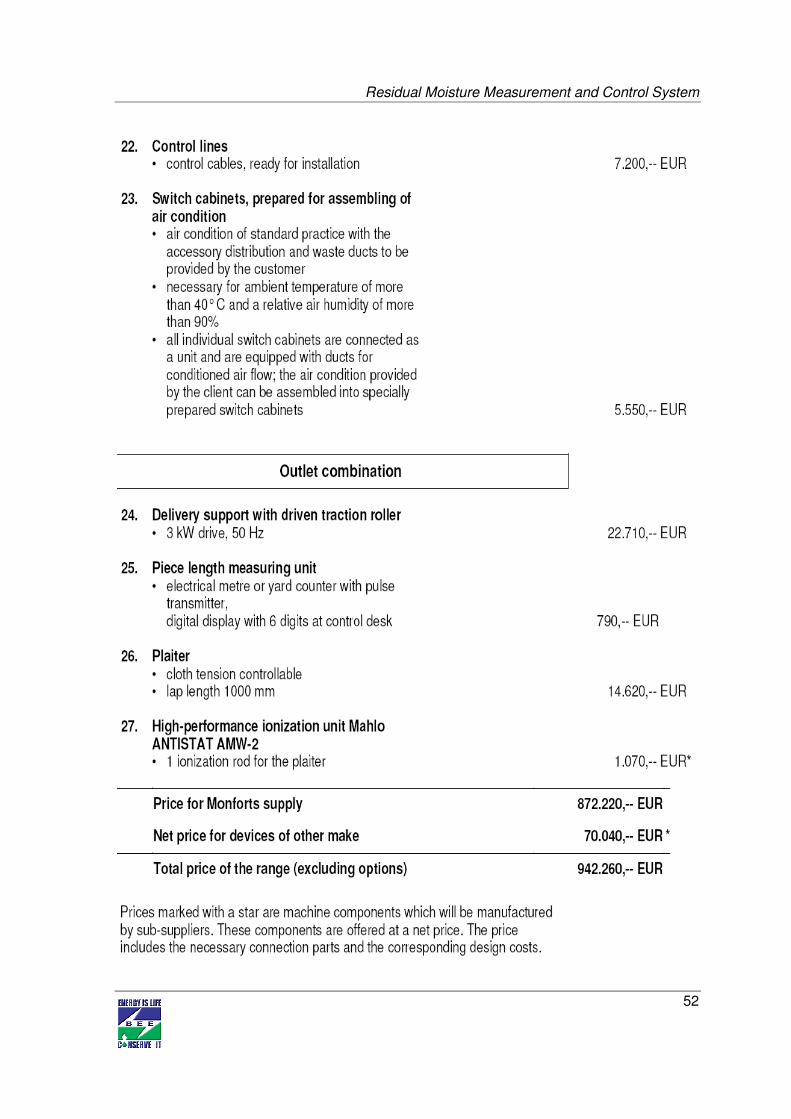
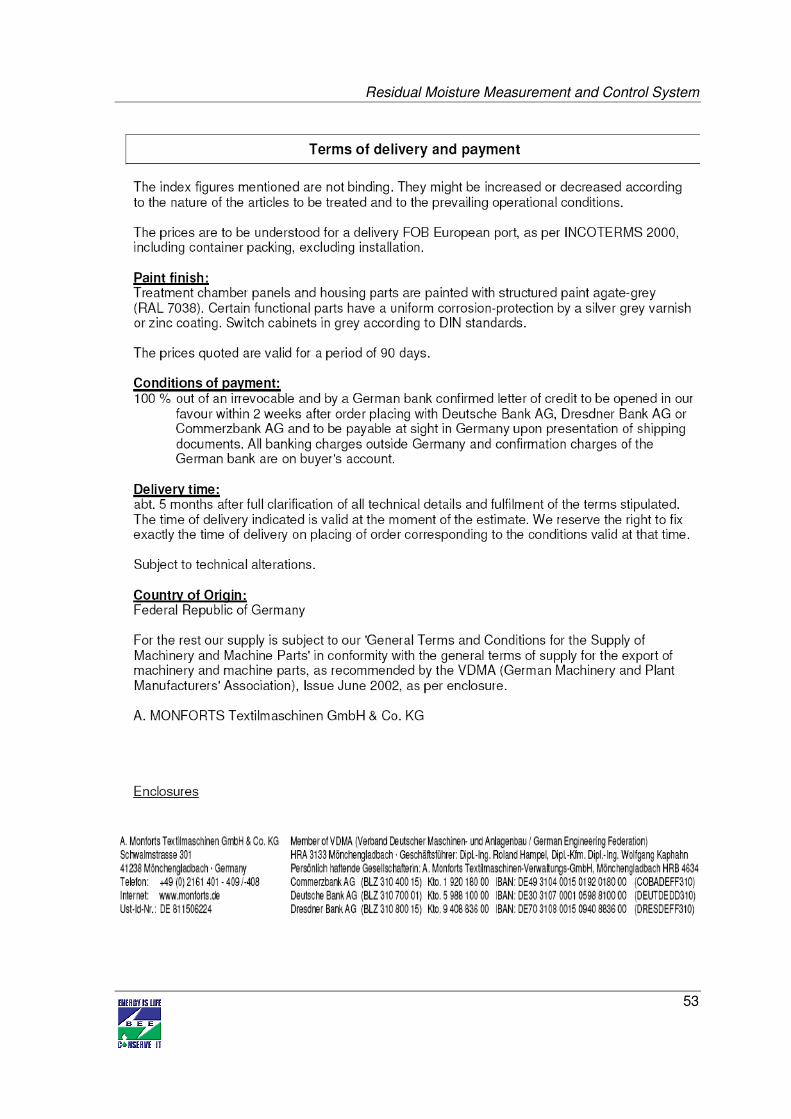
Annexure – 8 Quotation/Technical for Proposed Technology
Residual Moisture Measurement and Control System
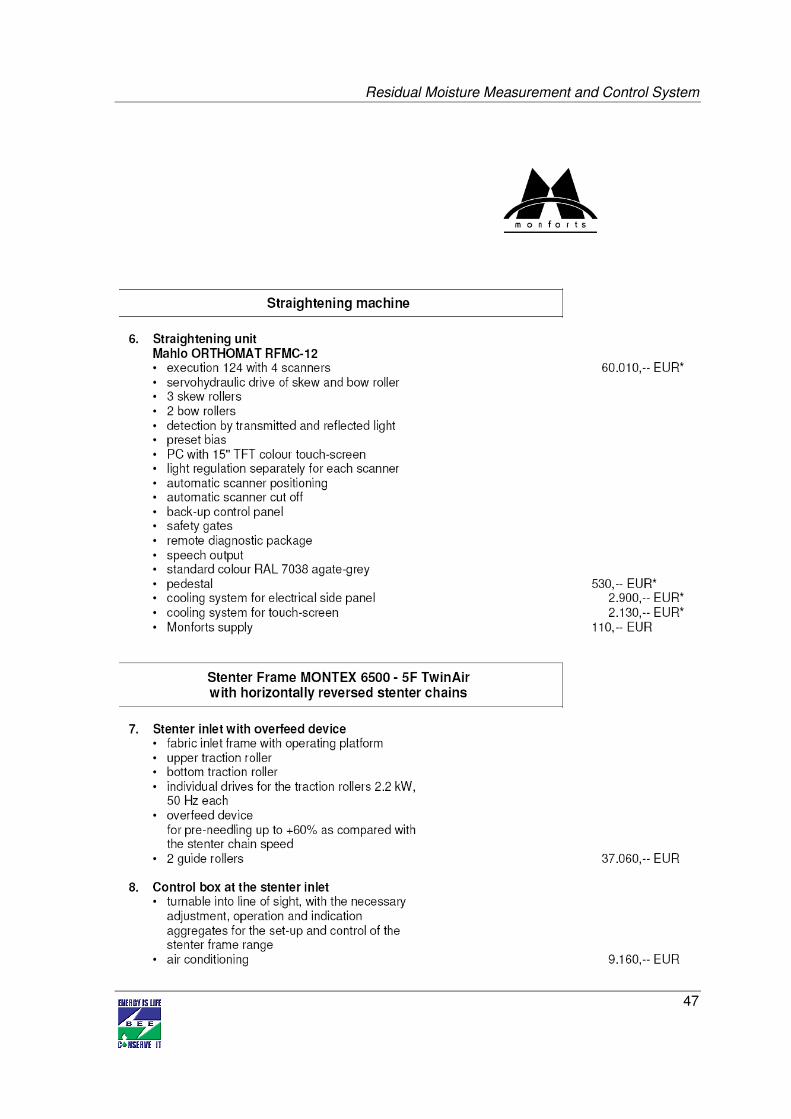
46
Residual Moisture Measurement and Control System
47
Residual Moisture Measurement and Control System
48
Residual Moisture Measurement and Control System
49
Residual Moisture Measurement and Control System
50
Residual Moisture Measurement and Control System
51
S
Residual Moisture Measurement and Control System
52
Residual Moisture Measurement and Control System
53