Embed Size (px)
Citation preview

PALFINGER:INcREAsING thE PowERoF thE BRANdAnnuAl RepoRt 2012
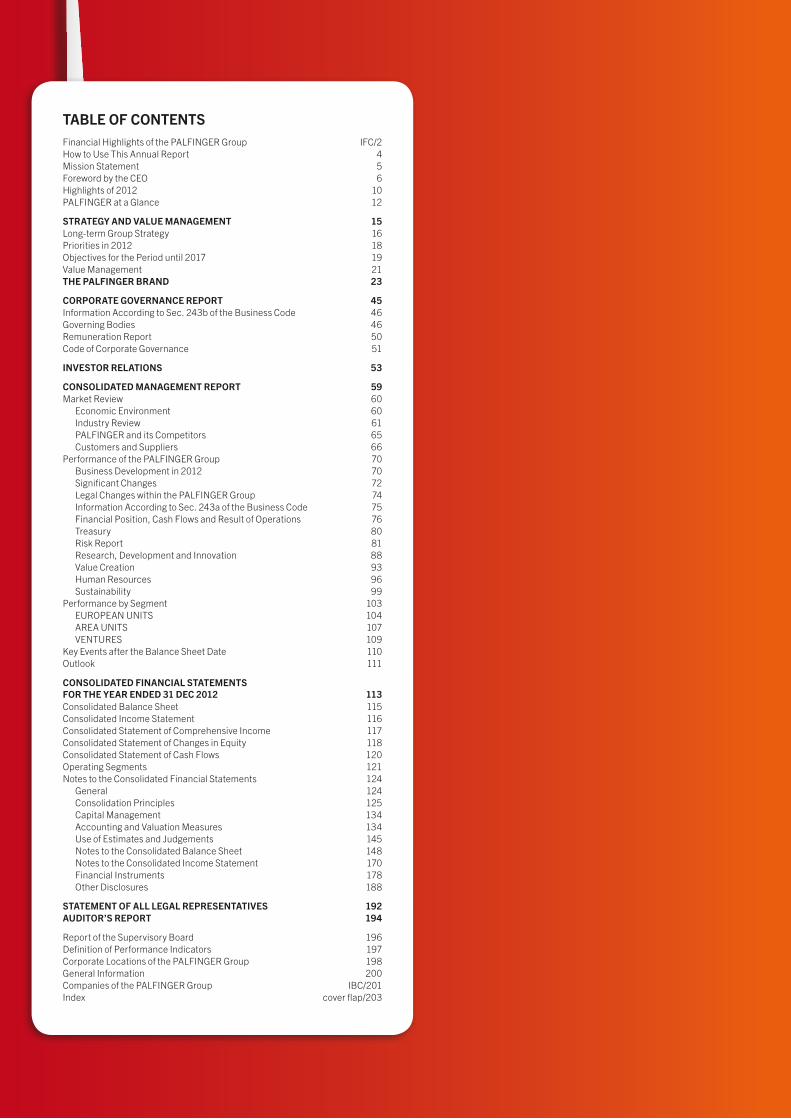
Table of ConTenTsFinancial Highlights of the PALFINGER Group IFC/2How to Use This Annual Report 4Mission Statement 5Foreword by the CEO 6Highlights of 2012 10PALFINGER at a Glance 12
sTraTegy and Value ManageMenT 15Long-term Group Strategy 16Priorities in 2012 18Objectives for the Period until 2017 19Value Management 21The PalfInger brand 23
CorPoraTe goVernanCe rePorT 45Information According to Sec. 243b of the Business Code 46Governing Bodies 46Remuneration Report 50Code of Corporate Governance 51
InVesTor relaTIons 53
ConsolIdaTed ManageMenT rePorT 59Market Review 60
Economic Environment 60Industry Review 61PALFINGER and its Competitors 65Customers and Suppliers 66
Performance of the PALFINGER Group 70Business Development in 2012 70Significant Changes 72Legal Changes within the PALFINGER Group 74Information According to Sec. 243a of the Business Code 75Financial Position, Cash Flows and Result of Operations 76Treasury 80Risk Report 81Research, Development and Innovation 88Value Creation 93Human Resources 96Sustainability 99
Performance by Segment 103EUROPEAN UNITS 104AREA UNITS 107VENTURES 109
Key Events after the Balance Sheet Date 110Outlook 111
ConsolIdaTed fInanCIal sTaTeMenTsfor The year ended 31 deC 2012 113Consolidated Balance Sheet 115Consolidated Income Statement 116Consolidated Statement of Comprehensive Income 117Consolidated Statement of Changes in Equity 118Consolidated Statement of Cash Flows 120Operating Segments 121Notes to the Consolidated Financial Statements 124
General 124Consolidation Principles 125Capital Management 134Accounting and Valuation Measures 134Use of Estimates and Judgements 145Notes to the Consolidated Balance Sheet 148Notes to the Consolidated Income Statement 170Financial Instruments 178Other Disclosures 188
sTaTeMenT of all legal rePresenTaTIVes 192audITor’s rePorT 194
Report of the Supervisory Board 196Definition of Performance Indicators 197Corporate Locations of the PALFINGER Group 198General Information 200Companies of the PALFINGER Group IBC/201Index cover flap/203
PALFINGER ANNuAL REPoRt 2012
FINANcIAL hIGhLIGhts oF thE PALFINGER GRouP
Cover: Hubert Palfinger, entrepreneur and crane pioneer
EuR thousand
Income statement 2012 2011 2010 2009 2008
Revenue 935,215 845,677 651,793 505,365 794,839
EBItDA 97,950 96,764 59,887 18,483 102,446
EBItDA margin 10.5% 11.4% 9.2% 3.7% 12.9%
EBIt 68,454 67,917 37,148 (2,983) 73,771
EBIt margin 7.3% 8.0% 5.7% (0.6%) 9.3%
Result before income tax 53,725 57,000 29,833 (11,860) 63,915
Consolidated net result for the period 40,409 41,955 24,225 (7,823) 43,907
Balance sheet
total assets 813,565 739,774 677,431 587,973 641,331
Net working capital (average) 151,291 118,774 117,740 151,587 85,214
Capital employed (average) 552,210 500,699 462,257 460,235 359,315
Equity 364,874 352,780 319,891 292,277 309,885
Equity ratio 44.8% 47.7% 47.2% 49.7% 48.3%
Net debt 217,565 166,876 160,932 151,880 166,774
Gearing 59.6% 47.3% 50.3% 52.0% 53.8%
cash flows and investments
Cash flows from operating activities 55,394 37,662 49,118 50,044 32,577
Free cash flows (3,103) 11,695 4,166 41,979 (39,537)
Net investments 40,799 23,673 18,709 15,916 47,319
Depreciation, amortization and impairment 29,496 28,847 22,739 21,466 28,675
Payroll
Annual average payroll1) 6,175 5,600 4,671 4,517 4,664
Value creation
RoCE 10.2% 11.1% 7.1% 0.0% 13.1%
RoE 12.7% 14.1% 8.9% (2.4%) 15.9%
EVA 18,958 20,475 (3,308) (31,033) 26,044
WACC 6.7% 7.0% 7.8% 7.0% 6.9%
share
Number of shares issued 35,730,000 35,730,000 35,730,000 35,730,000 35,730,000
Market capitalization 587,401 440,551 1,027,238 556,673 401,605
Price as at year end (EuR) 16.44 12.33 28.75 15.58 11.24
Earnings per share (EuR) 1.14 1.19 0.68 (0.22) 1.24
operating cash flows per share (EuR) 1.57 1.06 1.39 1.41 0.92
Dividend per share (EuR) 0.38 2) 0.38 0.22 0.00 0.39
1) Consolidated Group companies excluding equity shareholdings, as well as excluding temporary workers.2) Proposal for presentation to the Annual General Meeting.
FINANcIAL hIGhLIGhtsoF thE PALFINGER GRouP
PALFINGER ANNuAL REPoRt 2012
FINANcIAL hIGhLIGhts oF thE PALFINGER GRouP
3
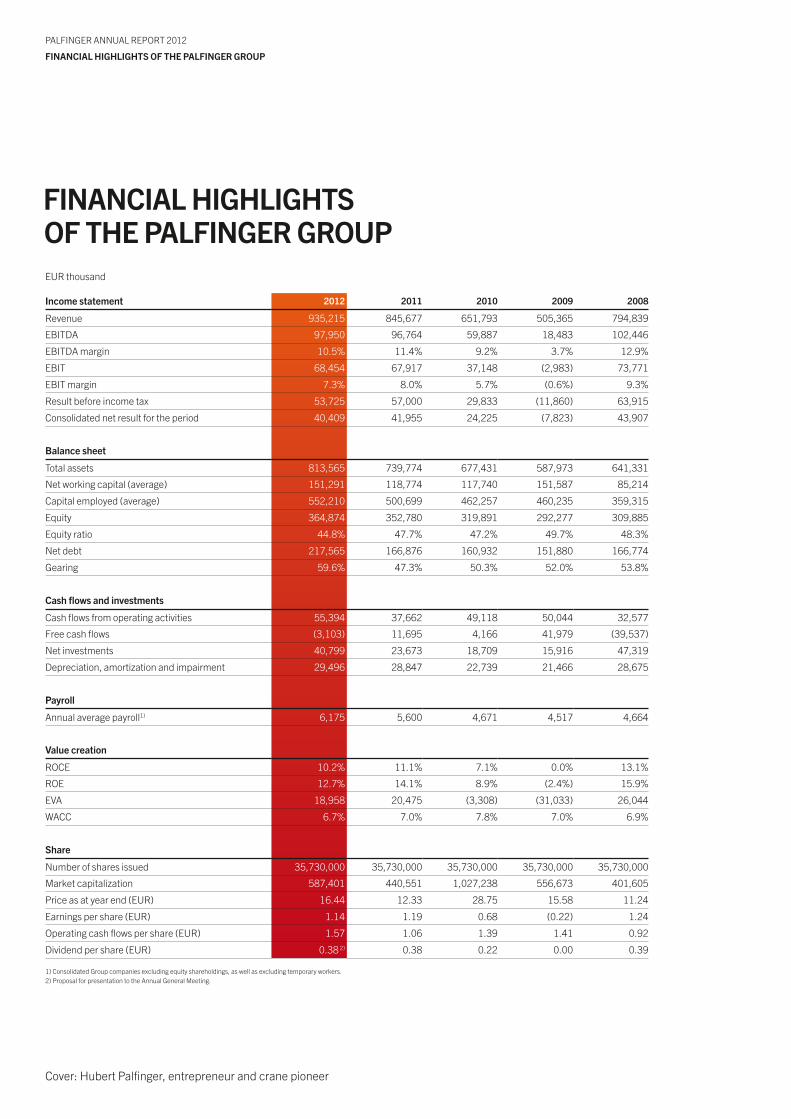
794
,839
505
,365 6
51,7
93
845
,677
935
,215
2008 2009 2010 2011 2012
REVENuE(euR thousand)
32,
577
50,
044
49,
118
37,
662
55,
394
2008 2009 2010 2011 2012
oPERAtING cAsh FLows(euR thousand)
4,6
64
4,5
17
4,6
71
5,6
00 6,1
75
2008 2009 2010 2011 2012
PAyRoLL
73,
771
37,
148
67,
917
68,
454
2008 2009 2010 2011 2012
EBIt(euR thousand)
(2,9
83)
4
PALFINGER ANNuAL REPoRt 2012
how to usE thIs ANNuAL REPoRt
how to usE thIs ANNuAL REPoRtLike magnets, powerful brands can exert a strong pull. In 2012, PALFINGER re-defined the values and the core of its brand. In the future, PALFINGER’s umbrella brand strategy will also increase the power of the PALFINGER brand.
the attraction explained – an overviewA summary of what constitutes the great attraction of PALFINGER is found on pages 2 to 13, which contain the key financial figures, the highlights of the 2012 financial year and a brief description of the PALFINGER Group.
Starting from page 197, you will find an outline of the most relevant background information: a definition of performance indicators, a list of all corporate locations and an overview of the corporate structure of the PALFINGER Group, as well as an index that facilitates a quick search of this Report.
Magnetic attraction – an introductionon page 6, Herbert ortner, CEo of PALFINGER AG, has summarized his personal view of the recent and expected future developments of the PALFINGER Group in a foreword addressed to the shareholders.
how the magnetic field worksthe long-term Group strategy, including the defined objectives, ensures that the further development of the PALFINGER Group will be consistently pursued. How the strategy works in detail is described from page 15 onwards. It is followed by background information on the new PALFINGER umbrella brand strategy and its practical relevance, starting from page 23.
Rules for the direction of the magnetic fieldStarting from page 45, the corporate governance report describes the Management Board and Super-visory Board, their cooperation and their remuneration. the report, setting forth PALFINGER’s commit-ment to observing the Austrian Code of Corporate Governance, was audited by the auditor.
Magnetism as a cooperative phenomenontransparent information is the basis of PALFINGER’s communications with its stakeholders and theirinterest in the Group. the chapter “Investor Relations”, starting on page 53, contains all information of specific relevance to existing and potential shareholders.
the magnetic flux in 2012Starting on page 59, the consolidated management report begins with a market review describing the current framework: economic development, industries, competition, customers and suppliers. the section on the business development of the PALFINGER Group describes the Group’s performance, the changes that have been made, the risks and the development of success factors such as research and development, human resources and sustainability.
the field lines in detailthe consolidated financial statements provide a detailed explanation of the business performance of PALFINGER in the 2012 financial year. Starting on page 113, all the facts and figures are provided.
If you still have any questions after reading the complete Annual Report 2012 of the PALFINGER Group, please do not hesitate to get in touch with your contact partner as specified on page 200.
PALFINGER ANNuAL REPoRt 2012
MIssIoN stAtEMENt
5
MIssIoN stAtEMENtworldwide, PALFINGER stands for the most innovative, reliable and cost-effective lifting solutionsfor use on commercial vehicles and in the maritime field. with our technological expertise and ex-perienced staff, we set quality benchmarks in the industries in which we operate. sustainability and the responsible use of resources are at the core of all our actions. high flexibility and competence in production and a global sales and services network give us a crucial competitive edge and ensure our customers LIFEtIME EXcELLENcE.
Innovation is the result of our passion for the permanent enhancement of our products, processes and organization. Innovations ensure PALFINGER’s market leadership and open up new fields of application that broaden the base of the business.
Internationalization ensures that our customers on all continents receive products that conform tomarket standards and provides our Company with maximum independence from regional economicfluctuations while simultaneously opening up new areas of potential growth.
Flexibility allows us to meet all market developments by quickly adjusting our resources and capacities, thus also safeguarding the success of our business in times of high volatility.

FoREwoRd By thE cEo
PALFINGER ANNuAL REPoRt 2012
FoREwoRd By thE cEo
6
7
PALFINGER ANNuAL REPoRt 2012
FoREwoRd By thE cEo
dEAR shAREhoLdERs,
80 years of successful business operations: the anniversary year 2012 was a significant year forPALFINGER in many respects. After the upswing experienced over the two previous years, it became clear that the economic crisis was still far from over, especially in Europe. the persisting sovereign debt prob-lems and the ensuing uncertainty in the euro area also impacted our markets and hence the performance of PALFINGER. At the same time, however, we achieved enormous milestones, thereby securing addition-al growth and consequently, we are convinced, the worldwide leading position of our Group in the future.
In 2012, the economic environment proved to be increasingly difficult, especially in Europe. the fact that the PALFINGER Group was still able to record growth and post another record year is owing to our long-standing internationalization strategy. In Europe, thanks to the marine business, we managed to maintain the same revenue as in 2011; in the areas outside Europe, revenue soared by 42.1 per cent. the AREA uNItS segment thus already generates one third of the Group’s revenue. Despite the start-up costs incurred in the regions that are still young for PALFINGER, we managed for the first time to record positive earnings in this segment in 2012, which confirms that we have been on the right track with our strategy.
In the year under review, we also wrote a significant chapter in the history of PALFINGER: By entering into a partnership with the Chinese Sany Group, we managed to secure our market entry into China –a country that has rapidly been gaining ever more importance on the international stage. With our joint venture, we have established an excellent basis upon which to profit from such growth. to highlight the scale of that market: the planned production plant will have production capacities for 10,000 cranes a year. therefore, we presume that China will become a second domestic market in the medium term.
We also took a great step forward in our globally operating Marine business area, which has proved a profitable growth segment from the onset. the acquisition of Dreggen, a well-renowned manufacturer of marine and offshore cranes, has generated a tremendous boost, which is going to open up new opportu-nities and markets for us.
Hand in hand with the substantial expansion of the Group, we have always taken care to reinforce our existing strengths: the sustainability of our actions is the core of our long-term success. Innovations will continue to secure our technological edge. the further increase of flexibility at all levels of value creation will help to cushion volatility in demand and low visibility.
In order to better pool our strengths, we have also refined our market presence. the various different product brands that have reflected our growth over the past few years will in future, for the most part, be comprised under the PALFINGER umbrella brand, thus enhancing the attraction of our brand. With the magnet attached to the cover of this Report, you may experience what we mean for yourself.
the changes taking place in the markets, in the economic environment and in the PALFINGER Grouprequire immutable willingness to change and to further improve on the part of our employees. on behalf of the entire Management Board, the Palfinger family and all our shareholders, I would like to take thisopportunity to express our deep gratitude and sincere thanks to our committed and flexible staff.
herbert ortner

Christoph Kaml, Martin Zehnder, Herbert ortner and Wolfgang Pilzthe Management Board of PALFINGER
10
PALFINGER ANNuAL REPoRt 2012
hIGhLIGhts oF 2012
hIGhLIGhts oF 2012PALFINGER: 80 yEARs oF succEssFuL GRowthIt was 80 years ago, in 1932, that PALFINGER was established as a small workshop in upper Austria. Since then, PALFINGER has grown into a multinational group of enterprises with a global sales and services network. the anniversary was celebrated at an international dealer conference in Salzburg, with the Palfinger family and many partners and guests from more than 80 countries in attendance. the developments throughout 2012 have contributed greatly to sustainably consolidating PALFINGER’s global leading position. PALFINGER looks forward to continued success in the future.
3 FEBRuARy 2012Publication of the 2011 resultsIn 2011, PALFINGER continued the upward trend of the previous year. For the second time in a row, the Group achieved a 30 per cent rise in revenue, and EBIt rose by a remarkable 83 per cent. PALFINGER thus clearly outperformed its peer group, recording a historic record revenue of EuR 845.7 million. this growth was facilitated, on the one hand, by the internal measures taken to invigorate the weaker business units and areas and, on the other hand, by the consistent internationalization that was continued in 2011 with major acquisitions carried out in Russia.
28 FEBRuARy 2012Milestone with china strategythe largest project since the Company’s IPo began to take shape: PALFINGER and the Sany Group, one of the largest Chinese enterprises, agreed on the establishment of two joint venture companies. Sany Palfinger would produce and sell PALFINGER products in China, and Palfinger Sany would distribute Sany’s mobile cranes in Europe and CIS. PALFINGER is convinced that in Sany it has found the ideal part-ner for its market entry in China and for consolidating its global leading position.
8 MARch 2012Annual General Meetingthe Annual General Meeting of PALFINGER AG resolved to distribute a dividend of EuR 0.38 per share for the 2011 financial year.
12 MARch 2012Location for new headquartersPALFINGER decided on a location for new headquarters, as the dimensions of the Company’s present headquarters had become far too small as a consequence of the growth achieved in recent years. Plans were set for the new Group headquarters to be built not far from the present location in Bergheim, Salzburg, and for employees to be able to move into the new building at the end of 2014.
10 MAy 2012Publication of results for the first quarter of 2012Despite the difficult economic environment, PALFINGER recorded two-digit growth rates in the first quarter. Due to the acquisitions carried out, the area CIS established itself as the region with the highest growth rates within the PALFINGER Group.
11
PALFINGER ANNuAL REPoRt 2012
hIGhLIGhts oF 2012
12 JuNE 2012sustainability Report 2010/2011PALFINGER published its latest sustainability report, describing the initiatives taken and progress achieved over the previous two years and setting out PALFINGER’s future programme. A few monthslater, the Company received the ÖKoVISIoN Sustainability Leadership Award for its commitment to sustain-ability and the “best sustainability report” as well as the Austrian Sustainability Reporting Award (ASRA).
9 AuGust 2012Publication of results for the first half of 2012the economic situation in Europe became more challenging in the second quarter. In this situation, PALFINGER benefited in particular from its long-standing strategy of internationalization, also in the BRIC countries, and continued to record a two-digit growth rate in revenue.
3 sEPtEMBER 2012Approval and start of the joint venture in chinaAfter only six months, the competent authorities gave their approval to the Group’s joint venture with Sany. Preparations had already been made and the China activities were ready to be launched. the sale of the first two crane models started immediately afterwards.
20 sEPtEMBER 2012Acquisition of Brazilian company tercekPALFINGER strengthened its market presence in South America by reaching an agreement on the takeover of tercek, a company developing electric-powered bus lifts – a growth segment in this promising market – under the brand name Líbero. the acquisition was closed at the end of october.
18 octoBER 2012Promissory note loan issuedPALFINGER successfully completed its new issue of promissory notes in the total amount of EuR 77.5 million, thus optimizing its financing structure and diversifying its financing partners.
30 octoBER 2012Expansion of marine business through the acquisition of dreggenWith the acquisition of the Norwegian Bergen Group Dreggen AS, PALFINGER took a major step forward in the growth of its marine business. the Dreggen cranes added tailor-made crane solutions for the ship-building, oil and gas industries to PALFINGER’s product portfolio, thus opening up new opportunities and markets. the acquisition was closed at the end of November.
9 NoVEMBER 2012Publication of results for the first three quarters of 2012In Europe, demand had been declining continuously, but the positive development in North and South America as well as in Russia made it possible for the PALFINGER Group to continue to step up its revenue. the contribution to earnings made by the business areas outside Europe was increasing continuously.
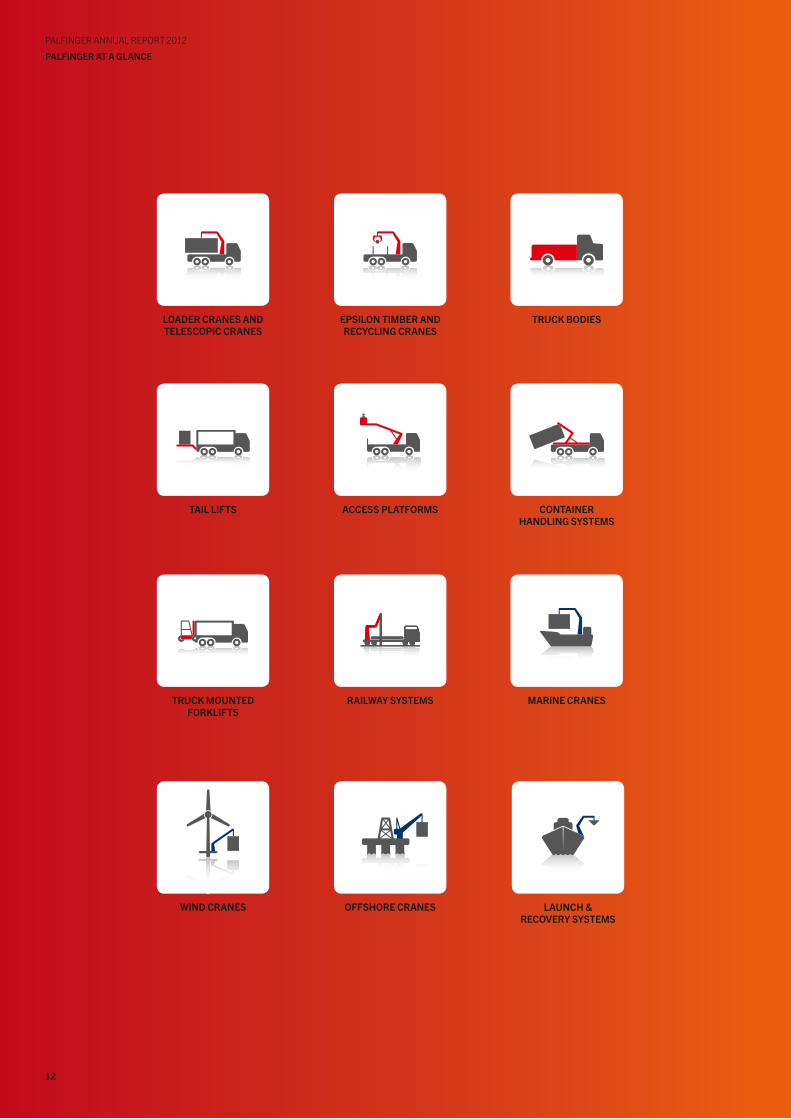
LoAdER cRANEs ANd tELEscoPIc cRANEs
EPsILoN tIMBER ANd REcycLING cRANEs
AccEss PLAtFoRMstAIL LIFts
tRuck BodIEs
LAuNch & REcoVERy systEMs
coNtAINER hANdLING systEMs
tRuck MouNtEd FoRkLIFts
RAILwAy systEMs
oFFshoRE cRANEswINd cRANEs
MARINE cRANEs
PALFINGER ANNuAL REPoRt 2012
PALFINGER At A GLANcE
12
13
PALFINGER ANNuAL REPoRt 2012
PALFINGER At A GLANcE
PALFINGER At A GLANcEAs at 31 December 2012, the PALFINGER Group, headquartered in Salzburg, Austria, comprised 50 companies in 22 countries and had a workforce of 6,175. Its 30 manufacturing and assembly sitesas well as the global sales and services network with more than 200 independent general importers andapprox. 4,500 outlets in more than 130 countries on all continents guarantee perfect proximity to cus-tomers in all product groups.
PALFINGER is regarded as the leader in technology and innovation in its sector. PALFINGER is number one worldwide for loader cranes, marine cranes, wind cranes and container handling systems. Moreover, the Company is a leading specialist in timber and recycling cranes, tail lifts, truck mounted forklifts and high-tech railway systems.
In 2012, the PALFINGER Group recorded record revenue of EuR 935.2 million. this 10.6 per cent in-crease over the previous year was facilitated by PALFINGER’s intensified market cultivation and the further growth of the Group primarily outside Europe. Due to the investments made and the changed market environment, EBIt did not rise to the same extent, but did climb to EuR 68.5 million.
With an equity ratio of 44.8 per cent and a gearing ratio of 59.6 per cent, PALFINGER has a sound capital structure. In 2012, cash flows from operating activities amounted to EuR 55.4 million, significantly above the previous year’s level; the return on capital employed (RoCE) was 10.2 per cent.

1514
PALFINGER ANNuAL REPoRt 2012
StrategY and Value ManageMent
PALFINGER ANNuAL REPoRt 2012
StrategY and Value ManageMent
stRAtEGy ANdvALuE MANAGEMENt
Siegfried HöbertPALFINGER International Sales, Loader Cranes
•Long-termGroupstrategyconsistentlypursued
•Successfuladaptationtochangedframeworkconditions
•Continualinnovation,internationalizationandflexibilityprovetheir worth especially in difficult environment
•Majormilestonesforthefuturereachedin2012
•Nextstepsdefinedtoachieveobjectivesfor2017
16
PALFINGER ANNuAL REPoRt 2012
StrategY and Value ManageMent
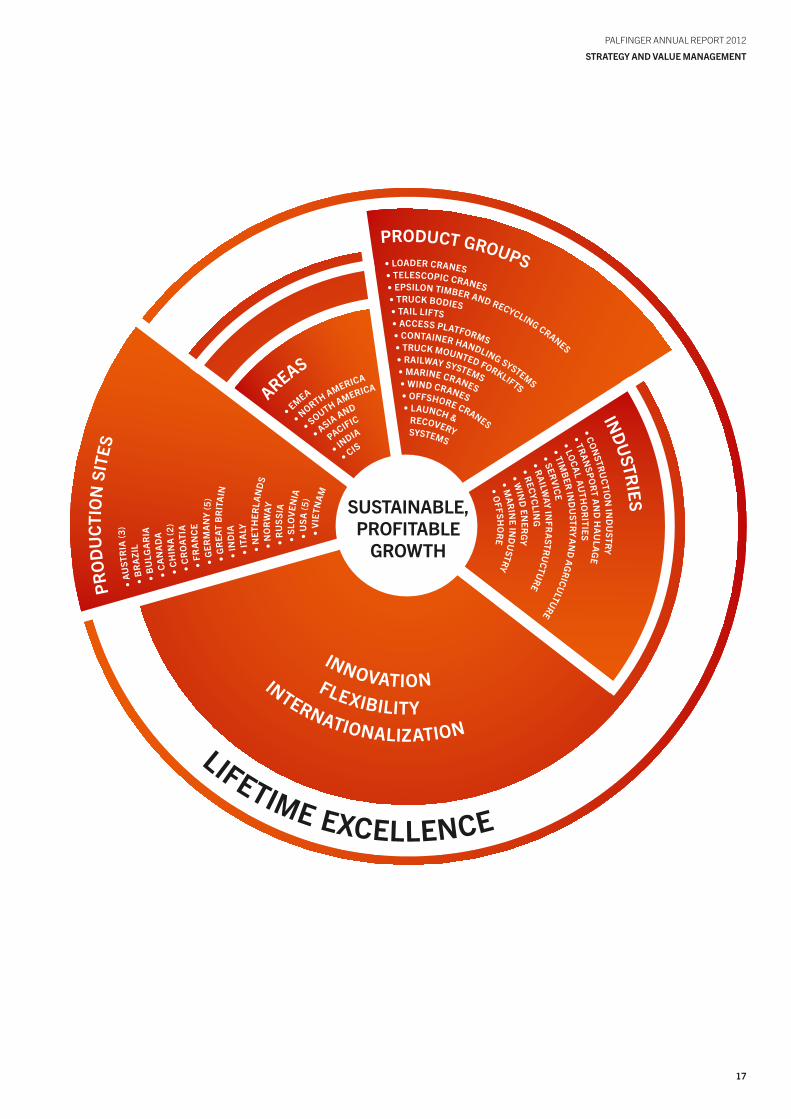
stRAtEGy ANd VALuE MANAGEMENt the PALFINGER Group has been pursuing a long-term growth strategy that is being consistently imple-mented. under this strategy, short to medium term goals and measures are adapted to changing frame-work conditions so as to ensure that they are implemented in a targeted manner. Within the scope of corporate strategic planning, objectives and specific measures were defined for the period until 2017.
LoNG-tERM GRouP stRAtEGy
PALFINGER strives to achieve sustainable, profitable growth and the best shareholder value possible. Sustainability is reflected in all aspects of the PALFINGER Group. taking economic, ecological and social aspects into account is viewed as a basic requirement for corporate success.
Well-trained and highly motivated employees are the core success factor of the Group, which is why they are at the centre of all considerations. In the PALFINGER plants, the customary regional standards regarding the environment and safety are exceeded. With its products, PALFINGER offers users higher safety and supports them in their efforts to save resources and lower their Co2 emissions.
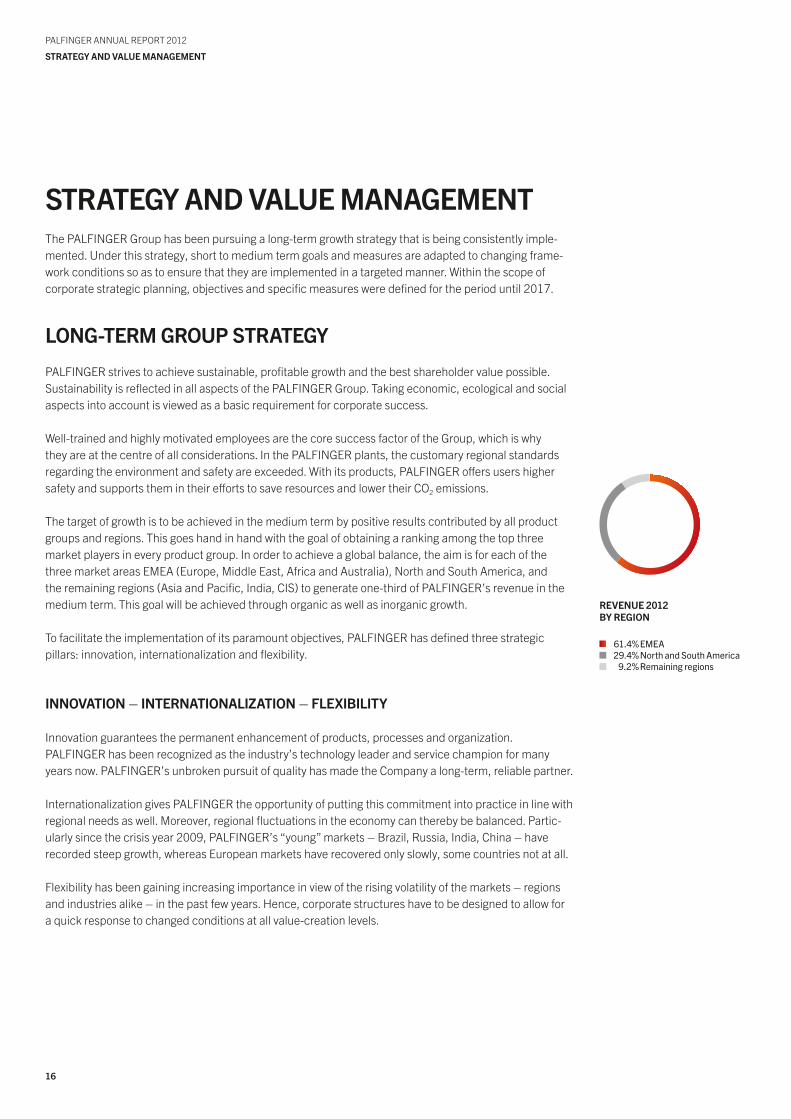
the target of growth is to be achieved in the medium term by positive results contributed by all product groups and regions. this goes hand in hand with the goal of obtaining a ranking among the top three market players in every product group. In order to achieve a global balance, the aim is for each of the three market areas EMEA (Europe, Middle East, Africa and Australia), North and South America, and the remaining regions (Asia and Pacific, India, CIS) to generate one-third of PALFINGER’s revenue in the medium term. this goal will be achieved through organic as well as inorganic growth.
to facilitate the implementation of its paramount objectives, PALFINGER has defined three strategic pillars: innovation, internationalization and flexibility.
INNoVAtIoN – INtERNAtIoNALIzAtIoN – FLEXIBILIty
Innovation guarantees the permanent enhancement of products, processes and organization. PALFINGER has been recognized as the industry’s technology leader and service champion for many years now. PALFINGER’s unbroken pursuit of quality has made the Company a long-term, reliable partner.
Internationalization gives PALFINGER the opportunity of putting this commitment into practice in line withregional needs as well. Moreover, regional fluctuations in the economy can thereby be balanced. Partic-ularly since the crisis year 2009, PALFINGER’s “young” markets – Brazil, Russia, India, China – have recorded steep growth, whereas European markets have recovered only slowly, some countries not at all.
Flexibility has been gaining increasing importance in view of the rising volatility of the markets – regions and industries alike – in the past few years. Hence, corporate structures have to be designed to allow for a quick response to changed conditions at all value-creation levels.
REVENuE 2012By REGIoN
61.4%eMeA29.4%north and South America09.2%Remaining regions
17
PALFINGER ANNuAL REPoRt 2012
Strategy and Value ManageMent
LIFETIME EXCELLENCE
INNOVATIONFLEXIBILITY INTERNATIONALIZATION
AREAS
• EMEA
• NORTH AMERICA
• SOUTH AMERICA
• ASIA AND
PACIFIC
• INDIA
• CIS
PRO
DU
CTI
ON
SIT
ES•
AU
STR
IA (3
)
• B
RA
ZIL
• B
ULG
AR
IA
• C
AN
AD
A
• C
HIN
A (2
)
• C
RO
ATIA
• FR
AN
CE
• G
ERM
AN
Y (5
)•
GR
EAT
BR
ITA
IN•
IND
IA
• IT
ALY
• N
ETH
ERLA
ND
S•
NO
RW
AY•
RU
SSI
A•
SLO
VEN
IA•
USA
(5)
• V
IETN
AM
IND
USTR
IES
• CON
STRU
CTIO
N IN
DU
STRY
• TRAN
SPOR
T AN
D H
AU
LAG
E
• LOC
AL A
UTH
OR
ITIES
• SERV
ICE
• RA
ILWAY IN
FRA
STRU
CTURE
• RECYC
LING
• WIN
D EN
ERG
Y
• MA
RIN
E IND
USTRY
• OFFSH
OR
E
• TIMB
ER IN
DU
STRY A
ND
AG
RICU
LTURE
PRODUCT GROUPS• LOADER CRANES • TELESCOPIC CRANES• EPSILON TIMBER AND RECYCLING CRANES
• TRUCK BODIES • TAIL LIFTS• ACCESS PLATFORMS• CONTAINER HANDLING SYSTEMS
• TRUCK MOUNTED FORKLIFTS
• RAILWAY SYSTEMS• MARINE CRANES• WIND CRANES• OFFSHORE CRANES
• LAUNCH & RECOVERYSYSTEMS
SUSTAINABLE, PROFITABLE
GROWTH
18
PALFINGER ANNuAL REPoRt 2012
StrategY and Value ManageMent
Research,developmentand innovationpage 88
PRIoRItIEs IN 2012
INtERNAtIoNALIzAtIoN
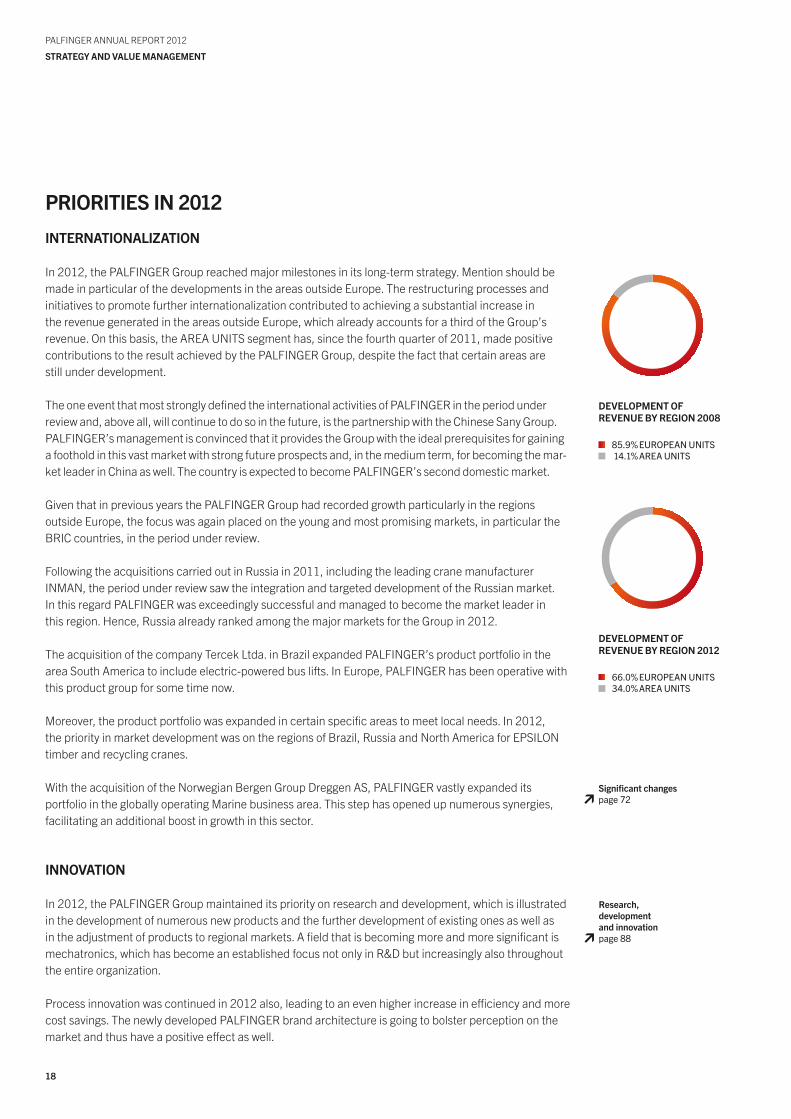
In 2012, the PALFINGER Group reached major milestones in its long-term strategy. Mention should be made in particular of the developments in the areas outside Europe. the restructuring processes and initiatives to promote further internationalization contributed to achieving a substantial increase in the revenue generated in the areas outside Europe, which already accounts for a third of the Group’s revenue. on this basis, the AREA uNItS segment has, since the fourth quarter of 2011, made positive contributions to the result achieved by the PALFINGER Group, despite the fact that certain areas are still under development.
the one event that most strongly defined the international activities of PALFINGER in the period under review and, above all, will continue to do so in the future, is the partnership with the Chinese Sany Group. PALFINGER’s management is convinced that it provides the Group with the ideal prerequisites for gaining a foothold in this vast market with strong future prospects and, in the medium term, for becoming the mar-ket leader in China as well. the country is expected to become PALFINGER’s second domestic market.
Given that in previous years the PALFINGER Group had recorded growth particularly in the regions outside Europe, the focus was again placed on the young and most promising markets, in particular the BRIC countries, in the period under review.
Following the acquisitions carried out in Russia in 2011, including the leading crane manufacturer INMAN, the period under review saw the integration and targeted development of the Russian market. In this regard PALFINGER was exceedingly successful and managed to become the market leader in this region. Hence, Russia already ranked among the major markets for the Group in 2012.
the acquisition of the company tercek Ltda. in Brazil expanded PALFINGER’s product portfolio in the area South America to include electric-powered bus lifts. In Europe, PALFINGER has been operative with this product group for some time now.
Moreover, the product portfolio was expanded in certain specific areas to meet local needs. In 2012, the priority in market development was on the regions of Brazil, Russia and North America for EPSILoN timber and recycling cranes.
With the acquisition of the Norwegian Bergen Group Dreggen AS, PALFINGER vastly expanded its portfolio in the globally operating Marine business area. this step has opened up numerous synergies, facilitating an additional boost in growth in this sector.
INNoVAtIoN
In 2012, the PALFINGER Group maintained its priority on research and development, which is illustrated in the development of numerous new products and the further development of existing ones as well as in the adjustment of products to regional markets. A field that is becoming more and more significant is mechatronics, which has become an established focus not only in R&D but increasingly also throughout the entire organization.
Process innovation was continued in 2012 also, leading to an even higher increase in efficiency and more cost savings. the newly developed PALFINGER brand architecture is going to bolster perception on the market and thus have a positive effect as well.
dEVELoPMENt oF REVENuE By REGIoN 2008
85.9%euRopeAn unItS14.1%AReA unItS
dEVELoPMENt oF REVENuE By REGIoN 2012
66.0%euRopeAn unItS34.0%AReA unItS
significant changespage 72
19
PALFINGER ANNuAL REPoRt 2012
Strategy and Value ManageMent
FLEXIBILIty
Increasing flexibility is a process that was continued in the period under review. the largest contributors in this respect were the expansion of contract manufacturing, the continuation of the structural and cost-related measures and the increase of financial flexibility. the issue of a promissory note loan supported the diversification of financing partners as well.
In Europe, the systematic implementation of market-related, in particular internal, measures made it pos-sible, for the first time, for all European business units to make a positive contribution to earnings in 2012. this is especially gratifying in the light of the harsh economic climate in Europe.
sustAINABILIty
Sustainability is an issue that, in all its aspects, is embedded in PALFINGER’s strategy. this is also illus-trated by the fact that economic, ecological and social developments and changes are always considered and pursued from a long-term perspective. Every two years, PALFINGER publishes a sustainability report, most recently in 2012. the report gives an overview of sustainability management, the specific develop-ments over the previous few years and the priorities placed by the Group for the years to come.
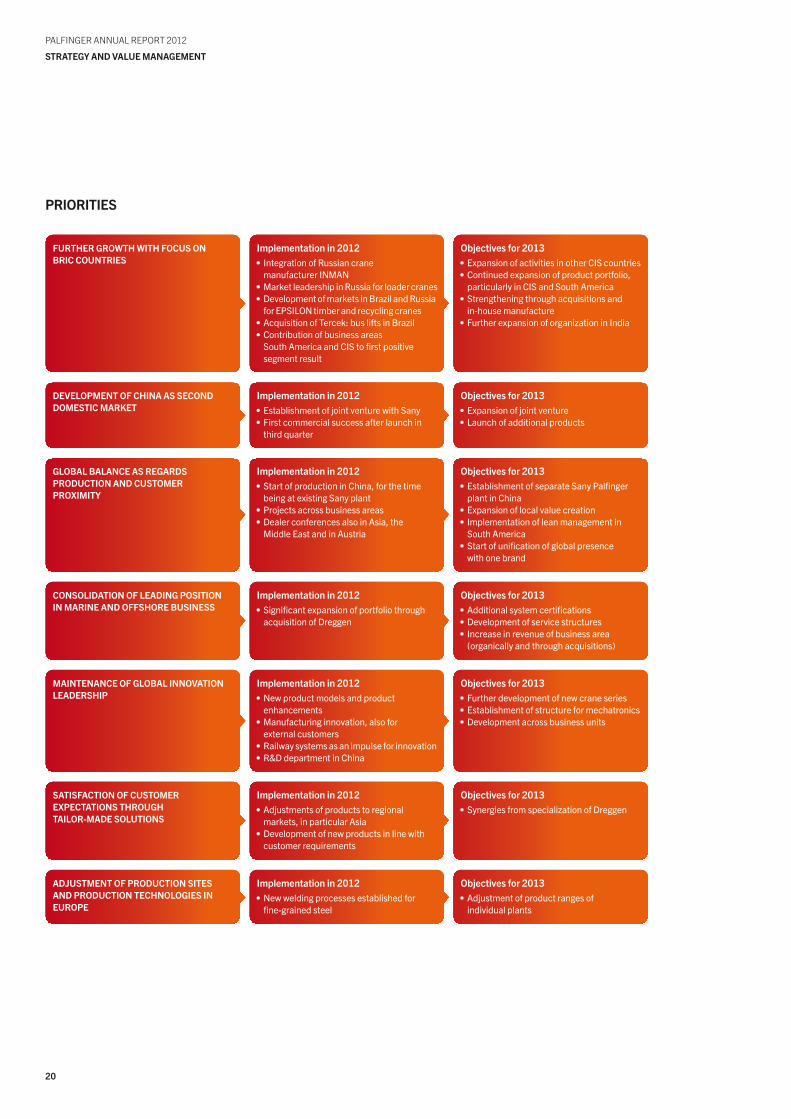
oBJEctIVEs FoR thE PERIod uNtIL 2017
In the autumn of 2012, on the basis of the changes made and the milestones reached by the PALFINGER Group, the management defined its objectives for the next five years, i.e. until 2017. For priority issues, the management elaborated the measures and fundamental strategies to be gradually implemented in order to ensure the sustainable, profitable growth of the PALFINGER Group.
the following table presents an overview of the major issues, the progress achieved in 2012 and thenext goals.
sustainabilitypage 99
20
PALFINGER ANNuAL REPoRt 2012
StrategY and Value ManageMent
Implementation in 2012•IntegrationofRussiancrane manufacturerINMAN
•MarketleadershipinRussiaforloadercranes•DevelopmentofmarketsinBrazilandRussiaforEPSILONtimberandrecyclingcranes
•AcquisitionofTercek:busliftsinBrazil•Contributionofbusinessareas SouthAmericaandCIStofirstpositive segmentresult
Implementation in 2012•StartofproductioninChina,forthetime beingatexistingSanyplant
•Projectsacrossbusinessareas•DealerconferencesalsoinAsia,the MiddleEastandinAustria
Implementation in 2012•SignificantexpansionofportfoliothroughacquisitionofDreggen
Implementation in 2012•Newproductmodelsandproduct
enhancements•Manufacturinginnovation,alsofor externalcustomers
•Railwaysystemsasanimpulseforinnovation•R&DdepartmentinChina
Implementation in 2012•Adjustmentsofproductstoregional markets,inparticularAsia
•Developmentofnewproductsinlinewithcustomerrequirements
Implementation in 2012•Newweldingprocessesestablishedfor fine-grainedsteel
Implementation in 2012•EstablishmentofjointventurewithSany•Firstcommercialsuccessafterlaunchin thirdquarter
FuRthER GRowth wIth Focus oNBRIc couNtRIEs
GLoBAL BALANcE As REGARdsPRoductIoN ANd custoMERPRoXIMIty
coNsoLIdAtIoN oF LEAdING PosItIoNIN MARINE ANd oFFshoRE BusINEss
MAINtENANcE oF GLoBAL INNoVAtIoN LEAdERshIP
sAtIsFActIoN oF custoMEREXPEctAtIoNs thRouGhtAILoR-MAdE soLutIoNs
AdJustMENt oF PRoductIoN sItEsANd PRoductIoN tEchNoLoGIEs IN EuRoPE
dEVELoPMENt oF chINA As sEcoNd doMEstIc MARkEt
objectives for 2013•ExpansionofactivitiesinotherCIScountries•Continuedexpansionofproductportfolio,particularlyinCISandSouthAmerica
•Strengtheningthroughacquisitionsand in-housemanufacture
•FurtherexpansionoforganizationinIndia
objectives for 2013•EstablishmentofseparateSanyPalfingerplantinChina
•Expansionoflocalvaluecreation•Implementationofleanmanagementin
South America•Startofunificationofglobalpresence withonebrand
objectives for 2013•Additionalsystemcertifications•Developmentofservicestructures•Increaseinrevenueofbusinessarea (organicallyandthroughacquisitions)
objectives for 2013•Furtherdevelopmentofnewcraneseries•Establishmentofstructureformechatronics•Developmentacrossbusinessunits
objectives for 2013•SynergiesfromspecializationofDreggen
objectives for 2013•Adjustmentofproductrangesof individualplants
objectives for 2013•Expansionofjointventure•Launchofadditionalproducts
PRIoRItIEs
21
PALFINGER ANNuAL REPoRt 2012
Strategy and Value ManageMent
VALuE MANAGEMENt
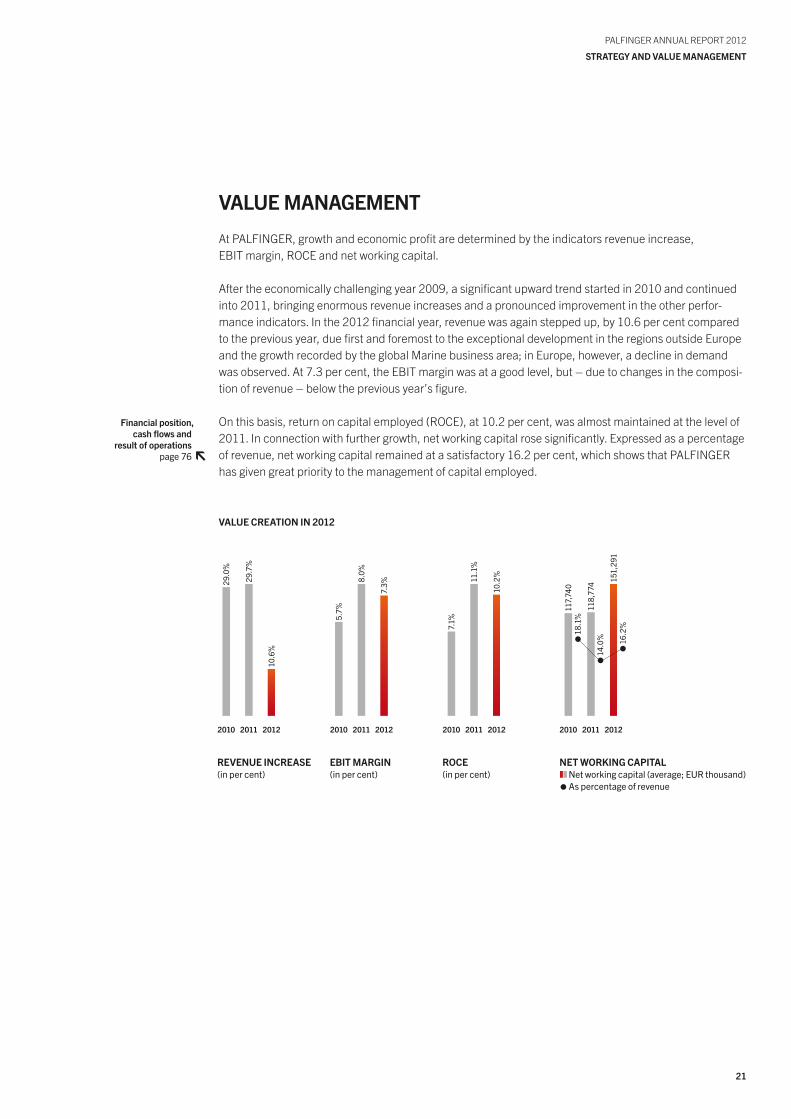
At PALFINGER, growth and economic profit are determined by the indicators revenue increase, EBIt margin, RoCE and net working capital.
After the economically challenging year 2009, a significant upward trend started in 2010 and continued into 2011, bringing enormous revenue increases and a pronounced improvement in the other perfor-mance indicators. In the 2012 financial year, revenue was again stepped up, by 10.6 per cent compared to the previous year, due first and foremost to the exceptional development in the regions outside Europe and the growth recorded by the global Marine business area; in Europe, however, a decline in demand was observed. At 7.3 per cent, the EBIt margin was at a good level, but – due to changes in the composi-tion of revenue – below the previous year’s figure.
on this basis, return on capital employed (RoCE), at 10.2 per cent, was almost maintained at the level of 2011. In connection with further growth, net working capital rose significantly. Expressed as a percentage of revenue, net working capital remained at a satisfactory 16.2 per cent, which shows that PALFINGER has given great priority to the management of capital employed.
29.
0%
29.
7%
10.
6%
2010 2011 2012
REVENuE INcREAsE(in per cent)
7.1
%
11.
1%
10.
2%
2010 2011 2012
RocE(in per cent)
5.7
%
8.0
%
7.3
%
2010 2011 2012
EBIt MARGIN(in per cent)
VALuE cREAtIoN IN 2012
117
,740
118
,774
151
,291
2010 2011 2012
NEt woRkING cAPItAL Networkingcapital(average;EURthousand) Aspercentageofrevenue
16.
2%
14.
0%
18.
1%
Financial position,cash flows and
result of operationspage 76

2322
PALFINGER ANNuAL REPoRt 2012
The PALFINGeR BRANd
PALFINGER ANNuAL REPoRt 2012
The PALFINGeR BRANd
thE PALFINGER BRANd
Daniel BannPALFINGER Large Crane Assembly, Köstendorf, Austria
24
PALFINGER ANNuAL REPoRt 2012
The PALFINGeR BRANd
thE PALFINGER BRANdthe growth of the PALFINGER Group – the positive consequence of its own initiatives as well as the acquisitions of previous years – resulted in the fact that by the beginning of 2011, the number of brands belonging to PALFINGER had reached a formidable 25. the Group remains dedicated to the goal of continuing its global growth with innovative products.
In this regard, a uniform external presence enhances brand awareness and, despite the Company’s diversification, builds high brand recognition across countries and industries, making it easier to enter new markets and countries and hence to further expand business. this is why, approximately a year ago, PALFINGER began the largest brand re-launch in its history and in 2012 took certain crucial decisions for the future.
coRE BRANd IdENtIty ANd BRANd VALuEs oF PALFINGER
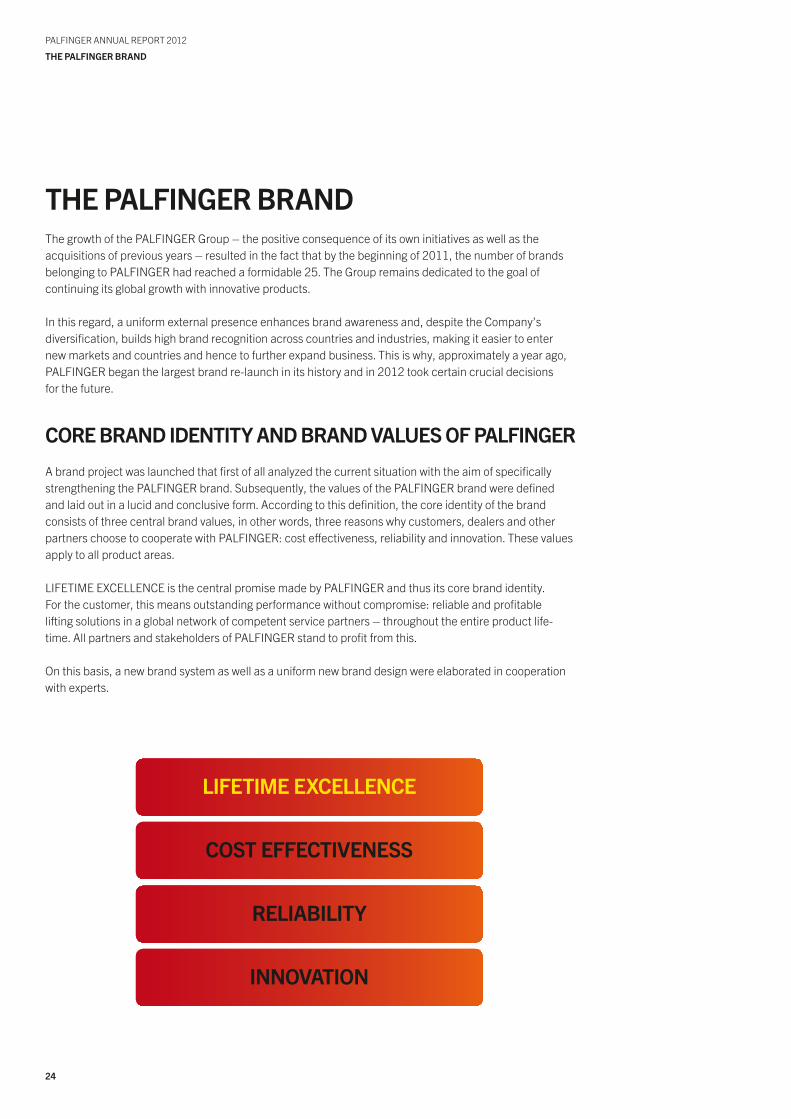
A brand project was launched that first of all analyzed the current situation with the aim of specifically strengthening the PALFINGER brand. Subsequently, the values of the PALFINGER brand were defined and laid out in a lucid and conclusive form. According to this definition, the core identity of the brand consists of three central brand values, in other words, three reasons why customers, dealers and other partners choose to cooperate with PALFINGER: cost effectiveness, reliability and innovation. these values apply to all product areas.
LIFEtIME EXCELLENCE is the central promise made by PALFINGER and thus its core brand identity. For the customer, this means outstanding performance without compromise: reliable and profitable lifting solutions in a global network of competent service partners – throughout the entire product life- time. All partners and stakeholders of PALFINGER stand to profit from this.
on this basis, a new brand system as well as a uniform new brand design were elaborated in cooperation with experts.
LIFEtIME EXcELLENcE
cost EFFEctIVENEss
RELIABILIty
INNoVAtIoN
25
PALFINGER ANNuAL REPoRt 2012
thE PALFINGER BRANd
PALFINGER uMBRELLA BRANd
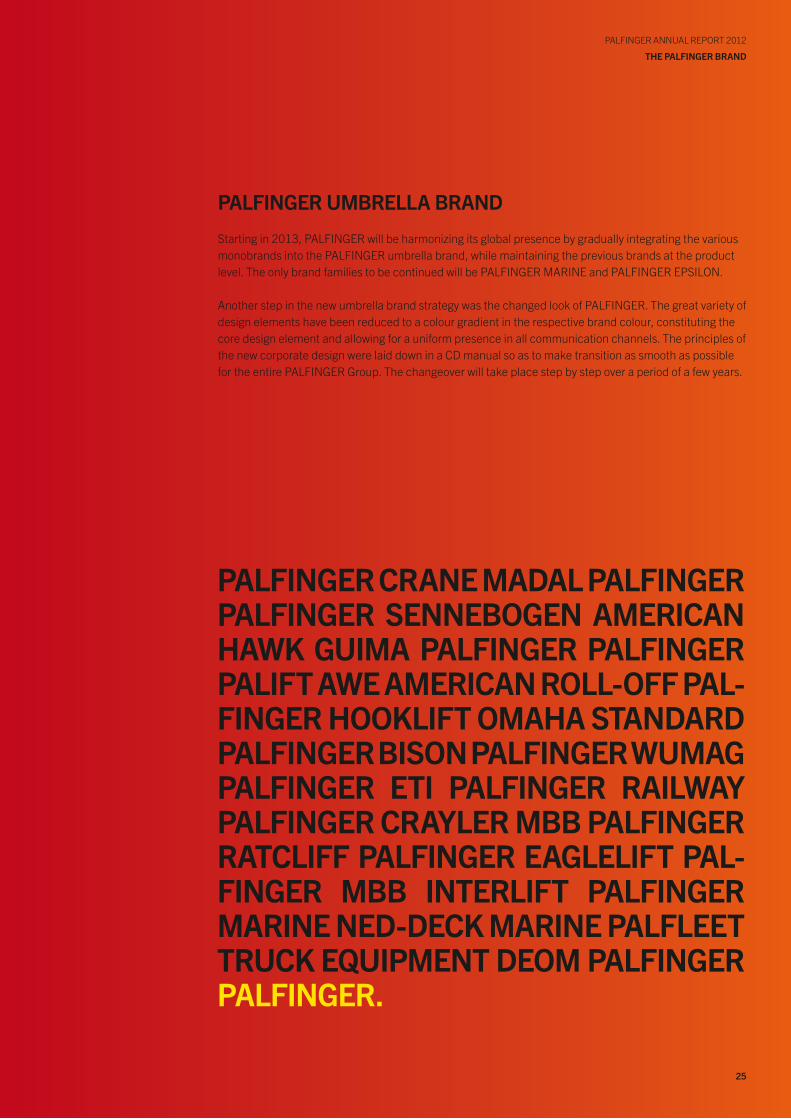
Starting in 2013, PALFINGER will be harmonizing its global presence by gradually integrating the various monobrands into the PALFINGER umbrella brand, while maintaining the previous brands at the product level. the only brand families to be continued will be PALFINGER MARINE and PALFINGER EPSILoN.
Another step in the new umbrella brand strategy was the changed look of PALFINGER. the great variety of design elements have been reduced to a colour gradient in the respective brand colour, constituting the core design element and allowing for a uniform presence in all communication channels. the principles of the new corporate design were laid down in a CD manual so as to make transition as smooth as possible for the entire PALFINGER Group. the changeover will take place step by step over a period of a few years.
2726
PALFINGER ANNuAL REPoRt 2012
The PALFINGeR BRANd
PALFINGER ANNuAL REPoRt 2012
The PALFINGeR BRANd
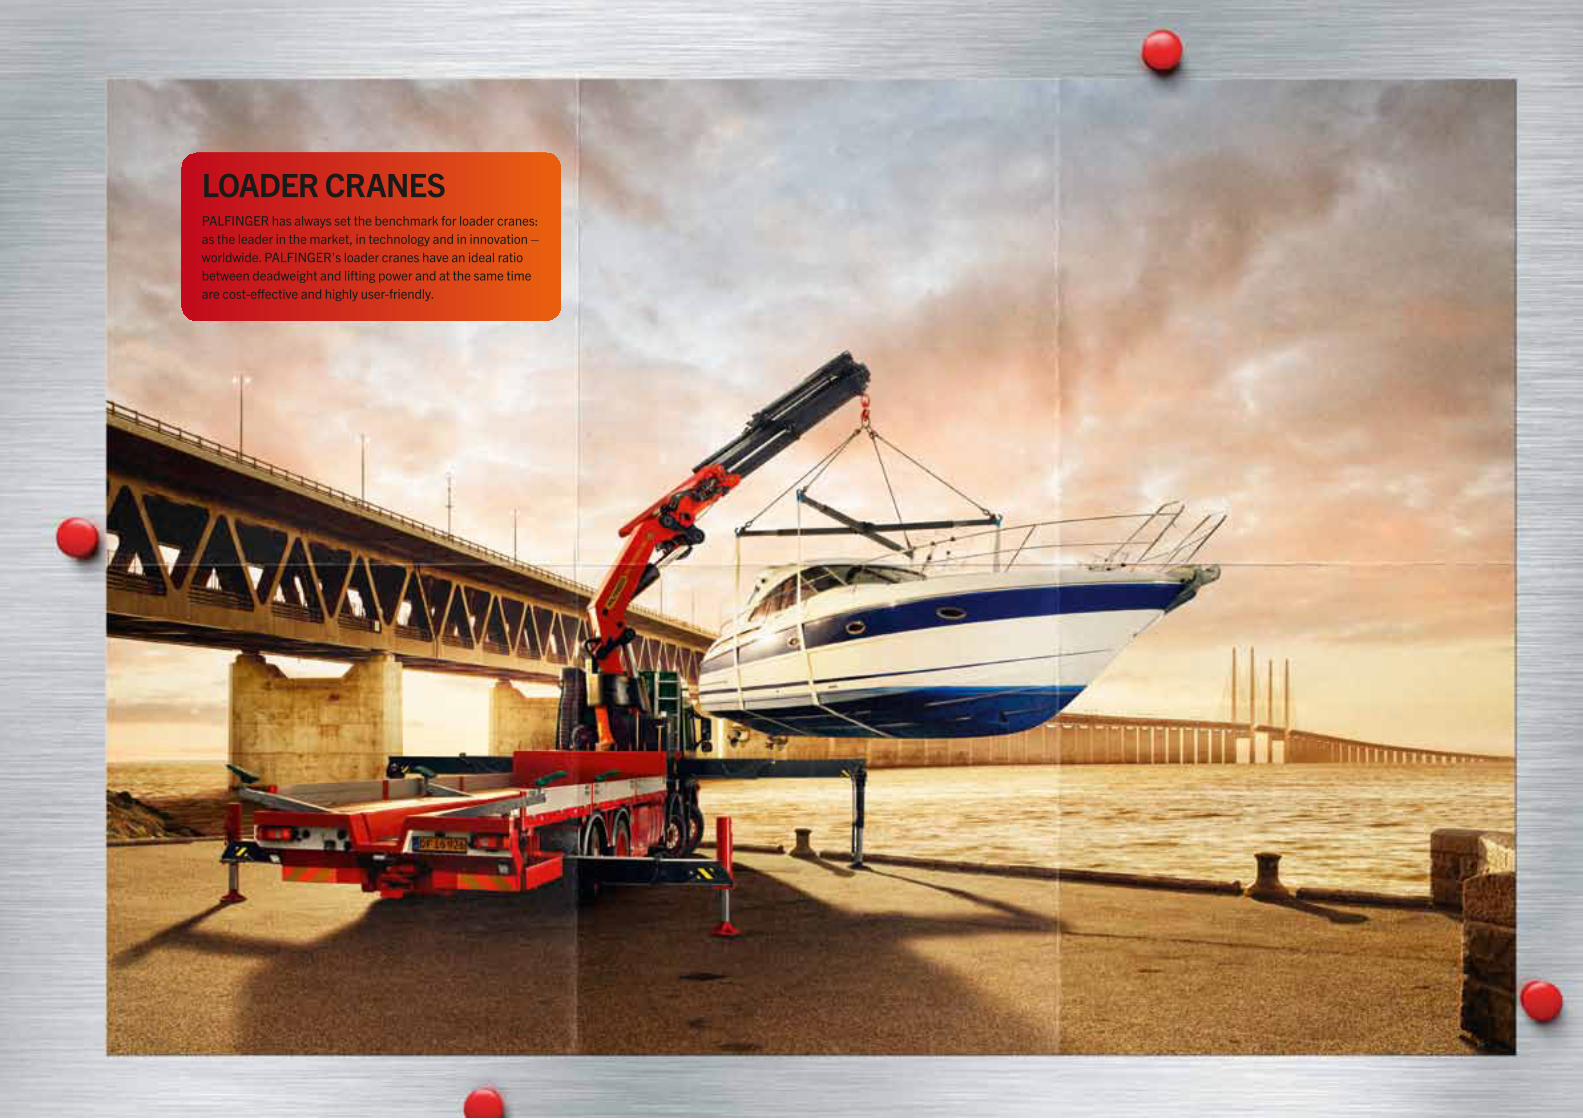
LoAdER cRANEsPALFINGERhasalwayssetthebenchmarkforloadercranes:astheleaderinthemarket,intechnologyandininnovation–worldwide.PALFINGER’sloadercraneshaveanidealratiobetweendeadweightandliftingpowerandatthesametimearecost-effectiveandhighlyuser-friendly.

2928
PALFINGER ANNuAL REPoRt 2012
The PALFINGeR BRANd
PALFINGER ANNuAL REPoRt 2012
The PALFINGeR BRANd
EPsILoN tIMBER ANd REcycLING cRANEsPALFINGERistheworld’sleadingmanufacturerofspecialcranesfortimberand scraphandlingaswellasfortheconstructionindustry.PALFINGER’sEPSILONcranes includemodelssuitableformountingontrucksandall-wheelvehiclesaswellasfor stationaryuseandarewell-knownfortheirreliabilityandcustomizedsolutions.

3130
PALFINGER ANNuAL REPoRt 2012
The PALFINGeR BRANd
PALFINGER ANNuAL REPoRt 2012
The PALFINGeR BRANd
tRuck MouNtEd FoRkLIFtsPALFINGERisoneoftheleadingmanufacturersoftruckmountedforkliftsused primarilyforhandlingbeveragesandconstructionmaterialbutalsoforother transportsolutions.Theeasy-to-manoeuvreforkliftsaretransportedontrucks andcombineextremelylowdeadweightwithmaximumliftingpower.

3332
PALFINGER ANNuAL REPoRt 2012
The PALFINGeR BRANd
PALFINGER ANNuAL REPoRt 2012
The PALFINGeR BRANd
coNtAINER hANdLING systEMsAsthegloballeaderintheproductionofcontainerhandlingsystems,PALFINGER offersthefullproductrange.Truckmountedhookloadersandskiploadersallowfor easyandsmoothtransportofvariablecontainers,especiallyintheconstructionand recyclingindustriesaswellasformunicipalapplications.

3534
PALFINGER ANNuAL REPoRt 2012
The PALFINGeR BRANd
PALFINGER ANNuAL REPoRt 2012
The PALFINGeR BRANd
AccEss PLAtFoRMsPALFINGER’saccessplatformsprovideidealapplicationsforworkinlimitedspaceandatgreatheights.Safeoperation,quickaerialaccessandthedensestservicesnetworkworldwidemakePALFINGERareliableandsought-afterprojectpartnerinthissector.

3736
PALFINGER ANNuAL REPoRt 2012
The PALFINGeR BRANd
PALFINGER ANNuAL REPoRt 2012
The PALFINGeR BRANd
tAIL LIFtsInthetailliftsector,PALFINGERisamongthetopperformersin theindustryworldwide.Whethercolumn,retractable,foldableor cantilevertaillifts:PALFINGER’sinnovativeandreliabletailliftsand passengerliftsfitabroadrangeofvehicles,offerapplication-oriented flexibilityandarebotheasytomaintainanduser-friendly.

3938
PALFINGER ANNuAL REPoRt 2012
The PALFINGeR BRANd
PALFINGER ANNuAL REPoRt 2012
The PALFINGeR BRANd
tRuck BodIEs ANdsERvIcE cRANEsAsoneoftheleadingprovidersoftruckbodiesandservicecranes,PALFINGER,especiallyinNorthAmerica,offersabroadrangeofflexiblesystemssuitableforallvehicletypes.Servicecranesareusedwherevermobilemaintenanceandrepairworkcallsformechanicalsupport.
4140
PALFINGER ANNuAL REPoRt 2012
The PALFINGeR BRANd
PALFINGER ANNuAL REPoRt 2012
The PALFINGeR BRANd
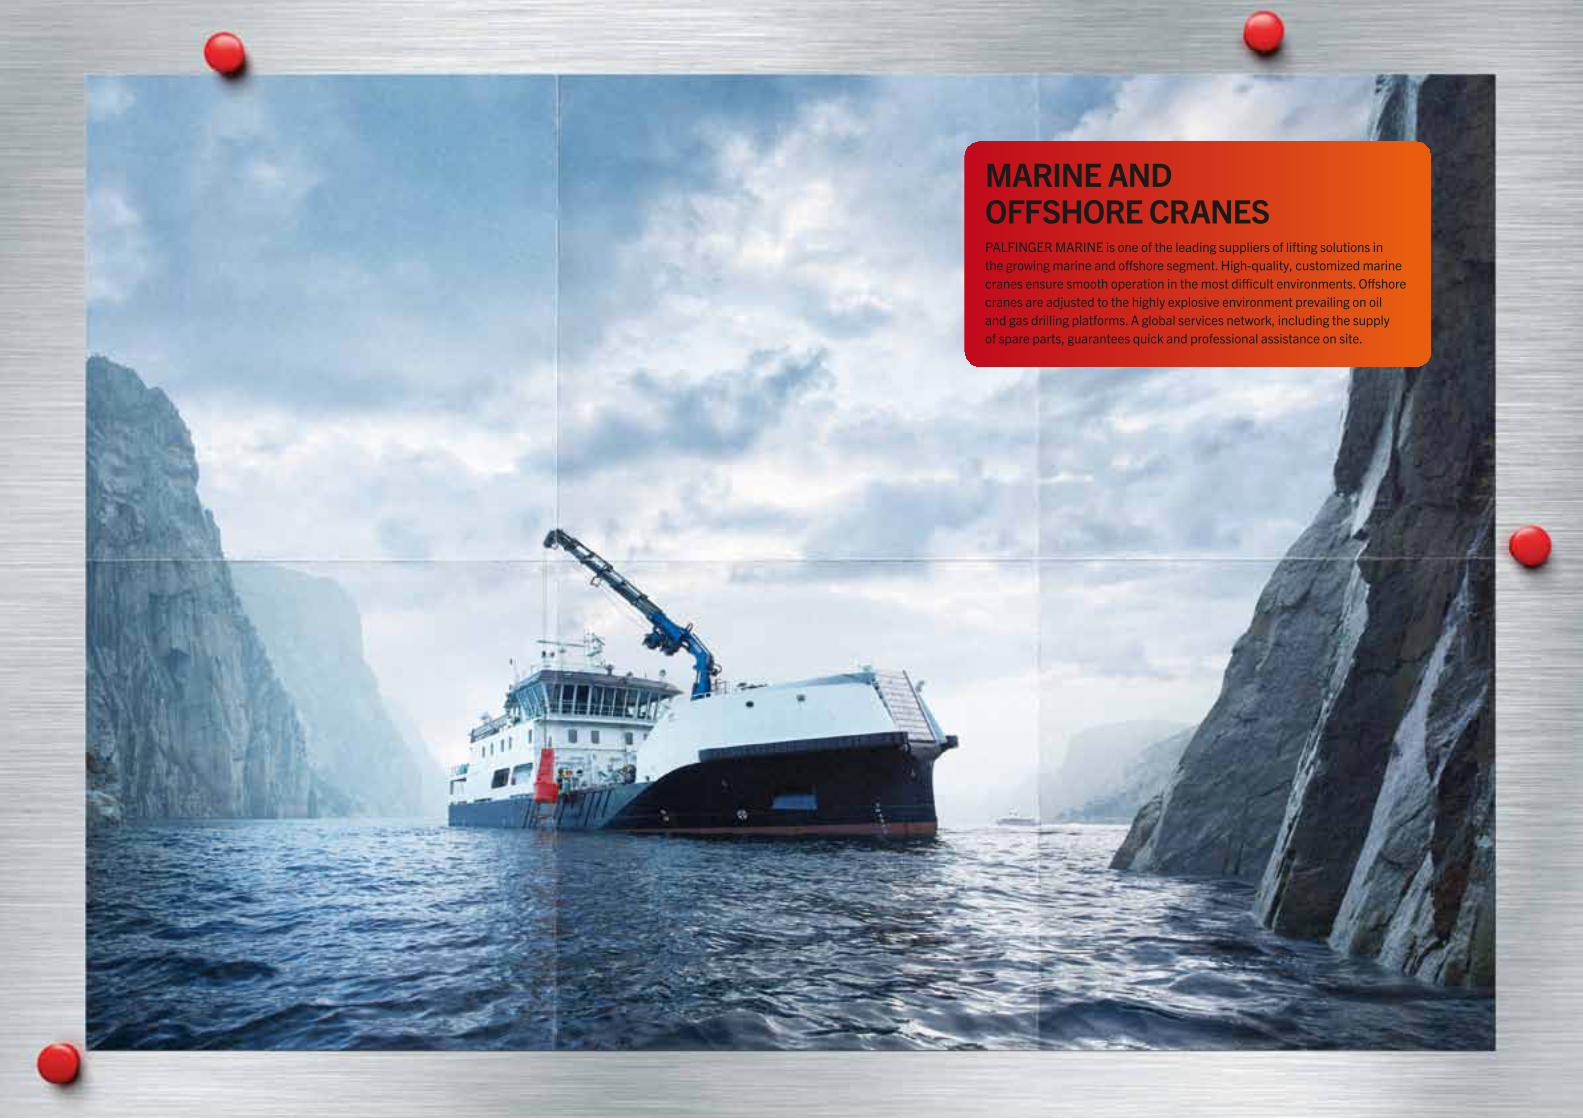
MARINE ANdoFFshoRE cRANEsPALFINGERMARINEisoneoftheleadingsuppliersofliftingsolutionsinthegrowingmarineandoffshoresegment.High-quality,customizedmarinecranesensuresmoothoperationinthemostdifficultenvironments.Offshorecranesareadjustedtothehighlyexplosiveenvironmentprevailingonoilandgasdrillingplatforms.Aglobalservicesnetwork,includingthesupplyofspareparts,guaranteesquickandprofessionalassistanceonsite.
4342
PALFINGER ANNuAL REPoRt 2012
The PALFINGeR BRANd
PALFINGER ANNuAL REPoRt 2012
The PALFINGeR BRANd
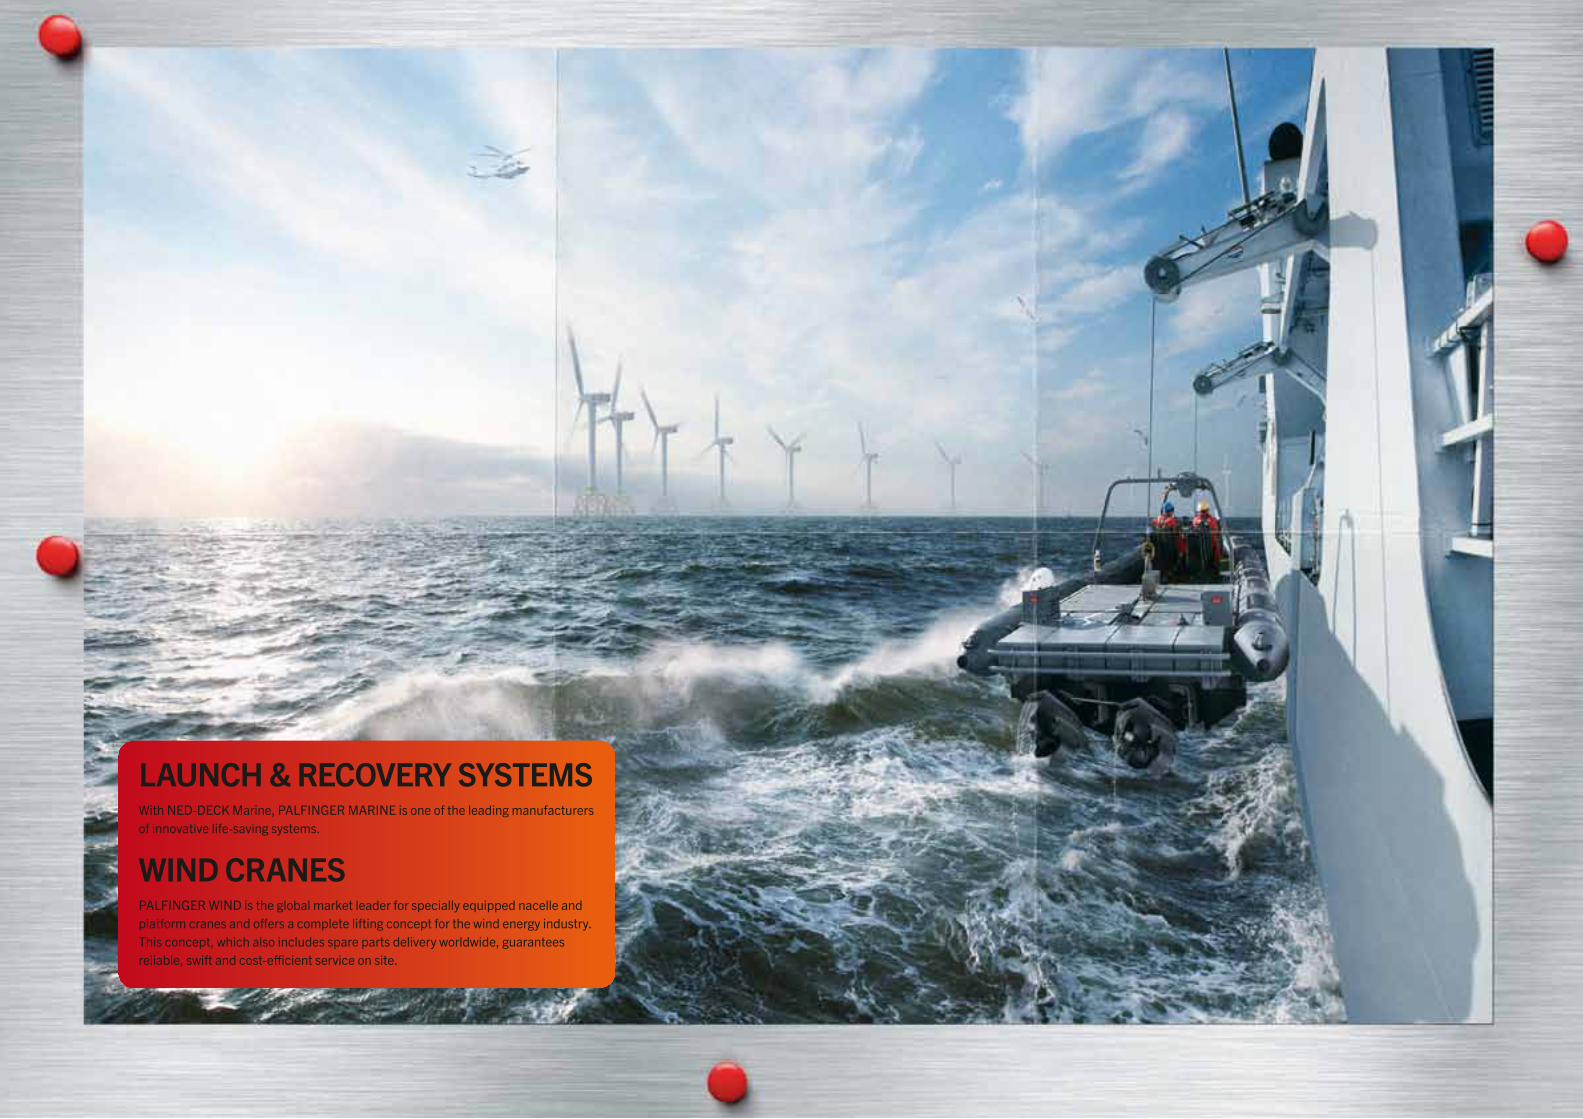
LAuNch & REcovERy systEMsWithNED-DECkMarine,PALFINGERMARINEisoneoftheleadingmanufacturersofinnovativelife-savingsystems.
wINd cRANEsPALFINGERWINDistheglobalmarketleaderforspeciallyequippednacelleandplatformcranesandoffersacompleteliftingconceptforthewindenergyindustry.Thisconcept,whichalsoincludessparepartsdeliveryworldwide,guaranteesreliable,swiftandcost-efficientserviceonsite.

4544
PALFINGER ANNuAL REPoRt 2012
coRPoRAtE GovERNANcE REPoRt
PALFINGER ANNuAL REPoRt 2012
coRPoRAtE GovERNANcE REPoRt
coRPoRAtEGovERNANcE REPoRt
Sandra HöferPALFINGER Corporate Counsels, Salzburg, Austria
•CommitmenttotheAustrianCodeofCorporateGovernance
•Evaluationbyanexternalauditor
•Stockoptionprogrammerewardslong-termandsustainablesuccess
•VariableremunerationofBoardmembersaveraged30percentin2012
46
PALFINGER ANNuAL REPoRt 2012
coRPoRAtE GoVERNANcE REPoRtINFoRMAtIoN ACCoRDING to SEC. 243B oF tHE BuSINESS CoDE
coRPoRAtE GoVERNANcE REPoRtINFoRMAtIoN AccoRdING to sEc. 243B oF thEBusINEss codEPALFINGER is committed to the standards of the Austrian Code of Corporate Governance (www.corporate-governance.at) and complies with nearly all rules of the Code. In accordance with legal provisions, this commitment is evaluated by an external auditor. the evaluation result confirms that corporate governance is genuinely put into practice at PALFINGER. the audited questionnaire is made available to all interested parties on PALFINGER’s corporate website (www.palfinger.ag).
GoVERNING BodIEs ANd thE oPERAtIoNs oF thE MANAGEMENt ANd suPERVIsoRy BoARds AccoRdING to sEc. 243B PARA. 2 oF thE BusINEss codE
According to the Austrian Companies Act (AktG), the Management Board of PALFINGER AG manages the Company under its own responsibility in such a manner as is in the best interest of the Company, taking into consideration the interests of the employees and of the shareholders as well as the public interest. Loyalty towards one’s colleagues, an open mind, a regular exchange of information and fast decision-making processes are among the Company’s supreme principles. the Supervisory Board supervises the management and assists the Management Board in significant decisions. open communication between the Management Board and the Supervisory Board and also within the respective Boards has a long-standing tradition at PALFINGER. At its meetings held in 2012, the Supervisory Board primarily discussed the ongoing business operations in the context of the current economic environment, measures to cut costs and the capital employed, projects of acquisition and expansion, risk management as well as the forecast for 2013.
At present there are no women on either the Supervisory Board or the Management Board or in any top management positions at PALFINGER. Even in the levels below that, the share of women in executive positions is low and/or limited to administrative positions.
PALFINGER intends to change this situation in the medium term. to this end, PALFINGER has increased the Company’s presence at job fairs and has specifically addressed prospective female applicants of high potential. When new executive positions are created or existing ones become vacant, PALFINGER is making a greater effort to encourage women to apply for such positions. However, one problem in this regard is that technical training is a prerequisite for the majority of executive positions at PALFINGER. the proportion of female engineers is extremely low which is often why no women apply for a position in the Company. Nevertheless, PALFINGER will continue its efforts to step up the percentage of women in the management development programmes.
47
PALFINGER ANNuAL REPoRt 2012
coRPoRAtE GoVERNANcE REPoRtGoVERNING BoDIES
MANAGEMENt BoARd
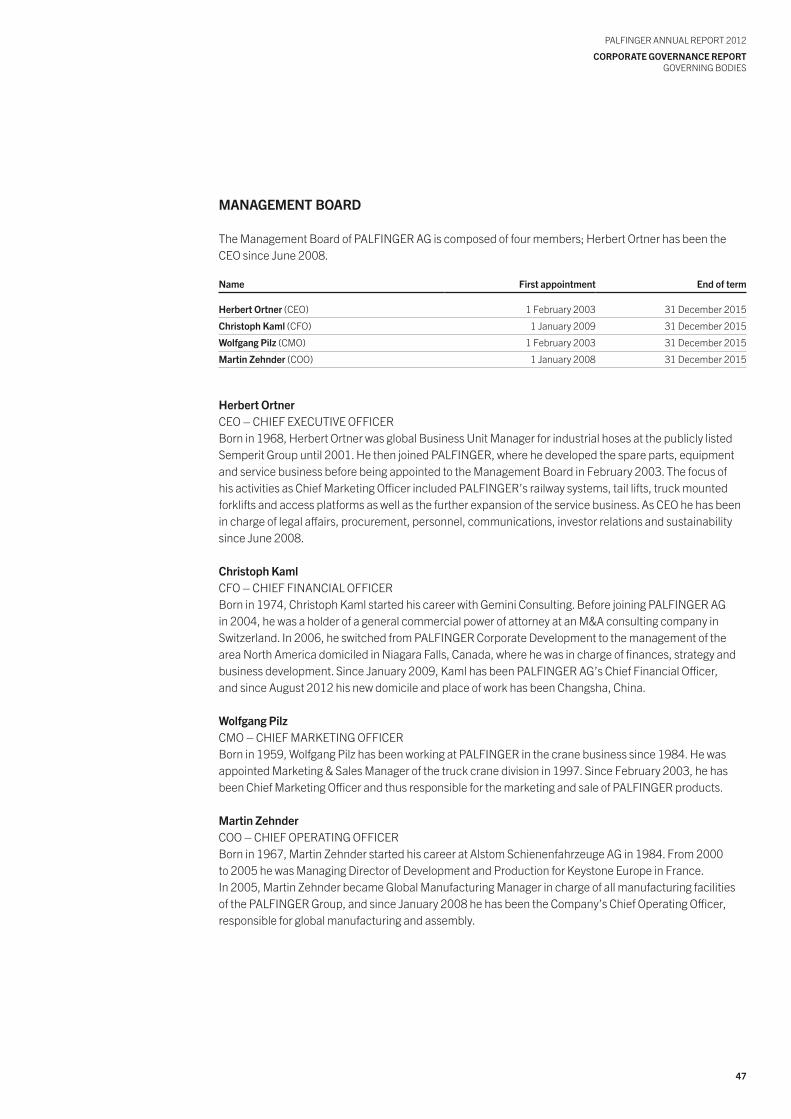
the Management Board of PALFINGER AG is composed of four members; Herbert ortner has been the CEo since June 2008.
Name First appointment End of term
herbert ortner (CEo) 1 February 2003 31 December 2015
christoph kaml (CFo) 1 January 2009 31 December 2015
wolfgang Pilz (CMo) 1 February 2003 31 December 2015
Martin zehnder (Coo) 1 January 2008 31 December 2015
herbert ortnerCEo – CHIEF EXECutIVE oFFICERBorn in 1968, Herbert ortner was global Business unit Manager for industrial hoses at the publicly listed Semperit Group until 2001. He then joined PALFINGER, where he developed the spare parts, equipment and service business before being appointed to the Management Board in February 2003. the focus of his activities as Chief Marketing officer included PALFINGER’s railway systems, tail lifts, truck mounted forklifts and access platforms as well as the further expansion of the service business. As CEo he has been in charge of legal affairs, procurement, personnel, communications, investor relations and sustainability since June 2008.
christoph kamlCFo – CHIEF FINANCIAL oFFICER Born in 1974, Christoph Kaml started his career with Gemini Consulting. Before joining PALFINGER AG in 2004, he was a holder of a general commercial power of attorney at an M&A consulting company in Switzerland. In 2006, he switched from PALFINGER Corporate Development to the management of the area North America domiciled in Niagara Falls, Canada, where he was in charge of finances, strategy and business development. Since January 2009, Kaml has been PALFINGER AG’s Chief Financial officer, and since August 2012 his new domicile and place of work has been Changsha, China.
wolfgang PilzCMo – CHIEF MARKEtING oFFICERBorn in 1959, Wolfgang Pilz has been working at PALFINGER in the crane business since 1984. He was appointed Marketing & Sales Manager of the truck crane division in 1997. Since February 2003, he has been Chief Marketing officer and thus responsible for the marketing and sale of PALFINGER products.
Martin zehnderCoo – CHIEF oPERAtING oFFICERBorn in 1967, Martin Zehnder started his career at Alstom Schienenfahrzeuge AG in 1984. From 2000 to 2005 he was Managing Director of Development and Production for Keystone Europe in France. In 2005, Martin Zehnder became Global Manufacturing Manager in charge of all manufacturing facilities of the PALFINGER Group, and since January 2008 he has been the Company’s Chief operating officer, responsible for global manufacturing and assembly.
48
PALFINGER ANNuAL REPoRt 2012
coRPoRAtE GoVERNANcE REPoRtGoVERNING BoDIES
suPERVIsoRy BoARd
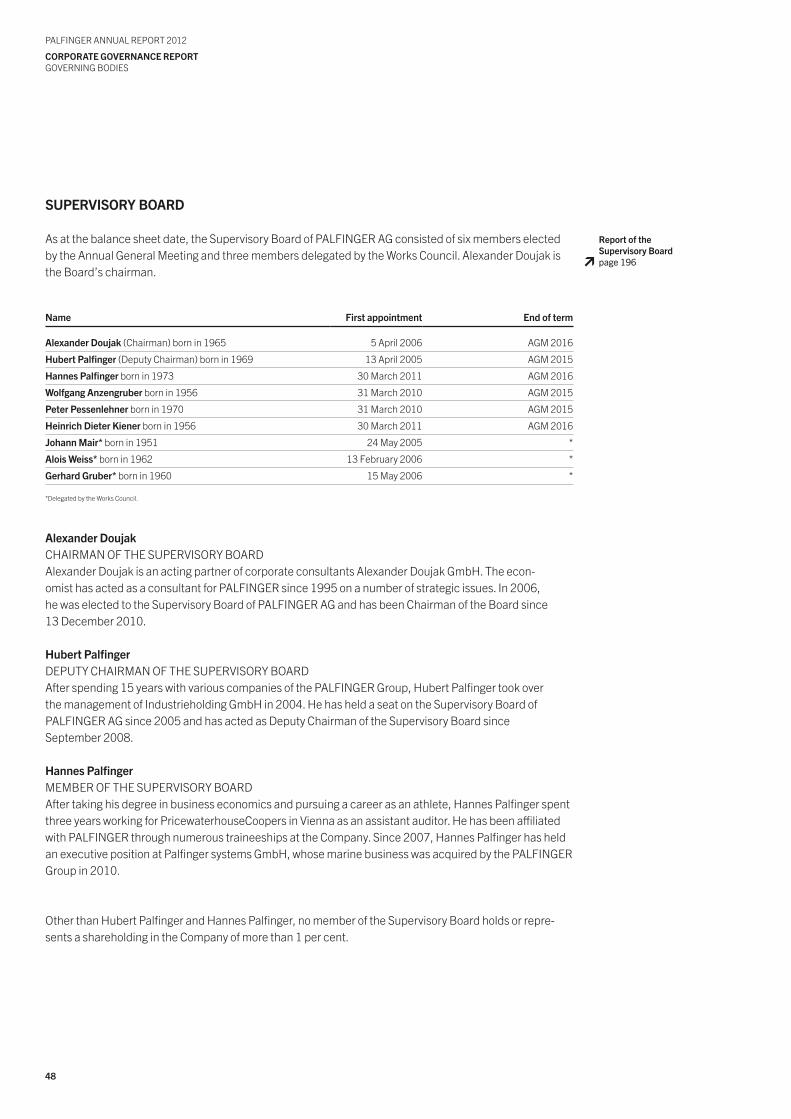
As at the balance sheet date, the Supervisory Board of PALFINGER AG consisted of six members elected by the Annual General Meeting and three members delegated by the Works Council. Alexander Doujak is the Board’s chairman.
Name First appointment End of term
Alexander doujak (Chairman) born in 1965 5 April 2006 AGM 2016
hubert Palfinger (Deputy Chairman) born in 1969 13 April 2005 AGM 2015
hannes Palfinger born in 1973 30 March 2011 AGM 2016
wolfgang Anzengruber born in 1956 31 March 2010 AGM 2015
Peter Pessenlehner born in 1970 31 March 2010 AGM 2015
heinrich dieter kiener born in 1956 30 March 2011 AGM 2016
Johann Mair* born in 1951 24 May 2005 *
Alois weiss* born in 1962 13 February 2006 *
Gerhard Gruber* born in 1960 15 May 2006 *
*Delegated by the Works Council.
Alexander doujakCHAIRMAN oF tHE SuPERVISoRy BoARDAlexander Doujak is an acting partner of corporate consultants Alexander Doujak GmbH. the econ-omist has acted as a consultant for PALFINGER since 1995 on a number of strategic issues. In 2006,he was elected to the Supervisory Board of PALFINGER AG and has been Chairman of the Board since13 December 2010.
hubert Palfinger DEPuty CHAIRMAN oF tHE SuPERVISoRy BoARDAfter spending 15 years with various companies of the PALFINGER Group, Hubert Palfinger took overthe management of Industrieholding GmbH in 2004. He has held a seat on the Supervisory Board of PALFINGER AG since 2005 and has acted as Deputy Chairman of the Supervisory Board sinceSeptember 2008.
hannes PalfingerMEMBER oF tHE SuPERVISoRy BoARDAfter taking his degree in business economics and pursuing a career as an athlete, Hannes Palfinger spent three years working for PricewaterhouseCoopers in Vienna as an assistant auditor. He has been affiliated with PALFINGER through numerous traineeships at the Company. Since 2007, Hannes Palfinger has held an executive position at Palfinger systems GmbH, whose marine business was acquired by the PALFINGER Group in 2010.
other than Hubert Palfinger and Hannes Palfinger, no member of the Supervisory Board holds or repre-sents a shareholding in the Company of more than 1 per cent.
Report of the supervisory Boardpage 196
49
PALFINGER ANNuAL REPoRt 2012
coRPoRAtE GoVERNANcE REPoRtGoVERNING BoDIES
coMMIttEEs oF thE suPERVIsoRy BoARd
Audit committeeAt the meeting on 3 February 2012, Hubert Palfinger resigned from the Audit Committee. the NominationCommittee at the same time proposed to delegate Hannes Palfinger. this resolution was adopted by the Supervisory Board.
the powers of decision vested in the Audit Committee are in compliance with the provisions of theCompanies Act. In 2012, the Audit Committee held two meetings dealing primarily with the 2011 financial statements, the internal control system, risk management and internal audits as well as with PALFINGER’s cooperation with the auditor.Members: Alexander Doujak (Chairman), Hannes Palfinger, Peter Pessenlehner (financial expert), Johann Mair
Nomination committeethe Nomination Committee met regularly in 2012 and discussed, in particular, the appointment of members of Supervisory Board committees as well as cooperation within and working methods of the Management Board.Members: Alexander Doujak (Chairman), Hubert Palfinger
Remuneration committeeAt its regular meetings held in 2012, the Remuneration Committee dealt with the remuneration of Manage-ment Board members and conducted feedback interviews with the members of the Management Board.Members: Alexander Doujak (Chairman), Hubert Palfinger
AudItoR
Ernst & young Wirtschaftsprüfungsgesellschaft m.b.H., Salzburg, was proposed as the auditor of the 2012 financial statements and consolidated financial statements of PALFINGER AG and appointed by the Annual General Meeting on 8 March 2012.
50
PALFINGER ANNuAL REPoRt 2012
coRPoRAtE GoVERNANcE REPoRtREMuNERAtIoN REPoRt
REMuNERAtIoN REPoRt
the remuneration system in place for Management Board members includes fixed elements and profit-related payments and is adequate given the size and complexity of the Company. Profit-related remune-ration is based, on the one hand, on targets that are set in agreement with the individual Management Board members and, on the other hand, on fundamental financial ratios of the PALFINGER Group:revenue growth, profit before tax and RoCE, as well as a higher corporate value in the long term. In 2012, the variable pay of Management Board members amounted, on average, to approx. 30 per cent of their annual remuneration.
the stock option programme adopted by the 2009 and 2010 Annual General Meetings and the per-formance standards defined in this programme are a means of rewarding, in particular, long-term and sustainable success. For detailed information on remuneration, stock options as well as special bonuses, please refer to the notes to the consolidated financial statements of this Report.
the members of the Supervisory Board received no remuneration for their services in the 2012 financial year.
A D&o insurance policy, the premiums of which are paid by PALFINGER AG, has been taken out for Supervisory and Management Board members as well as for other high-ranking executives of the PALFINGER Group.
consolidated financial statements, disclosures concerning governingbodies and employees page 190
51
PALFINGER ANNuAL REPoRt 2012
coRPoRAtE GoVERNANcE REPoRtCoDE oF CoRPoRAtE GoVERNANCE
codE oF coRPoRAtE GoVERNANcE
PALFINGER satisfies the requirements of the mandatory L-rules (legal requirements) and adheres toalmost all C-rules (comply or explain) of the Austrian Code of Corporate Governance as amended in July 2012. the following C-rules are not observed:
Rules No. 39 and No. 53 (independence of the supervisory Board and independence of supervisory Board committees)PALFINGER does not fully comply with Rule No. 53. No criteria for independence have been established. Rather, PALFINGER AG publishes personal profiles and qualification profiles of the members of the Supervisory Board and circumstances that might limit their independence on its website. on the basis of this information, any shareholder as well as the public at large can gain insight into the qualifications of the members of the Supervisory Board and assess their suitability for this Board.
the performance of the Supervisory Board members has made a significant contribution to the success of PALFINGER AG in recent years. the well-balanced composition of the Supervisory Board and the prudent selection of the individual members according to their professional and personal characteristics as well as their knowledge of the Company and of the entire sector have been of the greatest importance in this respect. For all of these reasons, it is not considered necessary to establish criteria for the independence of Supervisory Board members.
this also applies to the committee members (third paragraph, Rule No. 39).
Information on contracts requiring prior approval can be found in the notes to the consolidated financial statements and on the Company’s website www.palfinger.ag.
Salzburg, 23 January 2013
Herbert ortner m.p. Wolfgang Pilz m.p.
Christoph Kaml m.p. Martin Zehnder m.p.
consolidated financial statements,
Business transactions with related parties
page 188
www.palfinger.ag InvestorRelations
CorporateGovernanceAdditional
informationpursuanttoRulesNo.48andNo.53 oftheAustrianCodeof CorporateGovernance
5352
PALFINGER ANNuAL REPoRt 2012
Investor relatIons
PALFINGER ANNuAL REPoRt 2012
Investor relatIons
INvEstoR RELAtIoNs
Christian ProhaskaPALFINGER cafeteria chef, Salzburg, Austria
•Long-termstrategyaimedatgeneratingsustainable,profitablegrowthwithgreatest possible shareholder value
•Growthandeconomicprofitdeterminedbytheindicatorsrevenueincrease, EBIt margin, RocE and net working capital
•ThePalfingerfamilyasthestablecoreshareholdersupportslong-termsuccess
•Sustainabilityasaprerequisiteforcorporatesuccess
•Objectivesimplementedbasedonthreestrategicpillars: innovation, internationalization and flexibility
•Continuousdistributionpolicy:EUR0.38proposedfor2012dividend
54
PALFINGER ANNuAL REPoRt 2012
Investor relatIons
INVEstoR RELAtIoNsINtERNAtIoNAL stock MARkEts
International stock markets in 2012 were characterized by economic uncertainties and the respective current developments. After a marked recovery in the first quarter, stock markets experienced an equally hefty decline in the second quarter, reflecting in particular the flaring up of the national debt crisis. Mid-year, an upward trend set in again, but was suspended in the fourth quarter, mainly due to the awaited political and fiscal decisions in the uSA. At the end of the year, the major stock indices recovered again. Global stock markets thus recorded an overall upward trend in 2012.
After recording huge increases in the second half of 2012, the German stock index DAX ended the year at a level of 30.2 per cent higher than that of 2011, and the EuroStoxx 50 – an index of euro-area stocks – gained a notable 13.4 per cent year on year. the Japanese stock market index Nikkei 225 also performed well, rising 22.9 per cent. Despite a drop in the fourth quarter, the uS stock market index Dow Jones Industrial (DJI) closed the year 5.9 per cent above its 2011 level.
Sustainable investments continued to meet with growing interest in 2012, a trend that is reflected in the climbing number of investment funds dedicated to sustainability. this type of investment has gained wide acceptance among institutional investors, among them church-affiliated and non-profit organizations as well as foundations.
VIENNA stock EXchANGE
After the marked decline of 2011, the Austrian traded Index AtX rose significantly in 2012. As the euro crisis eased, investors’ interest gradually revived – a trend that was supported by favourable stock valua-tions. the high index weighting of banking stocks also contributed to a price increase of 26.5 per cent to 2,401.21 points at year end. Market capitalization rose to EuR 80.4 billion.
thE PALFINGER shARE
the shares of PALFINGER AG are listed in the prime market on the Vienna Stock Exchange. In Germany, they are traded over the counter in Frankfurt, Stuttgart, Berlin, Munich and Dusseldorf. Since March 2005, there has been an ADR Level 1 listing in New york. PALFINGER stock is listed in the AtX Prime Index of the Vienna Stock Exchange and, since 2005, has also been included in the Austrian VÖNIX sustainability index.
With high trading volumes, the PALFINGER share rose by more than 50 per cent in the first three months of 2012, reaching its 2012 high on 16 March at EuR 19.71. In the further course of the year, the share price developed in line with the international environment but was only partly able to keep up with the renewed gains made by European stock exchanges in the fourth quarter. At year end, on 28 December 2012, the price of the PALFINGER share closed at EuR 16.44, which is 33.3 per cent above the closing value of EuR 12.33 in 2011. this development shows that PALFINGER outperformed all relevant com-parative indices and is thus among the top performers among the stocks included in the prime market of the Vienna Stock Exchange.
55
PALFINGER ANNuAL REPoRt 2012
Investor relatIons
Continuous and transparent communications is a backbone of PALFINGER’s investor relations. the Annual Report 2011 received numerous awards, in Austria and abroad, for its supreme quality as did the Sustainability Report 2010/2011.
In 2012, PALFINGER’s Management Board and investor relations team attended numerous road shows and investors’ conferences in Austria and abroad. By participating in shareholders’ events and fairs, PALFINGER has also fostered relations with its retail shareholders.
In May 2012, PALFINGER, together with voestalpine AG, organized a Capital Markets Day in Salzburg, when analysts and investors were given the opportunity to visit the production plant in Lengau, Austria.
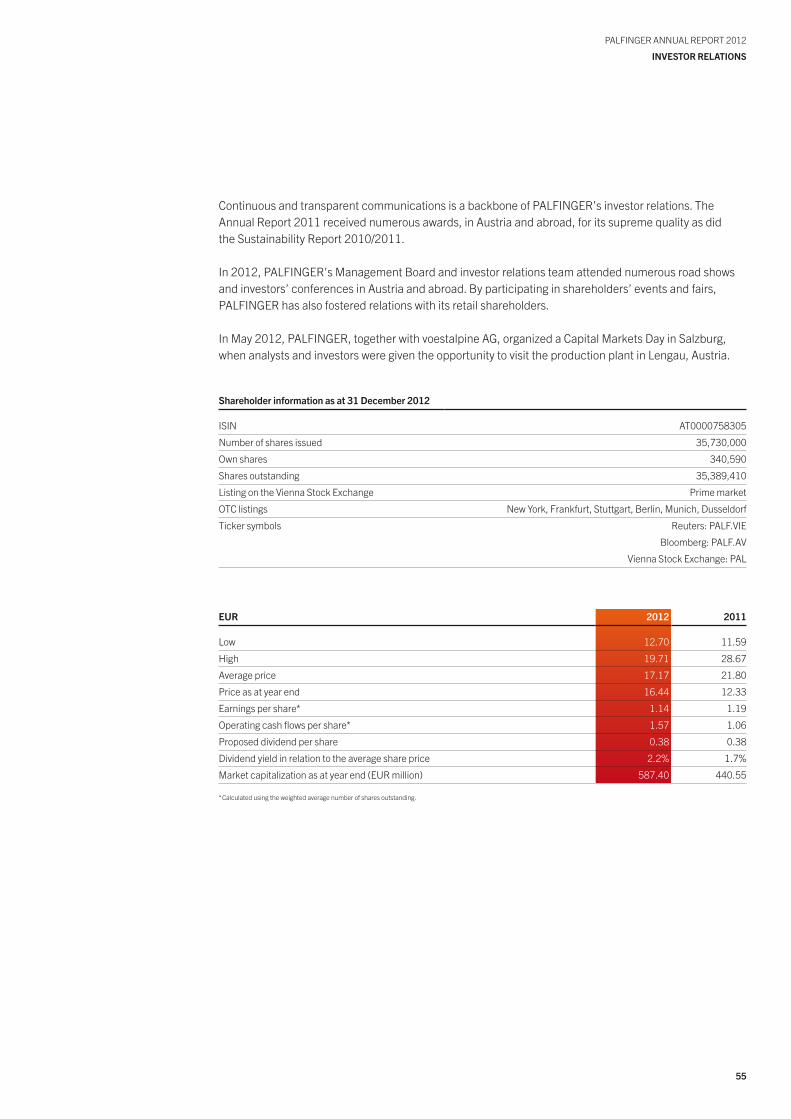
shareholder information as at 31 december 2012
ISIN At0000758305
Number of shares issued 35,730,000
own shares 340,590
Shares outstanding 35,389,410
Listing on the Vienna Stock Exchange Prime market
otC listings New york, Frankfurt, Stuttgart, Berlin, Munich, Dusseldorf
ticker symbols Reuters: PALF.VIE
Bloomberg: PALF.AV
Vienna Stock Exchange: PAL
EuR 2012 2011
Low 12.70 11.59
High 19.71 28.67
Average price 17.17 21.80
Price as at year end 16.44 12.33
Earnings per share* 1.14 1.19
operating cash flows per share* 1.57 1.06
Proposed dividend per share 0.38 0.38
Dividend yield in relation to the average share price 2.2% 1.7%
Market capitalization as at year end (EuR million) 587.40 440.55
* Calculated using the weighted average number of shares outstanding.
56
PALFINGER ANNuAL REPoRt 2012
Investor relatIons
Research reports•BerenbergBank•Cheuvreux•DeutscheBank•ErsteGroup•GoldmanSachs
dIVIdENds
PALFINGER AG pursues a continuous dividend policy, which provides that approximately one third of the annual profit is to be distributed to shareholders. the net profit of PALFINGER AG for 2012 amounted to EuR 155.4 million; the Management Board will propose to the Annual General Meeting to distribute a dividend of EuR 0.38 per share for 2012 (previous year: EuR 0.38 per share).
BuyBAck oF shAREs
on 1 December 2011, PALFINGER AG started a share buyback programme providing, in a first step, for the repurchase of own shares at a maximum price of EuR 12.30 per share up to a maximum buyback value of EuR 10 million. In 2011, 40,840 own shares were bought back under this programme; in 2012, the number of repurchased shares was 500. together with the 328,000 own shares from a buyback programme ended in 2003, minus 28,750 shares issued in 2012 under the existing stock option pro-grammes, the Company held 340,590 own shares as at the balance sheet date.
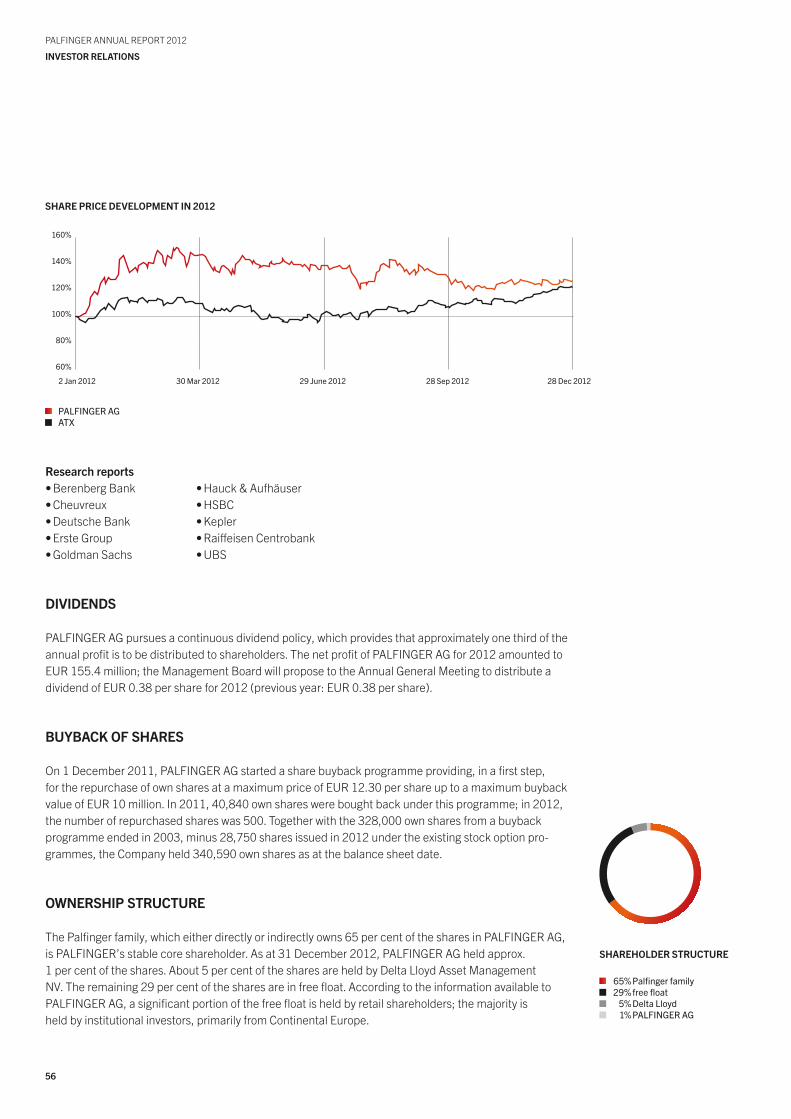
owNERshIP stRuctuRE
the Palfinger family, which either directly or indirectly owns 65 per cent of the shares in PALFINGER AG, is PALFINGER’s stable core shareholder. As at 31 December 2012, PALFINGER AG held approx. 1 per cent of the shares. About 5 per cent of the shares are held by Delta Lloyd Asset Management NV. the remaining 29 per cent of the shares are in free float. According to the information available to PALFINGER AG, a significant portion of the free float is held by retail shareholders; the majority is held by institutional investors, primarily from Continental Europe.
shAREhoLdER stRuctuRE
65%Palfingerfamily29% freefloat
5%DeltaLloyd1%PALFINGERAG
160%
140%
120%
100%
80%
60%
2 Jan 2012 30 Mar 2012 29 June 2012 28 Sep 2012 28Dec2012
PALFINGERAGAtX
shARE PRIcE dEVELoPMENt IN 2012
•Hauck&Aufhäuser•HSBC•Kepler•RaiffeisenCentrobank•UBS
57
PALFINGER ANNuAL REPoRt 2012
Investor relatIons
FINANcIAL cALENdAR 2013
68
12888
March 2013March 2013March 2013May 2013August 2013November 2013
Annual General MeetingEx-dividend dayDividend payment dayPublication of results for the first quarter of 2013Publication of results for the first half of 2013Publication of results for the first three quarters of 2013
Additional dates such as trade fairs or road shows will be announced at the Company’s website under Financial Calendar.
If you wish to receive regular news about the PALFINGER Group, please register for the info service onour website.
INVEstoR RELAtIoNs
Phone +43 662 4684-0Fax +43 662 4684-2280www.palfinger.ag
herbert ortner, CEoExt. 2222, [email protected]
hannes Roither, Company SpokespersonExt. 2260, [email protected]
www.palfinger.ag InvestorRelations
FinancialCalendar
www.palfinger.ag InvestorRelations
IRServices

5958
PALFINGER ANNuAL REPoRt 2012
coNsoLIdAtEd MANAGEMENt REPoRtCoDE oF CoRPoRAtE GoVERNANCE
PALFINGER ANNuAL REPoRt 2012
coNsoLIdAtEd MANAGEMENt REPoRtCoDE oF CoRPoRAtE GoVERNANCE
coNsoLIdAtEdMANAGEMENt REPoRt
Sylvia Frühwirth-EkloudPALFINGER travel Management
60
PALFINGER ANNuAL REPoRt 2012
coNsoLIdAtEd MANAGEMENt REPoRtMARKEt REVIEW
coNsoLIdAtEd MANAGEMENt REPoRt
MARkEt REVIEw
EcoNoMIc ENVIRoNMENt
the subdued development of the global economy, first signs of which were already noticed in the second half of 2011, continued throughout 2012. the problem of enormous sovereign debt in some European countries and the uSA as well as the resulting economic and political uncertainties were further aggravat-ed over the course of the year. the lack of trust placed in the future of the euro area and in debt reduction is regarded as a major downward risk for the economies of Western industrialized countries. As economic performance was weak, significant impulses on global trade were lacking. Consequently, growth slowed down in the emerging markets and developing countries as well, even though by comparison these re-gions still recorded relatively high economic growth.
over the course of 2012, global economic prospects became less optimistic; as a result, the International Monetary Fund (IMF) reduced its forecasts several times. In January 2013, the IMF expected global eco-nomic growth of only 3.2 per cent in 2012 and 3.5 per cent in 2013.
In Europe, the development of the real economy was slowed down by the tremendous financial difficulties faced by some countries. In 2012, the number of countries seeking aid from the euro area increased to five: Greece, Ireland, Portugal, Spain and Cyprus. A recession is expected in some countries of the euro area for 2012, and most recently the situation in Germany and France – up to now the drivers of econom-ic growth – started to slacken as well and the unemployment rate hit a record high. In July, the European Central Bank (ECB) cut its key interest rate to a historic low of 0.75 per cent. In early September, the ECB announced its plans to buy government bonds, but only on condition that the respective countries agree to economic policy reform programmes. the IMF expects the economy in the euro area to slow down by 0.4 per cent in 2012 and by 0.2 per cent in 2013.
Central and Eastern Europe are closely linked to the euro area in terms of trade and financial systems, which was one of the primary factors causing a clear weakening of economic dynamics. the IMF has fore-cast economic growth of 1.8 per cent for 2012 and 2.4 per cent for 2013 in the CEE region. In the second half of 2012, the economy in Russia deteriorated as well. With inflation rates on the rise, the Russian Cen-tral Bank raised its key interest rate in September.
the uS economy adopted a wait-and-see approach, primarily in the second half of the year – at first in connection with the presidential elections in November and then due to the “fiscal cliff” expected for the turn of the year 2012/2013, when the tax breaks were to come to an end and, at the same time, public spending cuts were to take effect. In September, the uS Federal Reserve resolved to launch its third bond purchasing programme; key interest rates are currently at a very low level. the uS economy is expected to grow by 2.3 per cent and 2.0 per cent in 2012 and 2013, respectively.
•GlobalimpactofincreasinglyuncertaineconomicdevelopmentinEurope•Divergentdevelopmentofindustries,increasingenvironmentalawarenesscausesgrowthof
recycling and offshore wind energy industries•PALFINGERisamongtheleadingprovidersinthemarket•PALFINGER’sdealersandsuppliersarealsoinvolvedinimprovementmeasuresaspartners
61
PALFINGER ANNuAL REPoRt 2012
coNsoLIdAtEd MANAGEMENt REPoRtMARKEt REVIEW
In Latin America, economic growth declined, primarily in the first half of 2012, caused by Brazil’s weak economic performance. targeted support measures then resulted in the Brazilian economy’s picking up in the second half, but investments and exports continued to contract. the government’s focus in 2012 was on supporting the economy; structural reforms were neglected. the IMF expects feeble economic growth of 1.0 per cent in 2012 and a recovery to 3.5 per cent in 2013.
Asia’s emerging markets were not spared the uncertainties affecting the industrialized nations. In China, the poor export demand prompted enterprises to take a hesitant stance towards investments in equip-ment. While investments in infrastructure were on the rise in the third quarter, primarily in the field of rail and road projects, consumption was low, largely due to the poor social security system. China’s economy is forecast to see growth of 7.8 per cent in 2012 and just above 8 per cent in 2013. the growth outlook for India is also less optimistic than before due to the weak economic activity, which has been observed mainly in connection with the difficult global environment, poor infrastructure and lack of success in con-solidating national finance.
In 2012, the financial markets were marked by the uncertainties of the real economy and by a high level of volatility. As the overall development of the international stock markets was positive, the share price losses recorded in 2011 were, at least to a great extent, compensated.
After an initial downward trend, the prices of raw materials took an upward turn in the third quarter of 2012. the price of a barrel of Brent crude, which in June had fallen below uSD 90, also rose significantly, reaching uSD 111.30 as at the end of 2012. taking a longer-term view on the price development since the beginning of 2011, a sideways movement phase with prices around uSD 100 can be observed.
In 2012, the euro appreciated slightly against the uS dollar. After recording a loss in value in mid-2012, it traded at uSD 1.32 at the end of the year, just 2 per cent above the previous year’s level. Against the Chinese yuan, the euro remained almost stable, trading at CNy 8.22. Against the Brazilian real, the euro appreciated by approx. 12 per cent.
INdustRy REVIEw
Due to the fact that PALFINGER has a diversified product portfolio, the Group’s products are used not only in a single sector, but in a wide variety of customer industries. Major developments of these target industries play a vital role in the overall success of the Group. Worldwide, PALFINGER is known today as the producer of the most innovative, reliable and cost-effective lifting solutions for use on commercial vehicles and in the maritime field. In addition to the construction industry and transport and haulage, the most important industries for PALFINGER therefore also include railway infrastructure, timber, recycling and, since 2010, increasingly also marine systems and wind energy.
construction industryAs in the previous year, the European construction industry started into the new year with cautious optimism in 2012. However, in many countries the continuing national debt crisis resulted in a hesitant approach towards investments by the public sector, which negatively impacted the construction industry. In Germany, incoming orders grew by almost 4 per cent in real terms, thanks to the positive development at the beginning of the year. At the European level, however, a decline of 2 per cent was forecast for 2012. Experts assume that the construction industry will grow in 2013, for the first time in six years, even though such growth is expected to be very modest at + 0.4 per cent.
62
PALFINGER ANNuAL REPoRt 2012
coNsoLIdAtEd MANAGEMENt REPoRtMARKEt REVIEW
In North America, a much more positive trend was already observed in 2012. Demand for project devel-opment was on the rise and was also reinforced by the very low price level. Funding remained a central problem in housing, although such financing obstacles were increasingly reduced in the course of the year. In the summer of 2012, the HMI (Housing Market Index) calculated by the National Association of Home Builders (NAHB) exceeded the previous record level of 39 index points achieved in February 2007, and at the end of the year it stabilized at 47 index points.
Asia’s emerging markets, first and foremost China, continued to show robust growth in 2012, even though developments in the second half of the year were indicative of an economic slowdown and thus also a slowdown in the construction industry. Whereas in Europe and North America the focus was pri-marily on housing projects, the strong growth in Asia was caused mainly by commercial building projects. Apart from China, the important Asian markets include India, Indonesia and increasingly also Vietnam.
In view of the present economic indicators, the research departments of large banks have only modest expectations regarding the further development of the global players in the construction industry and, in most cases, are forecasting a weak sideways movement phase.
transport and haulagethe transport industry is also highly dependent on the global economy, with the gross domestic products (GDP) of the individual countries being a good indicator for the development of traffic volumes. According to the GDP forecasts of the International Monetary Fund, no relevant recovery is in sight for Eu markets in 2012 and 2013, while in the uSA at least stable and modestly positive development is expected. the slightly higher growth rates in the CIS countries and Brazil are exceeded by the forecasts for India and China – currently the drivers of global economic growth – which predict a plus of clearly over 5 per cent. From a global point of view, the challenge will be to reduce national debt to a reasonable extent and, at the same time, to take measures to stimulate economic performance.
the Global trade and transport Report of the International trade Forum, published in mid-2012, reflects the ongoing high level of uncertainty in the global transport market: Even though sea and air freight has shown stable development, rail and road transport has been weak, primarily in Europe. the freight vol-umes transported in the Eu and North America remained below the pre-crisis level recorded in 2008.
Another index used to assess performance in the transport industry is the number of new vehicle regis-trations. In Europe, the data provided by the European Automobile Manufacturers’ Association (ACEA) underline the subdued situation resulting from the GDP development. In the first half of 2012, approx. 160,000 commercial vehicles of more than 3.5 tonnes were registered in Europe; this corresponds to a decline compared to 2011 of approx. 4,000 vehicles or 2.3 per cent. the negative trend intensified increasingly until the end of the year. Altogether, approx. 270,000 new vehicles were registered in 2012, which corresponds to a decline of 7.9 per cent year on year. the number of registrations in the category of heavy commercial vehicles over 16 tonnes also decreased over the course of the year: at 8.4 per cent, this decline was even greater than in the smaller weight class.
In spite of these extremely challenging developments, a medium-to-long-term positive trend can be ob-served in the transport industry. the oECD assumes that transport volumes will increase sustainably and expects a shift in the truck-rail transport ratio across all regions and markets towards a higher truck share.
Economic environmentpage 60
63
PALFINGER ANNuAL REPoRt 2012
coNsoLIdAtEd MANAGEMENt REPoRtMARKEt REVIEW
Railway infrastructureIn 2012, the market for railway maintenance and construction vehicles was marked by an average order situation. PALFINGER was able to realize exceptional projects in terms of size and technological standard, primarily in Switzerland, Great Britain, Austria, Israel and Saudi Arabia. All in all, an increase in project volume was recorded. Decisions on the award of specific projects, particularly in China and Central Asia, are overdue and are expected to be taken in 2013.
Particularly in Europe, a rapid increase in safety requirements has been observed, which is reflected in numerous new standards and provisions. As the European railway industry continues to hold a dominant position in the world market, compliance with these new standards is also demanded by most of the non-European customers. the development of adequate control and safety systems requires investments and innovative power on the part of the providers.
timber industry and agriculturethe continuous rise in global population figures is also affecting the timber industry and agriculture: the demand for wood products, timber and sawn timber is steadily increasing. By the year 2030, raw timber consumption is expected to rise by approx. 60 per cent to a level of 30.7 million solid cubic metres in Austria alone. the positive trend in the timber industry thus also continued throughout 2012. In addition, growing ecological awareness has accelerated the demand for sustainable building materials. the Euro-peanUmbrellaAssociationoftheTimberMaterialIndustry(EuropäischerDachverbandderHolzwerk-stoffindustrie) has repeatedly pointed out the important role played by timber, as a global greenhousegas storage medium, in climate protection.
In the uSA, following a record figure of over 2 million units in 2006, the number of private houses built had dropped to under 600,000 units at the pinnacle of the real estate crisis. In 2012, growth was record-ed again for the first time since 2008, with the number of units built in the first half of the year amounting to 760,000. timber is the dominant building material used for residential buildings in the uSA.
Russia’s accession to the Wto in 2012 also had a significant impact on the development of the timberindustry: Given that the liberalization of trade leads to lower export customs for sawlogs, this step proved to be advantageous for those companies that buy their sawlogs from Russia, e.g. the Finnish paper in-dustry. other effects of the liberalization of trade include efforts on the part of the Russian governmentto stimulate local value creation in order to lower exports of raw materials, which are now less lucrative.As a consequence, the Russian market is expected to grow.
RecyclingWaste volumes vary all over the world, depending on the consumption patterns in the individual countries. In general, households account for between 60 and 90 per cent of the overall waste produced. In Europe, the average volume of recycling waste has doubled within the last 15 years, a circumstance that calls for optimized waste management. In the same period, the portion of waste material being recycled has risen from 11 to 24 per cent.
In Brazil, the government has adopted a new law obliging cities and municipalities to introduce re-cycling programmes. these programmes provide for waste collection points in all cities. Recycling ac-tivities all over the country are to be promoted and a total of 600,000 jobs along the recycling chain areto be created by 2023. Moreover, it is now mandatory to fully recycle any building rubble produced.the planned investment sum for the period 2013 to 2020 is BRL 14.5 billion per year, which corre-sponds to approx. EuR 5.6 billion.
64
PALFINGER ANNuAL REPoRt 2012
coNsoLIdAtEd MANAGEMENt REPoRtMARKEt REVIEW
In Russia, the new scrapping bonus for imported motor vehicles – which becomes payable upon import-ing a vehicle to Russia – has primarily resulted in higher market entry barriers for foreign producers, but at the same time has opened up the opportunity of substantially developing the recycling sector. Posi-tive effects are also expected to result from the upcoming large-scale sports events, the Winter olympic Games 2014 in Sochi and the World Football Championship 2018, as comprehensive investments in infrastructure and thus in the construction industry are expected in this connection.
offshore wind energyIn mid-2012, Europe-wide there were 56 offshore wind parks in 10 countries, composed of approx.1,500 offshore wind turbines with an overall installed capacity of 4.3 gigawatts (GW). the most im-portant regions can be found primarily in the North Sea and in the territorial waters of the united Kingdom. Great Britain is the world’s largest individual market for offshore wind energy.
the market structure continues to be strongly dependant on political decisions, which makes it highly volatile. one of the biggest challenges to be met by operators and producers is the necessary reduction of costs in order to make wind energy competitive with other forms of energy even if no subsidies are paid.
In Central and Northern Europe, the market situation continues to be marked by bottlenecks in the in-frastructure necessary for network connection and problems and/or delays in funding. this was one ofthe factors that caused energy supply companies to stop or suspend some large projects in 2012.
In the medium to long term, the offshore wind energy market is expected to grow considerably.Current surveys forecast an increase in installed capacity to 20 GW by the year 2016 and to 40 GW by 2020. this corresponds to approx. 4 per cent of the electricity consumption of the European union.
Marine industry According to IHS Fairplay, goods transported by sea already accounted for 70 per cent of global trade in 2011, and this figure is expected to rise by another 3 per cent by 2016. In 2012, approx. 9.2 billion tonnes of goods were shipped and transported by sea, corresponding to an increase of approx. 6 per cent com-pared to 2011. until 2016, an annual increase of approx. 5 per cent up to 11.2 billion tonnes is expected, the majority being bulk cargo. In order to ship those volumes efficiently, large fleets of cargo vessels will be necessary. this growth is also reflected in the global production figures for ships: Nearly 4,500 ships were completed in 2012, a clear increase compared to 2011 (4,150 ships), although incoming orders were declining in the course of the year 2012. In the medium term, the production volume is expected to level off at approx. 3,000 ships per year. the majority of those ships will be produced in Asia: approx.40 per cent in China and approx. 33 per cent in South Korea.
In the field of offshore and service ships, particularly oil platform supply ships and tugboats, approx. 2,200 ships were ordered in 2012. It is expected that the total offshore fleet will have grown to up to 11,000 ships by 2016. that means slow but healthy growth. Currently, Africa is still the region with the world’s highest investments in deep sea drillings, closely followed by South America. However, it is ex-pected that as early as 2013 most of the payment flows will be recorded in South America, primarily in Brazil. In Africa, the oil-producing companies are focussing on the waters off the coasts of Angola, Ghana and Nigeria as well as on the Western Nile. In South America, Petrobras is currently highly active along the coasts of Santos.
In the field of launch and recovery systems, a trend towards premium solutions was observed in 2012, which resulted in new product developments and additional orders. this also had an impact on davitsystems for the offshore and wind energy industries. the most active countries in 2012 included the Netherlands, the uSA, Brazil, the Middle East, China, India, Singapore and South Korea.
65
PALFINGER ANNuAL REPoRt 2012
coNsoLIdAtEd MANAGEMENt REPoRtMARKEt REVIEW
PALFINGER ANd Its coMPEtItoRs
the PALFINGER Group is represented in different product groups and regions whose markets are charac-terized by diverse competitive environments.
PALFINGER’s main product is still the loader crane, primarily the truck mounted knuckle boom crane. the Company’s history began with this business unit, and PALFINGER continues to dominate the world market as an innovation leader, holding a share of approx. 30 per cent. Even in the huge Russian market, PALFINGER has succeeded in achieving a strong market position through its intensive activities during recent years. At a global level, the most important competitors are still HIAB, a company of the Finnish Cargotec Group, and Fassi of Italy. In some regions there are also well-established local players. Due to the emergence of Chinese manufacturers and PALFINGER’s entry into the Chinese market, the Group is also increasingly faced with Chinese competitors.
Markets outside Europe and products other than loader cranes are becoming increasingly important for PALFINGER. In cranes for timber and recycling, PALFINGER, with a market share of approx. 15 per cent, and the Russian manufacturer Lifting Machines are the global market leaders. the remaining market shares are distributed among numerous local companies.
PALFINGER is also a major player in the markets for container handling systems and truck mounted forklifts, with HIAB being one of its major competitors in this field as well. the global market for truck mounted forklifts is dominated by HIAB, which holds a share of approx. 50 per cent. PALFINGER is the world’s second-largest player in this market.
PALFINGER also holds a leading position in the worldwide specialty markets for railway systems andmarine solutions.
66
PALFINGER ANNuAL REPoRt 2012
coNsoLIdAtEd MANAGEMENt REPoRtMARKEt REVIEW
custoMERs ANd suPPLIERs
customer and dealer networkPALFINGER products are distributed in more than 130 countries all over the world, primarily through some 200 independent dealers and the Group’s distributing companies. together with more than 4,500 services centres, this forms a comprehensive network for the end customers.
the dealers, who are a vital link to the Group’s end customers, are thus PALFINGER’s most important group of customers. the annual dealer conferences are a good communications platform for the mutual exchange of experience and information. on the occasion of this year’s international dealer conference in Salzburg, the 80th anniversary of PALFINGER was celebrated. More than 300 guests – dealers from all over the world, suppliers, journalists, investors, the Palfinger family and friends of the family – attended the gala event held at Wolfgangsee lake in the summer of 2012.
In addition, large sales and service manager meetings took place in Asia (thailand), the Middle East (Qatar) and Europe (Austria), on the occasion of which innovations in the field of service were presented to the dealers.
the dealers are also included in the preparation and implementation of measures for improvement. to this end, PALFINGER carries out comprehensive dealer surveys every two to three years and derives targeted measures from the results of such surveys. In 2012, the survey started in the third quarter and focussed on satisfaction with the products, ordering and/or supplying and the service provided by PALFINGER. Respondents included the dealers from the EMEA business area and from the business units Loader Cranes, EPSILoN timber and Recycling Cranes, Container Handling Systems, tail Lifts, Access Platforms, truck Mounted Forklifts and Marine Cranes.
the results will be available in the first half of 2013. they will then be discussed with the executives in charge, and detailed activities will be derived.
PALFINGER also regularly carries out surveys among end customers regarding various product groups and national markets. this has the object of continuously enhancing customer satisfaction, in coopera-tion with product management, sales and the dealers.
67
PALFINGER ANNuAL REPoRt 2012
coNsoLIdAtEd MANAGEMENt REPoRtMARKEt REVIEW
PurchasingPALFINGER endeavours to keep inventory levels as low as possible. one of its main strategic goals is to be able to quickly and flexibly respond to changes in the extremely volatile market. Particularly in the last months of 2012, uncertainty regarding a further reduction in sales was on the rise again. In this context, the previously long delivery times of suppliers for semi-conductors were reduced as well.
Essential procurement factors for the PALFINGER Group include advanced technologies and innovation, mainly in the fields of hydraulics, electronics and high-tension steel. therefore, procurement focuses primarily on the Eu market, where these issues are strongly promoted. PALFINGER’s most important Eastern European procurement markets are Slovenia, Bulgaria, Romania and Croatia; due to the current price pressure, these countries are gaining further importance.
As a rule, in order to secure the expected future demand, PALFINGER enters into long-term agreements with its main strategic suppliers; these agreements provide for variable annual purchase quantities.
After the rapid declines in prices for raw materials in 2009, the subsequent general increase in demand for iron ore and coal led to enormous speculative increases in steel prices. In particular in the first quarter of 2012 a new upward trend in steel price development was observed. As PALFINGER had entered into master agreements early, at the end of 2011, it succeeded in cushioning a large share of these increases.
PALFINGER maintains long-term relationships with its suppliers which contributes to continuously im-proving the quality and consequently also the competitiveness of PALFINGER products. this objective is supported by quality assurance agreements entered into with around 130 main suppliers. Regular audits and evaluations identify possible deviations and risks and, if required, the suppliers are provided with the necessary assistance in the optimization process.
PALFINGER also subjects strategically important suppliers to a risk analysis at regular intervals in order to identify potential changes in stability at an early stage. thereby, changes in delivery performance are also identified early. this process contributes to PALFINGER’s goal of maintaining a stable and top-quality portfolio of suppliers.
In 2011, PALFINGER implemented a Code of Conduct for all suppliers, which provides for a commitment to environmental protection and social responsibility as well as economic ethics. A passage referring to this Code was incorporated into all contracts in 2012; important points include, among others, the pro-hibition of child labour, human rights violations and corruption. Compliance is checked in the course of audits.
Supplier relationships are enhanced by including ecological and social issues as well as the prevention of corruption. this helps to reduce all image and default risks that might be caused, for instance, by sup-pliers’ failure to comply with environmental requirements. In addition, PALFINGER carries out surveys among all strategic partners and suppliers regarding their environmental management systems. Since the third quarter of 2012, the results of these surveys have also been included in the quarterly assessment of suppliers.
In order to promote cooperation on a partner-like basis, PALFINGER organizes an international supplier meeting every two years to discuss the current economic situation and planned developments of the PALFINGER Group. the most recent supplier meeting conference was held in September 2012.
www.palfinger.ag Sustainability
CodeofConduct
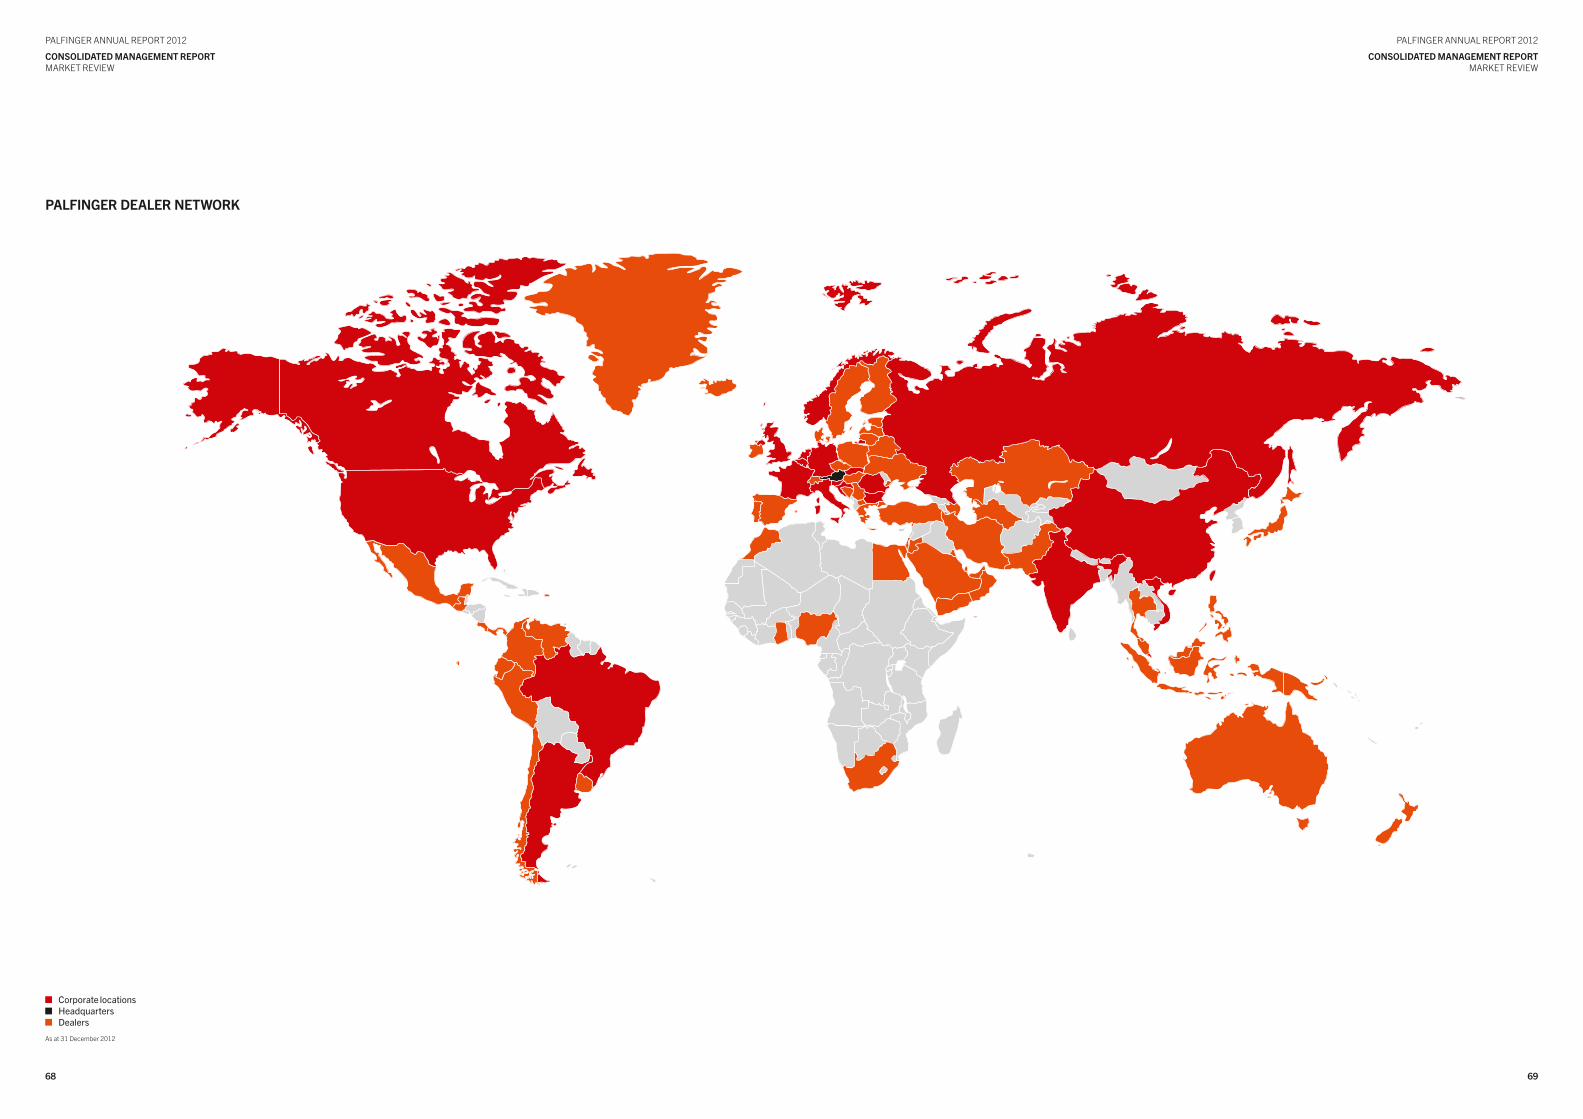
6968
PALFINGER ANNuAL REPoRt 2012
coNsoLIdAtEd MANAGEMENt REPoRtMARKEt REVIEW
PALFINGER ANNuAL REPoRt 2012
coNsoLIdAtEd MANAGEMENt REPoRtMARKEt REVIEW
CorporatelocationsHeadquartersDealers
As at 31 December 2012
PALFINGER dEALER NEtwoRk
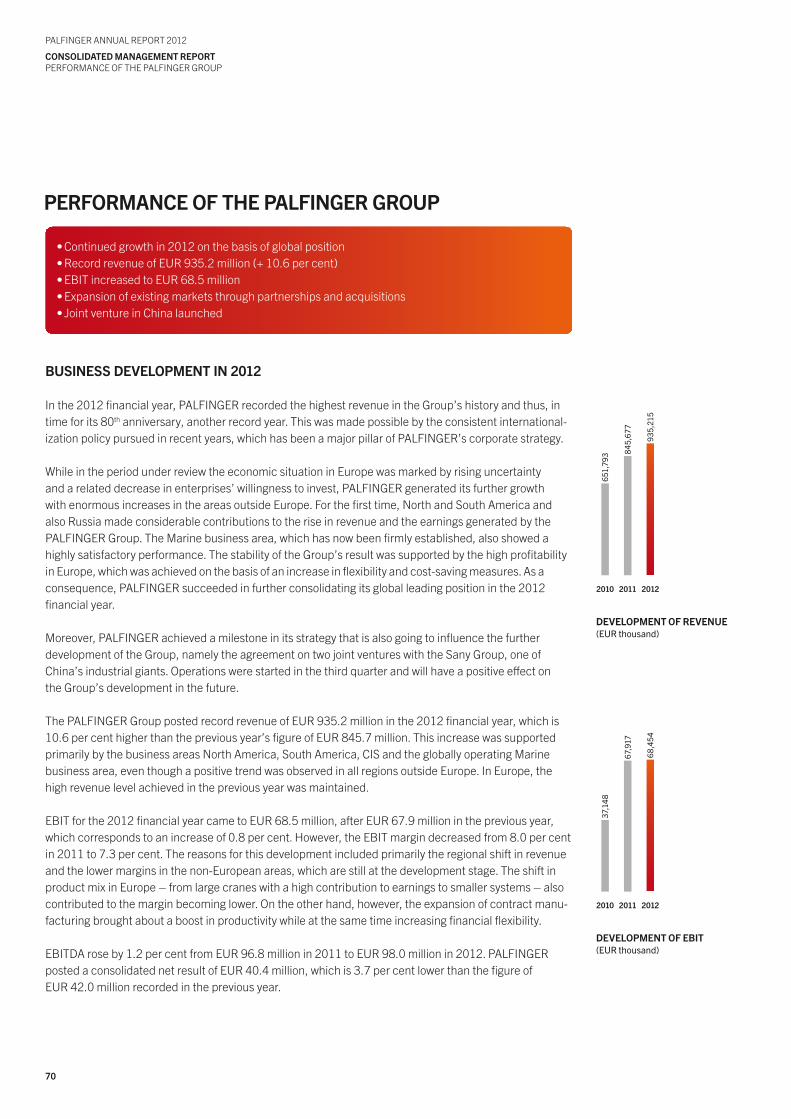
70
PALFINGER ANNuAL REPoRt 2012
coNsoLIdAtEd MANAGEMENt REPoRtPERFoRMANCE oF tHE PALFINGER GRouP
PERFoRMANcE oF thE PALFINGER GRouP
BusINEss dEVELoPMENt IN 2012
In the 2012 financial year, PALFINGER recorded the highest revenue in the Group’s history and thus, in time for its 80th anniversary, another record year. this was made possible by the consistent international-ization policy pursued in recent years, which has been a major pillar of PALFINGER’s corporate strategy.
While in the period under review the economic situation in Europe was marked by rising uncertainty and a related decrease in enterprises’ willingness to invest, PALFINGER generated its further growth with enormous increases in the areas outside Europe. For the first time, North and South America and also Russia made considerable contributions to the rise in revenue and the earnings generated by the PALFINGER Group. the Marine business area, which has now been firmly established, also showed a highly satisfactory performance. the stability of the Group’s result was supported by the high profitabilityin Europe, which was achieved on the basis of an increase in flexibility and cost-saving measures. As aconsequence, PALFINGER succeeded in further consolidating its global leading position in the 2012 financial year.
Moreover, PALFINGER achieved a milestone in its strategy that is also going to influence the further development of the Group, namely the agreement on two joint ventures with the Sany Group, one of China’s industrial giants. operations were started in the third quarter and will have a positive effect on the Group’s development in the future.
the PALFINGER Group posted record revenue of EuR 935.2 million in the 2012 financial year, which is 10.6 per cent higher than the previous year’s figure of EuR 845.7 million. this increase was supported primarily by the business areas North America, South America, CIS and the globally operating Marine business area, even though a positive trend was observed in all regions outside Europe. In Europe, the high revenue level achieved in the previous year was maintained.
EBIt for the 2012 financial year came to EuR 68.5 million, after EuR 67.9 million in the previous year, which corresponds to an increase of 0.8 per cent. However, the EBIt margin decreased from 8.0 per cent in 2011 to 7.3 per cent. the reasons for this development included primarily the regional shift in revenue and the lower margins in the non-European areas, which are still at the development stage. the shift in product mix in Europe – from large cranes with a high contribution to earnings to smaller systems – also contributed to the margin becoming lower. on the other hand, however, the expansion of contract manu-facturing brought about a boost in productivity while at the same time increasing financial flexibility.
EBItDA rose by 1.2 per cent from EuR 96.8 million in 2011 to EuR 98.0 million in 2012. PALFINGER posted a consolidated net result of EuR 40.4 million, which is 3.7 per cent lower than the figure of EuR 42.0 million recorded in the previous year.
651
,793
845
,677
935
,215
2010 2011 2012
dEVELoPMENt oF REVENuE(euR thousand)
37,
148
67,
917
68,
454
2010 2011 2012
dEVELoPMENt oF EBIt(euR thousand)
•Continuedgrowthin2012onthebasisofglobalposition•RecordrevenueofEUR935.2million(+10.6percent)•EBITincreasedtoEUR68.5million•Expansionofexistingmarketsthroughpartnershipsandacquisitions•JointventureinChinalaunched
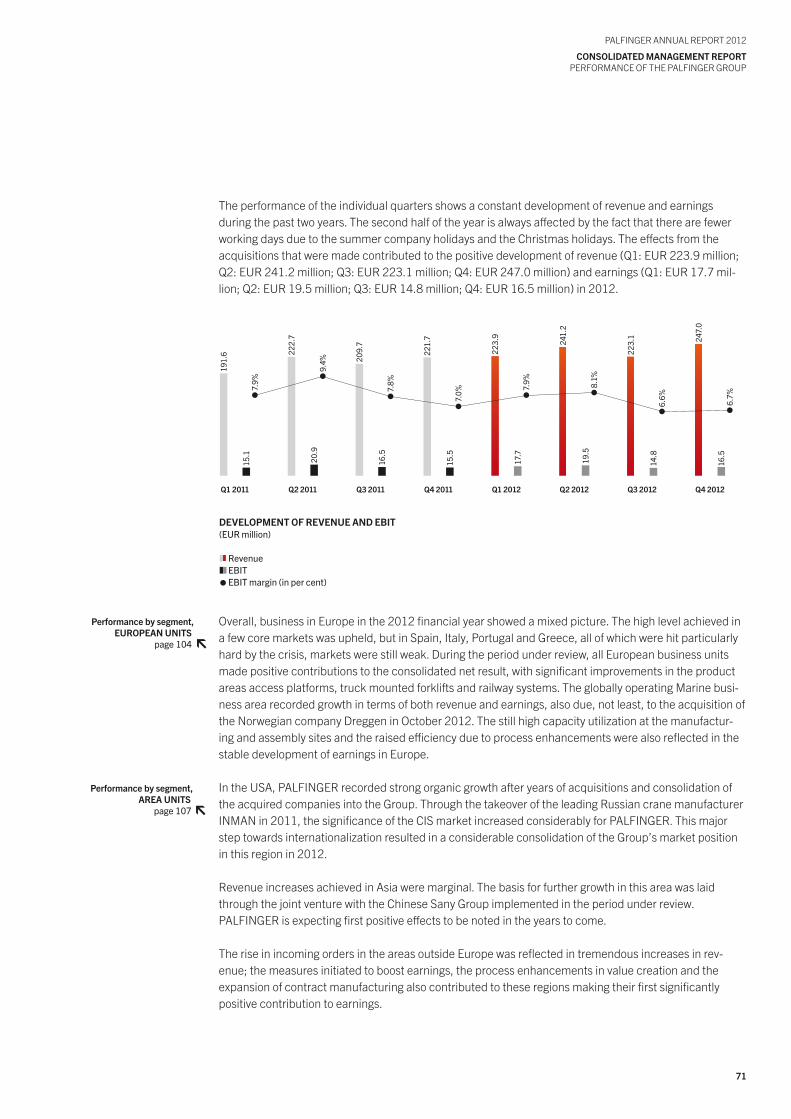
71
PALFINGER ANNuAL REPoRt 2012
coNsoLIdAtEd MANAGEMENt REPoRtPERFoRMANCE oF tHE PALFINGER GRouP
the performance of the individual quarters shows a constant development of revenue and earningsduring the past two years. the second half of the year is always affected by the fact that there are fewer working days due to the summer company holidays and the Christmas holidays. the effects from the acquisitions that were made contributed to the positive development of revenue (Q1: EuR 223.9 million; Q2: EuR 241.2 million; Q3: EuR 223.1 million; Q4: EuR 247.0 million) and earnings (Q1: EuR 17.7 mil-lion; Q2: EuR 19.5 million; Q3: EuR 14.8 million; Q4: EuR 16.5 million) in 2012.
overall, business in Europe in the 2012 financial year showed a mixed picture. the high level achieved in a few core markets was upheld, but in Spain, Italy, Portugal and Greece, all of which were hit particularly hard by the crisis, markets were still weak. During the period under review, all European business units made positive contributions to the consolidated net result, with significant improvements in the product areas access platforms, truck mounted forklifts and railway systems. the globally operating Marine busi-ness area recorded growth in terms of both revenue and earnings, also due, not least, to the acquisition of the Norwegian company Dreggen in october 2012. the still high capacity utilization at the manufactur-ing and assembly sites and the raised efficiency due to process enhancements were also reflected in the stable development of earnings in Europe.
In the uSA, PALFINGER recorded strong organic growth after years of acquisitions and consolidation of the acquired companies into the Group. through the takeover of the leading Russian crane manufacturer INMAN in 2011, the significance of the CIS market increased considerably for PALFINGER. this major step towards internationalization resulted in a considerable consolidation of the Group’s market position in this region in 2012.
Revenue increases achieved in Asia were marginal. the basis for further growth in this area was laid through the joint venture with the Chinese Sany Group implemented in the period under review. PALFINGER is expecting first positive effects to be noted in the years to come.
the rise in incoming orders in the areas outside Europe was reflected in tremendous increases in rev-enue; the measures initiated to boost earnings, the process enhancements in value creation and the expansion of contract manufacturing also contributed to these regions making their first significantly positive contribution to earnings.
Performance by segment,EuRoPEAN uNIts
page 104
Performance by segment,AREA uNIts
page 107
dEVELoPMENt oF REVENuE ANd EBIt(EURmillion)
Revenue EBIT EBITmargin(inpercent)
191
.6
15.
1
222
.7
20.
9
209
.7
16.
5
221
.7
15.
5
223
.9
17.
7
241
.2
19.
5
223
.1
14.
8
247
.0
16.
5
Q1 2011 Q2 2011 Q3 2011 Q4 2011 Q1 2012 Q2 2012 Q3 2012 Q4 2012
7.9
%
9.4
%
7.8
%
7.0
% 7.9
%
8.1
%
6.6
%
6.7
%
72
PALFINGER ANNuAL REPoRt 2012
coNsoLIdAtEd MANAGEMENt REPoRtPERFoRMANCE oF tHE PALFINGER GRouP
sIGNIFIcANt chANGEs
Joint ventures with the chinese sany Groupthe most important event in the 2012 financial year was the signing, in February, of the agreements on the establishment of two joint venture companies with the Chinese heavy equipment manufacturer Sany Group. Sany Palfinger SPV Equipment Co., Ltd., with its registered office in China, develops and produces PALFINGER products for the Chinese market. After only six months, the competent authorities gave their approval to this joint venture in the third quarter. As intense preparations had been made, operations were started shortly after approval, and the first truck mounted telescopic crane models have already been sold. At the end of 2012, the first three knuckle boom crane models adjusted to the regional market were launched.
For the time being, production is being carried out at the existing Sany plant in Ningxiang. Planning is underway for the construction of a separate plant with production capacities for approx. 10,000 cranes. the property for this plant has already been purchased; it has an area of 200,000 m2. Within the next few years, investments of approx. EuR 100 million will be made.
During the same period, Palfinger Sany International Mobile Cranes Sales GmbH was founded in Austria to distribute mobile cranes produced by Sany in Europe and CIS.
Expansion of product portfolio for south AmericaIn September, PALFINGER agreed to take over a 100 per cent share in tercek usinagem de Precisão Ltda.,headquartered in Caxias do Sul, Brazil, thereby strengthening PALFINGER’s market presence in South America. tercek develops electric-powered bus lifts under the brand name Líbero. Good market growth is expected for this product segment in connection with the further expansion of the infrastructure. More-over, from 2014 onwards, all municipal buses will be statutorily required to be equipped with a bus lift for passengers with limited mobility. the company was looking for a strong partner so as to be able to fund market penetration and expected growth. the transaction was closed in october 2012.
Future market marine businessAt the end of october 2012, PALFINGER reached another milestone, this time for the globally operatingMarine business area. the acquisition of the Norwegian Bergen Group Dreggen AS (Dreggen), a renownedmanufacturer of marine and offshore cranes, is an important growth step that will open up additionalopportunities and new markets to the Group in these areas. Dreggen specializes in tailor-made crane solutions for the shipbuilding, oil and gas industries. In 2012, the company generated revenue of approx. EuR 25 million.
through the integration of Dreggen, the portfolio of this area will be further expanded and its dynamic development will be accelerated. therefore, in order to expedite full integration and realize synergies,the Management Board has agreed with Palfinger systems GmbH on an early payment of the purchase price share for the marine unit taken over in 2010, which would originally have been due in 2016.
Enhancing flexibilityAs markets continued to be highly volatile in 2012, only short-term predictions of corporate developments were possible, which posed a major challenge. A further increase in flexibility had already been defined as the third strategic pillar of the PALFINGER Group in 2010. the Group’s strategic decisions are thus influenced by the goal of further enhancing flexibility in all corporate areas.
73
PALFINGER ANNuAL REPoRt 2012
coNsoLIdAtEd MANAGEMENt REPoRtPERFoRMANCE oF tHE PALFINGER GRouP
In october 2012, PALFINGER issued a promissory note loan payable in several tranches and was thus able to optimize its financing. Interest in the issue was substantial, and as a result a total volume of EuR 77.5 million was specified. the issue contributed to an increased diversification of financing partners, at the same time leveraging on the historically favourable interest rates.
InnovationCore innovation targets in 2012 included the continued development of a new crane series, enhance-ments in large-scale cranes and access platforms, the revision of the North American truck-mounted forklift model and regional adjustment of PALFINGER’s products to the Asian market. In electronics and mechatronics, the further development of which is a substantial success factor for PALFINGER, new structures have been established and first successes achieved.
Relocation of headquartersAs a consequence of the growth achieved in recent years, the dimensions of the PALFINGER Group’s present headquarters in Salzburg, Austria, have been too small for some time now. In March 2012, PALFINGER finalized the purchases and purchase options for the plots of land on which modern Group headquarters will be built in the years to come. the new headquarters in Bergheim, Salzburg, will not be far from the present location, and the employees are scheduled to move into the new building at the end of 2014.
the premises accommodating the present headquarters in Salzburg were sold to the highest bidder,a company owned by the majority shareholder.
At the manufacturing and assembly site in tenevo, Bulgaria, a new production hall was opened.this also resulted in a restructuring of the entire production process. the technical maximum capacity – for PALFINGER products and external customers – was thereby extended by almost 50 per cent. At the same time, the new system allows for the production of a substantially more demanding product portfolio and a larger variety of cylinder types. At the Delnice site in Croatia, the production hall was expanded, facilitating the successful consolidation of the two plants in Rijeka and Delnice in the third quarter.
strengthening market presenceIn 2012, the market presence of the PALFINGER Group was fully revised and thus strengthened. the core measure was a Group-wide brand project with a view to clearly structuring the multitude of different prod-uct brands that had resulted from the growth achieved in recent years. Henceforth, almost all products will be marketed under the umbrella brand of PALFINGER. the transition will be gradually implemented and will result in numerous synergies on the market. A strong brand is a major factor for success, in parti-cular in times of economic uncertainty. LIFEtIME EXCELLENCE is the promise made by PALFINGER.
the PALFINGER online project marked another step towards the Company’s “Internet future”. In the middle of 2012, PALFINGER went live with its new web presence. In a first step, the websites for some countries and a separate corporate site were launched. the gradual international roll-out to other coun-tries has been underway since then. the country websites are available at www.palfinger.com. through integrated geolocation, users are automatically directed to the website for their respective country. these websites are characterized by their focus on the end customers, with the presentation of products being given priority.
the corporate site can be accessed from all country websites as well as via its separate domainwww.palfinger.ag. It provides specific information about the Company, pertaining, for instance, toinvestor relations, sustainability, brands, services, purchasing and careers, as well as a virtual plant tour.
Research, developmentand innovation
page 88
the PALFINGER brandpage 23
www.palfinger.comwww.palfinger.ag
74
PALFINGER ANNuAL REPoRt 2012
coNsoLIdAtEd MANAGEMENt REPoRtPERFoRMANCE oF tHE PALFINGER GRouP
LEGAL chANGEs wIthIN thE PALFINGER GRouP
on 28 February 2012, the agreements on the establishment of two joint venture companies with the Chinese heavy equipment manufacturer Sany Group Co., Ltd. were signed: on 21 August 2012, Sany Palfinger SPV Equipment Co., Ltd. was founded in Changsha, China. Palfinger Asia Pacific Pte. Ltd. holds a 50 per cent interest in the new company. Palfinger Sany International Mobile Cranes Sales GmbH was established as an international sales and services company with its registered seat in Salzburg. It will distribute Sany’s mobile cranes in Europe and CIS. Palfinger European units GmbH holds a 50 per cent interest in the company, which was entered into the commercial register on 4 September 2012.
under the articles of association dated 13 February 2012, Palfinger Marine- und Beteiligungs-GmbH, Salzburg, founded Palfinger Marine Services B.V., Elst, Netherlands, as a wholly-owned subsidiary.
under the articles of association dated 6 June 2012, PALFINGER AG, Salzburg, founded the wholly-owned subsidiary PalAir GmbH, Salzburg.
on 22 June 2012, Guima Palfinger S.A.S. sold all its shares in Guima France S.A.S. to the associated company Palfinger France S.A.
on 12 July 2012, Fast RSQ B.V., Barneveld, Netherlands, founded Fast RSQ Vietnam Co., Ltd., Hung yen, Vietnam, for the purpose of taking up the production of Fast RSQ products.
on 17 September 2012, the sales contract on the takeover of 100 per cent of the shares in theBrazilian company tercek usinagem de Precisão Ltda. by the newly founded company Madal Palfinger Holding Ltda. was signed. this company develops electric-powered bus lifts, which have excellentproduct features, under the brand name Líbero. the acquisition was closed on 22 october 2012. onthe same day, the company was renamed Palfinger-tercek Indústria de Elevadores Veiculares Ltda.
under PALFINGER’s project to optimize the Group’s structure, its organizational structure under com-pany law has been adjusted to the current management structure and the Group has been subdivided into investment companies and operating companies. For this reason, on 25 June 2012, PalfingerMarine- und Beteiligungs-GmbH, Salzburg, transferred Palfinger uSA, Inc., tiffin, uSA, and its subsidiar-ies to Palfinger North America GmbH, Salzburg, and also transferred Madal Palfinger S.A., Caxias do Sul, Brazil, to Palfinger South America GmbH, Salzburg.
In addition, with effect as of 14 September 2012, Palfinger Marine- und Beteiligungs-GmbH, Salzburg, transferred 100 per cent of the shares in Palfinger, Inc., Niagara Falls, Canada, to Palfinger NorthAmerica GmbH, Salzburg, and 49 per cent of the shares in Palfinger Russland GmbH, Salzburg, toPalfinger CIS GmbH, Salzburg. As a consequence, Palfinger CIS GmbH now holds an 80 per cent interest in Palfinger Russland GmbH.
on 17 September 2012, Palfinger Europe GmbH, Salzburg, sold 90 per cent of the shares in Palfinger Platforms GmbH, Krefeld, Germany, to MBB Palfinger GmbH, Ganderkesee, Germany. Subsequently,on 20 September 2012, Palfinger Europe GmbH transferred, in several steps, 90 per cent of the sharesin Palfinger GmbH, Ainring, Germany, to Palfinger Platforms GmbH. As a consequence, PalfingerEurope GmbH now holds a 10 per cent interest in Palfinger Platforms GmbH and a 10 per cent interest inPalfinger GmbH. MBB Palfinger GmbH now holds 90 per cent of the shares in Palfinger Platforms GmbH, which in turn has a 90 per cent stake in Palfinger GmbH.
on 18 December 2012, Palfinger Marine- und Beteiligungs-GmbH, as the sole shareholder, transferred 100 per cent of its shares in Palfinger Asia Pacific Ptd. Ltd., Singapore, to Palfinger Area units GmbH.
75
PALFINGER ANNuAL REPoRt 2012
coNsoLIdAtEd MANAGEMENt REPoRtPERFoRMANCE oF tHE PALFINGER GRouP
on 30 october 2012, the contract for the acquisition of 100 per cent of the shares in the Norwegian Bergen Group Dreggen AS was signed with a view to expanding the marine business. the transaction was closed on 27 November 2012. on the same day, an extraordinary general meeting was held, at which it was resolved that the company’s name would be changed to Palfinger Dreggen AS.
NDM Romania S.r.l. was liquidated with effect as of 27 December 2012.
INFoRMAtIoN AccoRdING to sEc. 243A oF thE BusINEss codE
As at 31 December 2012, the issued share capital of PALFINGER AG was EuR 35.7 million, divided into 35,730,000 no-par-value bearer shares. Each PALFINGER share entitles its holder to one vote.
As at 31 December 2012, PALFINGER AG held 340,590 own shares.
PALFINGER AG is not aware of any restrictions regarding the voting rights of the PALFINGER shares and their transferability, including restrictions agreed upon between shareholders.
As at 31 December 2012, the Palfinger family directly or indirectly held approx. 65 per cent of the shares in PALFINGER AG. More than 5 per cent of the shares were held by Delta Lloyd Asset Management NV. Around 29 per cent of the PALFINGER shares were in free float.
there are no PALFINGER shares with special rights of control.
Within the PALFINGER Group there is no employee stock option programme under which the employees do not directly exercise their voting rights for their shares in PALFINGER AG.
the Articles of Association do not contain any provisions on the appointment of the members of theManagement Board and the Supervisory Board or on amendments to the Articles of Association thatexceed the scope of the respective statutory provisions.
the agreements on the promissory note loans contain change of control clauses.
No agreement on compensation in the event of a public takeover bid has been entered into between PALFINGER AG and the members of the Management Board and the Supervisory Board.
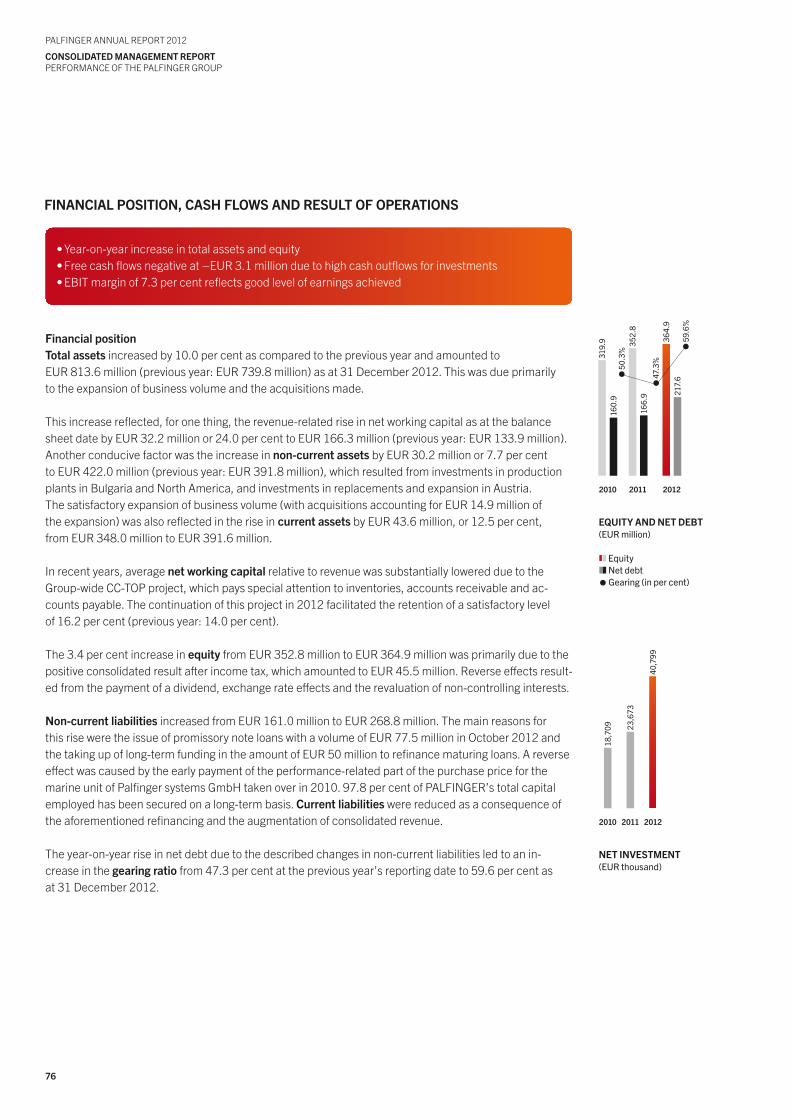
76
PALFINGER ANNuAL REPoRt 2012
coNsoLIdAtEd MANAGEMENt REPoRtPERFoRMANCE oF tHE PALFINGER GRouP
FINANcIAL PosItIoN, cAsh FLows ANd REsuLt oF oPERAtIoNs
Financial positiontotal assets increased by 10.0 per cent as compared to the previous year and amounted toEuR 813.6 million (previous year: EuR 739.8 million) as at 31 December 2012. this was due primarilyto the expansion of business volume and the acquisitions made.
this increase reflected, for one thing, the revenue-related rise in net working capital as at the balance sheet date by EuR 32.2 million or 24.0 per cent to EuR 166.3 million (previous year: EuR 133.9 million). Another conducive factor was the increase in non-current assets by EuR 30.2 million or 7.7 per centto EuR 422.0 million (previous year: EuR 391.8 million), which resulted from investments in production plants in Bulgaria and North America, and investments in replacements and expansion in Austria. the satisfactory expansion of business volume (with acquisitions accounting for EuR 14.9 million of the expansion) was also reflected in the rise in current assets by EuR 43.6 million, or 12.5 per cent, from EuR 348.0 million to EuR 391.6 million.
In recent years, average net working capital relative to revenue was substantially lowered due to the Group-wide CC-toP project, which pays special attention to inventories, accounts receivable and ac-counts payable. the continuation of this project in 2012 facilitated the retention of a satisfactory levelof 16.2 per cent (previous year: 14.0 per cent).
the 3.4 per cent increase in equity from EuR 352.8 million to EuR 364.9 million was primarily due to the positive consolidated result after income tax, which amounted to EuR 45.5 million. Reverse effects result-ed from the payment of a dividend, exchange rate effects and the revaluation of non-controlling interests.
Non-current liabilities increased from EuR 161.0 million to EuR 268.8 million. the main reasons forthis rise were the issue of promissory note loans with a volume of EuR 77.5 million in october 2012 and the taking up of long-term funding in the amount of EuR 50 million to refinance maturing loans. A reverse effect was caused by the early payment of the performance-related part of the purchase price for the marine unit of Palfinger systems GmbH taken over in 2010. 97.8 per cent of PALFINGER’s total capital employed has been secured on a long-term basis. current liabilities were reduced as a consequence of the aforementioned refinancing and the augmentation of consolidated revenue.
the year-on-year rise in net debt due to the described changes in non-current liabilities led to an in-crease in the gearing ratio from 47.3 per cent at the previous year’s reporting date to 59.6 per cent asat 31 December 2012.
18,
709
23,
673
40,
799
2010 2011 2012
NEt INVEstMENt (euR thousand)
EQuIty ANd NEt dEBt (EURmillion)
Equity Netdebt Gearing(inpercent)
2010 2011 2012
160
.9 3
19.9
166
.9 3
52.8
217
.6 3
64.9
59.
6%
47.
3% 50.
3%
•Year-on-yearincreaseintotalassetsandequity•Freecashflowsnegativeat–EUR3.1millionduetohighcashoutflowsforinvestments•EBITmarginof7.3percentreflectsgoodlevelofearningsachieved
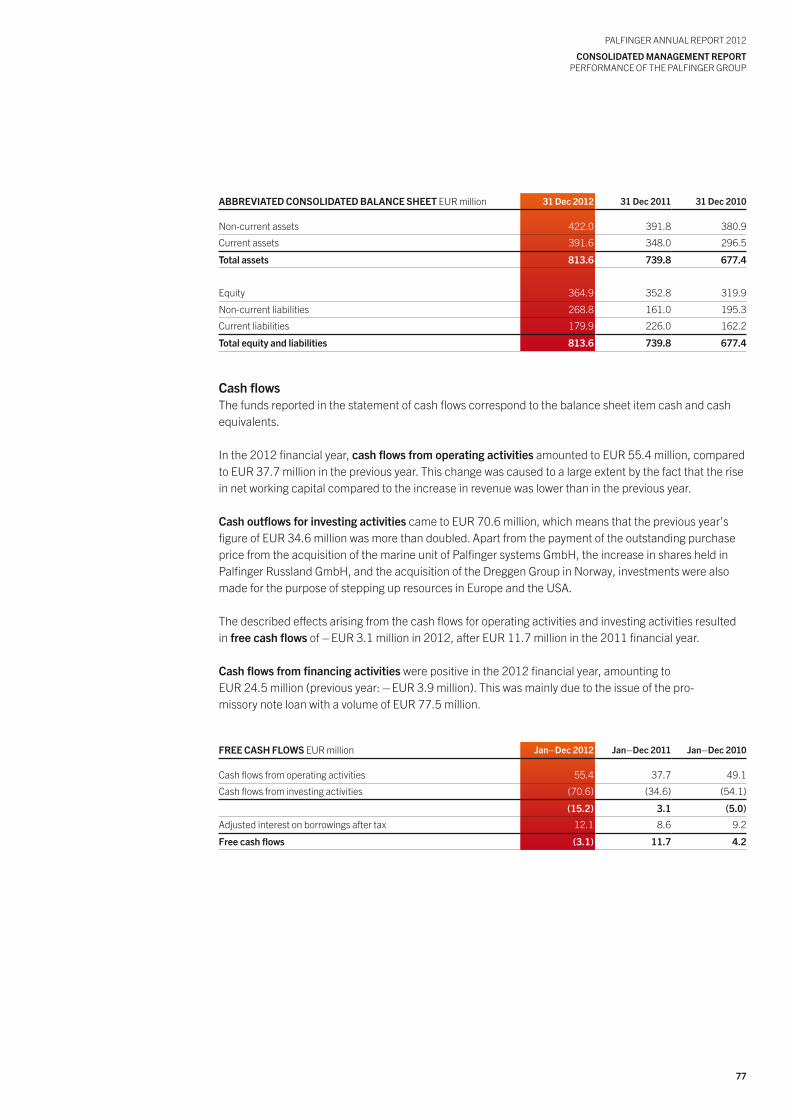
77
PALFINGER ANNuAL REPoRt 2012
coNsoLIdAtEd MANAGEMENt REPoRtPERFoRMANCE oF tHE PALFINGER GRouP
ABBREVIAtEd coNsoLIdAtEd BALANcE shEEt EuR million 31 dec 2012 31 dec 2011 31 dec 2010
Non-current assets 422.0 391.8 380.9
Current assets 391.6 348.0 296.5
total assets 813.6 739.8 677.4
Equity 364.9 352.8 319.9
Non-current liabilities 268.8 161.0 195.3
Current liabilities 179.9 226.0 162.2
total equity and liabilities 813.6 739.8 677.4
cash flowsthe funds reported in the statement of cash flows correspond to the balance sheet item cash and cash equivalents.
In the 2012 financial year, cash flows from operating activities amounted to EuR 55.4 million, compared to EuR 37.7 million in the previous year. this change was caused to a large extent by the fact that the rise in net working capital compared to the increase in revenue was lower than in the previous year.
cash outflows for investing activities came to EuR 70.6 million, which means that the previous year’s figure of EuR 34.6 million was more than doubled. Apart from the payment of the outstanding purchase price from the acquisition of the marine unit of Palfinger systems GmbH, the increase in shares held in Palfinger Russland GmbH, and the acquisition of the Dreggen Group in Norway, investments were also made for the purpose of stepping up resources in Europe and the uSA.
the described effects arising from the cash flows for operating activities and investing activities resulted in free cash flows of – EuR 3.1 million in 2012, after EuR 11.7 million in the 2011 financial year.
cash flows from financing activities were positive in the 2012 financial year, amounting toEuR 24.5 million (previous year: – EuR 3.9 million). this was mainly due to the issue of the pro-missory note loan with a volume of EuR 77.5 million.
FREE cAsh FLows EuR million Jan–dec 2012 Jan–dec 2011 Jan–dec 2010
Cash flows from operating activities 55.4 37.7 49.1
Cash flows from investing activities (70.6) (34.6) (54.1)
(15.2) 3.1 (5.0)
Adjusted interest on borrowings after tax 12.1 8.6 9.2
Free cash flows (3.1) 11.7 4.2
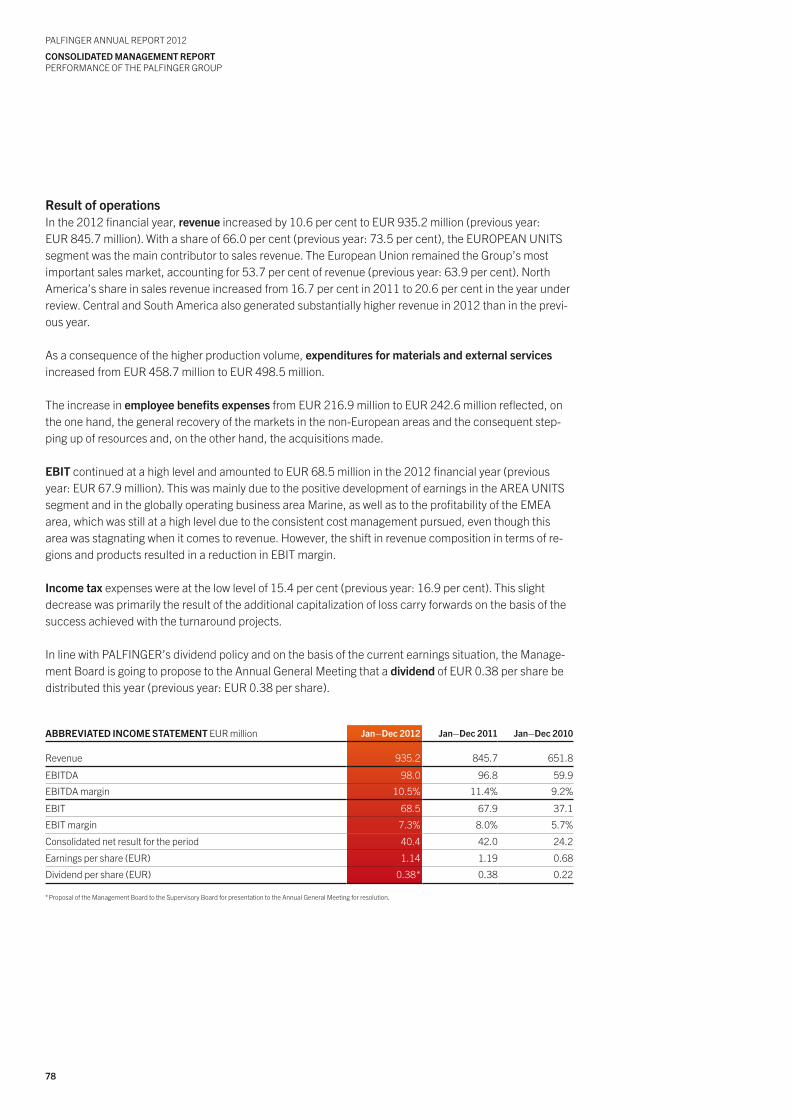
78
PALFINGER ANNuAL REPoRt 2012
coNsoLIdAtEd MANAGEMENt REPoRtPERFoRMANCE oF tHE PALFINGER GRouP
Result of operationsIn the 2012 financial year, revenue increased by 10.6 per cent to EuR 935.2 million (previous year: EuR 845.7 million). With a share of 66.0 per cent (previous year: 73.5 per cent), the EuRoPEAN uNItS segment was the main contributor to sales revenue. the European union remained the Group’s most important sales market, accounting for 53.7 per cent of revenue (previous year: 63.9 per cent). North America’s share in sales revenue increased from 16.7 per cent in 2011 to 20.6 per cent in the year under review. Central and South America also generated substantially higher revenue in 2012 than in the previ-ous year.
As a consequence of the higher production volume, expenditures for materials and external services increased from EuR 458.7 million to EuR 498.5 million.
the increase in employee benefits expenses from EuR 216.9 million to EuR 242.6 million reflected, on the one hand, the general recovery of the markets in the non-European areas and the consequent step-ping up of resources and, on the other hand, the acquisitions made.
EBIt continued at a high level and amounted to EuR 68.5 million in the 2012 financial year (previous year: EuR 67.9 million). this was mainly due to the positive development of earnings in the AREA uNItS segment and in the globally operating business area Marine, as well as to the profitability of the EMEA area, which was still at a high level due to the consistent cost management pursued, even though this area was stagnating when it comes to revenue. However, the shift in revenue composition in terms of re-gions and products resulted in a reduction in EBIt margin.
Income tax expenses were at the low level of 15.4 per cent (previous year: 16.9 per cent). this slight decrease was primarily the result of the additional capitalization of loss carry forwards on the basis of the success achieved with the turnaround projects.
In line with PALFINGER’s dividend policy and on the basis of the current earnings situation, the Manage-ment Board is going to propose to the Annual General Meeting that a dividend of EuR 0.38 per share be distributed this year (previous year: EuR 0.38 per share).
ABBREVIAtEd INcoME stAtEMENt EuR million Jan–dec 2012 Jan–dec 2011 Jan–dec 2010
Revenue 935.2 845.7 651.8
EBItDA 98.0 96.8 59.9
EBItDA margin 10.5% 11.4% 9.2%
EBIt 68.5 67.9 37.1
EBIt margin 7.3% 8.0% 5.7%
Consolidated net result for the period 40.4 42.0 24.2
Earnings per share (EuR) 1.14 1.19 0.68
Dividend per share (EuR) 0.38* 0.38 0.22
* Proposal of the Management Board to the Supervisory Board for presentation to the Annual General Meeting for resolution.
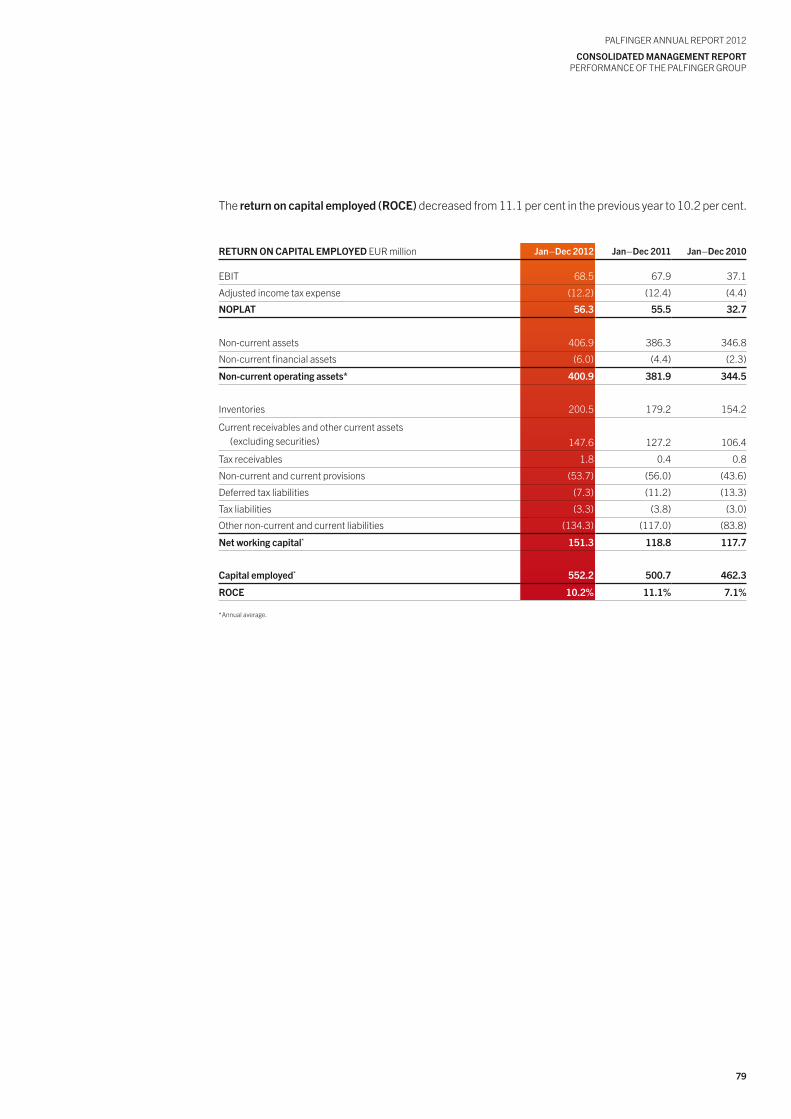
79
PALFINGER ANNuAL REPoRt 2012
coNsoLIdAtEd MANAGEMENt REPoRtPERFoRMANCE oF tHE PALFINGER GRouP
the return on capital employed (RocE) decreased from 11.1 per cent in the previous year to 10.2 per cent.
REtuRN oN cAPItAL EMPLoyEd EuR million Jan–dec 2012 Jan–dec 2011 Jan–dec 2010
EBIt 68.5 67.9 37.1
Adjusted income tax expense (12.2) (12.4) (4.4)
NoPLAt 56.3 55.5 32.7
Non-current assets 406.9 386.3 346.8
Non-current financial assets (6.0) (4.4) (2.3)
Non-current operating assets* 400.9 381.9 344.5
Inventories 200.5 179.2 154.2
Current receivables and other current assets(excluding securities) 147.6 127.2 106.4
tax receivables 1.8 0.4 0.8
Non-current and current provisions (53.7) (56.0) (43.6)
Deferred tax liabilities (7.3) (11.2) (13.3)
tax liabilities (3.3) (3.8) (3.0)
other non-current and current liabilities (134.3) (117.0) (83.8)
Net working capital* 151.3 118.8 117.7
capital employed* 552.2 500.7 462.3
RocE 10.2% 11.1% 7.1%
* Annual average.
80
PALFINGER ANNuAL REPoRt 2012
coNsoLIdAtEd MANAGEMENt REPoRtPERFoRMANCE oF tHE PALFINGER GRouP
tREAsuRy
the main objective of PALFINGER’s financing guidelines is to minimize the Group’s financial expendi-tures while at the same time ensuring that sufficient liquidity reserves are available so as to be able to meet payment obligations of the Group at any time.
Cash inflows from operating activities form the most important source of funding. Moreover, PALFINGER’s in-house banking scheme makes a valuable contribution to reducing the Group’s net interest expense. Excess liquid funds of Group companies are used to reduce the need for external financing. In addition, by balancing Group-internal transactions via clearing accounts, external bank transactions and banking charges are reduced.
other significant corporate treasury responsibilities include the effective management of foreign ex-change and interest risks, and central control of global insurance solutions.
the individual processes are laid down in the Group’s treasury guidelines. All processes are transparent and traceable; every single measure is documented and supported by state-of-the-art It infrastructure.
cash and liquidity managementthe sovereign debt crisis in the euro area did not subside in 2012, and the money markets and capital markets remained highly volatile. PALFINGER’s greatest priority is to ensure the sufficient liquidity supply of the Group and to increase its financial flexibility through additional financing sources.
the solvency of the PALFINGER Group at any time was guaranteed by maintaining liquidity reserves, agreeing on long-term financing agreements and increasing and extending approved credit lines.
When concluding financing agreements, increased attention was paid to the long-term availability of liquidity. In order to diversify risk, the credit volume is distributed among several banking partners so asto remain independent from individual lenders.
the issue of a promissory note loan in october 2012 enabled PALFINGER to further diversify its funding, while at the same time profiting from the all-time low interest rate levels.
In order to finance investments and acquisitions, long-term loans were entered into with several banking partners in the past financial year.
81
PALFINGER ANNuAL REPoRt 2012
coNsoLIdAtEd MANAGEMENt REPoRtPERFoRMANCE oF tHE PALFINGER GRouP
RIsk REPoRt
PALFINGER is aware of the fact that a functioning opportunities and risk management system plays an important role in maintaining and expanding competitive advantages. the aim is to use a systematic approach to identify opportunities and risks at an early stage so as to be able to proactively respond to changing framework conditions.
the basic components of the risk management system set up by the PALFINGER Group are standardized Group-wide planning and controlling processes and inter-company guidelines and reporting systems. the risk management process is described and set forth in a Group guideline. the viability and effective-ness of the process are checked and scrutinized at regular intervals.
the direct responsibility for risk management lies with the head of each operating unit. this is the level at which any issues pertaining to risks are regularly noted and evaluated. Corporate risk management reports directly to the Management Board, which bears overall responsibility.
Risk management systemthe management of the individual corporate areas and business units periodically identifies and evalu-ates the most important opportunities and risks along the process chain, also taking external factors into consideration. the evaluation of these opportunities and risks is carried out with a view to their possible impacts on the results and the probability of their occurrence, and uses a clearly structured, Group-wide, uniform method. on the basis of this analysis, existing measures are documented and further measures for active risk control are developed and implemented. the corporate risk management department also carries out periodic checks in order to make sure that the planned measures are implemented within the set deadlines.
the internal auditing department monitors adherence to the relevant statutory provisions and the Group’s internal guidelines. It also examines the general functionality of the risk management system with respect to the early identification of risks that might jeopardize the continued existence of the Company. Short-term risk issues are covered by the monthly reporting in controlling and by periodic meetings of the steer-ing committees of the business divisions.
Risk issuesthe current risk exposure of the PALFINGER Group is strongly influenced by developments in the market. Europe’s debt crisis has had a detrimental impact on the order books. At the same time, measures to promote the further internationalization of the Group present PALFINGER with the challenge of meeting various legal and cultural requirements in the respective countries. the establishment and expansion of the young business units and/or areas harbours the risk of increasing complexity.
A key success factor for PALFINGER is the ability to make quick adjustments and decisions on the basis of solid data. under its Group-wide risk management system, PALFINGER divides its risk areas into four main categories:
•Externalrisks•Strategicrisks•Internalrisksrelatingtovaluecreation•Internalrisksrelatingtosupportingprocesses
82
PALFINGER ANNuAL REPoRt 2012
coNsoLIdAtEd MANAGEMENt REPoRtPERFoRMANCE oF tHE PALFINGER GRouP
ExTERNALRISkSEconomicdevelopmentsthe debt crisis in Europe and the related uncertainty in the markets have increased the volatility of incoming orders and are also reflected in a partially lower utilization of the European production plants. PALFINGER has been meeting this impact of the economy on the Company’s risks and opportunities through flexible value-creation processes adjusted to the market situation, as well as by utilizing new sales opportunities, e.g. through manufacturing for third parties.
Germany and France are important sales markets for PALFINGER. Consequently, a decrease in market demand in these countries has severe repercussions on PALFINGER’s performance. through stronger internationalization and the expansion of the Company’s young business areas, such as the Marine business area, dependence on core markets is being reduced and sustainable growth targeted.
China, the economic powerhouse, may also impact the European sales market. Like other industries, the European knuckle boom crane sector could see PALFINGER’s competitors being taken over by large Chinese corporations, thereby securing access to the current core markets. these developments would massively change the competitive environment. the establishment of the joint venture with Sany is designed to promote the development of the Chinese market, while at the same time giving PALFINGER a lead over its Chinese competitors in the existing core markets.
Even though PALFINGER occupies an excellent position, there is the fundamental balance-sheet risk that, should the market environment deteriorate again, individual capitalized intangible assets will have to be further adjusted to the changed valuations (impairment) or that investments may not amortize as planned.
Politicaldevelopmentsthe political landscape in Europe was put to the test in 2011 and 2012, and the confidence placed by the financial markets in the stability of the euro area faltered. the actual scale of these developments cannot yet be predicted and constitutes a huge element of uncertainty, also for PALFINGER.
In some markets relevant to PALFINGER, such as the uSA, Brazil, Russia and China, an increased trend towards protectionism has been noticeable. PALFINGER is trying to take advantage of these develop-ments by expanding its local manufacturing capacities. And yet, trade barriers or legal framework condi-tions may, in part, entail economic risks.
Social unrest and political turmoil in individual countries raise the risk that PALFINGER could lose some of its sales markets and have to write off capital that has already been tied up.
83
PALFINGER ANNuAL REPoRt 2012
coNsoLIdAtEd MANAGEMENt REPoRtPERFoRMANCE oF tHE PALFINGER GRouP
STRATEGICRISkSStrategythe strategic guidelines of innovation, internationalization and flexibility were further pursued in the 2012 financial year. PALFINGER exploits market opportunities in order to take over appealing acquisition tar-gets after carrying out an in-depth review. the development throughout previous financial years confirms the success of this strategic approach aimed at reducing dependence on individual regions and indus-tries. However, this harbours the risk of increasing complexity.
Entering and penetrating the market in new areas brings the challenges of having to meet different legal requirements and overcome entry barriers. In order to keep delivery times as short as possible, inven-tories were built up in some areas (e.g. India, Russia), thereby running the risk of excessively locking up capital and creating obsolete inventory.
PALFINGER has lowered the entry barriers into the heavily growing sales market of China by setting up a joint venture with Sany – an endeavour that harbours the risk of initial friction losses. A focus is also being placed on controlling the necessary transfer of know-how.
the volatility of the markets has confronted PALFINGER with new challenges. the Company continues to consistently pursue its long-term strategic goals – a fundamental factor of success; short-term adjust-ments and decisions are made on the basis of the Company’s rolling forecast and monthly coordination meetings. All relevant information provided by market players on the customer and supplier side goes into this planning process to create a data base that is as valid as possible. Nevertheless, there is a limit to the transparency of future business performance, which may lead to significant deviations in practice. Deci-sions that have a material financial effect, such as investments in site expansions, may turn out to be not so profitable afterwards. thanks to steering committees operating in a timely manner, efficient controlling and short decision-making processes, PALFINGER is quick to respond to changes in the market environment.
Productportfoliothe continuation of the ongoing integration projects in the relevant product divisions is of crucial impor-tance for the successful development of the Group. the identified potential synergies must be exploited.
Another important factor of success is the consistent continuation and sustainable consolidation of turn-around projects with effective control mechanisms. Professional project management as well as support through risk management have the object of ensuring that the targets set will be reached.
With the expansion of its marine crane business, PALFINGER has firmly established itself in a customer segment with great future potential that also supports further internationalization and profitability en-hancement.
OrganizationandcorporatecultureWithin PALFINGER’s areas, the strengthening of the individual product fields has brought about flexibility in meeting various local customer demands. At the same time, Group-wide standards have been defined, particularly in supporting areas, to allow for the use of synergies.
In addition, the common values of the PALFINGER Group – entrepreneurial spirit, respect and learning – constitute important guiding principles in day-to-day operations.
the Asian markets are going to become more significant for PALFINGER, which will require adjustments and changes to be made in the entire organization. In this connection, open-mindedness and the willing-ness to recognize, understand and especially accept other work approaches and cultures are important at all levels. Moreover, language barriers are another obstacle to be overcome.
84
PALFINGER ANNuAL REPoRt 2012
coNsoLIdAtEd MANAGEMENt REPoRtPERFoRMANCE oF tHE PALFINGER GRouP
INTERNALRISkSRELATINGTOvALUECREATIONDevelopmentPALFINGER is faced with the challenge of regularly proving its technology leadership within its industry and of adjusting new developments to the needs of the different markets. Customized solutions offered by PALFINGER’s competitors may generate a market advantage for them, while resulting in a loss of market shares for PALFINGER.
Close cooperation between the development and distribution departments and a strong regional ap-proach of the development projects are in place to ensure that PALFINGER maintains and/or further expands its status as innovation leader in compliance with strategic goals, especially in the disciplines of mechatronics and software development, which are becoming increasingly important.
Development work has fundamental consequences for the cost structure of future serial manufacturing. Highly complex products also mean a high level of complexity in value creation and consequently also high costs. At PALFINGER, process optimization starts at the development stage, thanks to successful cooperation with the subsequent value-creation levels procurement and production and PALFINGER’s focus on complexity management.
Important innovations have been secured by patents, and confidential information within the Company is protected against unauthorized access.
procurementAs regards risk minimization, the focus in procurement has shifted from liquidity issues towards exclusivity.Increasing attention is being paid to creating at least one additional procurement option, particularly in the case of strategically significant materials and parts.
In the year under review, quality, delivery times and price remained of major importance in the field of procurement. Suppliers are actively supported when it comes to making further improvements, whichalso helps to counter the risk of supply shortages. PALFINGER has implemented special supplier selectionprocedures as well as risk management and supplier management systems to monitor its suppliers’ per-formances.
productionFor PALFINGER, major value-creation phases are the manufacturing and assembly of its products. the risk of an interruption of operations and the related direct impact on the Company’s results was identified in a risk analysis. this risk has been constantly minimized by this analysis and the resulting measures taken, such as the renewal of machinery, the introduction of total Productive Maintenance processes and the optimization of the PALFINGER ProductionSystem.
PALFINGER promotes its position as market leader by upholding the top-notch quality of products and services. PALFINGER has implemented an ISo 9001 certified quality management system. Notwithstand-ing this systematic approach within PALFINGER, it is not possible to fully exclude the risk of product liability. Defects in quality, if any, are remedied in line with customer requests. the Company has insur-ance cover for potential losses; however, any detriment to PALFINGER’s image would represent a consid-erable risk for the Company.
there are risks relating to breakdowns such as interruptions of energy supply, technical failure, fire, explosions and other possible disruptions. the Company has taken out adequate insurance cover for losses caused by such interruptions of operations.
85
PALFINGER ANNuAL REPoRt 2012
coNsoLIdAtEd MANAGEMENt REPoRtPERFoRMANCE oF tHE PALFINGER GRouP
INTERNALRISkSRELATINGTOSUPPORTINGPROCESSESAccountingandfinanceDue to the ongoing financial crisis in Europe and the uSA, it is essential for PALFINGER to have a flexible capital structure. Raising capital is something that may become more difficult in the near future. the option of financing relevant growth projects from the Company’s own resources may prove to be a com-petitive advantage.
In the deteriorating economy, especially in Europe, there is also a risk of bad-debt losses. the objective of the existing accounts receivable management is to reduce credit risks in advance – an objective that be-comes increasingly significant in economically difficult times. terms of payment are agreed upon on the basis of financial information about the buyers. the risk of losses on doubtful receivables is further limited by means of bad debt insurance cover for the individual accounts receivable.
As a consequence of PALFINGER’s international business operations, there are complex liquidity risks, interest rate risks and foreign currency risks. these are controlled by the treasury department, where all relevant information from the entire Group converges.
LiquidityriskGroup-wide cash reporting guarantees the transparency required to be able to control funds in a targeted manner. thanks to medium-to-long-term planning, potential finance requirements can be coordinated with the partners at an early stage. A Group-wide project was launched in the 2009 financial year to sus-tainably reduce capital employed in order to counteract this risk. this project has been continued and has made a substantial contribution to optimizing financing.
the determination of credit limits and the amount of refinancing costs of credit institutions and banks depend on their assessment of PALFINGER’s future perspective. therefore, PALFINGER maintains close contacts with its banking partners in order to be able to give them a comprehensive picture of the current situation at all times.
Foreigncurrencyriskthrough local value creation at PALFINGER’s sites, the Group only has a limited number of foreign exchange positions. the Group makes use of natural hedges, which means that a company offsets its expenses with the sales generated by its operations in the same currency.
the supply of finished products and components from Europe to North America creates a risk position primarily in uS dollars that is not covered by natural hedges. on the basis of the ongoing analyses of this position, a hedging strategy has been established, which is evaluated at regular meetings.
PALFINGER bases all of its hedging transactions on the underlying operating item, which ensures that financial operations are carried out to reduce rather than augment the Group’s exposure. only derivative financial instruments that may be measured and reported by PALFINGER itself are used. the primary hedging instruments used are foreign exchange forwards.
86
PALFINGER ANNuAL REPoRt 2012
coNsoLIdAtEd MANAGEMENt REPoRtPERFoRMANCE oF tHE PALFINGER GRouP
Interestrateriskthe greater financing need has increased the impact that changes in interest rates have on the net finan-cial result of the PALFINGER Group, which is why hedging against interest rate risks has become increas-ingly important. this hedging applies to the floating-rate part of the financing instruments. the interest rate exposure of these loans is hedged in part by interest rate swaps and in part by interest rate caps. In the case of an interest rate swap, the floating rate is converted into a fixed rate, thus fixing the cost of interest for the term of the swap. the interest rate cap puts an upper limit on interest payments. until the interest rate cap is reached, the market interest rate is used for calculating interest payments. If the mar-ket interest rate exceeds the cap determined, PALFINGER will receive a payment from its counterparty.
Risksrelatingtothefinancialstatementclosingprocessthe necessary use of estimates and judgements in the fields of non-financial assets, deferred tax assets,measurements of inventories and receivables, provisions for pensions, severance payments and anniver-sary bonuses, as well as provisions for guarantees and warranties have a direct impact on the presenta-tion of the Group’s assets and earnings. Assessment risks may be created due to the inclusion of acquisi-tions in the balance sheet and the related evaluations of facts necessary for this purpose. the combina-tion of various booking procedures entails a certain reporting risk. A uniform Corporate Manual defining the fundamental principles of accounting and valuation used by PALFINGER ensures a standardized process and thus minimizes the risk of using different processes within the Group.
An internal control system adapted to the Company has been integrated into the accounting process.the basic cornerstones of this system, such as the segregation of duties and the four-eyes principle,have already been introduced. Audits carried out by the internal auditing department and the auditor ensure that processes are continuously improved and optimized.
HumanresourcesPALFINGER regards its employees as the major factor in successfully achieving its objectives. Special planning, ongoing staff reviews and various development programmes ensure that there will be well-trained staff to fill future open positions. In connection with the ongoing volatility of markets, the develop-ment of flexible working time models remains an important issue that will be given even greater priority in the future, with a clear focus on maintaining top-quality staff. Local conditions and demographic devel-opments may limit the availability of skilled labour for the value-creation sites. PALFINGER tries to train sufficient skilled labour by carrying out apprentice training programmes.
PALFINGER’s growth projects in Asia require that well-qualified staff from the main plants be mobile.In order to accomplish this successfully, appropriate secondment programmes, also offering post-return orientation, have been initiated.
InformationtechnologyMost of the processes within the Company rely on It. In particular, operational and strategic management decisions depend on information generated by these systems. A failure of these systems and processes poses a risk for PALFINGER. Intensive training programmes may cause higher expenses in the short term. Internal and external experts maintain and further optimize the It infrastructure across the entire Group.
the growing international commitment of the PALFINGER Group tends to increase It risks and thus calls for more measures enhancing It security. the Company also has a range of technical security and protec-tive measures in place to minimize the risks of data misuse and data loss.
In summary, the risks to which the PALFINGER Group is exposed are manageable and can be controlled by adequate measures. therefore, from today’s point of view, the continued existence of the Group is definitely ensured.
87
PALFINGER ANNuAL REPoRt 2012
coNsoLIdAtEd MANAGEMENt REPoRtPERFoRMANCE oF tHE PALFINGER GRouP
Important features of the internal control and risk management systemswith a view to accountingthe internal control system constitutes an integral part of the Group-wide risk management process in place at PALFINGER. It contains all organizational principles, measures and controls in place at the Com-pany in order to ensure the observance of guidelines and the prevention of errors and losses that may be caused by PALFINGER’s own employees or by third parties.
CONTROLENvIRONMENTPALFINGER’s internal control system is based on guidelines valid for the entire Group. these Group guidelines contain uniform standards for the relevant corporate processes and have to be implemented and observed by all units in the Group. Each guideline is allocated to one process manager. the Manage-ment Board, local management, the process managers and the internal auditing department have collec-tive responsibility for ensuring that each relevant unit verifies the observance of the Group guidelines at periodic intervals.
RISkEvALUATIONthe identification of risks and their evaluation are contained in the risk report.
CONTROLSthe Group guidelines define not only the substance of these parameters but also the internal controls that, from a Group perspective, need to be implemented in local processes. the responsible manage-ment teams are in charge of laying down additional controls should the need arise. thus it is ensured that, in addition to standardized processes, short-term risks are also taken into account.
INFORMATIONANDCOMMUNICATIONWith regard to the accounting process, the major accounting and valuation methods are laid down in a Corporate Manual, which is regularly updated, and these methods have to be mandatorily implemented by the local units. A Group-wide standardized monthly reporting system with an automatic interface from the ERP systems guarantees that the management team has an overview of the Group’s performance. twice a year, a report on the control system is presented to the Audit Committee of the Supervisory Board.
AUDITSANDCONTROLSQuarterly statements are consolidated and reviewed by the auditor. Close cooperation with the auditorof the consolidated financial statements, whose international network guarantees uniform auditing stan-dards, ensures a comprehensive and efficient external audit of the financial statements. thanks to the close interplay of controlling and accounting, estimates are regularly compared with results, creating a system of mutual control and coordination. the information of internal and external accounting is based on the same stock of data and is reconciled with accounting on a monthly basis.
It has been agreed with the Audit Committee of the Supervisory Board that the internal control system of PALFINGER AG is adequate. However, continuous efforts are being made to raise the effectiveness, effi-ciency and precision of the entire system. Internal control is monitored through regular reports presented to the Audit Committee and through checks made by the internal auditing department, which closely cooperates with the responsible Management Board members and managing directors.
Risk reportpage 81
88
PALFINGER ANNuAL REPoRt 2012
coNsoLIdAtEd MANAGEMENt REPoRtPERFoRMANCE oF tHE PALFINGER GRouP
REsEARch, dEVELoPMENt ANd INNoVAtIoN
the PALFINGER brand stands for innovative, reliable and cost-effective lifting solutions – for LIFEtIME EXCELLENCE. In order to maintain and expand its leadership in the fields of technology and service, PALFINGER is boosting targeted, sustainable research and development as well as innovations in products, systems and processes.
PALFINGER’s Group-wide research and development centre, which houses numerous centres of excel-lence, is located at the Austrian business location in Köstendorf. Additional R&D departments have been established at various international sites.
Following the expansion of the R&D centre in Köstendorf, the development of the marine and wind cranes of the Marine business area was also integrated into the same site in 2012, facilitating a better use of synergies when developing modular products relating to more than one business unit.
In the period under review, PALFINGER also implemented a global product management structure in the fields of loader cranes and container handling systems, which specifies a joint development roadmap for the product portfolio and technologies. thereby, standardization and modularity can be better taken into account in local product planning and modular component kits can be developed and used.
the centres of excellence and the use of uniform manufacturing and production standards enable PALFINGER to optimally cater to local requirements even in the case of development projects across different business areas. In 2012, this proved particularly successful in the joint development of cylinders for Russia and South America.
the software for the management of product data and product lifecycles introduced in 2011 was expanded to cover additional units in 2012 and was also implemented at the Sany Palfinger joint venture company. Moreover, PALFINGER has been continuing with its full transition to 3D software.
Since 2012, with a view to generating added value in terms of the transition from development to manu-facturing, value analyses have been carried out parallel to target costing in order to support sourcing. Since 2011, PALFINGER’s strategic innovation focus has been placed on further development in the fields of electronics and mechatronics.
Value creationpage 93
•GlobalR&Dstructuresfacilitatespecificdevelopmentusingsynergies•Numerousnewproductmodelsin2012;64activepatents•R&Dactivitiesalsoincludeenhancementofcustomerservice•Cooperationprojectswitheducationalinstitutionsandalongtheentirevalue-creationchain
promote exchange and further development
89
PALFINGER ANNuAL REPoRt 2012
coNsoLIdAtEd MANAGEMENt REPoRtPERFoRMANCE oF tHE PALFINGER GRouP
MechatronicsIn the future, mechatronic systems will be contributing increasingly to product differentiation. they make PALFINGER products more user-friendly and consequently also expand their range of application. there-fore, starting at the R&D location in Köstendorf, a general framework has been created to interconnect the R&D organization of the PALFINGER Group accordingly.
the establishment of certified processes to develop security-oriented software was given priority status in 2012. As the use of mechatronics increases, internal quality management in this area comes to the fore as well. It covers development processes, the release of sensors and components as well as installation, setting and maintenance at the dealers.
Patents and ideasthe PALFINGER Group currently holds 64 active patents, utility models and special registered designs for the protection of functional design elements. Seven additional patents have been applied for.
In 2012, PALFINGER invested EuR 21.5 million in research and development, which corresponds to 2.3 per cent of the Company’s total revenue.
developments in 2012
LOADERCRANESFive new models were added to the SH crane series introduced to the market in 2010. PALFINGER now offers products for the entire segment from 10 mt (metre tonnes) to 110 mt. Moreover, all SH models can be delivered ex works as EN 280 workman basket cranes. In combination with the HPSC stability system developed by PALFINGER, this makes the positioning of stabilizers fully variable, even in workman basket operation. therefore, even if space for the stabilizers is limited, all safety requirements are met and new applications become possible for customers. For wholesale customers outside Europe, the product range was expanded by three additional models in the 27 mt to 40 mt range.
Moreover, since 2012, PALFINGER has been working on the development of a completely new crane series, which will include numerous new features. the launch of the first model is scheduled for 2014.
In the uSA, the first three models of a new service crane series were introduced to the market in 2010. In 2012, five additional models in the range of up to 10 mt were added, all of which were fully developed in the uSA. this made it possible to take into account local requirements and procurement options draw-ing on the extensive crane know-how of PALFINGER. the new models are available either as electrically-operated or hydraulic versions.
EPSILONTIMBERANDRECyCLINGCRANESIn 2012, the first EPSILoN harvester crane model was placed on the market. It is an absolute market novelty, as all electric and hydraulic lines run through an internal duct and are protected by the innovative link-rotator system “E+P Endless + Protected”.
the new tractor crane model C45F rounds out the product programme for tractor cranes at the lower end in terms of product size. the model was designed specifically for timber tractors, timber trailers and small mobile choppers and is equipped with a compact boom system.
As another innovation, an online product configurator for dealers was launched.
90
PALFINGER ANNuAL REPoRt 2012
coNsoLIdAtEd MANAGEMENt REPoRtPERFoRMANCE oF tHE PALFINGER GRouP
TRUCkMOUNTEDFORkLIFTSIn this product area, PALFINGER has been focussing, since 2011, on lowering lifecycle costs, enhancing product reliability, and standardization. In 2012, the assembly line for truck mounted forklifts in Köstendorf was converted to line production.
New load holding valves are going to improve user safety. Moreover, the PX models from the fixed mast series and some of the moving mast forklift models have been fitted with additional features to increase comfort for the operators.
In North America, the newly developed Gt series was presented to the market, completing the full product range of truck mounted forklifts.
CONTAINERHANDLINGSySTEMSIn 2012, Palfinger origin Protection (PoP), which has enabled PALFINGER hookloaders to meet standards applicable in the automotive industry in terms of painting and corrosion protection, was expanded to include vehicle integration.
the new assembly kit SAM (Secured Advanced Mounting) increases the quality and life-span of the equipment through screwing technology and surface protection, taking into consideration both the truck manufacturer’s specifications and the PALFINGER assembly guidelines.
PALFINGER has developed a new CIty model for use in cities. It has a considerably lower deadweight and contributes to a significant reduction in the variance of small trucks of up to 3.5 t.
A revision of the design of the SRL line for North America resulted in a reduction of both deadweight and production costs; production processes were further improved through the continued development of internal production facilities.
In China, PALFINGER reinforced the existing R&D department for hookloaders in Shenzhen in 2012.the 8-t and 10-t telescopic devices were adjusted to the needs of the Asian markets, and the t7-J modelwas added to the product range for the Japanese market. the t5Plus-Pl model was developed specifi-cally for markets in India, China, Indonesia and Malaysia. It is characterized by a high level of robustness and a low deadweight.
TAILLIFTSthe most outstanding innovation in 2012 was MBB Control, the next generation of electronic control systems for tail lifts, which takes into account the increased requirements of the commercial vehicle industry regarding accessory components by means of expanded control options. the segment of tail lifts with a payload of 750 kg remained a development priority as well. the model range in this area was expanded through the introduction of additional variants, including models for the Asian market.
Additional optimization measures enabled the successful implementation of many projects, such as, for instance, the new robot-welded steel platform MBB Ferrotop for use in the moderately heavy range.
In the field of lifts for passengers with limited mobility, PALFINGER managed to complete the developmentof the new compact double-arm linear lift RtP35H with a horizontal fold platform. Due to its design, thismodel is suitable for smaller vehicles, thus attracting new customer groups in the field of individual transport.
91
PALFINGER ANNuAL REPoRt 2012
coNsoLIdAtEd MANAGEMENt REPoRtPERFoRMANCE oF tHE PALFINGER GRouP
the Eu-funded project “Public transportation – Accessibility for All” was successfully concluded after a total period of three years. the objective of this project was to develop a lifting solution enabling pas- sengers with limited mobility to access railed vehicles for long-distance travelling. one of the criteria to be met was to provide the option of retrofitting vehicles of older building types. the semi-automatic 270-degree swivel lift of the type MBB trainlift tR 1000 was first presented to the public in a uIC railway carriage of the Bulgarian national railway BDZ at the INNotRANS 2012 fair in Berlin.
ACCESSPLATFORMSIn the field of access platforms, during the reporting period priority was given to the development of kits that allow for the building and testing of access platforms irrespective of the chassis and for mounting them on the vehicle directly at the place of use.
In order to comply with the road regulations in the uSA and Australia, in 2012 a so-called dolly solution was developed for the largest access platform. It uses an additional trailer to achieve a better distribution and also a reduction of axle loads. For telescopic cranes this was already a standard feature, but foraccess platforms PALFINGER’s solution was a first.
Customized platforms were developed for stationary use – equipped with special sensor technology and cable ducts in order to adapt cleaning technologies. Based on the success of the use of aluminium telescopes, PALFINGER also set up a centre of excellence for the further development of manufacturing procedures and for testing possible uses for other product areas and product sizes.
RAILWAySySTEMSIn the field of railway systems, 2012 was a year marked by a high percentage of order-based projects, including an outstanding project for the British infrastructure owner Network Rail, which comprised 15 different devices for a complete renewal of the catenary system. three large cranes were fitted with pile-driving equipment for the construction of mast foundations. this new technology has closed a gap in the portfolio of systems solutions and applications engineering. In addition to auger drilling devices and grapplers, PALFINGER can now also offer pile drivers as auxiliary equipment for the construction of foundations.
In software development, emphasis was placed on process optimization. A new project planning tool makes it possible to produce and manage large parameter sets in a partly automated manner. Moreover, tools for the optimization of the testing and commissioning processes have been developed.
MARIneIn the marine area, in addition to introducing a new crane series, PALFINGER focussed on the long-term functionality and the cost-effective use of its products. In 2012, maintenance-free sliding blocks in the extension booms were introduced to the market and the new modular ground control system FLVK was developed. Additional innovations comprised individual solutions in the field of mounted winches, for instance a dual-winch solution for the PK 150002 M crane.
92
PALFINGER ANNuAL REPoRt 2012
coNsoLIdAtEd MANAGEMENt REPoRtPERFoRMANCE oF tHE PALFINGER GRouP
SERvICESIn the service area, the HPSC system for loader cranes was established all over Europe in 2012. thanks to good documentation, adjustment software and training, the dealers are now in a position to install the systems and make the settings themselves. In November, the first HPSC-equipped crane was introduced to the North American market. HPSC systems are also being used in Hong Kong and Russia.
PALFINGER also succeeded in once again improving the assembly and stability calculation software PACWIN.NEt in 2012. the updated version also includes uS measurement systems, thus making the programme fit for use in North America as well.
With the PALREMotE software, a customer-service system enabling the remote diagnosis of technical problems via the Internet and the support of dealers and service workshops in case of electronic prob-lems was rolled out. this software is already in use all over the world.
In order to expand its (further) training area, PALFINGER acquired a central administration and e-learning platform, which in 2013 is going to map the Group training scheme, for the time being only in Europe. With this system, online training courses and tests can be carried out, and the individual participants can be provided with training schedules corresponding to their actual tasks in the workshop.
COOPERATIONPROjECTSPALFINGER carries out cooperation projects with universities, universities of applied sciences and techni-cal colleges for purposes of research and development, to exchange and transfer knowledge and for train-ing purposes, in order to develop human resources and recruit new staff. In 2012, cooperation focussed primarily on the intensification of relations to the Johannes-Kepler university in Linz and the Linz Center of Mechatronics through network activities and projects in the field of mechatronics.
An exchange of experience, information and technology along the entire value-creation chain is inten-sively supported by cooperation with other industrial companies as well as with suppliers and customers. Employees of PALFINGER regularly attend events, are members of standardization bodies and interest groups, and represent PALFINGER at trade conferences and innovation meetings. PALFINGER employ-ees also act as lecturers and give presentations at educational facilities.
93
PALFINGER ANNuAL REPoRt 2012
coNsoLIdAtEd MANAGEMENt REPoRtPERFoRMANCE oF tHE PALFINGER GRouP
VALuE cREAtIoN
Within the scope of corporate strategic planning, PALFINGER’s value-creation strategy was reviewed and fine-tuned in 2012. In doing so, the focus was placed on the superordinate business model. In Europe, the establishment of value creation in Eastern Europe that was commenced in 1993 is being continued and stepped up. Local value creation is also being further developed in the other business areas, with emphasis being placed on pursuing a balanced strategy with regard to investment in ma-chines and automation as well as on the flexibility of employees.
the business model determines how products and services are developed, how they are rendered and sold in the interest of value creation. the implementation of performance is pre-determined through pro-cesses that also define the necessary capacities, resources and organization. taking the entire business model into consideration is therefore supportive of a holistic approach. the optimization of production processes is being intensively continued in line with the newly established process map. under the head-ing of lean administration, process optimization was also rolled out to indirect units in the period under review.
the transition to manufacturing in terms of an early integration of value creation into the advance devel-opment process provides significant leverage in cost-effective production. It helps speed up the start-up of production, as value streams and technologies are already examined during development. this ap-proach was successfully implemented in 2012 in the development of crane components and will also be adopted by other development departments in the future.
With the expansion of the cylinder plant in tenevo, Bulgaria, the foundation for subsequent deliveries to the business areas South America, North America and CIS was laid in 2012. the plant in Delnice, Croatia, was renovated; this enabled the consolidation of production in Croatia. In addition, a competence centre for mounting was established, making it possible for PALFINGER to further optimize and standardize the interface between products and trucks. It also reinforces the coordination of the mounting operations car-ried out by the various business units.
For the purpose of reducing/optimizing complexity in products, processes and organization, certain “golden rules” relating to complexity, modularity, costs and manufacturing were set up.
the principles governing PALFINGER’s value-creation strategy are compiled in the first-time release of a value-creation manual, which has been distributed to all heads of business areas and business units for training purposes.
•Strategicintegrationinadvanceddevelopmentincreasesefficiency•Expansionofcontractmanufacturingreducesthroughputtimesandinventories•Refinedqualitymanagementbringsdowncostsandhasbeencertified•Growingmanufacturingforthirdpartiesconsolidateshighcompetitiveness
94
PALFINGER ANNuAL REPoRt 2012
coNsoLIdAtEd MANAGEMENt REPoRtPERFoRMANCE oF tHE PALFINGER GRouP
contract manufacturingIn 2012, contract manufacturing as a cornerstone of the value-creation strategy was further enhanced at various levels. the projects that were started in 2011 were, for example, continued in the business area South America as well as in the Access Platforms and Container Handling Systems business units by in-troducing line production and reducing throughput times.
At INMAN, the assembly sequence was revised and implemented in line with the order-based system, and in the start-up phase of Sany Palfinger in China the principles of contract manufacturing are being integrated into the layouts of planned production.
Frequent delivery times of global assembly sites are coordinated by a broker plant that also acts in obser-vance of principles of contract manufacturing and carries out the optimization of logistics and transport.
Due to the introduction of kanban decoupling points, throughput times in production plants were consid-erably shortened for various products and inventories were reduced.
Quality managementthe overriding goal of PALFINGER’s quality management is to maintain and further enhance the high quality standards of its products and services. In this respect, higher customer expectations as well as the need to further increase efficiency are ongoing challenges. therefore, methods and procedures are always being critically reviewed with a view to determining whether they meet these requirements, and further improvements are being targeted and made. the success of these efforts can be seen in the continuous reduction of warranty expenses as a percentage of consolidated revenue of the previous two years.
PALFINGER has certified management systems that are continuously being expanded. In the 2012 finan-cial year, the focus was on the roll-out of the quality management systems to the areas. In the business area South America with the plant in Caxias do Sul, Brazil, and in the business area India with the Chennai plant, quality management systems were successfully certified to ISo standard 9001.
After the sites in Maribor, Slovenia, and in Lengau, Austria, were awarded self-tester status (MSA) in 2011 by DNV (Det Norsk Veritas) for components subject to acceptance, the plants in tenevo and Cherven Brjag, both in Bulgaria, successfully completed this process in october 2012. this means that now all PALFINGER plants producing components for the Marine business area are MSA certified, thus giving PALFINGER a substantial time advantage in the production of marine components, as well as lower acceptance costs.
the certifications and the high number of customer audits successfully completed underline the high standard of PALFINGER’s management systems and their competitiveness in terms of quality and per-formance.
In 2013, PALFINGER will be striving to achieve continuous improvements as well as to expand its marine certifications by obtaining additional management systems certification from Germanischer Lloyd. More-over, consistent quality control in mechatronics will be a predominant focus, and the joint venture with the Chinese Sany Group will be supported.
95
PALFINGER ANNuAL REPoRt 2012
coNsoLIdAtEd MANAGEMENt REPoRtPERFoRMANCE oF tHE PALFINGER GRouP
Manufacturing for third partiesPALFINGER pursues a strategy of providing a fixed share of its production capacities and production know-how to external customers. this strategy was successfully continued in 2012. With respect to existing customers, the business volume grew and the range of components was widened. In addition, PALFINGER managed to gain new customers. Here it was observed that PALFINGER is primarily appre-ciated for its engineering know-how in the development of cylinders and increasingly also in structural steel, but also for fair prices, excellent quality, reliability in delivery and innovation in manufacturing.
In the production of both cylinders and structural steel, 2012 was marked by the completion of many prototypes as well as by series startups, which is why PALFINGER used additional capacities for project coordination and implementation. For large accounts, separate account managers were set up for the operational coordination and implementation of orders. these account managers can also be contacted in the case of any questions.
In the annual tÜV audit for certification in accordance with ISo 9001:2010, the relevant plants attached great importance to the quality of processes and products for third-party manufacturing. the good results obtained confirm that PALFINGER has reached a very high level.
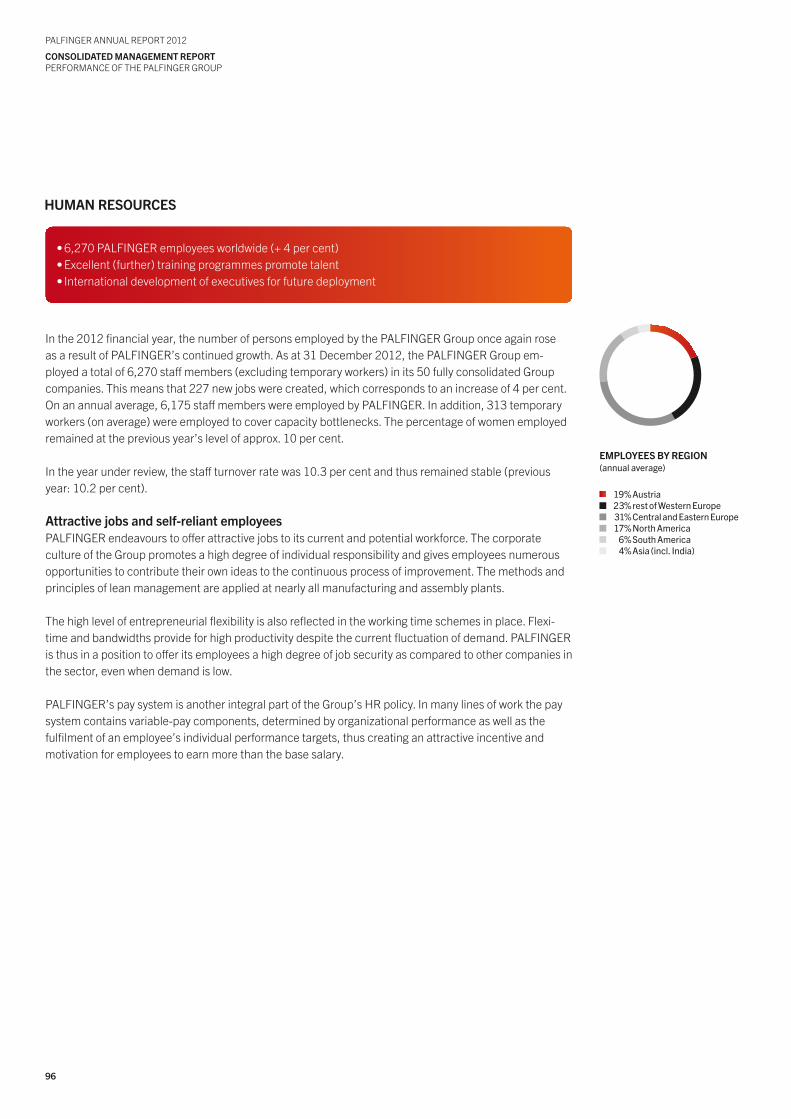
96
PALFINGER ANNuAL REPoRt 2012
coNsoLIdAtEd MANAGEMENt REPoRtPERFoRMANCE oF tHE PALFINGER GRouP
huMAN REsouRcEs
In the 2012 financial year, the number of persons employed by the PALFINGER Group once again rose as a result of PALFINGER’s continued growth. As at 31 December 2012, the PALFINGER Group em-ployed a total of 6,270 staff members (excluding temporary workers) in its 50 fully consolidated Group companies. this means that 227 new jobs were created, which corresponds to an increase of 4 per cent. on an annual average, 6,175 staff members were employed by PALFINGER. In addition, 313 temporary workers (on average) were employed to cover capacity bottlenecks. the percentage of women employed remained at the previous year’s level of approx. 10 per cent.
In the year under review, the staff turnover rate was 10.3 per cent and thus remained stable (previous year: 10.2 per cent).
Attractive jobs and self-reliant employeesPALFINGER endeavours to offer attractive jobs to its current and potential workforce. the corporate culture of the Group promotes a high degree of individual responsibility and gives employees numerous opportunities to contribute their own ideas to the continuous process of improvement. the methods and principles of lean management are applied at nearly all manufacturing and assembly plants.
the high level of entrepreneurial flexibility is also reflected in the working time schemes in place. Flexi-time and bandwidths provide for high productivity despite the current fluctuation of demand. PALFINGER is thus in a position to offer its employees a high degree of job security as compared to other companies in the sector, even when demand is low.
PALFINGER’s pay system is another integral part of the Group’s HR policy. In many lines of work the pay system contains variable-pay components, determined by organizational performance as well as thefulfilment of an employee’s individual performance targets, thus creating an attractive incentive andmotivation for employees to earn more than the base salary.
EMPLoyEEs By REGIoN (annualaverage)
19%Austria23%restofWesternEurope31%CentralandEasternEurope17%north America
6%South America4%Asia(incl.India)
•6,270PALFINGERemployeesworldwide(+4percent)•Excellent(further)trainingprogrammespromotetalent•Internationaldevelopmentofexecutivesforfuturedeployment
97
PALFINGER ANNuAL REPoRt 2012
coNsoLIdAtEd MANAGEMENt REPoRtPERFoRMANCE oF tHE PALFINGER GRouP
skilled labour as a core factor of successthe training concept implemented by the PALFINGER Group starts with initial vocational training.In this field, PALFINGER has for many years set the international benchmark with its apprentice training programmes. In the 2012 financial year, 69 apprentices were trained in Austria, primarily mechanical, production, mechatronic and construction engineers, welders and industrial business management as-sistants, out of which 52 graduated with distinction from the part-time vocational school for apprentices; several top rankings were, for example, achieved in the “Lehrlingsaward oberösterreich” (Apprentice Award of upper Austria). the “Lehre mit Matura” (apprenticeship and upper secondary school leaving certificate) scheme, with currently 26 participants, has also proven extremely successful. In 2013, the area EMEA will attach great priority to the development of young talent under the motto “Give youth a chance”.
At the international locations, PALFINGER also imparts its own know-how to train skilled labour in a tar-geted manner. In Bulgaria, Slovenia and Brazil, for example, government-certified training programmes are carried out in cooperation with local technical colleges where, as in the successful Austrian system of apprentice training, theoretical know-how is taught at school while, at the same time, practical training lasting several months is provided at a PALFINGER plant. In Germany, the technical training of appren-tices was expanded in 2012 so that now apprentices are trained at almost all sites. As at 31 December 2012, PALFINGER was training 129 apprentices worldwide.
In the field of continuing vocational training, the PALFINGER College has become a well-establishedinstitution at the Austrian sites. this training and development programme is essentially based on the transfer of knowledge by internal experts, specifically supplemented by courses held by external speak-ers. In Austria, 583 staff members attended a total of 2,694 training days to expand their business skillsin the period under review; this corresponds to a 13 per cent increase in training days compared to 2011.
Being able to deploy highly qualified staff at the right place at the right time has become of the essence, given the volatility of markets and the internationality of the Group.
the Palfinger Global Leadership Programme, an internal staff development programme, ensures that employees with potential management skills receive the best possible preparation for their future top management positions. In 2012, 13 participants took part in this programme. In 2013, PALFINGER will give especially high priority to the international nature of the participants to reinforce intercultural ex-periential learning.
Moreover, a team-leading programme, tailored to local needs, is offered in some countries in order toallow for an early identification and development of potential junior managers.
Another effort in support of existing executives in their individual career development is the Company Leadership Programme, which was launched in 2012 and is scheduled to run until September 2013.It is directed towards high-potential employees who already have disciplinary management responsi-bilities and is offered in the English language all over Europe.
With the objective of promoting lifelong learning, numerous officers at PALFINGER participated in 360-degree feedback interviews. the analysis of their skills and competencies was used as the basis for determining individual development measures.
All courses and seminars also communicate PALFINGER’s values in dealing with colleagues and employ-ees, which are based on respect and appreciation.
98
PALFINGER ANNuAL REPoRt 2012
coNsoLIdAtEd MANAGEMENt REPoRtPERFoRMANCE oF tHE PALFINGER GRouP
www.palfinger.ag Career
In the year under review, personnel marketing activities such as presence at job fairs, high school gradu-ation projects, traineeships and academic diploma theses were further developed. the new website of the Company takes into account the importance of current and potential employees by offering a larger career section.
organizational and human resources developmentEmployee satisfaction is an important factor of corporate success. In the period under review, the annual staff survey again showed an excellent response rate. the results of the survey will be reviewed in great detail in workshops held at the individual sites and improvement measures will be implemented.
Regular appraisal interviews are designed to harmonize the individual goals pursued by employees with those pursued by PALFINGER and also improve the quality of work and cooperation as a whole. At allAustrian sites, appraisal interviews are now also held with wage earners.
In order to make it easier for new employees to be integrated into the Company, an orientation pro-gramme was developed at the Austrian sites, in which background knowledge relevant to PALFINGERis taught in a concise and practical way.
In 2012, 25 expatriates facilitated a comprehensive transfer of know-how between headquarters andlocal companies as well as among local companies. In the year under review, PALFINGER developedpioneering secondment standards designed to make a substantial contribution to success in the future.
Regular meetings of the global management team guarantee efficient information flows and decisions; in addition, an annual evaluation of the strategic need for highly qualified executives helps to prevent a future shortage. Currently, preparations are underway for the introduction of SAP HCM so as to ensure Group-wide optimized human resources processes and thus lay the foundation for a sustainable strategic HR agenda.
99
PALFINGER ANNuAL REPoRt 2012
coNsoLIdAtEd MANAGEMENt REPoRtPERFoRMANCE oF tHE PALFINGER GRouP
sustAINABILIty
Social and ecological factors, in addition to economic aspects, are the essential parameters for sustain-able, profitable growth, which is why sustainable business management is paramount to PALFINGER; it is the foundation for long-term success.
For that purpose, PALFINGER sets itself specific objectives in a sustainability programme every two years and publishes the relevant issues and progress in a sustainability report. the current Sustainability Report 2010/2011 titled “We have put a lot of energy into saving energy” was published in June 2012. As was the case with previous reports, the Sustainability Report 2010/2011 was verified in accordance with the exter-nal guidelines consisting of G3.0 elaborated by the Global Reporting Initiative (GRI), application level A+.
In the current Sustainability Report, indicators have, for the first time, been presented over a four-year period to reflect PALFINGER’s long-term perspective. the effects that the global economic crisis and the ensuing recovery had on PALFINGER’s sustainability performance are thereby made transparent.
Comprehensive stakeholder communications supports the high standing of PALFINGER in numeroussustainability ratings. the PALFINGER share has been included in the Austrian VÖNIX sustainability in-dex, primarily addressing those investors taking into account long-term stability of value as well as en-vironmental and social factors in their investment decisions. In September 2012, PALFINGER received the Sustainability Leadership Award conferred by the ÖKoVISIoN investment committee for its commit-ment to sustainability and the “best report”. In November, the report won the first prize of the Austrian Sustainability Reporting Award (ASRA) for the third time in a row.
the most recent reporting period was characterized by the implementation of ecological and socialoptimizations. Special attention was paid to the following issues: fair business, responsible employer,eco-efficiency in production, sustainable products and sustainability management. For all the steps taken, the relevant trends were identified, and subsequently measures were derived for the next sus-tainability programme. Some of the priority issues are enumerated in the following.
www.palfinger.ag Sustainability
•Internationalprogressmadeatalllevelsofsustainability–internally,supplychainandproducts•ExternalawardsforcommitmentandSustainabilityReport2010/2011•Furtherexpansionofsustainabilitymanagement•Nextstepsdeterminedinthesustainabilityprogramme2012/2013
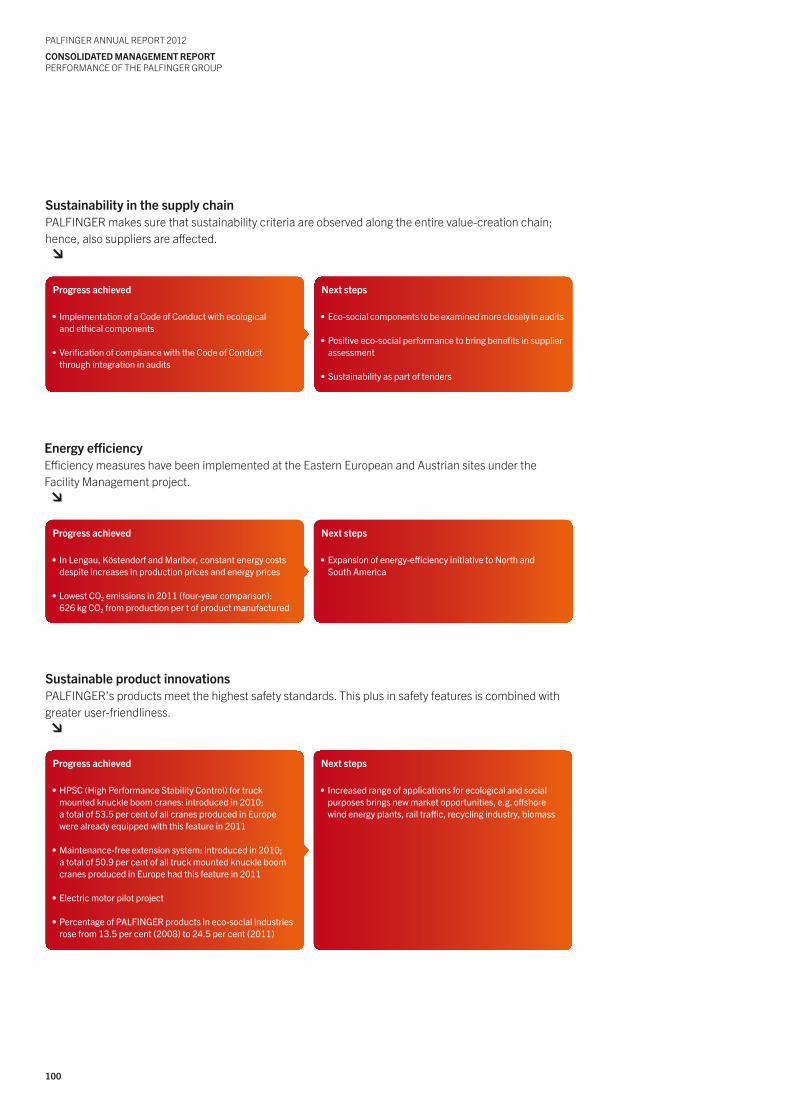
100
PALFINGER ANNuAL REPoRt 2012
coNsoLIdAtEd MANAGEMENt REPoRtPERFoRMANCE oF tHE PALFINGER GRouP
Progress achieved
•ImplementationofaCodeofConductwithecological andethicalcomponents
•verificationofcompliancewiththeCodeofConduct through integration in audits
Next steps
•Eco-socialcomponentstobeexaminedmorecloselyinaudits
•Positiveeco-socialperformancetobringbenefitsinsupplierassessment
•Sustainabilityaspartoftenders
sustainability in the supply chainPALFINGER makes sure that sustainability criteria are observed along the entire value-creation chain; hence, also suppliers are affected.
Progress achieved
•InLengau,köstendorfandMaribor,constantenergycostsdespiteincreasesinproductionpricesandenergyprices
•LowestCO2emissionsin2011(four-yearcomparison): 626kgCO2fromproductionpertofproductmanufactured
Next steps
•Expansionofenergy-efficiencyinitiativetoNorthand South America
Energy efficiencyEfficiency measures have been implemented at the Eastern European and Austrian sites under the Facility Management project.
Progress achieved
•HPSC(HighPerformanceStabilityControl)fortruck mountedknuckleboomcranes:introducedin2010; atotalof53.5percentofallcranesproducedinEurope werealreadyequippedwiththisfeaturein2011
•Maintenance-freeextensionsystem:introducedin2010; atotalof50.9percentofalltruckmountedknuckleboomcranesproducedinEuropehadthisfeaturein2011
•Electricmotorpilotproject
•PercentageofPALFINGERproductsineco-socialindustriesrosefrom13.5percent(2008)to24.5percent(2011)
Next steps
•Increasedrangeofapplicationsforecologicalandsocialpurposesbringsnewmarketopportunities,e.g.offshore windenergyplants,railtraffic,recyclingindustry,biomass
sustainable product innovationsPALFINGER’s products meet the highest safety standards. this plus in safety features is combined with greater user-friendliness.
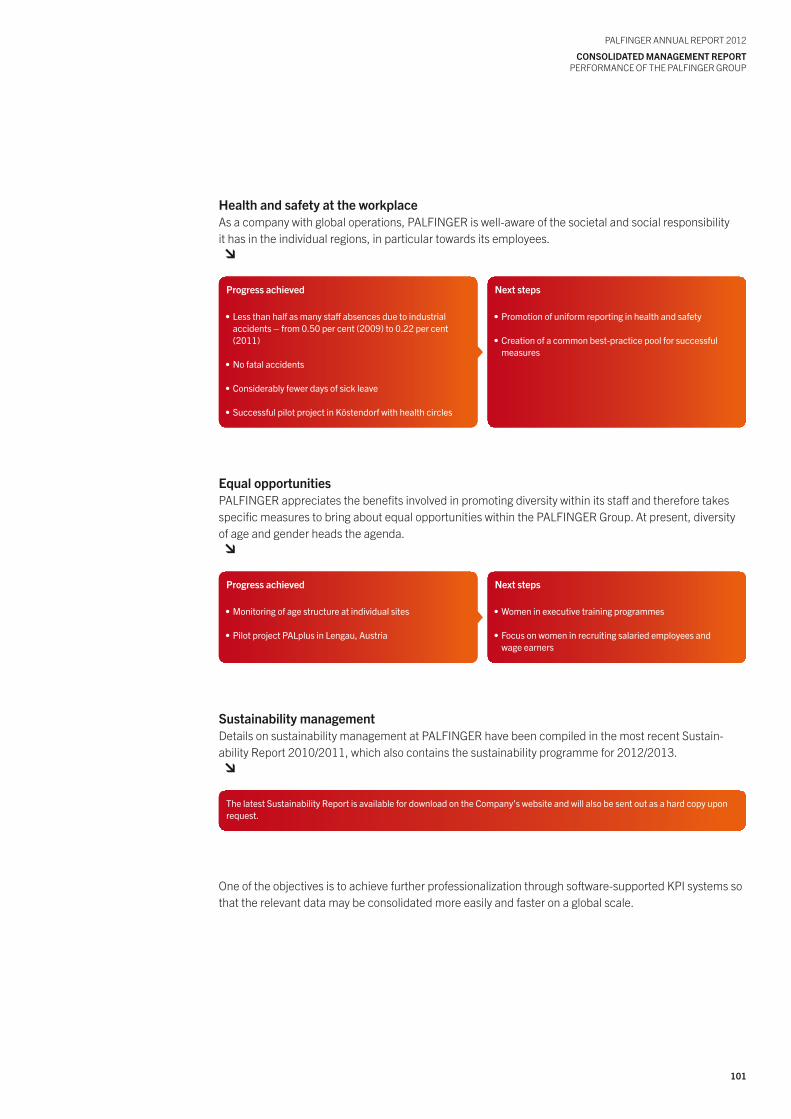
101
PALFINGER ANNuAL REPoRt 2012
coNsoLIdAtEd MANAGEMENt REPoRtPERFoRMANCE oF tHE PALFINGER GRouP
Progress achieved
•Lessthanhalfasmanystaffabsencesduetoindustrial accidents–from0.50percent(2009)to0.22percent(2011)
•Nofatalaccidents
•Considerablyfewerdaysofsickleave
•Successfulpilotprojectinköstendorfwithhealthcircles
Next steps
•Promotionofuniformreportinginhealthandsafety
•Creationofacommonbest-practicepoolforsuccessful measures
health and safety at the workplaceAs a company with global operations, PALFINGER is well-aware of the societal and social responsibilityit has in the individual regions, in particular towards its employees.
Progress achieved
•Monitoringofagestructureatindividualsites
•PilotprojectPALplusinLengau,Austria
Next steps
•Womeninexecutivetrainingprogrammes
•Focusonwomeninrecruitingsalariedemployeesand wageearners
Equal opportunitiesPALFINGER appreciates the benefits involved in promoting diversity within its staff and therefore takes specific measures to bring about equal opportunities within the PALFINGER Group. At present, diversity of age and gender heads the agenda.
one of the objectives is to achieve further professionalization through software-supported KPI systems so that the relevant data may be consolidated more easily and faster on a global scale.
sustainability managementDetails on sustainability management at PALFINGER have been compiled in the most recent Sustain-ability Report 2010/2011, which also contains the sustainability programme for 2012/2013.
ThelatestSustainabilityReportisavailablefordownloadontheCompany’swebsiteandwillalsobesentoutasahardcopyuponrequest.

103102
PALFINGER ANNuAL REPoRt 2012
coNsoLIdAtEd MANAGEMENt REPoRtPERFoRMANCE oF tHE PALFINGER GRouP
PALFINGER ANNuAL REPoRt 2012
coNsoLIdAtEd MANAGEMENt REPoRtPERFoRMANCE oF tHE PALFINGER GRouP
Albert DeiterPALFINGER Access Platforms, Ainring, Germany
PERFoRMANcEBy sEGMENt
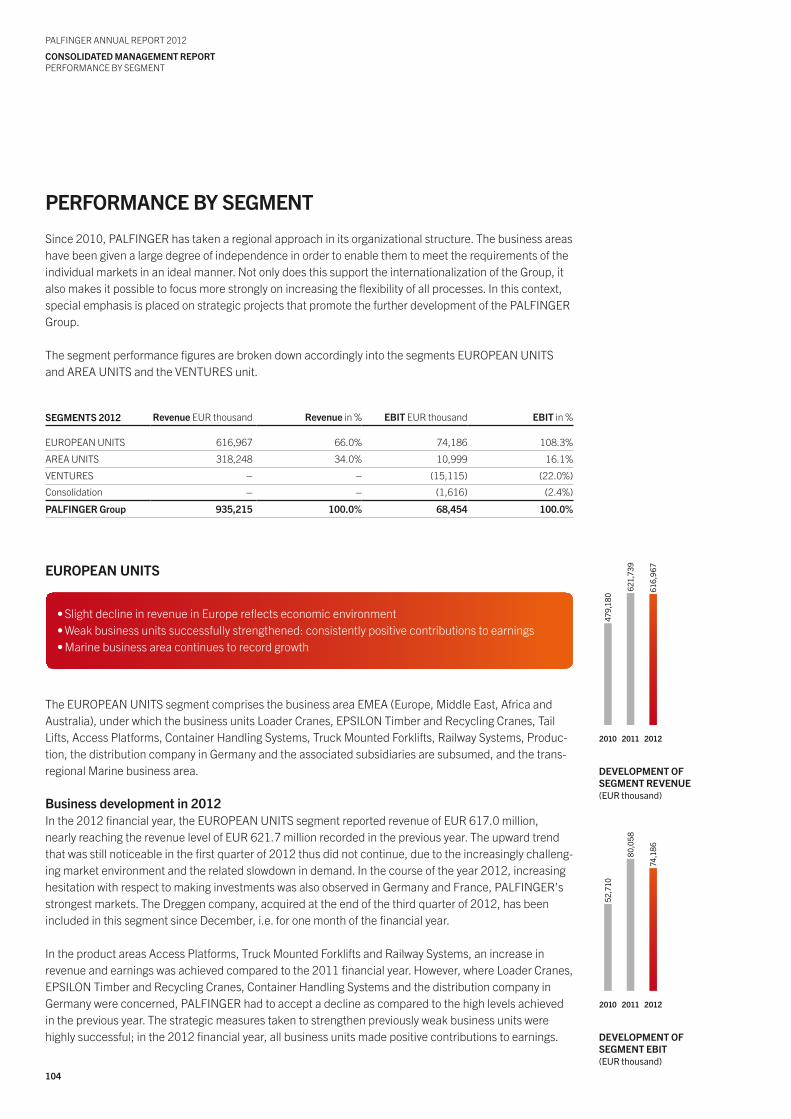
104
PALFINGER ANNuAL REPoRt 2012
coNsoLIdAtEd MANAGEMENt REPoRtPERFoRMANCE By SEGMENt
PERFoRMANcE By sEGMENt
Since 2010, PALFINGER has taken a regional approach in its organizational structure. the business areas have been given a large degree of independence in order to enable them to meet the requirements of the individual markets in an ideal manner. Not only does this support the internationalization of the Group, it also makes it possible to focus more strongly on increasing the flexibility of all processes. In this context, special emphasis is placed on strategic projects that promote the further development of the PALFINGER Group.
the segment performance figures are broken down accordingly into the segments EuRoPEAN uNItS and AREA uNItS and the VENtuRES unit.
sEGMENts 2012 Revenue EuR thousand Revenue in % EBIt EuR thousand EBIt in %
EuRoPEAN uNItS 616,967 66.0% 74,186 108.3%
AREA uNItS 318,248 34.0% 10,999 16.1%
VENtuRES – – (15,115) (22.0%)
Consolidation – – (1,616) (2.4%)
PALFINGER Group 935,215 100.0% 68,454 100.0%
EuRoPEAN uNIts
the EuRoPEAN uNItS segment comprises the business area EMEA (Europe, Middle East, Africa and Australia), under which the business units Loader Cranes, EPSILoN timber and Recycling Cranes, tail Lifts, Access Platforms, Container Handling Systems, truck Mounted Forklifts, Railway Systems, Produc-tion, the distribution company in Germany and the associated subsidiaries are subsumed, and the trans-regional Marine business area.
Business development in 2012In the 2012 financial year, the EuRoPEAN uNItS segment reported revenue of EuR 617.0 million, nearly reaching the revenue level of EuR 621.7 million recorded in the previous year. the upward trend that was still noticeable in the first quarter of 2012 thus did not continue, due to the increasingly challeng-ing market environment and the related slowdown in demand. In the course of the year 2012, increasing hesitation with respect to making investments was also observed in Germany and France, PALFINGER’s strongest markets. the Dreggen company, acquired at the end of the third quarter of 2012, has been included in this segment since December, i.e. for one month of the financial year.
In the product areas Access Platforms, truck Mounted Forklifts and Railway Systems, an increase in revenue and earnings was achieved compared to the 2011 financial year. However, where Loader Cranes, EPSILoN timber and Recycling Cranes, Container Handling Systems and the distribution company in Germany were concerned, PALFINGER had to accept a decline as compared to the high levels achieved in the previous year. the strategic measures taken to strengthen previously weak business units were highly successful; in the 2012 financial year, all business units made positive contributions to earnings.
52,
710
80,
058
74,
186
2010 2011 2012
dEVELoPMENt oF sEGMENt EBIt(euR thousand)
•SlightdeclineinrevenueinEuropereflectseconomicenvironment•Weakbusinessunitssuccessfullystrengthened:consistentlypositivecontributionstoearnings•Marinebusinessareacontinuestorecordgrowth
479
,180
621
,739
616
,967
2010 2011 2012
dEVELoPMENt oF sEGMENt REVENuE(euR thousand)
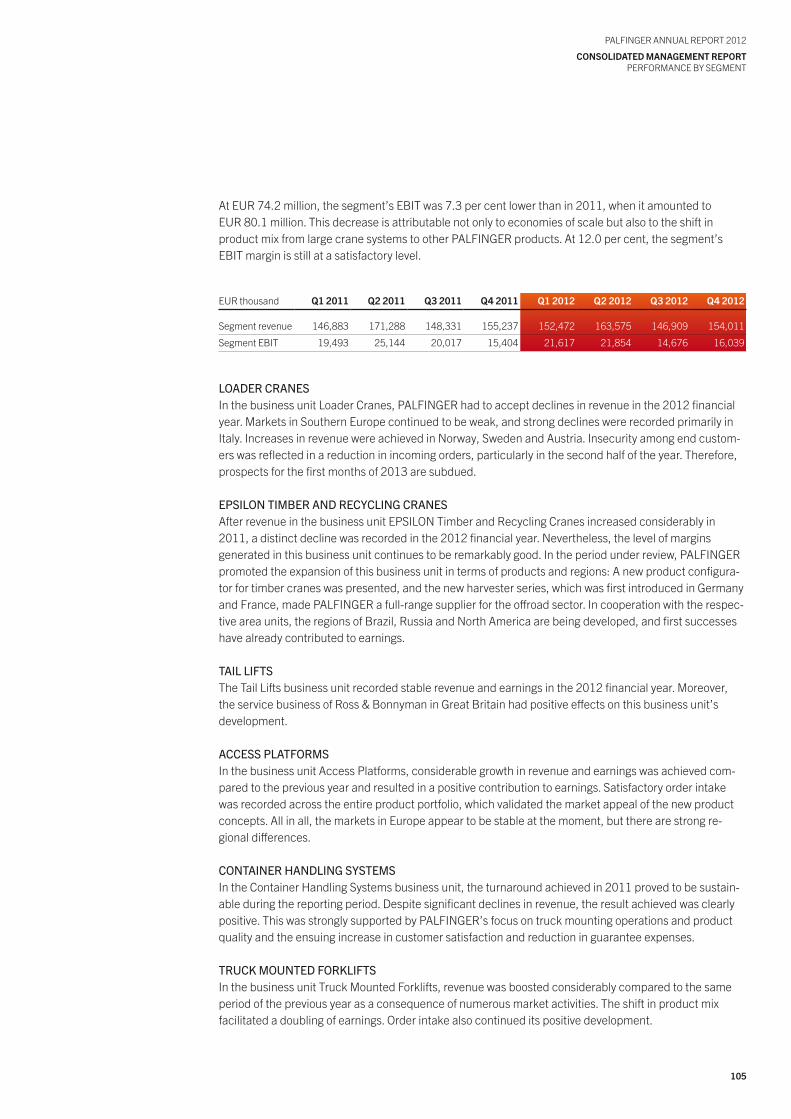
105
PALFINGER ANNuAL REPoRt 2012
coNsoLIdAtEd MANAGEMENt REPoRtPERFoRMANCE By SEGMENt
At EuR 74.2 million, the segment’s EBIt was 7.3 per cent lower than in 2011, when it amounted to EuR 80.1 million. this decrease is attributable not only to economies of scale but also to the shift in product mix from large crane systems to other PALFINGER products. At 12.0 per cent, the segment’s EBIt margin is still at a satisfactory level.
EuR thousand Q1 2011 Q2 2011 Q3 2011 Q4 2011 Q1 2012 Q2 2012 Q3 2012 Q4 2012
Segment revenue 146,883 171,288 148,331 155,237 152,472 163,575 146,909 154,011
Segment EBIt 19,493 25,144 20,017 15,404 21,617 21,854 14,676 16,039
LOADERCRANESIn the business unit Loader Cranes, PALFINGER had to accept declines in revenue in the 2012 financial year. Markets in Southern Europe continued to be weak, and strong declines were recorded primarily in Italy. Increases in revenue were achieved in Norway, Sweden and Austria. Insecurity among end custom-ers was reflected in a reduction in incoming orders, particularly in the second half of the year. therefore, prospects for the first months of 2013 are subdued.
EPSILONTIMBERANDRECyCLINGCRANESAfter revenue in the business unit EPSILoN timber and Recycling Cranes increased considerably in 2011, a distinct decline was recorded in the 2012 financial year. Nevertheless, the level of margins generated in this business unit continues to be remarkably good. In the period under review, PALFINGER promoted the expansion of this business unit in terms of products and regions: A new product configura-tor for timber cranes was presented, and the new harvester series, which was first introduced in Germany and France, made PALFINGER a full-range supplier for the offroad sector. In cooperation with the respec-tive area units, the regions of Brazil, Russia and North America are being developed, and first successes have already contributed to earnings.
TAILLIFTSthe tail Lifts business unit recorded stable revenue and earnings in the 2012 financial year. Moreover, the service business of Ross & Bonnyman in Great Britain had positive effects on this business unit’s development.
ACCESSPLATFORMSIn the business unit Access Platforms, considerable growth in revenue and earnings was achieved com-pared to the previous year and resulted in a positive contribution to earnings. Satisfactory order intake was recorded across the entire product portfolio, which validated the market appeal of the new product concepts. All in all, the markets in Europe appear to be stable at the moment, but there are strong re-gional differences.
CONTAINERHANDLINGSySTEMSIn the Container Handling Systems business unit, the turnaround achieved in 2011 proved to be sustain-able during the reporting period. Despite significant declines in revenue, the result achieved was clearly positive. this was strongly supported by PALFINGER’s focus on truck mounting operations and product quality and the ensuing increase in customer satisfaction and reduction in guarantee expenses.
TRUCkMOUNTEDFORkLIFTSIn the business unit truck Mounted Forklifts, revenue was boosted considerably compared to the same period of the previous year as a consequence of numerous market activities. the shift in product mixfacilitated a doubling of earnings. order intake also continued its positive development.
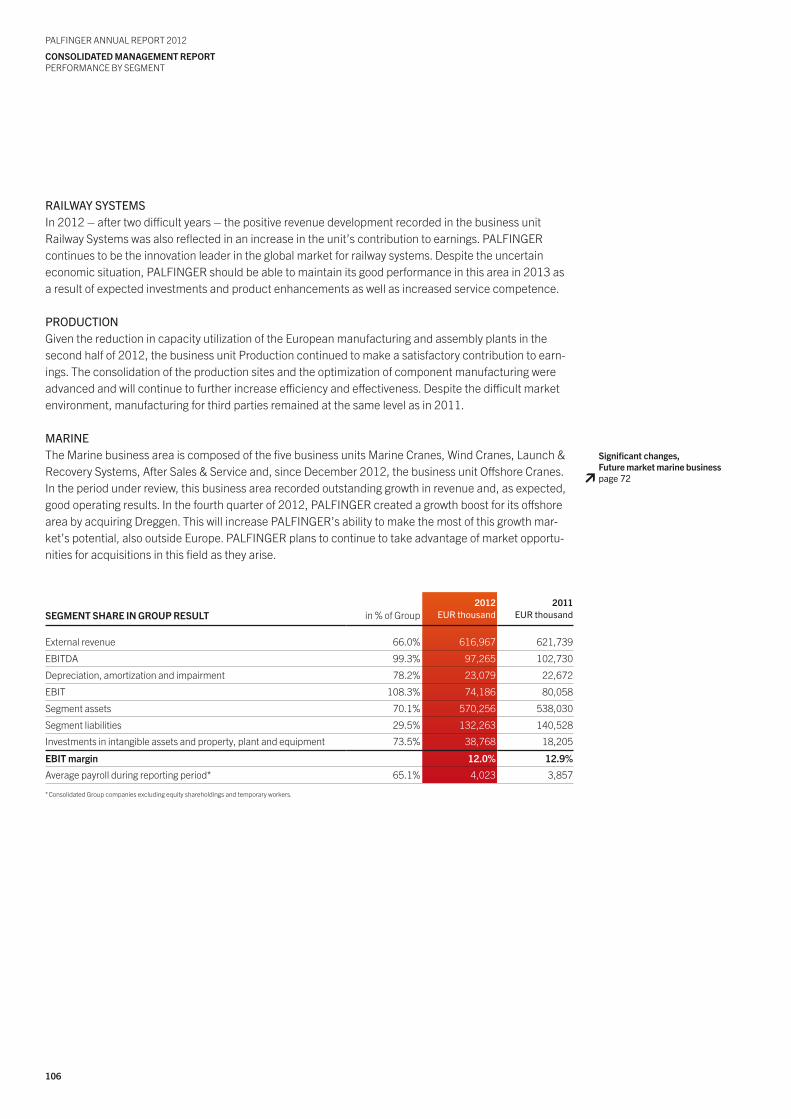
106
PALFINGER ANNuAL REPoRt 2012
coNsoLIdAtEd MANAGEMENt REPoRtPERFoRMANCE By SEGMENt
RAILWAySySTEMSIn 2012 – after two difficult years – the positive revenue development recorded in the business unit Railway Systems was also reflected in an increase in the unit’s contribution to earnings. PALFINGER continues to be the innovation leader in the global market for railway systems. Despite the uncertain economic situation, PALFINGER should be able to maintain its good performance in this area in 2013 as a result of expected investments and product enhancements as well as increased service competence.
PRODUCTIONGiven the reduction in capacity utilization of the European manufacturing and assembly plants in the second half of 2012, the business unit Production continued to make a satisfactory contribution to earn-ings. the consolidation of the production sites and the optimization of component manufacturing were advanced and will continue to further increase efficiency and effectiveness. Despite the difficult market environment, manufacturing for third parties remained at the same level as in 2011.
MARInethe Marine business area is composed of the five business units Marine Cranes, Wind Cranes, Launch & Recovery Systems, After Sales & Service and, since December 2012, the business unit offshore Cranes. In the period under review, this business area recorded outstanding growth in revenue and, as expected, good operating results. In the fourth quarter of 2012, PALFINGER created a growth boost for its offshore area by acquiring Dreggen. this will increase PALFINGER’s ability to make the most of this growth mar-ket’s potential, also outside Europe. PALFINGER plans to continue to take advantage of market opportu-nities for acquisitions in this field as they arise.
sEGMENt shARE IN GRouP REsuLt in % of Group2012
euR thousand2011
euR thousand
External revenue 66.0% 616,967 621,739
EBItDA 99.3% 97,265 102,730
Depreciation, amortization and impairment 78.2% 23,079 22,672
EBIt 108.3% 74,186 80,058
Segment assets 70.1% 570,256 538,030
Segment liabilities 29.5% 132,263 140,528
Investments in intangible assets and property, plant and equipment 73.5% 38,768 18,205
EBIt margin 12.0% 12.9%
Average payroll during reporting period* 65.1% 4,023 3,857
* Consolidated Group companies excluding equity shareholdings and temporary workers.
significant changes,Future market marine businesspage 72
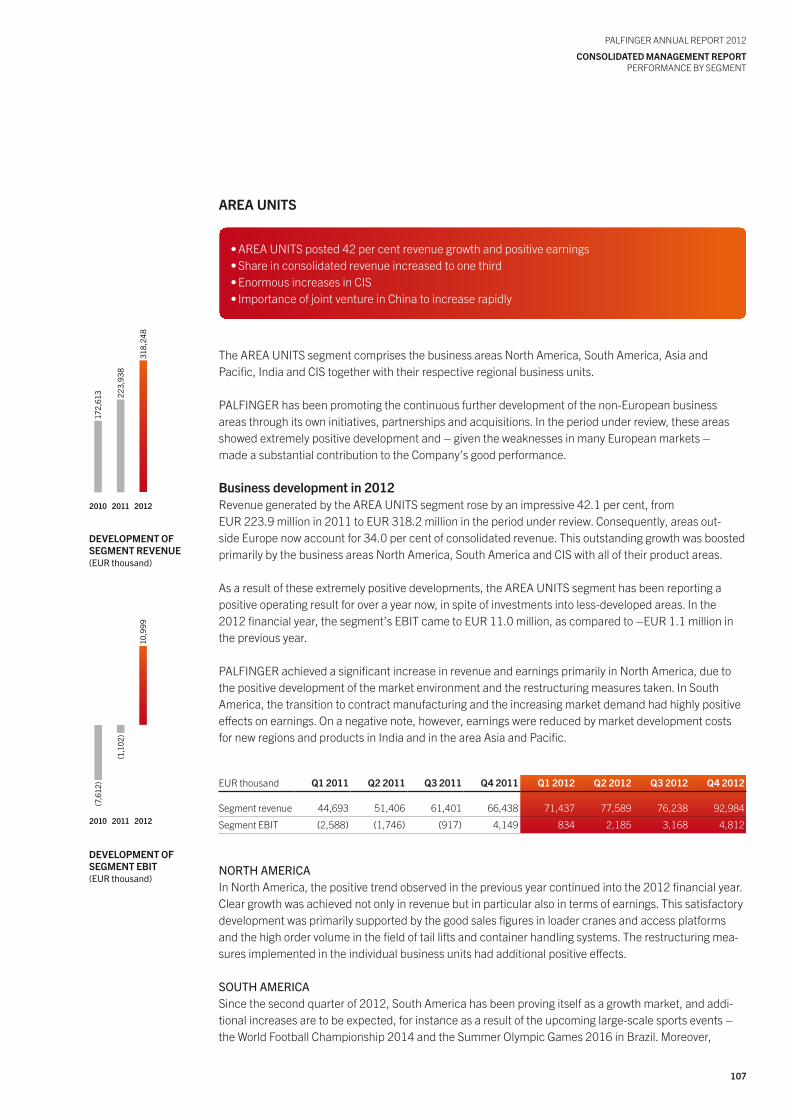
107
PALFINGER ANNuAL REPoRt 2012
coNsoLIdAtEd MANAGEMENt REPoRtPERFoRMANCE By SEGMENt
AREA uNIts
the AREA uNItS segment comprises the business areas North America, South America, Asia and Pacific, India and CIS together with their respective regional business units.
PALFINGER has been promoting the continuous further development of the non-European business areas through its own initiatives, partnerships and acquisitions. In the period under review, these areas showed extremely positive development and – given the weaknesses in many European markets – made a substantial contribution to the Company’s good performance.
Business development in 2012Revenue generated by the AREA uNItS segment rose by an impressive 42.1 per cent, fromEuR 223.9 million in 2011 to EuR 318.2 million in the period under review. Consequently, areas out-side Europe now account for 34.0 per cent of consolidated revenue. this outstanding growth was boosted primarily by the business areas North America, South America and CIS with all of their product areas.
As a result of these extremely positive developments, the AREA uNItS segment has been reporting a positive operating result for over a year now, in spite of investments into less-developed areas. In the2012 financial year, the segment’s EBIt came to EuR 11.0 million, as compared to –EuR 1.1 million in the previous year.
PALFINGER achieved a significant increase in revenue and earnings primarily in North America, due to the positive development of the market environment and the restructuring measures taken. In South America, the transition to contract manufacturing and the increasing market demand had highly positive effects on earnings. on a negative note, however, earnings were reduced by market development costs for new regions and products in India and in the area Asia and Pacific.
EuR thousand Q1 2011 Q2 2011 Q3 2011 Q4 2011 Q1 2012 Q2 2012 Q3 2012 Q4 2012
Segment revenue 44,693 51,406 61,401 66,438 71,437 77,589 76,238 92,984
Segment EBIt (2,588) (1,746) (917) 4,149 834 2,185 3,168 4,812
NORTHAMERICAIn North America, the positive trend observed in the previous year continued into the 2012 financial year. Clear growth was achieved not only in revenue but in particular also in terms of earnings. this satisfactory development was primarily supported by the good sales figures in loader cranes and access platforms and the high order volume in the field of tail lifts and container handling systems. the restructuring mea-sures implemented in the individual business units had additional positive effects.
SOUTHAMERICASince the second quarter of 2012, South America has been proving itself as a growth market, and addi-tional increases are to be expected, for instance as a result of the upcoming large-scale sports events – the World Football Championship 2014 and the Summer olympic Games 2016 in Brazil. Moreover,
172
,613 2
23,9
38
318
,248
2010 2011 2012
dEVELoPMENt oF sEGMENt REVENuE(euR thousand)
dEVELoPMENt oF sEGMENt EBIt(euR thousand)
2010 2011 2012
10,
999
(1,1
02)
(7,6
12)
•AREAUNITSposted42percentrevenuegrowthandpositiveearnings•Shareinconsolidatedrevenueincreasedtoonethird•EnormousincreasesinCIS•ImportanceofjointventureinChinatoincreaserapidly
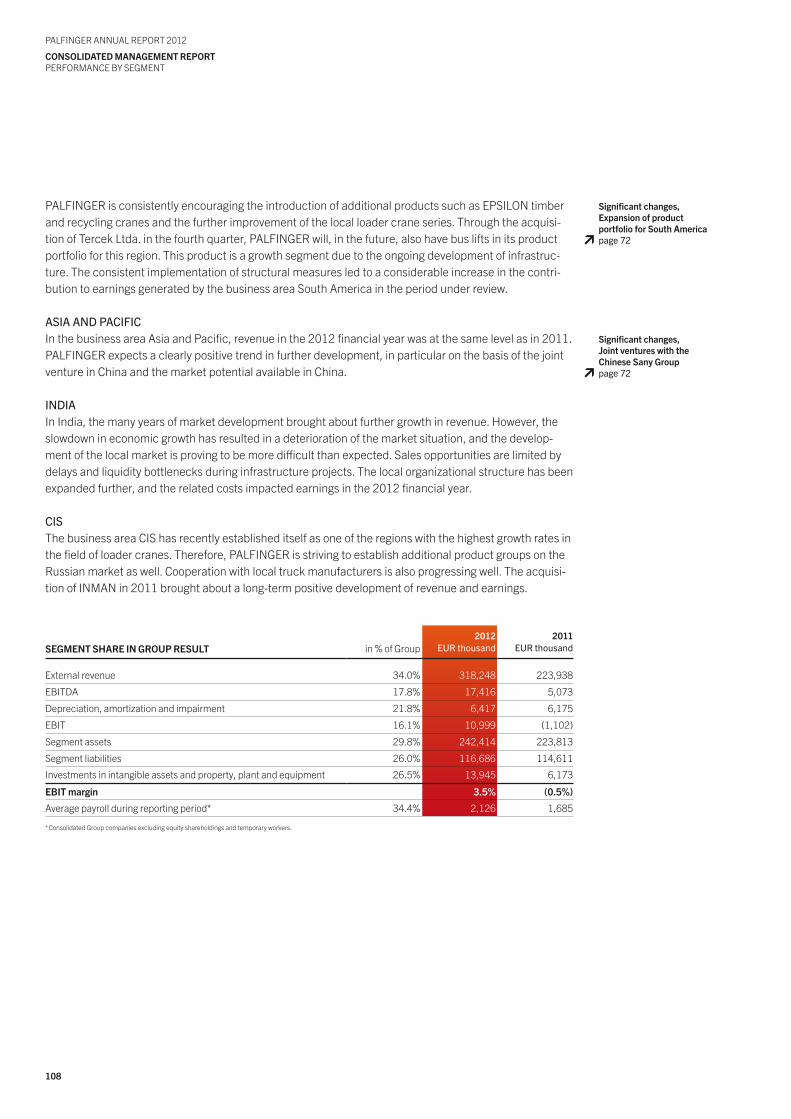
108
PALFINGER ANNuAL REPoRt 2012
coNsoLIdAtEd MANAGEMENt REPoRtPERFoRMANCE By SEGMENt
PALFINGER is consistently encouraging the introduction of additional products such as EPSILoN timber and recycling cranes and the further improvement of the local loader crane series. through the acquisi-tion of tercek Ltda. in the fourth quarter, PALFINGER will, in the future, also have bus lifts in its product portfolio for this region. this product is a growth segment due to the ongoing development of infrastruc-ture. the consistent implementation of structural measures led to a considerable increase in the contri-bution to earnings generated by the business area South America in the period under review.
ASIAANDPACIFICIn the business area Asia and Pacific, revenue in the 2012 financial year was at the same level as in 2011. PALFINGER expects a clearly positive trend in further development, in particular on the basis of the joint venture in China and the market potential available in China.
INDIAIn India, the many years of market development brought about further growth in revenue. However, the slowdown in economic growth has resulted in a deterioration of the market situation, and the develop-ment of the local market is proving to be more difficult than expected. Sales opportunities are limited by delays and liquidity bottlenecks during infrastructure projects. the local organizational structure has been expanded further, and the related costs impacted earnings in the 2012 financial year.
CISthe business area CIS has recently established itself as one of the regions with the highest growth rates in the field of loader cranes. therefore, PALFINGER is striving to establish additional product groups on the Russian market as well. Cooperation with local truck manufacturers is also progressing well. the acquisi-tion of INMAN in 2011 brought about a long-term positive development of revenue and earnings.
sEGMENt shARE IN GRouP REsuLt in % of Group2012
euR thousand2011
euR thousand
External revenue 34.0% 318,248 223,938
EBItDA 17.8% 17,416 5,073
Depreciation, amortization and impairment 21.8% 6,417 6,175
EBIt 16.1% 10,999 (1,102)
Segment assets 29.8% 242,414 223,813
Segment liabilities 26.0% 116,686 114,611
Investments in intangible assets and property, plant and equipment 26.5% 13,945 6,173
EBIt margin 3.5% (0.5%)
Average payroll during reporting period* 34.4% 2,126 1,685
* Consolidated Group companies excluding equity shareholdings and temporary workers.
significant changes,Expansion of productportfolio for south Americapage 72
significant changes,Joint ventures with thechinese sany Grouppage 72
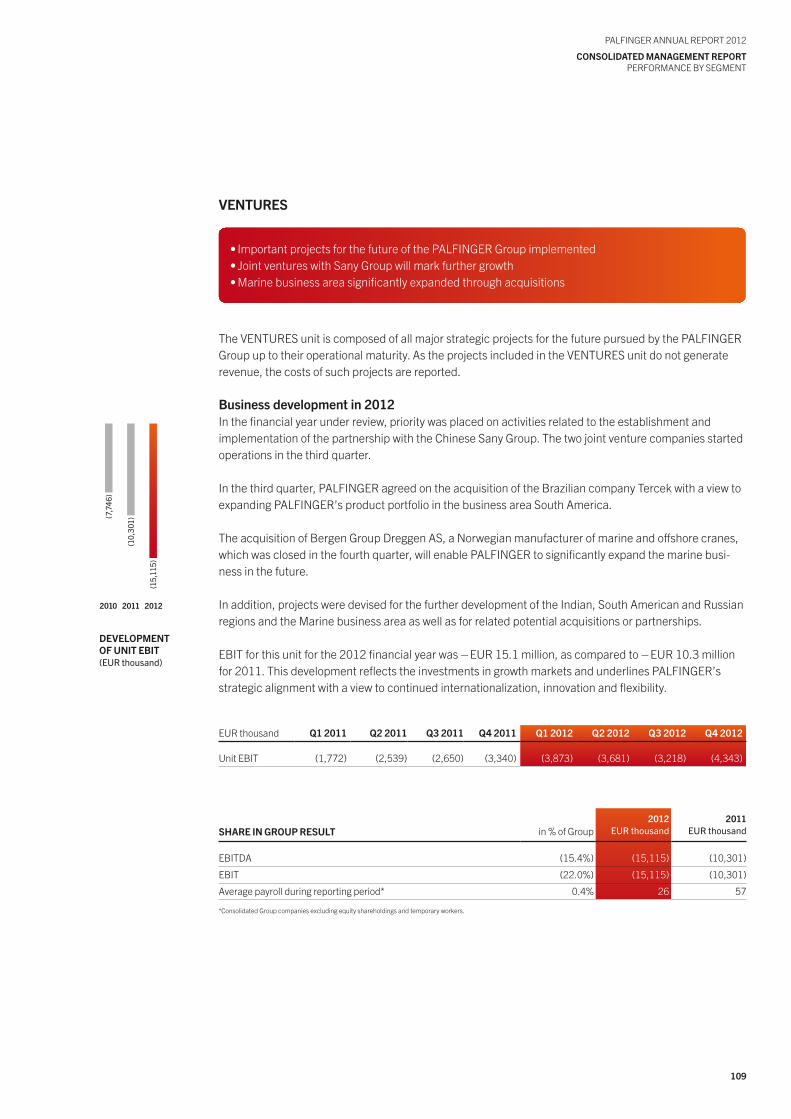
109
PALFINGER ANNuAL REPoRt 2012
coNsoLIdAtEd MANAGEMENt REPoRtPERFoRMANCE By SEGMENt
VENtuREs
the VENtuRES unit is composed of all major strategic projects for the future pursued by the PALFINGER Group up to their operational maturity. As the projects included in the VENtuRES unit do not generate revenue, the costs of such projects are reported.
Business development in 2012In the financial year under review, priority was placed on activities related to the establishment and implementation of the partnership with the Chinese Sany Group. the two joint venture companies started operations in the third quarter.
In the third quarter, PALFINGER agreed on the acquisition of the Brazilian company tercek with a view to expanding PALFINGER’s product portfolio in the business area South America.
the acquisition of Bergen Group Dreggen AS, a Norwegian manufacturer of marine and offshore cranes, which was closed in the fourth quarter, will enable PALFINGER to significantly expand the marine busi-ness in the future.
In addition, projects were devised for the further development of the Indian, South American and Russian regions and the Marine business area as well as for related potential acquisitions or partnerships.
EBIt for this unit for the 2012 financial year was – EuR 15.1 million, as compared to – EuR 10.3 million for 2011. this development reflects the investments in growth markets and underlines PALFINGER’s strategic alignment with a view to continued internationalization, innovation and flexibility.
EuR thousand Q1 2011 Q2 2011 Q3 2011 Q4 2011 Q1 2012 Q2 2012 Q3 2012 Q4 2012
unit EBIt (1,772) (2,539) (2,650) (3,340) (3,873) (3,681) (3,218) (4,343)
shARE IN GRouP REsuLt in % of Group2012
euR thousand2011
euR thousand
EBItDA (15.4%) (15,115) (10,301)
EBIt (22.0%) (15,115) (10,301)
Average payroll during reporting period* 0.4% 26 57
*Consolidated Group companies excluding equity shareholdings and temporary workers.
dEVELoPMENtoF uNIt EBIt(euR thousand)
2010 2011 2012
(15,
115)
(10,
301)
(7,7
46)
•ImportantprojectsforthefutureofthePALFINGERGroupimplemented•JointventureswithSanyGroupwillmarkfurthergrowth•Marinebusinessareasignificantlyexpandedthroughacquisitions

110
PALFINGER ANNuAL REPoRt 2012
coNsoLIdAtEd MANAGEMENt REPoRtKEy EVENtS AFtER tHE BALANCE SHEEt DAtE
kEy EVENts AFtER thE BALANcE shEEt dAtE
After the end of the 2012 financial year, there have been no material post-reporting events.
111
PALFINGER ANNuAL REPoRt 2012
coNsoLIdAtEd MANAGEMENt REPoRtoutLooK
outLook
In 2012, the expansion of the debt crisis in Europe had an increasingly weakening effect on the real economy in some of the European markets that are of importance to PALFINGER. Without the PALFINGER Group’s global orientation, the growth recorded would not have been possible. the man-agement considers this a confirmation of its strategic decision to grow not only in North America butalso towards the BRIC countries.
PALFINGER’s consistent strategy of internationalization, especially outside Europe, is therefore being continued. In the period under review, PALFINGER implemented the largest project since its IPo in 1999, namely two joint ventures with the Sany Group, one of China’s industrial giants. operations were launched in the third quarter of 2012 and will have a positive effect on future business performance. the foundation for a successful entry into the Chinese market had thus been laid in time to celebrate the 80th anniversary of the PALFINGER Group in 2012, and it is assumed that the Group’s leading position worldwide has been sustainably safeguarded through this step.
the Group’s flexibility will be continuously developed in all fields, as this is becoming increasingly impor-tant in view of the more rapidly changing market environment. order-based procurement, manufactur-ing and assembly have enabled PALFINGER to respond to order fluctuations quickly without locking up excessive capital by increasing inventories. PALFINGER will therefore continue to pursue its flexibility course consistently.
the diversity of PALFINGER’s products, the Group’s expansion through acquisition and the promotion of internationalization make it essential that the Group concentrate more intensively on complexity manage-ment. this is a challenge that PALFINGER has met through a Group-wide value-creation project, with the object of enhancing the Group’s major competitive advantage – its global organization – for the future.
2013 will also be marked by the new brand architecture for all product areas of the PALFINGER Group. PALFINGER regards its strong brand as a major factor for success, alongside the development and manu-facture of its premium products – particularly in view of the increasing uncertainty of the global economic situation. the more precise positioning that has now been defined is intended to guarantee the brand’s value for the future and to generate further synergies from its market operations.
Against the backdrop of the uncertain development of the economy and of demand, the visibility of the business was reduced in 2012. under the current economic conditions, the management expects a moderate increase in revenue, coming primarily from the business areas outside Europe and the Marine business area, for the 2013 financial year.
•UncertaintyinEuropeconfirmsinternationalizationstrategy•Flexibilityfurtherenhanced•Makingstrongpointsstronger:globalorganization,PALFINGERbrand•Slightgrowthexpectedfor2013,primarilyoutsideEurope

113112
PALFINGER ANNuAL REPoRt 2012
coNsoLIdAtEd FINANcIAL stAtEMENts FoR thE yEAR ENdEd 31 dEc 2012outLooK
PALFINGER ANNuAL REPoRt 2012
coNsoLIdAtEd FINANcIAL stAtEMENts FoR thE yEAR ENdEd 31 dEc 2012outLooK
coNsoLIdAtEd FINANcIAL stAtEMENts FoR thE yEAR ENdEd 31 dEc 2012
Regina SteinhagenPALFINGER Corporate Marketing
Balthasar GwechenbergerPALFINGER Corporate Services

coNsoLIdAtEd FINANcIAL stAtEMENts FoR thE yEAR ENdEd 31 dEc 2012
PALFINGER ANNuAL REPoRt 2012
coNsoLIdAtEd FINANcIAL stAtEMENts FoR thE yEAR ENdEd 31 dEc 2012
114
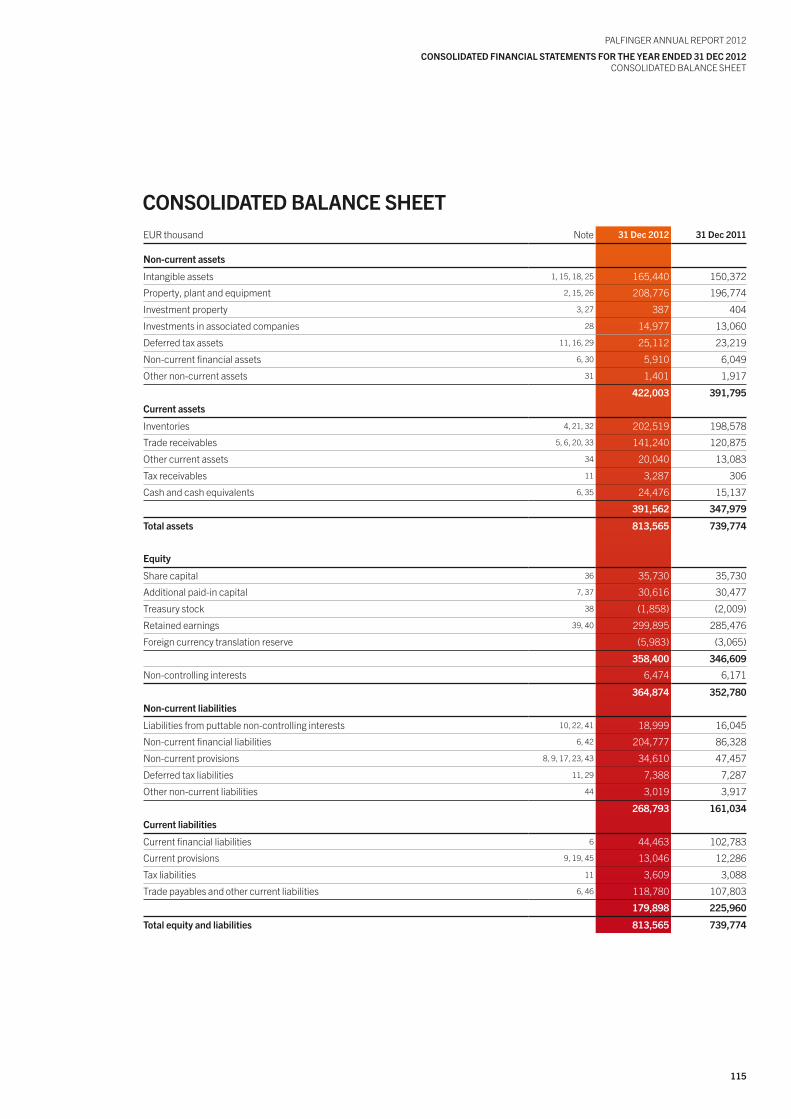
115
PALFINGER ANNuAL REPoRt 2012
coNsoLIdAtEd FINANcIAL stAtEMENts FoR thE yEAR ENdEd 31 dEc 2012CoNSoLIDAtED BALANCE SHEEt
coNsoLIdAtEd BALANcE shEEtEuR thousand Note 31 dec 2012 31 dec 2011
Non-current assets
Intangible assets 1, 15, 18, 25 165,440 150,372
Property, plant and equipment 2, 15, 26 208,776 196,774
Investment property 3, 27 387 404
Investments in associated companies 28 14,977 13,060
Deferred tax assets 11, 16, 29 25,112 23,219
Non-current financial assets 6, 30 5,910 6,049
other non-current assets 31 1,401 1,917
422,003 391,795
current assets
Inventories 4, 21, 32 202,519 198,578
trade receivables 5, 6, 20, 33 141,240 120,875
other current assets 34 20,040 13,083
tax receivables 11 3,287 306
Cash and cash equivalents 6, 35 24,476 15,137
391,562 347,979
total assets 813,565 739,774
Equity
Share capital 36 35,730 35,730
Additional paid-in capital 7, 37 30,616 30,477
treasury stock 38 (1,858) (2,009)
Retained earnings 39, 40 299,895 285,476
Foreign currency translation reserve (5,983) (3,065)
358,400 346,609
Non-controlling interests 6,474 6,171
364,874 352,780
Non-current liabilities
Liabilities from puttable non-controlling interests 10, 22, 41 18,999 16,045
Non-current financial liabilities 6, 42 204,777 86,328
Non-current provisions 8, 9, 17, 23, 43 34,610 47,457
Deferred tax liabilities 11, 29 7,388 7,287
other non-current liabilities 44 3,019 3,917
268,793 161,034
current liabilities
Current financial liabilities 6 44,463 102,783
Current provisions 9, 19, 45 13,046 12,286
tax liabilities 11 3,609 3,088
trade payables and other current liabilities 6, 46 118,780 107,803
179,898 225,960
total equity and liabilities 813,565 739,774
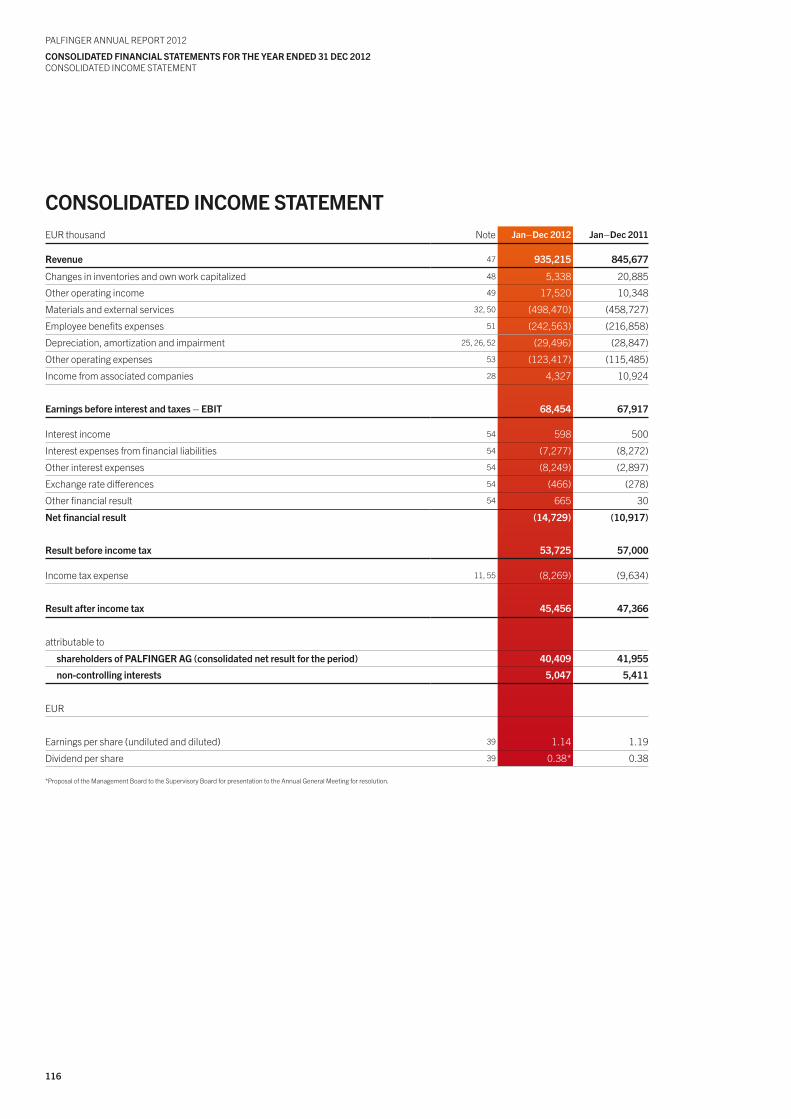
116
PALFINGER ANNuAL REPoRt 2012
coNsoLIdAtEd FINANcIAL stAtEMENts FoR thE yEAR ENdEd 31 dEc 2012CoNSoLIDAtED INCoME StAtEMENt
coNsoLIdAtEd INcoME stAtEMENtEuR thousand Note Jan–dec 2012 Jan–dec 2011
Revenue 47 935,215 845,677
Changes in inventories and own work capitalized 48 5,338 20,885
other operating income 49 17,520 10,348
Materials and external services 32, 50 (498,470) (458,727)
Employee benefits expenses 51 (242,563) (216,858)
Depreciation, amortization and impairment 25, 26, 52 (29,496) (28,847)
other operating expenses 53 (123,417) (115,485)
Income from associated companies 28 4,327 10,924
Earnings before interest and taxes – EBIt 68,454 67,917
Interest income 54 598 500
Interest expenses from financial liabilities 54 (7,277) (8,272)
other interest expenses 54 (8,249) (2,897)
Exchange rate differences 54 (466) (278)
other financial result 54 665 30
Net financial result (14,729) (10,917)
Result before income tax 53,725 57,000
Income tax expense 11, 55 (8,269) (9,634)
Result after income tax 45,456 47,366
attributable to
shareholders of PALFINGER AG (consolidated net result for the period) 40,409 41,955
non-controlling interests 5,047 5,411
EuR
Earnings per share (undiluted and diluted) 39 1.14 1.19
Dividend per share 39 0.38* 0.38
*Proposal of the Management Board to the Supervisory Board for presentation to the Annual General Meeting for resolution.
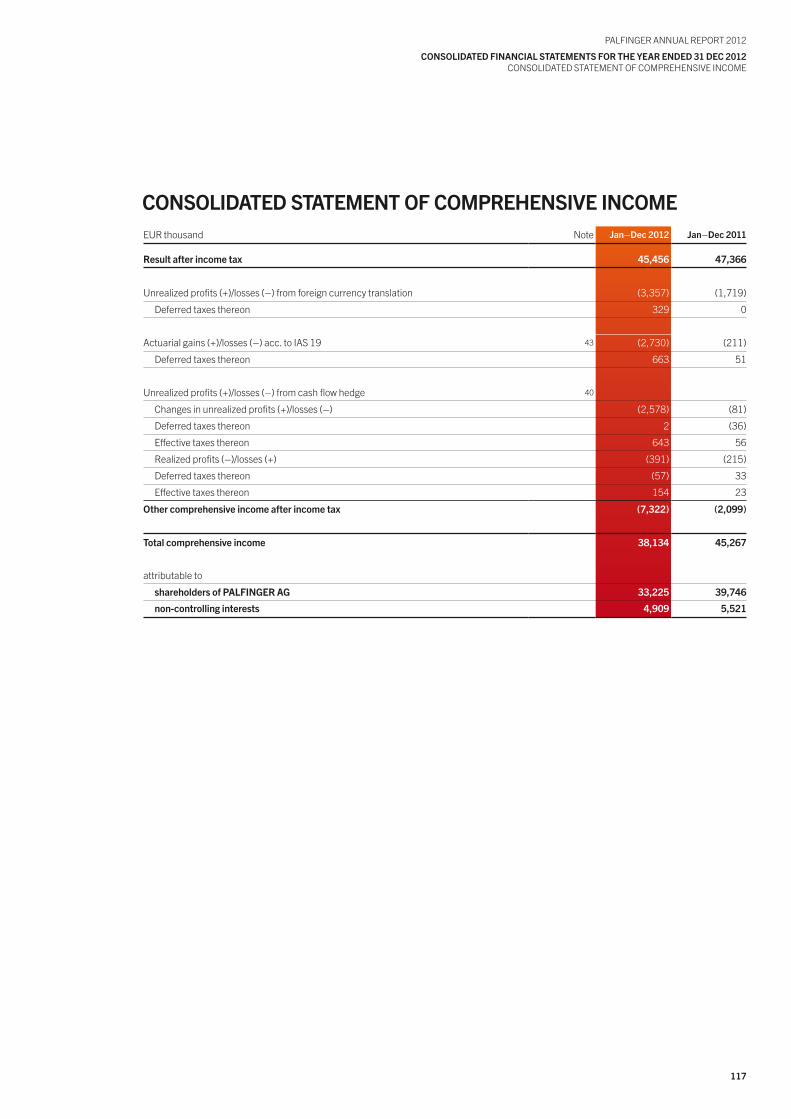
117
PALFINGER ANNuAL REPoRt 2012
coNsoLIdAtEd FINANcIAL stAtEMENts FoR thE yEAR ENdEd 31 dEc 2012CoNSoLIDAtED StAtEMENt oF CoMPREHENSIVE INCoME
coNsoLIdAtEd stAtEMENt oF coMPREhENsIVE INcoMEEuR thousand Note Jan–dec 2012 Jan–dec 2011
Result after income tax 45,456 47,366
unrealized profits (+)/losses (–) from foreign currency translation (3,357) (1,719)
Deferred taxes thereon 329 0
Actuarial gains (+)/losses (–) acc. to IAS 19 43 (2,730) (211)
Deferred taxes thereon 663 51
unrealized profits (+)/losses (–) from cash flow hedge 40
Changes in unrealized profits (+)/losses (–) (2,578) (81)
Deferred taxes thereon 2 (36)
Effective taxes thereon 643 56
Realized profits (–)/losses (+) (391) (215)
Deferred taxes thereon (57) 33
Effective taxes thereon 154 23
other comprehensive income after income tax (7,322) (2,099)
total comprehensive income 38,134 45,267
attributable to
shareholders of PALFINGER AG 33,225 39,746
non-controlling interests 4,909 5,521
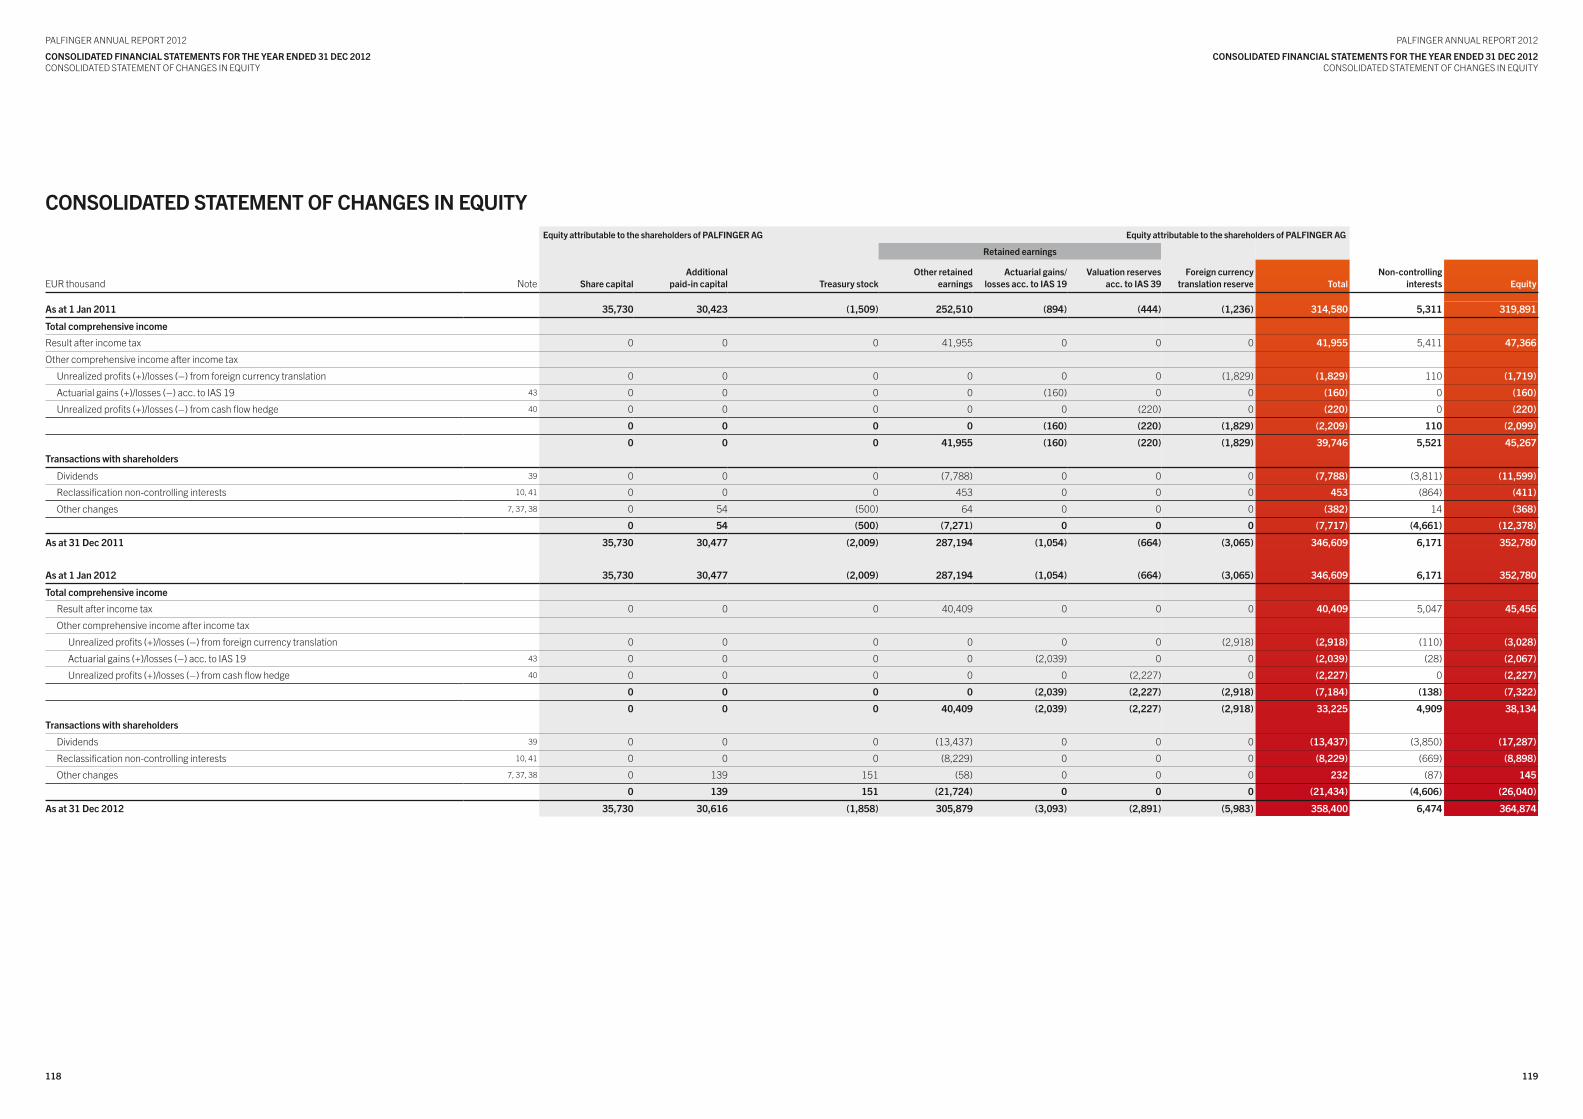
119118
PALFINGER ANNuAL REPoRt 2012
coNsoLIdAtEd FINANcIAL stAtEMENts FoR thE yEAR ENdEd 31 dEc 2012CoNSoLIDAtED StAtEMENt oF CHANGES IN EQuItY
PALFINGER ANNuAL REPoRt 2012
coNsoLIdAtEd FINANcIAL stAtEMENts FoR thE yEAR ENdEd 31 dEc 2012CoNSoLIDAtED StAtEMENt oF CHANGES IN EQuItY
coNsoLIdAtEd stAtEMENt oF chANGEs IN EQuItyEquity attributable to the shareholders of PALFINGER AG Equity attributable to the shareholders of PALFINGER AG
Retained earnings
EuR thousand Note share capitalAdditional
paid-in capital treasury stockother retained
earningsActuarial gains/
losses acc. to IAs 19valuation reserves
acc. to IAs 39Foreign currency
translation reserve totalNon-controlling
interests Equity
As at 1 Jan 2011 35,730 30,423 (1,509) 252,510 (894) (444) (1,236) 314,580 5,311 319,891
total comprehensive income
Result after income tax 0 0 0 41,955 0 0 0 41,955 5,411 47,366
other comprehensive income after income tax
unrealized profits (+)/losses (–) from foreign currency translation 0 0 0 0 0 0 (1,829) (1,829) 110 (1,719)
Actuarial gains (+)/losses (–) acc. to IAS 19 43 0 0 0 0 (160) 0 0 (160) 0 (160)
unrealized profits (+)/losses (–) from cash flow hedge 40 0 0 0 0 0 (220) 0 (220) 0 (220)
0 0 0 0 (160) (220) (1,829) (2,209) 110 (2,099)
0 0 0 41,955 (160) (220) (1,829) 39,746 5,521 45,267
transactions with shareholders
Dividends 39 0 0 0 (7,788) 0 0 0 (7,788) (3,811) (11,599)
Reclassification non-controlling interests 10, 41 0 0 0 453 0 0 0 453 (864) (411)
other changes 7, 37, 38 0 54 (500) 64 0 0 0 (382) 14 (368)
0 54 (500) (7,271) 0 0 0 (7,717) (4,661) (12,378)
As at 31 dec 2011 35,730 30,477 (2,009) 287,194 (1,054) (664) (3,065) 346,609 6,171 352,780
As at 1 Jan 2012 35,730 30,477 (2,009) 287,194 (1,054) (664) (3,065) 346,609 6,171 352,780
total comprehensive income
Result after income tax 0 0 0 40,409 0 0 0 40,409 5,047 45,456
other comprehensive income after income tax
unrealized profits (+)/losses (–) from foreign currency translation 0 0 0 0 0 0 (2,918) (2,918) (110) (3,028)
Actuarial gains (+)/losses (–) acc. to IAS 19 43 0 0 0 0 (2,039) 0 0 (2,039) (28) (2,067)
unrealized profits (+)/losses (–) from cash flow hedge 40 0 0 0 0 0 (2,227) 0 (2,227) 0 (2,227)
0 0 0 0 (2,039) (2,227) (2,918) (7,184) (138) (7,322)
0 0 0 40,409 (2,039) (2,227) (2,918) 33,225 4,909 38,134
transactions with shareholders
Dividends 39 0 0 0 (13,437) 0 0 0 (13,437) (3,850) (17,287)
Reclassification non-controlling interests 10, 41 0 0 0 (8,229) 0 0 0 (8,229) (669) (8,898)
other changes 7, 37, 38 0 139 151 (58) 0 0 0 232 (87) 145
0 139 151 (21,724) 0 0 0 (21,434) (4,606) (26,040)
As at 31 dec 2012 35,730 30,616 (1,858) 305,879 (3,093) (2,891) (5,983) 358,400 6,474 364,874
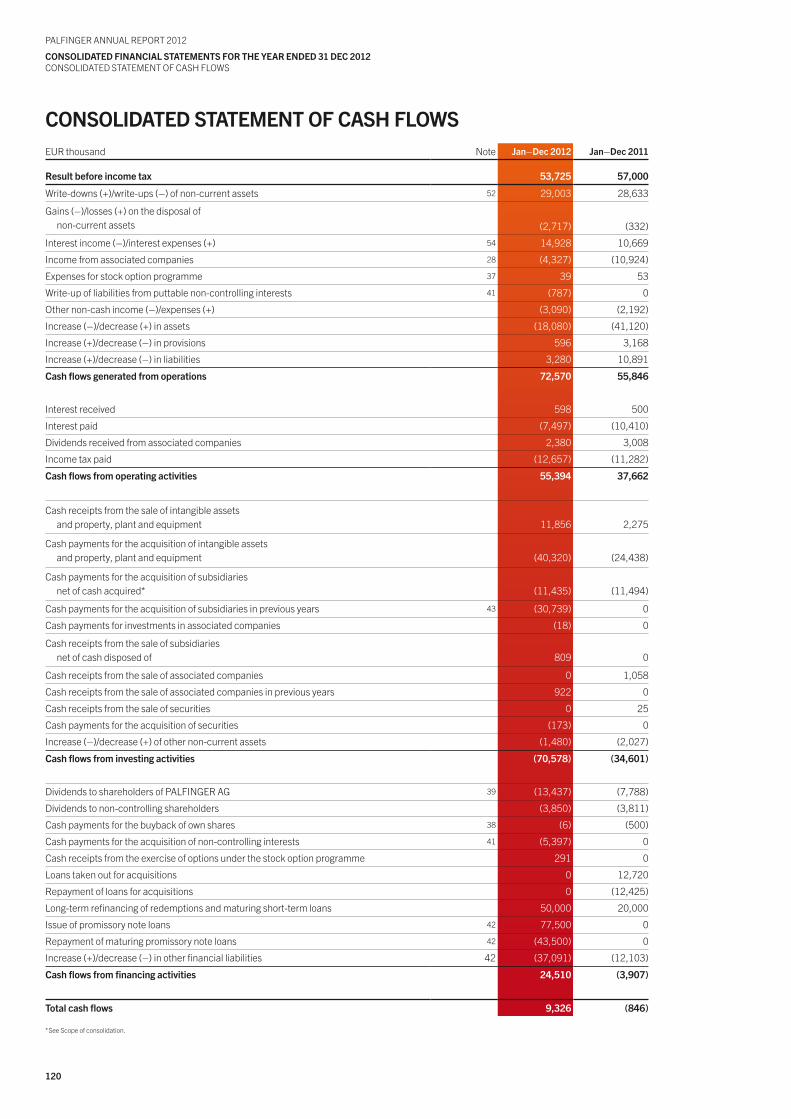
120
PALFINGER ANNuAL REPoRt 2012
coNsoLIdAtEd FINANcIAL stAtEMENts FoR thE yEAR ENdEd 31 dEc 2012CoNSoLIDAtED StAtEMENt oF CASH FLoWS
coNsoLIdAtEd stAtEMENt oF cAsh FLowsEuR thousand Note Jan–dec 2012 Jan–dec 2011
Result before income tax 53,725 57,000
Write-downs (+)/write-ups (–) of non-current assets 52 29,003 28,633
Gains (–)/losses (+) on the disposal of non-current assets (2,717) (332)
Interest income (–)/interest expenses (+) 54 14,928 10,669
Income from associated companies 28 (4,327) (10,924)
Expenses for stock option programme 37 39 53
Write-up of liabilities from puttable non-controlling interests 41 (787) 0
other non-cash income (–)/expenses (+) (3,090) (2,192)
Increase (–)/decrease (+) in assets (18,080) (41,120)
Increase (+)/decrease (–) in provisions 596 3,168
Increase (+)/decrease (–) in liabilities 3,280 10,891
cash flows generated from operations 72,570 55,846
Interest received 598 500
Interest paid (7,497) (10,410)
Dividends received from associated companies 2,380 3,008
Income tax paid (12,657) (11,282)
cash flows from operating activities 55,394 37,662
Cash receipts from the sale of intangible assetsand property, plant and equipment 11,856 2,275
Cash payments for the acquisition of intangible assetsand property, plant and equipment (40,320) (24,438)
Cash payments for the acquisition of subsidiariesnet of cash acquired* (11,435) (11,494)
Cash payments for the acquisition of subsidiaries in previous years 43 (30,739) 0
Cash payments for investments in associated companies (18) 0
Cash receipts from the sale of subsidiariesnet of cash disposed of 809 0
Cash receipts from the sale of associated companies 0 1,058
Cash receipts from the sale of associated companies in previous years 922 0
Cash receipts from the sale of securities 0 25
Cash payments for the acquisition of securities (173) 0
Increase (–)/decrease (+) of other non-current assets (1,480) (2,027)
cash flows from investing activities (70,578) (34,601)
Dividends to shareholders of PALFINGER AG 39 (13,437) (7,788)
Dividends to non-controlling shareholders (3,850) (3,811)
Cash payments for the buyback of own shares 38 (6) (500)
Cash payments for the acquisition of non-controlling interests 41 (5,397) 0
Cash receipts from the exercise of options under the stock option programme 291 0
Loans taken out for acquisitions 0 12,720
Repayment of loans for acquisitions 0 (12,425)
Long-term refinancing of redemptions and maturing short-term loans 50,000 20,000
Issue of promissory note loans 42 77,500 0
Repayment of maturing promissory note loans 42 (43,500) 0
Increase (+)/decrease (–) in other financial liabilities 42 (37,091) (12,103)
cash flows from financing activities 24,510 (3,907)
total cash flows 9,326 (846)
* See Scope of consolidation.
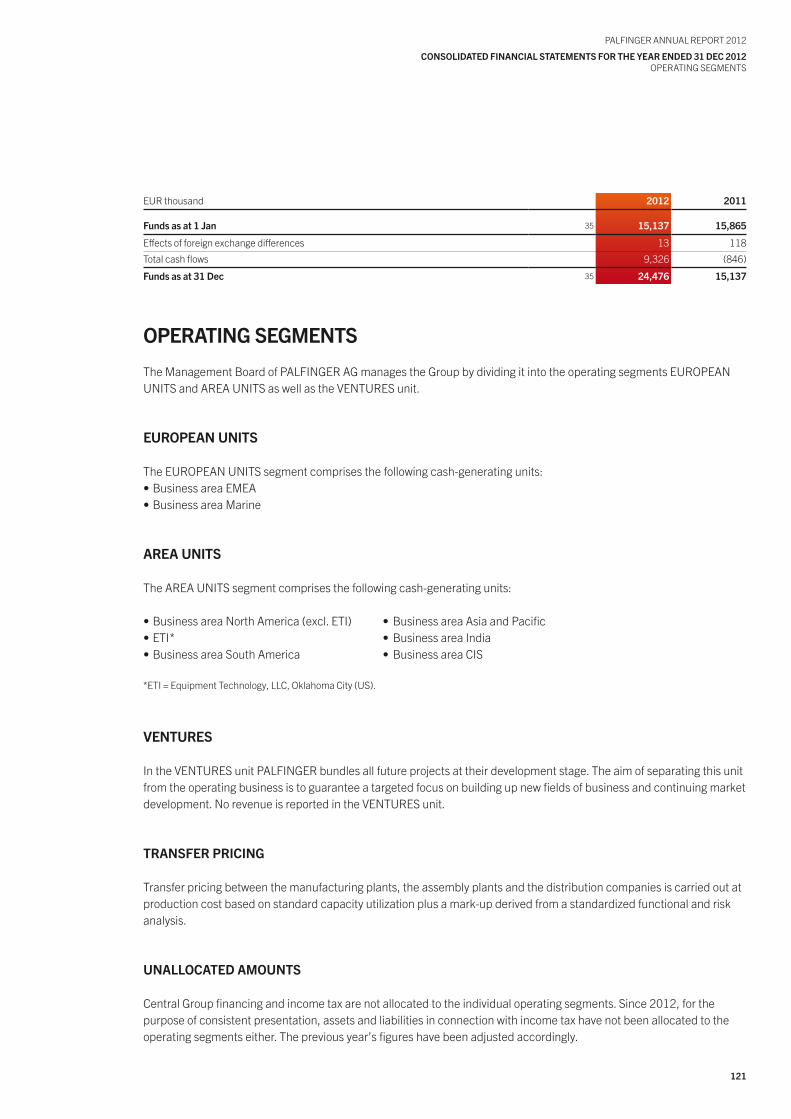
121
PALFINGER ANNuAL REPoRt 2012
coNsoLIdAtEd FINANcIAL stAtEMENts FoR thE yEAR ENdEd 31 dEc 2012oPERAtING SEGMENtS
oPERAtING sEGMENts
the Management Board of PALFINGER AG manages the Group by dividing it into the operating segments EuRoPEAN uNItS and AREA uNItS as well as the VENtuRES unit.
EuRoPEAN uNIts
the EuRoPEAN uNItS segment comprises the following cash-generating units:•BusinessareaEMEA•BusinessareaMarine
AREA uNIts
the AREA uNItS segment comprises the following cash-generating units:
•BusinessareaNorthAmerica(excl.ETI) •BusinessareaAsiaandPacific•ETI* •BusinessareaIndia•BusinessareaSouthAmerica •BusinessareaCIS
*EtI = Equipment technology, LLC, oklahoma City (uS).
VENtuREs
In the VENtuRES unit PALFINGER bundles all future projects at their development stage. the aim of separating this unit from the operating business is to guarantee a targeted focus on building up new fields of business and continuing market development. No revenue is reported in the VENtuRES unit.
tRANsFER PRIcING
transfer pricing between the manufacturing plants, the assembly plants and the distribution companies is carried out at production cost based on standard capacity utilization plus a mark-up derived from a standardized functional and risk analysis.
uNALLocAtEd AMouNts
Central Group financing and income tax are not allocated to the individual operating segments. Since 2012, for the purpose of consistent presentation, assets and liabilities in connection with income tax have not been allocated to the operating segments either. the previous year’s figures have been adjusted accordingly.
EuR thousand 2012 2011
Funds as at 1 Jan 35 15,137 15,865
Effects of foreign exchange differences 13 118
total cash flows 9,326 (846)
Funds as at 31 dec 35 24,476 15,137
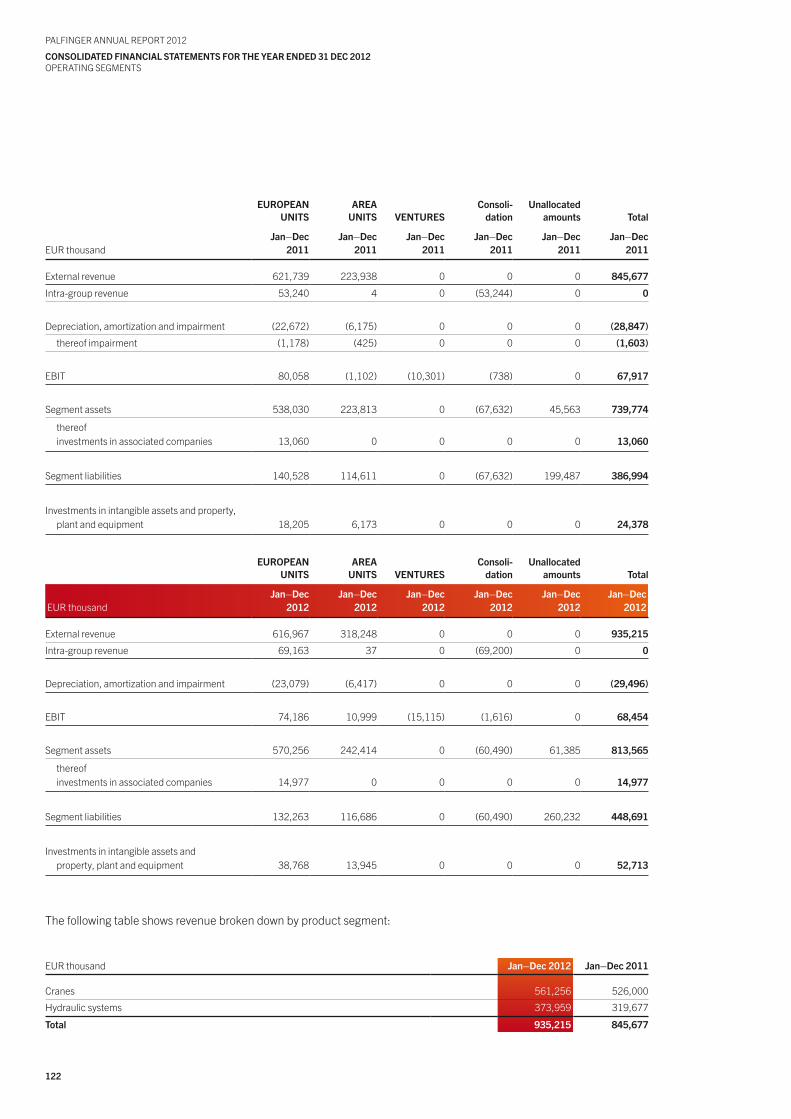
122
PALFINGER ANNuAL REPoRt 2012
coNsoLIdAtEd FINANcIAL stAtEMENts FoR thE yEAR ENdEd 31 dEc 2012oPERAtING SEGMENtS
EuRoPEAN uNIts
AREAuNIts VENtuREs
consoli-dation
unallocated amounts total
EuR thousandJan–dec
2011Jan–dec
2011Jan–dec
2011Jan–dec
2011Jan–dec
2011Jan–dec
2011
External revenue 621,739 223,938 0 0 0 845,677
Intra-group revenue 53,240 4 0 (53,244) 0 0
Depreciation, amortization and impairment (22,672) (6,175) 0 0 0 (28,847)
thereof impairment (1,178) (425) 0 0 0 (1,603)
EBIt 80,058 (1,102) (10,301) (738) 0 67,917
Segment assets 538,030 223,813 0 (67,632) 45,563 739,774
thereofinvestments in associated companies 13,060 0 0 0 0
13,060
Segment liabilities 140,528 114,611 0 (67,632) 199,487 386,994
Investments in intangible assets and property,plant and equipment 18,205 6,173 0 0 0 24,378
EuRoPEAN uNIts
AREAuNIts VENtuREs
consoli-dation
unallocated amounts total
EuR thousandJan–dec
2012Jan–dec
2012Jan–dec
2012Jan–dec
2012Jan–dec
2012Jan–dec
2012
External revenue 616,967 318,248 0 0 0 935,215
Intra-group revenue 69,163 37 0 (69,200) 0 0
Depreciation, amortization and impairment (23,079) (6,417) 0 0 0 (29,496)
EBIt 74,186 10,999 (15,115) (1,616) 0 68,454
Segment assets 570,256 242,414 0 (60,490) 61,385 813,565
thereofinvestments in associated companies 14,977 0 0 0 0
14,977
Segment liabilities 132,263 116,686 0 (60,490) 260,232 448,691
Investments in intangible assets andproperty, plant and equipment 38,768 13,945 0 0 0 52,713
the following table shows revenue broken down by product segment:
EuR thousand Jan–dec 2012 Jan–dec 2011
Cranes 561,256 526,000
Hydraulic systems 373,959 319,677
total 935,215 845,677
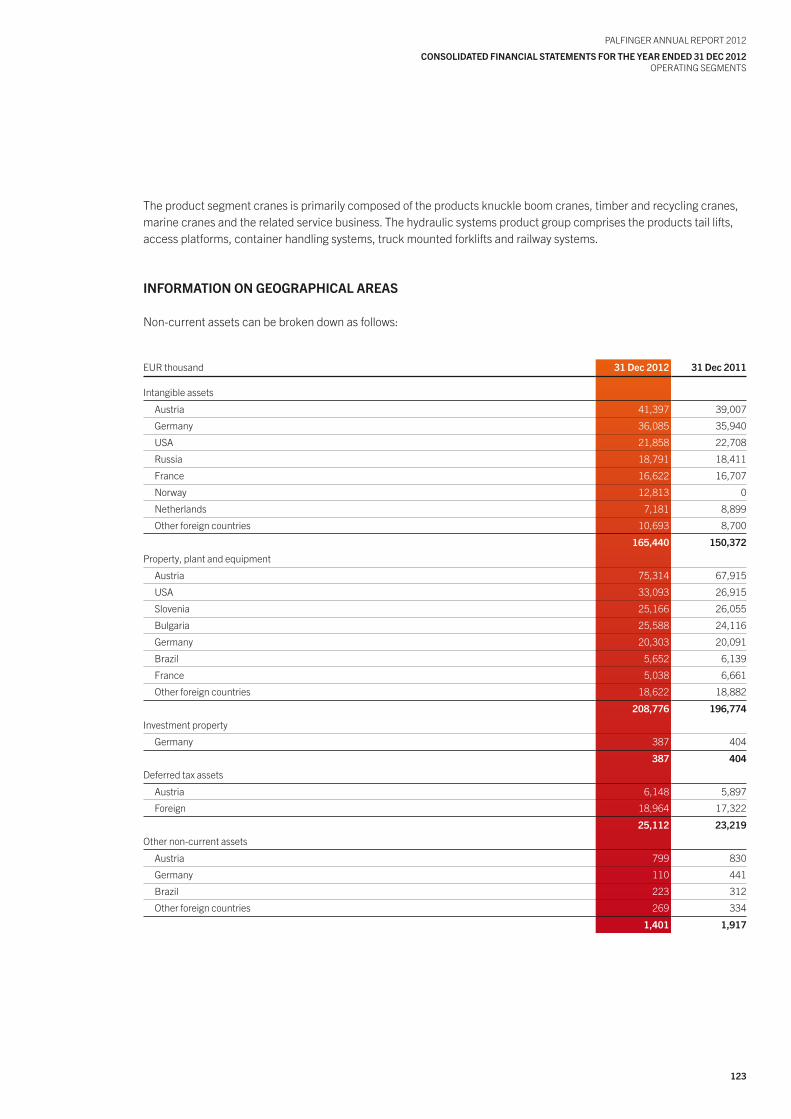
123
PALFINGER ANNuAL REPoRt 2012
coNsoLIdAtEd FINANcIAL stAtEMENts FoR thE yEAR ENdEd 31 dEc 2012oPERAtING SEGMENtS
the product segment cranes is primarily composed of the products knuckle boom cranes, timber and recycling cranes, marine cranes and the related service business. the hydraulic systems product group comprises the products tail lifts, access platforms, container handling systems, truck mounted forklifts and railway systems.
INFoRMAtIoN oN GEoGRAPhIcAL AREAs
Non-current assets can be broken down as follows:
EuR thousand 31 dec 2012 31 dec 2011
Intangible assets
Austria 41,397 39,007
Germany 36,085 35,940
uSA 21,858 22,708
Russia 18,791 18,411
France 16,622 16,707
Norway 12,813 0
Netherlands 7,181 8,899
other foreign countries 10,693 8,700
165,440 150,372
Property, plant and equipment
Austria 75,314 67,915
uSA 33,093 26,915
Slovenia 25,166 26,055
Bulgaria 25,588 24,116
Germany 20,303 20,091
Brazil 5,652 6,139
France 5,038 6,661
other foreign countries 18,622 18,882
208,776 196,774
Investment property
Germany 387 404
387 404
Deferred tax assets
Austria 6,148 5,897
Foreign 18,964 17,322
25,112 23,219
other non-current assets
Austria 799 830
Germany 110 441
Brazil 223 312
other foreign countries 269 334
1,401 1,917
124
PALFINGER ANNuAL REPoRt 2012
coNsoLIdAtEd FINANcIAL stAtEMENts FoR thE yEAR ENdEd 31 dEc 2012NotES to tHE CoNSoLIDAtED FINANCIAL StAtEMENtS
NotEs to thE coNsoLIdAtEd FINANcIAL stAtEMENts
GENERAL
PALFINGER AG is a publicly listed company headquartered in 5020 Salzburg, Austria, Franz-Wolfram-Scherer-Strasse 24.the main business activity is the production and sale of innovative lifting solutions for use on commercial vehicles and ships.
the consolidated financial statements of PALFINGER AG for the year ended 31 December 2012 were prepared in ac-cordance with the International Financial Reporting Standards (IFRS) issued by the International Accounting Standards Board (IASB) and the interpretations of the International Financial Reporting Interpretations Committee (IFRIC) as ad-opted by the European union (Eu). IFRS and IFRIC interpretations whose application is not mandatory for financial years starting on 1 January 2012 were not applied ahead of time. As these consolidated financial statements meet the criteria laid down in sec. 245a of the (Austrian) Business Code (uGB), the Company is not obligated to prepare financial state-ments in accordance with the provisions of the Code.
these consolidated financial statements were prepared as at the reporting date of the parent company PALFINGER AG. the financial year corresponds to the calendar year. With the exception of Palfinger Cranes India Pvt. Ltd., India, the financial statements of the individual Austrian and foreign companies included in the consolidated financial statements were prepared as at the reporting date of the consolidated financial statements. For Palfinger Cranes India Pvt. Ltd.,India, a reconciliation statement as at 31 December was prepared.
uniform accounting and valuation criteria were applied within the Group. the consolidated financial statements were prepared on the assumption that the Company would continue as a going concern. For the sake of a clearer presenta-tion, items were aggregated for the purposes of the consolidated balance sheet, the consolidated income statement, the statement of comprehensive income, the consolidated statement of changes in equity and the consolidated statement of cash flows. the same items were then listed and explained separately in the notes, following the principle of materiality. In general, when preparing these consolidated financial statements, the historical cost system was applied. Exceptions were made for derivate financial instruments and financial assets available for sale. these items were valued at fair value.
the consolidated balance sheet was structured in accordance with IAS 1, separating current from non-current assets and liabilities. Assets and liabilities were classified as current if they were likely to be realized or balanced within twelve months of the balance sheet date. the consolidated income statement was prepared according to the nature of expense method.
For the sake of clarity and comparability, all figures in the consolidated financial statements are, in principle, expressed in thousands of euros. Minimal arithmetic differences may arise from the application of commercial rounding to indi-vidual items and percentages.
the consolidated financial statements and the separate financial statements of the companies included were published in accordance with statutory requirements. the consolidated financial statements of PALFINGER AG for the year ended 31 December 2012 were audited by Ernst & young Wirtschaftsprüfungsgesellschaft m.b.H., Salzburg, Austria. the con-solidated financial statements for the year ended 31 December 2012 were released for submission to the Supervisory Board on 23 January 2013 by the Management Board of PALFINGER AG. It is the Supervisory Board’s task to review the consolidated financial statements and state whether it approves the consolidated financial statements for the year ended 31 December 2012.
125
PALFINGER ANNuAL REPoRt 2012
coNsoLIdAtEd FINANcIAL stAtEMENts FoR thE yEAR ENdEd 31 dEc 2012NotES to tHE CoNSoLIDAtED FINANCIAL StAtEMENtS
coNsoLIdAtIoN PRINcIPLEs
scope of consolidationPALFINGER AG prepares the consolidated financial statements for the PALFINGER Group. the consolidated financial statements comprise the financial statements of PALFINGER AG and the financial statements of the companies con-trolled by PALFINGER AG as at 31 December of each year. Control is defined as the power to govern the financial and operating policies of an entity so as to obtain economic benefits from its activities.
Associated companies are included according to the equity method. An associated company is a company on which PALFINGER AG may exercise significant influence by participating in its financial and operating policy decisions but over which it has no control or joint control. there is a rebuttable presumption that the investor holds 20 to 50 per cent of the voting power.
Joint venture companies are included in the consolidated financial statements on a proportionate basis.
As at 31 December 2012, the scope of consolidation, including PALFINGER AG as the parent company, comprised50 fully consolidated companies (previous year: 43), five companies consolidated at equity (previous year: four) and two companies consolidated on a proportionate basis (see Newly founded companies), all of whose names are disclosed in the statement of investments.
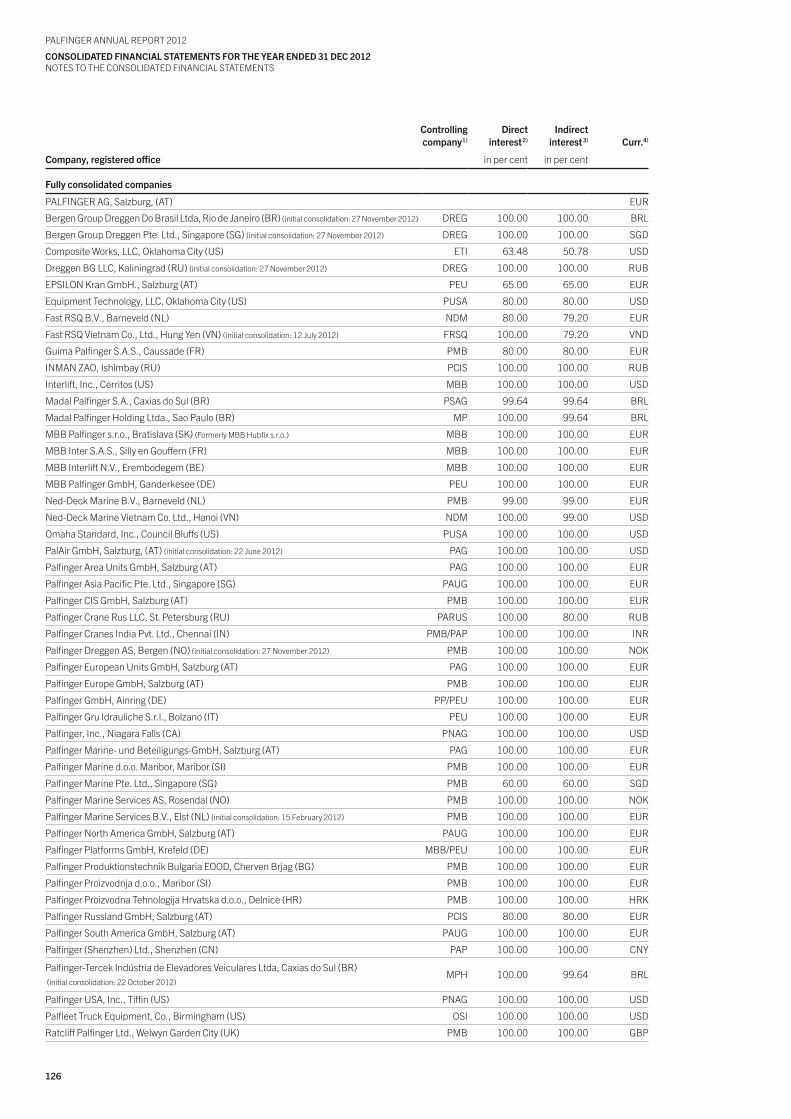
126
PALFINGER ANNuAL REPoRt 2012
coNsoLIdAtEd FINANcIAL stAtEMENts FoR thE yEAR ENdEd 31 dEc 2012NotES to tHE CoNSoLIDAtED FINANCIAL StAtEMENtS
controllingcompany1)
directinterest2)
Indirectinterest3) curr.4)
company, registered office in per cent in per cent
Fully consolidated companies
PALFINGER AG, Salzburg, (At) EuR
Bergen Group Dreggen Do Brasil Ltda, Rio de Janeiro (BR) (initial consolidation: 27 November 2012) DREG 100.00 100.00 BRL
Bergen Group Dreggen Pte. Ltd., Singapore (SG) (initial consolidation: 27 November 2012) DREG 100.00 100.00 SGD
Composite Works, LLC, oklahoma City (uS) EtI 63.48 50.78 uSD
Dreggen BG LLC, Kaliningrad (Ru) (initial consolidation: 27 November 2012) DREG 100.00 100.00 RuB
EPSILoN Kran GmbH., Salzburg (At) PEu 65.00 65.00 EuR
Equipment technology, LLC, oklahoma City (uS) PuSA 80.00 80.00 uSD
Fast RSQ B.V., Barneveld (NL) NDM 80.00 79.20 EuR
Fast RSQ Vietnam Co., Ltd., Hung yen (VN) (initial consolidation: 12 July 2012) FRSQ 100.00 79.20 VND
Guima Palfinger S.A.S., Caussade (FR) PMB 80.00 80.00 EuR
INMAN ZAo, Ishimbay (Ru) PCIS 100.00 100.00 RuB
Interlift, Inc., Cerritos (uS) MBB 100.00 100.00 uSD
Madal Palfinger S.A., Caxias do Sul (BR) PSAG 99.64 99.64 BRL
Madal Palfinger Holding Ltda., Sao Paulo (BR) MP 100.00 99.64 BRL
MBB Palfinger s.r.o., Bratislava (SK) (Formerly MBB Hubfix s.r.o.) MBB 100.00 100.00 EuR
MBB Inter S.A.S., Silly en Gouffern (FR) MBB 100.00 100.00 EuR
MBB Interlift N.V., Erembodegem (BE) MBB 100.00 100.00 EuR
MBB Palfinger GmbH, Ganderkesee (DE) PEu 100.00 100.00 EuR
Ned-Deck Marine B.V., Barneveld (NL) PMB 99.00 99.00 EuR
Ned-Deck Marine Vietnam Co. Ltd., Hanoi (VN) NDM 100.00 99.00 uSD
omaha Standard, Inc., Council Bluffs (uS) PuSA 100.00 100.00 uSD
PalAir GmbH, Salzburg, (At) (initial consolidation: 22 June 2012) PAG 100.00 100.00 uSD
Palfinger Area units GmbH, Salzburg (At) PAG 100.00 100.00 EuR
Palfinger Asia Pacific Pte. Ltd., Singapore (SG) PAuG 100.00 100.00 EuR
Palfinger CIS GmbH, Salzburg (At) PMB 100.00 100.00 EuR
Palfinger Crane Rus LLC, St. Petersburg (Ru) PARuS 100.00 80.00 RuB
Palfinger Cranes India Pvt. Ltd., Chennai (IN) PMB/PAP 100.00 100.00 INR
Palfinger Dreggen AS, Bergen (No) (initial consolidation: 27 November 2012) PMB 100.00 100.00 NoK
Palfinger European units GmbH, Salzburg (At) PAG 100.00 100.00 EuR
Palfinger Europe GmbH, Salzburg (At) PMB 100.00 100.00 EuR
Palfinger GmbH, Ainring (DE) PP/PEu 100.00 100.00 EuR
Palfinger Gru Idrauliche S.r.l., Bolzano (It) PEu 100.00 100.00 EuR
Palfinger, Inc., Niagara Falls (CA) PNAG 100.00 100.00 uSD
Palfinger Marine- und Beteiligungs-GmbH, Salzburg (At) PAG 100.00 100.00 EuR
Palfinger Marine d.o.o. Maribor, Maribor (SI) PMB 100.00 100.00 EuR
Palfinger Marine Pte. Ltd., Singapore (SG) PMB 60.00 60.00 SGD
Palfinger Marine Services AS, Rosendal (No) PMB 100.00 100.00 NoK
Palfinger Marine Services B.V., Elst (NL) (initial consolidation: 15 February 2012) PMB 100.00 100.00 EuR
Palfinger North America GmbH, Salzburg (At) PAuG 100.00 100.00 EuR
Palfinger Platforms GmbH, Krefeld (DE) MBB/PEu 100.00 100.00 EuR
Palfinger Produktionstechnik Bulgaria EooD, Cherven Brjag (BG) PMB 100.00 100.00 EuR
Palfinger Proizvodnja d.o.o., Maribor (SI) PMB 100.00 100.00 EuR
Palfinger Proizvodna tehnologija Hrvatska d.o.o., Delnice (HR) PMB 100.00 100.00 HRK
Palfinger Russland GmbH, Salzburg (At) PCIS 80.00 80.00 EuR
Palfinger South America GmbH, Salzburg (At) PAuG 100.00 100.00 EuR
Palfinger (Shenzhen) Ltd., Shenzhen (CN) PAP 100.00 100.00 CNy
Palfinger-tercek Indústria de Elevadores Veiculares Ltda, Caxias do Sul (BR) (initial consolidation: 22 october 2012)
MPH 100.00 99.64 BRL
Palfinger uSA, Inc., tiffin (uS) PNAG 100.00 100.00 uSD
Palfleet truck Equipment, Co., Birmingham (uS) oSI 100.00 100.00 uSD
Ratcliff Palfinger Ltd., Welwyn Garden City (uK) PMB 100.00 100.00 GBP
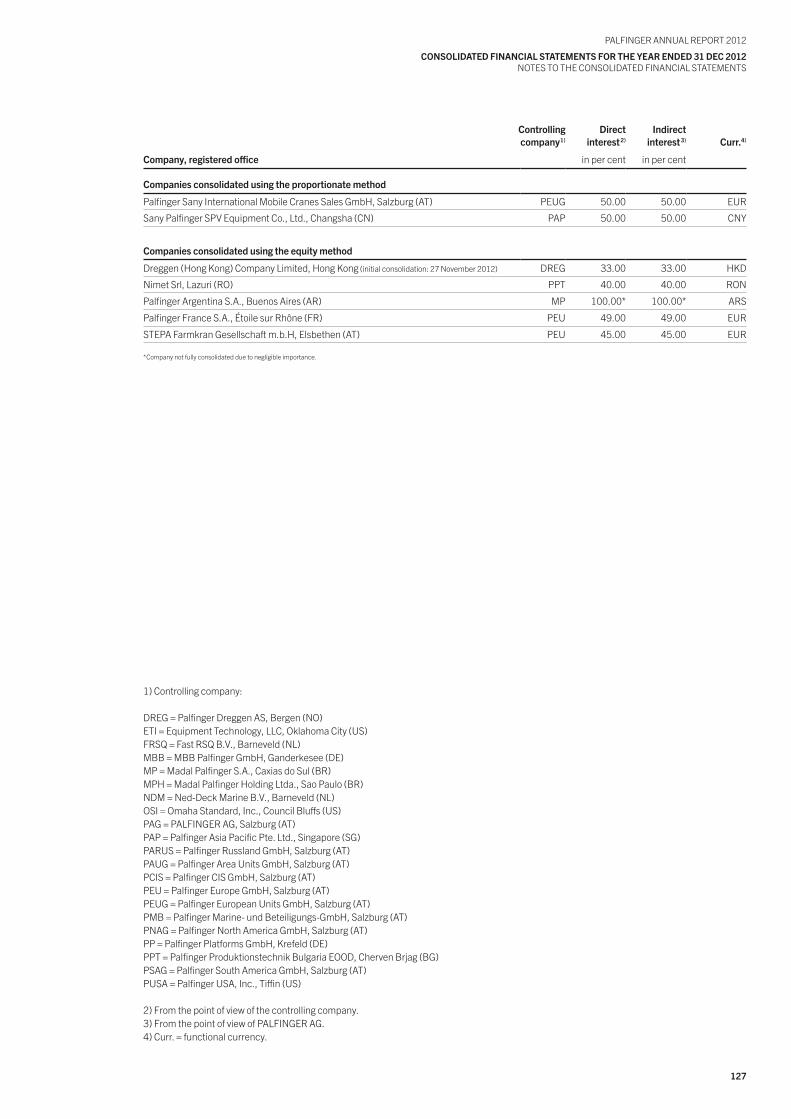
127
PALFINGER ANNuAL REPoRt 2012
coNsoLIdAtEd FINANcIAL stAtEMENts FoR thE yEAR ENdEd 31 dEc 2012NotES to tHE CoNSoLIDAtED FINANCIAL StAtEMENtS
1) Controlling company:
DREG = Palfinger Dreggen AS, Bergen (No)EtI = Equipment technology, LLC, oklahoma City (uS)FRSQ = Fast RSQ B.V., Barneveld (NL)MBB = MBB Palfinger GmbH, Ganderkesee (DE)MP = Madal Palfinger S.A., Caxias do Sul (BR)MPH = Madal Palfinger Holding Ltda., Sao Paulo (BR)NDM = Ned-Deck Marine B.V., Barneveld (NL)oSI = omaha Standard, Inc., Council Bluffs (uS)PAG = PALFINGER AG, Salzburg (At)PAP = Palfinger Asia Pacific Pte. Ltd., Singapore (SG)PARuS = Palfinger Russland GmbH, Salzburg (At)PAuG = Palfinger Area units GmbH, Salzburg (At)PCIS = Palfinger CIS GmbH, Salzburg (At)PEu = Palfinger Europe GmbH, Salzburg (At)PEuG = Palfinger European units GmbH, Salzburg (At)PMB = Palfinger Marine- und Beteiligungs-GmbH, Salzburg (At)PNAG = Palfinger North America GmbH, Salzburg (At)PP = Palfinger Platforms GmbH, Krefeld (DE)PPt = Palfinger Produktionstechnik Bulgaria EooD, Cherven Brjag (BG)PSAG = Palfinger South America GmbH, Salzburg (At)PuSA = Palfinger uSA, Inc., tiffin (uS)
2) From the point of view of the controlling company.3) From the point of view of PALFINGER AG.4) Curr. = functional currency.
controllingcompany1)
directinterest2)
Indirectinterest3) curr.4)
company, registered office in per cent in per cent
companies consolidated using the proportionate method
Palfinger Sany International Mobile Cranes Sales GmbH, Salzburg (At) PEuG 50.00 50.00 EuR
Sany Palfinger SPV Equipment Co., Ltd., Changsha (CN) PAP 50.00 50.00 CNy
companies consolidated using the equity method
Dreggen (Hong Kong) Company Limited, Hong Kong (initial consolidation: 27 November 2012) DREG 33.00 33.00 HKD
Nimet Srl, Lazuri (Ro) PPt 40.00 40.00 RoN
Palfinger Argentina S.A., Buenos Aires (AR) MP 100.00* 100.00* ARS
Palfinger France S.A., Étoile sur Rhône (FR) PEu 49.00 49.00 EuR
StEPA Farmkran Gesellschaft m.b.H, Elsbethen (At) PEu 45.00 45.00 EuR
*Company not fully consolidated due to negligible importance.
128
PALFINGER ANNuAL REPoRt 2012
coNsoLIdAtEd FINANcIAL stAtEMENts FoR thE yEAR ENdEd 31 dEc 2012NotES to tHE CoNSoLIDAtED FINANCIAL StAtEMENtS
NEWLyFOUNDEDCOMPANIESon 28 February 2012, the agreements on the establishment of two joint venture companies with the Chinese heavy equipment manufacturer Sany Group Co., Ltd. were signed:
on 21 August 2012, Sany Palfinger SPV Equipment Co., Ltd. was founded in Changsha, China. Palfinger Asia Pacific Pte. Ltd.holds a 50 per cent interest in the new company, which will develop and produce truck mounted knuckle boom cranes and telescopic cranes for the Chinese market on the basis of the technologies of PALFINGER and Sany. For this purpose, a new plant near Sany’s facilities, with production capacities for approx. 10,000 cranes, will be established and a dense sales and services network set up in China. the company started operations in the third quarter of 2012 and will reach full operational effectiveness in 2013. the company has been included in the consolidated financial statements on a pro-portionate basis.
Palfinger Sany International Mobile Cranes Sales GmbH was established as an international sales and services companywith its registered seat in Salzburg. It distributes Sany’s mobile cranes in Europe and CIS. Palfinger European units GmbHholds a 50 per cent interest in the company, which was entered into the commercial register held at the ProvincialCourt of Salzburg Acting as the Commercial Court on 4 September 2012. the company has already started operations. the company has been included in the consolidated financial statements on a proportionale basis.
under the articles of association dated 13 February 2012, Palfinger Marine- und Beteiligungs-GmbH, Salzburg, founded Palfinger Marine Services B.V., Elst, Netherlands, as a wholly-owned subsidiary. the company was entered into the commercial register held by the Commercial Court on 15 February 2012. the purpose of founding this company was to promote the expansion of the services business in the Marine business area.
under the articles of association dated 6 June 2012, PALFINGER AG, Salzburg, founded the wholly-owned subsidiary PalAir GmbH, Salzburg. the company was entered into the commercial register held at the Provincial Court of Salzburg Acting as the Commercial Court on 22 June 2012. the object of the company is the purchase and sale and/or the leasing and chartering of aircraft as well as their operation. As the economic environment for aircraft is predominantly influenced by the uS dollar, the functional currency of this company is the uS dollar.
on 12 July 2012, Fast RSQ B.V., Barneveld, Netherlands, founded Fast RSQ Vietnam Co., Ltd., Hung yen, Vietnam, for the purpose of taking up the production of Fast RSQ products.
REORGANIZATIONSunder PALFINGER’s project to optimize the Group’s structure, its organizational structure under company law has been adjusted to the current management structure and the Group has been subdivided into investment companies and op-erating companies. For this reason, on 25 June 2012, Palfinger Marine- und Beteiligungs-GmbH, Salzburg, transferred Palfinger uSA, Inc., tiffin, uSA, and its subsidiaries to Palfinger North America GmbH, Salzburg, and also transferred Madal Palfinger S.A., Caxias do Sul, Brazil, to Palfinger South America GmbH, Salzburg.
In addition, with effect as of 14 September 2012, Palfinger Marine- und Beteiligungs-GmbH, Salzburg, transferred 100 percent of the shares in Palfinger, Inc., Niagara Falls, Canada, to Palfinger North America GmbH, and 49 per cent of the shares in Palfinger Russland GmbH, Salzburg, to Palfinger CIS GmbH, Salzburg. As a consequence, Palfinger CIS GmbH now holds an 80 per cent interest in Palfinger Russland GmbH.
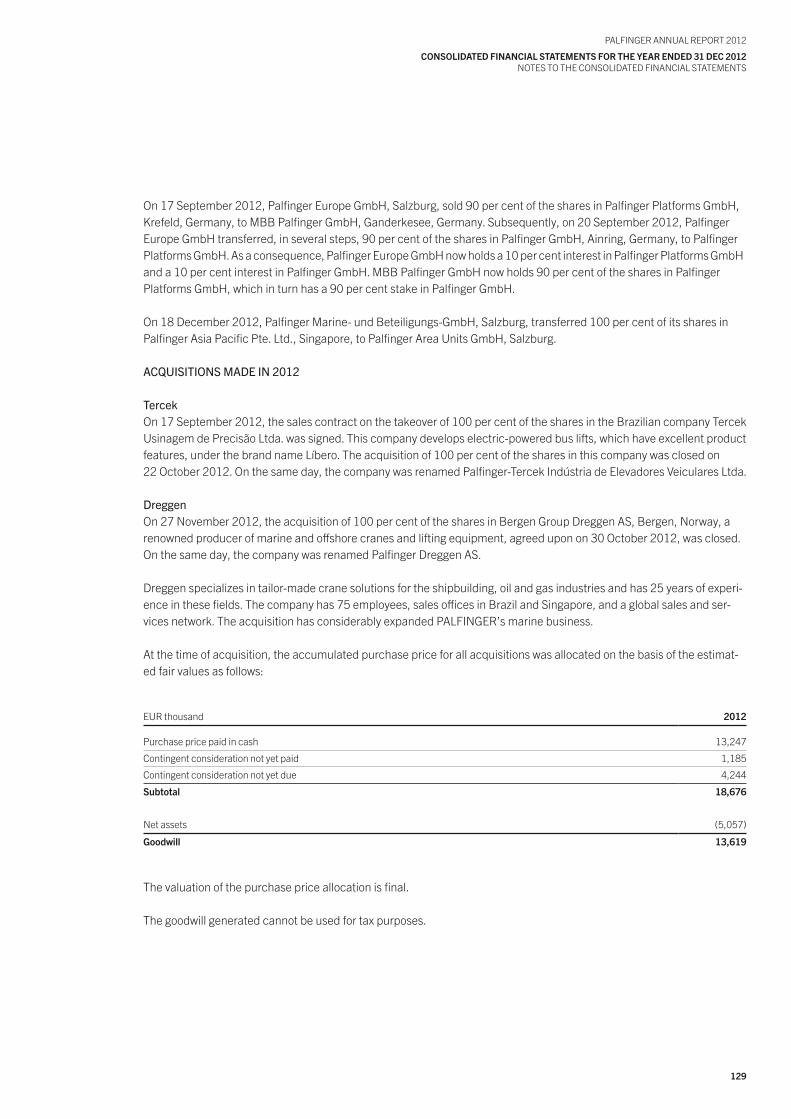
129
PALFINGER ANNuAL REPoRt 2012
coNsoLIdAtEd FINANcIAL stAtEMENts FoR thE yEAR ENdEd 31 dEc 2012NotES to tHE CoNSoLIDAtED FINANCIAL StAtEMENtS
on 17 September 2012, Palfinger Europe GmbH, Salzburg, sold 90 per cent of the shares in Palfinger Platforms GmbH, Krefeld, Germany, to MBB Palfinger GmbH, Ganderkesee, Germany. Subsequently, on 20 September 2012, Palfinger Europe GmbH transferred, in several steps, 90 per cent of the shares in Palfinger GmbH, Ainring, Germany, to PalfingerPlatforms GmbH. As a consequence, Palfinger Europe GmbH now holds a 10 per cent interest in Palfinger Platforms GmbHand a 10 per cent interest in Palfinger GmbH. MBB Palfinger GmbH now holds 90 per cent of the shares in Palfinger Platforms GmbH, which in turn has a 90 per cent stake in Palfinger GmbH.
on 18 December 2012, Palfinger Marine- und Beteiligungs-GmbH, Salzburg, transferred 100 per cent of its shares in Palfinger Asia Pacific Pte. Ltd., Singapore, to Palfinger Area units GmbH, Salzburg.
ACQUISITIONSMADEIN2012
Tercekon 17 September 2012, the sales contract on the takeover of 100 per cent of the shares in the Brazilian company tercek usinagem de Precisão Ltda. was signed. this company develops electric-powered bus lifts, which have excellent product features, under the brand name Líbero. the acquisition of 100 per cent of the shares in this company was closed on 22 october 2012. on the same day, the company was renamed Palfinger-tercek Indústria de Elevadores Veiculares Ltda.
Dreggenon 27 November 2012, the acquisition of 100 per cent of the shares in Bergen Group Dreggen AS, Bergen, Norway, a renowned producer of marine and offshore cranes and lifting equipment, agreed upon on 30 october 2012, was closed. on the same day, the company was renamed Palfinger Dreggen AS. Dreggen specializes in tailor-made crane solutions for the shipbuilding, oil and gas industries and has 25 years of experi-ence in these fields. the company has 75 employees, sales offices in Brazil and Singapore, and a global sales and ser-vices network. the acquisition has considerably expanded PALFINGER’s marine business.
At the time of acquisition, the accumulated purchase price for all acquisitions was allocated on the basis of the estimat-ed fair values as follows:
EuR thousand 2012
Purchase price paid in cash 13,247
Contingent consideration not yet paid 1,185
Contingent consideration not yet due 4,244
subtotal 18,676
Net assets (5,057)
Goodwill 13,619
the valuation of the purchase price allocation is final.
the goodwill generated cannot be used for tax purposes.
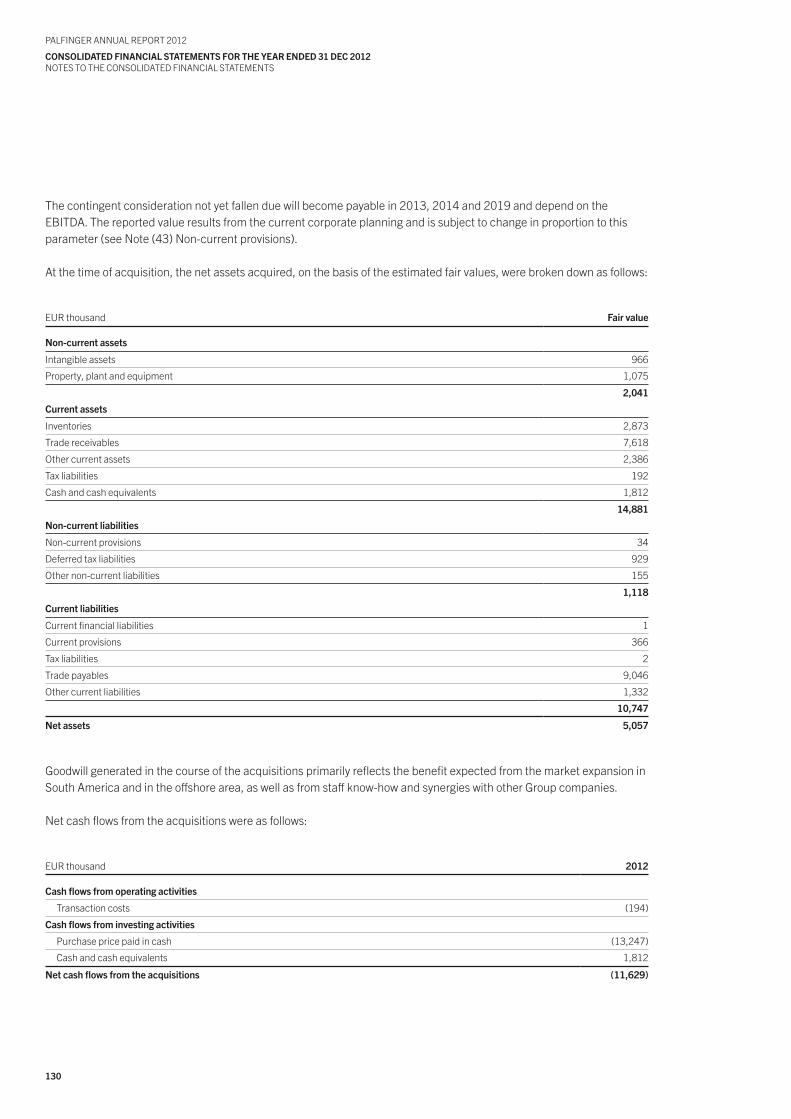
130
PALFINGER ANNuAL REPoRt 2012
coNsoLIdAtEd FINANcIAL stAtEMENts FoR thE yEAR ENdEd 31 dEc 2012NotES to tHE CoNSoLIDAtED FINANCIAL StAtEMENtS
the contingent consideration not yet fallen due will become payable in 2013, 2014 and 2019 and depend on the EBItDA. the reported value results from the current corporate planning and is subject to change in proportion to this parameter (see Note (43) Non-current provisions).
At the time of acquisition, the net assets acquired, on the basis of the estimated fair values, were broken down as follows:
EuR thousand Fair value
Non-current assets
Intangible assets 966
Property, plant and equipment 1,075
2,041
current assets
Inventories 2,873
trade receivables 7,618
other current assets 2,386
tax liabilities 192
Cash and cash equivalents 1,812
14,881
Non-current liabilities
Non-current provisions 34
Deferred tax liabilities 929
other non-current liabilities 155
1,118
current liabilities
Current financial liabilities 1
Current provisions 366
tax liabilities 2
trade payables 9,046
other current liabilities 1,332
10,747
Net assets 5,057
Goodwill generated in the course of the acquisitions primarily reflects the benefit expected from the market expansion in South America and in the offshore area, as well as from staff know-how and synergies with other Group companies.
Net cash flows from the acquisitions were as follows:
EuR thousand 2012
cash flows from operating activities
transaction costs (194)
cash flows from investing activities
Purchase price paid in cash (13,247)
Cash and cash equivalents 1,812
Net cash flows from the acquisitions (11,629)
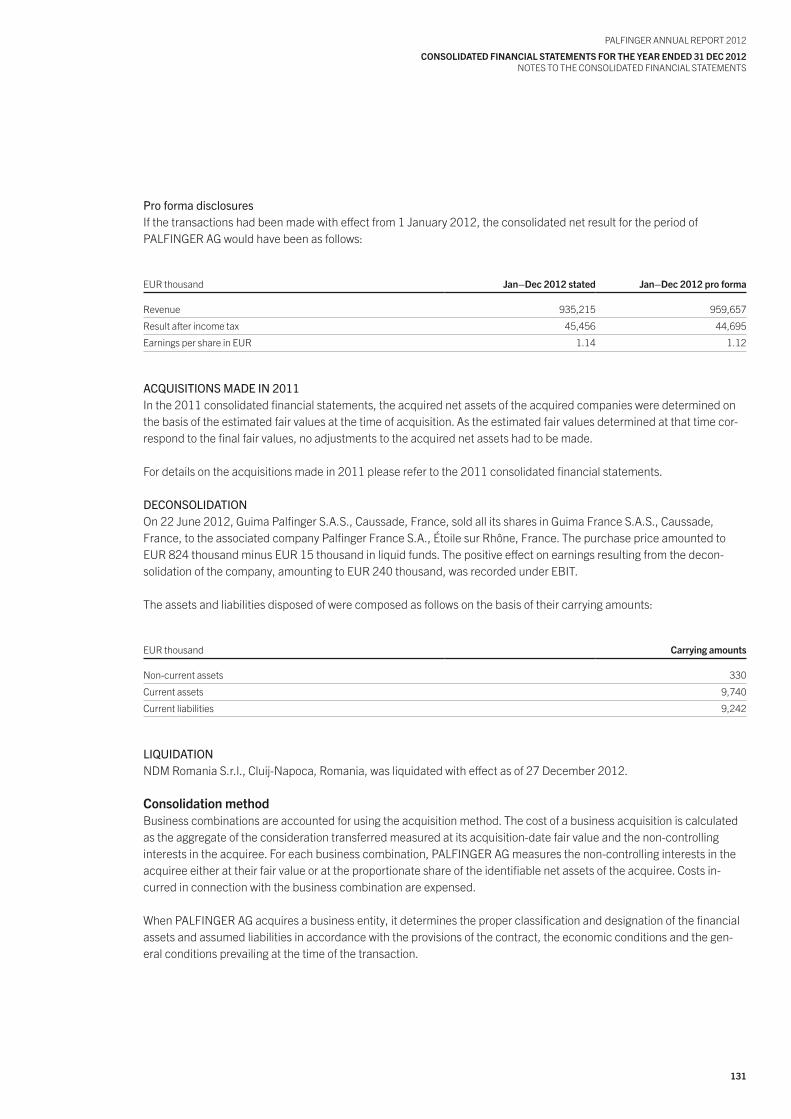
131
PALFINGER ANNuAL REPoRt 2012
coNsoLIdAtEd FINANcIAL stAtEMENts FoR thE yEAR ENdEd 31 dEc 2012NotES to tHE CoNSoLIDAtED FINANCIAL StAtEMENtS
ProformadisclosuresIf the transactions had been made with effect from 1 January 2012, the consolidated net result for the period of PALFINGER AG would have been as follows:
EuR thousand Jan–dec 2012 stated Jan–dec 2012 pro forma
Revenue 935,215 959,657
Result after income tax 45,456 44,695
Earnings per share in EuR 1.14 1.12
ACQUISITIONSMADEIN2011In the 2011 consolidated financial statements, the acquired net assets of the acquired companies were determined on the basis of the estimated fair values at the time of acquisition. As the estimated fair values determined at that time cor-respond to the final fair values, no adjustments to the acquired net assets had to be made.
For details on the acquisitions made in 2011 please refer to the 2011 consolidated financial statements.
DECONSOLIDATIONon 22 June 2012, Guima Palfinger S.A.S., Caussade, France, sold all its shares in Guima France S.A.S., Caussade, France, to the associated company Palfinger France S.A., Étoile sur Rhône, France. the purchase price amounted to EuR 824 thousand minus EuR 15 thousand in liquid funds. the positive effect on earnings resulting from the decon- solidation of the company, amounting to EuR 240 thousand, was recorded under EBIt.
the assets and liabilities disposed of were composed as follows on the basis of their carrying amounts:
EuR thousand carrying amounts
Non-current assets 330
Current assets 9,740
Current liabilities 9,242
LIQUIDATIONNDM Romania S.r.l., Cluij-Napoca, Romania, was liquidated with effect as of 27 December 2012.
consolidation methodBusiness combinations are accounted for using the acquisition method. the cost of a business acquisition is calculated as the aggregate of the consideration transferred measured at its acquisition-date fair value and the non-controllinginterests in the acquiree. For each business combination, PALFINGER AG measures the non-controlling interests in the acquiree either at their fair value or at the proportionate share of the identifiable net assets of the acquiree. Costs in-curred in connection with the business combination are expensed.
When PALFINGER AG acquires a business entity, it determines the proper classification and designation of the financial assets and assumed liabilities in accordance with the provisions of the contract, the economic conditions and the gen-eral conditions prevailing at the time of the transaction.
132
PALFINGER ANNuAL REPoRt 2012
coNsoLIdAtEd FINANcIAL stAtEMENts FoR thE yEAR ENdEd 31 dEc 2012NotES to tHE CoNSoLIDAtED FINANCIAL StAtEMENtS
For business combinations achieved in stages, the equity interest in the entity previously held by PALFINGER AG is re-measured at its fair value at the time of the transaction and the resulting gain or loss recognized in the income statement.
the agreed contingent consideration is recognized at its fair value at the acquisition date. Subsequent changes in the fair value of a contingent consideration representing an asset or liability are recognized through the income statement in accordance with IAS 39.
Goodwill is initially measured at cost, this being the excess of the consideration transferred plus the fair value of the previously held non-controlling interests over the Group’s identifiable assets and liabilities acquired. If this consideration is less than the fair value of the net assets of the acquired subsidiary, the difference is recognized through the income statement.
Following initial recognition, goodwill is measured at cost less any accumulated impairment losses. For the purpose of impairment testing, goodwill acquired in a business combination is, from the acquisition date, allocated to each of the Group’s cash-generating units that are expected to benefit from the synergies of the business combination, irrespective of whether other assets or liabilities of the acquiree are assigned to those cash-generating units.
Where goodwill forms part of a cash-generating unit and part of the operation within that unit is disposed of, the goodwill associated with the operation disposed of is included in the carrying amount of the operation when determining the gain or loss on disposal of the operation. Goodwill disposed of under these circumstances is measured based on the relative values of the operation disposed of and the portion of the cash-generating unit retained.
Earnings, assets and liabilities of associated companies are included in the consolidated financial statements applying the equity method. Investments in associated companies are reported in the balance sheet at cost after the adjustment to changes in the Group’s share of net assets after acquisition and impairment losses. Losses exceeding the Group’s investments in associated companies are not recognized unless the Group bears the economic risk. the goodwill relating to the associated company is included in the carrying amount of this share and is neither amortized on a straight-line basis nor subjected to a separate impairment test.
Any change in the amount of the interest held in a subsidiary not resulting in loss of control is accounted for as an equity transaction.
Intra-group accounts receivable and payable, income and expenses as well as inter-company profits and losses are fully eliminated.
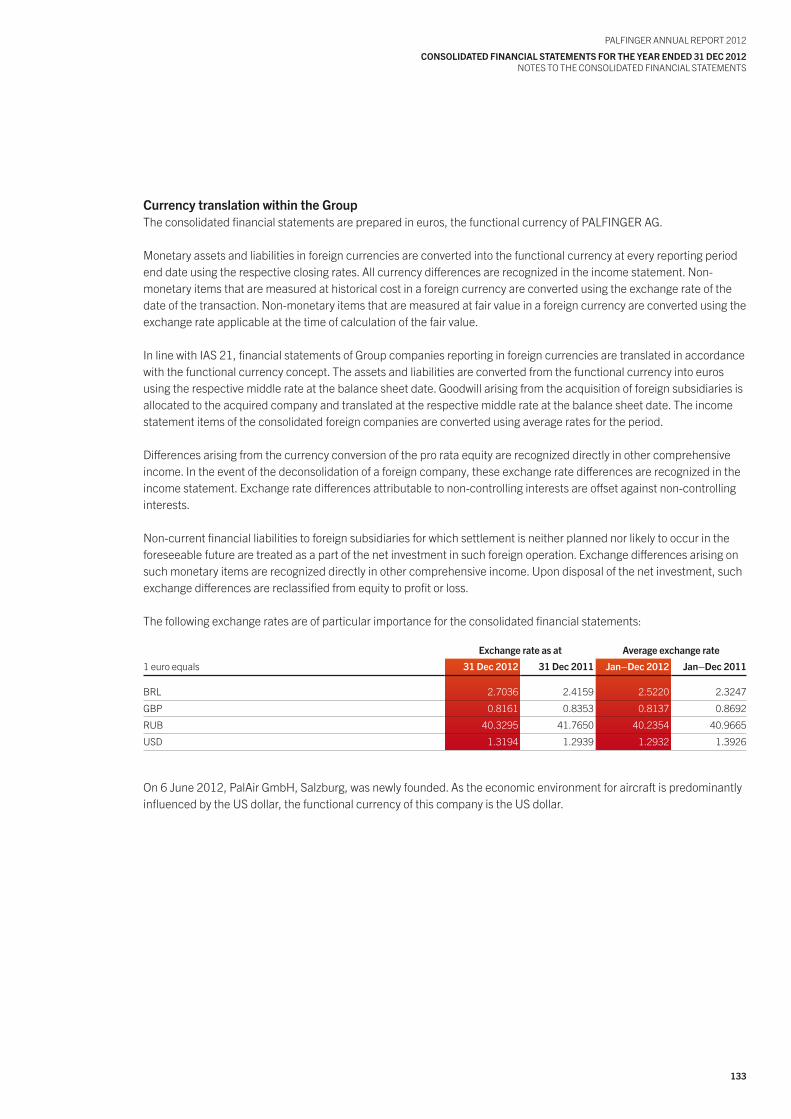
133
PALFINGER ANNuAL REPoRt 2012
coNsoLIdAtEd FINANcIAL stAtEMENts FoR thE yEAR ENdEd 31 dEc 2012NotES to tHE CoNSoLIDAtED FINANCIAL StAtEMENtS
currency translation within the Groupthe consolidated financial statements are prepared in euros, the functional currency of PALFINGER AG.
Monetary assets and liabilities in foreign currencies are converted into the functional currency at every reporting period end date using the respective closing rates. All currency differences are recognized in the income statement. Non-monetary items that are measured at historical cost in a foreign currency are converted using the exchange rate of the date of the transaction. Non-monetary items that are measured at fair value in a foreign currency are converted using the exchange rate applicable at the time of calculation of the fair value.
In line with IAS 21, financial statements of Group companies reporting in foreign currencies are translated in accordance with the functional currency concept. the assets and liabilities are converted from the functional currency into euros using the respective middle rate at the balance sheet date. Goodwill arising from the acquisition of foreign subsidiaries is allocated to the acquired company and translated at the respective middle rate at the balance sheet date. the income statement items of the consolidated foreign companies are converted using average rates for the period.
Differences arising from the currency conversion of the pro rata equity are recognized directly in other comprehensive income. In the event of the deconsolidation of a foreign company, these exchange rate differences are recognized in the income statement. Exchange rate differences attributable to non-controlling interests are offset against non-controlling interests.
Non-current financial liabilities to foreign subsidiaries for which settlement is neither planned nor likely to occur in the foreseeable future are treated as a part of the net investment in such foreign operation. Exchange differences arising on such monetary items are recognized directly in other comprehensive income. upon disposal of the net investment, such exchange differences are reclassified from equity to profit or loss. the following exchange rates are of particular importance for the consolidated financial statements:
Exchange rate as at Average exchange rate
1 euro equals 31 dec 2012 31 dec 2011 Jan–dec 2012 Jan–dec 2011
BRL 2.7036 2.4159 2.5220 2.3247
GBP 0.8161 0.8353 0.8137 0.8692
RuB 40.3295 41.7650 40.2354 40.9665
uSD 1.3194 1.2939 1.2932 1.3926
on 6 June 2012, PalAir GmbH, Salzburg, was newly founded. As the economic environment for aircraft is predominantly influenced by the uS dollar, the functional currency of this company is the uS dollar.
134
PALFINGER ANNuAL REPoRt 2012
coNsoLIdAtEd FINANcIAL stAtEMENts FoR thE yEAR ENdEd 31 dEc 2012NotES to tHE CoNSoLIDAtED FINANCIAL StAtEMENtS
cAPItAL MANAGEMENt
PALFINGER’s target is to maintain a strong equity structure in order to retain the trust of investors, lenders and the market and to guarantee a solid capital basis for its future business development.
Net debt of PALFINGER is controlled centrally in consultation with the corporate treasury department, whose main responsibilities include long-term guaranteed liquidity in support of business operations, an efficient use of banking and financial services and limiting financial risks while optimizing revenue and costs. Central synergy effects and local oppor-tunities are taken into consideration as well.
PALFINGER controls its capital structure taking into consideration the change in economic framework conditions, the strategic projects agreed upon and the internal equity ratio and gearing ratio targets. A promissory note loan with a total volume of EuR 77.5 million was issued in order to leverage on the historically favourable interest rates in 2012. Matur-ing funding was refinanced through long-term bank loans, which also resulted in an extension of the capital commitment of financial liabilities. Flexibility in funding was also increased by expanding credit lines. When agreeing on credit lines, PALFINGER continues to pay special attention to their long-term availability.
In order to maintain this capital structure, PALFINGER pursues a consistent dividend policy based on the consolidated net result for the previous year. In accordance with PALFINGER’s long-term dividend policy of distributing one third of the consolidated net result for the period to its shareholders, a dividend of EuR 0.38 per share was paid in 2012.
PALFINGER monitors its capital using the gearing ratio, which corresponds to the ratio of net debt and equity, as well as the equity ratio. In the long term, an equity rate of more than 50 per cent and a gearing ratio below 50 per cent are desirable. Net debt of EuR 217,565 thousand (previous year: EuR 166,876 thousand) includes non-current and current financial assets and the cash holdings as well as non-current and current financial liabilities. Equity of EuR 364,874 thousand (previous year: EuR 352,780 thousand) corresponds to the equity reported according to IFRS.
AccouNtING ANd VALuAtIoN MEAsuREs
(1) Intangible assetsPurchased intangible assets are capitalized at acquisition cost. Internally generated intangible assets are capitalized at manufacturing cost if the preconditions set out in IAS 38 regarding the capitalization of internally generated intangible assets are satisfied.
Intangible assets are subject to amortization over their relevant useful lives. Amortization is performed on a straight-line basis over a time frame between two and fifteen years or in line with the products’ life cycles in the case of development expenses, and is recorded under the item depreciation, amortization and impairment expenses. Customer relation-ships capitalized as part of acquisitions are amortized over a useful life of five to ten years. At the end of every financial year, the residual values, the useful lives and the methods of amortization of these assets are reviewed and, if necessary, adjusted prospectively. Changes in the method or period of amortization that become necessary as a consequence of modifications of the anticipated useful lives or the expected consumption of the future economic benefits of the assets are treated as changes in estimates.
In the case of intangible assets with indefinite useful lives and intangible assets under development, each asset is tested for impairment at least once a year. these intangible assets are not amortized over their useful lives on a systematic ba-sis. once a year, the useful lives of all intangible assets with indefinite useful lives are checked as to whether the estima-tions of the indefinite useful lives are still justified. If this is not the case, the estimates are changed prospectively from an indefinite useful life into a finite useful life.
135
PALFINGER ANNuAL REPoRt 2012
coNsoLIdAtEd FINANcIAL stAtEMENts FoR thE yEAR ENdEd 31 dEc 2012NotES to tHE CoNSoLIDAtED FINANCIAL StAtEMENtS
Impairments are recognized in the year in which the event giving rise to the impairment occurs and are recorded under the item depreciation, amortization and impairment expenses. If the reasons for the impairment cease to exist, corre-sponding reversals of the impairment loss are performed up to the level of amortized cost. Such reversals are recorded as other operating income.
GOODWILLGoodwill according to IFRS 3 is not amortized but is instead tested for impairment annually as well as whenever there are indications that impairment has occurred.
In order to perform impairment tests, goodwill is allocated to cash-generating units. the essential standard applied for determining whether a unit qualifies as a cash-generating unit is the assessment of its technical and commercial in-dependence in the generation of income. the impairment test of the cash-generating unit is carried out by comparing the amortized carrying amount (including the allocated goodwill) to the higher of either the net realizable value or the value in use. the value in use is calculated as the present value of relevant future cash inflows and outflows on the basis of the data obtained from the internal medium-term corporate planning. the discount rate is derived from the Com-pany’s weighted cost of capital. If the calculated amount is less than the carrying amount, the impairment loss in the amount of the difference is allocated first to reduce the carrying amount of the goodwill. Any additional impairment loss is then to be allocated to the remaining assets of the cash-generating units in proportion to their carrying amounts.
the impairment test is applied to the entire goodwill capitalized. When, in the course of an acquisition, non-controlling interests are reported at their fair values, the impairment is spread over the individual groups of shareholders. the al-location is made on the basis of the same key that is also applied when distributing the results of the subsidiary at hand among the shareholders, provided that the subsidiary under review is a cash-generating unit to which goodwill is allo-cated.
According to IFRS 3, goodwill once written down for impairment can no longer be recovered.
RESEARCHANDDEvELOPMENTResearch expenses are reported in the income statement when incurred.
Development expenses made with a view to a significant further development of a product or a process are capitalized if the product or process is feasible both from a technological and commercial point of view, the development is market-able, the expenses can be measured reliably and PALFINGER has sufficient resources to complete the development project. All other development expenses are recognized in the income statement when incurred.
Capitalized development expenses of closed projects are reported at cost less accumulated amortization. As long as a development project is not yet completed, an impairment test of the capitalized amounts accrued is carried out annually or more frequently if circumstances indicate that an impairment loss might have occurred.
(2) Property, plant and equipmentItems of property, plant and equipment are reported at cost, adjusted for straight-line depreciation. Besides direct costs, production costs also contain appropriate proportions of materials and manufacturing overhead costs and, in the case of qualifying assets, also borrowing costs. General administrative expenses are not capitalized.
Assets are depreciated as soon as they are available for use. Depreciation is performed on a straight-line basis over the prospective useful lives of the relevant assets and is shown under depreciation, amortization and impairment expenses. the anticipated economic or technical useful life is used to determine the expected useful life of property, plant and equipment. If property, plant and equipment is composed of major identifiable components with different useful lives, these components are disclosed separately and depreciated over their respective useful lives.
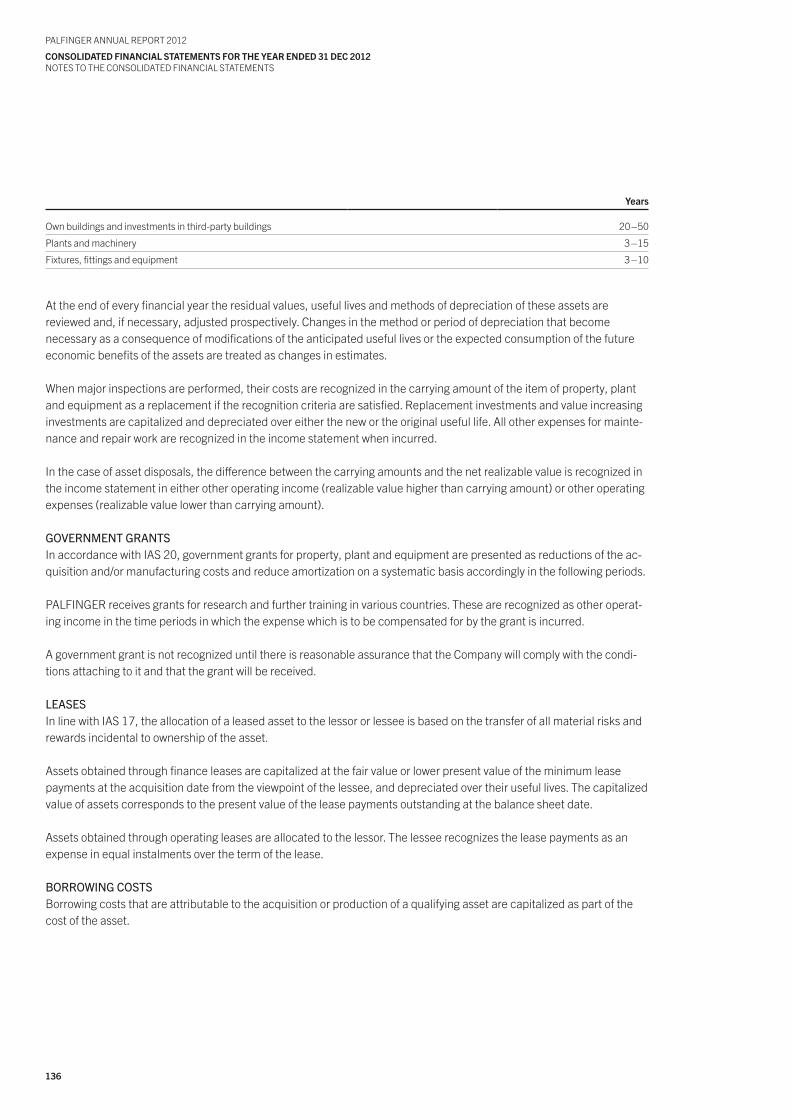
136
PALFINGER ANNuAL REPoRt 2012
coNsoLIdAtEd FINANcIAL stAtEMENts FoR thE yEAR ENdEd 31 dEc 2012NotES to tHE CoNSoLIDAtED FINANCIAL StAtEMENtS
years
own buildings and investments in third-party buildings 20–50
Plants and machinery 3–15
Fixtures, fittings and equipment 3–10
At the end of every financial year the residual values, useful lives and methods of depreciation of these assets are reviewed and, if necessary, adjusted prospectively. Changes in the method or period of depreciation that become necessary as a consequence of modifications of the anticipated useful lives or the expected consumption of the future economic benefits of the assets are treated as changes in estimates.
When major inspections are performed, their costs are recognized in the carrying amount of the item of property, plant and equipment as a replacement if the recognition criteria are satisfied. Replacement investments and value increasing investments are capitalized and depreciated over either the new or the original useful life. All other expenses for mainte-nance and repair work are recognized in the income statement when incurred.
In the case of asset disposals, the difference between the carrying amounts and the net realizable value is recognized in the income statement in either other operating income (realizable value higher than carrying amount) or other operating expenses (realizable value lower than carrying amount).
GOvERNMENTGRANTSIn accordance with IAS 20, government grants for property, plant and equipment are presented as reductions of the ac-quisition and/or manufacturing costs and reduce amortization on a systematic basis accordingly in the following periods.
PALFINGER receives grants for research and further training in various countries. these are recognized as other operat-ing income in the time periods in which the expense which is to be compensated for by the grant is incurred.
A government grant is not recognized until there is reasonable assurance that the Company will comply with the condi-tions attaching to it and that the grant will be received.
leASeSIn line with IAS 17, the allocation of a leased asset to the lessor or lessee is based on the transfer of all material risks and rewards incidental to ownership of the asset.
Assets obtained through finance leases are capitalized at the fair value or lower present value of the minimum lease payments at the acquisition date from the viewpoint of the lessee, and depreciated over their useful lives. the capitalized value of assets corresponds to the present value of the lease payments outstanding at the balance sheet date.
Assets obtained through operating leases are allocated to the lessor. the lessee recognizes the lease payments as an expense in equal instalments over the term of the lease.
BORROWINGCOSTSBorrowing costs that are attributable to the acquisition or production of a qualifying asset are capitalized as part of the cost of the asset.
137
PALFINGER ANNuAL REPoRt 2012
coNsoLIdAtEd FINANcIAL stAtEMENts FoR thE yEAR ENdEd 31 dEc 2012NotES to tHE CoNSoLIDAtED FINANCIAL StAtEMENtS
(3) Investment propertyInvestment property includes land or buildings held to earn rentals or for capital appreciation rather than for use in the production or supply of goods or services or for administrative purposes or sale in the ordinary course of business.
Investment property is measured at cost less accumulated depreciation. Depreciation on buildings is performed on a straight-line basis over a period ranging from 20 to 50 years. the fair value of investment property is determined on the basis of expert opinions that are prepared internally and using an income-cost approach.
(4) InventoriesInventories are assets held for sale as part of the normal operating business (finished goods and merchandise), assets that are still in the process of production (work in progress) or that are consumed as part of the manufacturing of products or the rendering of services (materials and production supplies).
Inventories are valued at acquisition or production cost or the lower net realizable value at the balance sheet date. the valuation of materials and production supplies as well as goods for resale is carried out in accordance with the moving average cost method. Write-downs are made where the net realizable value is lower than the carrying amount. the production costs of work in progress and finished goods are determined on the basis of standard production costs and, besides direct materials and manufacturing costs, also contain appropriate shares of materials and manufactur-ing overheads as well as administrative expenses relating to manufacturing. the standard production costs are reviewed regularly and adjusted to current conditions if necessary.
(5) contract manufacturingReceivables from projects and sales in this connection are recognized in accordance with the percentage of completion. Projects are characterized by the fact that they are agreed on the basis of individual contractual terms with fixed prices. the percentage of completion is determined by means of the cost-to-cost method. Reliable estimates of the total costs of the contracts, the selling prices and the actual costs incurred are available on a monthly basis. the estimated profits from the contracts are realized in proportion to calculated sales. When applying the cost-to-cost method, sales and contract revenue are recognized in proportion of the manufacturing costs actually incurred to the expected total costs. Losses are booked through the income statement as soon as they are identified. For technological and financial risks that might occur during the remaining term of the project, an individual estimate is made for each contract and the cor-responding amounts are reported in estimated total costs. Imminent losses resulting from the measurement of projects not yet invoiced are immediately recorded as expenses. Imminent losses are realized if total contract costs are likely to exceed the contract revenue.
(6) Financial instrumentsFinancial assets within the meaning of IAS 39 are classified either as held for trading, loans and receivables, available for sale or hedging derivatives. PALFINGER determines the designation of its financial assets upon initial recognition.
When they are recognized initially, financial assets are measured at fair value. In the case of financial investments that are not recognized at fair value through the income statement, transaction costs are recognized as well. these costs are directly allocable to the acquisition of the assets.
Acquisitions or sales of financial assets are recognized at the trade date.
the fair value of financial instruments is the amount for which a financial instrument could be exchanged between knowledgeable, willing and independent parties in an arm’s length transaction. the fair value is frequently identical to the market price, and therefore its calculation is based on market information available at the balance sheet date.the values listed may diverge from values realized later due to varying determinants.
Market values are available for all derivative financial instruments and securities. the fair values for all other financial instruments are determined on the basis of the discounted anticipated cash flows.
138
PALFINGER ANNuAL REPoRt 2012
coNsoLIdAtEd FINANcIAL stAtEMENts FoR thE yEAR ENdEd 31 dEc 2012NotES to tHE CoNSoLIDAtED FINANCIAL StAtEMENtS
SECURITIESANDOTHERSHAREHOLDINGSSecurities and other shareholdings are classified as available for sale according to IAS 39. they are measured at fair value provided that a reliable fair value can be determined. Significant unrealized profits and losses are recognized inequity. In the case of sales, the unrealized profit and/or loss that up to that point had been reported in the balance sheet will be reported in the income statement under other financial result. Impairment losses are recorded in the income statement. Impairment losses recorded for equity instruments are reversed in the balance sheet, impairment lossesrecorded for debt instruments in the income statement.
loAnSInterest-bearing loans are classified as loans and receivables according to IAS 39. to the extent that no impairment losses are required, they are reported at amortized cost, applying the effective interest method, and less any impairmentlosses; non-interest bearing loans and interest-bearing loans with low rates of interest are discounted accordingly.Impairment losses are reversed through the income statement.
RECEIvABLESReceivables are classified as loans and receivables according to IAS 39 and are reported at amortized cost, if necessary less impairment losses. Foreign currency receivables are valued at the foreign currency middle rate at the balance sheet date. Impairment losses are recorded in allowance accounts; the receivable is only derecognized in the event of insol-vency or failure to assert the claim in court. Impairment losses are reversed through the income statement.
CASHANDCASHEQUIvALENTSCurrent financial assets are composed of cash in hand, cheques and cash at banks with an initial remaining time to maturity of a maximum of three months and are reported under cash and cash equivalents. they are measured mark to market as at the balance sheet date.
LIABILITIESLiabilities are shown at amortized cost applying the effective interest method.
DERIvATIvEFINANCIALINSTRUMENTSDerivative financial instruments that do not satisfy the criteria for hedge accounting laid down in IAS 39 are classified as held for trading according to IAS 39 and recognized at their fair values through the income statement.
CASHFLOWHEDGEIn order to minimize the risk of fluctuations with respect to payments received in the future, expected foreign currency income in uS dollars and Russian rubles for the following financial year is hedged in the PALFINGER Group by means of forward exchange contracts. the special hedge accounting principles as stipulated by IAS 39 are applied to ensure compensation on an accrual basis for the effects of hedged transactions and the hedging instrument in the income statement. the market value of forward contracts arising from the valuation of forward contracts at the balance sheet date after deduction of deferred taxes is reported in the balance sheet as a reserve according to IAS 39. the reserve is reversed to income in line with future proceeds generated in the relevant financial year.
139
PALFINGER ANNuAL REPoRt 2012
coNsoLIdAtEd FINANcIAL stAtEMENts FoR thE yEAR ENdEd 31 dEc 2012NotES to tHE CoNSoLIDAtED FINANCIAL StAtEMENtS
(7) stock option programmethe Annual General Meeting on 25 March 2009 resolved to set up a stock option programme in the form of an equity-settled plan for members of the Supervisory and Management Boards and to grant 250,000 stock options under this programme to Alexander Exner, former Chairman of the Supervisory Board (retired from the Supervisory Board on 30 March 2011), Alexander Doujak, member of the Supervisory Board (since 13 December 2010 Chairman of the Supervisory Board), and to Management Board members Herbert ortner, Wolfgang Pilz and Martin Zehnder.
the objective of the programme is to link the amount of remuneration directly to operating performance. thus, the management should be more willing to align its objectives with those of the shareholders of the Company but also have a share in the success of the Company.
the following applies to the 2009 stock option programme: the entitled holders were/are entitled to exercise one stock option in exchange for one share each at an exercise price of EuR 10.12. the holders were/are entitled to exercise the stock options (one half each) on two exercise dates. In order to exercise stock options on exercise date 1 in 2012, the average ratio of earnings before taxes (EBt) and revenue for each of the three balance sheet dates preceding the exer-cise date, as reported in the consolidated financial statements of PALFINGER AG, had to be at least 3 per cent; in order to exercise stock options on exercise date 2 in 2014, the corresponding ratio must be at least 5 per cent.
the maximum number of shares available for subscription is equivalent to the number of options issued. In the case of an EBt ratio of less than 3 per cent or 5 per cent, respectively, holders were/are not entitled to exercise options or sub-scribe to shares. With an EBt ratio of 3 or 5 per cent, entitled persons had/have the right to exercise 25 per cent of their stock options on the relevant exercise date. In the case of an EBt ratio exceeding 3 or 5 per cent, the number of stock options that a holder was/is entitled to exercise on the relevant exercise date rose/rises in linear progression up to an EBt ratio of 7 per cent (exercise date 1 in 2012) or 11 per cent (exercise date 2 in 2014).
the Annual General Meeting on 31 March 2010 resolved to grant 50,000 stock options to Christoph Kaml, member of the Management Board.
the following applies to the 2010 stock option programme: Each stock option may be exercised in exchange for one share at an exercise price of EuR 16.57. the stock options may be exercised (one half each) at two exercise dates. In order to be able to exercise stock options, the average ratio of earnings before taxes (EBt) and revenue as reported in the consolidated financial statements of PALFINGER AG must have been at least 4 per cent (exercise date 1 in 2013) or 5 per cent (exercise date 2 in 2015) for each of the three balance sheet dates preceding the date the option is exercised.
the maximum number of shares available for subscription is equivalent to the number of options issued. If the EBt ratio is less than 4 or 5 per cent, no options may be exercised and there is no entitlement to subscription. If the EBt ratio is 4 or 5 per cent, the entitled person enjoys the right to exercise 25 per cent of his stock options at the relevant exercise date. If the EBt ratio exceeds 4 or 5 per cent, the number of stock options that may be exercised by a person at the relevant exercise date rises in linear progression up to an EBt ratio of 9 or 11 per cent.
the fair value of the options granted is recognized as employee benefits expense and offset against additional paid-in capital in equity. the fair value is determined at the date the option is granted and expensed over a period during which the employees acquire the unconditional entitlement to the options granted (vesting period). A Monte Carlo simulation is used to determine the fair value of options, taking into account the terms and conditions on which the options were granted. the amount, which is to be reported as an expense, is adjusted to take into account the effect of anticipated staff turnover in order to reflect the expected actual number of options that may be exercised in the future.
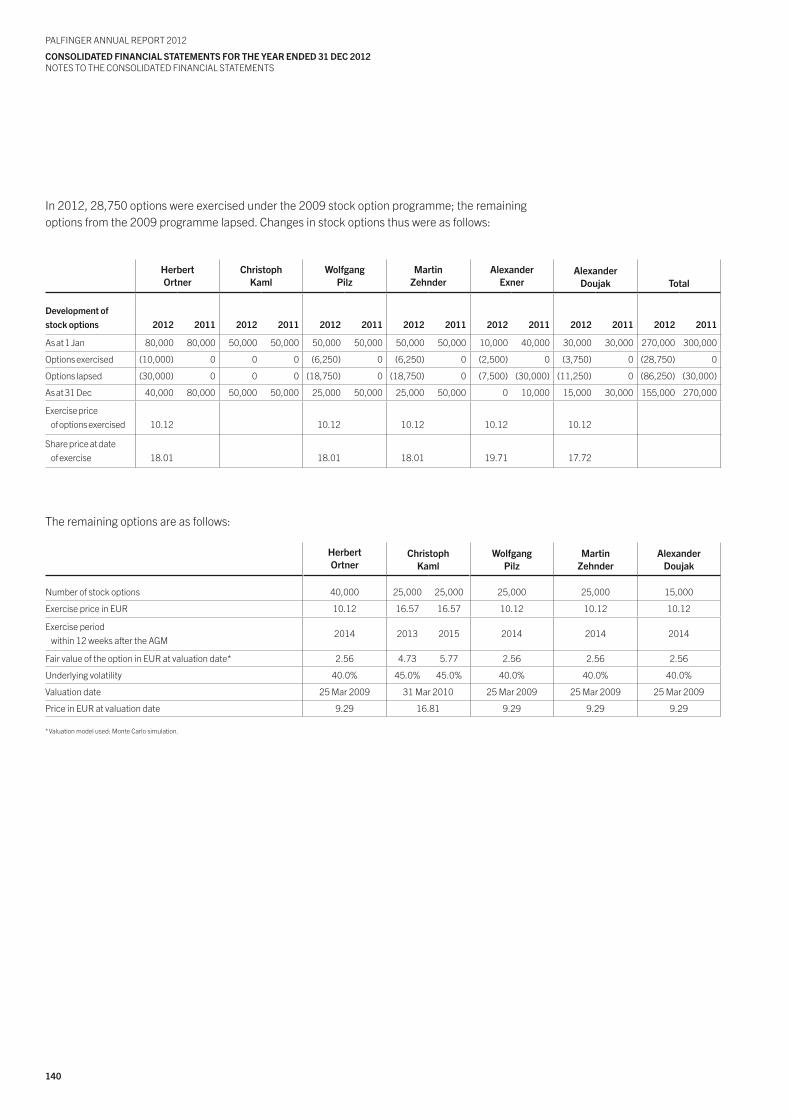
140
PALFINGER ANNuAL REPoRt 2012
coNsoLIdAtEd FINANcIAL stAtEMENts FoR thE yEAR ENdEd 31 dEc 2012NotES to tHE CoNSoLIDAtED FINANCIAL StAtEMENtS
In 2012, 28,750 options were exercised under the 2009 stock option programme; the remaining options from the 2009 programme lapsed. Changes in stock options thus were as follows:
herbertortner
christophkaml
wolfgangPilz
Martinzehnder
AlexanderExner
Alexanderdoujak total
development ofstock options 2012 2011 2012 2011 2012 2011 2012 2011 2012 2011 2012 2011 2012 2011
As at 1 Jan 80,000 80,000 50,000 50,000 50,000 50,000 50,000 50,000 10,000 40,000 30,000 30,000 270,000 300,000
options exercised (10,000) 0 0 0 (6,250) 0 (6,250) 0 (2,500) 0 (3,750) 0 (28,750) 0
options lapsed (30,000) 0 0 0 (18,750) 0 (18,750) 0 (7,500) (30,000) (11,250) 0 (86,250) (30,000)
As at 31 Dec 40,000 80,000 50,000 50,000 25,000 50,000 25,000 50,000 0 10,000 15,000 30,000 155,000 270,000
Exercise price of options exercised 10.12 10.12 10.12 10.12 10.12
Share price at dateof exercise 18.01 18.01 18.01 19.71 17.72
the remaining options are as follows:
herbertortner
christophkaml
wolfgangPilz
Martinzehnder
Alexanderdoujak
Number of stock options 40,000 25,000 25,000 25,000 25,000 15,000
Exercise price in EuR 10.12 16.57 16.57 10.12 10.12 10.12
Exercise periodwithin 12 weeks after the AGM
2014 2013 2015 2014 2014 2014
Fair value of the option in EuR at valuation date* 2.56 4.73 5.77 2.56 2.56 2.56
underlying volatility 40.0% 45.0% 45.0% 40.0% 40.0% 40.0%
Valuation date 25 Mar 2009 31 Mar 2010 25 Mar 2009 25 Mar 2009 25 Mar 2009
Price in EuR at valuation date 9.29 16.81 9.29 9.29 9.29
* Valuation model used: Monte Carlo simulation.
141
PALFINGER ANNuAL REPoRt 2012
coNsoLIdAtEd FINANcIAL stAtEMENts FoR thE yEAR ENdEd 31 dEc 2012NotES to tHE CoNSoLIDAtED FINANCIAL StAtEMENtS
(8) Long-term employment benefits
DEFINEDBENEFITPLANSDefined benefit plans apply to pension commitments in Austria, France and Germany as well as severance pay obliga-tions in Austria, Slovenia and Bulgaria.
Employees whose employment contract is governed by Austrian law and whose employment status started before 1 January 2003 are entitled to a severance payment if their contract is terminated by the employer or if they leave the company early for good cause, provided that their employment lasted for three years without interruptions. In addition, if their employment lasted for at least ten years, they are entitled to a severance payment upon any kind of termination of employment when they have reached the statutory pensionable age. the amount of the severance payment depends on the amount of the remuneration paid at the time of termination and the length of service.
Provisions for pensions and other post-employment benefits as well as for severance payments and anniversary bonuses are valued using the projected unit credit method. under this method, anticipated benefits are distributed over the work-ing lifespan of the employees until retirement. Anticipated future salary increases are taken into account. the amounts of the provisions are determined on the basis of an actuarial opinion prepared by an actuary as at the balance sheet date.
According to IAS 19, actuarial gains and losses are recognized in the balance sheet if they relate to provisions forpensions and other post-employment benefits or for severance payments.
DEFINEDCONTRIBUTIONPLANSDefined contribution plans have been introduced at various Group companies on the basis of statutory obligations. In addition, individual pension agreements have been entered into. Contributions to such defined contribution plans are recognized as expenses in the period for which they are paid.
OTHERLONG-TERMEMPLOyMENTBENEFITSother long-term employment benefits refer primarily to collective bargaining commitments for payment of anniversary bonuses depending on years of service for the employees of Austrian and Slovenian companies. In accordance withIAS 19, actuarial gains and losses are recognized as employee benefits expenses in the income statement if they relate to provisions for anniversary bonuses.
(9) other provisionsother provisions were formed to reflect the level of uncertain liabilities, recognizing the amount associated with the high-est level of probability of occurrence of individual obligations as the best estimate. Where the provision being measured involved a large population of items, the expected-value method of estimation was applied. Non-current provisions are reported at their present value.
142
PALFINGER ANNuAL REPoRt 2012
coNsoLIdAtEd FINANcIAL stAtEMENts FoR thE yEAR ENdEd 31 dEc 2012NotES to tHE CoNSoLIDAtED FINANCIAL StAtEMENtS
(10) Liabilities from puttable non-controlling interestsPuttable or fixed-term interests held by non-controlling shareholders of subsidiaries constitute financial liabilities and are reported under liabilities from puttable non-controlling interests. At first, the liabilities are recognized at fair value, which, as a rule, corresponds to the fair value of the interest held by the non-controlling shareholder in the subsidiary at the time the obligation was entered into. Provided that the other shareholders are the beneficial owners of the interests, the results and payments are still attributed to the non-controlling interests. At the balance sheet date, they are reclassified to liabilities, and differences, if any, between the non-controlling interest and the obligation are presented under retained earnings. If, however, the other shareholders are not the beneficial owners, they are presented as an accelerated acqui-sition and measurement subsequent to initial recognition is made through the income statement.
(11) Income taxtax receivables and tax liabilities are offset when they relate to the same tax authority and the Company has a right to offset the items.
According to the liability method, deferred tax is reported on temporary differences between the amounts recognized under IFRS and those recognized in the tax balance sheet as well as on tax-loss carry forwards. temporary differences are reported whenever they give rise to deferred tax liabilities. Deferred tax assets are only recognized if it is probable that the relevant tax benefits will actually be realized.
Deferred tax is calculated using the tax rate expected to apply at the balance sheet date when the temporary differences reverse. As a rule, all changes in taxes result in tax expenses and/or income. taxes on items reported in other compre-hensive income are reported in other comprehensive income. taxes on items directly reported in equity are directly recognized in equity.
(12) Recognition of revenue and expensesRevenue arising from the provision of goods is recognized when all major risks and opportunities arising from the de-livered object have been transferred to the buyer. Revenue from the provision of services refers to short-term services which are recognized when the service is rendered.
operating expenses are recognized when the service is rendered or a delivery is received, or at the time the expenses are in-curred. Interest is recognized using the effective interest method. For information on contract manufacturing see Note (5).
(13) consolidated statement of cash flowsthe presentation of the statement of operating cash flows is based on the indirect method. the item funds corresponds to cash and cash equivalents.
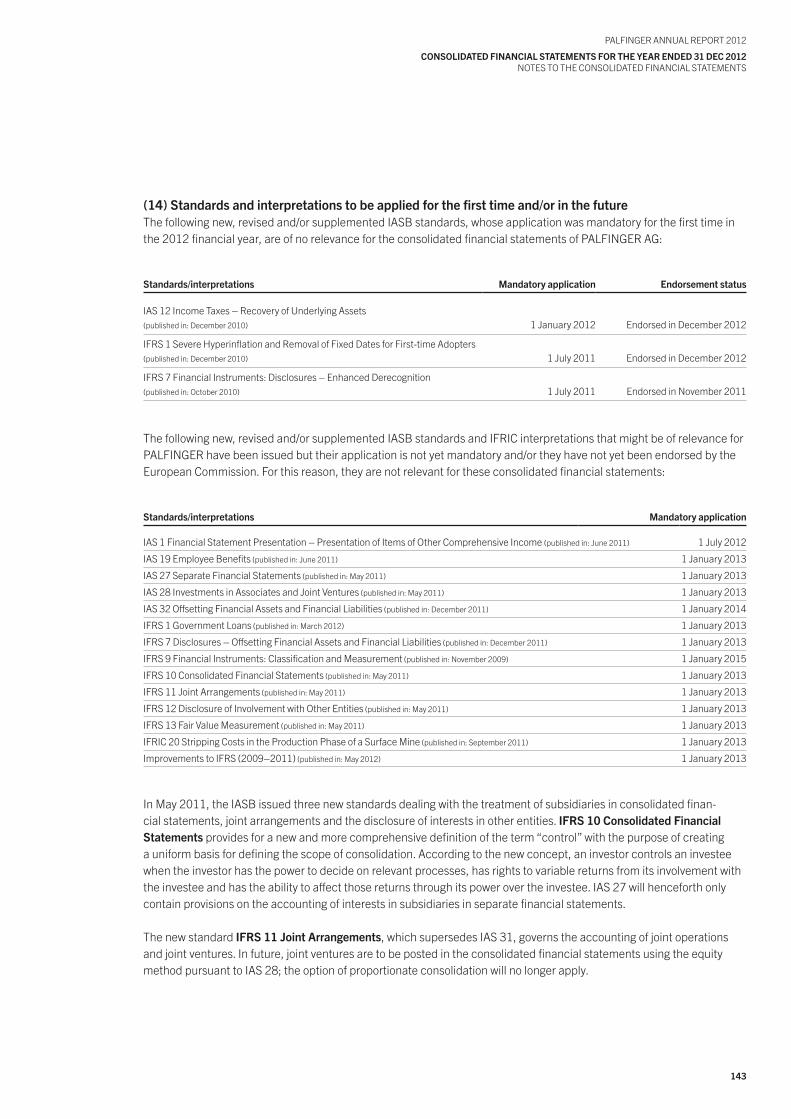
143
PALFINGER ANNuAL REPoRt 2012
coNsoLIdAtEd FINANcIAL stAtEMENts FoR thE yEAR ENdEd 31 dEc 2012NotES to tHE CoNSoLIDAtED FINANCIAL StAtEMENtS
(14) standards and interpretations to be applied for the first time and/or in the futurethe following new, revised and/or supplemented IASB standards, whose application was mandatory for the first time in the 2012 financial year, are of no relevance for the consolidated financial statements of PALFINGER AG:
standards/interpretations Mandatory application Endorsement status
IAS 12 Income taxes – Recovery of underlying Assets(published in: December 2010) 1 January 2012 Endorsed in December 2012
IFRS 1 Severe Hyperinflation and Removal of Fixed Dates for First-time Adopters (published in: December 2010) 1 July 2011 Endorsed in December 2012
IFRS 7 Financial Instruments: Disclosures – Enhanced Derecognition(published in: october 2010) 1 July 2011 Endorsed in November 2011
the following new, revised and/or supplemented IASB standards and IFRIC interpretations that might be of relevance for PALFINGER have been issued but their application is not yet mandatory and/or they have not yet been endorsed by the European Commission. For this reason, they are not relevant for these consolidated financial statements:
standards/interpretations Mandatory application
IAS 1 Financial Statement Presentation – Presentation of Items of other Comprehensive Income (published in: June 2011) 1 July 2012
IAS 19 Employee Benefits (published in: June 2011) 1 January 2013
IAS 27 Separate Financial Statements (published in: May 2011) 1 January 2013
IAS 28 Investments in Associates and Joint Ventures (published in: May 2011) 1 January 2013
IAS 32 offsetting Financial Assets and Financial Liabilities (published in: December 2011) 1 January 2014
IFRS 1 Government Loans (published in: March 2012) 1 January 2013
IFRS 7 Disclosures – offsetting Financial Assets and Financial Liabilities (published in: December 2011) 1 January 2013
IFRS 9 Financial Instruments: Classification and Measurement (published in: November 2009) 1 January 2015
IFRS 10 Consolidated Financial Statements (published in: May 2011) 1 January 2013
IFRS 11 Joint Arrangements (published in: May 2011) 1 January 2013
IFRS 12 Disclosure of Involvement with other Entities (published in: May 2011) 1 January 2013
IFRS 13 Fair Value Measurement (published in: May 2011) 1 January 2013
IFRIC 20 Stripping Costs in the Production Phase of a Surface Mine (published in: September 2011) 1 January 2013
Improvements to IFRS (2009–2011) (published in: May 2012) 1 January 2013
In May 2011, the IASB issued three new standards dealing with the treatment of subsidiaries in consolidated finan-cial statements, joint arrangements and the disclosure of interests in other entities. IFRs 10 consolidated Financial statements provides for a new and more comprehensive definition of the term “control” with the purpose of creating a uniform basis for defining the scope of consolidation. According to the new concept, an investor controls an investee when the investor has the power to decide on relevant processes, has rights to variable returns from its involvement with the investee and has the ability to affect those returns through its power over the investee. IAS 27 will henceforth only contain provisions on the accounting of interests in subsidiaries in separate financial statements.
the new standard IFRs 11 Joint Arrangements, which supersedes IAS 31, governs the accounting of joint operations and joint ventures. In future, joint ventures are to be posted in the consolidated financial statements using the equity method pursuant to IAS 28; the option of proportionate consolidation will no longer apply.
144
PALFINGER ANNuAL REPoRt 2012
coNsoLIdAtEd FINANcIAL stAtEMENts FoR thE yEAR ENdEd 31 dEc 2012NotES to tHE CoNSoLIDAtED FINANCIAL StAtEMENtS
IFRs 12 contains the necessary disclosures regarding interests in subsidiaries, joint arrangements and interests in asso-ciates, which still have to be posted pursuant to IAS 28. the information to be disclosed is significantly more comprehen-sive than previously prescribed under IAS 27, 28 and 31.
the European Commission endorsed these standards on 11 December 2012. the application of these new standards within the Eu will become mandatory at the latest for financial years starting on or after 1 January 2014. PALFINGER will apply the new standards starting from that point in time.
In June 2011, the IASB published amendments of IAs 19 Employee Benefits, providing detailed guidance in particular regarding the accounting requirements for post-employment benefits. As a result of the removal of options and smooth-ing mechanisms, the full net obligation arising from defined benefit plans has to be recognized in the balance sheet. Consequently, actuarial gains and losses will henceforth be immediately recognized in other comprehensive income and can no longer be recycled later. In addition, non-vesting past service cost has to be recognized immediately in profit or loss. Moreover, the disclosure obligations in connection with defined benefit plans were expanded. the new standard was adopted by the European Commission on 5 June 2012, and its application is to be mandatory for the first time in financial years starting on or after 1 January 2013.
As PALFINGER already recognizes actuarial gains and losses directly in other comprehensive income if they relate to provisions for pensions and other post-employment benefits or for severance payments, only slight changes in the accounting of defined benefit plans will become necessary. However, in the financial statements for the year ended 31 December 2013, additional disclosures such as a sensitivity analysis will be required.
the Company does not expect the remaining new, revised and/or supplemented standards to have any major impact on its consolidated financial statements.
145
PALFINGER ANNuAL REPoRt 2012
coNsoLIdAtEd FINANcIAL stAtEMENts FoR thE yEAR ENdEd 31 dEc 2012NotES to tHE CoNSoLIDAtED FINANCIAL StAtEMENtS
usE oF EstIMAtEs ANd JudGEMENts
the preparation of the consolidated financial statements requires the use of estimates and assumptions, which may in-fluence the reported values of assets, liabilities and financial obligations at the balance sheet date, as well as the income and expenses of the financial year. Actual results may differ from these estimates. the true and fair view principle is fully applied in the use of all estimates.
the key assumptions concerning the future and other key sources of estimation uncertainty at the balance sheet date that have a significant risk of causing a material adjustment to the carrying amounts of assets and liabilities within the next financial year are disclosed in the following.
(15) Impairment of non-financial assetsthe impairment tests performed by PALFINGER regarding goodwill, intangible assets with indefinite useful lives and uncompleted capitalized development projects are based on calculations of the value in use, for the purpose of which a discounted cash flow model was applied. the recoverable amount strongly depends on the discount rates used under the discounted cash flow model and the expected future cash inflows.
Further details on the impairment of non-financial assets are presented in Note (25) Intangible assets and Note (26) Property, plant and equipment.
(16) deferred tax assetsDeferred tax assets are reported for all unused tax-loss carry forwards in the amount of taxable income probably avail-able so that the loss carry forwards may actually be used. In the case of carry forwards not subject to expiry, their usabil-ity during the next five years is taken as the decisive factor. For the purpose of determining the amount of the deferred tax asset that may be capitalized, material judgements by the management on the anticipated time of occurrence and the amount of the future taxable income as well as on the future tax planning strategies are required.
PALFINGER reported as assets tax-loss carry forwards amounting to EuR 67,308 thousand (previous year:EuR 57,763 thousand). Capitalized tax-loss carry forwards of EuR 46,965 thousand (previous year: EuR 40,972 thousand)are not subject to expiry.
Further details on deferred taxes are disclosed in Note (29) Deferred tax assets and liabilities.
146
PALFINGER ANNuAL REPoRt 2012
coNsoLIdAtEd FINANcIAL stAtEMENts FoR thE yEAR ENdEd 31 dEc 2012NotES to tHE CoNSoLIDAtED FINANCIAL StAtEMENtS
(17) Pensions, severance payments and anniversary bonusesthe expenses for defined benefit plans and statutory obligations upon termination of employment and periods of em-ployment entitling employees to anniversary bonuses are determined on the basis of actuarial calculations. the actuarial assessment is based on assumptions on discount rates, future increases in wages and salaries, mortality and future in-creases in pension payments. Each reporting date, these assumptions are reviewed. For the purpose of determining the adequate discount rate, the management uses long-term market interest rates. the mortality rate is based on publicly available mortality tables for the respective countries.
the future increases in wages and salaries as well as pension payments are based on the anticipated future inflation rates for the respective countries.
Further details on the assumptions used are presented in Note (43) Non-current provisions.
(18) development expenditureDevelopment expenditure is capitalized in accordance with the accounting and valuation method presented. the initial capitalization of these costs is based on the management’s assessment that the development’s feasibility from a techni-cal and economic point of view is proven. this is usually the case when a product development project has reached a specific milestone of an existing project management model. For the purpose of determining the amount to be capital-ized, the management makes assumptions on the amount of the expected future cash flows from the project, the dis-count rates to be applied and the time period in which the expected future benefits are to be received. on 31 December 2012, the carrying amount of the capitalized development expenditure was EuR 17,657 thousand (previous year: EuR 12,882 thousand) and included primarily development services in cranes, access platforms, tail lifts, services and railway systems. the impairment test is geared to the benefit of the individual assets, irrespective of the profit expecta-tions of the entire area.
(19) Guarantee and warranty expensesWhen forming provisions for guarantee and warranty expenses, guarantee and warranty obligations are taken into con-sideration using a standardized method. this method is influenced considerably by the time of occurrence of the war-ranty claim, specific product replacement campaigns, refund quotas of suppliers, developments of the revenue subject to warranty and assumptions of gross profit margins on the basis of the implemented warranty process.
In the 2012 financial year, the provisions for guarantee and warranty expenses amounted to EuR 12,124 thousand(previous year: EuR 11,296 thousand).
(20) Measurement of receivablesBesides standardized measurement of receivables on the basis of experience regarding days overdue and country risk, the probability of receiving payment is taken into consideration by means of specific bad-debt allowances. In doing so, primarily previous experience with the respective customers, their creditworthiness and available collateral, if any, are taken into account.
In the 2012 financial year, bad-debt allowances amounting to EuR 6,248 thousand (previous year: EuR 5,503 thousand)were reported.
147
PALFINGER ANNuAL REPoRt 2012
coNsoLIdAtEd FINANcIAL stAtEMENts FoR thE yEAR ENdEd 31 dEc 2012NotES to tHE CoNSoLIDAtED FINANCIAL StAtEMENtS
(21) Measurement of inventoriesA standardized obsolescence measurement method was implemented in order to allow for the risk of obsoleteness. this method considers not only actual and planned consumption, minimum inventories and determinations of days stock on hand, but also alternative uses of materials. In addition, the commercial benefit of the existing inventories is reviewed on a case-by-case basis and, if necessary, additional impairment losses are recorded on the basis of long-term storage, limited sales channels or defects in quality. In addition, a systematic review of finished goods is carried out with a view to achieving a loss-free measurement, which is basically characterized by the expected sales prices, currency develop-ments, the time of selling and the costs yet to be expected.
Further details on impairment losses recognized for inventories are presented in Note (32) Inventories.
(22) Liabilities from puttable non-controlling intereststhis item comprises puttable and fixed-term interests that are reported at fair value. As their fair value depends on the development of earnings of the entities concerned, a change in fair value may become necessary should the develop-ment be different than expected. these estimates are based on the medium-term corporate strategic planning of the PALFINGER Group.
For details, please refer to Note (41) and the explanations regarding financial instruments.
(23) other non-current provisionsthe item other non-current provisions comprises purchase price portions not yet fallen due that depend on the future development of the earnings of the acquired entities. therefore, a change in the expected underlying values may result in an adjustment of the reported values through profit and loss. these estimates are based on the medium-term corpo-rate strategic planning of the PALFINGER Group.
For details, please refer to Note (43) and the explanations regarding financial instruments.
(24) changes in estimatesNo major changes in estimates were made in the 2012 financial year.
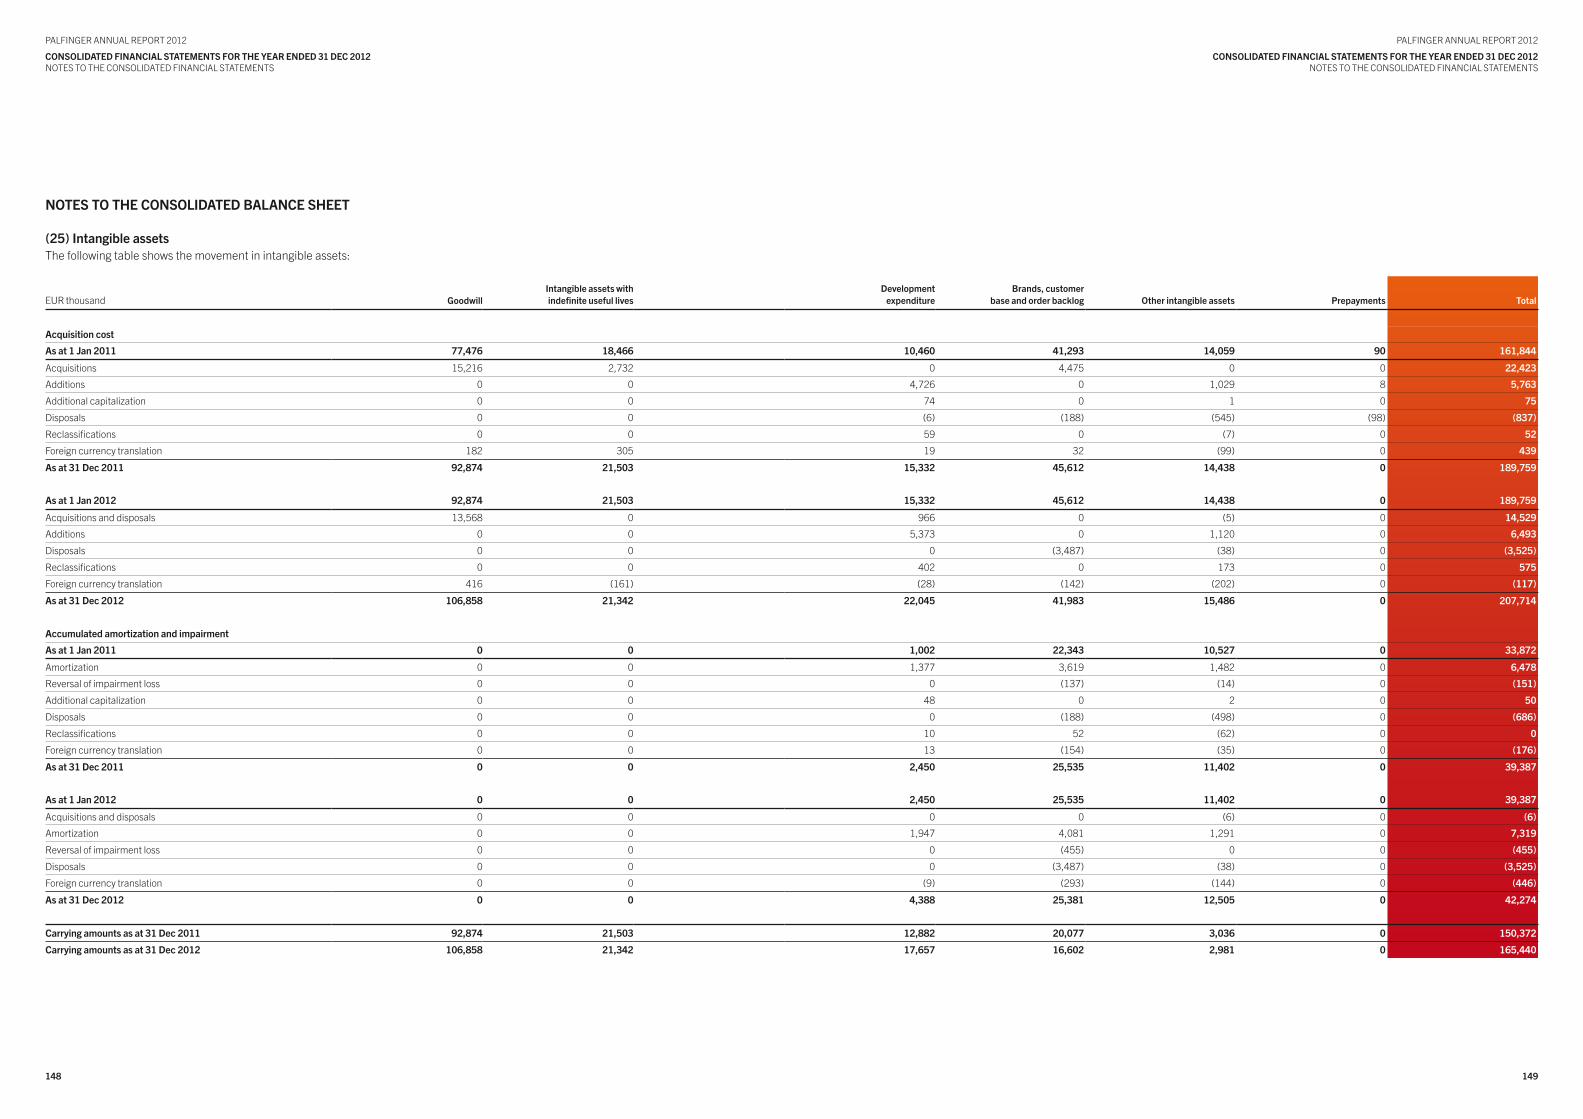
149148
PALFINGER ANNuAL REPoRt 2012
coNsoLIdAtEd FINANcIAL stAtEMENts FoR thE yEAR ENdEd 31 dEc 2012NotES to tHE CoNSoLIDAtED FINANCIAL StAtEMENtS
PALFINGER ANNuAL REPoRt 2012
coNsoLIdAtEd FINANcIAL stAtEMENts FoR thE yEAR ENdEd 31 dEc 2012NotES to tHE CoNSoLIDAtED FINANCIAL StAtEMENtS
NotEs to thE coNsoLIdAtEd BALANcE shEEt
(25) Intangible assetsthe following table shows the movement in intangible assets:
EuR thousand GoodwillIntangible assets withindefinite useful lives
developmentexpenditure
Brands, customerbase and order backlog other intangible assets Prepayments total
Acquisition cost
As at 1 Jan 2011 77,476 18,466 10,460 41,293 14,059 90 161,844
Acquisitions 15,216 2,732 0 4,475 0 0 22,423
Additions 0 0 4,726 0 1,029 8 5,763
Additional capitalization 0 0 74 0 1 0 75
Disposals 0 0 (6) (188) (545) (98) (837)
Reclassifications 0 0 59 0 (7) 0 52
Foreign currency translation 182 305 19 32 (99) 0 439
As at 31 dec 2011 92,874 21,503 15,332 45,612 14,438 0 189,759
As at 1 Jan 2012 92,874 21,503 15,332 45,612 14,438 0 189,759
Acquisitions and disposals 13,568 0 966 0 (5) 0 14,529
Additions 0 0 5,373 0 1,120 0 6,493
Disposals 0 0 0 (3,487) (38) 0 (3,525)
Reclassifications 0 0 402 0 173 0 575
Foreign currency translation 416 (161) (28) (142) (202) 0 (117)
As at 31 dec 2012 106,858 21,342 22,045 41,983 15,486 0 207,714
Accumulated amortization and impairment
As at 1 Jan 2011 0 0 1,002 22,343 10,527 0 33,872
Amortization 0 0 1,377 3,619 1,482 0 6,478
Reversal of impairment loss 0 0 0 (137) (14) 0 (151)
Additional capitalization 0 0 48 0 2 0 50
Disposals 0 0 0 (188) (498) 0 (686)
Reclassifications 0 0 10 52 (62) 0 0
Foreign currency translation 0 0 13 (154) (35) 0 (176)
As at 31 dec 2011 0 0 2,450 25,535 11,402 0 39,387
As at 1 Jan 2012 0 0 2,450 25,535 11,402 0 39,387
Acquisitions and disposals 0 0 0 0 (6) 0 (6)
Amortization 0 0 1,947 4,081 1,291 0 7,319
Reversal of impairment loss 0 0 0 (455) 0 0 (455)
Disposals 0 0 0 (3,487) (38) 0 (3,525)
Foreign currency translation 0 0 (9) (293) (144) 0 (446)
As at 31 dec 2012 0 0 4,388 25,381 12,505 0 42,274
carrying amounts as at 31 dec 2011 92,874 21,503 12,882 20,077 3,036 0 150,372
carrying amounts as at 31 dec 2012 106,858 21,342 17,657 16,602 2,981 0 165,440
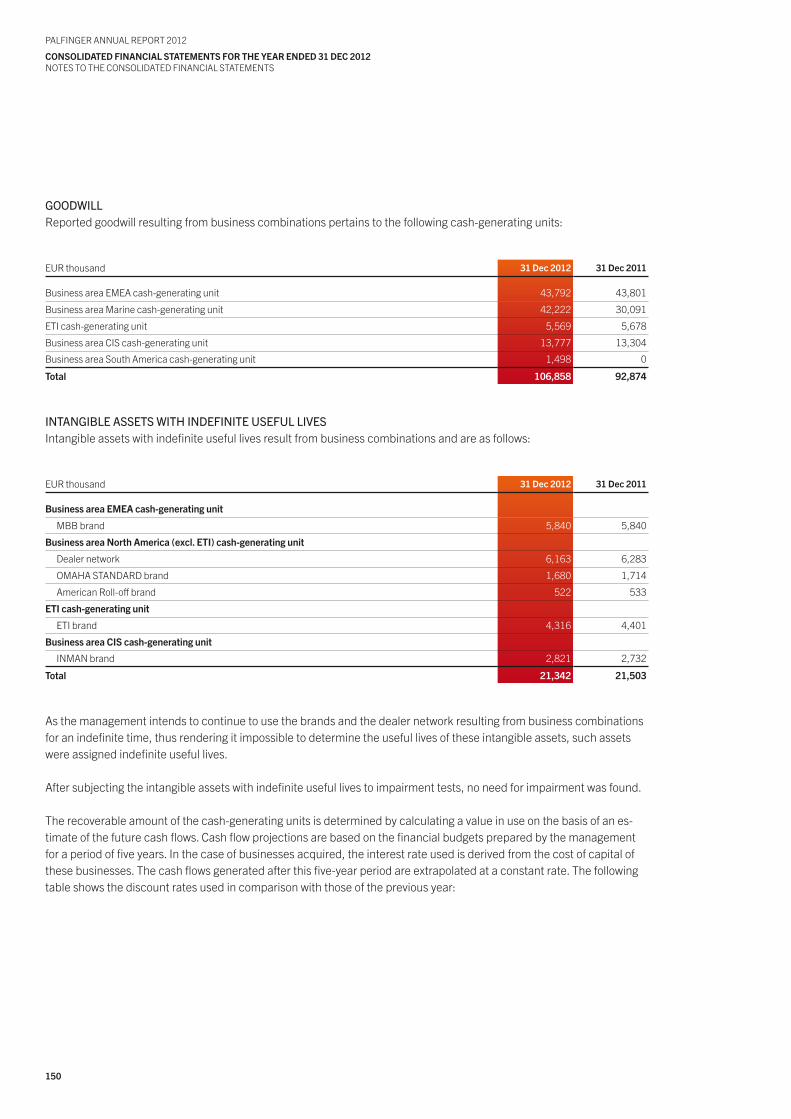
150
PALFINGER ANNuAL REPoRt 2012
coNsoLIdAtEd FINANcIAL stAtEMENts FoR thE yEAR ENdEd 31 dEc 2012NotES to tHE CoNSoLIDAtED FINANCIAL StAtEMENtS
GOODWILLReported goodwill resulting from business combinations pertains to the following cash-generating units:
EuR thousand 31 dec 2012 31 dec 2011
Business area EMEA cash-generating unit 43,792 43,801
Business area Marine cash-generating unit 42,222 30,091
EtI cash-generating unit 5,569 5,678
Business area CIS cash-generating unit 13,777 13,304
Business area South America cash-generating unit 1,498 0
total 106,858 92,874
INTANGIBLEASSETSWITHINDEFINITEUSEFULLIvESIntangible assets with indefinite useful lives result from business combinations and are as follows:
EuR thousand 31 dec 2012 31 dec 2011
Business area EMEA cash-generating unit
MBB brand 5,840 5,840
Business area North America (excl. EtI) cash-generating unit
Dealer network 6,163 6,283
oMAHA StANDARD brand 1,680 1,714
American Roll-off brand 522 533
EtI cash-generating unit
EtI brand 4,316 4,401
Business area cIs cash-generating unit
INMAN brand 2,821 2,732
total 21,342 21,503
As the management intends to continue to use the brands and the dealer network resulting from business combinations for an indefinite time, thus rendering it impossible to determine the useful lives of these intangible assets, such assets were assigned indefinite useful lives.
After subjecting the intangible assets with indefinite useful lives to impairment tests, no need for impairment was found.
the recoverable amount of the cash-generating units is determined by calculating a value in use on the basis of an es-timate of the future cash flows. Cash flow projections are based on the financial budgets prepared by the management for a period of five years. In the case of businesses acquired, the interest rate used is derived from the cost of capital of these businesses. the cash flows generated after this five-year period are extrapolated at a constant rate. the following table shows the discount rates used in comparison with those of the previous year:
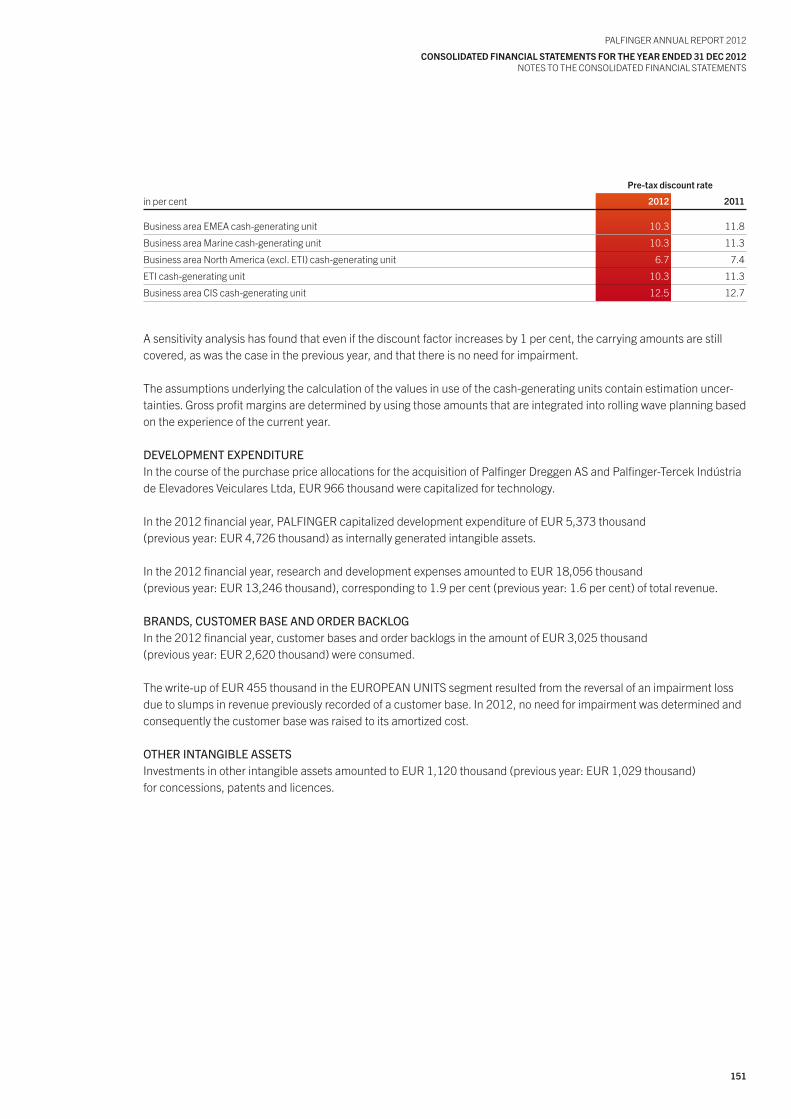
151
PALFINGER ANNuAL REPoRt 2012
coNsoLIdAtEd FINANcIAL stAtEMENts FoR thE yEAR ENdEd 31 dEc 2012NotES to tHE CoNSoLIDAtED FINANCIAL StAtEMENtS
Pre-tax discount rate
in per cent 2012 2011
Business area EMEA cash-generating unit 10.3 11.8
Business area Marine cash-generating unit 10.3 11.3
Business area North America (excl. EtI) cash-generating unit 6.7 7.4
EtI cash-generating unit 10.3 11.3
Business area CIS cash-generating unit 12.5 12.7
A sensitivity analysis has found that even if the discount factor increases by 1 per cent, the carrying amounts are still covered, as was the case in the previous year, and that there is no need for impairment.
the assumptions underlying the calculation of the values in use of the cash-generating units contain estimation uncer-tainties. Gross profit margins are determined by using those amounts that are integrated into rolling wave planning based on the experience of the current year. DEvELOPMENTExPENDITUREIn the course of the purchase price allocations for the acquisition of Palfinger Dreggen AS and Palfinger-tercek Indústria de Elevadores Veiculares Ltda, EuR 966 thousand were capitalized for technology.
In the 2012 financial year, PALFINGER capitalized development expenditure of EuR 5,373 thousand(previous year: EuR 4,726 thousand) as internally generated intangible assets.
In the 2012 financial year, research and development expenses amounted to EuR 18,056 thousand(previous year: EuR 13,246 thousand), corresponding to 1.9 per cent (previous year: 1.6 per cent) of total revenue.
BRANDS,CUSTOMERBASEANDORDERBACkLOGIn the 2012 financial year, customer bases and order backlogs in the amount of EuR 3,025 thousand(previous year: EuR 2,620 thousand) were consumed.
the write-up of EuR 455 thousand in the EuRoPEAN uNItS segment resulted from the reversal of an impairment loss due to slumps in revenue previously recorded of a customer base. In 2012, no need for impairment was determined and consequently the customer base was raised to its amortized cost.
OTHERINTANGIBLEASSETSInvestments in other intangible assets amounted to EuR 1,120 thousand (previous year: EuR 1,029 thousand)for concessions, patents and licences.
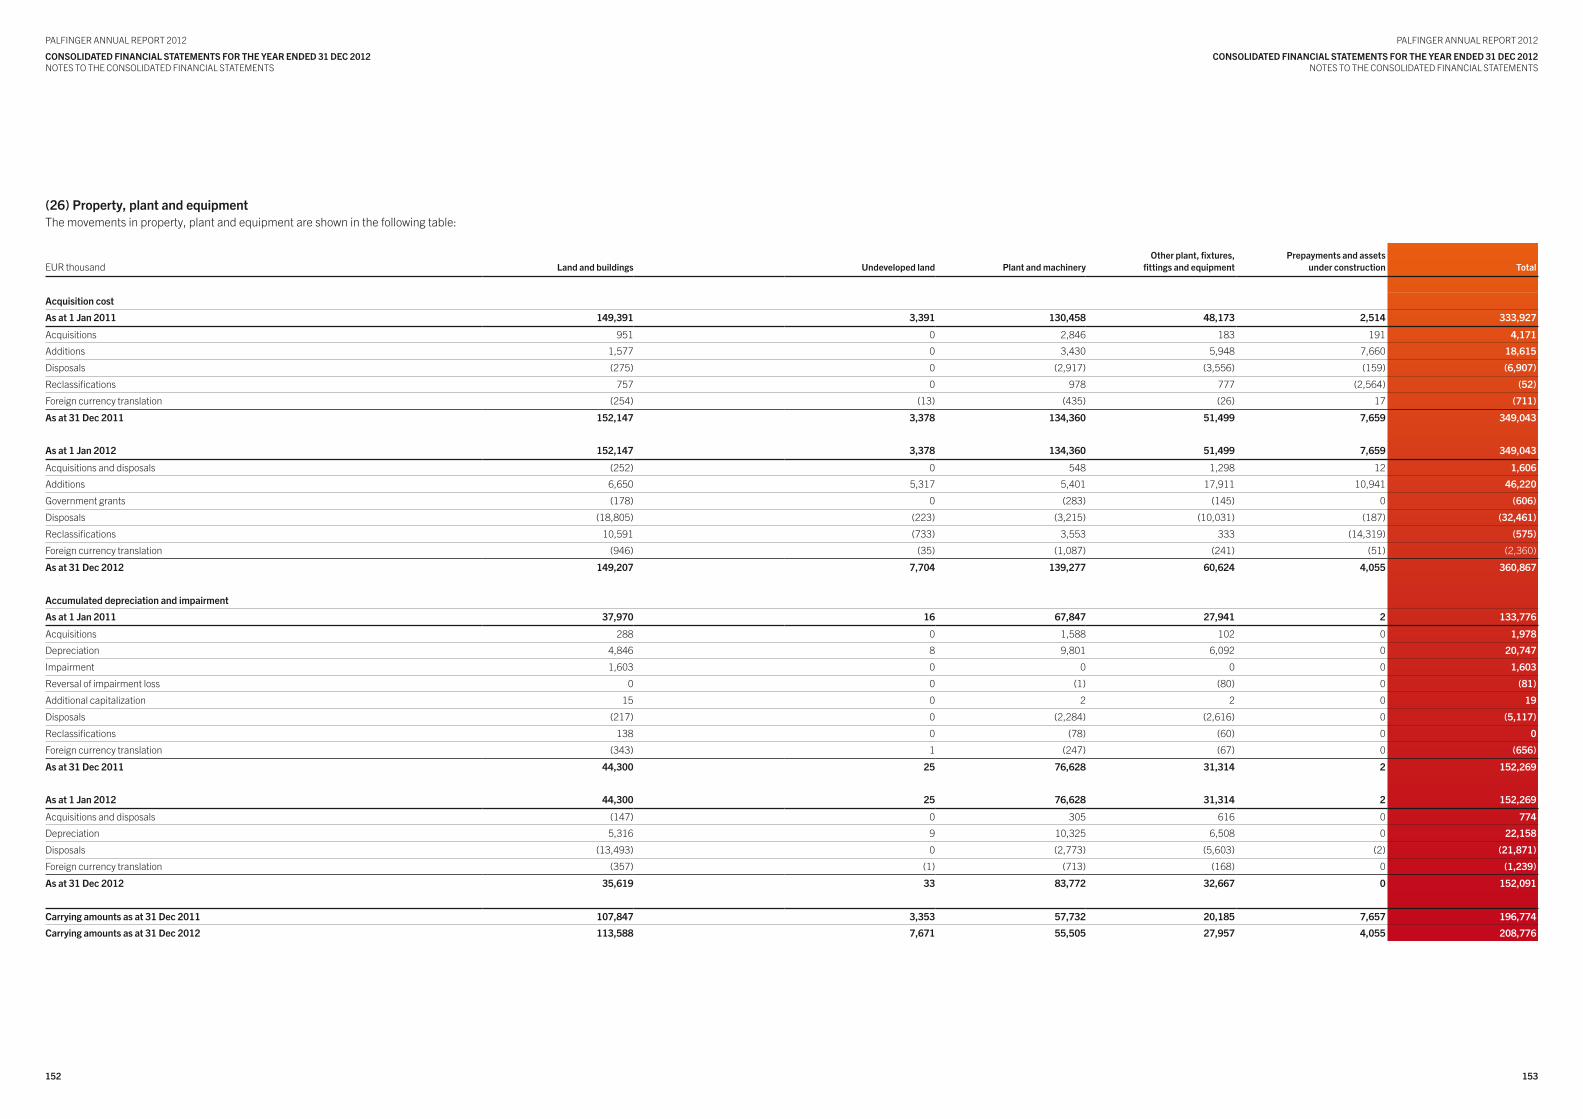
153152
PALFINGER ANNuAL REPoRt 2012
coNsoLIdAtEd FINANcIAL stAtEMENts FoR thE yEAR ENdEd 31 dEc 2012NotES to tHE CoNSoLIDAtED FINANCIAL StAtEMENtS
PALFINGER ANNuAL REPoRt 2012
coNsoLIdAtEd FINANcIAL stAtEMENts FoR thE yEAR ENdEd 31 dEc 2012NotES to tHE CoNSoLIDAtED FINANCIAL StAtEMENtS
(26) Property, plant and equipmentthe movements in property, plant and equipment are shown in the following table:
EuR thousand Land and buildings undeveloped land Plant and machineryother plant, fixtures,
fittings and equipmentPrepayments and assets
under construction total
Acquisition cost
As at 1 Jan 2011 149,391 3,391 130,458 48,173 2,514 333,927
Acquisitions 951 0 2,846 183 191 4,171
Additions 1,577 0 3,430 5,948 7,660 18,615
Disposals (275) 0 (2,917) (3,556) (159) (6,907)
Reclassifications 757 0 978 777 (2,564) (52)
Foreign currency translation (254) (13) (435) (26) 17 (711)
As at 31 dec 2011 152,147 3,378 134,360 51,499 7,659 349,043
As at 1 Jan 2012 152,147 3,378 134,360 51,499 7,659 349,043
Acquisitions and disposals (252) 0 548 1,298 12 1,606
Additions 6,650 5,317 5,401 17,911 10,941 46,220
Government grants (178) 0 (283) (145) 0 (606)
Disposals (18,805) (223) (3,215) (10,031) (187) (32,461)
Reclassifications 10,591 (733) 3,553 333 (14,319) (575)
Foreign currency translation (946) (35) (1,087) (241) (51) (2,360)
As at 31 dec 2012 149,207 7,704 139,277 60,624 4,055 360,867
Accumulated depreciation and impairment
As at 1 Jan 2011 37,970 16 67,847 27,941 2 133,776
Acquisitions 288 0 1,588 102 0 1,978
Depreciation 4,846 8 9,801 6,092 0 20,747
Impairment 1,603 0 0 0 0 1,603
Reversal of impairment loss 0 0 (1) (80) 0 (81)
Additional capitalization 15 0 2 2 0 19
Disposals (217) 0 (2,284) (2,616) 0 (5,117)
Reclassifications 138 0 (78) (60) 0 0
Foreign currency translation (343) 1 (247) (67) 0 (656)
As at 31 dec 2011 44,300 25 76,628 31,314 2 152,269
As at 1 Jan 2012 44,300 25 76,628 31,314 2 152,269
Acquisitions and disposals (147) 0 305 616 0 774
Depreciation 5,316 9 10,325 6,508 0 22,158
Disposals (13,493) 0 (2,773) (5,603) (2) (21,871)
Foreign currency translation (357) (1) (713) (168) 0 (1,239)
As at 31 dec 2012 35,619 33 83,772 32,667 0 152,091
carrying amounts as at 31 dec 2011 107,847 3,353 57,732 20,185 7,657 196,774
carrying amounts as at 31 dec 2012 113,588 7,671 55,505 27,957 4,055 208,776
154
PALFINGER ANNuAL REPoRt 2012
coNsoLIdAtEd FINANcIAL stAtEMENts FoR thE yEAR ENdEd 31 dEc 2012NotES to tHE CoNSoLIDAtED FINANCIAL StAtEMENtS
Additions related primarily to the construction of production plants in Bulgaria and North America in the amount of EuR 7,156 thousand as well as replacement and expansion investments in Austria amounting to EuR 20,066 thousand.
Land and buildings include the real estate values of developed properties amounting to EuR 18,021 thousand(previous year: EuR 17,788 thousand).
Prepayments and assets under construction are reported at cost and represent assets which were under constructionas at the balance sheet date, totalling EuR 3,733 thousand (previous year: EuR 6,903 thousand).
For the construction of new Group headquarters, properties with a total area of approx. 21,000 m2 were acquired in the vicinity of the present location. Acquisition costs amounted to EuR 5,309 thousand as at 31 December 2012.
In addition, a purchase option agreement was concluded, obligating and/or authorizing PALFINGER to acquire additional plots of land, amounting to approx. 19,000 m2 in total, after five or ten years, respectively, following the planned rezon-ing of the plots of land. the financial obligation to acquire these additional properties amounts to EuR 4,353 thousand plus an adjustment for inflation up to the date of exercise of the purchase option.
the construction of the new headquarters in Bergheim, Salzburg, is being planned and will start in 2013.
the premises accommodating the present headquarters in Salzburg were sold to the highest bidder, a company owned by the majority shareholder. PALFINGER AG’s profit from this sale was EuR 1,838 thousand; the purchase price has al-ready been paid in full. Since 1 october 2012, the present Group headquarters has been rented at an arm’s length price under a lease agreement that may be terminated by PALFINGER AG at the end of each quarter upon six months’ notice.
In the period under review, borrowing costs on qualifying assets in the amount of EuR 21 thousand (previous year: EuR 0 thousand) were capitalized.
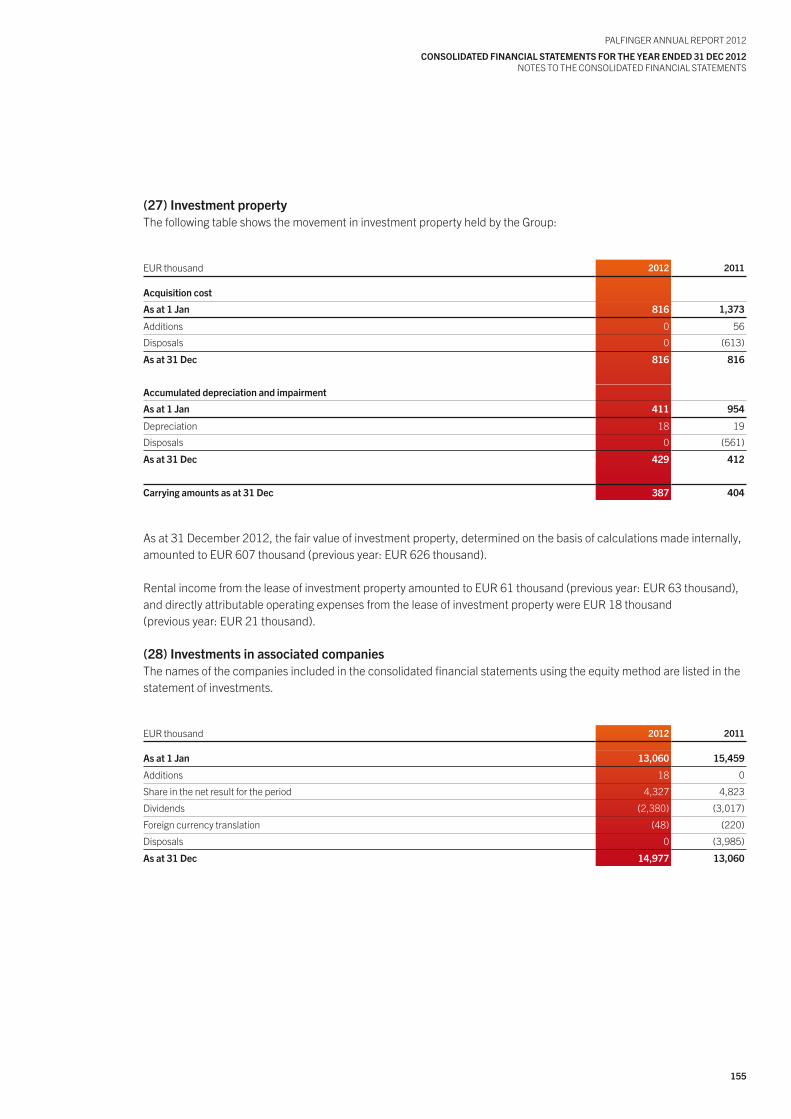
155
PALFINGER ANNuAL REPoRt 2012
coNsoLIdAtEd FINANcIAL stAtEMENts FoR thE yEAR ENdEd 31 dEc 2012NotES to tHE CoNSoLIDAtED FINANCIAL StAtEMENtS
(27) Investment propertythe following table shows the movement in investment property held by the Group:
EuR thousand 2012 2011
Acquisition cost
As at 1 Jan 816 1,373
Additions 0 56
Disposals 0 (613)
As at 31 dec 816 816
Accumulated depreciation and impairment
As at 1 Jan 411 954
Depreciation 18 19
Disposals 0 (561)
As at 31 dec 429 412
carrying amounts as at 31 dec 387 404
As at 31 December 2012, the fair value of investment property, determined on the basis of calculations made internally, amounted to EuR 607 thousand (previous year: EuR 626 thousand).
Rental income from the lease of investment property amounted to EuR 61 thousand (previous year: EuR 63 thousand), and directly attributable operating expenses from the lease of investment property were EuR 18 thousand (previous year: EuR 21 thousand).
(28) Investments in associated companiesthe names of the companies included in the consolidated financial statements using the equity method are listed in the statement of investments.
EuR thousand 2012 2011
As at 1 Jan 13,060 15,459
Additions 18 0
Share in the net result for the period 4,327 4,823
Dividends (2,380) (3,017)
Foreign currency translation (48) (220)
Disposals 0 (3,985)
As at 31 dec 14,977 13,060
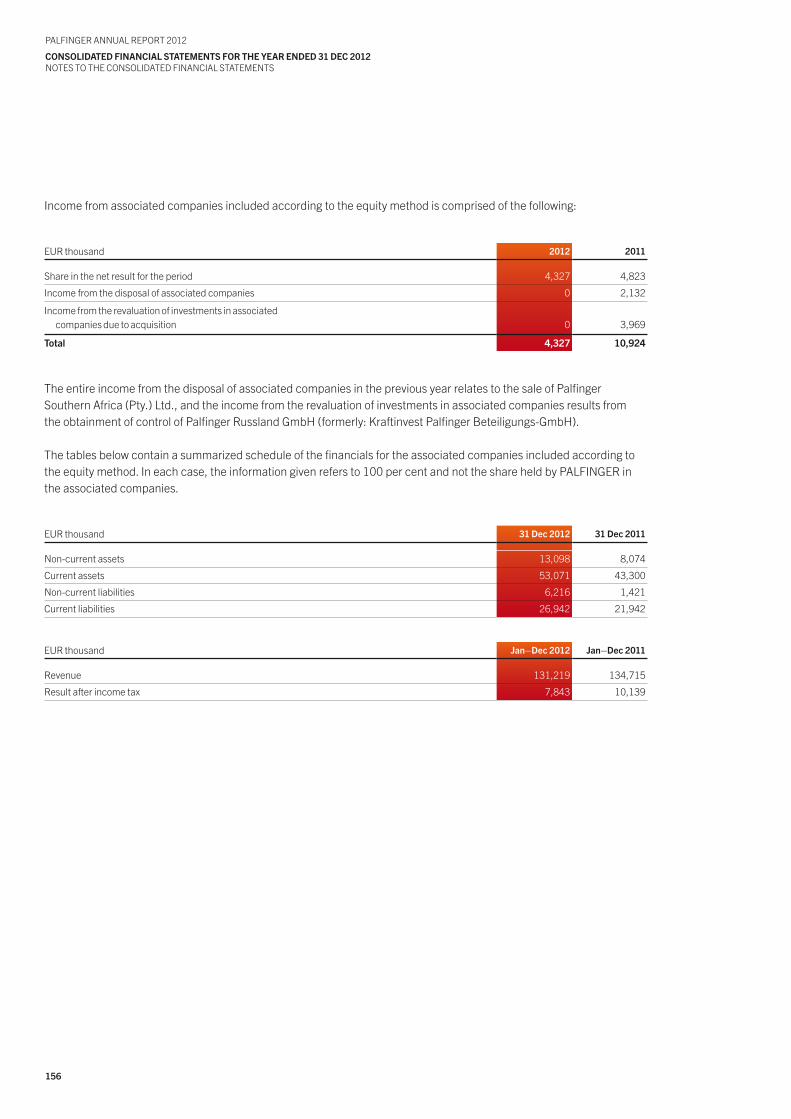
156
PALFINGER ANNuAL REPoRt 2012
coNsoLIdAtEd FINANcIAL stAtEMENts FoR thE yEAR ENdEd 31 dEc 2012NotES to tHE CoNSoLIDAtED FINANCIAL StAtEMENtS
Income from associated companies included according to the equity method is comprised of the following:
EuR thousand 2012 2011
Share in the net result for the period 4,327 4,823
Income from the disposal of associated companies 0 2,132
Income from the revaluation of investments in associatedcompanies due to acquisition 0 3,969
total 4,327 10,924
the entire income from the disposal of associated companies in the previous year relates to the sale of PalfingerSouthern Africa (Pty.) Ltd., and the income from the revaluation of investments in associated companies results fromthe obtainment of control of Palfinger Russland GmbH (formerly: Kraftinvest Palfinger Beteiligungs-GmbH).
the tables below contain a summarized schedule of the financials for the associated companies included according to the equity method. In each case, the information given refers to 100 per cent and not the share held by PALFINGER in the associated companies.
EuR thousand 31 dec 2012 31 dec 2011
Non-current assets 13,098 8,074
Current assets 53,071 43,300
Non-current liabilities 6,216 1,421
Current liabilities 26,942 21,942
EuR thousand Jan–dec 2012 Jan–dec 2011
Revenue 131,219 134,715
Result after income tax 7,843 10,139
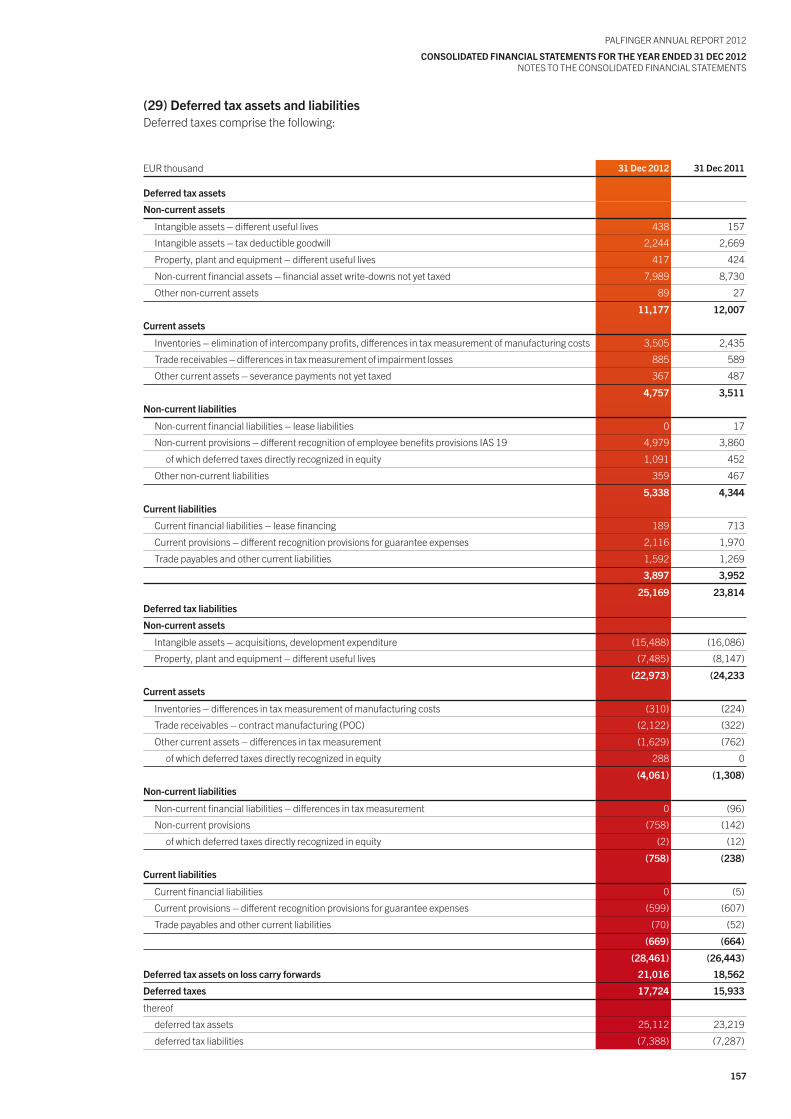
157
PALFINGER ANNuAL REPoRt 2012
coNsoLIdAtEd FINANcIAL stAtEMENts FoR thE yEAR ENdEd 31 dEc 2012NotES to tHE CoNSoLIDAtED FINANCIAL StAtEMENtS
(29) deferred tax assets and liabilitiesDeferred taxes comprise the following:
EuR thousand 31 dec 2012 31 dec 2011
deferred tax assets
Non-current assets
Intangible assets – different useful lives 438 157
Intangible assets – tax deductible goodwill 2,244 2,669
Property, plant and equipment – different useful lives 417 424
Non-current financial assets – financial asset write-downs not yet taxed 7,989 8,730
other non-current assets 89 27
11,177 12,007
current assets
Inventories – elimination of intercompany profits, differences in tax measurement of manufacturing costs 3,505 2,435
trade receivables – differences in tax measurement of impairment losses 885 589
other current assets – severance payments not yet taxed 367 487
4,757 3,511
Non-current liabilities
Non-current financial liabilities – lease liabilities 0 17
Non-current provisions – different recognition of employee benefits provisions IAS 19 4,979 3,860
of which deferred taxes directly recognized in equity 1,091 452
other non-current liabilities 359 467
5,338 4,344
current liabilities
Current financial liabilities – lease financing 189 713
Current provisions – different recognition provisions for guarantee expenses 2,116 1,970
trade payables and other current liabilities 1,592 1,269
3,897 3,952
25,169 23,814
deferred tax liabilities
Non-current assets
Intangible assets – acquisitions, development expenditure (15,488) (16,086)
Property, plant and equipment – different useful lives (7,485) (8,147)
(22,973) (24,233
current assets
Inventories – differences in tax measurement of manufacturing costs (310) (224)
trade receivables – contract manufacturing (PoC) (2,122) (322)
other current assets – differences in tax measurement (1,629) (762)
of which deferred taxes directly recognized in equity 288 0
(4,061) (1,308)
Non-current liabilities
Non-current financial liabilities – differences in tax measurement 0 (96)
Non-current provisions (758) (142)
of which deferred taxes directly recognized in equity (2) (12)
(758) (238)
current liabilities
Current financial liabilities 0 (5)
Current provisions – different recognition provisions for guarantee expenses (599) (607)
trade payables and other current liabilities (70) (52)
(669) (664)
(28,461) (26,443)
deferred tax assets on loss carry forwards 21,016 18,562
deferred taxes 17,724 15,933
thereof
deferred tax assets 25,112 23,219
deferred tax liabilities (7,388) (7,287)
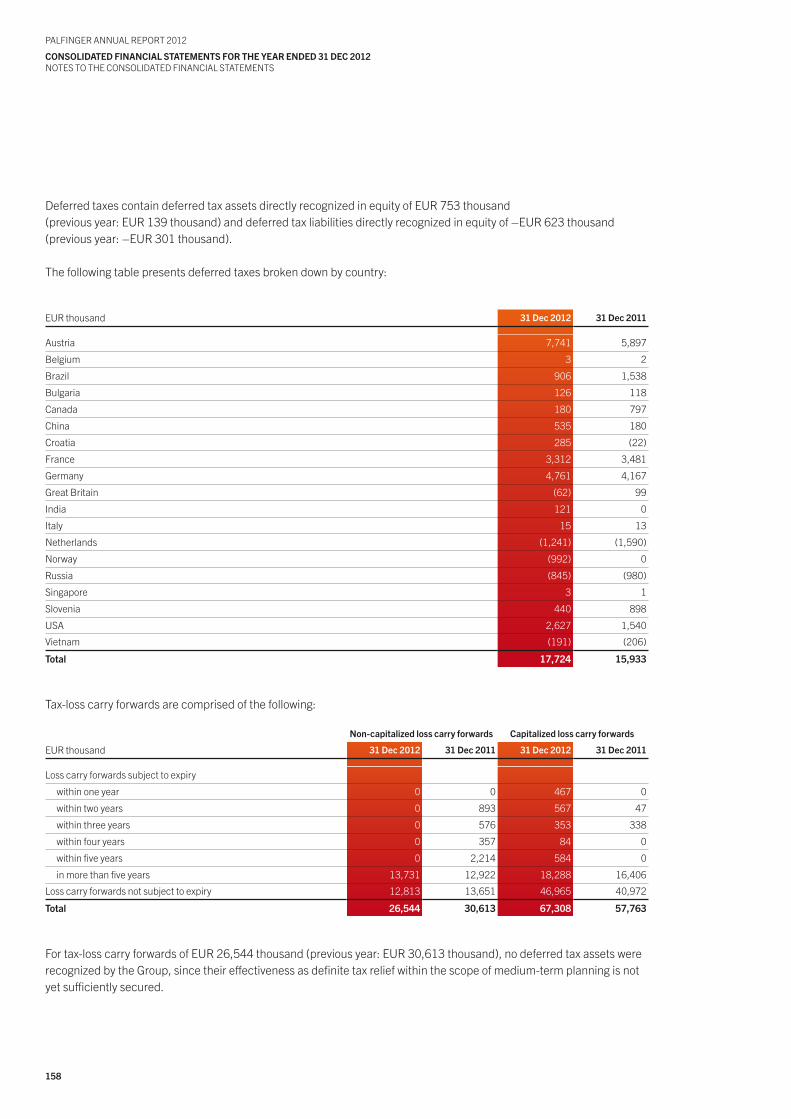
158
PALFINGER ANNuAL REPoRt 2012
coNsoLIdAtEd FINANcIAL stAtEMENts FoR thE yEAR ENdEd 31 dEc 2012NotES to tHE CoNSoLIDAtED FINANCIAL StAtEMENtS
Deferred taxes contain deferred tax assets directly recognized in equity of EuR 753 thousand (previous year: EuR 139 thousand) and deferred tax liabilities directly recognized in equity of –EuR 623 thousand (previous year: –EuR 301 thousand).
the following table presents deferred taxes broken down by country:
EuR thousand 31 dec 2012 31 dec 2011
Austria 7,741 5,897
Belgium 3 2
Brazil 906 1,538
Bulgaria 126 118
Canada 180 797
China 535 180
Croatia 285 (22)
France 3,312 3,481
Germany 4,761 4,167
Great Britain (62) 99
India 121 0
Italy 15 13
Netherlands (1,241) (1,590)
Norway (992) 0
Russia (845) (980)
Singapore 3 1
Slovenia 440 898
uSA 2,627 1,540
Vietnam (191) (206)
total 17,724 15,933
tax-loss carry forwards are comprised of the following:
Non-capitalized loss carry forwards capitalized loss carry forwards
EuR thousand 31 dec 2012 31 dec 2011 31 dec 2012 31 dec 2011
Loss carry forwards subject to expiry
within one year 0 0 467 0
within two years 0 893 567 47
within three years 0 576 353 338
within four years 0 357 84 0
within five years 0 2,214 584 0
in more than five years 13,731 12,922 18,288 16,406
Loss carry forwards not subject to expiry 12,813 13,651 46,965 40,972
total 26,544 30,613 67,308 57,763
For tax-loss carry forwards of EuR 26,544 thousand (previous year: EuR 30,613 thousand), no deferred tax assets were recognized by the Group, since their effectiveness as definite tax relief within the scope of medium-term planning is not yet sufficiently secured.
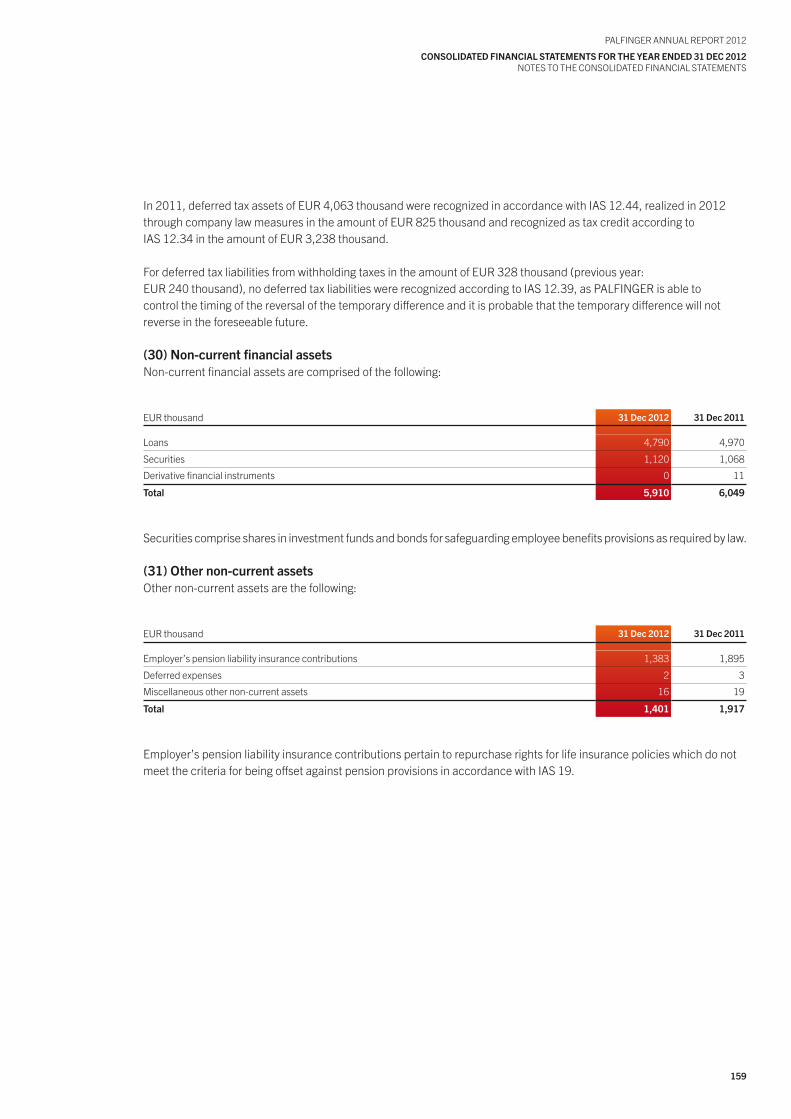
159
PALFINGER ANNuAL REPoRt 2012
coNsoLIdAtEd FINANcIAL stAtEMENts FoR thE yEAR ENdEd 31 dEc 2012NotES to tHE CoNSoLIDAtED FINANCIAL StAtEMENtS
In 2011, deferred tax assets of EuR 4,063 thousand were recognized in accordance with IAS 12.44, realized in 2012 through company law measures in the amount of EuR 825 thousand and recognized as tax credit according to IAS 12.34 in the amount of EuR 3,238 thousand.
For deferred tax liabilities from withholding taxes in the amount of EuR 328 thousand (previous year: EuR 240 thousand), no deferred tax liabilities were recognized according to IAS 12.39, as PALFINGER is able to control the timing of the reversal of the temporary difference and it is probable that the temporary difference will not reverse in the foreseeable future.
(30) Non-current financial assetsNon-current financial assets are comprised of the following:
EuR thousand 31 dec 2012 31 dec 2011
Loans 4,790 4,970
Securities 1,120 1,068
Derivative financial instruments 0 11
total 5,910 6,049
Securities comprise shares in investment funds and bonds for safeguarding employee benefits provisions as required by law.
(31) other non-current assetsother non-current assets are the following:
EuR thousand 31 dec 2012 31 dec 2011
Employer’s pension liability insurance contributions 1,383 1,895
Deferred expenses 2 3
Miscellaneous other non-current assets 16 19
total 1,401 1,917
Employer’s pension liability insurance contributions pertain to repurchase rights for life insurance policies which do not meet the criteria for being offset against pension provisions in accordance with IAS 19.
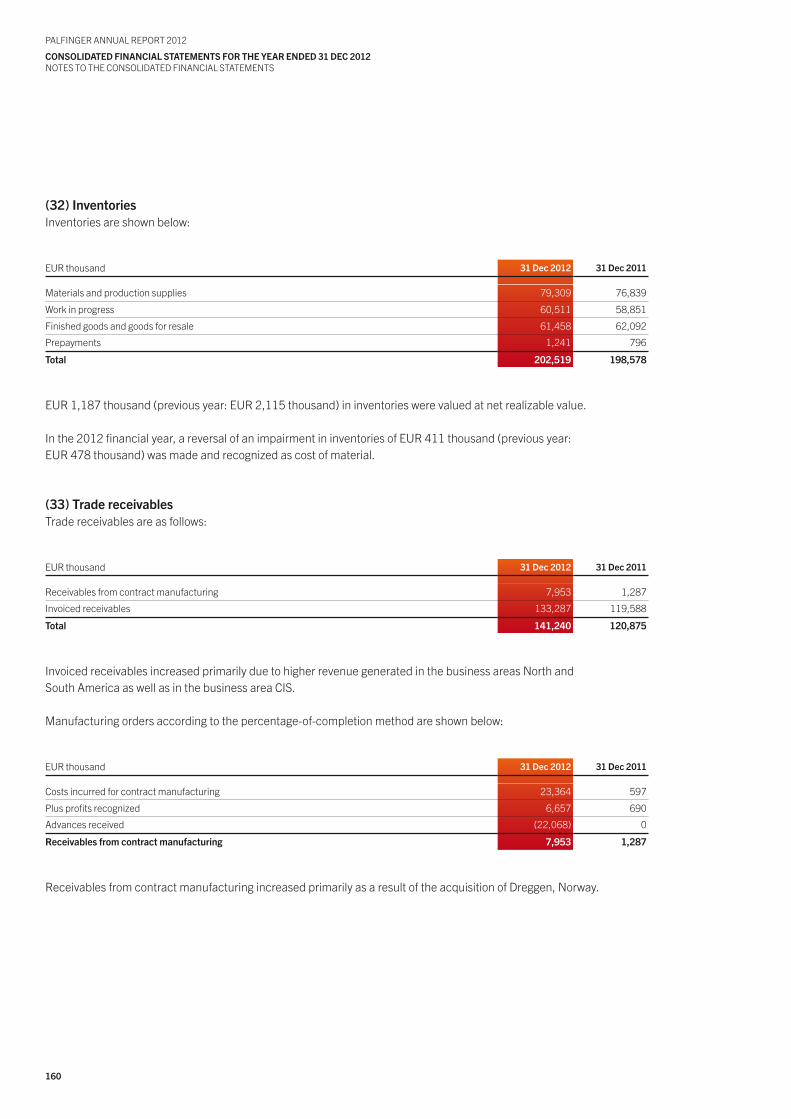
160
PALFINGER ANNuAL REPoRt 2012
coNsoLIdAtEd FINANcIAL stAtEMENts FoR thE yEAR ENdEd 31 dEc 2012NotES to tHE CoNSoLIDAtED FINANCIAL StAtEMENtS
(32) InventoriesInventories are shown below:
EuR thousand 31 dec 2012 31 dec 2011
Materials and production supplies 79,309 76,839
Work in progress 60,511 58,851
Finished goods and goods for resale 61,458 62,092
Prepayments 1,241 796
total 202,519 198,578
EuR 1,187 thousand (previous year: EuR 2,115 thousand) in inventories were valued at net realizable value.
In the 2012 financial year, a reversal of an impairment in inventories of EuR 411 thousand (previous year:EuR 478 thousand) was made and recognized as cost of material.
(33) trade receivablestrade receivables are as follows:
EuR thousand 31 dec 2012 31 dec 2011
Receivables from contract manufacturing 7,953 1,287
Invoiced receivables 133,287 119,588
total 141,240 120,875
Invoiced receivables increased primarily due to higher revenue generated in the business areas North andSouth America as well as in the business area CIS.
Manufacturing orders according to the percentage-of-completion method are shown below:
EuR thousand 31 dec 2012 31 dec 2011
Costs incurred for contract manufacturing 23,364 597
Plus profits recognized 6,657 690
Advances received (22,068) 0
Receivables from contract manufacturing 7,953 1,287
Receivables from contract manufacturing increased primarily as a result of the acquisition of Dreggen, Norway.
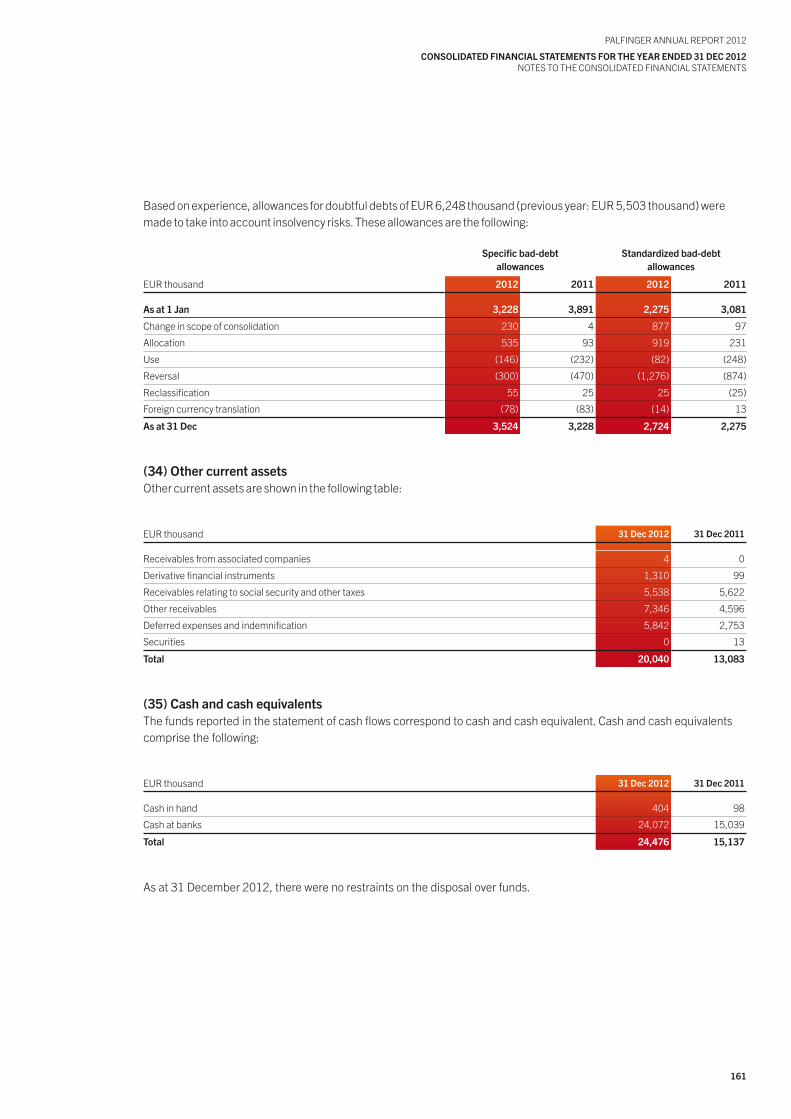
161
PALFINGER ANNuAL REPoRt 2012
coNsoLIdAtEd FINANcIAL stAtEMENts FoR thE yEAR ENdEd 31 dEc 2012NotES to tHE CoNSoLIDAtED FINANCIAL StAtEMENtS
Based on experience, allowances for doubtful debts of EuR 6,248 thousand (previous year: EuR 5,503 thousand) were made to take into account insolvency risks. these allowances are the following:
specific bad-debtallowances
standardized bad-debtallowances
EuR thousand 2012 2011 2012 2011
As at 1 Jan 3,228 3,891 2,275 3,081
Change in scope of consolidation 230 4 877 97
Allocation 535 93 919 231
use (146) (232) (82) (248)
Reversal (300) (470) (1,276) (874)
Reclassification 55 25 25 (25)
Foreign currency translation (78) (83) (14) 13
As at 31 dec 3,524 3,228 2,724 2,275
(34) other current assetsother current assets are shown in the following table:
EuR thousand 31 dec 2012 31 dec 2011
Receivables from associated companies 4 0
Derivative financial instruments 1,310 99
Receivables relating to social security and other taxes 5,538 5,622
other receivables 7,346 4,596
Deferred expenses and indemnification 5,842 2,753
Securities 0 13
total 20,040 13,083
(35) cash and cash equivalentsthe funds reported in the statement of cash flows correspond to cash and cash equivalent. Cash and cash equivalents comprise the following:
EuR thousand 31 dec 2012 31 dec 2011
Cash in hand 404 98
Cash at banks 24,072 15,039
total 24,476 15,137
As at 31 December 2012, there were no restraints on the disposal over funds.
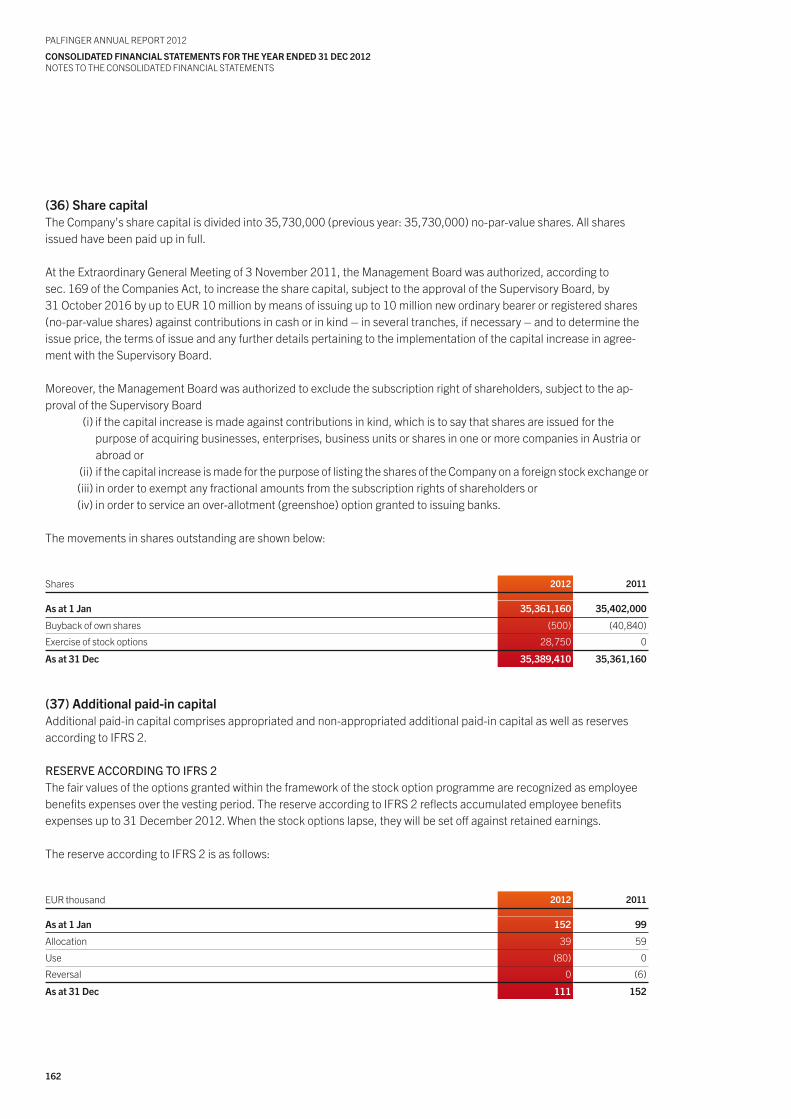
162
PALFINGER ANNuAL REPoRt 2012
coNsoLIdAtEd FINANcIAL stAtEMENts FoR thE yEAR ENdEd 31 dEc 2012NotES to tHE CoNSoLIDAtED FINANCIAL StAtEMENtS
(36) share capitalthe Company’s share capital is divided into 35,730,000 (previous year: 35,730,000) no-par-value shares. All sharesissued have been paid up in full.
At the Extraordinary General Meeting of 3 November 2011, the Management Board was authorized, according tosec. 169 of the Companies Act, to increase the share capital, subject to the approval of the Supervisory Board, by 31 october 2016 by up to EuR 10 million by means of issuing up to 10 million new ordinary bearer or registered shares (no-par-value shares) against contributions in cash or in kind – in several tranches, if necessary – and to determine the issue price, the terms of issue and any further details pertaining to the implementation of the capital increase in agree-ment with the Supervisory Board.
Moreover, the Management Board was authorized to exclude the subscription right of shareholders, subject to the ap-proval of the Supervisory Board (i) if the capital increase is made against contributions in kind, which is to say that shares are issued for the purpose of acquiring businesses, enterprises, business units or shares in one or more companies in Austria or abroad or (ii) if the capital increase is made for the purpose of listing the shares of the Company on a foreign stock exchange or (iii) in order to exempt any fractional amounts from the subscription rights of shareholders or (iv) in order to service an over-allotment (greenshoe) option granted to issuing banks.
the movements in shares outstanding are shown below:
Shares 2012 2011
As at 1 Jan 35,361,160 35,402,000
Buyback of own shares (500) (40,840)
Exercise of stock options 28,750 0
As at 31 dec 35,389,410 35,361,160
(37) Additional paid-in capitalAdditional paid-in capital comprises appropriated and non-appropriated additional paid-in capital as well as reserves according to IFRS 2.
RESERvEACCORDINGTOIFRS2the fair values of the options granted within the framework of the stock option programme are recognized as employee benefits expenses over the vesting period. the reserve according to IFRS 2 reflects accumulated employee benefitsexpenses up to 31 December 2012. When the stock options lapse, they will be set off against retained earnings.
the reserve according to IFRS 2 is as follows:
EuR thousand 2012 2011
As at 1 Jan 152 99
Allocation 39 59
use (80) 0
Reversal 0 (6)
As at 31 dec 111 152
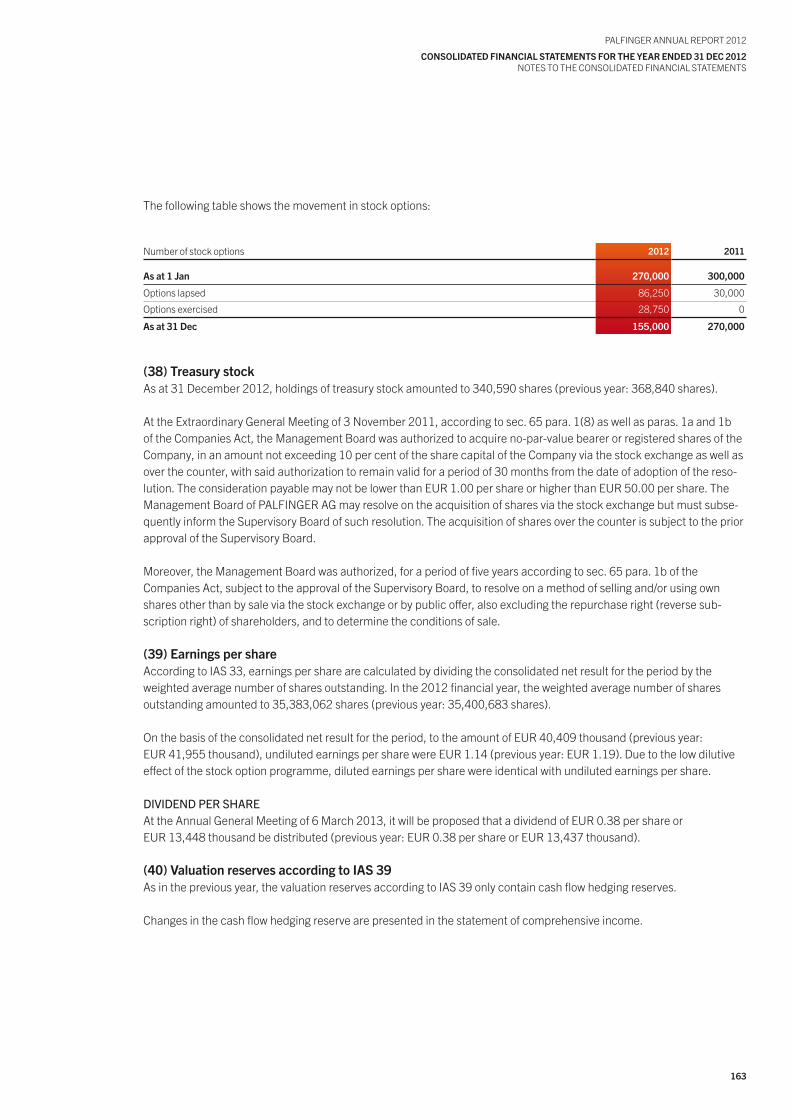
163
PALFINGER ANNuAL REPoRt 2012
coNsoLIdAtEd FINANcIAL stAtEMENts FoR thE yEAR ENdEd 31 dEc 2012NotES to tHE CoNSoLIDAtED FINANCIAL StAtEMENtS
the following table shows the movement in stock options:
Number of stock options 2012 2011
As at 1 Jan 270,000 300,000
options lapsed 86,250 30,000
options exercised 28,750 0
As at 31 dec 155,000 270,000
(38) treasury stockAs at 31 December 2012, holdings of treasury stock amounted to 340,590 shares (previous year: 368,840 shares).
At the Extraordinary General Meeting of 3 November 2011, according to sec. 65 para. 1(8) as well as paras. 1a and 1b of the Companies Act, the Management Board was authorized to acquire no-par-value bearer or registered shares of the Company, in an amount not exceeding 10 per cent of the share capital of the Company via the stock exchange as well as over the counter, with said authorization to remain valid for a period of 30 months from the date of adoption of the reso-lution. the consideration payable may not be lower than EuR 1.00 per share or higher than EuR 50.00 per share. the Management Board of PALFINGER AG may resolve on the acquisition of shares via the stock exchange but must subse-quently inform the Supervisory Board of such resolution. the acquisition of shares over the counter is subject to the prior approval of the Supervisory Board.
Moreover, the Management Board was authorized, for a period of five years according to sec. 65 para. 1b of theCompanies Act, subject to the approval of the Supervisory Board, to resolve on a method of selling and/or using own shares other than by sale via the stock exchange or by public offer, also excluding the repurchase right (reverse sub-scription right) of shareholders, and to determine the conditions of sale.
(39) Earnings per shareAccording to IAS 33, earnings per share are calculated by dividing the consolidated net result for the period by the weighted average number of shares outstanding. In the 2012 financial year, the weighted average number of sharesoutstanding amounted to 35,383,062 shares (previous year: 35,400,683 shares).
on the basis of the consolidated net result for the period, to the amount of EuR 40,409 thousand (previous year:EuR 41,955 thousand), undiluted earnings per share were EuR 1.14 (previous year: EuR 1.19). Due to the low dilutive effect of the stock option programme, diluted earnings per share were identical with undiluted earnings per share.
DIvIDENDPERSHAREAt the Annual General Meeting of 6 March 2013, it will be proposed that a dividend of EuR 0.38 per share orEuR 13,448 thousand be distributed (previous year: EuR 0.38 per share or EuR 13,437 thousand).
(40) Valuation reserves according to IAs 39As in the previous year, the valuation reserves according to IAS 39 only contain cash flow hedging reserves.
Changes in the cash flow hedging reserve are presented in the statement of comprehensive income.
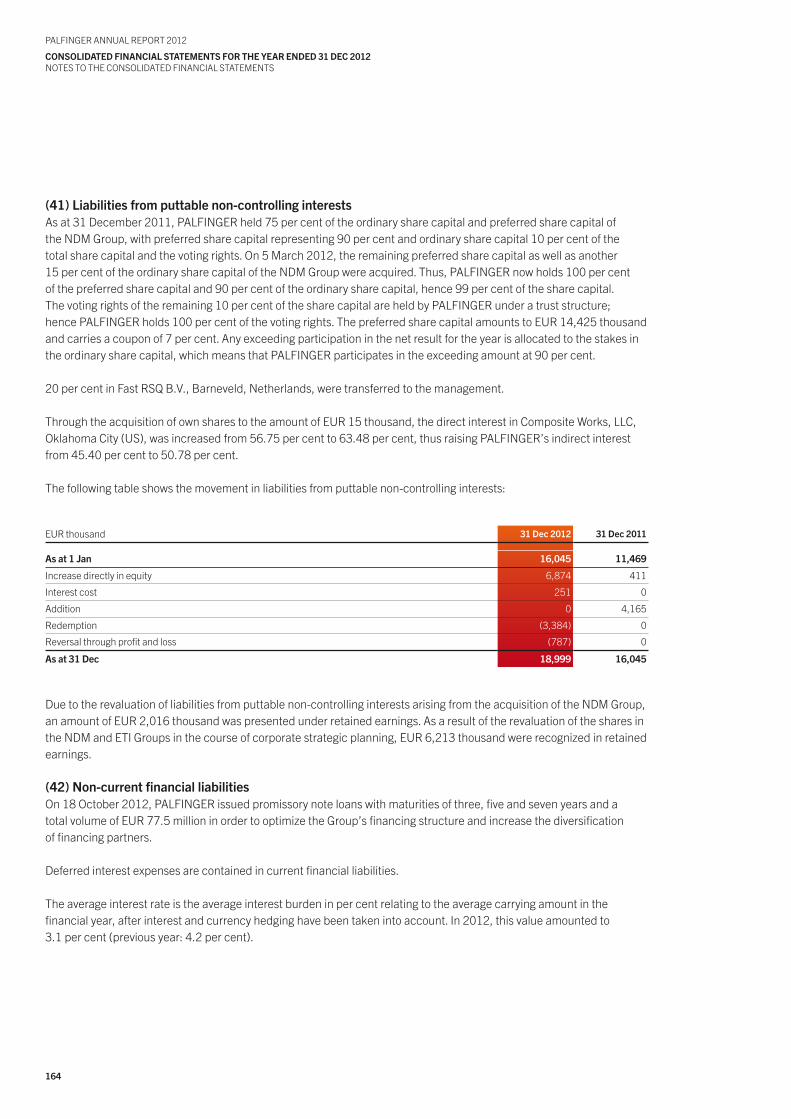
164
PALFINGER ANNuAL REPoRt 2012
coNsoLIdAtEd FINANcIAL stAtEMENts FoR thE yEAR ENdEd 31 dEc 2012NotES to tHE CoNSoLIDAtED FINANCIAL StAtEMENtS
(41) Liabilities from puttable non-controlling interestsAs at 31 December 2011, PALFINGER held 75 per cent of the ordinary share capital and preferred share capital ofthe NDM Group, with preferred share capital representing 90 per cent and ordinary share capital 10 per cent of thetotal share capital and the voting rights. on 5 March 2012, the remaining preferred share capital as well as another15 per cent of the ordinary share capital of the NDM Group were acquired. thus, PALFINGER now holds 100 per centof the preferred share capital and 90 per cent of the ordinary share capital, hence 99 per cent of the share capital.the voting rights of the remaining 10 per cent of the share capital are held by PALFINGER under a trust structure;hence PALFINGER holds 100 per cent of the voting rights. the preferred share capital amounts to EuR 14,425 thousand and carries a coupon of 7 per cent. Any exceeding participation in the net result for the year is allocated to the stakes in the ordinary share capital, which means that PALFINGER participates in the exceeding amount at 90 per cent.
20 per cent in Fast RSQ B.V., Barneveld, Netherlands, were transferred to the management.
through the acquisition of own shares to the amount of EuR 15 thousand, the direct interest in Composite Works, LLC, oklahoma City (uS), was increased from 56.75 per cent to 63.48 per cent, thus raising PALFINGER’s indirect interest from 45.40 per cent to 50.78 per cent.
the following table shows the movement in liabilities from puttable non-controlling interests:
EuR thousand 31 dec 2012 31 dec 2011
As at 1 Jan 16,045 11,469
Increase directly in equity 6,874 411
Interest cost 251 0
Addition 0 4,165
Redemption (3,384) 0
Reversal through profit and loss (787) 0
As at 31 dec 18,999 16,045
Due to the revaluation of liabilities from puttable non-controlling interests arising from the acquisition of the NDM Group, an amount of EuR 2,016 thousand was presented under retained earnings. As a result of the revaluation of the shares in the NDM and EtI Groups in the course of corporate strategic planning, EuR 6,213 thousand were recognized in retained earnings.
(42) Non-current financial liabilitieson 18 october 2012, PALFINGER issued promissory note loans with maturities of three, five and seven years and a total volume of EuR 77.5 million in order to optimize the Group’s financing structure and increase the diversification of financing partners.
Deferred interest expenses are contained in current financial liabilities.
the average interest rate is the average interest burden in per cent relating to the average carrying amount in the financial year, after interest and currency hedging have been taken into account. In 2012, this value amounted to 3.1 per cent (previous year: 4.2 per cent).
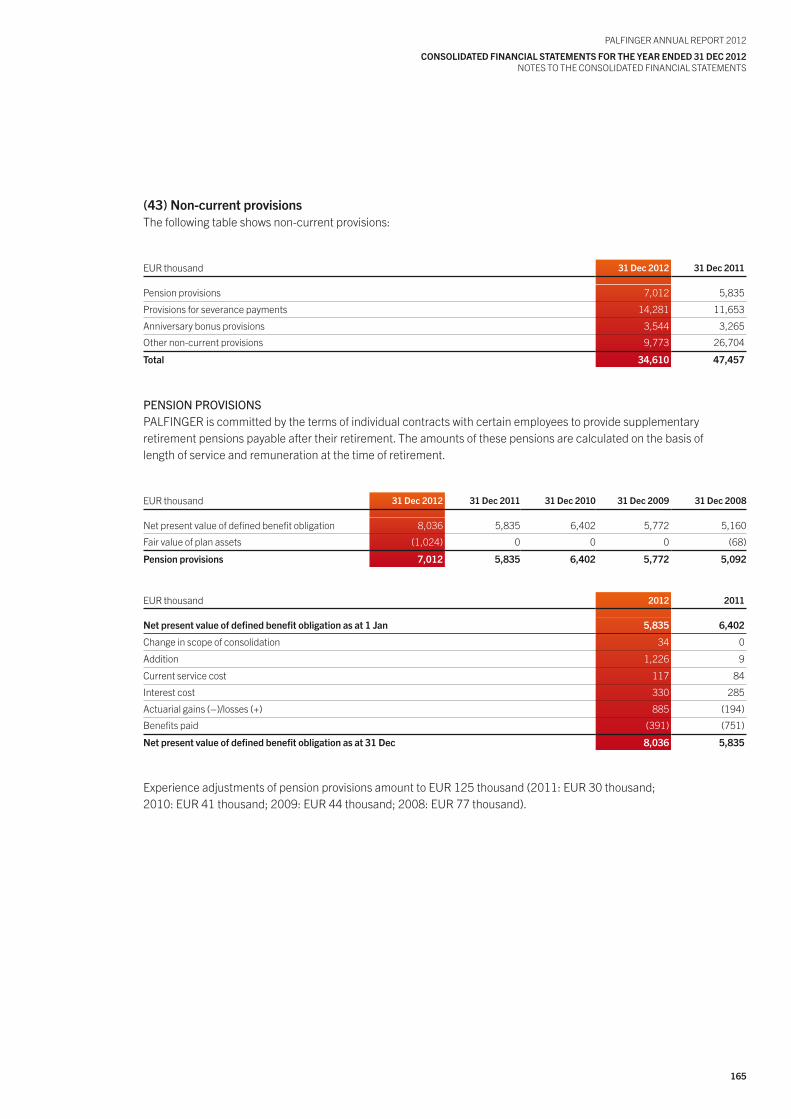
165
PALFINGER ANNuAL REPoRt 2012
coNsoLIdAtEd FINANcIAL stAtEMENts FoR thE yEAR ENdEd 31 dEc 2012NotES to tHE CoNSoLIDAtED FINANCIAL StAtEMENtS
(43) Non-current provisionsthe following table shows non-current provisions:
EuR thousand 31 dec 2012 31 dec 2011
Pension provisions 7,012 5,835
Provisions for severance payments 14,281 11,653
Anniversary bonus provisions 3,544 3,265
other non-current provisions 9,773 26,704
total 34,610 47,457
PENSIONPROvISIONSPALFINGER is committed by the terms of individual contracts with certain employees to provide supplementary retirement pensions payable after their retirement. the amounts of these pensions are calculated on the basis of length of service and remuneration at the time of retirement.
EuR thousand 31 dec 2012 31 dec 2011 31 dec 2010 31 dec 2009 31 dec 2008
Net present value of defined benefit obligation 8,036 5,835 6,402 5,772 5,160
Fair value of plan assets (1,024) 0 0 0 (68)
Pension provisions 7,012 5,835 6,402 5,772 5,092
EuR thousand 2012 2011
Net present value of defined benefit obligation as at 1 Jan 5,835 6,402
Change in scope of consolidation 34 0
Addition 1,226 9
Current service cost 117 84
Interest cost 330 285
Actuarial gains (–)/losses (+) 885 (194)
Benefits paid (391) (751)
Net present value of defined benefit obligation as at 31 dec 8,036 5,835
Experience adjustments of pension provisions amount to EuR 125 thousand (2011: EuR 30 thousand;2010: EuR 41 thousand; 2009: EuR 44 thousand; 2008: EuR 77 thousand).
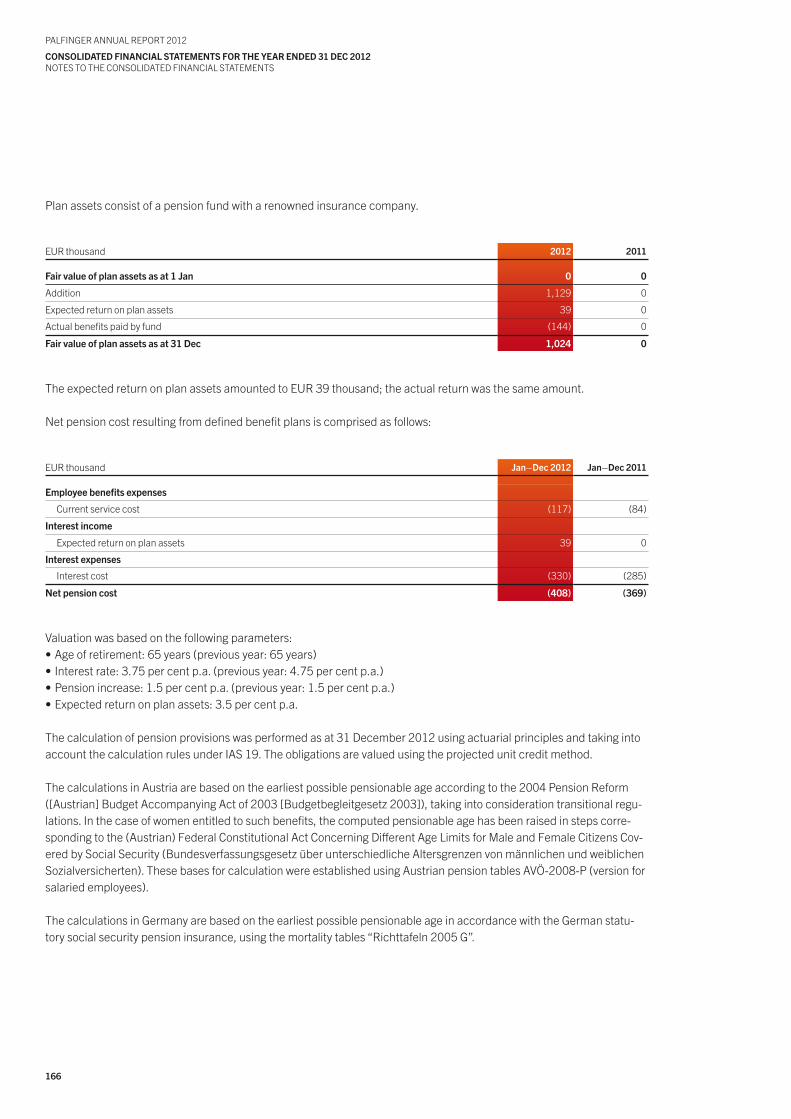
166
PALFINGER ANNuAL REPoRt 2012
coNsoLIdAtEd FINANcIAL stAtEMENts FoR thE yEAR ENdEd 31 dEc 2012NotES to tHE CoNSoLIDAtED FINANCIAL StAtEMENtS
Plan assets consist of a pension fund with a renowned insurance company.
EuR thousand 2012 2011
Fair value of plan assets as at 1 Jan 0 0
Addition 1,129 0
Expected return on plan assets 39 0
Actual benefits paid by fund (144) 0
Fair value of plan assets as at 31 dec 1,024 0
the expected return on plan assets amounted to EuR 39 thousand; the actual return was the same amount.
Net pension cost resulting from defined benefit plans is comprised as follows:
EuR thousand Jan–dec 2012 Jan–dec 2011
Employee benefits expenses
Current service cost (117) (84)
Interest income
Expected return on plan assets 39 0
Interest expenses
Interest cost (330) (285)
Net pension cost (408) (369)
Valuation was based on the following parameters:•Ageofretirement:65years(previousyear:65years)•Interestrate:3.75percentp.a.(previousyear:4.75percentp.a.)•Pensionincrease:1.5percentp.a.(previousyear:1.5percentp.a.)•Expectedreturnonplanassets:3.5percentp.a.
the calculation of pension provisions was performed as at 31 December 2012 using actuarial principles and taking into account the calculation rules under IAS 19. the obligations are valued using the projected unit credit method.
the calculations in Austria are based on the earliest possible pensionable age according to the 2004 Pension Reform ([Austrian] Budget Accompanying Act of 2003 [Budgetbegleitgesetz 2003]), taking into consideration transitional regu-lations. In the case of women entitled to such benefits, the computed pensionable age has been raised in steps corre-sponding to the (Austrian) Federal Constitutional Act Concerning Different Age Limits for Male and Female Citizens Cov-eredbySocialSecurity(BundesverfassungsgesetzüberunterschiedlicheAltersgrenzenvonmännlichenundweiblichenSozialversicherten). these bases for calculation were established using Austrian pension tables AVÖ-2008-P (version for salaried employees).
the calculations in Germany are based on the earliest possible pensionable age in accordance with the German statu-tory social security pension insurance, using the mortality tables “Richttafeln 2005 G”.
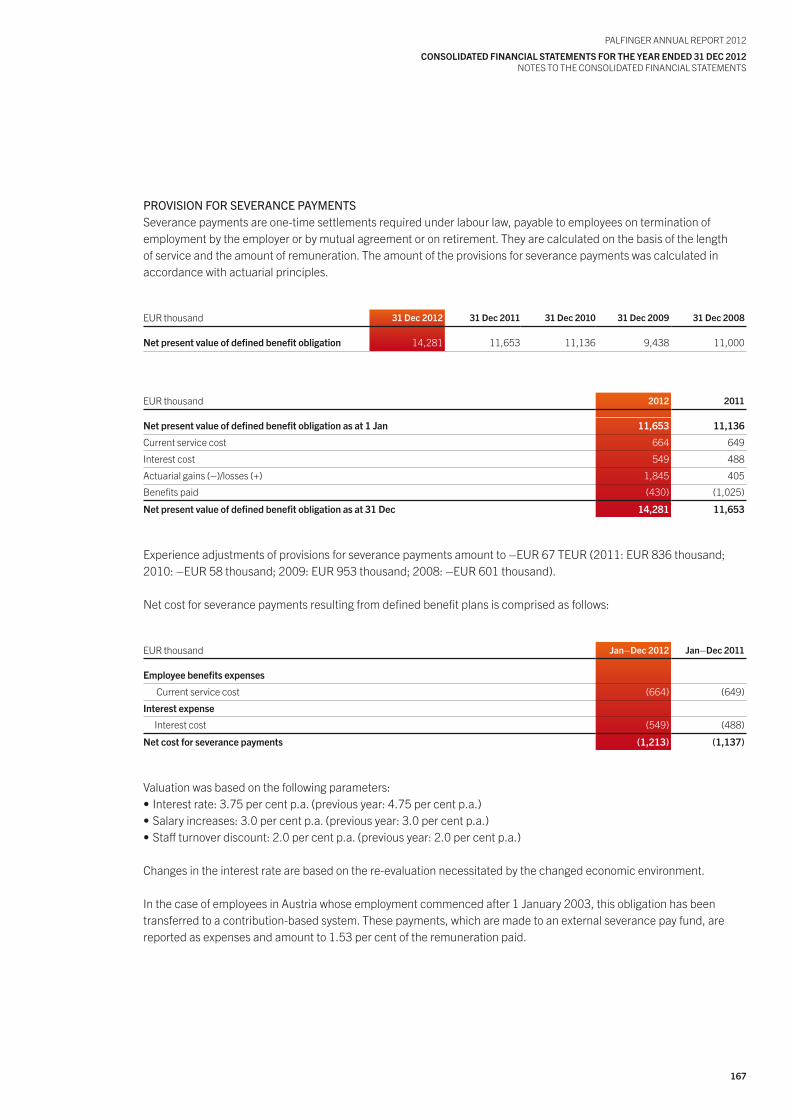
167
PALFINGER ANNuAL REPoRt 2012
coNsoLIdAtEd FINANcIAL stAtEMENts FoR thE yEAR ENdEd 31 dEc 2012NotES to tHE CoNSoLIDAtED FINANCIAL StAtEMENtS
PROvISIONFORSEvERANCEPAyMENTSSeverance payments are one-time settlements required under labour law, payable to employees on termination ofemployment by the employer or by mutual agreement or on retirement. they are calculated on the basis of the lengthof service and the amount of remuneration. the amount of the provisions for severance payments was calculated inaccordance with actuarial principles.
EuR thousand 31 dec 2012 31 dec 2011 31 dec 2010 31 dec 2009 31 dec 2008
Net present value of defined benefit obligation 14,281 11,653 11,136 9,438 11,000
EuR thousand 2012 2011
Net present value of defined benefit obligation as at 1 Jan 11,653 11,136
Current service cost 664 649
Interest cost 549 488
Actuarial gains (–)/losses (+) 1,845 405
Benefits paid (430) (1,025)
Net present value of defined benefit obligation as at 31 dec 14,281 11,653
Experience adjustments of provisions for severance payments amount to –EuR 67 tEuR (2011: EuR 836 thousand; 2010: –EuR 58 thousand; 2009: EuR 953 thousand; 2008: –EuR 601 thousand).
Net cost for severance payments resulting from defined benefit plans is comprised as follows:
EuR thousand Jan–dec 2012 Jan–dec 2011
Employee benefits expenses
Current service cost (664) (649)
Interest expense
Interest cost (549) (488)
Net cost for severance payments (1,213) (1,137)
Valuation was based on the following parameters:•Interestrate:3.75percentp.a.(previousyear:4.75percentp.a.)•Salaryincreases:3.0percentp.a.(previousyear:3.0percentp.a.)•Staffturnoverdiscount:2.0percentp.a.(previousyear:2.0percentp.a.)
Changes in the interest rate are based on the re-evaluation necessitated by the changed economic environment.
In the case of employees in Austria whose employment commenced after 1 January 2003, this obligation has been transferred to a contribution-based system. these payments, which are made to an external severance pay fund, are reported as expenses and amount to 1.53 per cent of the remuneration paid.
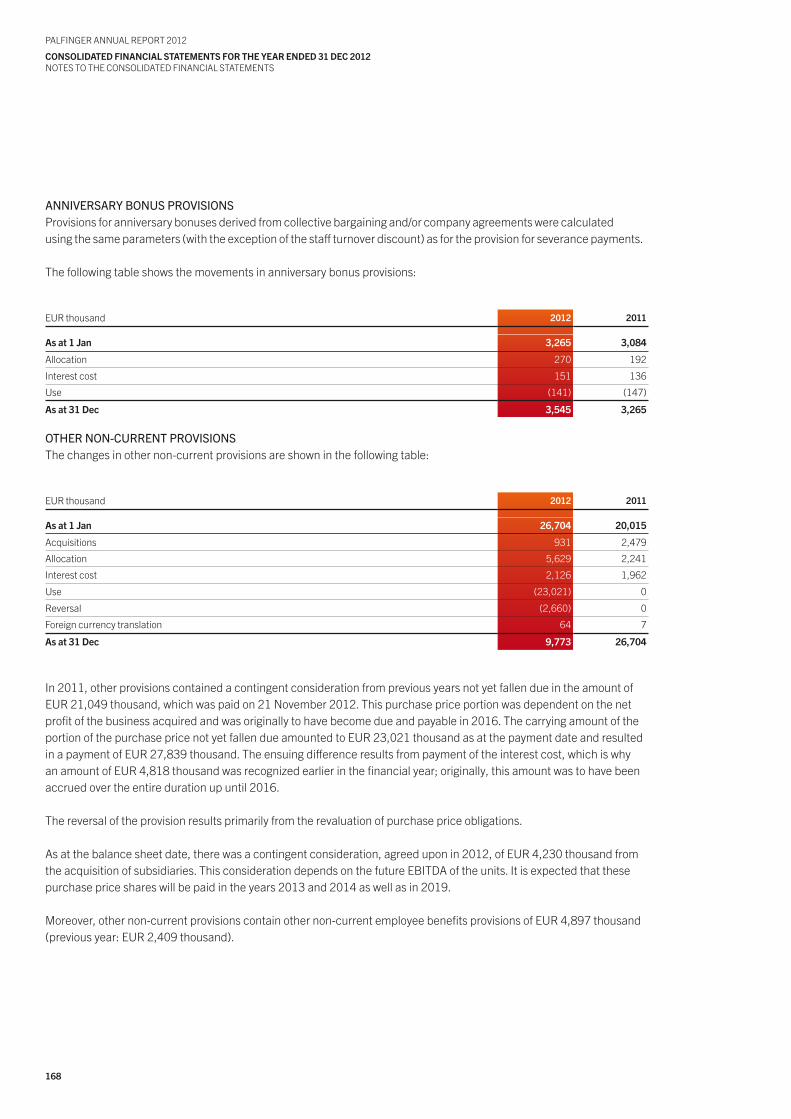
168
PALFINGER ANNuAL REPoRt 2012
coNsoLIdAtEd FINANcIAL stAtEMENts FoR thE yEAR ENdEd 31 dEc 2012NotES to tHE CoNSoLIDAtED FINANCIAL StAtEMENtS
ANNIvERSARyBONUSPROvISIONSProvisions for anniversary bonuses derived from collective bargaining and/or company agreements were calculatedusing the same parameters (with the exception of the staff turnover discount) as for the provision for severance payments.
the following table shows the movements in anniversary bonus provisions:
EuR thousand 2012 2011
As at 1 Jan 3,265 3,084
Allocation 270 192
Interest cost 151 136
use (141) (147)
As at 31 dec 3,545 3,265
OTHERNON-CURRENTPROvISIONSthe changes in other non-current provisions are shown in the following table:
EuR thousand 2012 2011
As at 1 Jan 26,704 20,015
Acquisitions 931 2,479
Allocation 5,629 2,241
Interest cost 2,126 1,962
use (23,021) 0
Reversal (2,660) 0
Foreign currency translation 64 7
As at 31 dec 9,773 26,704
In 2011, other provisions contained a contingent consideration from previous years not yet fallen due in the amount of EuR 21,049 thousand, which was paid on 21 November 2012. this purchase price portion was dependent on the net profit of the business acquired and was originally to have become due and payable in 2016. the carrying amount of the portion of the purchase price not yet fallen due amounted to EuR 23,021 thousand as at the payment date and resulted in a payment of EuR 27,839 thousand. the ensuing difference results from payment of the interest cost, which is why an amount of EuR 4,818 thousand was recognized earlier in the financial year; originally, this amount was to have been accrued over the entire duration up until 2016.
the reversal of the provision results primarily from the revaluation of purchase price obligations.
As at the balance sheet date, there was a contingent consideration, agreed upon in 2012, of EuR 4,230 thousand from the acquisition of subsidiaries. this consideration depends on the future EBItDA of the units. It is expected that these purchase price shares will be paid in the years 2013 and 2014 as well as in 2019.
Moreover, other non-current provisions contain other non-current employee benefits provisions of EuR 4,897 thousand (previous year: EuR 2,409 thousand).
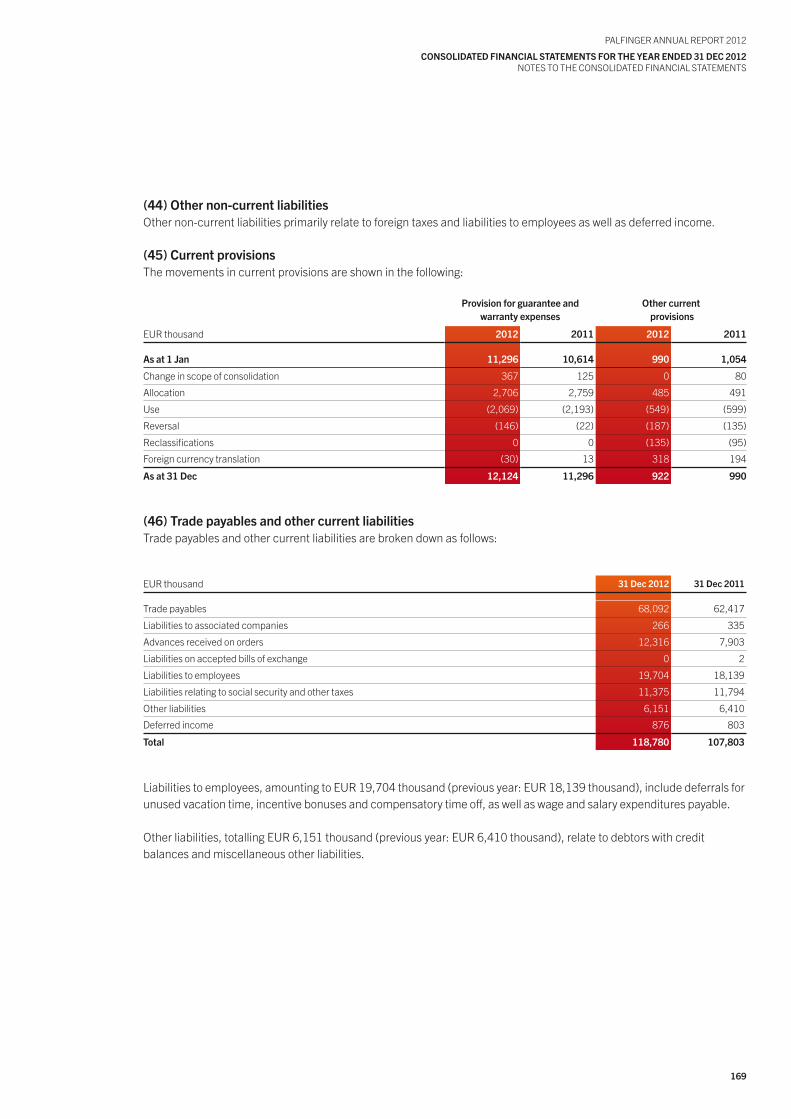
169
PALFINGER ANNuAL REPoRt 2012
coNsoLIdAtEd FINANcIAL stAtEMENts FoR thE yEAR ENdEd 31 dEc 2012NotES to tHE CoNSoLIDAtED FINANCIAL StAtEMENtS
(44) other non-current liabilitiesother non-current liabilities primarily relate to foreign taxes and liabilities to employees as well as deferred income.
(45) current provisionsthe movements in current provisions are shown in the following:
Provision for guarantee andwarranty expenses
other current provisions
EuR thousand 2012 2011 2012 2011
As at 1 Jan 11,296 10,614 990 1,054
Change in scope of consolidation 367 125 0 80
Allocation 2,706 2,759 485 491
use (2,069) (2,193) (549) (599)
Reversal (146) (22) (187) (135)
Reclassifications 0 0 (135) (95)
Foreign currency translation (30) 13 318 194
As at 31 dec 12,124 11,296 922 990
(46) trade payables and other current liabilitiestrade payables and other current liabilities are broken down as follows:
EuR thousand 31 dec 2012 31 dec 2011
trade payables 68,092 62,417
Liabilities to associated companies 266 335
Advances received on orders 12,316 7,903
Liabilities on accepted bills of exchange 0 2
Liabilities to employees 19,704 18,139
Liabilities relating to social security and other taxes 11,375 11,794
other liabilities 6,151 6,410
Deferred income 876 803
total 118,780 107,803
Liabilities to employees, amounting to EuR 19,704 thousand (previous year: EuR 18,139 thousand), include deferrals for unused vacation time, incentive bonuses and compensatory time off, as well as wage and salary expenditures payable.
other liabilities, totalling EuR 6,151 thousand (previous year: EuR 6,410 thousand), relate to debtors with creditbalances and miscellaneous other liabilities.
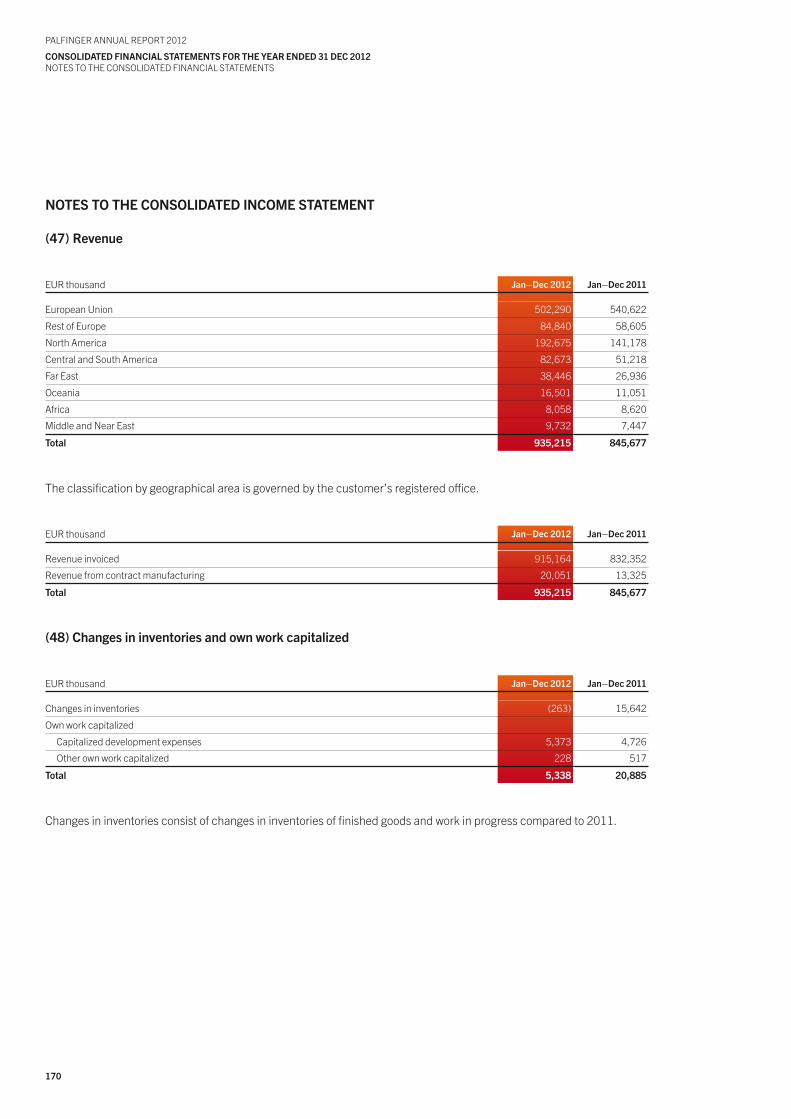
170
PALFINGER ANNuAL REPoRt 2012
coNsoLIdAtEd FINANcIAL stAtEMENts FoR thE yEAR ENdEd 31 dEc 2012NotES to tHE CoNSoLIDAtED FINANCIAL StAtEMENtS
NotEs to thE coNsoLIdAtEd INcoME stAtEMENt
(47) Revenue
EuR thousand Jan–dec 2012 Jan–dec 2011
European union 502,290 540,622
Rest of Europe 84,840 58,605
North America 192,675 141,178
Central and South America 82,673 51,218
Far East 38,446 26,936
oceania 16,501 11,051
Africa 8,058 8,620
Middle and Near East 9,732 7,447
total 935,215 845,677
the classification by geographical area is governed by the customer’s registered office.
EuR thousand Jan–dec 2012 Jan–dec 2011
Revenue invoiced 915,164 832,352
Revenue from contract manufacturing 20,051 13,325
total 935,215 845,677
(48) changes in inventories and own work capitalized
EuR thousand Jan–dec 2012 Jan–dec 2011
Changes in inventories (263) 15,642
own work capitalized
Capitalized development expenses 5,373 4,726
other own work capitalized 228 517
total 5,338 20,885
Changes in inventories consist of changes in inventories of finished goods and work in progress compared to 2011.
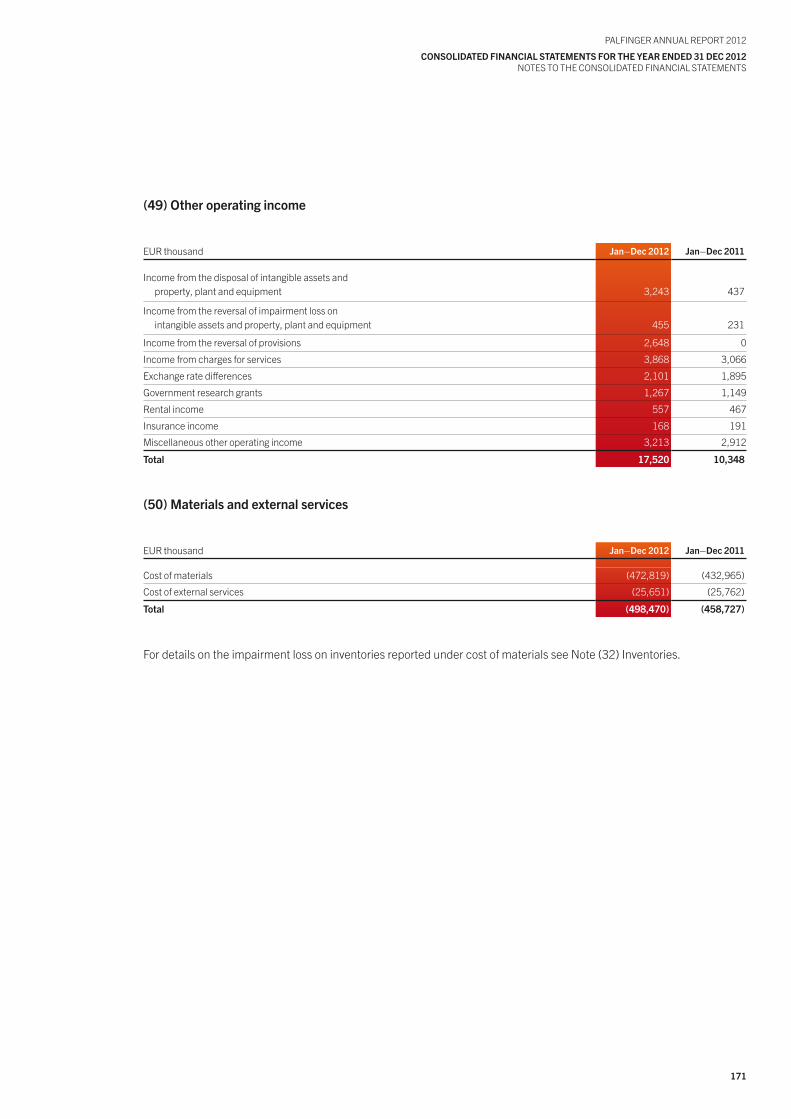
171
PALFINGER ANNuAL REPoRt 2012
coNsoLIdAtEd FINANcIAL stAtEMENts FoR thE yEAR ENdEd 31 dEc 2012NotES to tHE CoNSoLIDAtED FINANCIAL StAtEMENtS
(49) other operating income
EuR thousand Jan–dec 2012 Jan–dec 2011
Income from the disposal of intangible assets andproperty, plant and equipment 3,243 437
Income from the reversal of impairment loss onintangible assets and property, plant and equipment 455 231
Income from the reversal of provisions 2,648 0
Income from charges for services 3,868 3,066
Exchange rate differences 2,101 1,895
Government research grants 1,267 1,149
Rental income 557 467
Insurance income 168 191
Miscellaneous other operating income 3,213 2,912
total 17,520 10,348
(50) Materials and external services
EuR thousand Jan–dec 2012 Jan–dec 2011
Cost of materials (472,819) (432,965)
Cost of external services (25,651) (25,762)
total (498,470) (458,727)
For details on the impairment loss on inventories reported under cost of materials see Note (32) Inventories.
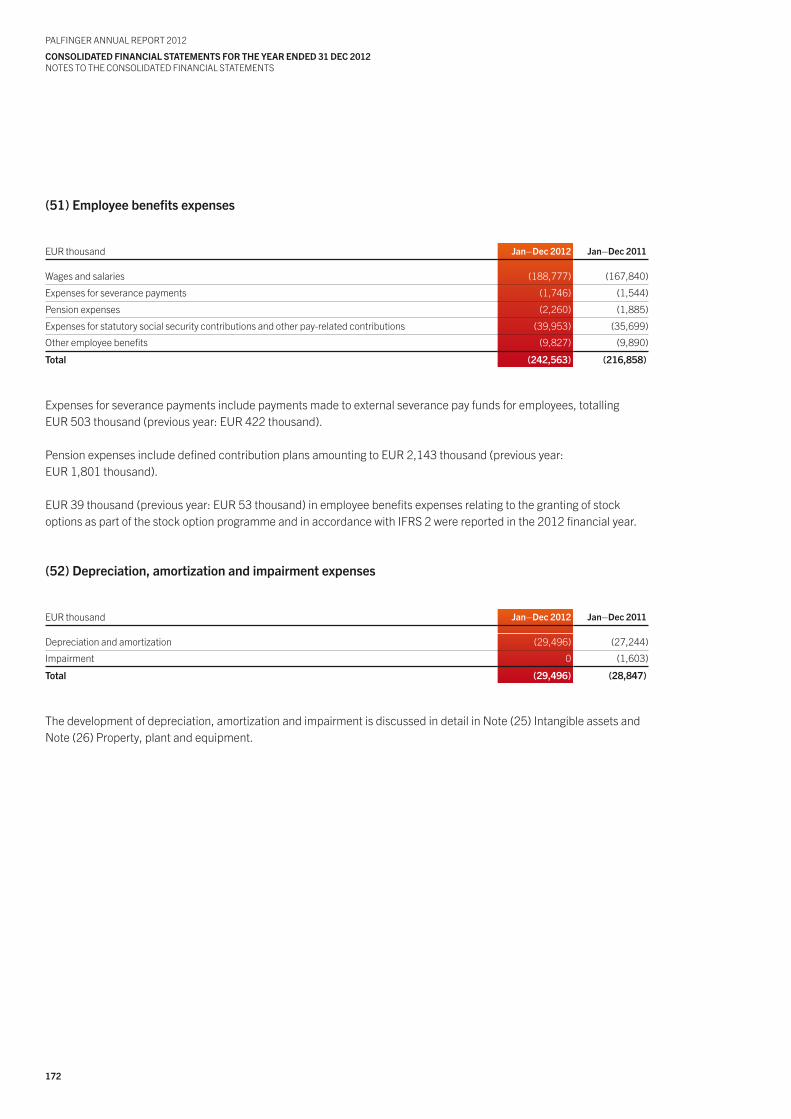
172
PALFINGER ANNuAL REPoRt 2012
coNsoLIdAtEd FINANcIAL stAtEMENts FoR thE yEAR ENdEd 31 dEc 2012NotES to tHE CoNSoLIDAtED FINANCIAL StAtEMENtS
(51) Employee benefits expenses
EuR thousand Jan–dec 2012 Jan–dec 2011
Wages and salaries (188,777) (167,840)
Expenses for severance payments (1,746) (1,544)
Pension expenses (2,260) (1,885)
Expenses for statutory social security contributions and other pay-related contributions (39,953) (35,699)
other employee benefits (9,827) (9,890)
total (242,563) (216,858)
Expenses for severance payments include payments made to external severance pay funds for employees, totalling EuR 503 thousand (previous year: EuR 422 thousand).
Pension expenses include defined contribution plans amounting to EuR 2,143 thousand (previous year:EuR 1,801 thousand).
EuR 39 thousand (previous year: EuR 53 thousand) in employee benefits expenses relating to the granting of stock options as part of the stock option programme and in accordance with IFRS 2 were reported in the 2012 financial year.
(52) depreciation, amortization and impairment expenses
EuR thousand Jan–dec 2012 Jan–dec 2011
Depreciation and amortization (29,496) (27,244)
Impairment 0 (1,603)
total (29,496) (28,847)
the development of depreciation, amortization and impairment is discussed in detail in Note (25) Intangible assets and Note (26) Property, plant and equipment.
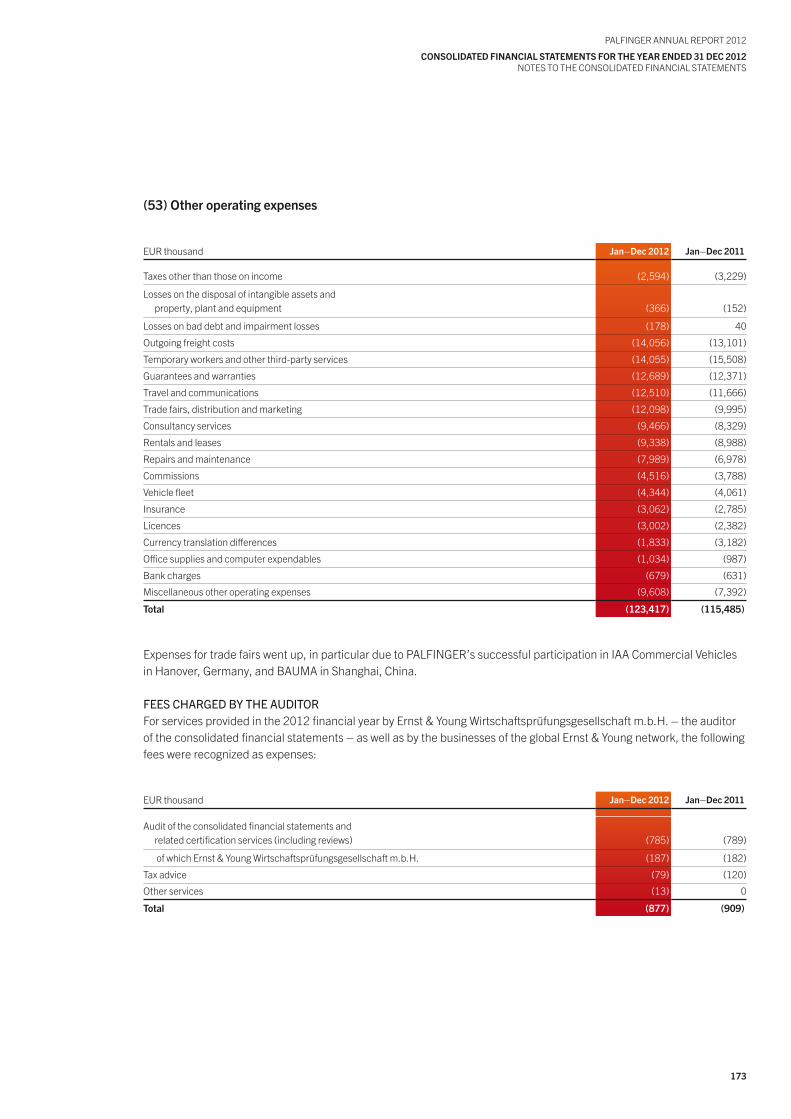
173
PALFINGER ANNuAL REPoRt 2012
coNsoLIdAtEd FINANcIAL stAtEMENts FoR thE yEAR ENdEd 31 dEc 2012NotES to tHE CoNSoLIDAtED FINANCIAL StAtEMENtS
(53) other operating expenses
EuR thousand Jan–dec 2012 Jan–dec 2011
taxes other than those on income (2,594) (3,229)
Losses on the disposal of intangible assets andproperty, plant and equipment (366) (152)
Losses on bad debt and impairment losses (178) 40
outgoing freight costs (14,056) (13,101)
temporary workers and other third-party services (14,055) (15,508)
Guarantees and warranties (12,689) (12,371)
travel and communications (12,510) (11,666)
trade fairs, distribution and marketing (12,098) (9,995)
Consultancy services (9,466) (8,329)
Rentals and leases (9,338) (8,988)
Repairs and maintenance (7,989) (6,978)
Commissions (4,516) (3,788)
Vehicle fleet (4,344) (4,061)
Insurance (3,062) (2,785)
Licences (3,002) (2,382)
Currency translation differences (1,833) (3,182)
office supplies and computer expendables (1,034) (987)
Bank charges (679) (631)
Miscellaneous other operating expenses (9,608) (7,392)
total (123,417) (115,485)
Expenses for trade fairs went up, in particular due to PALFINGER’s successful participation in IAA Commercial Vehicles in Hanover, Germany, and BAuMA in Shanghai, China.
FEESCHARGEDByTHEAUDITORFor services provided in the 2012 financial year by Ernst & young Wirtschaftsprüfungsgesellschaft m.b.H. – the auditor of the consolidated financial statements – as well as by the businesses of the global Ernst & young network, the following fees were recognized as expenses:
EuR thousand Jan–dec 2012 Jan–dec 2011
Audit of the consolidated financial statements andrelated certification services (including reviews) (785) (789)
of which Ernst & young Wirtschaftsprüfungsgesellschaft m.b.H. (187) (182)
tax advice (79) (120)
other services (13) 0
total (877) (909)
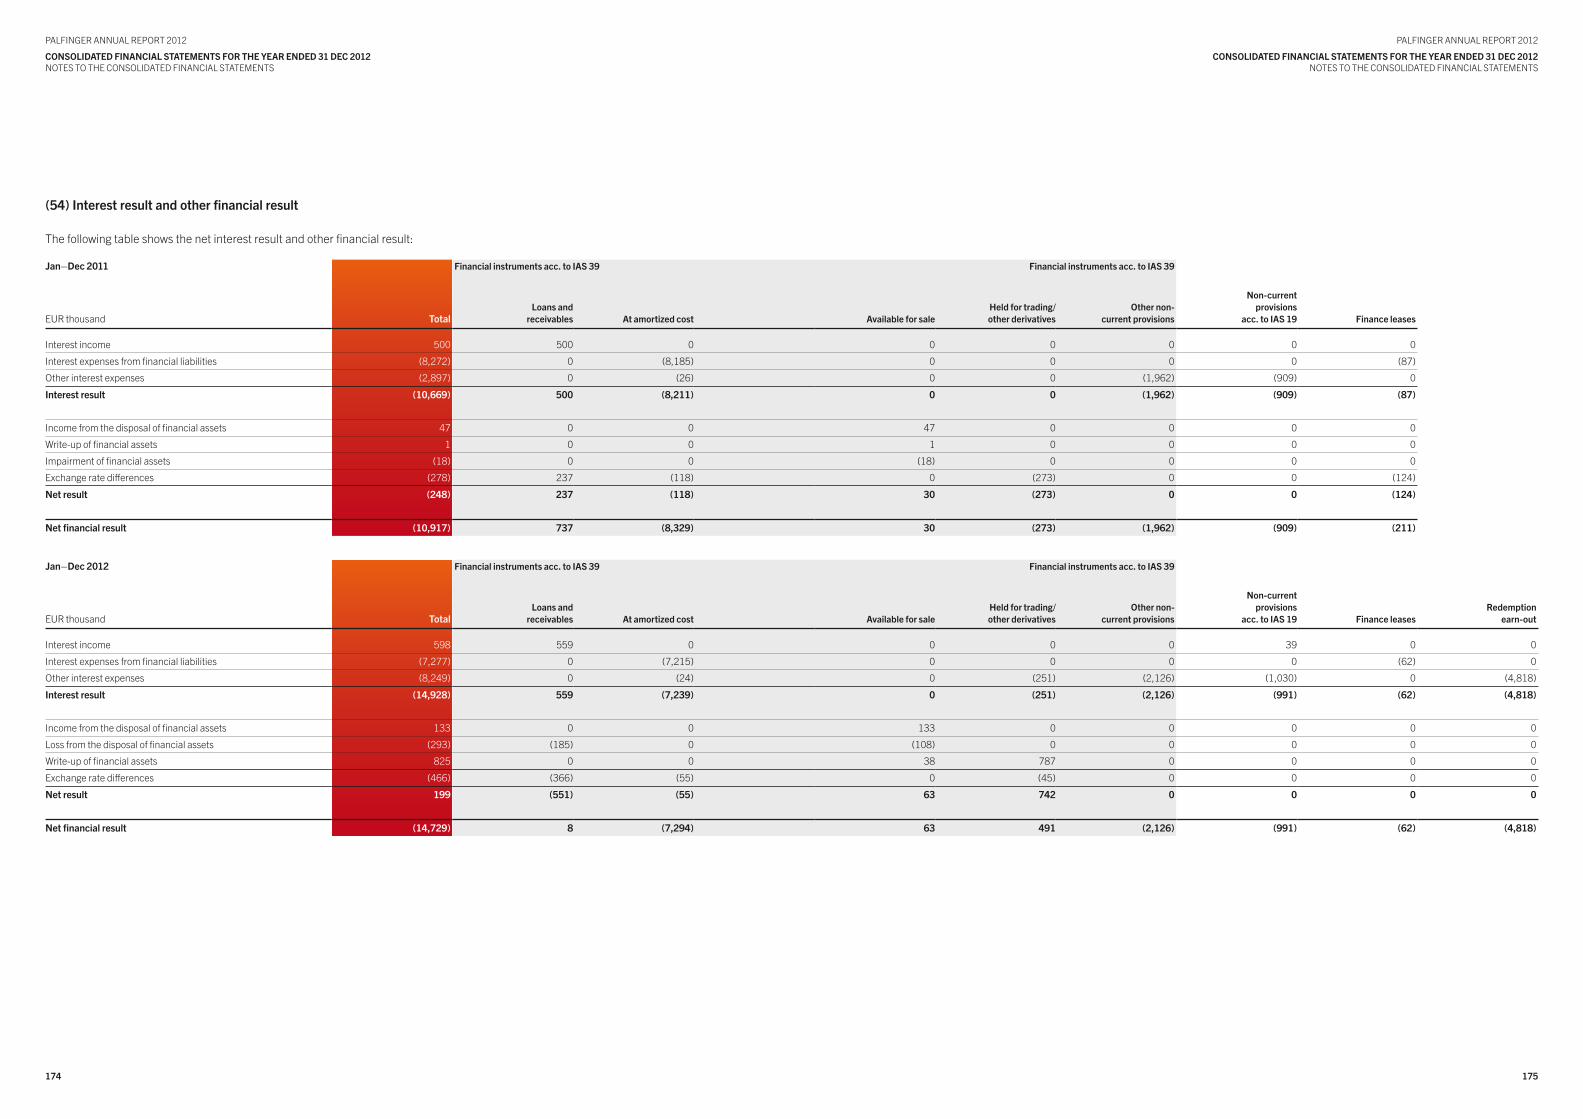
175174
PALFINGER ANNuAL REPoRt 2012
coNsoLIdAtEd FINANcIAL stAtEMENts FoR thE yEAR ENdEd 31 dEc 2012NotES to tHE CoNSoLIDAtED FINANCIAL StAtEMENtS
PALFINGER ANNuAL REPoRt 2012
coNsoLIdAtEd FINANcIAL stAtEMENts FoR thE yEAR ENdEd 31 dEc 2012NotES to tHE CoNSoLIDAtED FINANCIAL StAtEMENtS
(54) Interest result and other financial result
the following table shows the net interest result and other financial result:
Jan–dec 2011 Financial instruments acc. to IAs 39 Financial instruments acc. to IAs 39
EuR thousand totalLoans and
receivables At amortized cost Available for saleheld for trading/other derivatives
other non-current provisions
Non-currentprovisions
acc. to IAs 19 Finance leases
Interest income 500 500 0 0 0 0 0 0
Interest expenses from financial liabilities (8,272) 0 (8,185) 0 0 0 0 (87)
other interest expenses (2,897) 0 (26) 0 0 (1,962) (909) 0
Interest result (10,669) 500 (8,211) 0 0 (1,962) (909) (87)
Income from the disposal of financial assets 47 0 0 47 0 0 0 0
Write-up of financial assets 1 0 0 1 0 0 0 0
Impairment of financial assets (18) 0 0 (18) 0 0 0 0
Exchange rate differences (278) 237 (118) 0 (273) 0 0 (124)
Net result (248) 237 (118) 30 (273) 0 0 (124)
Net financial result (10,917) 737 (8,329) 30 (273) (1,962) (909) (211)
Jan–dec 2012 Financial instruments acc. to IAs 39 Financial instruments acc. to IAs 39
EuR thousand totalLoans and
receivables At amortized cost Available for saleheld for trading/other derivatives
other non-current provisions
Non-currentprovisions
acc. to IAs 19 Finance leasesRedemption
earn-out
Interest income 598 559 0 0 0 0 39 0 0
Interest expenses from financial liabilities (7,277) 0 (7,215) 0 0 0 0 (62) 0
other interest expenses (8,249) 0 (24) 0 (251) (2,126) (1,030) 0 (4,818)
Interest result (14,928) 559 (7,239) 0 (251) (2,126) (991) (62) (4,818)
Income from the disposal of financial assets 133 0 0 133 0 0 0 0 0
Loss from the disposal of financial assets (293) (185) 0 (108) 0 0 0 0 0
Write-up of financial assets 825 0 0 38 787 0 0 0 0
Exchange rate differences (466) (366) (55) 0 (45) 0 0 0 0
Net result 199 (551) (55) 63 742 0 0 0 0
Net financial result (14,729) 8 (7,294) 63 491 (2,126) (991) (62) (4,818)
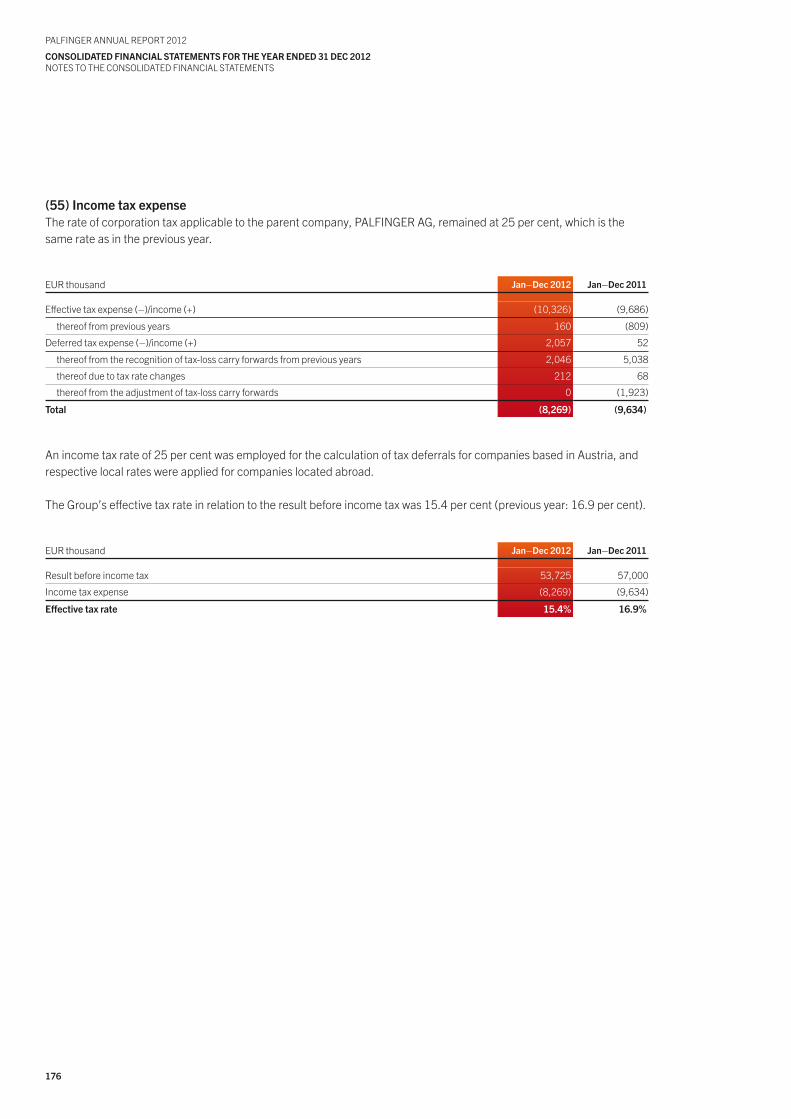
176
PALFINGER ANNuAL REPoRt 2012
coNsoLIdAtEd FINANcIAL stAtEMENts FoR thE yEAR ENdEd 31 dEc 2012NotES to tHE CoNSoLIDAtED FINANCIAL StAtEMENtS
(55) Income tax expensethe rate of corporation tax applicable to the parent company, PALFINGER AG, remained at 25 per cent, which is the same rate as in the previous year.
EuR thousand Jan–dec 2012 Jan–dec 2011
Effective tax expense (–)/income (+) (10,326) (9,686)
thereof from previous years 160 (809)
Deferred tax expense (–)/income (+) 2,057 52
thereof from the recognition of tax-loss carry forwards from previous years 2,046 5,038
thereof due to tax rate changes 212 68
thereof from the adjustment of tax-loss carry forwards 0 (1,923)
total (8,269) (9,634)
An income tax rate of 25 per cent was employed for the calculation of tax deferrals for companies based in Austria, and respective local rates were applied for companies located abroad.
the Group’s effective tax rate in relation to the result before income tax was 15.4 per cent (previous year: 16.9 per cent).
EuR thousand Jan–dec 2012 Jan–dec 2011
Result before income tax 53,725 57,000
Income tax expense (8,269) (9,634)
Effective tax rate 15.4% 16.9%
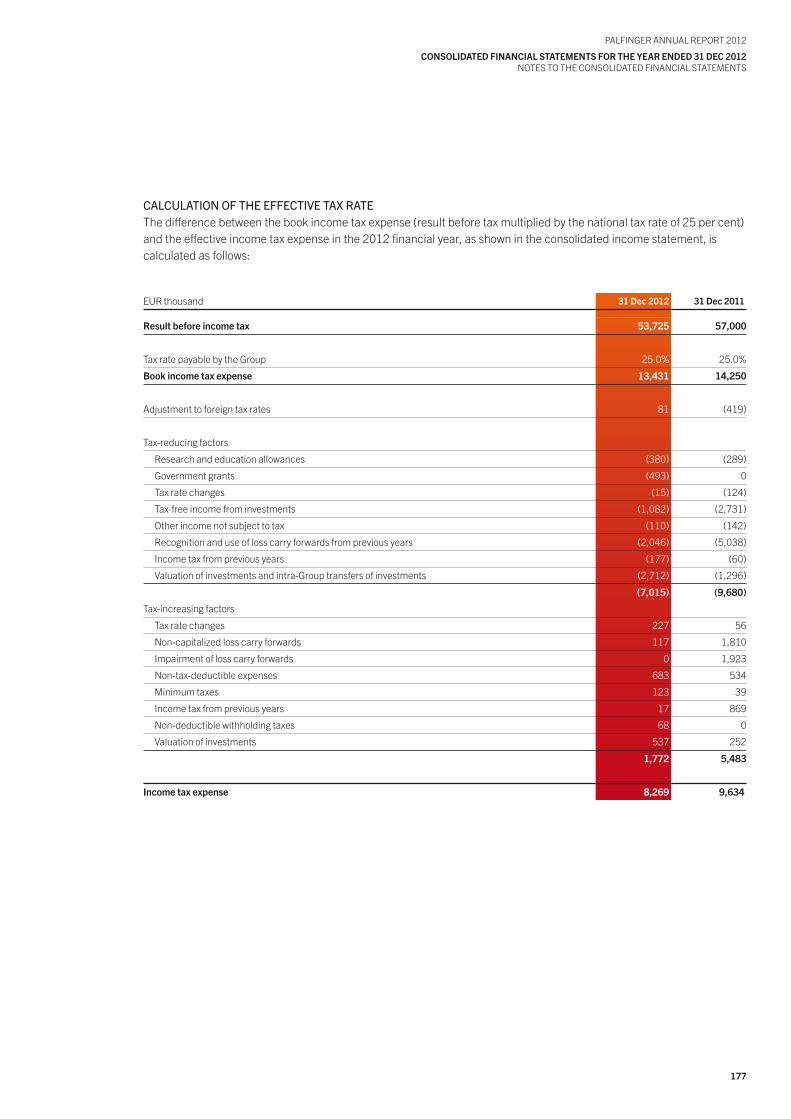
177
PALFINGER ANNuAL REPoRt 2012
coNsoLIdAtEd FINANcIAL stAtEMENts FoR thE yEAR ENdEd 31 dEc 2012NotES to tHE CoNSoLIDAtED FINANCIAL StAtEMENtS
CALCULATIONOFTHEEFFECTIvETAxRATEthe difference between the book income tax expense (result before tax multiplied by the national tax rate of 25 per cent) and the effective income tax expense in the 2012 financial year, as shown in the consolidated income statement, iscalculated as follows:
EuR thousand 31 dec 2012 31 dec 2011
Result before income tax 53,725 57,000
tax rate payable by the Group 25.0% 25.0%
Book income tax expense 13,431 14,250
Adjustment to foreign tax rates 81 (419)
tax-reducing factors
Research and education allowances (380) (289)
Government grants (493) 0
tax rate changes (15) (124)
tax-free income from investments (1,082) (2,731)
other income not subject to tax (110) (142)
Recognition and use of loss carry forwards from previous years (2,046) (5,038)
Income tax from previous years (177) (60)
Valuation of investments and intra-Group transfers of investments (2,712) (1,296)
(7,015) (9,680)
tax-increasing factors
tax rate changes 227 56
Non-capitalized loss carry forwards 117 1,810
Impairment of loss carry forwards 0 1,923
Non-tax-deductible expenses 683 534
Minimum taxes 123 39
Income tax from previous years 17 869
Non-deductible withholding taxes 68 0
Valuation of investments 537 252
1,772 5,483
Income tax expense 8,269 9,634
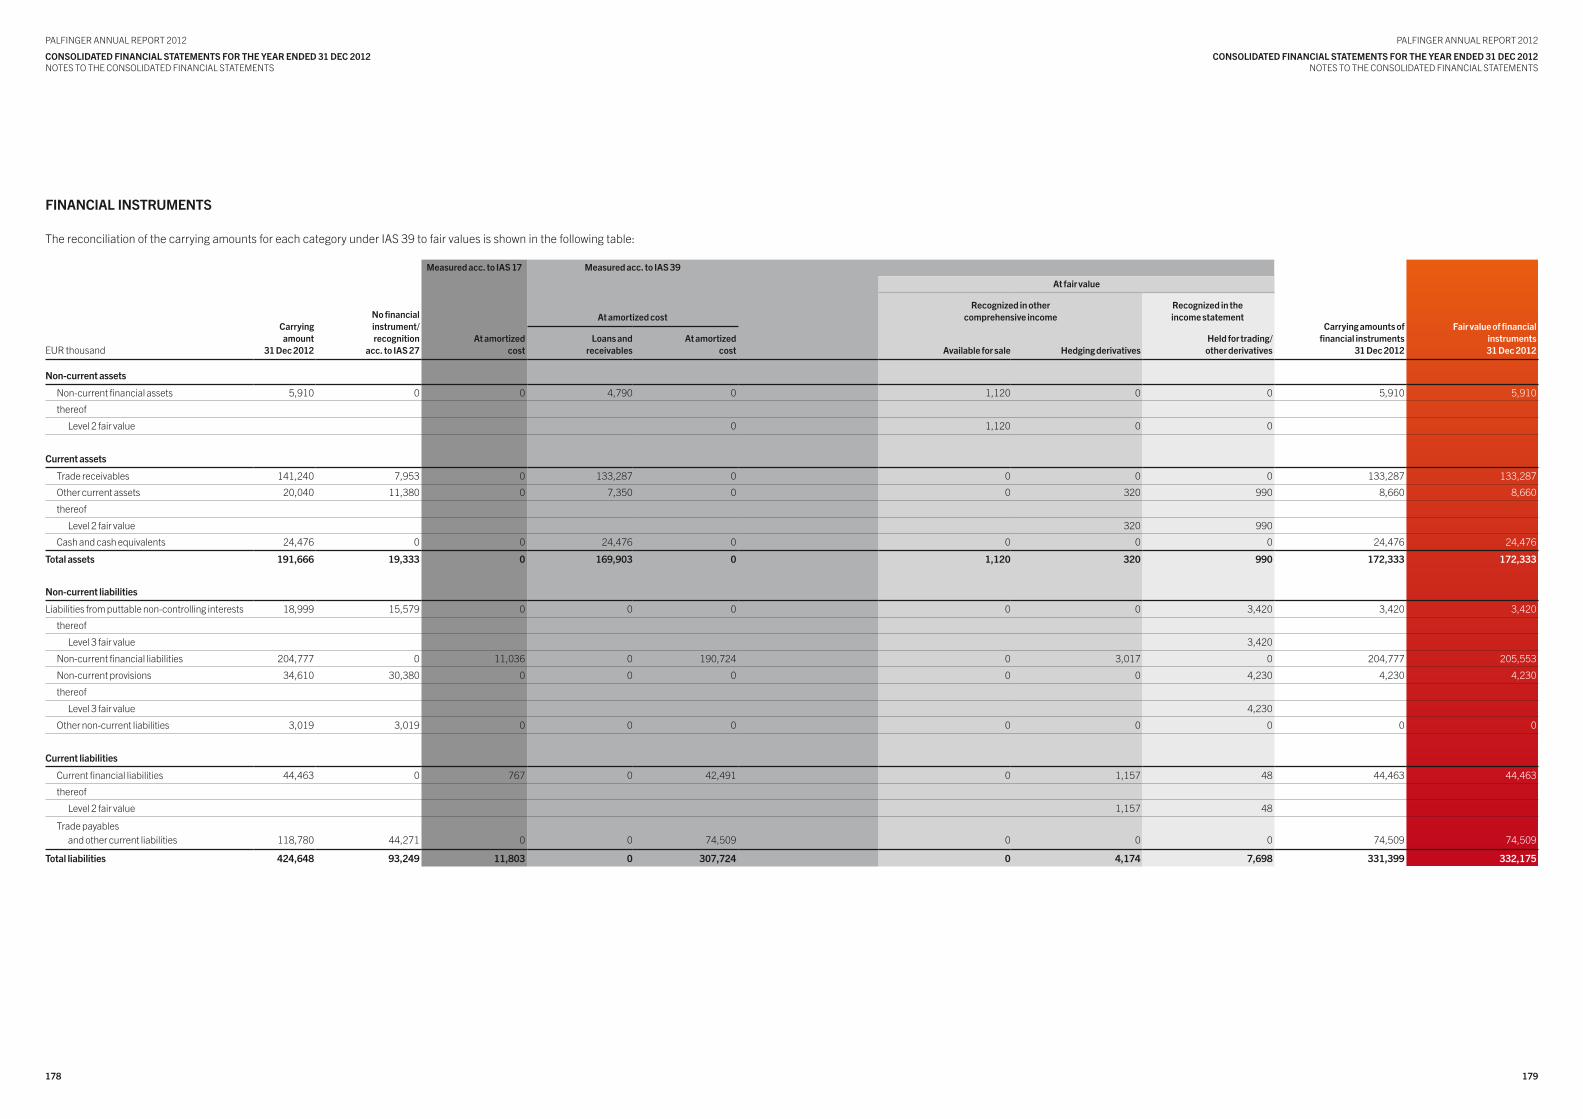
179178
PALFINGER ANNuAL REPoRt 2012
coNsoLIdAtEd FINANcIAL stAtEMENts FoR thE yEAR ENdEd 31 dEc 2012NotES to tHE CoNSoLIDAtED FINANCIAL StAtEMENtS
PALFINGER ANNuAL REPoRt 2012
coNsoLIdAtEd FINANcIAL stAtEMENts FoR thE yEAR ENdEd 31 dEc 2012NotES to tHE CoNSoLIDAtED FINANCIAL StAtEMENtS
FINANcIAL INstRuMENts
the reconciliation of the carrying amounts for each category under IAS 39 to fair values is shown in the following table:
Measured acc. to IAs 17 Measured acc. to IAs 39
At fair value
carrying amount
31 dec 2012
No financialinstrument/recognition
acc. to IAs 27
At amortized costRecognized in other
comprehensive incomeRecognized in theincome statement
carrying amounts offinancial instruments
31 dec 2012
Fair value of financialinstruments31 dec 2012EuR thousand
At amortizedcost
Loans andreceivables
At amortizedcost Available for sale hedging derivatives
held for trading/other derivatives
Non-current assets
Non-current financial assets 5,910 0 0 4,790 0 1,120 0 0 5,910 5,910
thereof
Level 2 fair value 0 1,120 0 0
current assets
trade receivables 141,240 7,953 0 133,287 0 0 0 0 133,287 133,287
other current assets 20,040 11,380 0 7,350 0 0 320 990 8,660 8,660
thereof
Level 2 fair value 320 990
Cash and cash equivalents 24,476 0 0 24,476 0 0 0 0 24,476 24,476
total assets 191,666 19,333 0 169,903 0 1,120 320 990 172,333 172,333
Non-current liabilities
Liabilities from puttable non-controlling interests 18,999 15,579 0 0 0 0 0 3,420 3,420 3,420
thereof
Level 3 fair value 3,420
Non-current financial liabilities 204,777 0 11,036 0 190,724 0 3,017 0 204,777 205,553
Non-current provisions 34,610 30,380 0 0 0 0 0 4,230 4,230 4,230
thereof
Level 3 fair value 4,230
other non-current liabilities 3,019 3,019 0 0 0 0 0 0 0 0
current liabilities
Current financial liabilities 44,463 0 767 0 42,491 0 1,157 48 44,463 44,463
thereof
Level 2 fair value 1,157 48
trade payablesand other current liabilities 118,780 44,271 0 0 74,509 0 0 0 74,509 74,509
total liabilities 424,648 93,249 11,803 0 307,724 0 4,174 7,698 331,399 332,175
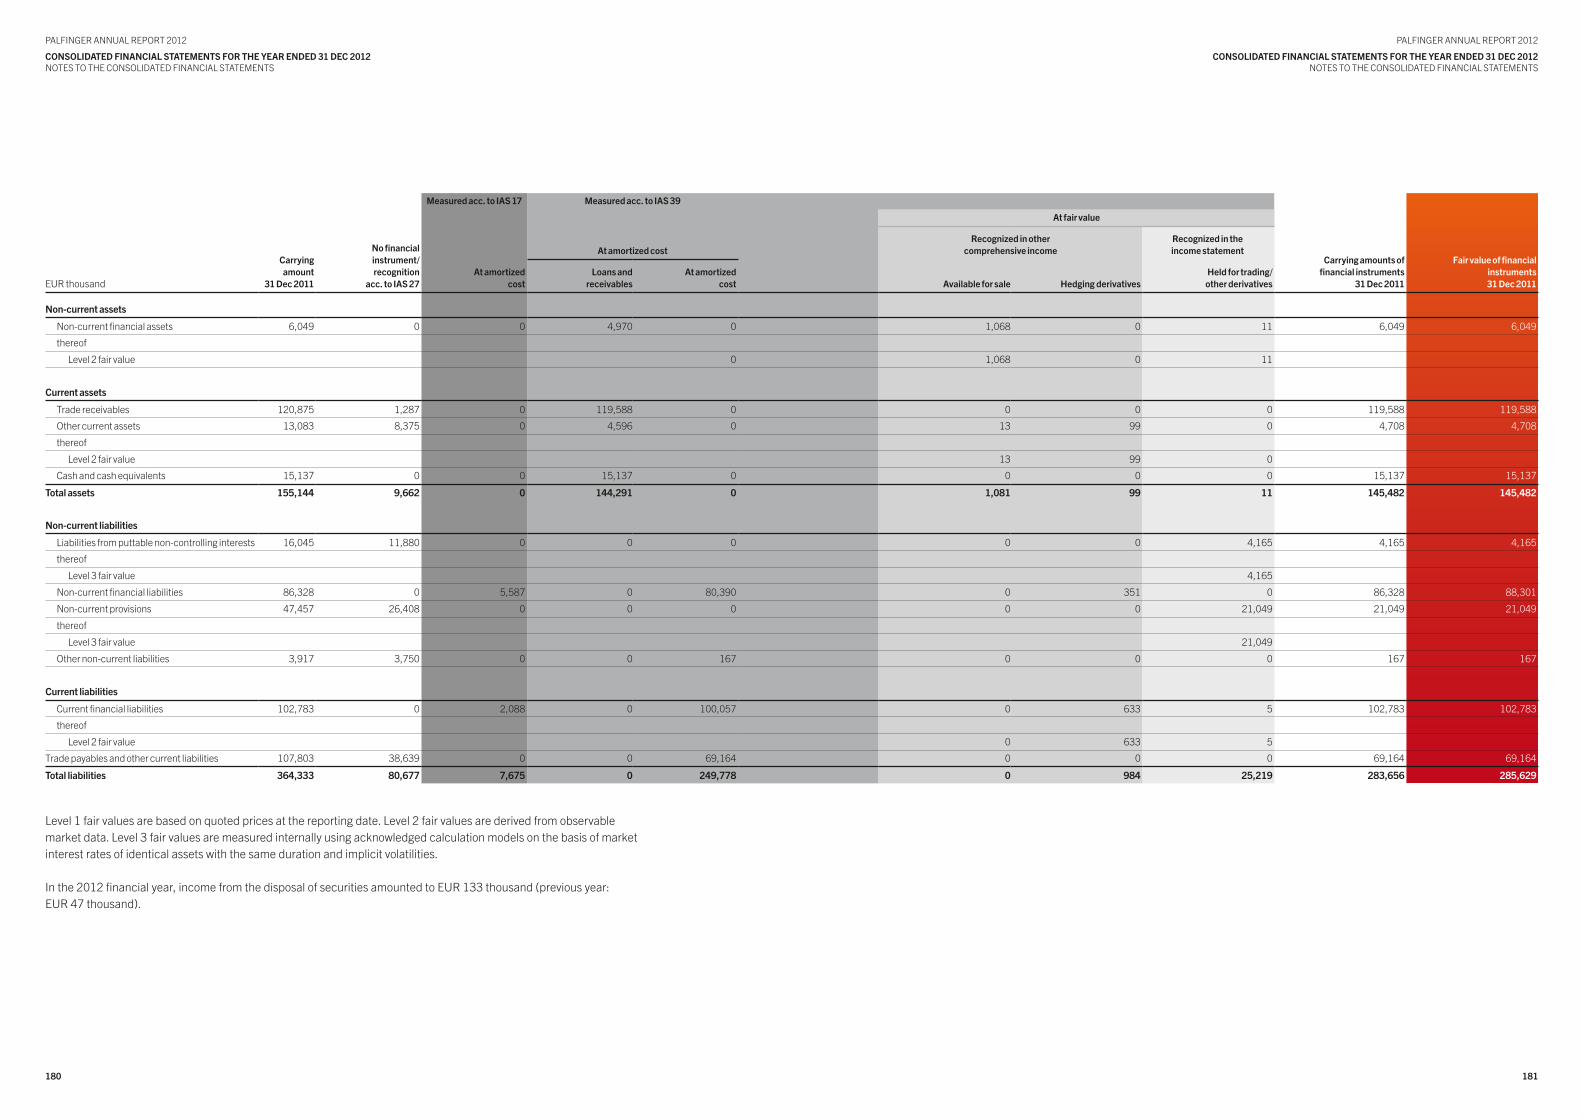
181180
PALFINGER ANNuAL REPoRt 2012
coNsoLIdAtEd FINANcIAL stAtEMENts FoR thE yEAR ENdEd 31 dEc 2012NotES to tHE CoNSoLIDAtED FINANCIAL StAtEMENtS
PALFINGER ANNuAL REPoRt 2012
coNsoLIdAtEd FINANcIAL stAtEMENts FoR thE yEAR ENdEd 31 dEc 2012NotES to tHE CoNSoLIDAtED FINANCIAL StAtEMENtS
Measured acc. to IAs 17 Measured acc. to IAs 39
At fair value
carrying amount
31 dec 2011
No financialinstrument/recognition
acc. to IAs 27
At amortized costRecognized in other
comprehensive incomeRecognized in theincome statement
carrying amounts offinancial instruments
31 dec 2011
Fair value of financialinstruments31 dec 2011EuR thousand
At amortizedcost
Loans andreceivables
At amortizedcost Available for sale hedging derivatives
held for trading/other derivatives
Non-current assets
Non-current financial assets 6,049 0 0 4,970 0 1,068 0 11 6,049 6,049
thereof
Level 2 fair value 0 1,068 0 11
current assets
trade receivables 120,875 1,287 0 119,588 0 0 0 0 119,588 119,588
other current assets 13,083 8,375 0 4,596 0 13 99 0 4,708 4,708
thereof
Level 2 fair value 13 99 0
Cash and cash equivalents 15,137 0 0 15,137 0 0 0 0 15,137 15,137
total assets 155,144 9,662 0 144,291 0 1,081 99 11 145,482 145,482
Non-current liabilities
Liabilities from puttable non-controlling interests 16,045 11,880 0 0 0 0 0 4,165 4,165 4,165
thereof
Level 3 fair value 4,165
Non-current financial liabilities 86,328 0 5,587 0 80,390 0 351 0 86,328 88,301
Non-current provisions 47,457 26,408 0 0 0 0 0 21,049 21,049 21,049
thereof
Level 3 fair value 21,049
other non-current liabilities 3,917 3,750 0 0 167 0 0 0 167 167
current liabilities
Current financial liabilities 102,783 0 2,088 0 100,057 0 633 5 102,783 102,783
thereof
Level 2 fair value 0 633 5
trade payables and other current liabilities 107,803 38,639 0 0 69,164 0 0 0 69,164 69,164
total liabilities 364,333 80,677 7,675 0 249,778 0 984 25,219 283,656 285,629
Level 1 fair values are based on quoted prices at the reporting date. Level 2 fair values are derived from observable market data. Level 3 fair values are measured internally using acknowledged calculation models on the basis of market interest rates of identical assets with the same duration and implicit volatilities.
In the 2012 financial year, income from the disposal of securities amounted to EuR 133 thousand (previous year:EuR 47 thousand).
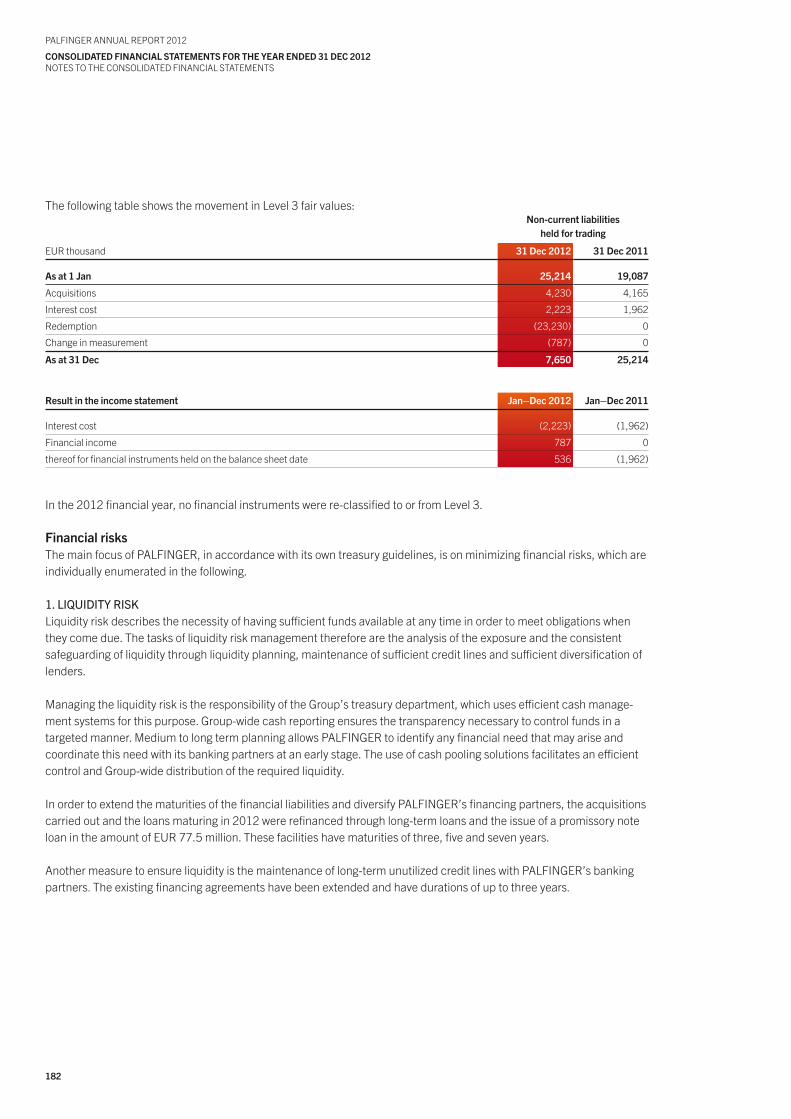
182
PALFINGER ANNuAL REPoRt 2012
coNsoLIdAtEd FINANcIAL stAtEMENts FoR thE yEAR ENdEd 31 dEc 2012NotES to tHE CoNSoLIDAtED FINANCIAL StAtEMENtS
the following table shows the movement in Level 3 fair values:Non-current liabilities
held for trading
EuR thousand 31 dec 2012 31 dec 2011
As at 1 Jan 25,214 19,087
Acquisitions 4,230 4,165
Interest cost 2,223 1,962
Redemption (23,230) 0
Change in measurement (787) 0
As at 31 dec 7,650 25,214
Result in the income statement Jan–dec 2012 Jan–dec 2011
Interest cost (2,223) (1,962)
Financial income 787 0
thereof for financial instruments held on the balance sheet date 536 (1,962)
In the 2012 financial year, no financial instruments were re-classified to or from Level 3.
Financial risksthe main focus of PALFINGER, in accordance with its own treasury guidelines, is on minimizing financial risks, which are individually enumerated in the following.
1.LIQUIDITyRISkLiquidity risk describes the necessity of having sufficient funds available at any time in order to meet obligations when they come due. the tasks of liquidity risk management therefore are the analysis of the exposure and the consistent safeguarding of liquidity through liquidity planning, maintenance of sufficient credit lines and sufficient diversification of lenders.
Managing the liquidity risk is the responsibility of the Group’s treasury department, which uses efficient cash manage-ment systems for this purpose. Group-wide cash reporting ensures the transparency necessary to control funds in a targeted manner. Medium to long term planning allows PALFINGER to identify any financial need that may arise and coordinate this need with its banking partners at an early stage. the use of cash pooling solutions facilitates an efficient control and Group-wide distribution of the required liquidity.
In order to extend the maturities of the financial liabilities and diversify PALFINGER’s financing partners, the acquisitions carried out and the loans maturing in 2012 were refinanced through long-term loans and the issue of a promissory note loan in the amount of EuR 77.5 million. these facilities have maturities of three, five and seven years.
Another measure to ensure liquidity is the maintenance of long-term unutilized credit lines with PALFINGER’s banking partners. the existing financing agreements have been extended and have durations of up to three years.
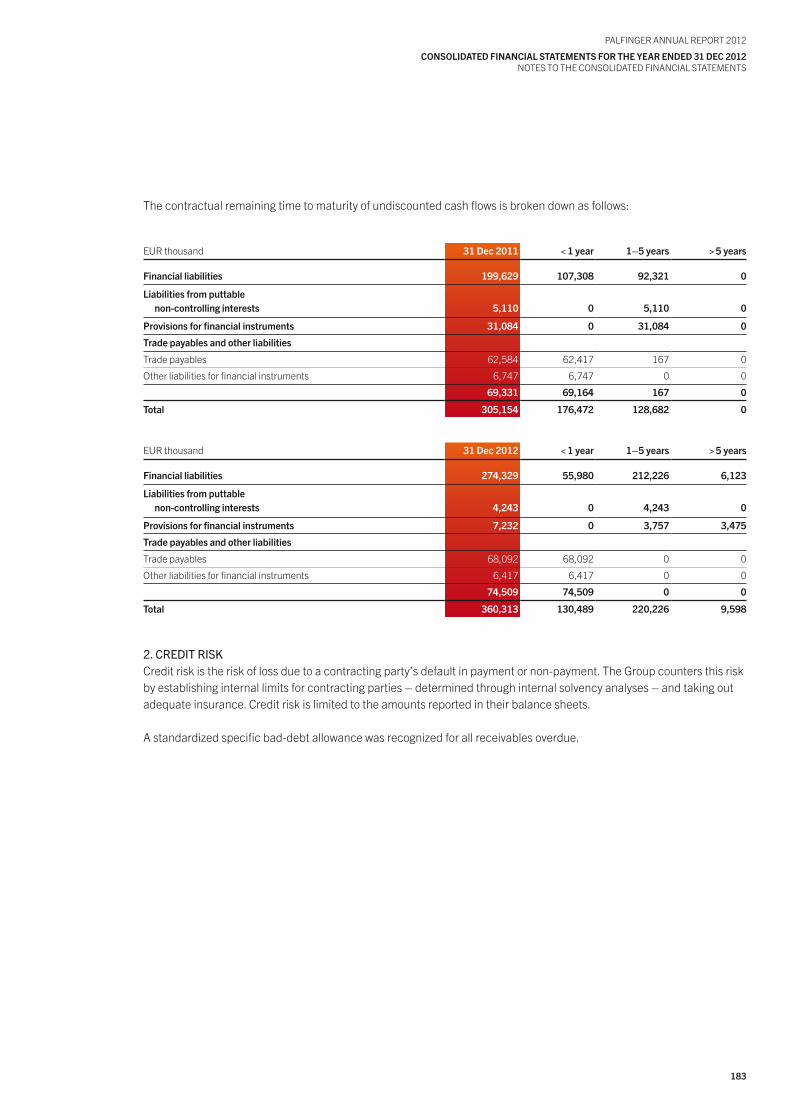
183
PALFINGER ANNuAL REPoRt 2012
coNsoLIdAtEd FINANcIAL stAtEMENts FoR thE yEAR ENdEd 31 dEc 2012NotES to tHE CoNSoLIDAtED FINANCIAL StAtEMENtS
the contractual remaining time to maturity of undiscounted cash flows is broken down as follows:
EuR thousand 31 dec 2011 < 1 year 1–5 years > 5 years
Financial liabilities 199,629 107,308 92,321 0
Liabilities from puttablenon-controlling interests 5,110 0 5,110 0
Provisions for financial instruments 31,084 0 31,084 0
trade payables and other liabilities
trade payables 62,584 62,417 167 0
other liabilities for financial instruments 6,747 6,747 0 0
69,331 69,164 167 0
total 305,154 176,472 128,682 0
EuR thousand 31 dec 2012 < 1 year 1–5 years > 5 years
Financial liabilities 274,329 55,980 212,226 6,123
Liabilities from puttablenon-controlling interests 4,243 0 4,243 0
Provisions for financial instruments 7,232 0 3,757 3,475
trade payables and other liabilities
trade payables 68,092 68,092 0 0
other liabilities for financial instruments 6,417 6,417 0 0
74,509 74,509 0 0
total 360,313 130,489 220,226 9,598
2.CREDITRISkCredit risk is the risk of loss due to a contracting party’s default in payment or non-payment. the Group counters this risk by establishing internal limits for contracting parties – determined through internal solvency analyses – and taking out adequate insurance. Credit risk is limited to the amounts reported in their balance sheets.
A standardized specific bad-debt allowance was recognized for all receivables overdue.
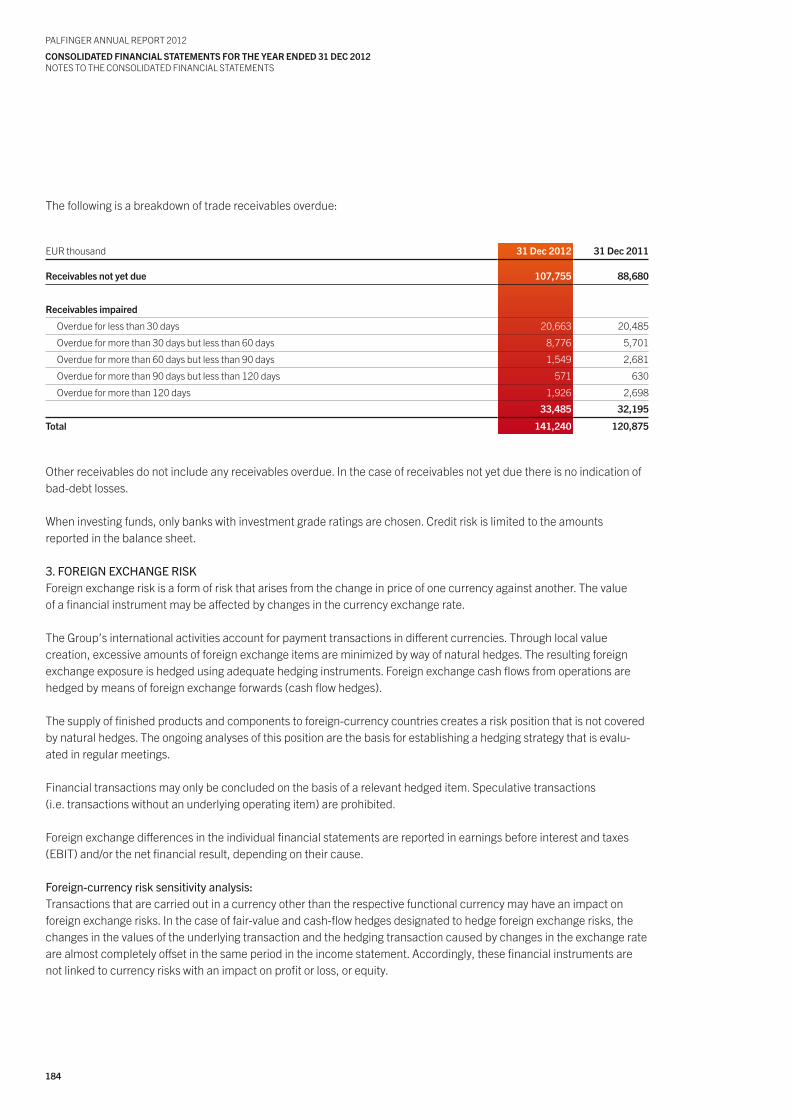
184
PALFINGER ANNuAL REPoRt 2012
coNsoLIdAtEd FINANcIAL stAtEMENts FoR thE yEAR ENdEd 31 dEc 2012NotES to tHE CoNSoLIDAtED FINANCIAL StAtEMENtS
the following is a breakdown of trade receivables overdue:
EuR thousand 31 dec 2012 31 dec 2011
Receivables not yet due 107,755 88,680
Receivables impaired
overdue for less than 30 days 20,663 20,485
overdue for more than 30 days but less than 60 days 8,776 5,701
overdue for more than 60 days but less than 90 days 1,549 2,681
overdue for more than 90 days but less than 120 days 571 630
overdue for more than 120 days 1,926 2,698
33,485 32,195
total 141,240 120,875
other receivables do not include any receivables overdue. In the case of receivables not yet due there is no indication of bad-debt losses.
When investing funds, only banks with investment grade ratings are chosen. Credit risk is limited to the amountsreported in the balance sheet.
3.FOREIGNExCHANGERISkForeign exchange risk is a form of risk that arises from the change in price of one currency against another. the valueof a financial instrument may be affected by changes in the currency exchange rate.
the Group’s international activities account for payment transactions in different currencies. through local value creation, excessive amounts of foreign exchange items are minimized by way of natural hedges. the resulting foreign exchange exposure is hedged using adequate hedging instruments. Foreign exchange cash flows from operations are hedged by means of foreign exchange forwards (cash flow hedges).
the supply of finished products and components to foreign-currency countries creates a risk position that is not covered by natural hedges. the ongoing analyses of this position are the basis for establishing a hedging strategy that is evalu-ated in regular meetings.
Financial transactions may only be concluded on the basis of a relevant hedged item. Speculative transactions(i.e. transactions without an underlying operating item) are prohibited.
Foreign exchange differences in the individual financial statements are reported in earnings before interest and taxes (EBIt) and/or the net financial result, depending on their cause.
Foreign-currencyrisksensitivityanalysis:transactions that are carried out in a currency other than the respective functional currency may have an impact on foreign exchange risks. In the case of fair-value and cash-flow hedges designated to hedge foreign exchange risks, the changes in the values of the underlying transaction and the hedging transaction caused by changes in the exchange rate are almost completely offset in the same period in the income statement. Accordingly, these financial instruments are not linked to currency risks with an impact on profit or loss, or equity.
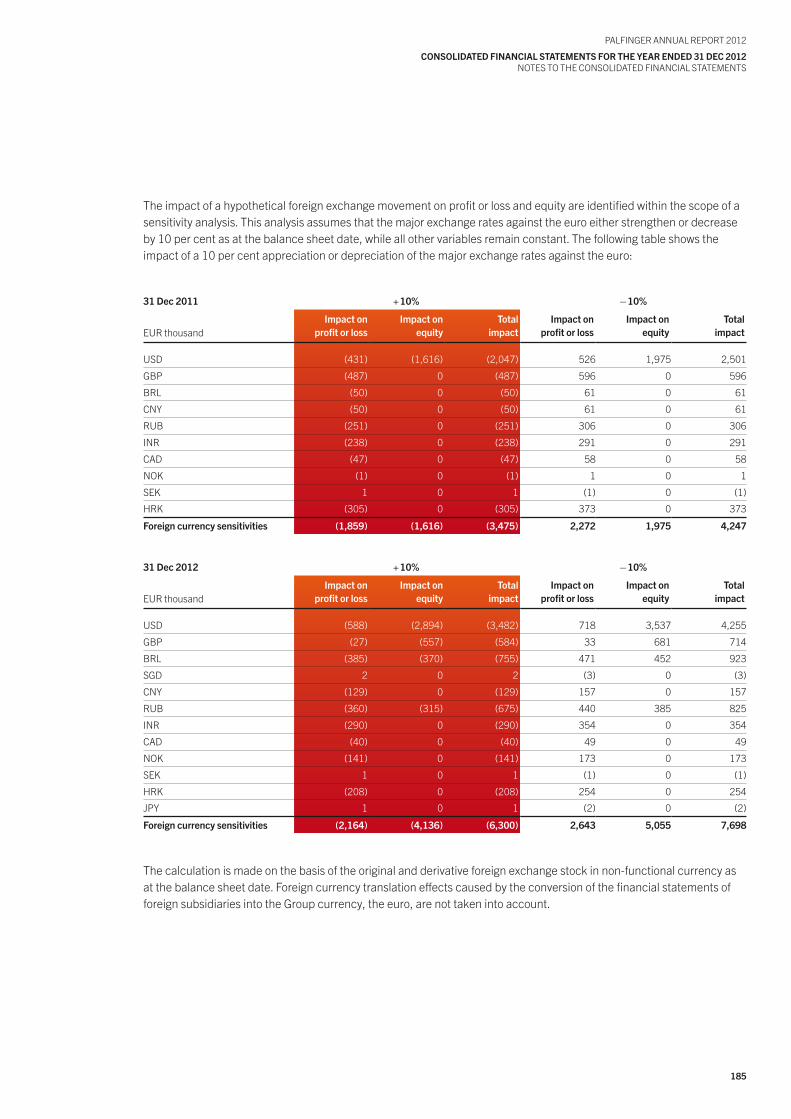
185
PALFINGER ANNuAL REPoRt 2012
coNsoLIdAtEd FINANcIAL stAtEMENts FoR thE yEAR ENdEd 31 dEc 2012NotES to tHE CoNSoLIDAtED FINANCIAL StAtEMENtS
the impact of a hypothetical foreign exchange movement on profit or loss and equity are identified within the scope of a sensitivity analysis. this analysis assumes that the major exchange rates against the euro either strengthen or decrease by 10 per cent as at the balance sheet date, while all other variables remain constant. the following table shows the impact of a 10 per cent appreciation or depreciation of the major exchange rates against the euro:
31 dec 2011 + 10% – 10%
EuR thousandImpact on
profit or lossImpact on
equitytotal
impactImpact on
profit or lossImpact on
equitytotal
impact
uSD (431) (1,616) (2,047) 526 1,975 2,501
GBP (487) 0 (487) 596 0 596
BRL (50) 0 (50) 61 0 61
CNy (50) 0 (50) 61 0 61
RuB (251) 0 (251) 306 0 306
INR (238) 0 (238) 291 0 291
CAD (47) 0 (47) 58 0 58
NoK (1) 0 (1) 1 0 1
SEK 1 0 1 (1) 0 (1)
HRK (305) 0 (305) 373 0 373
Foreign currency sensitivities (1,859) (1,616) (3,475) 2,272 1,975 4,247
31 dec 2012 + 10% – 10%
EuR thousandImpact on
profit or lossImpact on
equitytotal
impactImpact on
profit or lossImpact on
equitytotal
impact
uSD (588) (2,894) (3,482) 718 3,537 4,255
GBP (27) (557) (584) 33 681 714
BRL (385) (370) (755) 471 452 923
SGD 2 0 2 (3) 0 (3)
CNy (129) 0 (129) 157 0 157
RuB (360) (315) (675) 440 385 825
INR (290) 0 (290) 354 0 354
CAD (40) 0 (40) 49 0 49
NoK (141) 0 (141) 173 0 173
SEK 1 0 1 (1) 0 (1)
HRK (208) 0 (208) 254 0 254
JPy 1 0 1 (2) 0 (2)
Foreign currency sensitivities (2,164) (4,136) (6,300) 2,643 5,055 7,698
the calculation is made on the basis of the original and derivative foreign exchange stock in non-functional currency as at the balance sheet date. Foreign currency translation effects caused by the conversion of the financial statements of foreign subsidiaries into the Group currency, the euro, are not taken into account.
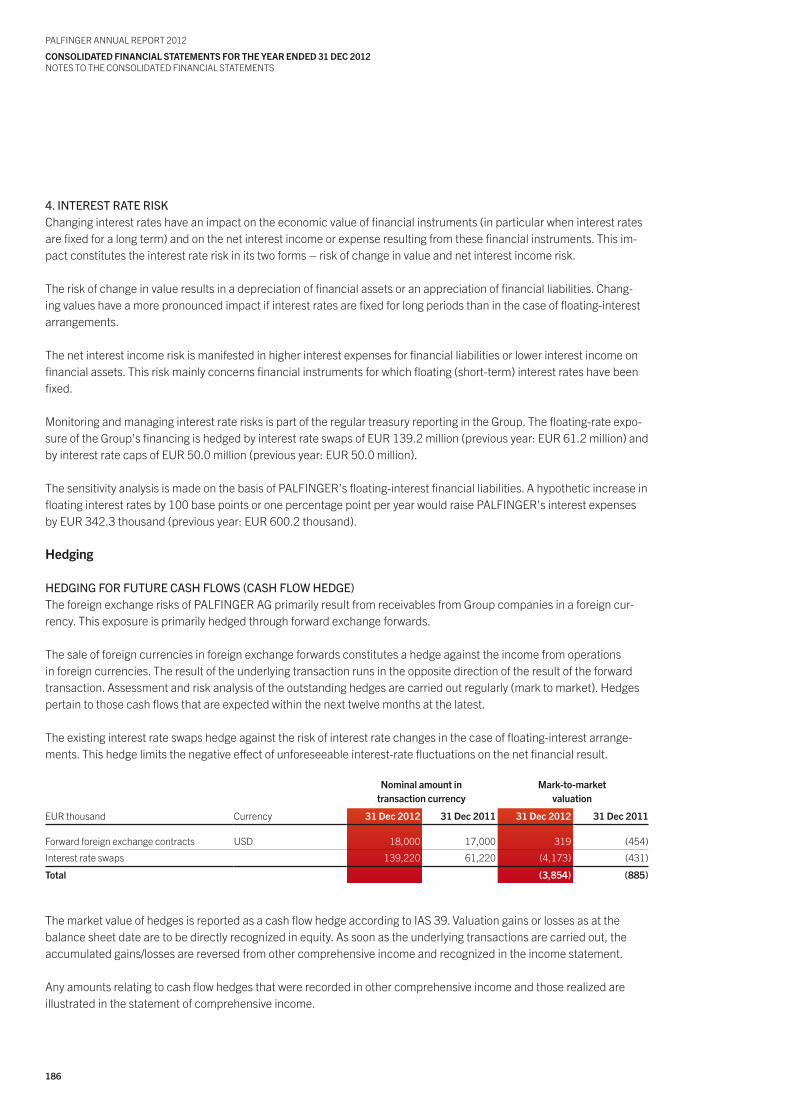
186
PALFINGER ANNuAL REPoRt 2012
coNsoLIdAtEd FINANcIAL stAtEMENts FoR thE yEAR ENdEd 31 dEc 2012NotES to tHE CoNSoLIDAtED FINANCIAL StAtEMENtS
4.INTERESTRATERISkChanging interest rates have an impact on the economic value of financial instruments (in particular when interest rates are fixed for a long term) and on the net interest income or expense resulting from these financial instruments. this im-pact constitutes the interest rate risk in its two forms – risk of change in value and net interest income risk.
the risk of change in value results in a depreciation of financial assets or an appreciation of financial liabilities. Chang-ing values have a more pronounced impact if interest rates are fixed for long periods than in the case of floating-interest arrangements.
the net interest income risk is manifested in higher interest expenses for financial liabilities or lower interest income on financial assets. this risk mainly concerns financial instruments for which floating (short-term) interest rates have been fixed.
Monitoring and managing interest rate risks is part of the regular treasury reporting in the Group. the floating-rate expo-sure of the Group’s financing is hedged by interest rate swaps of EuR 139.2 million (previous year: EuR 61.2 million) and by interest rate caps of EuR 50.0 million (previous year: EuR 50.0 million).
the sensitivity analysis is made on the basis of PALFINGER’s floating-interest financial liabilities. A hypothetic increase in floating interest rates by 100 base points or one percentage point per year would raise PALFINGER’s interest expenses by EuR 342.3 thousand (previous year: EuR 600.2 thousand).
hedging
HEDGINGFORFUTURECASHFLOWS(CASHFLOWHEDGE)the foreign exchange risks of PALFINGER AG primarily result from receivables from Group companies in a foreign cur-rency. this exposure is primarily hedged through forward exchange forwards. the sale of foreign currencies in foreign exchange forwards constitutes a hedge against the income from operations in foreign currencies. the result of the underlying transaction runs in the opposite direction of the result of the forward transaction. Assessment and risk analysis of the outstanding hedges are carried out regularly (mark to market). Hedges pertain to those cash flows that are expected within the next twelve months at the latest.
the existing interest rate swaps hedge against the risk of interest rate changes in the case of floating-interest arrange-ments. this hedge limits the negative effect of unforeseeable interest-rate fluctuations on the net financial result.
Nominal amount intransaction currency
Mark-to-marketvaluation
EuR thousand Currency 31 dec 2012 31 dec 2011 31 dec 2012 31 dec 2011
Forward foreign exchange contracts uSD 18,000 17,000 319 (454)
Interest rate swaps 139,220 61,220 (4,173) (431)
total (3,854) (885)
the market value of hedges is reported as a cash flow hedge according to IAS 39. Valuation gains or losses as at thebalance sheet date are to be directly recognized in equity. As soon as the underlying transactions are carried out, theaccumulated gains/losses are reversed from other comprehensive income and recognized in the income statement.
Any amounts relating to cash flow hedges that were recorded in other comprehensive income and those realized areillustrated in the statement of comprehensive income.
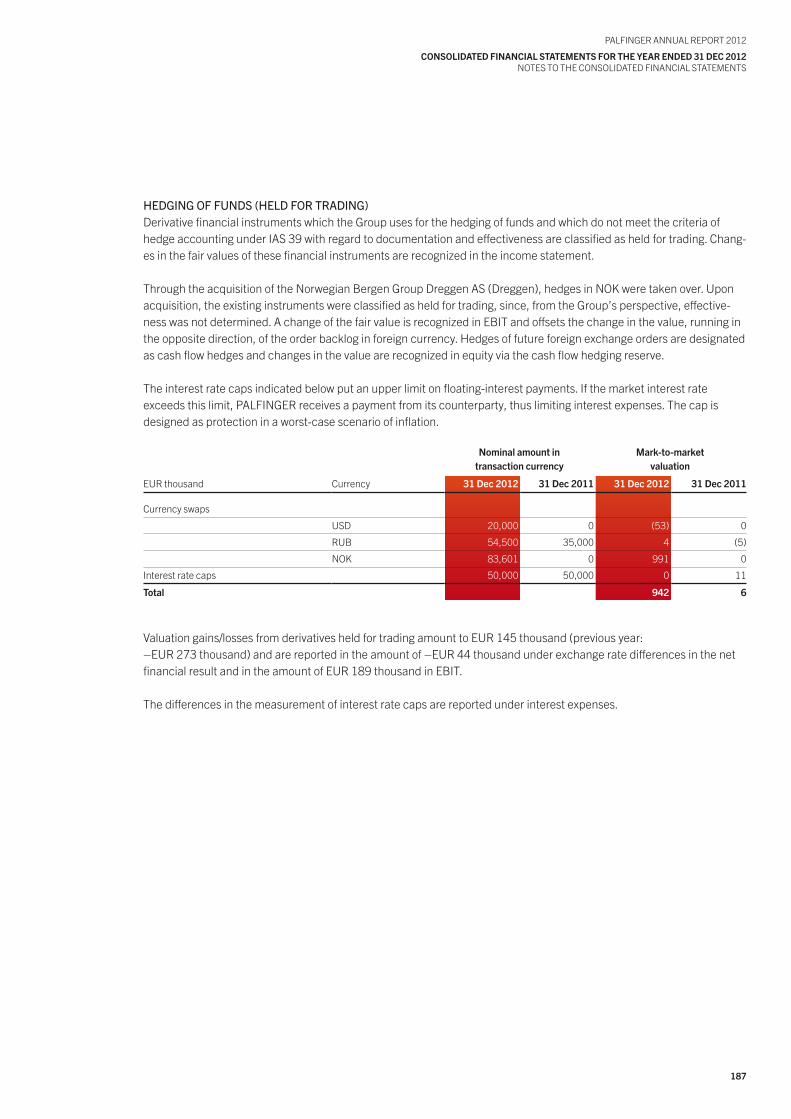
187
PALFINGER ANNuAL REPoRt 2012
coNsoLIdAtEd FINANcIAL stAtEMENts FoR thE yEAR ENdEd 31 dEc 2012NotES to tHE CoNSoLIDAtED FINANCIAL StAtEMENtS
HEDGINGOFFUNDS(HELDFORTRADING)Derivative financial instruments which the Group uses for the hedging of funds and which do not meet the criteria of hedge accounting under IAS 39 with regard to documentation and effectiveness are classified as held for trading. Chang-es in the fair values of these financial instruments are recognized in the income statement.
through the acquisition of the Norwegian Bergen Group Dreggen AS (Dreggen), hedges in NoK were taken over. upon acquisition, the existing instruments were classified as held for trading, since, from the Group’s perspective, effective-ness was not determined. A change of the fair value is recognized in EBIt and offsets the change in the value, running in the opposite direction, of the order backlog in foreign currency. Hedges of future foreign exchange orders are designated as cash flow hedges and changes in the value are recognized in equity via the cash flow hedging reserve.
the interest rate caps indicated below put an upper limit on floating-interest payments. If the market interest rateexceeds this limit, PALFINGER receives a payment from its counterparty, thus limiting interest expenses. the cap isdesigned as protection in a worst-case scenario of inflation.
Nominal amount intransaction currency
Mark-to-marketvaluation
EuR thousand Currency 31 dec 2012 31 dec 2011 31 dec 2012 31 dec 2011
Currency swaps
uSD 20,000 0 (53) 0
RuB 54,500 35,000 4 (5)
NoK 83,601 0 991 0
Interest rate caps 50,000 50,000 0 11
total 942 6
Valuation gains/losses from derivatives held for trading amount to EuR 145 thousand (previous year:–EuR 273 thousand) and are reported in the amount of –EuR 44 thousand under exchange rate differences in the net financial result and in the amount of EuR 189 thousand in EBIt.
the differences in the measurement of interest rate caps are reported under interest expenses.
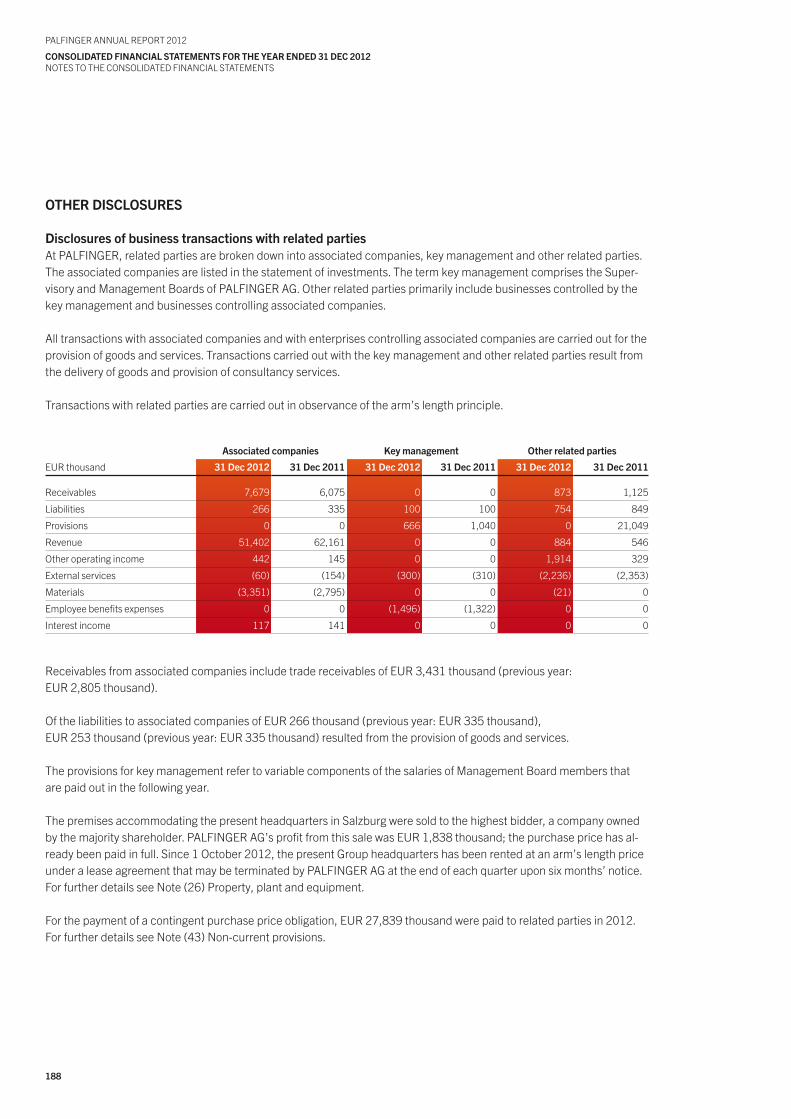
188
PALFINGER ANNuAL REPoRt 2012
coNsoLIdAtEd FINANcIAL stAtEMENts FoR thE yEAR ENdEd 31 dEc 2012NotES to tHE CoNSoLIDAtED FINANCIAL StAtEMENtS
othER dIscLosuREs
disclosures of business transactions with related partiesAt PALFINGER, related parties are broken down into associated companies, key management and other related parties. the associated companies are listed in the statement of investments. the term key management comprises the Super-visory and Management Boards of PALFINGER AG. other related parties primarily include businesses controlled by the key management and businesses controlling associated companies.
All transactions with associated companies and with enterprises controlling associated companies are carried out for the provision of goods and services. transactions carried out with the key management and other related parties result from the delivery of goods and provision of consultancy services.
transactions with related parties are carried out in observance of the arm’s length principle.
Associated companies key management other related parties
EuR thousand 31 dec 2012 31 dec 2011 31 dec 2012 31 dec 2011 31 dec 2012 31 dec 2011
Receivables 7,679 6,075 0 0 873 1,125
Liabilities 266 335 100 100 754 849
Provisions 0 0 666 1,040 0 21,049
Revenue 51,402 62,161 0 0 884 546
other operating income 442 145 0 0 1,914 329
External services (60) (154) (300) (310) (2,236) (2,353)
Materials (3,351) (2,795) 0 0 (21) 0
Employee benefits expenses 0 0 (1,496) (1,322) 0 0
Interest income 117 141 0 0 0 0
Receivables from associated companies include trade receivables of EuR 3,431 thousand (previous year:EuR 2,805 thousand).
of the liabilities to associated companies of EuR 266 thousand (previous year: EuR 335 thousand),EuR 253 thousand (previous year: EuR 335 thousand) resulted from the provision of goods and services.
the provisions for key management refer to variable components of the salaries of Management Board members that are paid out in the following year.
the premises accommodating the present headquarters in Salzburg were sold to the highest bidder, a company owned by the majority shareholder. PALFINGER AG’s profit from this sale was EuR 1,838 thousand; the purchase price has al-ready been paid in full. Since 1 october 2012, the present Group headquarters has been rented at an arm’s length price under a lease agreement that may be terminated by PALFINGER AG at the end of each quarter upon six months’ notice. For further details see Note (26) Property, plant and equipment.
For the payment of a contingent purchase price obligation, EuR 27,839 thousand were paid to related parties in 2012. For further details see Note (43) Non-current provisions.
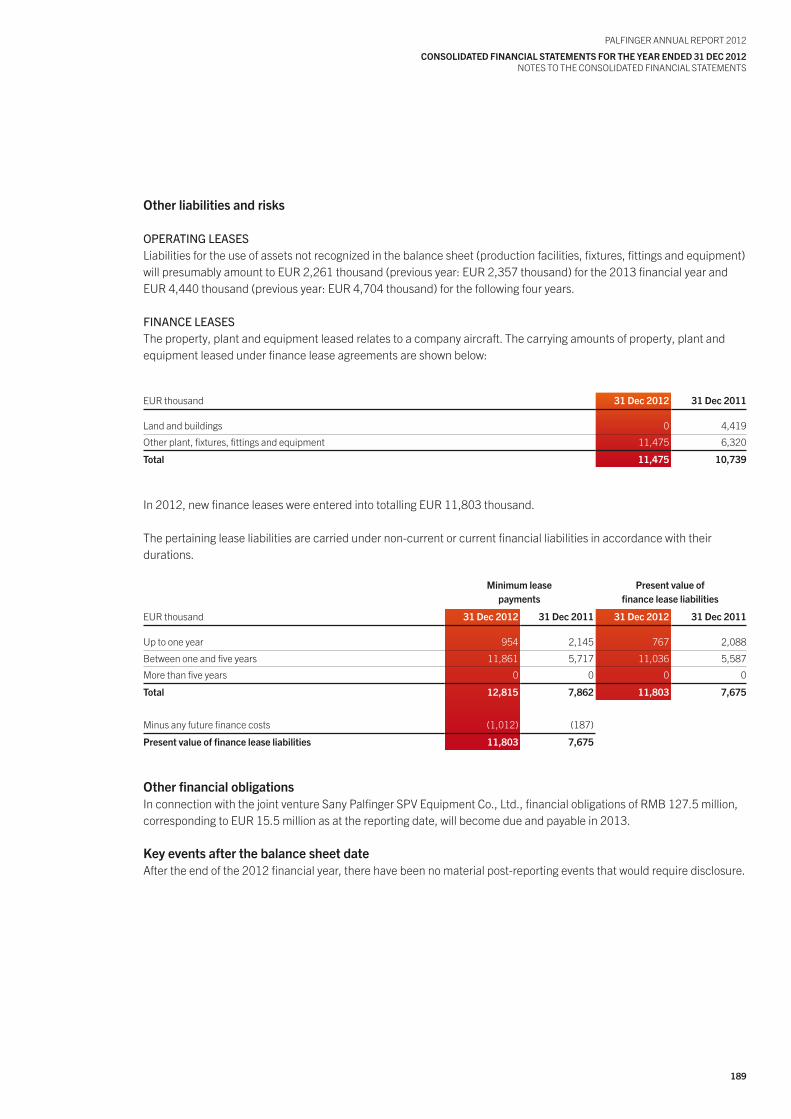
189
PALFINGER ANNuAL REPoRt 2012
coNsoLIdAtEd FINANcIAL stAtEMENts FoR thE yEAR ENdEd 31 dEc 2012NotES to tHE CoNSoLIDAtED FINANCIAL StAtEMENtS
other liabilities and risks
OPERATINGLEASESLiabilities for the use of assets not recognized in the balance sheet (production facilities, fixtures, fittings and equipment) will presumably amount to EuR 2,261 thousand (previous year: EuR 2,357 thousand) for the 2013 financial year and EuR 4,440 thousand (previous year: EuR 4,704 thousand) for the following four years.
FINANCELEASESthe property, plant and equipment leased relates to a company aircraft. the carrying amounts of property, plant and equipment leased under finance lease agreements are shown below:
EuR thousand 31 dec 2012 31 dec 2011
Land and buildings 0 4,419
other plant, fixtures, fittings and equipment 11,475 6,320
total 11,475 10,739
In 2012, new finance leases were entered into totalling EuR 11,803 thousand.
the pertaining lease liabilities are carried under non-current or current financial liabilities in accordance with their durations.
Minimum leasepayments
Present value offinance lease liabilities
EuR thousand 31 dec 2012 31 dec 2011 31 dec 2012 31 dec 2011
up to one year 954 2,145 767 2,088
Between one and five years 11,861 5,717 11,036 5,587
More than five years 0 0 0 0
total 12,815 7,862 11,803 7,675
Minus any future finance costs (1,012) (187)
Present value of finance lease liabilities 11,803 7,675
other financial obligationsIn connection with the joint venture Sany Palfinger SPV Equipment Co., Ltd., financial obligations of RMB 127.5 million, corresponding to EuR 15.5 million as at the reporting date, will become due and payable in 2013.
key events after the balance sheet date After the end of the 2012 financial year, there have been no material post-reporting events that would require disclosure.
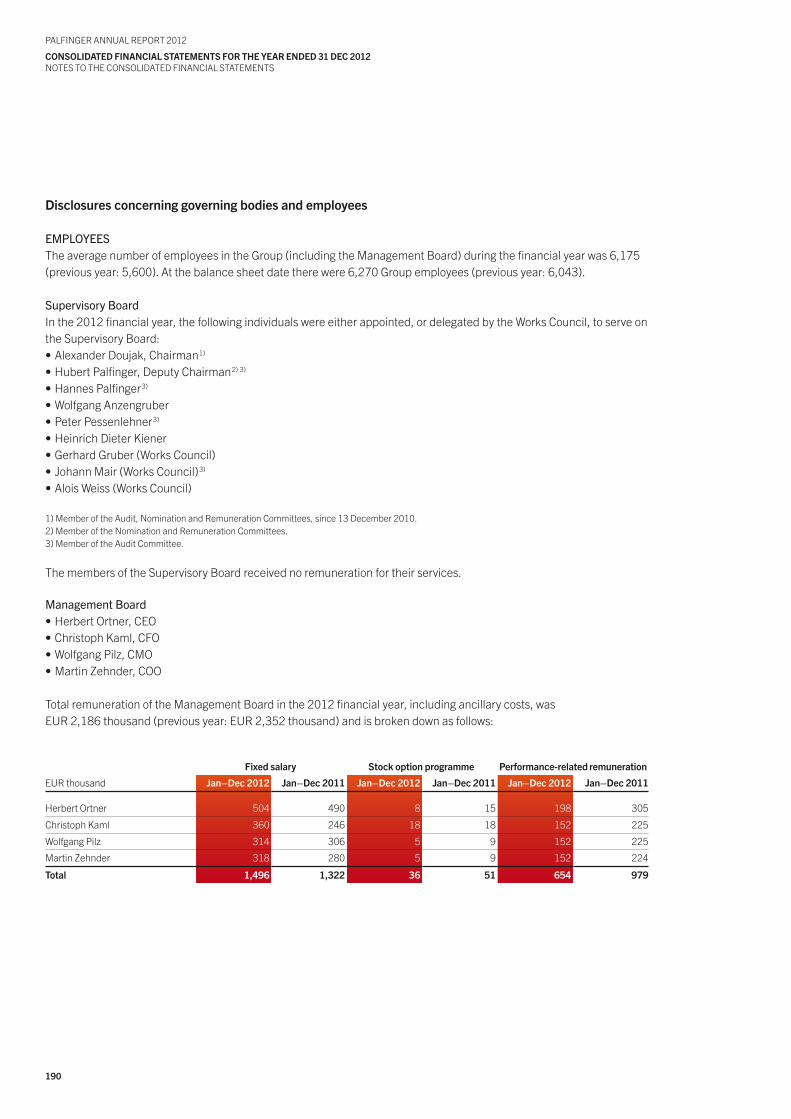
190
PALFINGER ANNuAL REPoRt 2012
coNsoLIdAtEd FINANcIAL stAtEMENts FoR thE yEAR ENdEd 31 dEc 2012NotES to tHE CoNSoLIDAtED FINANCIAL StAtEMENtS
disclosures concerning governing bodies and employees
EMPLOyEESthe average number of employees in the Group (including the Management Board) during the financial year was 6,175 (previous year: 5,600). At the balance sheet date there were 6,270 Group employees (previous year: 6,043).
SupervisoryBoardIn the 2012 financial year, the following individuals were either appointed, or delegated by the Works Council, to serve on the Supervisory Board:•AlexanderDoujak,Chairman1)
•HubertPalfinger,DeputyChairman2) 3)
•HannesPalfinger3)
•WolfgangAnzengruber•PeterPessenlehner3)
•HeinrichDieterKiener•GerhardGruber(WorksCouncil)•JohannMair(WorksCouncil)3)
•AloisWeiss(WorksCouncil)
1) Member of the Audit, Nomination and Remuneration Committees, since 13 December 2010.2) Member of the Nomination and Remuneration Committees.3) Member of the Audit Committee.
the members of the Supervisory Board received no remuneration for their services.
ManagementBoard•HerbertOrtner,CEO•ChristophKaml,CFO•WolfgangPilz,CMO•MartinZehnder,COO
total remuneration of the Management Board in the 2012 financial year, including ancillary costs, wasEuR 2,186 thousand (previous year: EuR 2,352 thousand) and is broken down as follows:
Fixed salary stock option programme Performance-related remuneration
EuR thousand Jan–dec 2012 Jan–dec 2011 Jan–dec 2012 Jan–dec 2011 Jan–dec 2012 Jan–dec 2011
Herbert ortner 504 490 8 15 198 305
Christoph Kaml 360 246 18 18 152 225
Wolfgang Pilz 314 306 5 9 152 225
Martin Zehnder 318 280 5 9 152 224
total 1,496 1,322 36 51 654 979
191
PALFINGER ANNuAL REPoRt 2012
coNsoLIdAtEd FINANcIAL stAtEMENts FoR thE yEAR ENdEd 31 dEc 2012NotES to tHE CoNSoLIDAtED FINANCIAL StAtEMENtS
In addition, a bonus agreement was concluded with the members of the Management Board for achieving a long-term increase in corporate value; these bonuses will be paid out in 2016 provided that the agreed benchmarks are achieved. In the 2012 financial year, provisions of EuR 2,176 thousand (previous year: EuR 1,757 thousand) were recognized in the income statement.
For benefits payable after termination of employment, EuR 32 thousand (previous year: EuR 40 thousand) were report-ed as current service cost in the 2012 financial year. this concerns severance payment obligations for Herbert ortner and Wolfgang Pilz as well as individual contracts regarding pension commitments concluded with Wolfgang Pilz and, in 2011, with Alexander Exner and Wolfgang Pilz.
Additional information according to sec. 245a of the Business codeAt PALFINGER AG, expenses for severance and pension payments for members of the Management Board and otherexecutives amounted to EuR 219 thousand (previous year: EuR 245 thousand), for the remaining employees toEuR 926 thousand (previous year: EuR 620 thousand).
Salzburg, 23 January 2013
the Management Board of PALFINGER AG
Herbert ortner m.p. Christoph Kaml m.p. Chief Executive officer Chief Financial officer
Wolfgang Pilz m.p. Martin Zehnder m.p. Chief Marketing officer Chief operating officer

192
PALFINGER ANNuAL REPoRt 2012
stAtEMENt oF ALL LEGAL REPREsENtAtIVEs
stAtEMENt oF ALL LEGALREPREsENtAtIVEs
193
PALFINGER ANNuAL REPoRt 2012
Statement of all legal RepReSentativeS
We confirm to the best of our knowledge that the consolidated financial statements for the year ended31 December 2012 give a true and fair view of the assets, liabilities, financial position and profit or loss of the Group as required by the International Financial Reporting Standards (IFRS) as adopted by theEuropean union (Eu) and that the consolidated management report for the year ended 31 December 2012gives a true and fair view of the development and performance of the business and the position of the Group, together with a description of the principal risks and uncertainties the Group faces.
We confirm to the best of our knowledge that the separate financial statements for the year ended31 December 2012 give a true and fair view of the assets, liabilities, financial position and profit or lossof PALFINGER AG as required by the Austrian Business Code (uGB) and that the management reportfor the year ended 31 December 2012 gives a true and fair view of the development and performanceof the business and the position of the Company, together with a description of the principal risks and uncertainties the Company faces.
Salzburg, 23 January 2013
the Management Board of PALFINGER AG
Herbert ortner m.p. Christoph Kaml m.p. Chief Executive officer Chief Financial officer
Wolfgang Pilz m.p. Martin Zehnder m.p. Chief Marketing officer Chief operating officer
194
PALFINGER ANNuAL REPoRt 2012
Auditor’s report
AudItoR’s REPoRt
REPoRt oN thE coNsoLIdAtEd FINANcIAL stAtEMENts
We have audited the accompanying consolidated financial statements of PALFINGER AG, Salzburg, for the financial year from 1 January to 31 December 2012. these consolidated financial statements comprise the consolidated balance sheet as at 31 December 2012, the consolidated income statement, consolidated statement of comprehensive income, consolidated statement of changes in equity andconsolidated statement of cash flows for the year ended 31 December 2012, and a summary of significantaccounting and valuation policies and other explanatory notes.
MANAGEMENt’s REsPoNsIBILIty FoR thE coNsoLIdAtEd FINANcIAL stAtEMENts
the Company’s management is responsible for the preparation and fair presentation of these consoli-dated financial statements in accordance with International Financial Reporting Standards as adopted by the Eu. this responsibility includes: designing, implementing and maintaining internal control relevant to the preparation and fair presentation of financial statements that are free from material misstatement, whether due to fraud or error; selecting and applying appropriate accounting policies; and making ac-counting estimates that are reasonable in the circumstances.
AudItoR’s REsPoNsIBILIty
our responsibility is to express an opinion on these consolidated financial statements based on our audit.We conducted our audit in accordance with laws and regulations applicable in Austria and in accordancewith International Standards on Auditing, issued by the International Auditing and Assurance StandardsBoard (IAASB) of the International Federation of Accountants (IFAC). those standards require that wecomply with ethical requirements and plan and perform the audit to obtain reasonable assurance whetherthe financial statements are free from material misstatement.
An audit involves performing procedures to obtain audit evidence about the amounts and disclosures in the consolidated financial statements. the procedures selected depend on the auditor’s judgement, including the assessment of the risks of material misstatement of the financial statements, whether due to fraud or error. In making those risk assessments, the auditor considers internal control relevant to the entity’s preparation and fair presentation of the consolidated financial statements in order to design audit procedures that are appropriate in the circumstances, but not for the purpose of expressing an opinion on the effectiveness of the entity’s internal control. An audit also includes evaluating the appropriateness of accounting policies used and the reasonableness of accounting estimates made by management, as well as evaluating the overall presentation of the consolidated financial statements.
We believe that the audit evidence we have obtained is sufficient and appropriate to provide a basis for our audit opinion.
195
PALFINGER ANNuAL REPoRt 2012
Auditor’s report
oPINIoN
our audit did not give rise to any objections.
Based on the results of our audit in our opinion, the consolidated financial statements present fairly, in all material respects, the financial position of the Group as at 31 December 2012 and its financial perfor-mance and its cash flows for the financial year from 1 January to 31 December 2012 in accordance with International Financial Reporting Standards as adopted by the Eu.
REPoRt oN thE coNsoLIdAtEd MANAGEMENt REPoRt
Laws and regulations applicable in Austria require us to perform audit procedures whether the consoli-dated management report is consistent with the consolidated financial statements and whether the other disclosures made in the consolidated management report do not give rise to misconception of the position of the Group. Furthermore, the auditor’s report needs to include a statement as to whether the consolidated management report is consistent with the consolidated financial statements and whether the information disclosed according to sec. 243a uGB is correct. In our opinion, the consolidated man-agement report for the Group is consistent with the consolidated financial statements. the information according to sec. 243a uGB is correct.
Salzburg, 23 January 2013
Ernst & youngWirtschaftsprüfungsgesellschaft m.b.H.
Anna Flotzinger m.p. Christoph Fröhlich m.p.Certified public accountant Certified public accountant
196
PALFINGER ANNuAL REPoRt 2012
REPoRt oF thE suPERVIsoRy BoARd
REPoRt oF thE suPERVIsoRy BoARdIn the 2012 financial year, the Supervisory Board performed all duties assigned to it by law and by the Company’s Articles of Association. Four Supervisory Board meetings were held, on 3 February, 18 June, 24 September and 17 December, and attended by the Management Board. the Management Board in-formed the Supervisory Board regularly, both in writing and verbally, about the course of business and the position of the Company and of the Group companies. the Chairman of the Supervisory Board commu-nicated regularly with the Chairman of the Management Board, also outside the scope of the Supervisory Board meetings, in order to confer with him concerning the Company’s strategy, business development and risk situation.
Besides current developments, the Supervisory Board focussed primarily on strategy in the individualbusiness units, acquisition projects and major investment decisions. the Audit Committee, the Nomina-tion Committee and the Remuneration Committee met at regular intervals during the reporting year.the strategic orientation and further development of the Group were the focus of discussions.
PALFINGER AG’s financial statements for the year ended 31 December 2012 and the management re-port including the Company’s accounting records were audited by Ernst & young Wirtschaftsprüfungsge-sellschaft m.b.H., Salzburg. the audit revealed that the accounting records, the financial statements and the management report comply with the applicable legal regulations and the provisions of the Articles of Association. the final findings of the audit did not give rise to any objections, thus allowing an unqualified auditor’s opinion to be issued for 2012. this also applies to the consolidated financial statements. the consolidated financial statements prepared in accordance with IFRS (as adopted by the European union) were supplemented by the consolidated management report and additional information in accordance with sec. 245a of the Business Code.
the Supervisory Board has approved the financial statements for the year ended 31 December 2012 and the management report for the 2012 financial year, thereby adopting the 2012 financial statements of PALFINGER AG according to sec. 96 para. 4 of the Companies Act. the Supervisory Board has ap-proved the consolidated financial statements of the Company and the consolidated management report prepared according to sec. 244 et seq. of the Business Code. the Supervisory Board has evaluated and approved the proposal of the Management Board with respect to the distribution of profits for the 2012 financial year.
the Supervisory Board would like to express its thanks and recognition to the members of the Manage-ment Board and all staff members of the PALFINGER Group for their outstanding commitment and achievements in the 2012 financial year.
Salzburg, 11 February 2013
Alexander Doujak m.p.Chairman of the Supervisory Board
197
PALFINGER ANNuAL REPoRt 2012
dEFINItIoN oF PERFoRMANcE INdIcAtoRs
dEFINItIoN oF PERFoRMANcEINdIcAtoRs
reflects capital investment and is calculated as•intangibleassets•plusproperty,plantandequipment,shareholdings•andnetcurrentassets
is the ratio of the consolidated net result for the period to the weighted average number of shares outstanding
(Earnings Before Interest and taxes)
(Economic Value Added) indicates the Company’s economic profit:•ROCEminusWACC•multipliedbyaveragecapitalemployed
is the net amount of cash available to service internal or external borrowing:•cashflowsgeneratedfromoperations•plusinterestonborrowings•minustaxshieldoninterestonborrowings
is a measure relating to the Company’s debt:•ratioofnetdebtand•equityinpercent
is calculated as•non-currentandcurrentfinancialliabilitiesminus•long-termandshort-termsecurities•long-termloans•cashandcashequivalents
(Net operating Profit Less Adjusted taxes) is composed of•EBIT•minustaxesonEBIT
(Return on Capital Employed) shows the rate of return generated on capital invested in the Company:•ratioofNOPLATto•averagecapitalemployed(fromreportingdateofpreviousyeartoreportingdateofcurrentyear)inpercent
(Return on Equity) is a measure of the Company’s profitability that presents earnings in relation to equity employed:•ratioofafter-taxearningsand•averageequityasapercentage
(Weighted Average Cost of Capital) is a measure of the average cost of capital employed (debt and equity)
is the net surplus of current assets over current liabilities
cAPItAL EMPLoyEd
EARNINGs PER shARE
EBIt
EVA
FREE cAsh FLows
GEARING RAtIo
NEt dEBt
NoPLAt
RocE
RoE
wAcc
woRkING cAPItAL
198
PALFINGER ANNuAL REPoRt 2012
coRPoRAtE LocAtIoNs oF thE PALFINGER GRouP
coRPoRAtE LocAtIoNs oF thE PALFINGER GRouPAustRIA
PALFINGER AG•Franz-Wolfram-Scherer-Strasse24,5020SalzburgEPsILoN kran Gmbh.•Christophorusstrasse30,5061Elsbethen/Glasenbach•Franz-Wolfram-Scherer-Strasse24,5020SalzburgPalAir Gmbh•Franz-Wolfram-Scherer-Strasse24,5020SalzburgPalfinger Area units Gmbh•Franz-Wolfram-Scherer-Strasse24,5020SalzburgPalfinger European units Gmbh•Franz-Wolfram-Scherer-Strasse24,5020SalzburgPalfinger cIs Gmbh•Franz-Wolfram-Scherer-Strasse24,5020SalzburgPalfinger Europe Gmbh•Franz-Wolfram-Scherer-Strasse24,5020Salzburg•Moosmühlstrasse1,5203Köstendorf•Kapellenstrasse18,5211FriedburgPalfinger Marine- und Beteiligungs-Gmbh•Franz-Wolfram-Scherer-Strasse24,5020Salzburg•Moosmühlstrasse1,5203KöstendorfPalfinger North America Gmbh•Franz-Wolfram-Scherer-Strasse24,5020SalzburgPalfinger Russland Gmbh•Franz-Wolfram-Scherer-Strasse24,5020SalzburgPalfinger sany International Mobile cranes sales Gmbh•Franz-Wolfram-Scherer-Strasse24,5020SalzburgPalfinger south America Gmbh•Franz-Wolfram-Scherer-Strasse24,5020SalzburgstEPA Farmkran Gesellschaft m.b.h.•Christophorusstrasse28,5061Elsbethen/Glasenbach
ARGENtINA
Palfinger Argentina s.A.•Av.Corrientes327,3°Piso,BuenosAires
BELGIuM
MBB Interlift N.V.•Industrielaan4,3eIndustriezone,9320Erembodegem
BRAzIL
Bergen Group dreggen do Brasil Ltda•LauroMuller116,NBIO/Suite2405,TorredoRioSul,
Botafogo 22290-160, Rio de JaneiroMadal Palfinger s.A.•RuaFlavioFranciscoBellini350,CEP95098–170,CaxiasdoSul•EstradadoEmbu,485–JardimSãoVicente,CEP06713–100,
CotiaMadal Palfinger holding Ltda. •RuaHenriqueMonteiro90,8thfloor,05423–020SãoPauloPalfinger-tercek Indústria de Elevadores Veiculares Ltda•RuaEmilioRibas189,CEP95032–350,CaxiasdoSul
BuLGARIA
Palfinger Produktionstechnik Bulgaria Eood•5980ChervenBrijag•8672Tenevo
cANAdA
Palfinger, Inc.•7942DorchesterRoad,NiagaraFalls,OntarioL2E6V6
chINA
PALFINGER AG (office)•Room716building2Xiangyucenter,249WuyiAve,Furong
District, Changsha, Hunandreggen (hong kong) company Limited•Room1603,KwongKinTradeCentre,5KinFatStreet,TuenMun,
N.t., Hong KongPalfinger (shenzhen) Ltd.•Block5,NorthernYongfaTechnologicalPark,DistrictB,
Chuandong Industrial Park, Dao yan Chuan Chaoyang Road, Song Gang Street, Bao An District, Shenzhen
sany Palfinger sPV Equipment co., Ltd.•No.168WestJinzhouRoad,JinzhouNewArea,Changsha,Hunan
cRoAtIA
Palfinger Proizvodna tehnologija hrvatska d.o.o.•LučićkaCesta1,51300Delnice
FRANcE
A.c.I. sARL•AvenueDescartes,33370ArtiguesprèsBordeauxcaridro Atlantique sarl•9,RueJamesJoule,44400Rezécaridro centre sarl•28,RueEmileLeconte,45140Ingrécaridro ouest s.A.s.•ZAdelaLongueraie,56140SaintAbrahamcaridro Val de Loire sarl•10,AlléeRollandPilainZAEvenParc–StMalo,
37320 Esvres sur IndreGuima France s.A.s.•29A,AvenuedesTourondes,82300CaussadeGuima herblay sarl•4,RueÉdouardBranly,95220HerblayGuima Palfinger s.A.s.•29A,AvenuedesTourondes,82300CaussadeGuima Provence sarl•RoutedeMarseille,83170BrignolesGuima sud ouest sarl•277,ChemindeBordevielle,31790SaintSauveurJcB Poids Lourds s.A.s.•ZIdel‘Alouette–BP12,62801LievinMBB Inter s.A.s.•Ruedel’Eglise,61310SillyenGouffernNord Benne sARL•AvenueKuhlmann–BP106,59373LoosCedexPalfinger France s.A.•ZALesBasseaux–BP73,26802ÉtoilesurRhôneCedexPalfinger service Annecy sarl•329RoutedeValparc,74330PoisyPalfinger service Paris sarl•24AvenueCondorcet,91240SaintMichelsurOrgesand sARL•ZACdesDeuxVallées,10AvenuedesMineurs,54910Valleroy
As at 31 December 2012
199
PALFINGER ANNuAL REPoRt 2012
coRPoRAtE LocAtIoNs oF thE PALFINGER GRouP
GERMANy
MBB Palfinger Gmbh•Fockestrasse53,27777Ganderkesee-HoykenkampPalfinger Gmbh•FeldkirchenerFeld1,83404Ainring•Rauheckstrasse4,74232Abstatt•Industriestrasse4,89188Merklingen•DüsseldorferStrasse100,47809Krefeld•Johann-Andreas-Schubert-Strasse6,02730Ebersbach•BrachwitzerStrasse20,06118Halle/Saale•Färberstrasse2,85276Pfaffenhofena.d.Ilm•Bullerdeich59,20537HamburgPalfinger Platforms Gmbh•DüsseldorferStrasse100,47809Krefeld•ÄussereBautznerStrasse47,02708Löbau•HalbendorferStrasse4,02782Seifhennersdorf•Johann-Andreas-Schubert-Strasse6,02730Ebersbach
GREAt BRItAIN
Ratcliff Palfinger Ltd.•BessemerRoad,WelwynGardenCity,HertsAL71ET
INdIA
Palfinger cranes India Pvt. Ltd.•37,Varadarajapuram,Nazarathpet,Poonamallee,
Chennai – 600 123
ItALy
Palfinger Gru Idrauliche s.r.l.•ViaDanteAleghieri50,42023CadelboscodiSopra
NEthERLANds
Fast RsQ B.V.•Ambachtsweg10,3771MGBarneveldNed-deck Marine B.V.•Ambachtsweg10,3771MGBarneveldPalfinger Marine services B.V.•Arsenaal9,3905NNVenendaal•Vissersweg38,3922GHElstUt
NoRwAy
Palfinger dreggen As (formerly Bergen Group Dreggen AS)•Hegrenesveien17A,5042BergenPalfinger Marine services As•Skalegato50,Box134,5486Rosendal
RoMANIA
Nimet srl•137121,Lazuri,Comisani
RussIA
PALFINGER AG (office)•UlitzaMarata,47–49,LiteraA,Office501,191002,
St. Petersburgdreggen BG LLc•D.DonskogoSt.,17,Office20,236000KaliningradINMAN zAo•2PervootkryvateleyBaschkirskoyNefti,453210,
Ishimbay, Respublika BashkortostanPalfinger crane Rus LLc•ParkovayaUlitza,7,196084,St.PetersburgPALFINGER sANy cranes ooo•OfficeCenterDelovoy,BusinessCenterAlekseevskaya
Bashnya, Raketny Bulvar 16, 7th floor, 129164 Moscow
sINGAPoRE
Bergen Group dreggen Pte. Ltd. •2TohGuanRoadEast,NaigaiNittoBuilding#03-2A,
Singapore 608837Palfinger Asia Pacific Pte. Ltd.•16TuasAvenue6,Singapore639303Palfinger Marine Pte. Ltd.•79JooKoonCircle,Singapore629107
sLoVAkIA
MBB Palfinger s.r.o.•Tovarenska14,81571Bratislava
sLoVENIA
Palfinger Marine d.o.o., Maribor•ŠpelinaUlica22,2000MariborPalfinger Proizvodnja d.o.o.•Jaskova18,2001Maribor
usA
composite works, LLc•341NW122ndStreet,OklahomaCity,OK73114,OklahomaEquipment technology, LLc•341NW122ndStreet,OklahomaCity,OK73114,OklahomaInterlift, Inc.•15939PiumaAvenue,Cerritos,CA90703,Californiaomaha standard, Inc.•3501South11thStreet,CouncilBluffs,IA51501,Iowa•572WhiteheadRoad,Suite301,Trenton,NJ08619,NewJerseyPalfinger, Inc.•3450LakesideDrive,Suite110,Miramar,FL33027,FloridaPalfinger usA, Inc.•4151WestStateRoute18,Tiffin,OH44883,OhioPalfleet truck Equipment, co.•2490PinsonValleyParkway,Birmingham,AL35217,Alabama•5178OldDixieHighway,ForestPark,Atlanta,GA30297,Georgia•4101TrailerDrive,Charlotte,NC28269,NorthCarolina•3030IrvingBoulevard,Dallas,TX75247,Texas•2770BluffRoad,Indianapolis,IN46225,Indiana•5620FernValleyRoad,Louisville,KY40228,Kentucky•2109South35thStreet,CouncilBluffs,IA51501,Iowa•1801LebanonPike,Nashville,TN37210,Tennessee•4151WestStateRoute18,Tiffin,OH44883,Ohio
VIEtNAM
Fast RsQ Vietnam co., Ltd.•Road206,SectionA,PhoNoiAIndustrialPark,
Van Lam District, Hung yen Ned-deck Marine Vietnam co. Ltd.•7PhanHuyChu,HoanKiem,Hanoi•RoadD2,AreaD,IZPhoNoiA,HungYen
200
PALFINGER ANNuAL REPoRt 2012
GENERAL INFoRMAtIoN
GENERAL INFoRMAtIoN PALFINGER AGFranz-Wolfram-Scherer-Strasse 245020 SalzburgAustria
INVEstoR RELAtIoNs
Company Spokesperson:hannes RoitherPhone +43 662 4684-2260Fax +43 662 [email protected]
Corporate Communications:Julia GanglbauerExt. 2262, [email protected] RendlExt. 2261, [email protected] werdeckerExt. 2219, [email protected]
www.PALFINGER.AG
coNsuLtINGScholdan & Company
dEsIGNRahofer Werbeagentur
Photo IMAGEsAndreas Fitzner, Vienna Paint
PRINtEd oNArctic Volume
Minimal arithmetical differences may arise from the application of commercial rounding to individual items and percentages in the Annual Report. the English translation of the PALFINGER Report is for convenience. only the German text is binding.
this Annual Report contains forward-looking statements made on the basis of all information available at the date of the preparation of this Annual Report. Forward-looking statements are usually identified by the use of terminology such as “expect”, “plan”, “estimate”, “believe”, etc. Actual outcomes and results may be different from those predicted.
Published on 13 February 2013.
No liability is assumed for any typographical or printing errors.
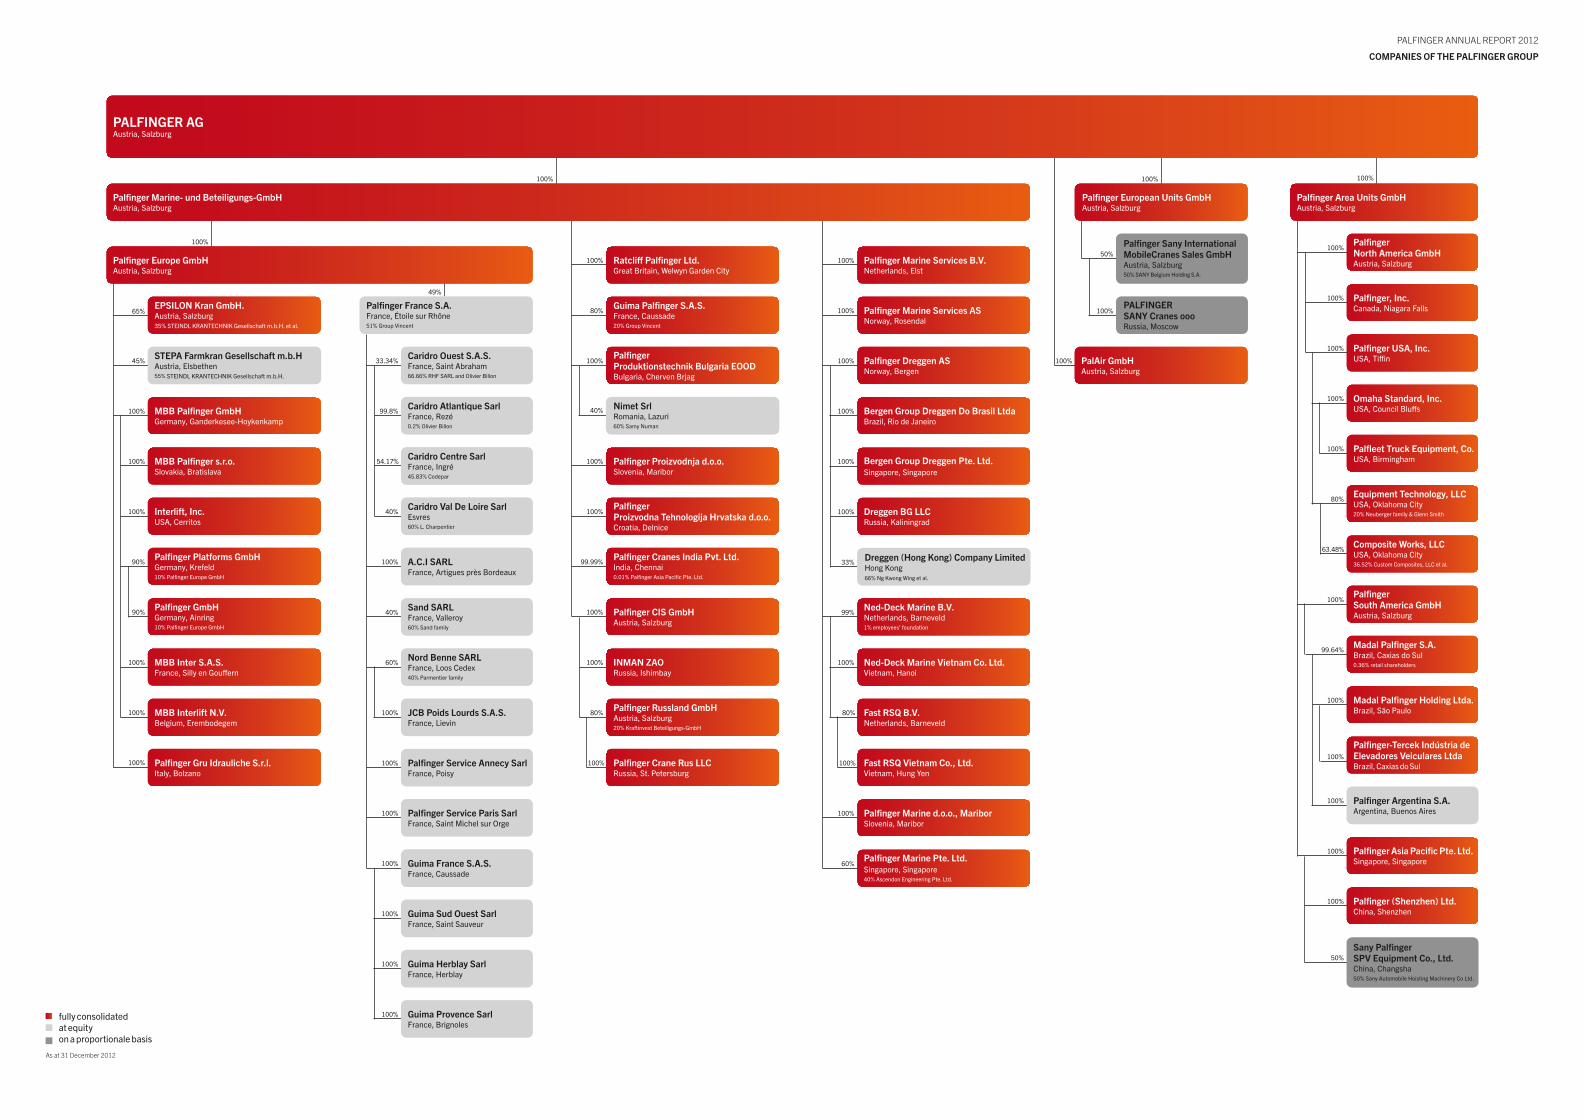
200
PALFINGER ANNuAL REPoRt 2012
GENERAL INFoRMAtIoN
GENERAL INFoRMAtIoN PALFINGER AGFranz-Wolfram-Scherer-Strasse 245020 SalzburgAustria
INvEstoR RELAtIoNs
Company Spokesperson:hannes RoitherPhone +43 662 4684-2260Fax +43 662 [email protected]
Corporate Communications:Julia GanglbauerExt. 2262, [email protected] RendlExt. 2261, [email protected] werdeckerExt. 2219, [email protected]
www.PALFINGER.AG
coNsuLtINGScholdan & Company
dEsIGNRahofer Werbeagentur
Photo IMAGEsAndreas Fitzner, Vienna Paint
PRINtEd oNArctic Volume
Minimal arithmetical differences may arise from the application of commercial rounding to individual items and percentages in the Annual Report. the English translation of the PALFINGER Report is for convenience. only the German text is binding.
this Annual Report contains forward-looking statements made on the basis of all information available at the date of the preparation of this Annual Report. Forward-looking statements are usually identified by the use of terminology such as “expect”, “plan”, “estimate”, “believe”, etc. Actual outcomes and results may be different from those predicted.
Published on 13 February 2013.
No liability is assumed for any typographical or printing errors.
PALFINGER ANNuAL REPoRt 2012
coMPANIEs oF thE PALFINGER GRouP
100%
100%
100%
100%
80%
100%
63.48%
100%
100%
50%
99.64%
100%
100%
100%
100%
100%
Palfi ngerNorth America GmbhAustria,Salzburg
Palfi nger, Inc.Canada,NiagaraFalls
Palfi nger usA, Inc.uSA, tiffi n
omaha standard, Inc.USA,CouncilBluffs
Palfl eet truck Equipment, co.USA,Birmingham
Equipment technology, LLcUSA,OklahomaCity20%Neubergerfamily&GlennSmith
composite works, LLcUSA,OklahomaCity36.52%CustomComposites,LLCetal.
Palfi nger Area units GmbhAustria,Salzburg
Palfi nger Asia Pacifi c Pte. Ltd.Singapore, Singapore
Palfi nger (shenzhen) Ltd.China,Shenzhen
Palfi ngersouth America GmbhAustria,Salzburg
Madal Palfi nger s.A.Brazil,CaxiasdoSul0.36%retailshareholders
Madal Palfi nger holding Ltda. Brazil,SãoPaulo
Palfi nger-tercek Indústria de Elevadores veiculares LtdaBrazil,CaxiasdoSul
Palfi nger Argentina s.A.Argentina,BuenosAires
sany Palfi ngersPv Equipment co., Ltd. China,Changsha50%SanyAutomobileHoistingMachineryCoLtd.
100%
33.34%
99.8%
54.17%
40%
100%
100%
100%
100%
100%
100%
100%
100%
40%
60%
49%
Palfi nger France s.A.France,ÉtoilesurRhône51%Groupvincent
caridro ouest s.A.s. France,SaintAbraham66.66%RHFSARLandOlivierBillon
caridro Atlantique sarl France,Rezé0.2%OlivierBillon
caridro centre sarl France,Ingré45.83%Codepar
caridro val de Loire sarl Esvres60%L.Charpentier
A.c.I sARL France,ArtiguesprèsBordeaux
sand sARL France,valleroy60%Sandfamily
Nord Benne sARL France,LoosCedex40%Parmentierfamily
Palfi nger service Annecy sarl France,Poisy
Palfi nger service Paris sarl France,SaintMichelsurOrge
Guima France s.A.s. France,Caussade
Guima sud ouest sarl France,SaintSauveur
Guima herblay sarl France,Herblay
Guima Provence sarl France,Brignoles
JcB Poids Lourds s.A.s. France,Lievin
100%
100%
100%
100%
100%
100%
90%
90%
65%
45%
EPsILoN kran Gmbh.Austria,Salzburg35% STEINDLkRANTECHNIkGesellschaftm.b.H.etal.
stEPA Farmkran Gesellschaft m.b.hAustria,Elsbethen55% STEINDLkRANTECHNIkGesellschaftm.b.H.
Palfi nger GmbhGermany,Ainring10%PalfingerEuropeGmbH
Palfi nger Platforms GmbhGermany,krefeld10%PalfingerEuropeGmbH
MBB Palfi nger GmbhGermany,Ganderkesee-Hoykenkamp
MBB Inter s.A.s.France,SillyenGouffern
MBB Interlift N.v.Belgium,Erembodegem
Palfi nger Gru Idrauliche s.r.l.Italy,Bolzano
MBB Palfi nger s.r.o.Slovakia,Bratislava
Interlift, Inc.USA,Cerritos
Palfi nger Europe GmbhAustria,Salzburg
100%
99.99%
100%
100%
100%
80%
100%
100%
100%
80%
40%
Ratcliff Palfi nger Ltd.GreatBritain,WelwynGardenCity
Guima Palfi nger s.A.s.France,Caussade20%Groupvincent
Palfi ngerProduktionstechnik Bulgaria EoodBulgaria,ChervenBrjag
Palfi ngerProizvodna tehnologija hrvatska d.o.o.Croatia,Delnice
Palfi nger Proizvodnja d.o.o.Slovenia,Maribor
Nimet srlRomania,Lazuri60%SamyNuman
Palfi nger cranes India Pvt. Ltd.India,Chennai0.01%PalfingerAsiaPacificPte.Ltd.
Palfi nger cIs GmbhAustria,Salzburg
INMAN zAoRussia,Ishimbay
Palfi nger Russland GmbhAustria,Salzburg20%kraftinvestBeteiligungs-GmbH
Palfi nger crane Rus LLcRussia,St.Petersburg
100% PalAir GmbhAustria,Salzburg
50%
100%
100%
Palfi nger European units GmbhAustria,Salzburg
PALFINGERsANy cranes ooo Russia,Moscow
Palfi nger sany International Mobilecranes sales GmbhAustria,Salzburg50%SANyBelgiumHoldingS.A.
100%
99%
80%
100%
100%
60%
100%
100%
100%
100%
100%
33%
100%
Ned-deck Marine B.v.Netherlands,Barneveld1%employees’foundation
Fast RsQ B.v.Netherlands,Barneveld
Fast RsQ vietnam co., Ltd. vietnam,Hungyen
Ned-deck Marine vietnam co. Ltd.vietnam,Hanoi
Palfi nger Marine d.o.o., MariborSlovenia,Maribor
Palfi nger Marine Pte. Ltd.Singapore, Singapore 40% Ascendon engineering pte. ltd.
Palfi nger Marine services AsNorway,Rosendal
Palfi nger Marine services B.v. Netherlands,Elst
Palfi nger dreggen As Norway,Bergen
dreggen BG LLc Russia,kaliningrad
Bergen Group dreggen Pte. Ltd.Singapore, Singapore
Bergen Group dreggen do Brasil Ltda Brazil,Riodejaneiro
dreggen (hong kong) company LimitedHongkong66%NgkwongWingetal.
100%
Palfi nger Marine- und Beteiligungs-GmbhAustria,Salzburg
PALFINGER AGAustria,Salzburg
fullyconsolidatedatequityonaproportionalebasis
As at 31 December 2012
PALFINGER ANNuAL REPoRt 2012
INdEX
A Acquisition 11, 18, 20, 72, 74–75, 109, 129 et seq.
AREA uNIts segment 18, 107–108, 121–122
Auditor’s report 149–150
B Balance sheet 2, 76–77, 115, 148–149
c cash flows 2, 77, 120–121
code of conduct 67, 100
committees of the supervisory Board 49, 190, 196
contract manufacturing 19, 94, 107
corporate governance 45 et seq.
corporate locations 17, 68–69, 198–199
d dividend 2, 56–57, 78, 116, 134, 163
E Environment 16, 99 et seq.
Equity 2, 76–77, 115, 118–119
EuRoPEAN uNIts segment 104 et seq., 121–122
F Financial calendar 57
Flexibility 5, 16 et seq., 72–73, 111
G Growth 10–11, 16 et seq., 70 et seq.
h human resources 96 et seq., 101, 190
I Income statement 2, 116, 170 et seq.
Innovation 5, 16 et seq., 73, 88 et seq., 100
Internal control system 87
Internationalization 5, 11, 16 et seq., 70–71, 111
Investments 2, 72, 76
Investor relations 53 et seq.
L Liquidity 80, 134
M Management Board 6 et seq., 47, 190
Marine 11, 20, 64, 72, 91, 106, 109, 129
Market position 13, 16, 20, 65
o outlook 111
P PALFINGER brand 23 et seq.
Products 17, 24 et seq., 88 et seq., 100
Q Quality 5, 16, 67, 93 et seq.
R Remuneration 50, 96, 190–191
Risk management 81 et seq.
s share 2, 54 et seq., 75, 162–163
share buyback 56, 162
shareholder structure 56
strategy 7, 15 et seq.
supervisory Board 48, 190, 196
sustainability 5, 11, 16, 19, 99 et seq.
t technology 13, 16, 67, 88 et seq.
V Value creation 20, 88, 93 et seq.
VENtuREs unit 109, 121–122
INdEX

www.PALFINGER.AG
PALFINGER AGFRANZ-WOLFRAM-SCHERER-STRASSE245020SALZBURGAuStRIA