Embed Size (px)
Citation preview
Palestinian Central Bureau of Statistics
Child Statistics Series (No. 15)
Palestinian Children –Issues and Statistics Annual Report, 2012
April, 2012
This document is prepared in accordance with the standard procedures stated in the Code of Practice for Palestine Official Statistics 2006
© April, 2012 All Rights Reserved. Suggested Citation: Palestinian Central Bureau of Statistics, 2012. Annual Report. Palestine Children–Issues and Statistics. Child Statistics Series (No. 15). Ramallah–Palestine. All correspondence should be directed to: Palestinian Central Bureau of Statistics P. O. Box 1647, Ramallah, Palestine Tel: (972/970) 2 298 2 700 Fax: (972/970) 2 2982 710 Toll Free: 1800 300 300 Email: [email protected] Web-site: http://www.pcbs.gov.ps

Work Team
Report Preparation Faten Abu-Qara Preliminary Review Khalid Abu Khalid
Jawad AL-Saleh
Final Review Mahmoud Jaradat Overall Supervision Ola Awad President of PCBS

Acknowledgements
A technical team at the Palestinian Central Bureau of Statistics (PCBS) prepared the report “Palestinian Children – Issues and Statistics, 2012”. The funds for preparing this report were provided by the Palestinian National Authority (PNA) and the Core Funding Group (CFG) for 2012, represented by the Representative Office of Norway to PNA and the Swiss Development and Cooperation Agency (SDC). Moreover, PCBS very much appreciates the distinctive efforts of the Core Funding Group (CFG) for their valuable contribution to funding the project.

Preface The availability of statistics on children in the world has improved since United Nations reemphasized the concerns of the international community regarding children’s rights by making it an objective to provide a statistical database on the conditions of children and to measure progress achieved to meet their needs. The Convention, signed and approved by almost all member countries, constitutes a reference and an international legal framework for monitoring progress made in meeting children’s needs and requirements. The different countries translate their commitment to protect child rights through development of their own reports. The Palestinian Central Bureau of Statistics took on itself the task of providing an enabling atmosphere, and to promote awareness among policy makers, planners, and other parties engaged in defending children rights and interested in bringing about sustainable and comprehensive developments for children. The Palestinian Central Bureau of Statistics is pleased to dish its fifteen annual report on the socio-economic situation of the Palestinian child, as part of the activities of the Child Statistics Program. This report is significant as it is issued after fifteen years from the inception of the Palestinian National authority (PNA). The Palestinian Central Bureau of Statistics (PCBS) attempts through statistics to give specialists, concerned parties and decision makers an opportunity to identify the extent of progress achieved by the PNA, local and international Non Governmental Organizations (NGOs), and private sector, in the protection and development of children in the Palestinian Territory. The report presents available statistics on the socio-economic environment of the Palestinian child and sheds light on the immediate deficiencies and gaps in the child’s reality, especially in the fields of health, education, culture, recreation, poverty, and child labor. Developing the status of the child and commitment to enforce child rights can not be attained without the accumulation of the efforts of all parties interested in childhood. It is necessary in this context to point out that the database we have developed, in terms of framework and content, is based on the nature of our own understanding of the monitoring role assigned to us by the principles of collective participation in defining work priorities. This effort is to be enhanced through coordination with Palestinian, regional and international institutions to ensure harmony with the tools used in measuring indicators pertinent to child rights, as adopted by the General Assembly of the United Nations, and to ensure the fulfillments of these requirements in light of the peculiarities of the Palestinian reality and the unique conditions of our children. PCBS hopes that this report will be utilized in planning, policy making and strategic decision making in the child sector in Palestine. No doubt, the continuous flow of data for the main indicators about children is one of the basic pillars for monitoring changes in this regard. April 2012 Ola Awad President of PCBS

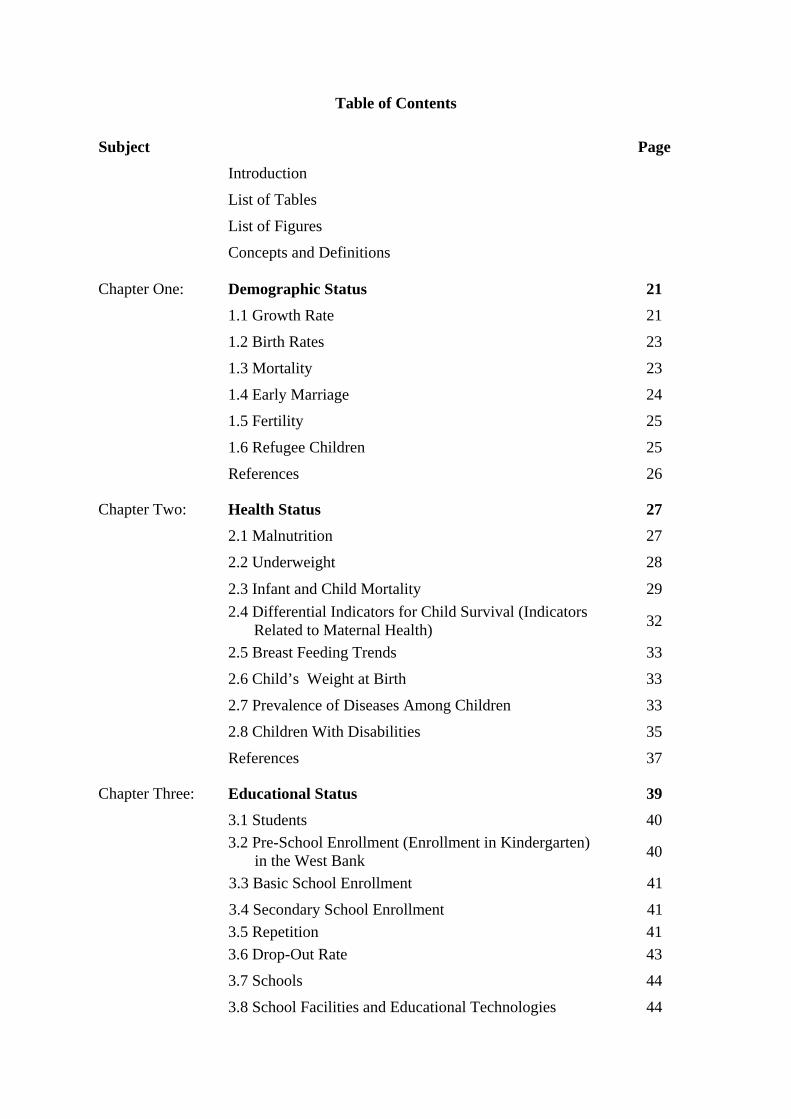
Table of Contents
Subject Page Introduction
List of Tables
List of Figures
Concepts and Definitions
Chapter One: Demographic Status 21 1.1 Growth Rate 21 1.2 Birth Rates 23 1.3 Mortality 23 1.4 Early Marriage 24 1.5 Fertility 25 1.6 Refugee Children 25 References 26
Chapter Two: Health Status 27 2.1 Malnutrition 27 2.2 Underweight 28 2.3 Infant and Child Mortality 29
2.4 Differential Indicators for Child Survival (Indicators Related to Maternal Health) 32
2.5 Breast Feeding Trends 33 2.6 Child’s Weight at Birth 33 2.7 Prevalence of Diseases Among Children 33 2.8 Children With Disabilities 35 References 37
Chapter Three: Educational Status 39 3.1 Students 40
3.2 Pre-School Enrollment (Enrollment in Kindergarten) in the West Bank 40
3.3 Basic School Enrollment 41 3.4 Secondary School Enrollment 41 3.5 Repetition 41 3.6 Drop-Out Rate 43 3.7 Schools 44 3.8 School Facilities and Educational Technologies 44
Subject Page 3.9 Crowdedness Rate 45 3.10 Teachers 46 References 47
Chapter Four: Child Cultural and Recreational Status 49 4.1 Using Computer 49
4.2 Using Internet 49
4.3 Availability of Knowledge Means in the Family 50
References 52
Chapter Five: Children In Need of Special Protection 53 5.1 Children Living in Poverty 54 5.2 Number of Childen in the Household 54 5.3 Child Labor 55
5.4 In-adequate Care for Children Under Age of Five Years 57
5.5 Violence Against Children 58 5.6 Detained Children 60 References 62
List of Tables
Page Table Chapter One: Demographic Status
25 Age specific and total fertility rates using the direct method by region, 2010
Table (1-1)
Chapter Two: Health Status
35Percentage distribution of disabled individuals 0-17 years by reason of disability and region, 2011
Table (2-1)
36Percentage of disabled individuals aged 10-17 years needing modified features to continue education by main disability, 2011
Table (2-2)
Chapter Five: Children In Need of Special Protection 54 Likelihood of being poor among households according to households
monthly consumption by region, 2010Table (5-1)
54Percentage of children in poverty by region, 2010 Table (5-2) 55 Likelihood of being poor among households according to households
monthly consumption by number of children in the household, 2010 Table (5-3)
56 Percentage distribution of children 5-14 years by employment status and selected characterstics, 2010
Table (5-4)
56 Percentage of child labor and education enrollment of children aged 5-14 years by selected background characteristics, 2010
Table (5-5)
57 Percentage of children aged 5-11 years who are involved in child labor by involvement in economic activity during the past week, according to selected background characteristics, 2010
Table (5-6)
59 Percentage of children 12-17 years who were exposed to physical or Psychological violence from students or teachers during the period of 12 months that preceded July / 2011 on the school by sex and region
Table (5-7)
59 Percentage of children 12-17 years who were exposed to a form of violence at least for one time by one of the parents during the period of 12 months that preceded July / 2011 by region
Table (5-8)

List of Figures
Page Figure Chapter One: Demographic Status
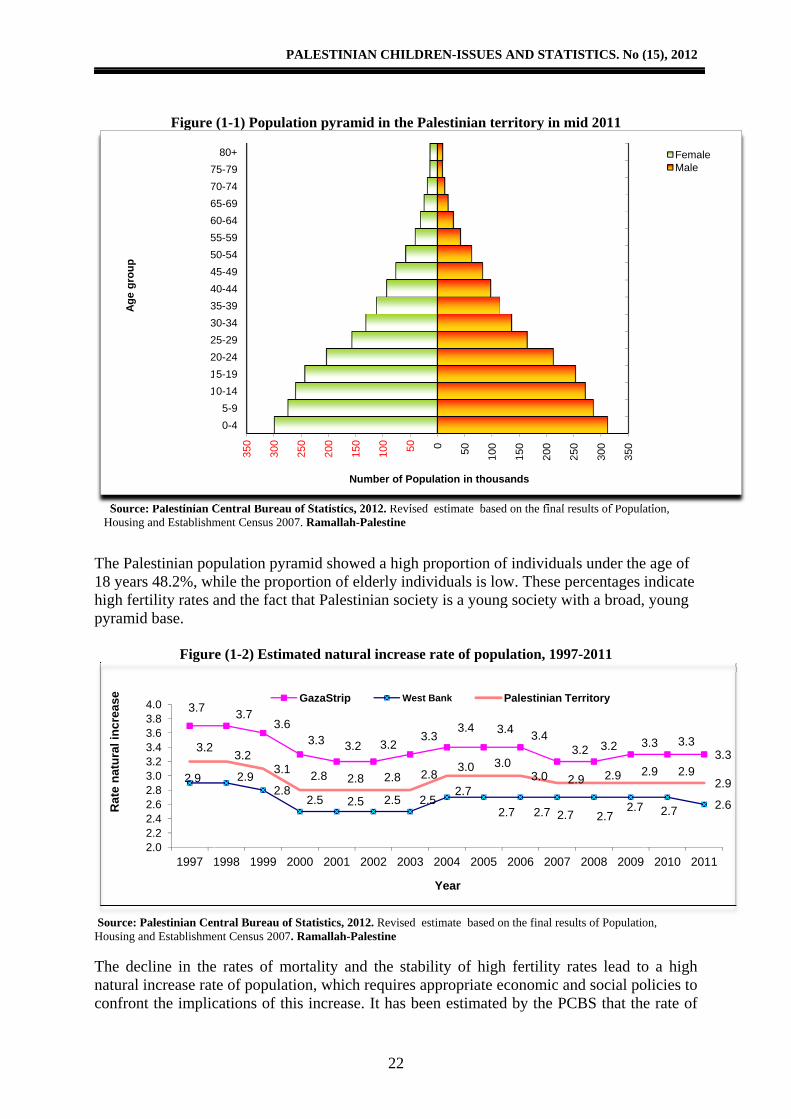
22 Population pyramid in the Palestinian Territory, mid 2011 Figure (1-1)
22 Estimated natural increase rate of population, 1997-2011 Figure (1-2)
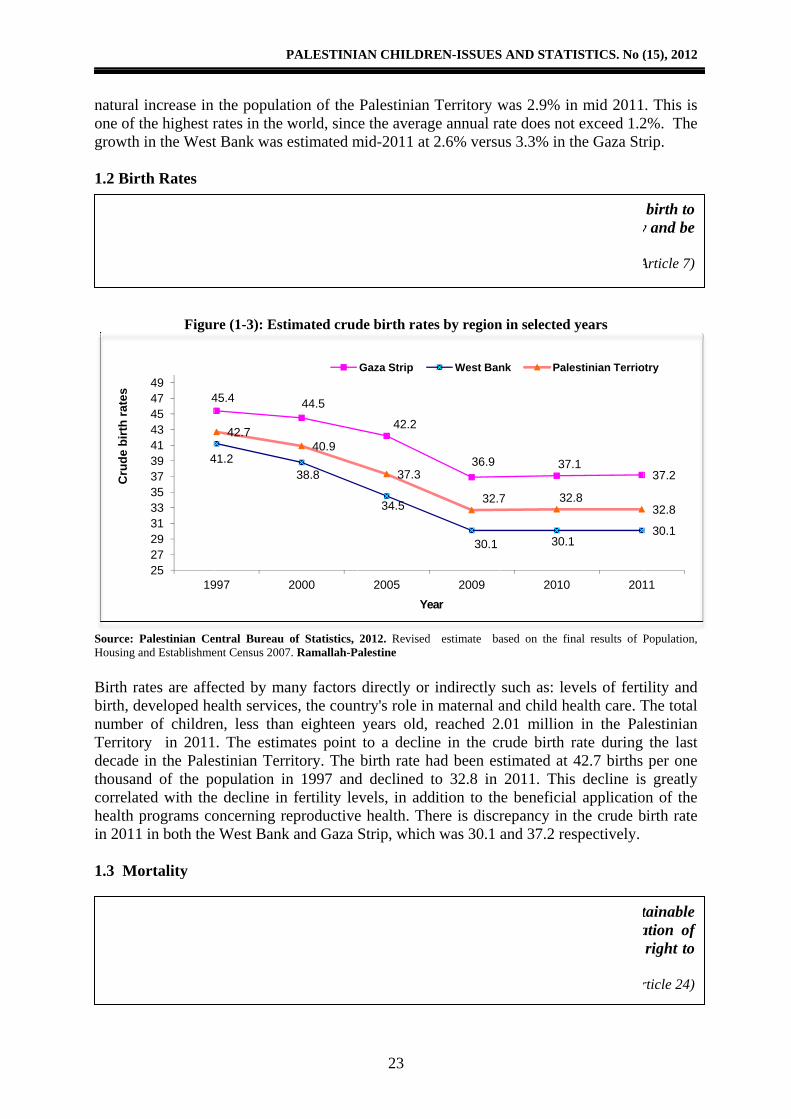
23 Estimated crude birth rates by region, Selected Years Figure (1-3)
24 Estimated crude mortality rates by region, Selected Years Figure (1-4)
Chapter Two: Health Status 28 Prevalence of stunting among children under five by
region, 2000-2010 Figure (2-1)
29 Prevalence of underweight among children under five by region, 2000-2010
Figure (2-2)
30 Infant mortality rates by region in 2006, 2010 Figure (2-3)
31 Under five child mortality rates by region in 2006, 2010 Figure (2-4)
32 Percentage of deliveries occurred at health institutions by region, 2000-2010
Figure (2-5)
34 Percentage of children under five who had diarrhea by region, 2006, 2010
Figure (2-6)
35 Percentage of children under five infected of diarrhea and or respiratory infections by sex, 2010
Figure (2-7)
Chapter Three: Educational Status
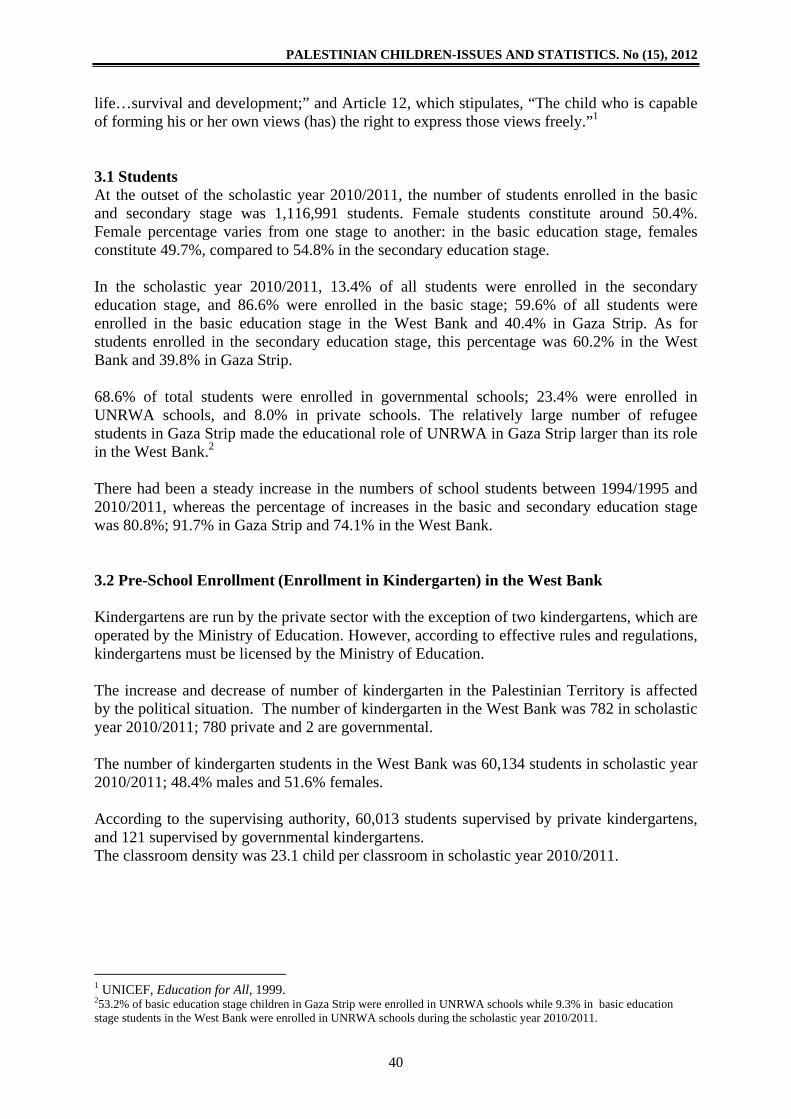
42 Repetition rate in the basic stage by region and selected scholastic years
Figure (3-1)
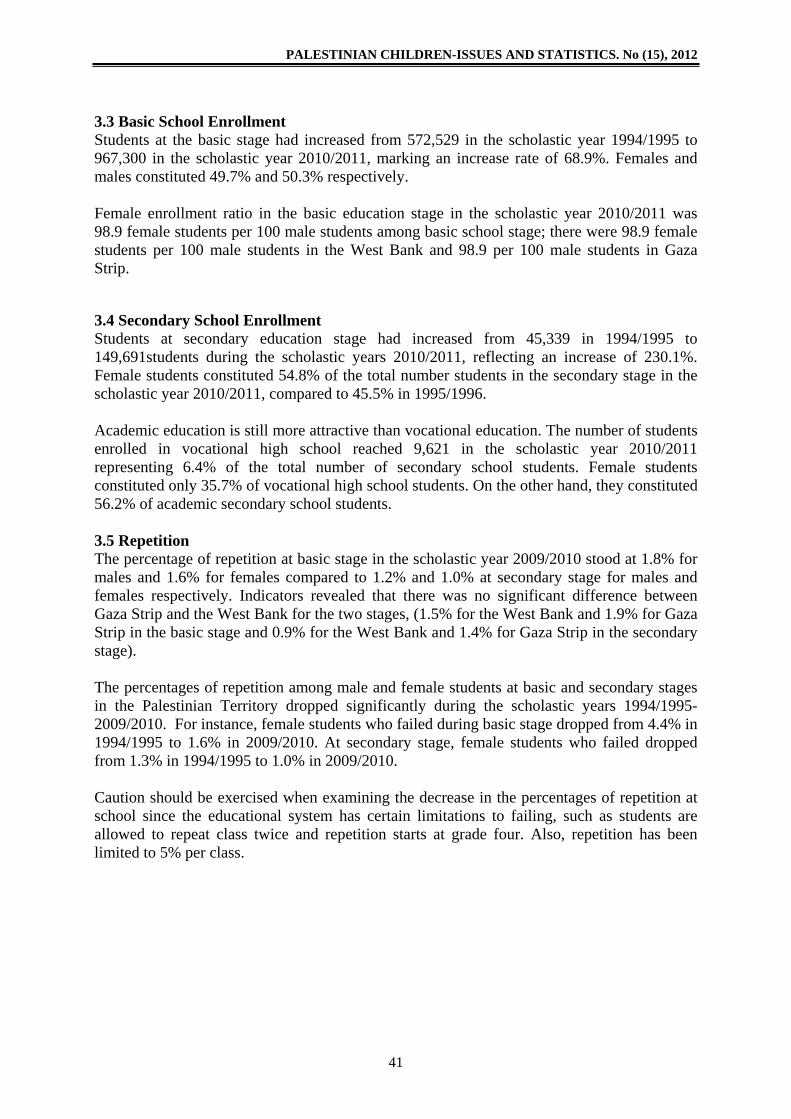
42 Repetition rate in the secondary stage by region and selected scholastic Years
Figure (3-2)
43 Drop-out rates in the basic stage by region and selected scholastic years
Figure (3-3)
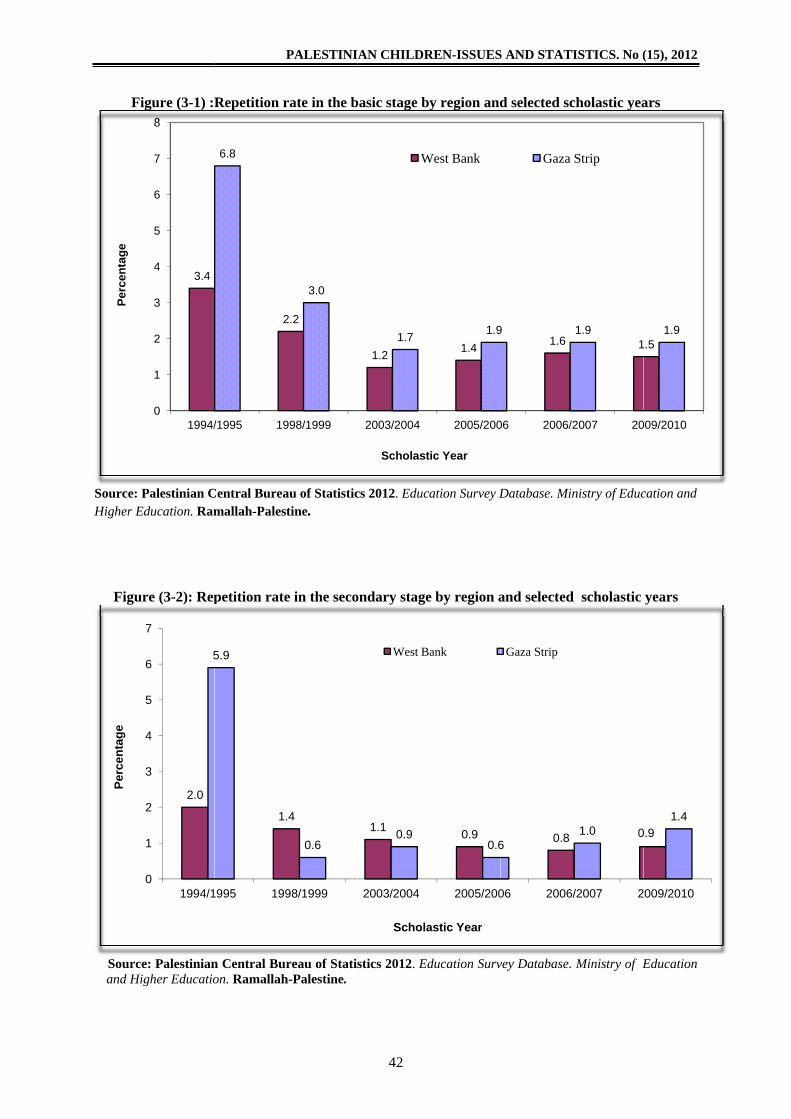
44 Drop-out rates in the secondary stage by region selected scholastic years
Figure (3-4)
45 Students per class by stage and selected scholastic years Figure (3-5) Chapter Foure: Child Cultural and Recreational Status
50 Percentage distribution of children (aged 10-17) by use of internet 2006, 2011
Figure (4-1)
51 Percentage of availability of entertaining instruments for households with children below 18 years of age during 2006, 2011
Figure (4-2)
Chapter Five: Children In Need of Special Protection
58 Percentage of children aged 0-59 months left in the care of other children under the age of 10 years or left alone by region, type of locality, 2010
Figure (5-1)
58 Percentage of Children (12-17 years) who exposed to physical violence from the occupation forces during the period of 12 months that preceded July / 2011 by sex and region
Figure (5-2)
Concepts and Definitions
Acute Respiratory Infections (ARI): Acute respiratory infections are the most common illness suffered by children, no matter where they live. ARI are caused by a wide variety of disease agents; these include forms of vaccine-preventable tangent diseases: diphtheria, pertussis and tuberculosis. ARI are traditionally divided into two main categories: those of the upper respiratory tract (the common cold) and those of the lower respiratory tract (primarily pneumonia). The principal transmission factors are high population density, crowded conditions and seasonal changes that favor the spread of disease.
Age at Marriage: The age of the individual in years at the time of his/her actual marriage. Anemia among children: Children aged 6-59 months with a hemoglobin level of less than 11.0 g\dl, according to WHO. Anemia among women: Women aged 15-49 with a hemoglobin level of less than 12.0 g\dl, according to WHO.
Basic Stage: The first ten scholastic years of schooling on which other stages of education depend. Breast feeding: Refers to the method of feeding infants and children and is defined as a child fed breast milk directly from the breast or expressed. Communication disability/difficulty: Inability to exchange information and ideas with others and engage with them through the use of speech, or use signs, or write the information they want to share with others. This may be due to the result of a deficiency in hearing or speech, or lack of intellectual capacity to interpret and understand others. Computer Use: For the purposes of this survey, defined as the basic use of the computer (during the last twelve months), such as opening the computer and files, creating, copying, pasting, and saving files
Crude Birth: Referring to new births, the Crude Birth Rate refers to the number of new births per 1,000 persons in a given year. Crude Death: Referring to deaths among a population in a given period, Crude Death Rate refers to the number of these deaths per 1,000 persons in a given year. Death Causes: A state of illness, infirmity, incidence, or poisoning that directly or indirectly leads to death.
Diarrhea: The passage of loose or liquid stools more frequently than is normal for the individual. Diarrhea may be defined as it is understood by respondents or mothers. The interviewers used the mother’s definition in this survey. Disability/difficulty: Individuals with disabilities include those who have long-term physical, mental, intellectual, or sensory impairments which, in interaction with various barriers, may hinder their full and effective participation in society on an equal basis with others. Domestic violence: Violence is any act or failure to act of a household member against another member in the household for the purpose of causing physical, sexual or psychological abuse, or the threat of physical, sexual or psychological abuse, or generates fear. It also includes the deprivation of basic rights such as shelter, food, drink, clothing, education, freedom of movement and loss of self-determination and self security. Economic Activity: Economic activity refers to the main activity of the establishment in which the employed person works or the kind of work done previously for unemployed ever worked person.
E-mail: A means for the exchange of messages, texts, and attached files among Internet or intranet users. Employed Child: The child performing a certain work for the other in return for a wage or for him / herself, or unpaid family work. Employer: A person who works in an establishment that is totally or partially belonging to him/ her and hires or supervises the work of one or more waged employees. This includes persons operating their projects or contracting companies provided that they employ a minimum of one waged employee. Shareholders are not considered employers even if they are working in it. Governmental Schools: Any educational institution run by Ministry of Education and Higher Education (MOEHE) or any other ministry or governmental instrument. Growth Rate: The average increase or decrease in the number of population during a certain year, due to natural increase and net migration. It is expressed by a percentage of the base population.
Health: Many definitions exist. As defined by the World Health Organization: “A state of complete physical, mental and social well-being and not merely the absence of disease or infirmity”.
Hearing disability/difficulty: The question determines individuals who have some hearing difficulties that contribute to the reduction of their ability to perform any part and aspect of their day, such as difficulty
hearing someone talking in a busy place or with noise, or cannot hear someone speak directly and at normal volume (without shouting or higher volume), and determine whether they are unable to hear with one ear or both. Height for Age: This parameter reflects the achieved linear growth and its deficit. indicates long-term cumulative inadequacies of health or nutrition. Two related terms are used when describing this parameter: length and stature. Length is the measurement while in a recumbent position and is used for children under 2 years of age, while stature refers to standing height. For simplification, the term height is used for both measurements in this report. Low height for age (below –2SD of the NCHS/WHO reference) ranges from 5 to 65% among less-developed countries. In low prevalence countries, it is most likely due to normal variation, i.e. shortness: in less-developed countries it is likely to be due to a pathological process, resulting in stunting. A pathological process can be from the past or a continuous process. Infant Mortality: Refers to infant deaths (infants who are less than a year old), the infant mortality rate refers to the number of infant deaths in a given year per 1,000 live births during the year. Internet Use: For the purposes of this survey, defined as the basic uses of the Internet (during the last twelve months), such as access to certain sites, reading newsletters, and downloading files or programs from the Web.
Kindergarten: Any educational institution licensed by MOEHE offering education to four or five year olds. Kindergarten consists of the first and second grades.
Learning disability/difficulty: Inability to understand things or deal with others. It includes difficulty with intellectual functions due to a condition such as an acquired brain injury, Downs Syndrome, brain damage at birth, difficulty with interpersonal skills due to any condition such as autistic spectrum disorders, or difficulty in learning everyday skills such as reading, writing, and using simple equipment. Malnutrition: Malnutrition means “badly nourished” but it is more than a measure of what we eat or fail to eat. Clinically, malnutrition is characterized by an inadequate intake of protein, energy and micronutrients and by frequent infections or disease. Nutritional status is the result of the complex interaction between the food we eat, our overall state of health and the environment in which we live – in short, food, health and caring, the three “pillars of well-being”. Mental disability/difficulty: Individuals who suffer from stress, anxiety, uncertainty, and depression, as well as those with difficulties performing daily activities because of drug or alcohol abuse and addiction. Mobility disability/difficulty: Individuals who have difficulties to navigate and walk on foot, which may limit or not the performance of daily activities. For example, may find it difficult to walk a short distance, or a problem going up and down stairs or uneven terrain, or cannot walk any distance without a break or stop, or cannot walk without relying on a stick, or crutch, or walking device, or cannot stand on their feet for more than a minute and need a wheelchair for movement from
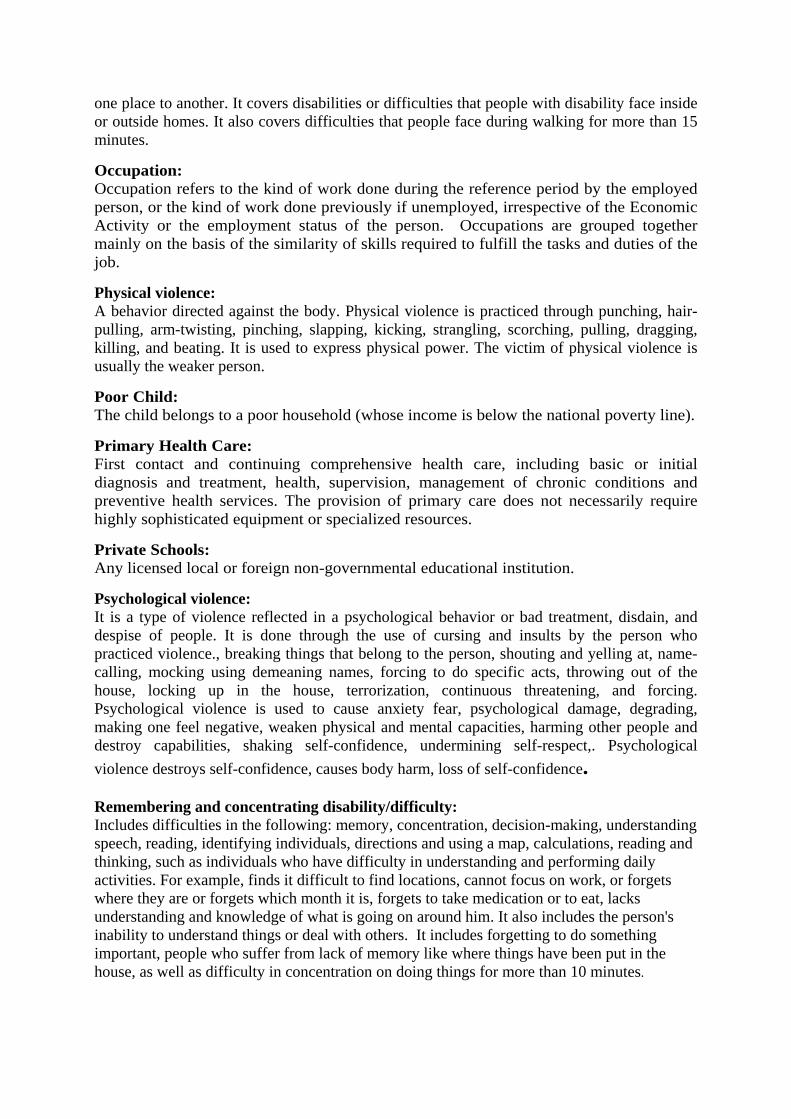
one place to another. It covers disabilities or difficulties that people with disability face inside or outside homes. It also covers difficulties that people face during walking for more than 15 minutes. Occupation: Occupation refers to the kind of work done during the reference period by the employed person, or the kind of work done previously if unemployed, irrespective of the Economic Activity or the employment status of the person. Occupations are grouped together mainly on the basis of the similarity of skills required to fulfill the tasks and duties of the job. Physical violence: A behavior directed against the body. Physical violence is practiced through punching, hair-pulling, arm-twisting, pinching, slapping, kicking, strangling, scorching, pulling, dragging, killing, and beating. It is used to express physical power. The victim of physical violence is usually the weaker person. Poor Child: The child belongs to a poor household (whose income is below the national poverty line).
Primary Health Care: First contact and continuing comprehensive health care, including basic or initial diagnosis and treatment, health, supervision, management of chronic conditions and preventive health services. The provision of primary care does not necessarily require highly sophisticated equipment or specialized resources. Private Schools: Any licensed local or foreign non-governmental educational institution. Psychological violence: It is a type of violence reflected in a psychological behavior or bad treatment, disdain, and despise of people. It is done through the use of cursing and insults by the person who practiced violence., breaking things that belong to the person, shouting and yelling at, name-calling, mocking using demeaning names, forcing to do specific acts, throwing out of the house, locking up in the house, terrorization, continuous threatening, and forcing. Psychological violence is used to cause anxiety fear, psychological damage, degrading, making one feel negative, weaken physical and mental capacities, harming other people and destroy capabilities, shaking self-confidence, undermining self-respect,. Psychological violence destroys self-confidence, causes body harm, loss of self-confidence. Remembering and concentrating disability/difficulty: Includes difficulties in the following: memory, concentration, decision-making, understanding speech, reading, identifying individuals, directions and using a map, calculations, reading and thinking, such as individuals who have difficulty in understanding and performing daily activities. For example, finds it difficult to find locations, cannot focus on work, or forgets where they are or forgets which month it is, forgets to take medication or to eat, lacks understanding and knowledge of what is going on around him. It also includes the person's inability to understand things or deal with others. It includes forgetting to do something important, people who suffer from lack of memory like where things have been put in the house, as well as difficulty in concentration on doing things for more than 10 minutes.

Repeater: A student who fails one or more subjects and therefore is not promoted to the following grade. Satellite: A satellite stationed in geosynchronous orbit that acts as a microwave relay station, receiving signals sent from a ground-based station, amplifying them, and retransmitting them on a different frequency to another ground-based station. Satellites can be used for high-speed transmission of computer data. School : Any educational institution excluding kindergartens, regardless of students’ number and grade structure. Secondary Stage: The stage consists of two scholastic years following the basic stage. that is, years 11 and 12 of schooling.
Seeing disability/difficulty: Individuals who have some difficulties in vision that limits their ability to perform their daily duties, for example, may not be able to read, or see road signs while driving a car, may not be able to see well with one eye, or tunnel vision, or problem with vision that they perceive to be a problem. All individuals are asked whether they wear glasses or not, and must be reminded to wear glasses or contact lenses. Self_Employed: A person who works in an establishment that is totally or partially belonging to him/her (partner) and who does not hire any wage employees. This includes self employed persons who are outside establishments. Student/Pupil: Any one attends an educational institution. Suspected Pneumonia: Children aged 0-59 months who suffer from coughing during the two weeks preceding the survey, who are short of breath or have difficulty breathing due to a problem in the chest or in both the chest and a blocked nose.
Teacher: A person with specialized qualification who is responsible for teaching students at an educational institution. Total Fertility Rate: The average number of children that would be born alive to a woman (or group of women) during her life time if she were to pass through her childbearing years conforming to the age-specific fertility rates of a given year. The sum of age specific fertility rates multiplied by 5.
Under-5 Mortality: The probability of dying between birth and the fifth birthday (per 1,000 live births). Unemployment: Underemployment exists when a person’s employment is inadequate in relation to alternative employment, account being taken of his/her occupational skills. The
underemployed persons are classified into two groups(1) Visible Underemployment:which refers to insufficient volume of employment: Persons worked less than 35 hours during the reference week or worked less than the normal hours of work in their occupation were considered as visibly underemployed; and (2) Invisible Underemployment: refers to a misapplication of labour resources or fundamental imbalance as between labour and other factors of production, such as insufficient income. UNRWA Schools: Any school run or supervised by UNRWA. Wage Employee (Paid- Employee): A person who works for a public or private employer or under its supervision and receives remuneration in wage, salary, commission, tips, piece rates or in kind …etc. This item includes persons employed in governmental, non _ governmental and private institutions along with those employed in a household enterprise in return for a specific remuneration. Weight for Age: This parameter is influenced by both the height and weight of the child. It reflects the long and short-term health of an individual or population. Lightness and underweight have been used to describe normal and pathological processes. High weight for age is not used to describe obesity.
PALESTINIAN CHILDREN-ISSUES AND STATISTICS. No (15), 2012
21
Chapter One
Demographic Status Children are an important sector in the society, and a major asset for future community Childhood is an important stage when the future life of a child is defined, so it has prompted many states to ensure that children are provided care for their integrated balanced growth in all aspects of mental, psychological and social health. The Convention on the Rights of the Child, adopted by United Nations General Assembly in 1989, constitutes the highest standard of attention to children, since this declaration includes a number of principles aimed at providing guarantees for survival, development and protection of children. The implementation of this convention requires a supportive environment to meet and cater for the rights of the child that is rich with incentives to encourage decision and policy makers, and all workers in the childhood sector, to work for achieving the goals of the declaration. The environment surrounding children is a key element in the evolution and development of the child's physical, mental, and psychological development, and affects the circumstances surrounding the way the child is raised, including the formation of ideas and beliefs, perceptions and attitudes towards the core issues relating to his life. This chapter presents the basic statistics about the environment surrounding the Palestinian child in the Palestinian Territory, including the demographic composition of the population as well as the social and environmental status in which a Palestinian child lives. 1.1 Growth Rate The study of age and gender contributes to understanding the demographic changes. The data showed that the population in the Palestinian Territory in mid 2011, is 4.17 million of whom 2.58 million are in the West Bank; 61.9%, and 1.59 million people in Gaza Strip; 38.1% in 2011.
A child means every human being under the age of eighteen years unless, under the law applicable to the child, majority is attained earlier. (Convention on the Rights of the Child,, Article 1)
SourceHousing
The Pal18 yearshigh ferpyramid
Source: PHousing a The decnatural confron
Age
grou
p
Rat
e na
tura
l inc
reas
e Figure
e: Palestinian Cg and Establishm
lestinian pops 48.2%, whrtility rates ad base.
Figur
Palestinian Cenand Establishme
cline in theincrease rat
nt the implic
77665544332211
3.7
2.9
3.2
2.02.22.42.62.83.03.23.43.63.84.0
1997
(1-1) Popul
Central Bureaument Census 20
pulation pyrhile the propand the fact
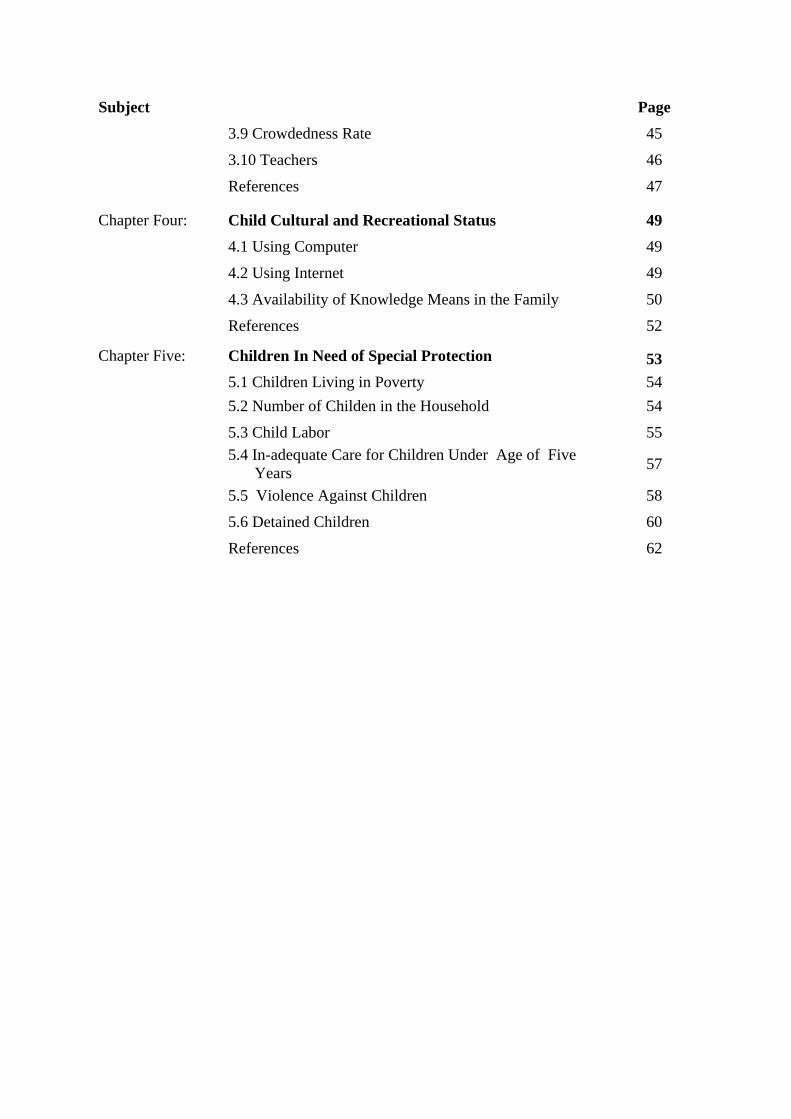
e (1-2) Estim
ntral Bureau oent Census 2007
e rates of mte of populacations of th
350
300
+8079 -7574 -7069 -6564 -6059 -5554 -5049 -4544 -4039 -3534 -3029 -2524 -2019 -514 -0
9 -54 -0
3.73.6
2.92.8
3.23.1
1998 1999
PALESTINI
ation pyram
u of Statistics, 007. Ramallah-
ramid showportion of et that Palest
mated natur
of Statistics, 207. Ramallah-P
mortality anation, whichhis increase
250
200
150
N
63.3 3.2
82.5 2.
1 2.8 2.
2000 2001
GazaStrip
AN CHILDR
22
mid in the Pa
2012. Revised -Palestine
wed a high pelderly indivinian societ
ral increase
012. Revised esalestine
nd the stabih requires ape. It has bee
150
100 50
umber of Popu
2 3.23.
5 2.5 2.
8 2.8 2.
2002 2003
West
REN-ISSUES
alestinian te
estimate base
proportion oviduals is loty is a young
rate of popu
stimate based o
ility of highppropriate een estimated
0 50
100
ulation in thous
.33.4 3
52.7
2
.8 3.0 3
2004 2005
Year
Bank
S AND STAT
erritory in m
ed on the final re
of individuaow. These pg society w
ulation, 1997
on the final resu
h fertility reconomic and by the PC
150
200
250
sands
3.4 3.4
2.7 2.7 2.7
.03.0 2
2006 2007
Palestinian Te
TISTICS. No (
mid 2011
esults of Popula
ls under thepercentages with a broad,
7-2011
ults of Populatio
rates lead tond social poCBS that th
250
300
350
3.2 3.2 3
7 2.72.7
2.9 2.9 2
2008 2009
erritory
(15), 2012
ation,
e age of indicate , young
on,
o a high olicies to e rate of
FemaleMale
3.3 3.3
2.7
2.9 2.9
2010 2011
3.3
2.6
2.9
1
natural one of tgrowth 1.2 Birt
Source: PHousing a Birth rabirth, denumberTerritordecade thousancorrelathealth pin 2011 1.3 Mo
Cru
de b
irth
rate
s
The cha namcared f
State Pstandahealthaccess
increase in the highest rin the West
th Rates
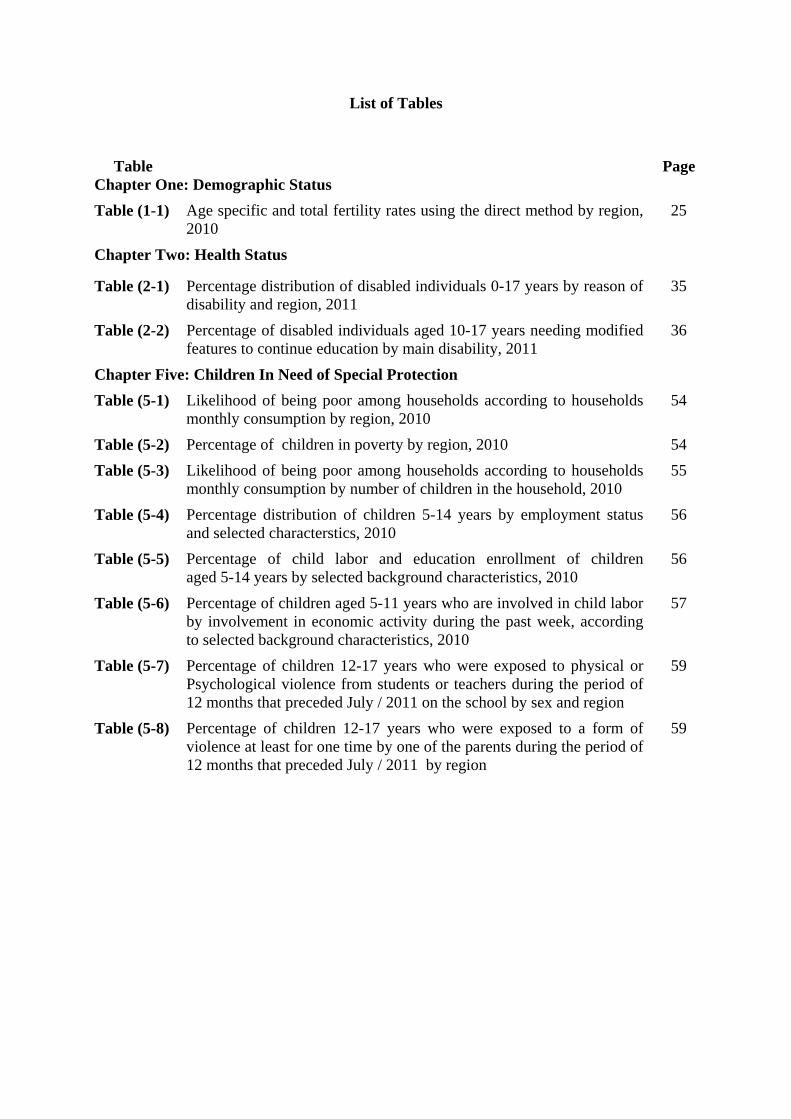
Figur
Palestinian Ceand Establishme
ates are affeeveloped her of childrery in 2011in the Pale
nd of the poted with theprograms co
in both the
ortality
4
4
25272931333537394143454749
19
hild shall bme, the right
for by his o
Parties recard of heah. State Pars to such he
the popularates in the t Bank was
re (1-3): Est
entral Bureau ent Census 2007
ected by maealth serviceen, less than. The estimstinian Terropulation ine decline inoncerning re West Bank
45.4
41.2
42.7
997
e registeredt to acquireor her paren
cognize the lth and to rties shall sealth care s
PALESTINI
ation of the world, sincestimated m
timated crud
of Statistics, 7. Ramallah-P
any factors es, the counn eighteen
mates point ritory. The n 1997 and
n fertility lereproductivek and Gaza
44.5
38.8
40.9
2000
d immediatee a nationalnts.
right of thfacilities f
strive to enservices.
AN CHILDR
23
Palestiniane the averag
mid-2011 at
de birth rate
2012. Revisedalestine
directly orntry's role in
years old, to a declinbirth rate h
d declined evels, in adde health. ThStrip, which
42.2
34.5
37.3
2005Ye
Gaza Strip
ely after birlity and, as f (Con
he child to for the treasure that no (Conv
REN-ISSUES
n Territory wge annual rat 2.6% versu
es by region
d estimate ba
r indirectly n maternal a
reached 2ne in the crhad been esto 32.8 in dition to thhere is discrh was 30.1 a
36.9
30.1
32.7
2009ear
West Ban
rth and shafar as poss
nvention on t
the enjoymatment of o child is d
vention on th
S AND STAT
was 2.9% inate does notus 3.3% in t
n in selected
ased on the fin
such as: levand child he.01 millionrude birth rstimated at 2011. This
he beneficiarepancy in and 37.2 res
37
30.1
7 32
2010
nk Pale
all have the sible, the rig
the Rights of
ment of the illness and
deprived of
e Rights of th
TISTICS. No (
n mid 2011t exceed 1.2the Gaza Str
years
nal results of P
vels of fertealth care. T
n in the Parate during 42.7 births s decline is
al applicatiothe crude bspectively.
.1
1
.8
201
estinian Terrio
right from ght to know
f the Child,, A
highest attd rehabilita
f his or her
he Child,, Ar
(15), 2012
. This is 2%. The rip.
Population,
ility and The total lestinian the last per one
s greatly on of the birth rate
37.2
30.1
32.8
11
otry
birth to w and be
Article 7)
tainable ation of right to
rticle 24)

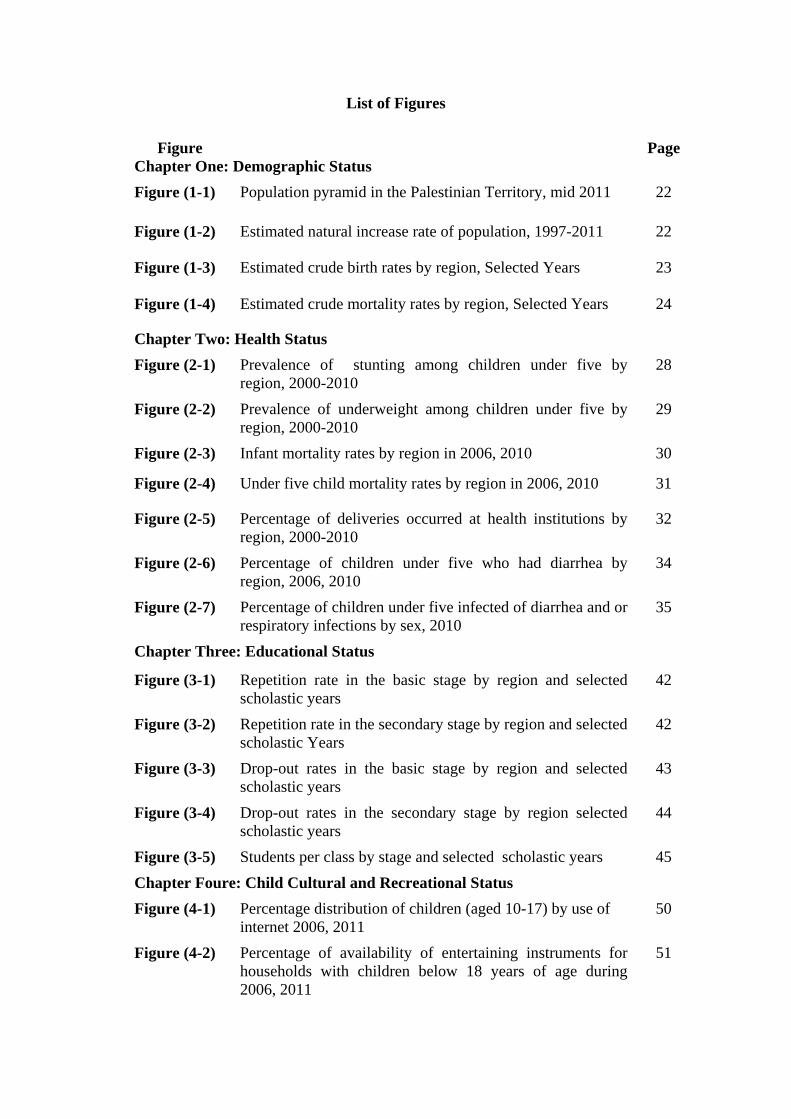
The avacurrent Palestinwhile thStrip. T1997 anestimatethousanreceivinimprove
Source: PHousing a
1.4 EarMarriagthe levewidesprfemalesmedian respectidegree wreflects marriagmales. Of all compare
222334445566
crud
e m
orta
lity
rate
sailable datamortality r
nian Territohere is a di
The estimatend declineded in the G
nd in 2011ng medical ement in he
Figure
Palestinian Cenand Establishme
rly Marriagge in any soel of civilizread phenoms at first m
age at first ively, in 20was 23.7 yethe role of
ge for those
women whed with 0.9%
4.7
5.
4.9
2.02.42.83.23.64.04.44.85.25.66.06.4
199
a point out rates in theory from 4.9ifference ined rate of crd to 4.1 peGaza Strip a. This indiservices, i
alth service
(1-4): Estim
ntral Bureau ofent Census 2007
ge ociety has sozation. Datmenon of e
marriage wamarriage in
10. The meears for femeducation iwho have a
ho got mar% for males
1
7 20
PALESTINI
that the me Arab coun9 per one t
n the crude rude mortalier one thouat 4.7 per oicates imprimprovemenes.
mated crude
f Statistics, 2017. Ramallah-P
ocial and ecta on marriearly marris 18.0 yearn the West
ean age of mmales and 2in reducing a preparato
rried in 201s.
4.3
4.64.5
000
Gaz
AN CHILDR
24
mortality levntries. The thousand inmortality rity in the Wusand in 20one thousanrovement int in healt
mortality r
12. Revised estalestine
conomic dimiage and diage especiars, and 23.Bank was 2
marriage am26.8 years f
early marriry certificat
10, 21.8%
3.9
4.1
4.0
2005
Year
za Strip
REN-ISSUES
vel is relatcrude mort
n 1997 to 4ate for each
West Bank re011; while nd in 1997 in the qualh awarenes
ates by regi
timates based o
mensions asivorce in Wally among0 years for
20.1 and 25mong those wfor males iniage amongte only was
were unde
4.1
4.4
4.3
2009
r
West Bank
S AND STAT
tively low tality rate h
4.0 per one h of the Weached 5.1 pthe crude and decli
lity of lifess among t
on in selecte
on the final resu
s well as dimWest Bank g females. Tr males in .4 years forwho have a
n the West B Palestinian
s 16.9 for fe
er the age
4.0
4.2
4.1
2010
Palestin
TISTICS. No (
compared whas decline thousand i
West Bank anper one thomortality r
ined to 3.9 , opportunthe populat
ed years
ults of Populati
mensions rein 1997 sh
The median1997, whe
r females ana bachelor oBank in 20ns. The meaemales and
of eighteen
3.9
4.14
2011
nian Territory
(15), 2012
with the ed in the in 2011, nd Gaza usand in rate was per one
ities for tion and
on,
eflecting howed a n age of ereas the nd males or higher 10. This
an age of 24.5 for
n years
4.0
PALESTINIAN CHILDREN-ISSUES AND STATISTICS. No (15), 2012
25
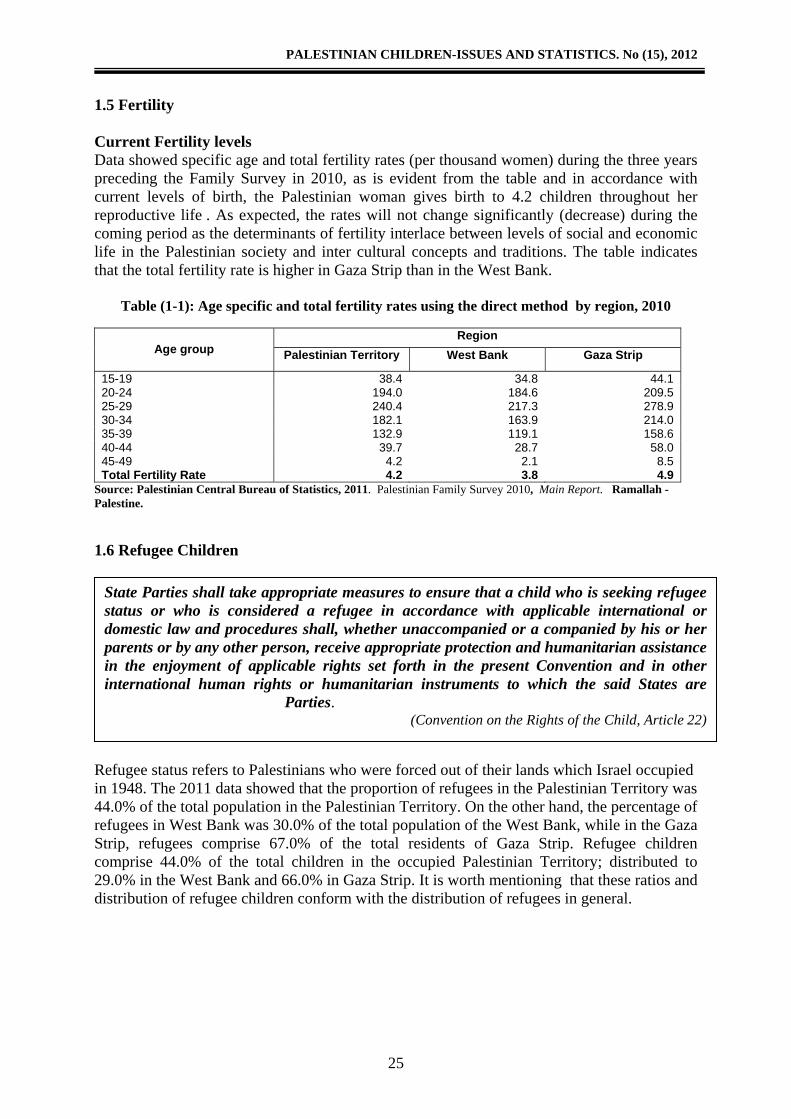
1.5 Fertility Current Fertility levels Data showed specific age and total fertility rates (per thousand women) during the three years preceding the Family Survey in 2010, as is evident from the table and in accordance with current levels of birth, the Palestinian woman gives birth to 4.2 children throughout her reproductive life . As expected, the rates will not change significantly (decrease) during the coming period as the determinants of fertility interlace between levels of social and economic life in the Palestinian society and inter cultural concepts and traditions. The table indicates that the total fertility rate is higher in Gaza Strip than in the West Bank.
Table (1-1): Age specific and total fertility rates using the direct method by region, 2010
Age group
RegionPalestinian Territory West Bank Gaza Strip
15-19 38.4 34.8 44.1 20-24 194.0 184.6 209.5 25-29 240.4 217.3 278.9 30-34 182.1 163.9 214.0 35-39 132.9 119.1 158.6 40-44 39.7 28.7 58.0 45-49 4.2 2.1 8.5 Total Fertility Rate 4.2 3.8 4.9
Source: Palestinian Central Bureau of Statistics, 2011. Palestinian Family Survey 2010, Main Report. Ramallah - Palestine.
1.6 Refugee Children
Refugee status refers to Palestinians who were forced out of their lands which Israel occupied in 1948. The 2011 data showed that the proportion of refugees in the Palestinian Territory was 44.0% of the total population in the Palestinian Territory. On the other hand, the percentage of refugees in West Bank was 30.0% of the total population of the West Bank, while in the Gaza Strip, refugees comprise 67.0% of the total residents of Gaza Strip. Refugee children comprise 44.0% of the total children in the occupied Palestinian Territory; distributed to 29.0% in the West Bank and 66.0% in Gaza Strip. It is worth mentioning that these ratios and distribution of refugee children conform with the distribution of refugees in general.
State Parties shall take appropriate measures to ensure that a child who is seeking refugee status or who is considered a refugee in accordance with applicable international or domestic law and procedures shall, whether unaccompanied or a companied by his or her parents or by any other person, receive appropriate protection and humanitarian assistance in the enjoyment of applicable rights set forth in the present Convention and in other international human rights or humanitarian instruments to which the said States are
Parties. (Convention on the Rights of the Child, Article 22)
PALESTINIAN CHILDREN-ISSUES AND STATISTICS. No (15), 2012
26
References - Palestinian Central Bureau of Statistics, 2011. Palestinian Family Survey 2010, Main
Report. Ramallah - Palestine.
- Palestinian Central Bureau of Statistics, 2012. Data Base, marriages and divorces, 2010. Ramallah-Palestine.
- Palestinian Central Bureau of Statistics, 2012. Revised estimate based on the final results of Population, Housing and Establishment Census 2007. Ramallah-Palestine . - Palestinian Central Bureau of Statistics and Ministry of Social Affairs, 2011. Data
Base, disabled Individuals Survey, 2011, Main Findings Report. Ramallah - Palestine.
PALESTINIAN CHILDREN-ISSUES AND STATISTICS. No (15), 2012
27
Chapter Two
Health Status
Understanding the significance of children is necessary in building the future of any society. The ongoing development of the child renders them the impact of surrounding internal and external factors. All UN international conventions have addressed healthcare for every human, child or adult, as a human right; furthermore, the Convention on the Rights of the Child (CRC), considered to be the universal constitution for child rights, addressed the rights of the child to healthcare. Although the Palestinian National Authority is not a sovereign state, which means that it cannot sign international conventions, it has adopted all aspects of the Convention on the Rights of the Child. The strategy of the National Plan for the Palestinian Child was drafted based on the CRC as a general framework for that strategy. The program focuses on a number of services provided to children, which include areas such as health, education, youth, culture and social affairs. Regarding health, for instance, the program proposes developing the health system to better improve the Palestinian child’s health and to make that system accessible to all children and mothers as well. The program further adopts the principle of strengthening health through schools, clinics and the media. The National Health Plan 1999-2003 addresses the need to improve the quality of health care services for mothers and children at all levels, ensuring equal distribution and optimum access to all levels of care. In addition, it takes into account the Millennium Development Goals, especially those amendments which were added to the fourth and fifth goals, to reduce child mortality by two thirds between 1990 and 2015, and to improve maternal health by reducing maternal mortality by three quarters in the period between 1990 and 2015.
The health status of children can be measured and evaluated through the use of indicators which include infant mortality rate, under five child mortality rate and nutritional status. child’s health status is affected by certain factors or direct determinants (factors associated with age and education of the mother and some other background characteristics at birth) and indirect factors (including social and economic situation of the child's family and the availability of health services in general). 2.1 Malnutrition The second target of the first goal of the MDGs points out to reducing by half the proportion of people who suffer from hunger by improving two key indicators: Prevalence of underweight among children under five years of age and proportion of the population below minimum level of dietary energy consumption.
States Parties recognize the right of the child to the enjoyment of the highest attainable standard of health and to facilities for the treatment of illness and rehabilitation of health. States Parties shall strive to ensure that no child is deprived of his or her right of access to such health care services.
(Convention on the Rights of the Child, Article 24-1)
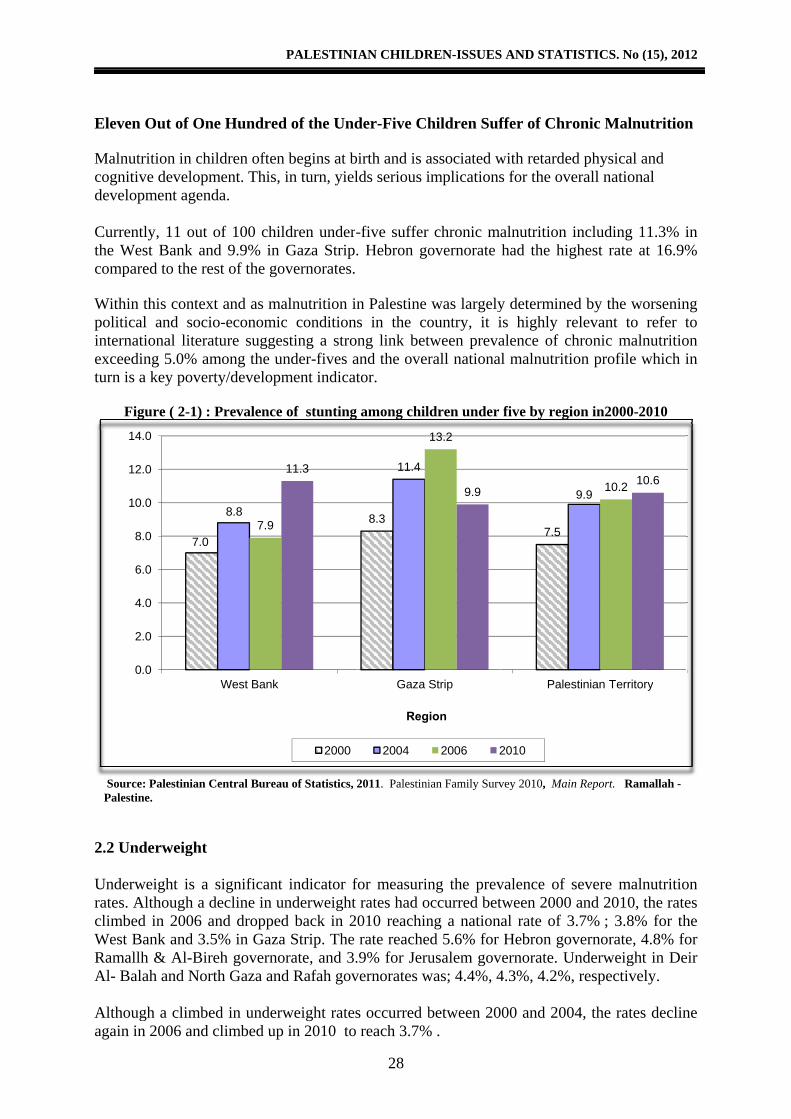
Eleven Malnutrcognitivdevelop Currentthe Wescompare Within politicalinternatexceediturn is a
Fig
SourcePalestin
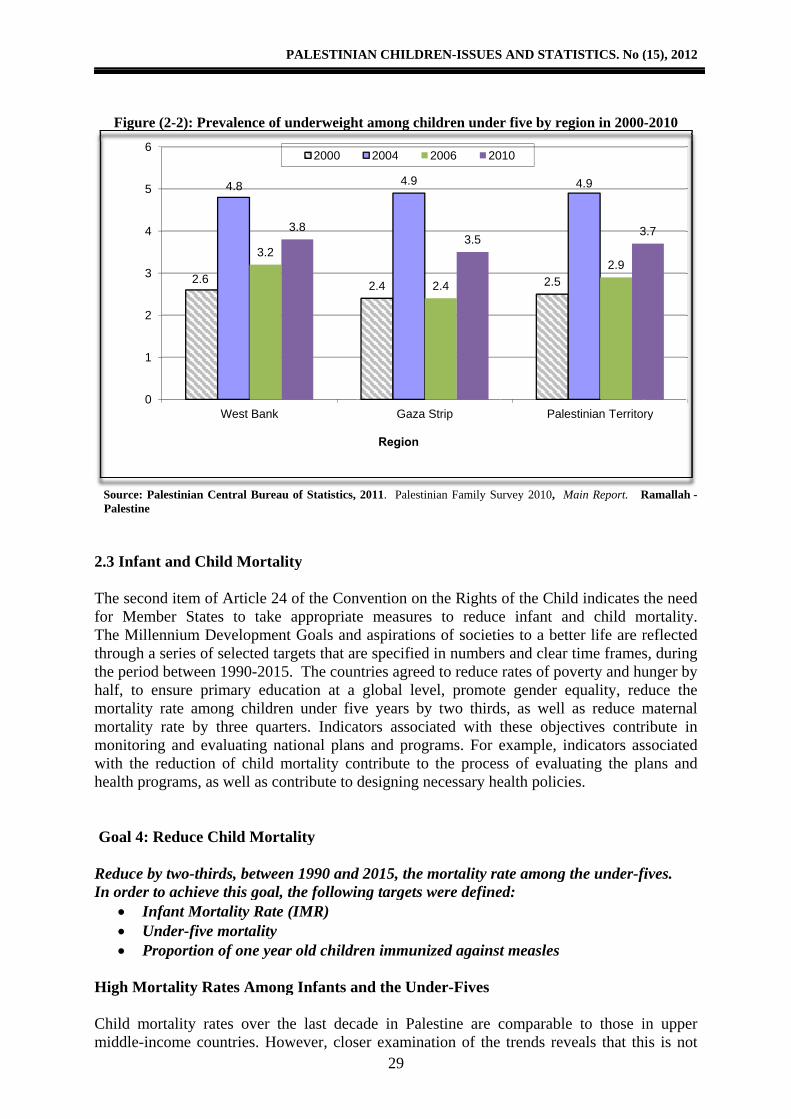
2.2 Und
Underwrates. AclimbedWest BaRamallhAl- Bala Althougagain in
0.
2.
4.
6.
8.
10.
12.
14.
Out of One
rition in chive developmpment agend
tly, 11 out ost Bank anded to the res
this contextl and sociotional literatng 5.0% am
a key povert
gure ( 2-1) :
: Palestinian Cne.
derweight
weight is a Although a dd in 2006 aank and 3.5h & Al-Bireah and Nort
gh a climben 2006 and c
7.0
.0
.0
.0
.0
.0
.0
.0
.0
e Hundred
ildren often ment. This, ida.
of 100 childd 9.9% in Gst of the gov
t and as mao-economicture sugges
mong the unty/developm
Prevalence
Central Bureau
significant decline in unand dropped5% in Gaza eh governorth Gaza and
ed in underwclimbed up
8.87.9
West Bank
PALESTINI
d of the Und
begins at bin turn, yiel
dren under-Gaza Strip.vernorates.
alnutrition inc conditionssting a stronnder-fives ament indicat
of stunting
u of Statistics, 2
indicator fnderweight d back in 2
Strip. The rate, and 3.
d Rafah gov
weight ratesin 2010 to
11.3
2000
AN CHILDR
28
der-Five Ch
irth and is alds serious i
-five suffer . Hebron go
n Palestine s in the cong link bet
and the overtor.
among chil
2011. Palestini
for measurinrates had o010 reachinrate reache9% for Jeru
vernorates w
s occurred breach 3.7%
8.3
11.4
Gaza S
Reg
2004
REN-ISSUES
hildren Suf
associated wimplications
chronic maovernorate
was largelyountry, it itween prevarall nationa
dren under
ian Family Surv
ng the prevoccurred betng a nationed 5.6% for usalem gov
was; 4.4%, 4
between 20% .
13.2
9.9
Strip
ion
2006 2
S AND STAT
ffer of Chr
with retardes for the ove
alnutrition had the hig
y determineis highly realence of ch
al malnutriti
five by regi
vey 2010, Main
valence of stween 2000 al rate of 3Hebron gov
vernorate. U4.3%, 4.2%,
000 and 200
7.5
Pales
2010
TISTICS. No (
onic Malnu
d physical aerall nation
including 1ghest rate a
ed by the woelevant to hronic malnion profile w
ion in2000-2
n Report. Ram
severe malnand 2010,
3.7% ; 3.8%vernorate, 4
Underweight, respective
04, the rates
9.9 10.2 10
stinian Territo
(15), 2012
utrition
and al
11.3% in at 16.9%
orsening refer to
nutrition which in
2010
mallah -
nutrition the rates
% for the 4.8% for t in Deir ly.
s decline
0.6
ry
Figur
Source: Palestin
2.3 Infa The secfor MeThe Mithroughthe perihalf, tomortalitmortalitmonitorwith thehealth p Goal 4
ReduceIn orde
• I• • P
High M Child mmiddle-
re (2-2): Pre
Palestinian Cne
ant and Ch
cond item ofember Statellennium D
h a series of od between ensure prity rate amoty rate by ring and eve reduction
programs, as
: Reduce C
e by two-thirr to achieveInfant MorUnder-five Proportion
Mortality Ra
mortality ra-income cou
2.6
0
1
2
3
4
5
6
evalence of u
Central Bureau
ild Mortali
f Article 24es to take
Developmenf selected tarn 1990-2015imary educong childrenthree quart
valuating nan of child ms well as co
Child Morta
rds, betweene this goal, rtality Rate mortality of one year
ates Amon
ates over thuntries. How
4.8
3.2
West Bank
PALESTINI
underweigh
u of Statistics,
ity
4 of the Conappropriate
nt Goals andrgets that ar5. The councation at a n under fivters. Indicaational planmortality coontribute to d
ality
n 1990 andthe followin(IMR)
r old childr
g Infants a
he last decawever, clos
3.8
2000
AN CHILDR
29
ht among chi
2011. Palestin
nvention on e measuresd aspirationre specifiedntries agreed
global levve years byators associns and progontribute to designing n
d 2015, the ming targets w
ren immuni
and the Und
ade in Paleser examina
2.4
4.9
Gaza S
Region
2004
REN-ISSUES
ildren under
nian Family Su
the Rights s to reduce
ns of societid in numbersd to reduce
vel, promotey two thirdated with trams. For ethe proces
necessary he
mortality rawere define
ized against
der-Fives
estine are cation of the
2.4
3.5
Strip
2006 20
S AND STAT
r five by reg
urvey 2010, M
of the Childe infant anies to a betts and clear trates of pove gender es, as well these objecexample, inss of evaluaealth policie
ate among ted:
t measles
comparabletrends reve
2.5
Pales
010
TISTICS. No (
gion in 2000
Main Report. R
d indicates nd child mter life are rtime framesverty and huquality, redas reduce m
ctives contrndicators asating the ples.
the under-f
e to those ieals that th
4.9
2.9
3
stinian Territo
(15), 2012
-2010
Ramallah -
the need mortality. reflected s, during unger by duce the maternal ribute in ssociated lans and
fives.
in upper his is not
3.7
ry
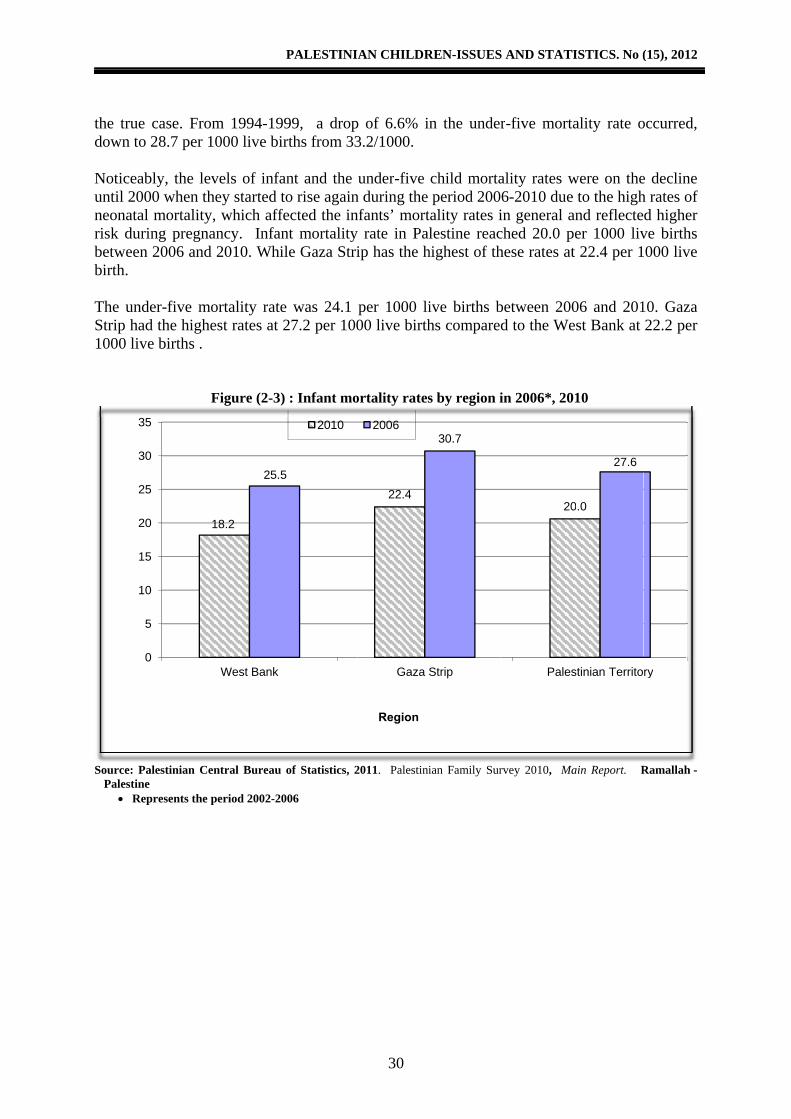
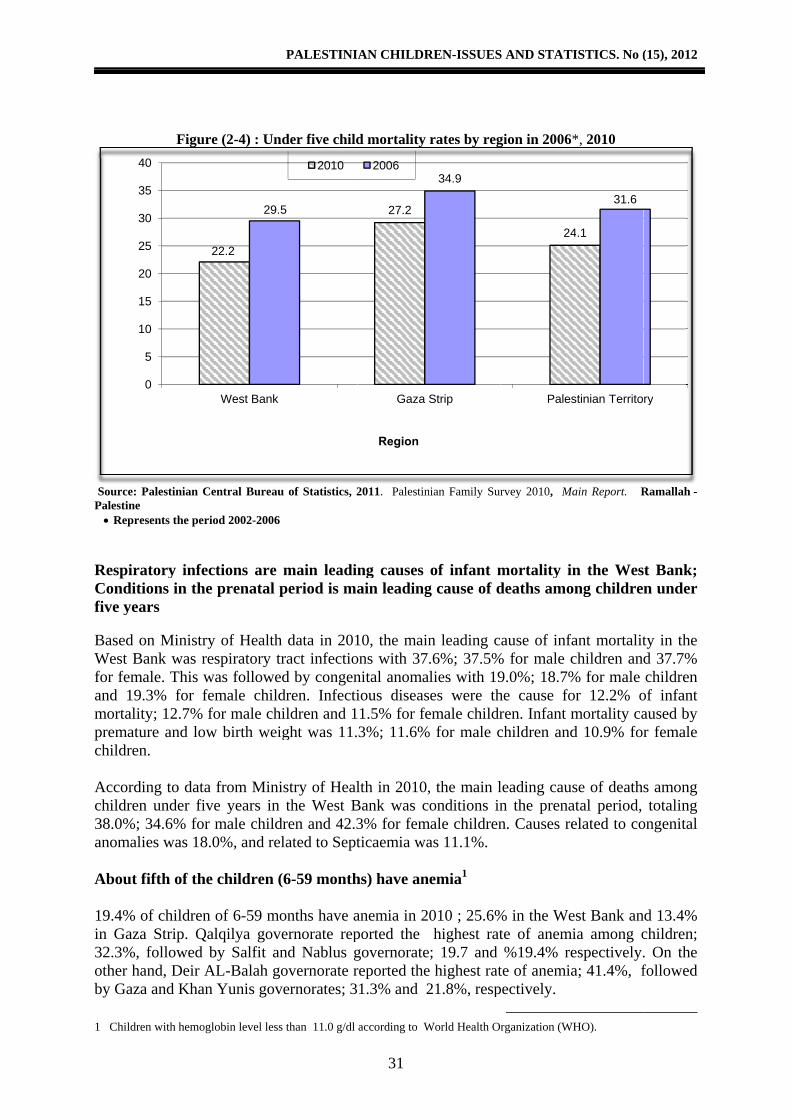
the truedown to Noticeauntil 20neonatarisk durbetweenbirth. The undStrip ha1000 liv
Source: PPalestin
• Re
1
1
2
2
3
3
e case. Fromo 28.7 per 1
ably, the lev000 when thal mortality,ring pregnan 2006 and
der-five moad the higheve births .
F
Palestinian Cenne epresents the p
1
0
5
0
5
20
25
30
35
m 1994-199000 live bir
vels of infahey started to, which affeancy. Infan2010. Whil
ortality rateest rates at 2
Figure (2-3)
ntral Bureau
period 2002-20
18.2
25.5
West Bank
PALESTINI
99, a droprths from 33
nt and the o rise againected the innt mortalityle Gaza Stri
e was 24.1 27.2 per 100
: Infant mo
of Statistics, 2
006
5
2010
AN CHILDR
30
p of 6.6% i3.2/1000.
under-five n during the nfants’ morty rate in Paip has the h
per 1000 li00 live birth
ortality rates
2011. Palestini
22.4
Gaza S
Region
2006
REN-ISSUES
n the under
child mortaperiod 200
tality rates ilestine reac
highest of th
ive births bhs compare
s by region i
ian Family Sur
30.7
Strip
S AND STAT
r-five mort
ality rates w6-2010 duein general ached 20.0 phese rates at
between 200d to the We
in 2006*, 20
rvey 2010, Ma
20
Pales
TISTICS. No (
tality rate o
were on thee to the highand reflecteper 1000 livt 22.4 per 1
06 and 201est Bank at
010
Main Report. R
0.0
27.6
stinian Territo
(15), 2012
occurred,
e decline h rates of d higher ve births 000 live
10. Gaza 22.2 per
Ramallah -
ry
Source: PPalestine • Repre
RespiraConditifive yea Based oWest Bfor femand 19.mortalitprematuchildren Accordichildren38.0%; anomali About f 19.4% oin Gaza32.3%, other haby Gaza
1 Childre
1
1
2
2
3
3
4
Figure
Palestinian Ce
esents the perio
atory infecions in the ars
on Ministryank was reale. This w.3% for fety; 12.7% foure and lown.
ing to data n under five34.6% for ies was 18.0
fifth of the
of children a Strip. Qalfollowed b
and, Deir Aa and Khan
en with hemogl
2
0
5
0
5
20
25
30
35
40
e (2-4) : Und
entral Bureau
od 2002-2006
ctions are mprenatal p
y of Health spiratory tras followedmale childror male chi
w birth weig
from Minise years in tmale childr0%, and rela
children (6
of 6-59 molqilya gove
by Salfit anAL-Balah go
Yunis gove
obin level less
22.2
29.5
West Bank
PALESTINI
der five child
of Statistics, 2
main leadinperiod is ma
data in 201ract infectiod by congenren. Infectildren and 1
ght was 11.
stry of Healthe West Bren and 42.3ated to Sept
6-59 month
onths have aernorate repnd Nablus governorate rernorates; 3
than 11.0 g/dl
5
2010
AN CHILDR
31
d mortality
2011. Palestin
ng causes ain leading
10, the mainons with 37nital anomaious diseas1.5% for fe3%; 11.6%
lth in 2010,Bank was c3% for femticaemia wa
hs) have an
anemia in 2ported the governoratereported the1.3% and 2
according to W
27.2
Gaza S
Region
2006
REN-ISSUES
rates by reg
nian Family Sur
of infant mg cause of d
n leading c.6%; 37.5%lies with 19
ses were themale childr
% for male c
, the main londitions in
male childrenas 11.1%.
emia1
010 ; 25.6%highest rat
; 19.7 and e highest rat21.8%, resp
World Health O
34.9
Strip
S AND STAT
gion in 2006
rvey 2010, M
mortality ideaths amo
ause of infa% for male c9.0%; 18.7%he cause foren. Infant mchildren and
leading caun the prenan. Causes re
% in the Wete of anem%19.4% re
te of anemiapectively.
rganization (W
24
Pales
TISTICS. No (
*, 2010
Main Report. R
n the Wesong childre
fant mortalitchildren and% for male or 12.2% omortality cad 10.9% for
se of deathatal period, elated to co
est Bank anmia among c
espectively.a; 41.4%, f
WHO).
4.1
31.6
stinian Territo
(15), 2012
Ramallah -
t Bank; n under
ty in the d 37.7% children
of infant aused by r female
s among totaling
ongenital
nd 13.4% children; . On the followed
ry
2.4 Diff Goal 5: Reducefollowin
- m- p
High co
The dattheir preDespiteneeds fu
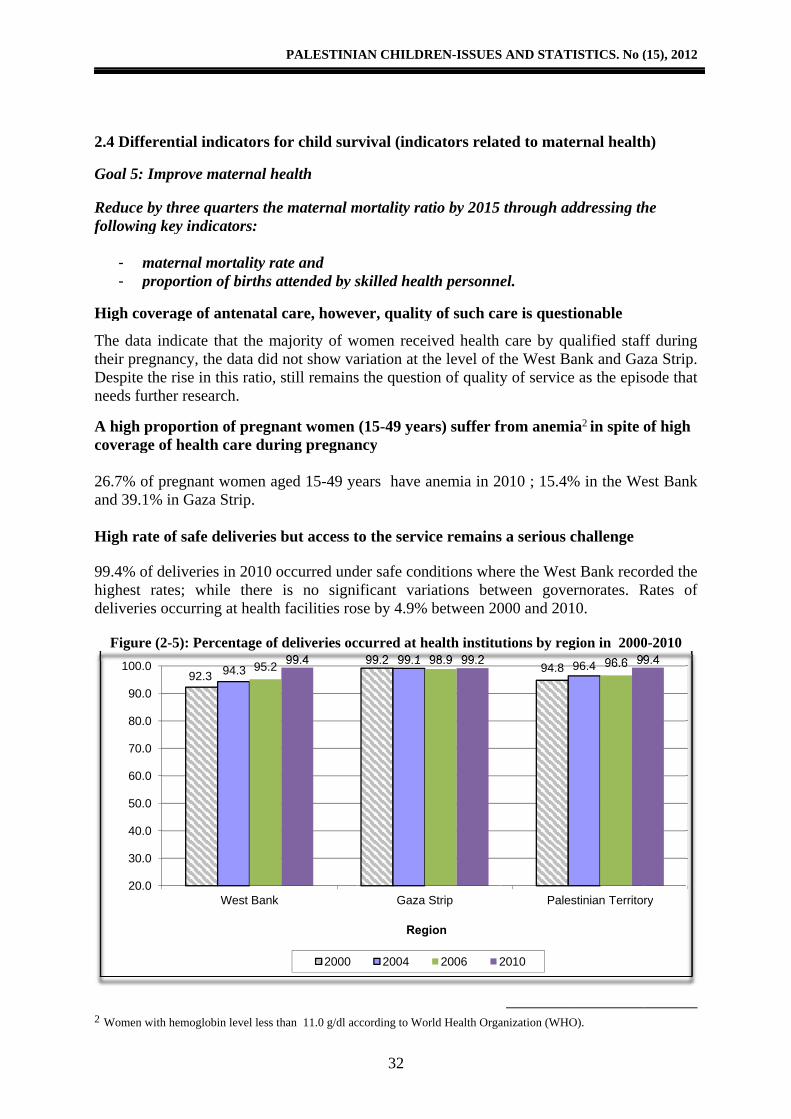
A high coverag 26.7% oand 39. High ra 99.4% ohighest deliveri
Figur
2 Women
20.
30.
40.
50.
60.
70.
80.
90.
100.
ferential in
Improve m
e by three qung key indic
maternal mproportion
overage of a
ta indicate tegnancy, th the rise in urther resea
proportionge of health
of pregnant 1% in Gaza
ate of safe d
of deliveriesrates; wh
es occurring
re (2-5): Per
with hemoglob
92.3
.0
.0
.0
.0
.0
.0
.0
.0
.0
dicators fo
maternal he
uarters the cators:
mortality ratof births at
antenatal c
that the mahe data did n
this ratio, sarch.
n of pregnah care durin
women aga Strip.
deliveries b
s in 2010 ocile there ig at health f
rcentage of d
bin level less th
94.3 95.2
West Bank
PALESTINI
or child sur
ealth
maternal m
te and ttended by s
care, howev
ajority of wnot show vatill remains
ant women ng pregnan
ed 15-49 ye
but access t
ccurred undis no signifacilities ro
deliveries oc
an 11.0 g/dl ac
99.4
2000
AN CHILDR
32
rvival (indic
mortality rat
skilled heal
ver, quality
women receiariation at ths the questio
(15-49 yearncy
ears have a
to the servi
der safe conificant varise by 4.9%
ccurred at he
ccording to Wor
99.2 99.1
Gaza S
Reg
2004
REN-ISSUES
cators relat
tio by 2015
lth personne
y of such ca
ived health he level of ton of quality
rs) suffer f
anemia in 2
ce remains
ditions wheiations betwbetween 20
ealth institu
rld Health Orga
98.9 99.2
Strip
ion
2006 2
S AND STAT
ted to mate
through ad
el.
are is quest
care by quthe West Bay of service
from anemi
010 ; 15.4%
s a serious c
ere the Westween gove000 and 201
utions by reg
anization (WHO
94.8
Pales
2010
TISTICS. No (
ernal health
ddressing th
tionable
ualified stafank and Gae as the epis
ia2 in spite
% in the We
challenge
t Bank recoernorates. R10.
gion in 2000
O).
96.4 96.6 99
stinian Territo
(15), 2012
h)
he
ff during aza Strip. sode that
of high
est Bank
orded the Rates of
0-2010
9.4
ry
PALESTINIAN CHILDREN-ISSUES AND STATISTICS. No (15), 2012
33
Source: Palestinian Central Bureau of Statistics, 2011. Palestinian Family Survey 2010, Main Report. Ramallah - Palestine Tubas governorate has the highest percentage of unsafe deliveries with 2.0% of deliveries occurred under questionable conditions at home or on the way to hospital, followed by Qalqiliya governorate1.4%. 2.5 Breast Feeding Trends
To ensure that all segments of society, in particular parents and children, are informed, have access to education and are supported in the use of basic knowledge of child health and nutrition, the advantages of breastfeeding, hygiene and environmental sanitation and the prevention of accidents. Child Rights Convention (24-2-h)
Prevalence of breastfeeding among children 96.3% of children were breastfed in 2010; 96.3% in West Bank and 96.2% in Gaza Strip. And 26.5% of children at the age group of (0-5) months were exclusively breastfed; 27.4% in the West Bank and 25.3% in Gaza Strip. One should note that the average of breastfeeding in the Palestinian territory is good, where the average of continuation in breastfeeding reached 13.0 months in 2010, and 62.8% of the children had begun their breastfeeding within the first hour of birth.
2.6 Child’s Weight at Birth 8.8% of the children were weighing less than 2.5 kg at birth; 9.4% in the West Bank, and 8.1% in Gaza Strip. While 2.8% of them, their weight at birth reached more than 4 kg; 2.6% in the West Bank, and 3.1% in Gaza Strip in 2010 . 7.2 Prevalence of Diseases Among Children The average of incidence of infectious diseases among children is considered a diagnosis of and reflection to health current status and an indication of the safety and purity of the environment. As well as a measuring tool of social progress and the social status of households and communities . Prevalence of diseases is associated with different agents and factors of the pollution of the environment and quality of child food and how it is prepared. The frequent incidence of disease had a negative impact on the child, not only in increasing the risk of death, but also through its impact on public health of the child and possibly exposed to malnutrition and weak immune system .The following are indicators of some childhood diseases:
Source:RamallaPalestin
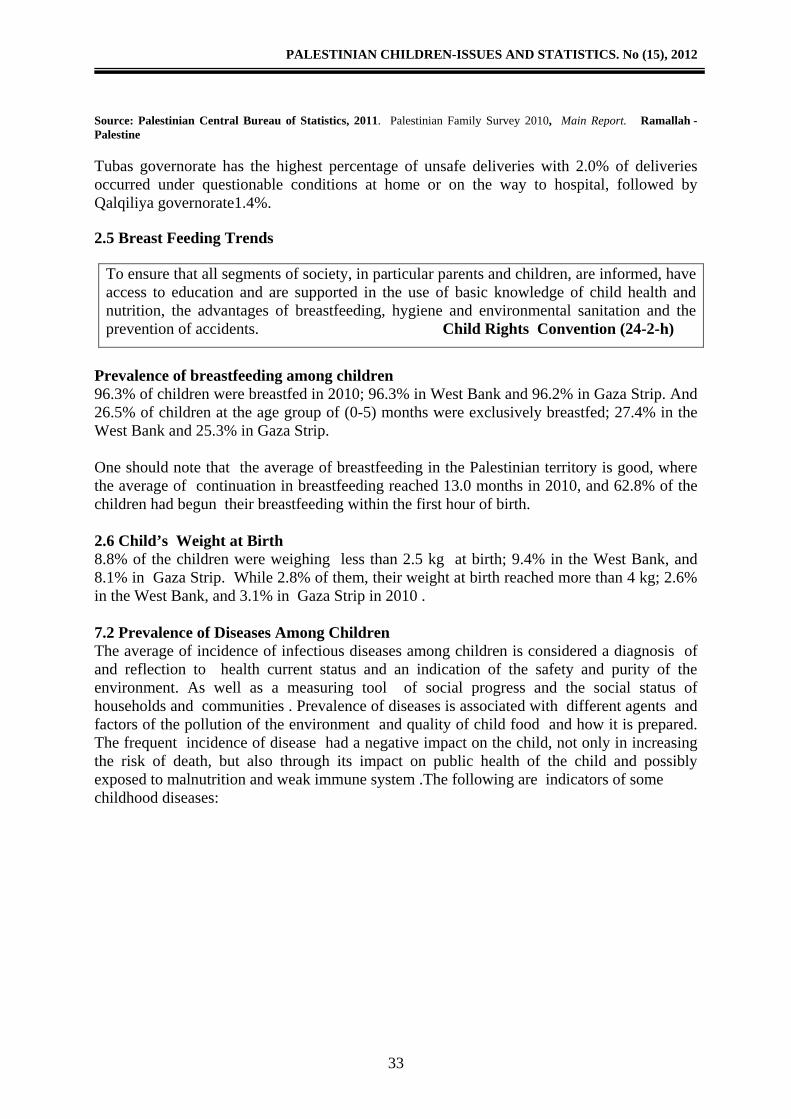
DiarrheIt was cunder fpercentapercentaStrip in that chilas it rea
children With rewere trreceivedMinistry
diseases The datthe highcompare
respirato
1
1
1
1
Perc
ent
Figur
Palestinian Cah – Palestine
nian Central Bu
ea clear that thfive years age was 11age of child2010, whilldren in theached 21.3 n with hous
gard to treaeated with d more quay of Health s that cause
a showed thhest in Gazed to the resory infectio
1
0
2
4
6
8
10
12
14
16
re (2-6): Per
Central Burea ureau of Statis
here was anof old who
1.7% in 20dren who he these perc
e age group % and it m
sehold and p
atment resula rehydrat
antities of dropped dedeath amon
hat the incidza Strip comst of govern
ons among
14.8
11.5
West Bank
PALESTINI
rcentage of cregion
au of Statisti
stics, 2011. Pal
n increase o had diarrh006 and inchad diarrhecentages we of 12-23 m
may be attribprocessed fo
lts, results tion solutiofluids duri
ehydration ng infants a
dence of resmpared to norates. Figufemales we
5
2010
AN CHILDR
34
children undn in 2006 an
ics, 2007. Pale
lestinian Family
"clearly havhea in thecreased to 1ea was 14.8 ere 11.5% amonths werbuted to andfoods at this
showed than (ORS) anng diarrheaand disease
and children
spiratory infWest Bankure (2-7) sh
ere less com
9.8
Gaza S
Region
2006
REN-ISSUES
der five whod 2010
estinian Family
y Survey 2010,
ve occurrede period bet12.8% in 2% in the W
and 12.1% re more suscd due to theage.
at 31.3% of nd 44.6% a. It shouldes of the dign under age
fections wak and in Shows percen
mpared to ma
12.1
Strip
S AND STAT
o had diarrh
y Health Surv
, Main Report.
d in the pertween 20062010. At thWest Bank respectivelyceptible to de launching
f the childreof children
d be noted tgestive systee of five.
as 5.0% and Salfit governtages of caales.
12
Pale
TISTICS. No (
hea by
vey, 2006. Fin
Ramallah -
rcentage of 6 - 2010, whe region le
and 9.8% iy in 2006. It diarrhea tha of providin
en who had n who had that the Paem from the
the percentrnorate at ases of diarr
2.811.7
estinin Territor
(15), 2012
nal Report.
Palestine
children while the evel, the in Gaza is noted
an others ng
diarrhea diarrhea lestinian
e list of
tage was (10.2%) rhea and
ry
PALESTINIAN CHILDREN-ISSUES AND STATISTICS. No (15), 2012
03
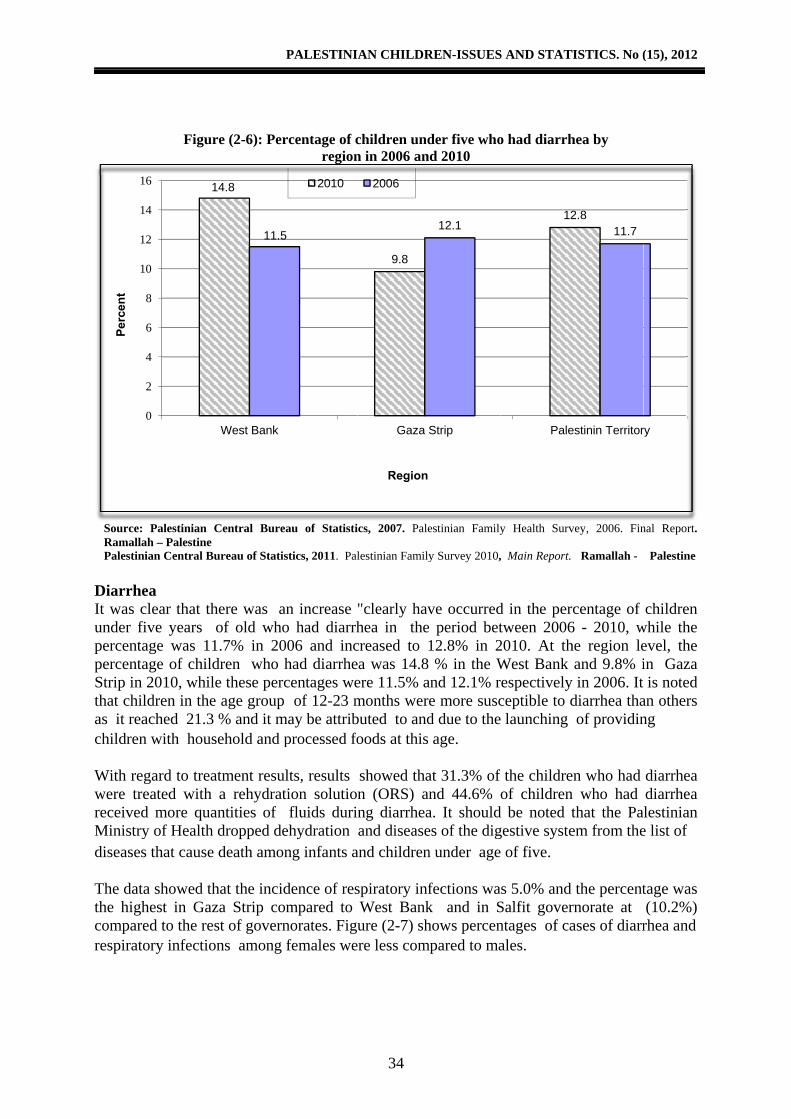
Figure (2-7): Percentage of children under five infected of diarrhea and or respiratory infections
by sex in 2010
Source: Palestinian Central Bureau of Statistics, 2011. Palestinian Family Survey 2010, Main Report. Ramallah -
Palestine
2.8 Children With Disabilities
1.5% out of children in Palestinian Territory with disabilities in 2011; 1.6% in the West Bank
and 1.4% in Gaza Strip, concerning the disability percentage distribution according to sex it
was 1.8% among males children 1.3% females children.
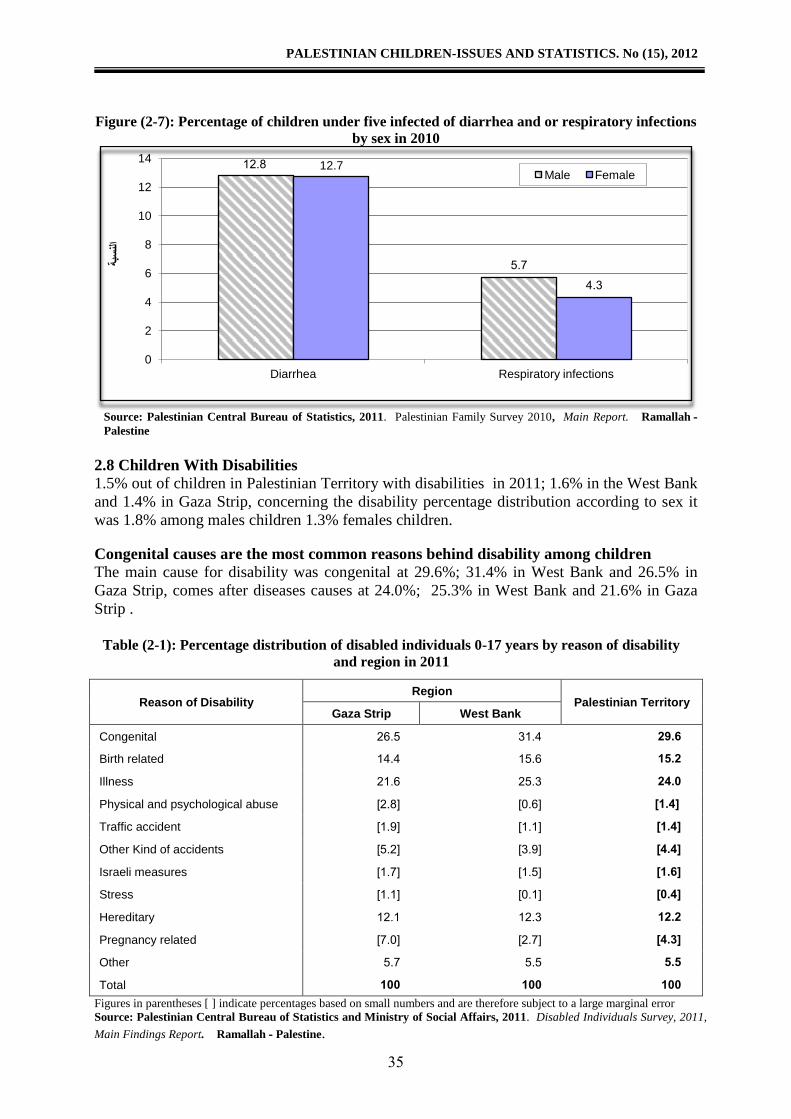
Congenital causes are the most common reasons behind disability among children
The main cause for disability was congenital at 29.6%; 31.4% in West Bank and 26.5% in
Gaza Strip, comes after diseases causes at 24.0%; 25.3% in West Bank and 21.6% in Gaza
Strip .
Table (2-1): Percentage distribution of disabled individuals 0-17 years by reason of disability
and region in 2011
Palestinian Territory Region
Reason of Disability West Bank Gaza Strip
6.92 31.4 26.2 Congenital
2.96 12.6 14.4 Birth related
6.92 22.3 21.6 Illness
[29.] [0.6] [2.8] Physical and psychological abuse
[29.] [1.1] [1.9] Traffic accident
[.9.] [3.9] [2.2] Other Kind of accidents
[292] [1.2] [1.7] Israeli measures
[29.] [0.1] [1.1] Stress
2696 12.3 12.1 Hereditary
[.94] [2.7] [7.0] Pregnancy related
.9. 2.2 2.7 Other
222 222 222 Total Figures in parentheses [ ] indicate percentages based on small numbers and are therefore subject to a large marginal error
Source: Palestinian Central Bureau of Statistics and Ministry of Social Affairs, 2011. Disabled Individuals Survey, 2011,
Main Findings Report. Ramallah - Palestine.
12.8
2.7
12.7
4.3
0
2
4
6
8
10
12
14
Diarrhea Respiratory infections
بةس
لنا
Male Female
PALESTINIAN CHILDREN-ISSUES AND STATISTICS. No (15), 2012
36
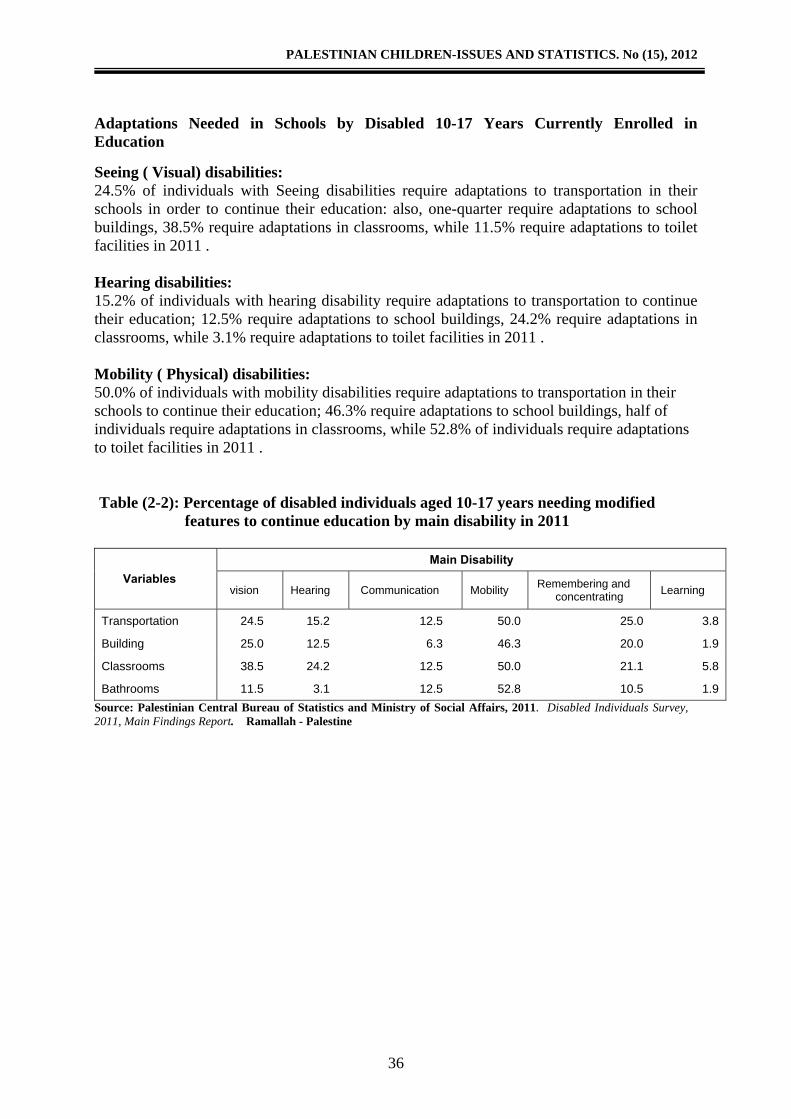
Adaptations Needed in Schools by Disabled 10-17 Years Currently Enrolled in Education Seeing ( Visual) disabilities: 24.5% of individuals with Seeing disabilities require adaptations to transportation in their schools in order to continue their education: also, one-quarter require adaptations to school buildings, 38.5% require adaptations in classrooms, while 11.5% require adaptations to toilet facilities in 2011 . Hearing disabilities: 15.2% of individuals with hearing disability require adaptations to transportation to continue their education; 12.5% require adaptations to school buildings, 24.2% require adaptations in classrooms, while 3.1% require adaptations to toilet facilities in 2011 . Mobility ( Physical) disabilities: 50.0% of individuals with mobility disabilities require adaptations to transportation in their schools to continue their education; 46.3% require adaptations to school buildings, half of individuals require adaptations in classrooms, while 52.8% of individuals require adaptations to toilet facilities in 2011 .
Table (2-2): Percentage of disabled individuals aged 10-17 years needing modified features to continue education by main disability in 2011
Main Disability
Variables Learning Remembering and
concentrating Mobility Communication Hearing vision
3.8 25.0 50.0 12.5 15.2 24.5 Transportation
1.9 20.0 46.3 6.3 12.5 25.0 Building
5.8 21.1 50.0 12.5 24.2 38.5 Classrooms
1.9 10.5 52.8 12.5 3.1 11.5 Bathrooms Source: Palestinian Central Bureau of Statistics and Ministry of Social Affairs, 2011. Disabled Individuals Survey, 2011, Main Findings Report. Ramallah - Palestine
PALESTINIAN CHILDREN-ISSUES AND STATISTICS. No (15), 2012
37
References - Palestinian Central Bureau of Statistics, 2007. Palestinian Family Health Survey, 2006.
Final Report. Ramallah – Palestine.
- Palestinian Central Bureau of Statistics, 2011. Palestinian Family Survey 2010, Main
Report. Ramallah - Palestine
- Palestinian Central Bureau of Statistics, 2005. Demographic and Health Survey 2004.
Main Findings. Ramallah – Palestine. - Palestinian Central Bureau of Statistics, 2011. Annual Report 2011. Palestine Children –
Issues and Statistics. Child statistics series (No.13) . Ramallah – Palestine.
- Palestinian Central Bureau of Statistics and Ministry of Social Affairs, 2011. Disabled Individuals Survey, 2011, Main Findings Report. Ramallah - Palestine.
- Ministry of Health, PHIC, Health Status in Palestine 2010, April 2011.
PALESTINIAN CHILDREN-ISSUES AND STATISTICS. No (15), 2012
38
PALESTINIAN CHILDREN-ISSUES AND STATISTICS. No (15), 2012
39
Chapter Three
Educational Status
The educational sector is one of the most important sectors in the society, which is given special attention by governments since it represents real investment in the future of nations. Educational indicators are used to measure the government and society’s performance in providing a suitable environment for children and youths’ right to education. Such concern has had an unequivocal impact in bridging the educational gap between male and female students in basic and secondary education stages since both have recorded approximate comprehensive enrollment of basic school (from first grade to tenth grade). Compulsory education has been expanded from nine years to ten years and the new Palestinian curriculum reform plans were gradually introduced for implementation during the scholastic years 2000-2006. There has also been widening of educational facilities, which have reached areas where they were never before available. Despite the achievements in children’s education, we cannot underestimate the future challenges of the educational process. Educating children occupied a high priority in many national, regional, and international conferences such as Jumetian Conference on Societal Education in 1990, Dakar Conference on Evaluating Education for All in 2000, and the Convention on the Rights of the Child in 1989, which is the most comprehensive convention in the world on human rights. Moreover, human rights conventions have all emphasized providing quality education to children and gave such matters high priority. Articles 28 and 29 of the Convention on the Rights of the Child stipulate that “State Parties shall make primary education compulsory and available free to all’ and that “education of the child shall be directed to the development of the child’s personality, talents, and mental and physical abilities to their fullest potential.” Therefore, school attainment and receiving good quality education are main factors to achieving such goal. Moreover, four more Articles in the Convention on the Rights of the Child reinforce the comprehensive legal principles of the child’s education including: Article 2, which stipulates that “State Parties shall respect and ensure the rights set forth in the present Convention to each child within their jurisdiction without discrimination of any kind;” Article 3, which states, “The best interest of the child shall be a primary consideration;” Article 6 states, “That every child has the inherent right to
States Parties recognize the right of the child to education, and with a view to achieving this right progressively and on the basis of equal opportunity, they shall, in particular:
A- Make elementary education compulsory and available free to all; B-Encourage the development of different forms of secondary education, make them available and accessible to every child, and take appropriate measures such as the introduction of free education and offering financial assistance in case of need.
(Convention on the Rights of the Child, Article 28-1)
PALESTINIAN CHILDREN-ISSUES AND STATISTICS. No (15), 2012
40
life…survival and development;” and Article 12, which stipulates, “The child who is capable of forming his or her own views (has) the right to express those views freely.”1 3.1 Students At the outset of the scholastic year 2010/2011, the number of students enrolled in the basic and secondary stage was 1,116,991 students. Female students constitute around 50.4%. Female percentage varies from one stage to another: in the basic education stage, females constitute 49.7%, compared to 54.8% in the secondary education stage. In the scholastic year 2010/2011, 13.4% of all students were enrolled in the secondary education stage, and 86.6% were enrolled in the basic stage; 59.6% of all students were enrolled in the basic education stage in the West Bank and 40.4% in Gaza Strip. As for students enrolled in the secondary education stage, this percentage was 60.2% in the West Bank and 39.8% in Gaza Strip. 68.6% of total students were enrolled in governmental schools; 23.4% were enrolled in UNRWA schools, and 8.0% in private schools. The relatively large number of refugee students in Gaza Strip made the educational role of UNRWA in Gaza Strip larger than its role in the West Bank.2 There had been a steady increase in the numbers of school students between 1994/1995 and 2010/2011, whereas the percentage of increases in the basic and secondary education stage was 80.8%; 91.7% in Gaza Strip and 74.1% in the West Bank. 3.2 Pre-School Enrollment (Enrollment in Kindergarten) in the West Bank Kindergartens are run by the private sector with the exception of two kindergartens, which are operated by the Ministry of Education. However, according to effective rules and regulations, kindergartens must be licensed by the Ministry of Education. The increase and decrease of number of kindergarten in the Palestinian Territory is affected by the political situation. The number of kindergarten in the West Bank was 782 in scholastic year 2010/2011; 780 private and 2 are governmental. The number of kindergarten students in the West Bank was 60,134 students in scholastic year 2010/2011; 48.4% males and 51.6% females. According to the supervising authority, 60,013 students supervised by private kindergartens, and 121 supervised by governmental kindergartens. The classroom density was 23.1 child per classroom in scholastic year 2010/2011.
1 UNICEF, Education for All, 1999. 253.2% of basic education stage children in Gaza Strip were enrolled in UNRWA schools while 9.3% in basic education stage students in the West Bank were enrolled in UNRWA schools during the scholastic year 2010/2011.
PALESTINIAN CHILDREN-ISSUES AND STATISTICS. No (15), 2012
41
3.3 Basic School Enrollment Students at the basic stage had increased from 572,529 in the scholastic year 1994/1995 to 967,300 in the scholastic year 2010/2011, marking an increase rate of 68.9%. Females and males constituted 49.7% and 50.3% respectively. Female enrollment ratio in the basic education stage in the scholastic year 2010/2011 was 98.9 female students per 100 male students among basic school stage; there were 98.9 female students per 100 male students in the West Bank and 98.9 per 100 male students in Gaza Strip.
3.4 Secondary School Enrollment Students at secondary education stage had increased from 45,339 in 1994/1995 to 149,691students during the scholastic years 2010/2011, reflecting an increase of 230.1%. Female students constituted 54.8% of the total number students in the secondary stage in the scholastic year 2010/2011, compared to 45.5% in 1995/1996. Academic education is still more attractive than vocational education. The number of students enrolled in vocational high school reached 9,621 in the scholastic year 2010/2011 representing 6.4% of the total number of secondary school students. Female students constituted only 35.7% of vocational high school students. On the other hand, they constituted 56.2% of academic secondary school students. 3.5 Repetition The percentage of repetition at basic stage in the scholastic year 2009/2010 stood at 1.8% for males and 1.6% for females compared to 1.2% and 1.0% at secondary stage for males and females respectively. Indicators revealed that there was no significant difference between Gaza Strip and the West Bank for the two stages, (1.5% for the West Bank and 1.9% for Gaza Strip in the basic stage and 0.9% for the West Bank and 1.4% for Gaza Strip in the secondary stage). The percentages of repetition among male and female students at basic and secondary stages in the Palestinian Territory dropped significantly during the scholastic years 1994/1995-2009/2010. For instance, female students who failed during basic stage dropped from 4.4% in 1994/1995 to 1.6% in 2009/2010. At secondary stage, female students who failed dropped from 1.3% in 1994/1995 to 1.0% in 2009/2010. Caution should be exercised when examining the decrease in the percentages of repetition at school since the educational system has certain limitations to failing, such as students are allowed to repeat class twice and repetition starts at grade four. Also, repetition has been limited to 5% per class.
Fi
Source: PHigher E
Figur
Sourceand Hig
Perc
enta
gePe
rcen
tage
igure (3-1) :R
Palestinian CEducation. Ram
re (3-2): Rep
e: Palestinianigher Educatio
3.4
0
1
2
3
4
5
6
7
8
1994/
2.0
5
0
1
2
3
4
5
6
7
1994/1
Repetition r
Central Bureamallah-Pales
petition rate
n Central Buon. Ramallah
2
6.8
/1995 19
1.
5.9
995 199
PALESTINI
rate in the b
au of Statistictine.
e in the seco
reau of Statish-Palestine.
2.2
3.0
998/1999
.4
0.6
98/1999
AN CHILDR
42
basic stage b
cs 2012. Educ
ondary stage
stics 2012. Ed
1.21.7
2003/2004
Scholast
W
1.1 0.9
2003/2004
Schola
West B
REN-ISSUES
y region and
ation Survey D
e by region a
ducation Surv
1.41.9
2005/200
tic Year
West Bank
0.90.6
2005/200
astic Year
ank
S AND STAT
d selected sc
Database. Min
and selected
vey Database.
1.69
06 2006/
Gaza
0.86
06 2006
Gaza Strip
TISTICS. No (
cholastic yea
nistry of Educ
d scholastic
Ministry of E
11.9
2007 20
Strip
01.0
6/2007 2
(15), 2012
ars
cation and
years
Education
.51.9
009/2010
0.91.4
2009/2010

3.6 Dro The droPalestinseconda The drodistribu0.7%, d
The dro2.3% indistribu
Fi
Source: and High
Perc
enta
geop-Outs Ra
op-outs ratenian territorary stage, th
op-outs rate uted as 2.5%distributed a
op-out rate an the West Buted as 0.9%
igure (3-3):
Palestinian Cher Education.
2.7
2
0
1
2
3
4
1995/1
ate
e at the basry was 1.0he rates wer
among fem% in West Baas 0.4% in t
among maleBank and 1
% in the Wes
Drop-out ra
Central Bure. Ramallah-P
2.02.2
996 199
PALESTINI
sic schoolin0% for male 1.9% for m
males at the ank and 1.5the West Ba
es at the sec1.3% in Gazst Bank and
ates in the b
eau of StatistPalestine.
0
1.0
98/1999
AN CHILDR
43
ng stage in le students males and 2
secondary 5% in Gaza ank and 1.1%
condary staza Strip, wh
d 1.2% in Ga
asic stage by
tics, 2012. Ed
0.80.6
2003/2004
Scholasti
REN-ISSUES
the schooliand 0.7%
2.1% for fem
schooling sStrip, while% in Gaza S
age in 2009/hile the rateaza Strip.
y region and
ducation Surv
0.70.5
2005/2006
c Year
S AND STAT
ing year o for femal
males.
stage of 20e the rate at Strip.
/2010 was 1e at the bas
d selected sc
vey Database.
0.8
6 2006/2
Wes
TISTICS. No (
of 2009/201le students.
009/2010 wathe basic st
1.9%, distrisic stage wa
cholastic yea
Ministry of E
0
1.0
2007 20
t Bank Ga
(15), 2012
0 in the . At the
as 2.1%, tage was
ibuted as as 1.0%,
ars
Education
0.6
1.2
009/2010
aza Strip
Fi
Source: and High
3.7 SchThe num74.5% o GovernmUNRW The numThere hThe num1995/19number 3.8 SchThe perscience increaseUNRWand in p As for sdedicate2010/20 3 Includes
Perc
enta
ge
gure (3-4): D
Palestinian Cher Education.
ools mber of schof schools a
mental schWA-run scho
mber of schhas been anmber of ba996 was 1,0r of schools
ool Facilitircentage of s increased f
ed at governWA schools,
private scho
school libraed to school011whereas
s schools that
9.8
0
2
4
6
8
10
12
1995
Drop-out ra
Central Bure. Ramallah-P
hools was 2,are in the W
ools constitols , and 13
hools have n emphasis asic schools098. The nuin 1995/199
ies and Eduschools whefrom 39.6%nment schoothis percent
ools, it incre
aries, the pel library, in it increase have both bas
7
5.1
5/1996 19
PALESTINI
ates in the se
au of StatistiPalestine.
652 in 2010West Bank an
tuted 74.4%3.0% as priv
increased son increasi
s in 2010/2umber of se96 was 372
ucational Tere there wa
% in 1994/1ols from 40tage increas
eased from 4
ercentage ofncreased froed from 28.0
sic education
7.8
1.8
998/1999
S
AN CHILDR
44
econdary sta
cs 2012. Educ
0/2011: 1,74nd 25.5% ar
% of schoovate schools
since the PNing school 2011 was 1condary sch.3
Technologieas a special995 to 61.8.0% in yearsed from 3147.6% to 50
f schools, wom 24.4% i0% in the ye
and secondary
3.4
2.3
2003/2004
Scholastic Ye
REN-ISSUES
age by regio
cation Survey
47 basic stare in Gaza S
ols in 2010/s .
NA took cocapacity to,747, wherhools in 20
es l room that
8% in 2010/r 1994/19951.3% to 48.20.6% during
where there n 1994/199ear of 1995
y school educ
2.92.1
2005/2006
ear
S AND STAT
n selected sc
Database. Mi
age and 905Strip.
/2011, com
ontrol over o accommodreas the num10/2011 wa
t was devote/2011. Whil5 to 66.1% i2% during t
g same perio
was a speci95 to 68.7% /1996 to 72
ation as well a
2.9
4.1
2006/200
West Bank
TISTICS. No (
cholastic yea
Ministry of Edu
secondary
mpared to 1
education date more smber of scas 905, whe
ed to laborale this percein 2010/201the same peod as well.
ial room thain the year
2.4% in 201
as secondary
2.4
1
07 2009/2
Gaza Strip
(15), 2012
ars
cation
schools.
2.6% as
in 1994. students. hools in ereas the
atory entage 1, but at
eriod
at was of 0/2011
schools.
1.4
2010
p
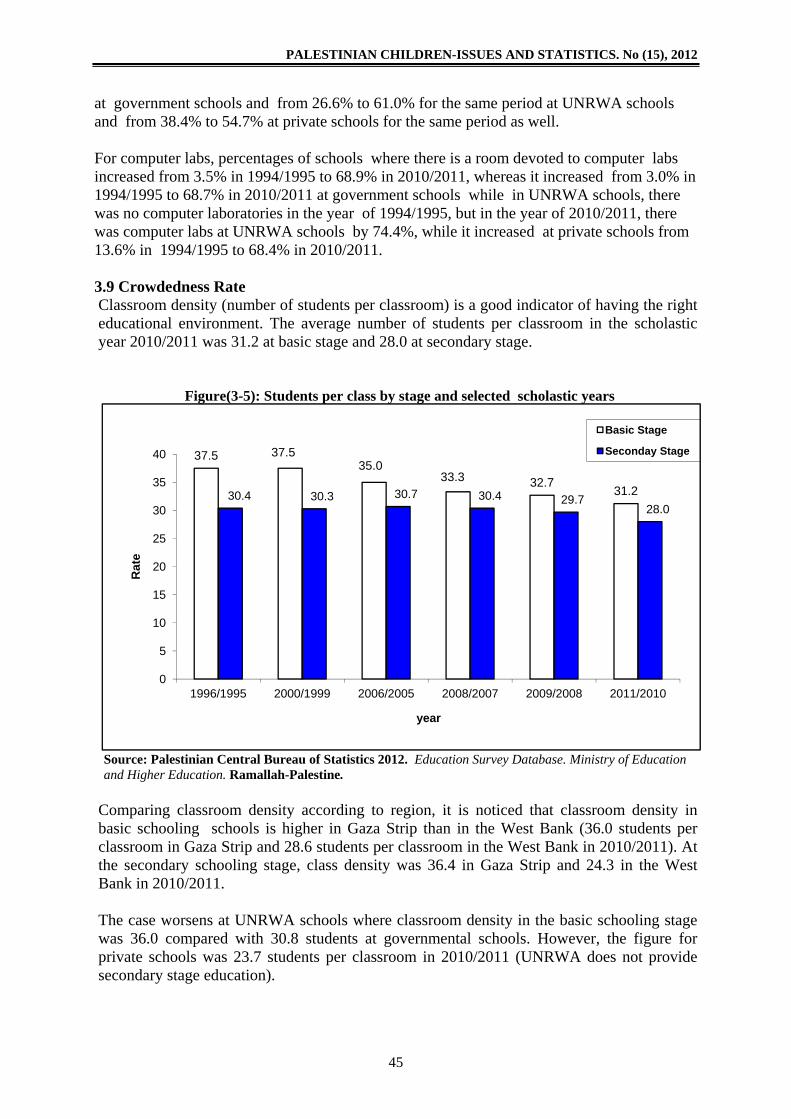
PALESTINIAN CHILDREN-ISSUES AND STATISTICS. No (15), 2012
45
at government schools and from 26.6% to 61.0% for the same period at UNRWA schools and from 38.4% to 54.7% at private schools for the same period as well. For computer labs, percentages of schools where there is a room devoted to computer labs increased from 3.5% in 1994/1995 to 68.9% in 2010/2011, whereas it increased from 3.0% in 1994/1995 to 68.7% in 2010/2011 at government schools while in UNRWA schools, there was no computer laboratories in the year of 1994/1995, but in the year of 2010/2011, there was computer labs at UNRWA schools by 74.4%, while it increased at private schools from 13.6% in 1994/1995 to 68.4% in 2010/2011. 3.9 Crowdedness Rate Classroom density (number of students per classroom) is a good indicator of having the right educational environment. The average number of students per classroom in the scholastic year 2010/2011 was 31.2 at basic stage and 28.0 at secondary stage.
Figure(3-5): Students per class by stage and selected scholastic years
Source: Palestinian Central Bureau of Statistics 2012. Education Survey Database. Ministry of Education and Higher Education. Ramallah-Palestine.
Comparing classroom density according to region, it is noticed that classroom density in basic schooling schools is higher in Gaza Strip than in the West Bank (36.0 students per classroom in Gaza Strip and 28.6 students per classroom in the West Bank in 2010/2011). At the secondary schooling stage, class density was 36.4 in Gaza Strip and 24.3 in the West Bank in 2010/2011. The case worsens at UNRWA schools where classroom density in the basic schooling stage was 36.0 compared with 30.8 students at governmental schools. However, the figure for private schools was 23.7 students per classroom in 2010/2011 (UNRWA does not provide secondary stage education).
37.5 37.535.0
33.3 32.731.230.4 30.3 30.7 30.4 29.7
28.0
0
5
10
15
20
25
30
35
40
1996/1995 2000/1999 2006/2005 2008/2007 2009/2008 2011/2010
Rat
e
year
Basic Stage
Seconday Stage
PALESTINIAN CHILDREN-ISSUES AND STATISTICS. No (15), 2012
46
3.10 Teachers The number of teachers in schools reached 50,468 in the scholastic year 2010/2011 (21,156 male teachers and 29,312 female teachers). 71.1% of teachers teach at governmental schools, 18.1% teach at UNRWA schools, 10.8% teach at private schools. The number of students per teacher at governmental schools was 21.4 in 2010/2011; in UNRWA schools, the figure was 28.7, while in private schools it was 16.3.
PALESTINIAN CHILDREN-ISSUES AND STATISTICS. No (15), 2012
47
References - Palestinian Central Bureau of Statistics, 2012. Education Census database-selected
years. Ministry of Education and Higher Education (unpublished data). Ramallah-Palestine. -------------------------------------------------------------------------------------------------
- Ministry of Education, 2000. The Annual Statistical Educational Book, 1999/2000,
Number (6). Ramallah-Palestine. --------------------------------------------------------------------------------------------------------
- Ministry of Education, 2001. The Five Year Plan for Education in Palestine (2001-
2005). Ramallah-Palestine. -------------------------------------------------------------------------------------------
- Ministry of Education, 2000. Window on Education in Palestine. Ramallah-Palestine. --------------------------------------------------------------------------------------------------
- Palestinian Central Bureau of Statistics, 1999. Teaching Indicators 1994/1995-
1998/1999, Ramallah-Palestine. --------------------------------------------------------------------------------------------------------
PALESTINIAN CHILDREN-ISSUES AND STATISTICS. No (15), 2012
49
Chapter Four
Child Cultural and Recreational Status State parties recognize the right of the child to rest and leisure, to engage in play and recreational activities appropriate to the child age and to participate freely in cultural life and the arts.
(Convention on the Rights of the Child, Article 31-1) State parties shall respect and promote the right of the child to participate fully in cultural and artistic life and shall encourage the provision of appropriate and equal opportunities for artistic, cultural and recreational and leisure time activity.
(Convention on the Rights of the Child, Article 31-2) Children’s education and culture is a basic function of culture as a social process of upbringing and transforming the newborn from a biological entity into a social being. Cultures go beyond socialization to develop the child’s personality and national identity. Solidification of cultural and recreational rights of Palestinian children have been made through the incorporation of these rights into the Palestinian child national plan, prepared by the national committee and endorsed by the PNA in 1995. The plan is in line with the International Convention of the Rights of the Child sanctioned by the UN General Assembly in 1989. The child’s cultural and recreational rights have since become inseparable parts of the child’s rights as a human being, as stated in the Article 31 of this Convention. The culture of Palestinian children stems from Palestinian Arabic heritage, philosophy, religion, norms, values, traditions, the 1988 Declaration of Independence, and the national Palestinian, Arab and Islamic aspirations. Knowledge and information are acquired through the Arabic language by which interpersonal communication, self-expression, and openness to the Arab culture are made possible. The child’s knowledge is also enriched through arts, music, literature, technology, and investment in recreational activities and leisure time. 4.1 Using Computer Percentage of children (10-17 years) who use computers amounted to 75.1%, (of which 81.9% in West Bank and 64.4% in Gaza Strip), with no significant differences between males (76.7%) and females (73.5%) in 2011. 4.2 Using Internet About the extent of knowledge and use of the internet by children aged 10-17 years old, the results showed that four out of ten children (43.6%) have internet service and know and use it, while four out of ten children (39.0%) do not have the minimum knowledge of the internet. Furthermore, findings revealed that the most common reason for using the Internet were: leisure and entertainment purposes 32.8%, (33.5% for males and 31.9% for females), while it was 26.0% in 2006, and study and research 23.3% (16.2% for males and 31.3% for females) compared to 25.6% in 2006, and email service 21.8%,(28.6% for males and 14.1% for females), while it was 8.7% in 2006,
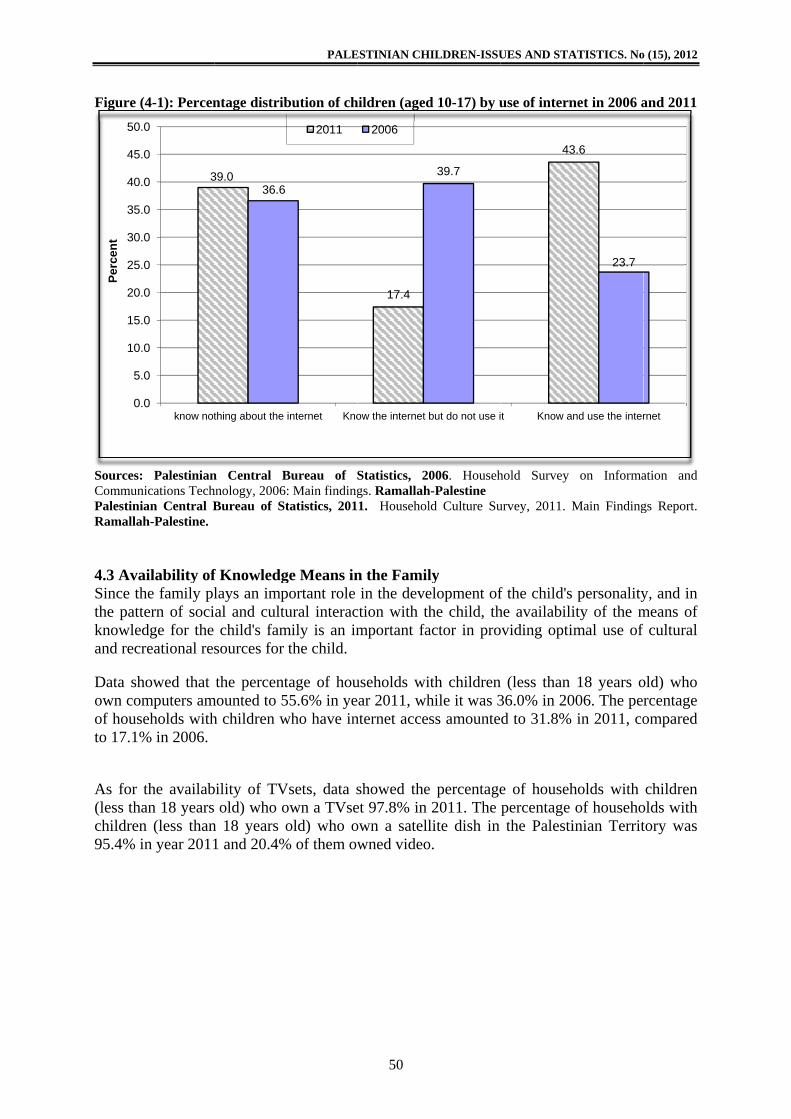
Figure (
Sources:CommunPalestiniRamallah 4.3 AvaSince ththe pattknowledand recr Data shown comof housto 17.1% As for (less thachildren95.4% i
0.
5.
10.
15.
20.
25.
30.
35.
40.
45.
50.Pe
rcen
t(4-1): Percen
Palestiniannications Techian Central Bh-Palestine.
ailability ofhe family pltern of socidge for the reational res
howed that mputers ameholds with% in 2006.
the availaban 18 yearsn (less thanin year 2011
3
0
0
0
0
0
0
0
0
0
0
0
know not
ntage distrib
n Central Bhnology, 2006Bureau of St
f Knowledglays an impal and cultuchild's fam
sources for
the percentmounted to 5h children w
bility of TV old) who o
n 18 years o1 and 20.4%
39.036.6
thing about the
PALE
bution of ch
Bureau of S: Main findingtatistics, 201
ge Means inportant role ural interac
mily is an imthe child.
tage of hou55.6% in yewho have in
Vsets, data sown a TVseold) who o
% of them ow
internet Kno
2011
ESTINIAN CH
50
hildren (aged
Statistics, 2gs. Ramallah1. Househol
n the Familin the deve
ction with thmportant fa
useholds wiar 2011, wh
nternet acce
showed theet 97.8% inown a satellwned video
17.4
ow the internet
2006
HILDREN-ISSU
d 10-17) by u
006. Househh-Palestine ld Culture Su
ly elopment ofhe child, thactor in pro
ith childrenhile it was 3ss amounte
e percentage2011. The lite dish in
o.
39.7
but do not use i
UES AND STA
use of intern
hold Survey
urvey, 2011. M
f the child'she availabilioviding opti
n (less than 36.0% in 20d to 31.8%
e of househpercentage the Palesti
43
t Know a
ATISTICS. No
net in 2006 a
on Informa
Main Finding
personalityity of the mimal use of
18 years o006. The per
in 2011, co
holds with of househo
inian Territ
3.6
23.7
nd use the inter
o (15), 2012
and 2011
ation and
gs Report.
y, and in means of f cultural
old) who rcentage ompared
children olds with tory was
rnet
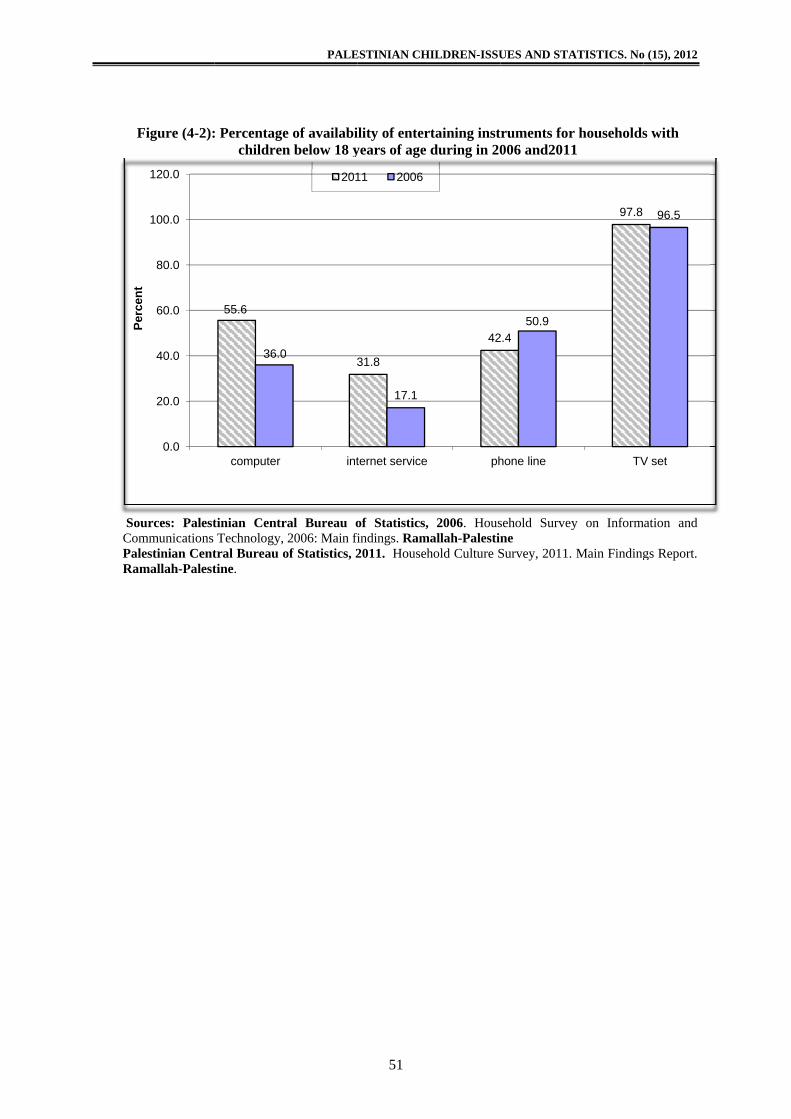
F
SouComPaleRam
Perc
ent
Figure (4-2):
urces: Palestmmunications estinian Centmallah-Palest
0.0
20.0
40.0
60.0
80.0
100.0
120.0
: Percentagechildren
tinian CentrTechnology,
tral Bureau otine.
55.6
36.0
computer
PALE
e of availabin below 18 y
ral Bureau o2006: Main fi
of Statistics, 2
30
int
201
ESTINIAN CH
51
ility of enteryears of age
of Statistics, findings. Ram2011. Househ
31.8
17.1
ternet service
11 2006
HILDREN-ISSU
rtaining instduring in 20
2006. Housmallah-Palestin
hold Culture S
42
ph
UES AND STA
ruments for006 and2011
sehold Surveyne Survey, 2011.
2.450.9
hone line
ATISTICS. No
r households1
y on Inform
Main Finding
97.8
TV
o (15), 2012
s with
mation and
gs Report.
96.5
V set

PALESTINIAN CHILDREN-ISSUES AND STATISTICS. No (15), 2012
52
References - Palestinian Central Bureau of Statistics, 2006. Household Survey on Information
and Communications Technology, 2006: Main findings. Ramallah-Palestine. - Palestinian Central Bureau of Statistics, 2011. Household Culture Survey, 2011.
Main Findings Report. Ramallah-Palestine. - UNICEF, 1990. Children First, Convention on the Rights of the Child.
PALESTINIAN CHILDREN-ISSUES AND STATISTICS. No (15), 2012
53
Chapter Five
Children In Need of Special Protection
This chapter attempts to analyze data and information on a specific age group referred to as “children in need of special protection.” This group comprises a variety of children subgroups experiencing difficult life circumstances hampering their mental and physical wellbeing. Sub groups are usually identified according to the type of difficulty they encounter or due to:
- Children’s separation from their parents due to institutionalization, hospitalization, family de-unification, adoption, or deprivation from family environment (CRC, Articles 9, 10, 20, and 21).
- Other subgroups in need of special protection are children subject to all kinds of physical, sexual and mental/emotional abuse (CRC, Articles 19 and 34).
- Disabled children (CRC, Articles 23). - Poor children (CRC, Articles 26 and 27). - Employed children (CRC, Article 32). - Children exploited to the use, sale and trafficking of drugs (CRC, Article 35). - Children deprived of their liberty or receiving juvenile institutional care (CRC, Articles
37 and 40). - Children afflicted by violence and armed conflicts (CRC, Articles 38 and 39).
Though many countries make serious efforts to ensure children’s full enjoyment of their rights, as stated in the United Nations Convention on the Rights of the Child-1989, this convention has not yet been implemented anywhere. This is very hard to accomplish especially given the number of uncontrollable political, economic and social factors involved. Undoubtedly all these factors have negative effects on children in general, and those in need of special protection, in particular. Furthermore, children experience a number of dramatic events resulting from individuals belonging to their environments such as negligence, abuse, exploitation, and violence from persons who should be their caretakers.
PALESTINIAN CHILDREN-ISSUES AND STATISTICS. No (15), 2012
54
5.1 Children Living in Poverty
19.9% of Palestinian households are childless, while the vast majority of Palestinian households at 80.1% are with children. Hence, meaningful comparisons in poverty status should be carried out for households with a different number of children rather than merely between childless households and the rest. The poverty rate in 2010 indicated that the rate of the total distribution of poverty among Palestinian households in the Palestinian territory was 21.4% in 2010 (using consumption data), of which 22.8% is among households with children and 15.8% is among households without children. More significantly, it isthe fact that the poverty data indicated that 16.0% of the households in West Bank were suffering from poverty in 2010 (16.4% among households with children and 14.6% among households without children), while 31.9% of households in Gaza Strip were suffering from poverty in 2010 (34.4% among households with children and 18.8% among households without children).
Table (5-1): Likelihood of being poor among households according to households monthly consumption by region in2010
Region With Children With out Children Total
Value Contribution Value Contribution Value Contribution Palestinian Territory 22.8 100 15.8 100 21.4 100.0
West Bank 16.4 46.2 14.6 66.4 16.0 49.1
Gaza Strip 34.4 53.8 18.8 33.6 31.9 50.9
Source: Palestinian Central Bureau of Statistics, 2011. data base of Palestinian Expenditure and consumption survey, 2010. .(unpublished data)- Ramallah- Palestine. 26.9% of children in the Palestinian Territory were poor in 2010; 19.0% in West Bank, and 38.4% in Gaza Strip.
Table (5-2): Percentage of children in poverty by region in 2010
Region Poverty Deep poverty
Palestinian Territory 26.9 14.6
West Bank 19.0 8.8
Gaza Strip 38.4 23.1
Source: Palestinian Central Bureau of Statistics, 2011. data base of Palestinian Expenditure and consumption survey, 2010. .(unpublished data)- Ramallah- Palestine.
5.2 Number of Childen in the Household With the exception of childless households, the incidence of poverty increases consistently by the additional number of children among households. Households with the least incidence of poverty are those with 1-2 children. The picture remains essentially the same when other poverty indexes are used to reflect the depth of poverty.
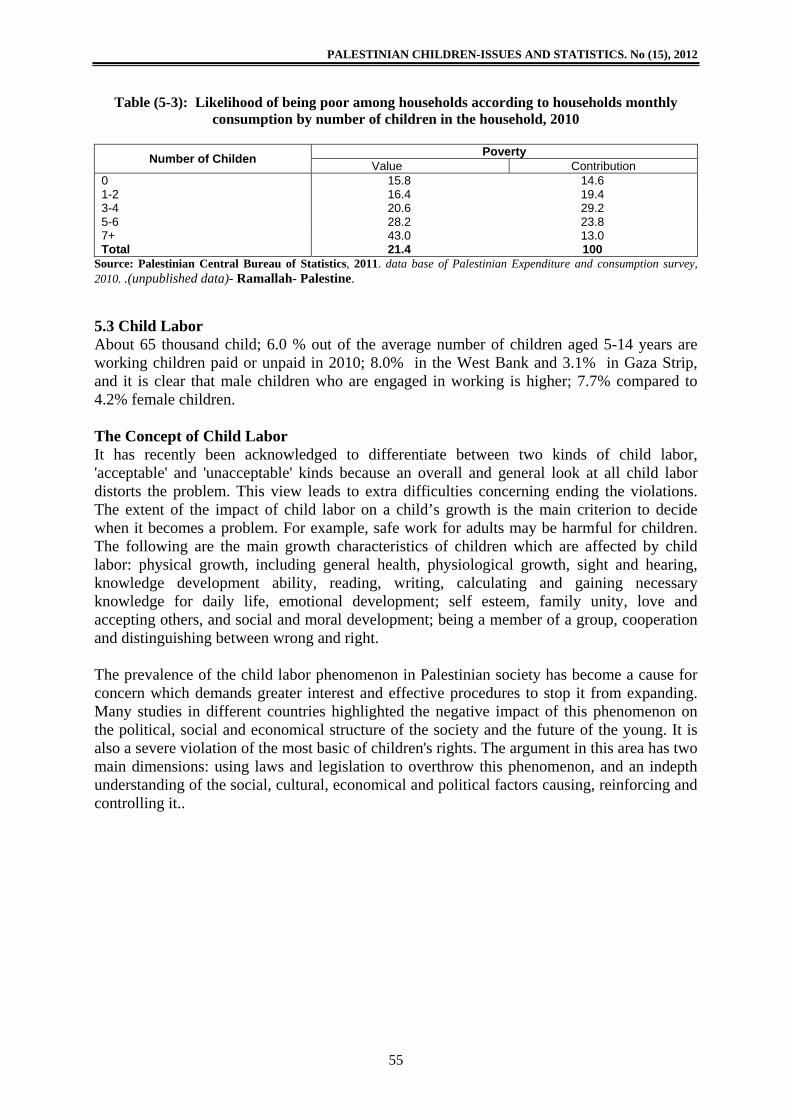
PALESTINIAN CHILDREN-ISSUES AND STATISTICS. No (15), 2012
55
Table (5-3): Likelihood of being poor among households according to households monthly consumption by number of children in the household, 2010
Number of Childen Poverty
Value Contribution 0 15.8 14.6 1-2 16.4 19.4 3-4 20.6 29.2 5-6 28.2 23.8 7+ 43.0 13.0 Total 21.4 100
Source: Palestinian Central Bureau of Statistics, 2011. data base of Palestinian Expenditure and consumption survey, 2010. .(unpublished data)- Ramallah- Palestine.
5.3 Child Labor About 65 thousand child; 6.0 % out of the average number of children aged 5-14 years are working children paid or unpaid in 2010; 8.0% in the West Bank and 3.1% in Gaza Strip, and it is clear that male children who are engaged in working is higher; 7.7% compared to 4.2% female children. The Concept of Child Labor It has recently been acknowledged to differentiate between two kinds of child labor, 'acceptable' and 'unacceptable' kinds because an overall and general look at all child labor distorts the problem. This view leads to extra difficulties concerning ending the violations. The extent of the impact of child labor on a child’s growth is the main criterion to decide when it becomes a problem. For example, safe work for adults may be harmful for children. The following are the main growth characteristics of children which are affected by child labor: physical growth, including general health, physiological growth, sight and hearing, knowledge development ability, reading, writing, calculating and gaining necessary knowledge for daily life, emotional development; self esteem, family unity, love and accepting others, and social and moral development; being a member of a group, cooperation and distinguishing between wrong and right. The prevalence of the child labor phenomenon in Palestinian society has become a cause for concern which demands greater interest and effective procedures to stop it from expanding. Many studies in different countries highlighted the negative impact of this phenomenon on the political, social and economical structure of the society and the future of the young. It is also a severe violation of the most basic of children's rights. The argument in this area has two main dimensions: using laws and legislation to overthrow this phenomenon, and an indepth understanding of the social, cultural, economical and political factors causing, reinforcing and controlling it..
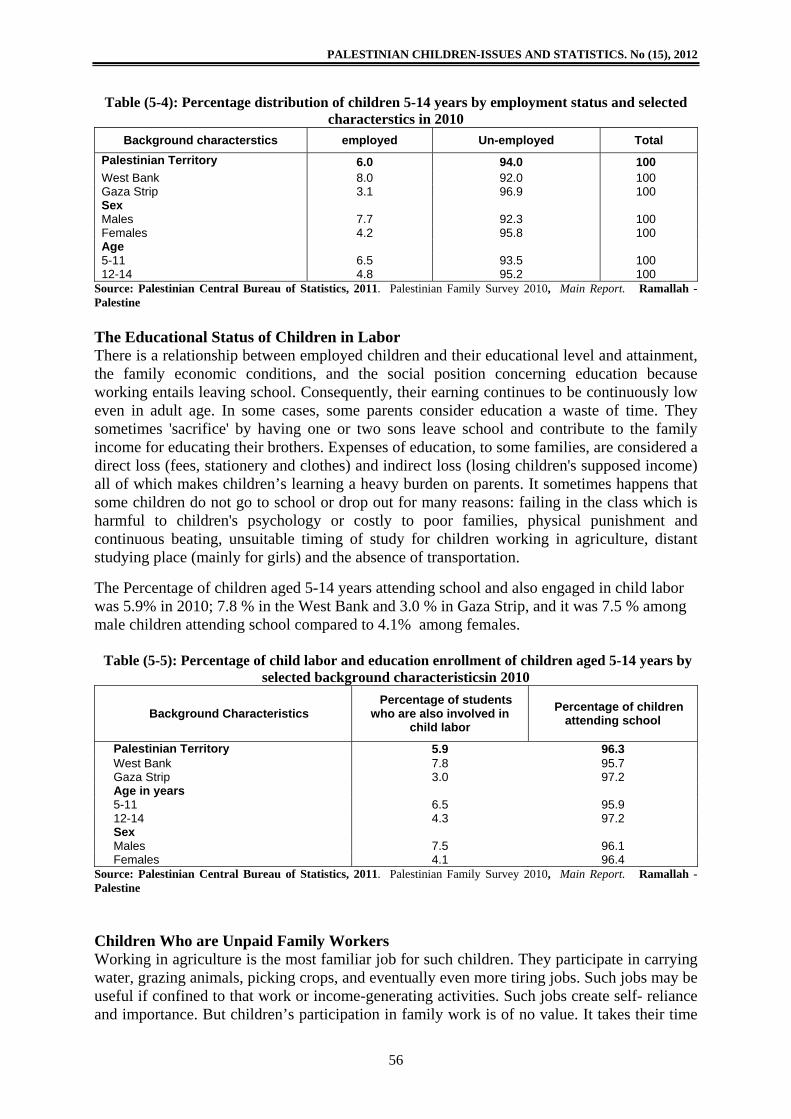
PALESTINIAN CHILDREN-ISSUES AND STATISTICS. No (15), 2012
56
Table (5-4): Percentage distribution of children 5-14 years by employment status and selected characterstics in 2010
Background characterstics employed Un-employed Total Palestinian Territory 6.0 94.0 100 West Bank 8.0 92.0 100 Gaza Strip 3.1 96.9 100 Sex Males 7.7 92.3 100 Females 4.2 95.8 100 Age 5-11 6.5 93.5 100 12-14 4.8 95.2 100
Source: Palestinian Central Bureau of Statistics, 2011. Palestinian Family Survey 2010, Main Report. Ramallah - Palestine The Educational Status of Children in Labor There is a relationship between employed children and their educational level and attainment, the family economic conditions, and the social position concerning education because working entails leaving school. Consequently, their earning continues to be continuously low even in adult age. In some cases, some parents consider education a waste of time. They sometimes 'sacrifice' by having one or two sons leave school and contribute to the family income for educating their brothers. Expenses of education, to some families, are considered a direct loss (fees, stationery and clothes) and indirect loss (losing children's supposed income) all of which makes children’s learning a heavy burden on parents. It sometimes happens that some children do not go to school or drop out for many reasons: failing in the class which is harmful to children's psychology or costly to poor families, physical punishment and continuous beating, unsuitable timing of study for children working in agriculture, distant studying place (mainly for girls) and the absence of transportation. The Percentage of children aged 5-14 years attending school and also engaged in child labor was 5.9% in 2010; 7.8 % in the West Bank and 3.0 % in Gaza Strip, and it was 7.5 % among male children attending school compared to 4.1% among females.
Table (5-5): Percentage of child labor and education enrollment of children aged 5-14 years by
selected background characteristicsin 2010
Background Characteristics Percentage of students
who are also involved in child labor
Percentage of children attending school
Palestinian Territory 5.9 96.3 West Bank 7.8 95.7 Gaza Strip 3.0 97.2 Age in years 5-11 6.5 95.9 12-14 4.3 97.2 Sex Males 7.5 96.1 Females 4.1 96.4
Source: Palestinian Central Bureau of Statistics, 2011. Palestinian Family Survey 2010, Main Report. Ramallah - Palestine Children Who are Unpaid Family Workers Working in agriculture is the most familiar job for such children. They participate in carrying water, grazing animals, picking crops, and eventually even more tiring jobs. Such jobs may be useful if confined to that work or income-generating activities. Such jobs create self- reliance and importance. But children’s participation in family work is of no value. It takes their time
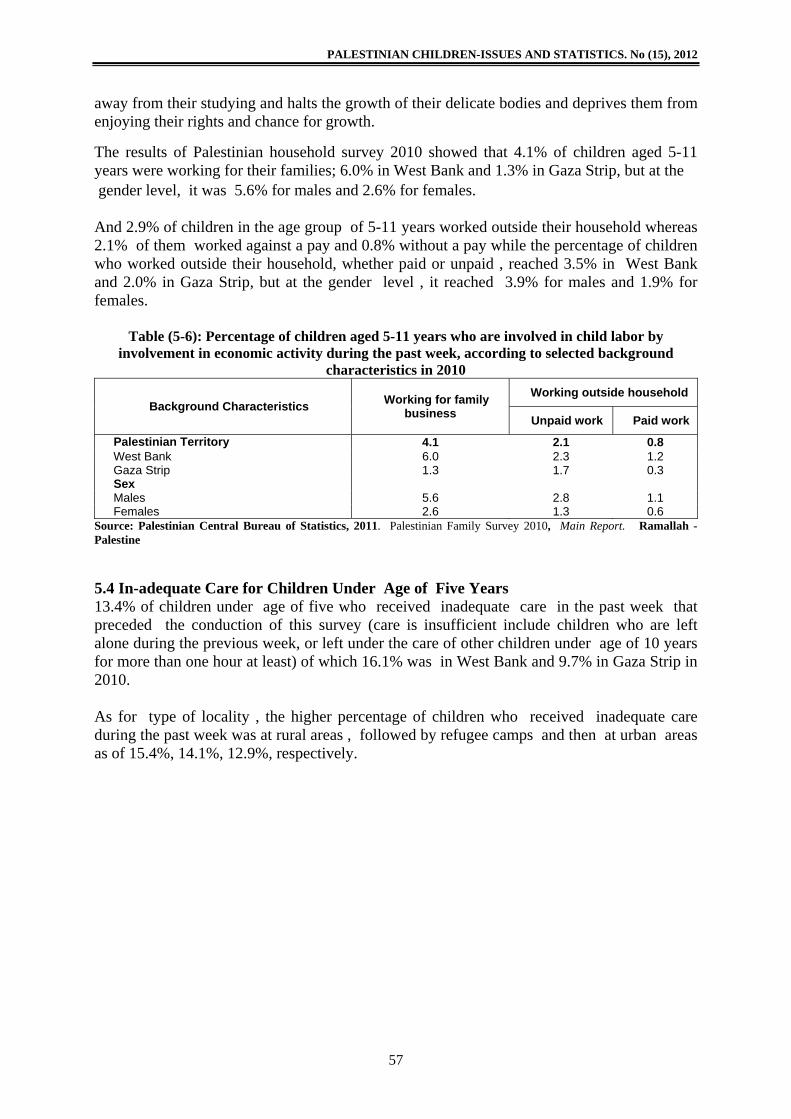
PALESTINIAN CHILDREN-ISSUES AND STATISTICS. No (15), 2012
57
away from their studying and halts the growth of their delicate bodies and deprives them from enjoying their rights and chance for growth. The results of Palestinian household survey 2010 showed that 4.1% of children aged 5-11 years were working for their families; 6.0% in West Bank and 1.3% in Gaza Strip, but at the
gender level, it was 5.6% for males and 2.6% for females. And 2.9% of children in the age group of 5-11 years worked outside their household whereas 2.1% of them worked against a pay and 0.8% without a pay while the percentage of children who worked outside their household, whether paid or unpaid , reached 3.5% in West Bank and 2.0% in Gaza Strip, but at the gender level , it reached 3.9% for males and 1.9% for females.
Table (5-6): Percentage of children aged 5-11 years who are involved in child labor by involvement in economic activity during the past week, according to selected background
characteristics in 2010
Background Characteristics Working for family business
Working outside household
Unpaid work Paid work
Palestinian Territory 4.1 2.1 0.8 West Bank 6.0 2.3 1.2 Gaza Strip 1.3 1.7 0.3 Sex Males 5.6 2.8 1.1 Females 2.6 1.3 0.6
Source: Palestinian Central Bureau of Statistics, 2011. Palestinian Family Survey 2010, Main Report. Ramallah - Palestine
5.4 In-adequate Care for Children Under Age of Five Years 13.4% of children under age of five who received inadequate care in the past week that preceded the conduction of this survey (care is insufficient include children who are left alone during the previous week, or left under the care of other children under age of 10 years for more than one hour at least) of which 16.1% was in West Bank and 9.7% in Gaza Strip in 2010. As for type of locality , the higher percentage of children who received inadequate care during the past week was at rural areas , followed by refugee camps and then at urban areas as of 15.4%, 14.1%, 12.9%, respectively.
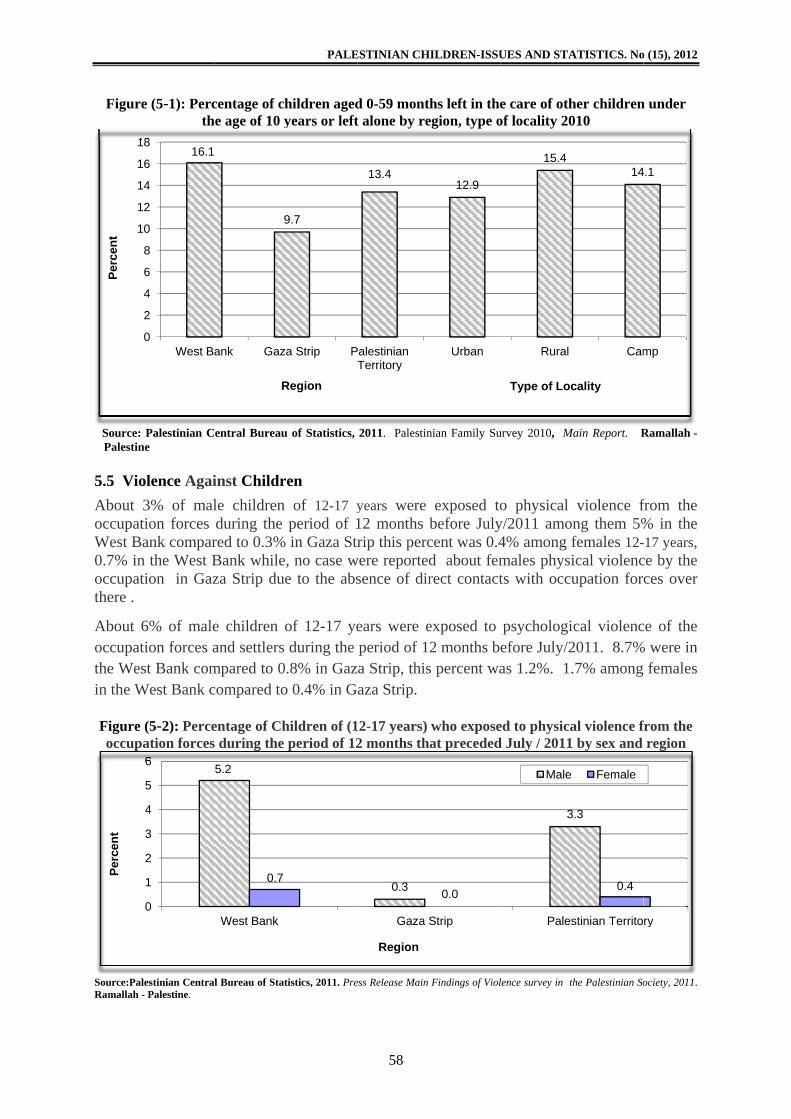
Figure
Source:
Palestin
5.5 Vio
About occupatWest Ba0.7% inoccupatthere .
About 6occupatthe Wesin the W
Figure occup
Source:PalRamallah -
1
1
1
1
1
Perc
ent
Perc
ent
e (5-1): Percth
Palestinian Cne
olence Agai3% of maltion forces ank compar
n the West Btion in Gaz
6% of maletion forces ast Bank com
West Bank c
(5-2): Perceation forces
lestinian Centra- Palestine.
16.1
0
2
4
6
8
0
2
4
6
8
West Ba
0
1
2
3
4
5
6
centage of che age of 10 y
entral Bureau
inst Childrle children during the red to 0.3%Bank whileza Strip due
e children oand settlers mpared to 0compared to
entage of Ch during the
l Bureau of Stat
9
ank Gaz
R
5.2
0.7
West Bank
PALE
hildren agedyears or left
u of Statistics,
ren of 12-17 y
period of 1 in Gaza Str, no case we to the abs
of 12-17 yeduring the .8% in Gaz
o 0.4% in G
hildren of (1period of 12
tistics, 2011. Pre
9.7
a Strip P
Region
ESTINIAN CH
58
d 0-59 montt alone by re
2011. Palestin
years were 12 months rip this perc
were reportedsence of dir
ears were eperiod of 1a Strip, thisaza Strip.
12-17 years) 2 months th
ess Release Main
13.4
Palestinian Territory
0.3
Gaza S
Region
HILDREN-ISSU
ths left in theegion, type o
nian Family Su
exposed tobefore Julycent was 0.4d about femrect contact
exposed to 2 months bs percent wa
who exposeat preceded
Findings of Viol
12.9
Urban
0.0
Strip
UES AND STA
e care of othof locality 20
urvey 2010, M
o physical y/2011 amo4% among fmales physits with occu
psychologiefore July/2as 1.2%. 1.
ed to physicad July / 2011
lence survey in t
15.4
Rural
Type of Loc
3
Pales
Male
ATISTICS. No
her children010
Main Report. R
violence fong them 5%females 12-ical violencupation for
ical violenc2011. 8.7%.7% among
al violence f1 by sex and
the Palestinian So
14
Cam
cality
3.3
0.4
stinian Territo
Female
o (15), 2012
n under
Ramallah -
from the % in the -17 years, ce by the ces over
ce of the % were in
females
from the region
ociety, 2011.
4.1
mp
ry
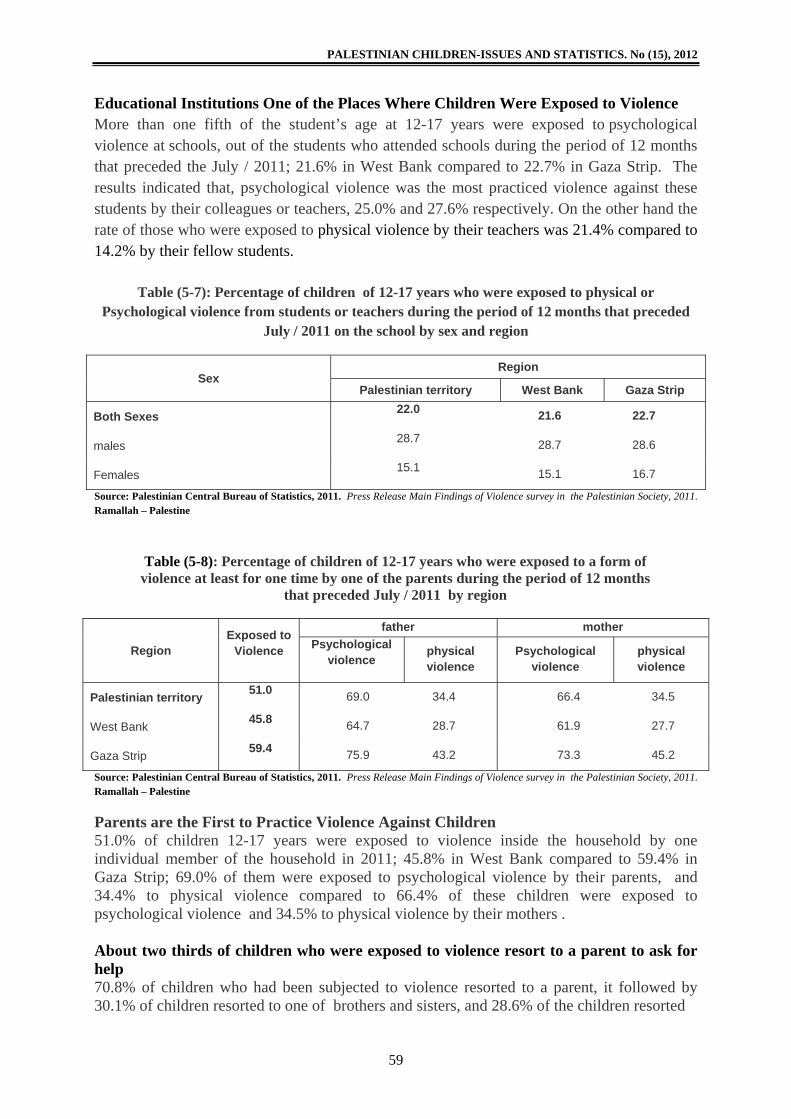
PALESTINIAN CHILDREN-ISSUES AND STATISTICS. No (15), 2012
59
Educational Institutions One of the Places Where Children Were Exposed to Violence More than one fifth of the student’s age at 12-17 years were exposed to psychological violence at schools, out of the students who attended schools during the period of 12 months that preceded the July / 2011; 21.6% in West Bank compared to 22.7% in Gaza Strip. The results indicated that, psychological violence was the most practiced violence against these students by their colleagues or teachers, 25.0% and 27.6% respectively. On the other hand the rate of those who were exposed to physical violence by their teachers was 21.4% compared to 14.2% by their fellow students.
Table (5-7): Percentage of children of 12-17 years who were exposed to physical or Psychological violence from students or teachers during the period of 12 months that preceded
July / 2011 on the school by sex and region
Region Sex
Gaza Strip West Bank Palestinian territory
22.7 21.6 22.0Both Sexes
28.6 28.7 28.7 males
16.7 15.1 15.1 Females Source: Palestinian Central Bureau of Statistics, 2011. Press Release Main Findings of Violence survey in the Palestinian Society, 2011. Ramallah – Palestine
Table (5-8): Percentage of children of 12-17 years who were exposed to a form of violence at least for one time by one of the parents during the period of 12 months
that preceded July / 2011 by region
mother father Exposed to
Violence Region physical violence
Psychological violence
physical violence
Psychological violence
34.5 66.4 34.4 69.0 51.0 Palestinian territory
27.7 61.9 28.7 64.7 45.8 West Bank
45.2 73.3 43.2 75.9 59.4 Gaza Strip
Source: Palestinian Central Bureau of Statistics, 2011. Press Release Main Findings of Violence survey in the Palestinian Society, 2011. Ramallah – Palestine
Parents are the First to Practice Violence Against Children 51.0% of children 12-17 years were exposed to violence inside the household by one individual member of the household in 2011; 45.8% in West Bank compared to 59.4% in Gaza Strip; 69.0% of them were exposed to psychological violence by their parents, and 34.4% to physical violence compared to 66.4% of these children were exposed to psychological violence and 34.5% to physical violence by their mothers . About two thirds of children who were exposed to violence resort to a parent to ask for help 70.8% of children who had been subjected to violence resorted to a parent, it followed by 30.1% of children resorted to one of brothers and sisters, and 28.6% of the children resorted
PALESTINIAN CHILDREN-ISSUES AND STATISTICS. No (15), 2012
60
to a friend. Also, data revealed that 20.2% of children resorted to a social adviser at school, while 12.3% of children resorted to a teacher . 5.6 Detained Children
No child shall be deprived of his or her liberty unlawfully or arbitrarily. The arrest, detention or imprisonment of a child shall be in conformity with the law and shall be used only as a measure of last resort and for the shortest appropriate period of time. (Convention on the Rights of the Child, Article 37). The Israeli occupation deprives detained Palestinian children from their basic rights awarded by international agreements regardless of their religion, race or ethnicity. These rights prohibit random imprisonment, and guarantee knowing the reason of imprisonment, the right of having a lawyer, informing families about the reason and place of their children’s imprisonment, connections to the outside word, refuting the allegations and having human and dignified treatment. Many international charters state that torturing children is taboo in prisons and jails:
"Torturing, severe punishment, inhuman and undignified treatment are prohibited. "( International Declaration of Human Rights, Article 5).
“Every member country undertakes that all kinds or torturing are war crimes in its criminal law including any person involved in torturing."
(Convention Against Torture, Article 4). "No exceptional conditions such as war condition or threatening by war or any political instability or crises and emergency cases are excuses for torturing."
(Convention Against Torture, Article 2-2). "Each is prohibited from taking any measure of such a character as to cause the physical suffering or extermination of Protected Persons in their hands. This prohibition applies not only to murder, torture, corporal punishments, mutilation, and medical or scientific experiments not necessitated by the medical treament of a Protected Person but also to any other measures of brutality whether applied by civilian or miltiary agents.”
(The Fourth Geneva Convention, Article 32) Despite these charters and international agreements, Israel violates these norms and practices by using extreme types of psychological and physical punishment against Palestinian children in jails not only during interrogations but during other stages. These quotations talk about young and old individuals. But the Convention on the Rights of the Child, Article 37-d, states that: "Every child deprived of his or her liberty shall have the right to prompt access to legal and other appropriate assistance…before a court or other competent, independent and impartial authority…” In many cases, lawyers do not have easy access to their clients who are also judged in courts for adults. Moreover, children of Jerusalem are jailed with Jewish criminals who threaten their lives. It is worth mentioning that Israel is a signatory to all treaties and international charters for children.
PALESTINIAN CHILDREN-ISSUES AND STATISTICS. No (15), 2012
61
Israel practices racial discrimination against Palestinian children. It has a double-standard law when dealing with Jewish children who receive a fair judgment. Furthermore, Israel considers Jewish children to be those under18 while Palestinian children are those under 16 years old. According to the data of the Ministry for Detainees and Prisoners in 2012, the Israeli occupation authorities are holding 179 child in the age group13-18 years, amid harsh conditions and flagrant violations of all rights. Detained children constitute about 4.4% of the total detainees in Israeli jails. Among the detained children, there are (42) serving sentenced terms, (136) awaiting pending trial, and (1) children are under administrative detention without charge. It is worth mentioning in this context that hundreds of detainees were arrested when they were children and now they are over the age of 18 years but still in captivity inside Israeli jails. According to the same source, the Israeli occupation authorities exercise harsh methods of arrest and interrogation of Palestinian children in Occupied Palestinian Territory. Furthermore, the Israeli occupation authorities deprive detained children of the most basic rights granted by international and human rights conventions, specifically the right to not be subjected to arbitrary arrest, the right to know the reason for the arrest, the right to have an attorney, the right of families to know the cause and place of detention, the right to appear before a judge, the right to object to charges and challenge them, the right to communicate with the outside world, and the right to humane treatment that maintain the dignity of the detained child. Torture of Children in Israeli jails According to data of the Ministry for Detainees and Ex-War Prisonersof2012, the Israeli occupation authorities used detention and interrogation methods against children in the same manner as with adult detainees. Children detainees are subjected from the moment of arrest to varying types of torture, humiliation, and cruel treatment. Children detainees are forcefully and brutally taken away from their homes in late night hours and are subjected to degrading treatment while being transported to detention centers. In addition, these children are usually subjected to various methods of investigation along with unfair arbitrary court procedures. Interrogation methods with children include the beating with a focus on the upper body parts and head, body burning with cigarette, threat to deport their families, head sacking, blowing up homes, cuffing hands and legs, blindfolding, the use of electric shocks, and ghosting (forced to stand up against the wall with hands up for long period of time). In addition, the Israeli authorities exercise inhumane interrogation methods that include deprivation of sleep for several days, applying psychological stress, insults and verbal abuse, as well as violent shaking (carrying the child and shake him frequently till the child loses conscious). Detained children are also subjected to torture methods such as spraying them with cold and hot water for long periods, forcing them to eat ice cubes, in addition to applying loud noise to the ears causing great harm and psychological stress to the detained child. According to the same source, the most serious type of torture and interrogation that children suffer is to confine them in same detention room notoriously known as "disgrace rooms" with collaborators in order to extract confessions deceptively, as well as to threaten detained children with imprisonment for long periods, demolition of their homes as well as the arrest of members of the family, if they do not cooperate with Israeli intelligence.
PALESTINIAN CHILDREN-ISSUES AND STATISTICS. No (15), 2012
62
References
- Palestinian Central Bureau of Statistics, 2010. Annual Report 2010. Palestine children –Issues and statistics. Child statistics series (No. 13) . Ramallah – Palestine.
- Palestinian Central Bureau of Statistics, 2011. Labor Force Survey 2010 - Labor Force Database.(unpublished data)- Ramallah- Palestine
- Palestinian Central Bureau of Statistics, 2011. data base of Palestinian Expenditure and consumption survey, 2010 . (unpublished data)- Ramallah- Palestine.
- Ministry for Detainees and Prisoners. 2012. Administrative records. Ramallah-
Palestine