Embed Size (px)
Citation preview
1
ENHANCING
PALESTINE - MERCOSUR TRADE
RELATIONS
Assessing Palestine – MERCOSUR trade relations using
Sussex Framework
DECEMBER 2014
Prepared by
PalTrade – Palestine Trade Center
This assessment was made possible through the Canadian
Department of Foreign Affairs, Trade and Development (DFATD).
The contents of the document are the sole responsibility of
PalTrade and do not necessarily reflect the view of DFATD. © PalTrade: Palestine, 2014

2
Executive summary
The present assessment aims at providing an overview of Palestine’s trade with the MERCOSUR
countries between 1996 and 2013, evaluating the potential impact of the MERCOSUR-Palestine
Free Trade Agreement (MPFTA)1 which was signed in 2011 but has not entered into force yet,
identifying opportunities for trade creation, and key obstacles to trade. The assessment is based on
key features of Sussex Framework, a methodology developed by researchers at the University of
Sussex.
The first part of our assessment is therefore dedicated to providing an overview of
Palestine’s trade with MERCOSUR. As we shall see, MERCOSUR has so far been an
insignificant trade partner for Palestine’s exports. Until 2010, Palestine’s exports to MERCOSUR
did not exceed 2,500 USD. In 2010, Palestine exported sawing machines for working stone,
ceramics and glass at the value of 200 thousand USD. Furthermore, while dates were exported in
2011 and 2012 at the total value of 135 thousand USD, no exports were registered in 2013. Within
MERCOSUR, nearly all of Palestine’s exports were directed to Brazil.
For imports however, MERCOSUR has been a fairly strong trade partner throughout time. With an
imported value of 26.4 million USD in 2013, MERCOSUR accounts for 0.5% of Palestine’s world
imports. Throughout time, import products were concentrated with frozen meat products & fish,
coffee, cane sugar and tobacco, with Brazil accounting for 74% of Palestine’s imports during
1996-2013, followed by Argentina (15.9%), Uruguay (5.2%), Paraguay (4.2%) and Venezuela
(0.6%).
The second part of the assessment addresses shallow integration, i.e. the potential impact of
tariff measures taken under MPFTA. In a nutshell, while we have identified high potential for
trade creation in many sectors, the majority of these products have not been prioritized under
MPFTA’s tariff exemption program.
When looking first at Israeli and MERCOSUR’s applied AHS tariffs at the total trade level, we
find that while Israeli tariffs have been low throughout time at around 5.1%, MERCOSUR’s tariffs
have been relatively high at average levels of 14.9% for Brazil, 13.5% for Argentina, 13.2% for
Venezuela, 12.2% for Paraguay, 11.7% for Uruguay. Additionally, Israel’s applied tariff peaks are
relatively low, whereas we have identified a very high number of tariff peaks applied in the
MERCOSUR countries. This suggests that for Palestine, there may be considerable scope for trade
creation through tariff reduction/exemption in certain sectors.
Having said this, we first look at Palestine’s top 25 exports in the years 2007-2013 and find that
MERCOSUR applies tariff peaks in the following sectors:
1 Can be downloaded at URL:
http://www.mercosur.int/t_generic.jsp?contentid=6150&site=1&channel=secretaria&seccion=2 [last access on
04/12/2014]

3
- Sacks & bags,
- Cigarettes containing tobacco,
- Waterproof footwear,
- Wooden furniture,
- Olive oil,
- Bars & rods,
- Mattresses,
- Seats with wooden frames,
- Yogurt,
- Sugar confectionary,
- Organic washing/cleaning preparations,
- Sausages;
Additionally, MERCOSUR applies particularly high AHS tariffs (>20%) in the following
sectors:
- Furniture: Metal office furniture, wooden office furniture, plastic furniture;
- Footwear: Footwear with rubber sole, leather footwear;
- Textile: Woven fabric with synthetic filament, pullovers and cardigans, women/girls
trousers;
- Dairy: Fresh cheese, Milk and cream powder;
- Trailers.
To explore further the export potential of the products which we have identified, we have also
looked at their revealed comparative advantage (RCA) at different levels: Palestine’s RCA in
the world, Palestine’s RCA in the world relative to MERCOSUR and Palestine’s RCA in the world
relative to Israel. Looking at all the three levels, the overall result shows that Palestine’s
comparative advantage is particularly high for
- yogurt,
- sacks & bags,
- woven fabric with synthetic filament,
- waterproof footwear,
- office furniture and
- mattresses.
Lastly, in order to identify potential for trade creation, we take into consideration MERCOSUR’s
demand based on imports and exports in the discussed sectors. We find that while the demand is
low for slabs of stone, scrap ingots, waste/scrap of tinned iron/steel, wooden pallets, granite and
milk & cream powder, MERCOSUR’s demand appears to be particularly high for
- slabs of marble,
- agricultural produce (olive oil, plants and parts thereof, incl. fresh herbs, cereals)
- bars & rods,

4
- medicaments,
- furniture (seats with wooden frames, metal office furniture, plastic furniture)
- polymers of ethylene,
- ceramic mosaic tiles,
- organic washing/cleaning preparations and
- footwear.
Having identified a list of products with considerable export potential for Palestine, we next take
into consideration MPFTA’s tariff reduction program, and the list of concessions negotiated
between Palestine and MERCOSUR. This analysis brings into light that unfortunately, the great
majority of our identified products with export potential are not subject to immediate customs
exemption (“Category A”) in MERCOSUR.
Table 1 below illustrate that in fact, only 3 products at the 6-digit level (slabs of marble, olive oil
and copper) as well as 15 products at the 8-digit level are provided immediate tariff exemption in
MERCOSUR, while for all other products, tariff exemption is going to take place only within 4, 8
or 10 years.
The table above also includes MERCOSUR’s concessions for Israel, revealing that predominantly,
the same concessions were provided to Palestine and Israel. However, one needs to take into
consideration that Israel’s FTA with MERCOSR has entered into force in 2010, while MPFTA’s
entry into force is still pending. For this reason, MERCOSUR’s concessions are, for the time
being and in the first 10 years after entry into force of MPFTA, considerably more favorable
to Israel than to Palestine.
Table 1: MERCOSUR’s concessions under MPFTA for Palestine’s products with export
potential
Product Product Name
MER
applied
AHS tariff
on WLD
imports
Tariff exemption for Palestine
under MPFTA upon entry into
force
Tariff exemption for Israel under
Israel-MERCOSUR FTA (entry
into force April 2010)
680221 Cut or sawn slabs of marble, trave.. 8.90% Immediate Within 3 years
392321 Sacks & bags (including cones) o.. 16.64% Within 8 and 10 years Within 8 and 10 years
240220 Cigarettes containing tobacco 16.12% Within 10 years Within 10 years
640199 Waterproof footwear(Wellington).. 31.03% n.a. n.a.
940350 Bedroom furniture, wooden, nes 16.46% Within 8 years Within 10 years
150910 Olive oil, virgin 12.90% Immediate Within 8 years
760429 Bars, rods and other profiles, .. 8.95% Within 8 years, immediate for
certain tariff line
Within 8 years, immediate for
certain tariff line
300490 Medicaments nes, in dosage 9.09%
Most tariff lines within 8 and
10 years, certain tariff lines
immediate.
Most tariff lines within 8 and 10
years, certain tariff lines
immediate.
940429 Mattresses, stuffed, spring interior.. 20.17% Within 10 years Within 10 years
121190 Plants & parts, pharmacy, perfume.. 7.50% Within 4 years Within 4 years
940161 Seats with wooden frames, .. 20.01% Within 10 years Within 10 years
390190 Polymers of ethylene nes, in .. 8.25% Certain tariff lines immediate,
others within 8 years.
Certain tariff lines immediate,
others within 8 years.

5
040310 Yogurt 14.67% Within 4 years Within 4 years
721399 Bars&rods,iron/na st irr 9.10% Within 4 years Within 8 years
740400 Copper/copper alloy waste or scrap 2.00% Immediate Immediate
690810 Glazed ceramic mosaic tiles, cube.. 13.88% Within 8 years Within 8 years
100890 Cereals unmilled nes 4.41% One tariff line immediate,
another within 4 years. Immediate
170490 Sugar confectionery not chewing.. 17.50% Within 4 years Within 4 years
340290 Organic surfactant washing, clea.. 11.33%
Immediate for certain tariff
lines, others within 8 and 10
years.
Immediate for certain tariff
lines, others within 8 and 10
years.
160100 Sausages, similar products of meat,
meat .. 15.04% Within 4 years Within 10 years
940310 Office furniture, metal, nes 20.61% Within 8 years Within 10 years
640419 Footwear,sole rubber/plastic,uppe.. 29.89% Within 8 years Within 10 years
940370 Furniture, plastic, nes 20.23% Within 8 years Within 10 years
540791 Woven fabric synthetic filament nes 20.42% Within 10 years Within 10 years
040610 Fresh cheese, unfermented whey .. 21.17% Within 4 years Within 8 years
640351 Footwear, soles, uppers of leather.. 28.78% Within 8 years Within 10 years
871639 Trailers nes for the transport of .. 22.89% n.a. n.a.
In a nutshell, there is considerable potential for shallow integration induced trade effects for
Palestine, if tariff measures are taken in the above mentioned sectors. As stated in Chapter III, Art.
3 of MPFTA, “[u]pon request of either Party, the Parties shall consider granting further
concessions in their bilateral trade”. Having said this, further efforts must be taken in order to
include at least the above mentioned products in MERCOSUR’s list of Category A
concessions. In addition, the list shall be modified further in order to provide Palestinian
exporters with – at least – the same tariff treatment as Israel.
In addition, in order to create trade, tariff measures must go along with behind-the-border
measures. Therefore, we lastly turn our attention to deep integration measures taken under
USPTA. As we shall see, MPFTA provides the coverage of many instruments for deep integration,
including customs cooperation and rules of origin, trade remedies (safeguards, subsidies and anti-
dumping measures), technical regulations, standards and conformity assessment procedures,
sanitary and phytosanitary measures and technical and technological cooperation. If, as suggested
in MPFTA, the Parties will establish cooperation mechanisms in these fields and start negotiations
for agreements in the fields of investment and services, and with the economic and political
support from the MERCOSUR countries, Palestine will be able to considerably benefit from these
instruments.

6
Table of Contents
Executive summary ................................................................................................................ 2
List of Abbreviations .............................................................................................................. 8
Background ............................................................................................................................. 9
A snapshot of Palestinian economic performance................................................................ 12
Palestine-MERCOSUR trade relations ................................................................................. 14
Trade Shares ...................................................................................................................... 17
Trade Structure .................................................................................................................. 24
Shallow integration effects ................................................................................................... 28
Deep integration ................................................................................................................... 39
Instruments of deep integration in MPFTA.......................................................................... 39
Summary and Conclusions ................................................................................................... 42
Appendices ........................................................................................................................... 46

7
List of Figures
Figure 1: Palestinian GDP per capita at constant prices ................................................................................ 12
Figure 2: Sectorial distribution of GDP at constant prices ............................................................................ 13
Figure 3: Breakdown of services contribution to GDP at constant prices 1994-2012 ................................... 13
Figure 4: Palestinian total trade with the world 1996-2013 ........................................................................... 14
Figure 5: Palestinian total trade with MERCOSUR 1996-2013 .................................................................... 15
Figure 6: Palestinian exports to MERCOSUR by country (details in Annex II) ........................................... 16
Figure 7: Palestinian imports from MERCOSUR by country (details in Annex II) ...................................... 17
Figure 8: Top trade partners for the MERCOSUR’s imports 1996-2013 (details in Annex III) ................... 20
Figure 9: Top trade partners for MERCOSUR’s exports 1996-2013 (details in Annex III).......................... 20
Figure 10: Top trade partners for Palestine’s imports 1996-2013 (details in Annex IV) .............................. 23
Figure 11: Top trade partners for Palestine’s exports 1996-2013 (details in Annex IV) ............................... 23
Figure 12: Palestinian exports to MERCOSUR (Annex V)........................................................................... 24
Figure 13: Top 5 Palestinian imports from MERCOSUR between 1996 and 2006 (Annex VI) ................... 25
Figure 14: Top 5 Palestinian imports from MERCOSUR between 2007 and 2013 (Annex VI) ................... 25
Figure 15: Evolution of tariffs in Israel and MERCOSUR over time (Simple average AHS in %) .............. 28
List of Tables
Table 1: MERCOSUR’s concessions under MPFTA for Palestine’s exports ................................................. 4
Table 2: Palestinian total trade with MERCOSUR 1996-2013 ..................................................................... 15
Table 3: Geographical distribution of Palestine’s trade with MERCOSUR 1996-2013 (Annex II) .............. 17
Table 4: Geographical distribution of MERCOSUR’s imports in 2013 ........................................................ 18
Table 5: Geographical distribution of MERCOSUR’s exports in 2013 ........................................................ 19
Table 6: Geographical distribution of Palestine’s imports in 2013 ................................................................ 21
Table 7: Geographical distribution of Palestine’s exports in 2013 ................................................................ 22
Table 8: Palestinian top 25 imports from MERCOSUR in 2013 ................................................................... 27
Table 9: Comparative tariff profiles of Israel and MERCOSUR on world imports ...................................... 29
Table 10: Palestinian top world exports between 2007-2013 and MERCOSUR’s applied tariffs ................ 31
Table 11: MERCOSUR’s applied tariff peaks for Palestine’s exports to the world (2013) .......................... 33
Table 12: RCAs for Palestine’s world exports (2013) ................................................................................... 35
Table 13: MERCOSUR’s imported/exported value of Palestine’s exports (2013) ....................................... 36
Table 14: Products with export potential and assigned tariff reduction categories under MPFTA ............... 38
Table 15: MERCOSUR’s concessions under MPFTA for Palestine’s exports ............................................. 44
List of Appendices
Annex I: The Sussex Framework ................................................................................................................... 46
Annex II: Geographical distribution of Palestine’s total trade with MERCOSUR by country (1996-2013). 48
Annex III: MERCOSUR’s top trade partners 1996-2013 .............................................................................. 51
Annex IV: Palestine’s top trade partners 1996-2013 ..................................................................................... 60
Annex V: Palestinian exports to MERCOSUR (by product and year) .......................................................... 67
Annex VI: Palestinian imports from MERCOSUR (by product and year) .................................................... 68
Annex VII: MERCOSUR’s applied tariff peaks for Palestine’s world exports (2013) ................................. 75

8
List of Abbreviations
AHS Tariff: Effectively Applied Tariff
AVE Tariff: Ad Valorem Equivalent Tariff
EFTA: European Free Trade Association
EU: European Union
FKI: Finger-Kreinin-Index
FTA: Free Trade Agreement
GAFTA: Greater Arab Free Trade Area
GLI: Grubel-Lloyd-Index
HS: Harmonized System
IIT: Intra-Industry Index
MERCOSUR: Common Market of the South
MPFTA: MERCOSUR-Palestine Free Trade Agreement
PCBS: Palestinian Central Bureau of Statistics
RCA: Revealed Comparative Advantage
RMA: Revealed Market Access
SF: Sussex Framework
SITC: Standard International Trade Classification

9
Background
Since the foundation of the Palestinian National Authority (PNA), the Israeli-Palestinian Interim
Agreement (hereby referred to as “Paris Protocol”) has been the only basis to regulate economic
relations between Israel and Palestine. Although it was designated for an interim period only
(1994-1999), the Paris Protocol is still in force till date. The Oslo Agreement, of which Paris
Protocol forms an integral part, gives Palestine the right to negotiate and conclude agreements as
long as the same import policy is applied in Israel and the Palestine. Therefore, Palestine signed
several trade agreements in an attempt to improve and flourish the Palestinian economy, the
ultimate objective of which was to reduce dependence on a single market and create an enabling
business environment.
The Paris Protocol created a quasi-customs union between Israel and Palestine formulated on the
free movement of goods between the two markets without any type of tariff and non-tariff barriers;
and the adoption of a joint/unified tariff list while giving the Palestine the right to determine duties
and standards requirements for a list of basic or strategic commodities known as lists A1, A2, and
B. List A1 refers to locally produced goods originating in Arab countries and Jordan and Egypt
particularly, whereas List A2 applies to goods from Arab, Islamic and other countries. Goods in
List B are basic food items and other goods for the Palestinian economic development program.
However, as for the goods specified in these lists, tariffs are till date the same as those applied by
Israel. For imports from Israel, Palestinian applied tariffs are zero.
With respect to goods not specified in these lists, Israeli customs duties serve as the minimum
basis for Palestinian applied tariffs. Based thereupon, in an attempt to protect local industries, the
Palestinian Customs Authority collects (additional) duties for imported items in the sectors shoes
and leather, textiles, furniture and aluminium. These duties are applied irrespective the country of
origin, except for countries that Palestine has concluded trade agreements/arrangements with.
Furthermore, the Paris Protocol gives Palestine the right to determine duties for imports of cars and
petroleum. Based thereupon, the Palestinian Customs Authority filed a request to reduce the
purchase tax on car imports to 50% (for cars < 2000 cc) and 75% (for cars > 2000 cc), which was
approved by Israeli authorities and has been in place since mid-2013.
Strategically, Palestine prioritized signing agreements with countries that had Free Trade
Agreements (FTAs) with Israel. The underlying logic was to grant Palestinian exports preferential
treatment since imports from these countries entered the Palestinian market duty free based on
their trade agreements with Israel and the “quasi” customs union between Palestine and Israel
under the Paris Protocol. The agreements signed by Palestine include the Interim Association
Agreements (IAA) with the European Union (EU) and European Free Trade Association (EFTA),
Greater Arab Free Trade Area (GAFTA), a Free Trade Agreement with Turkey, a Framework
Agreement with Canada, a Trade Arrangement with the USA and an FTA with the Common
Market of the South (MERCOSUR), last of which to date has not entered into force yet.

10
Further, especially with respect to products on lists A1, A2, and B, Palestine signed preferential
trade agreements with both Jordan and Egypt to strengthen and flourish the Palestinian economy
by exercising rights granted under the Paris Protocol. Israeli Customs, while still in control of
external borders for Palestine, would clear goods imported by Palestinian traders on behalf of
Palestinian Customs and then transfer this money to Palestine; 3% of the total transfers is taken by
Israel as administrative expenses.
The MERCOSUR-State of Palestine Free Trade Agreement (MPFTA) was signed in
December 2011, after one year of negotiations, between Palestine and MERCOSUR Member
Countries, including The Argentine Republic, the Federative Republic of Brazil, the Republic of
Paraguay and the Oriental Republic of Uruguay. Venezuela became a Member of MERCOSUR
later on. To date, the agreement has not entered into force yet.
Although MPFTA’s primary objective is to strengthen relations between the Parties through
eliminating trade barriers and facilitating the movement of goods, the Agreement also aims at i)
promoting conditions of fair competition in the free trade area; ii) to substantially boost investment
opportunities and increase cooperation in areas of mutual interest, iii) to create effective
procedures for the implementation, application and compliance of the Agreement and its joint
administration; and iv) to set a framework for further bilateral and multilateral cooperation aimed
at expanding and enhancing the benefits of the Agreement.
Besides, MERCOSUR and Palestine agree that the Agreement shall be consistent with WTO
Agreements, including GATT 1994, and its successor agreements and other agreements to which
the Parties are party.
In relation to the core issue of tariff reduction, products were classified into six categories, five
with different reduction levels and stages and one with the products subject to preferences under
specified conditions:
Category A: customs duties shall be eliminated when the Agreement enters into force;
Category B: customs duties shall be eliminated over a period of four years, in four equal
stages, the first one taking place on the date of entry into force of this Agreement and the
other three on 1 January of each successive year;
Category C: Customs duties shall be eliminated over a period of 8 years, in 8 equal stages,
the first one taking place on the date of entry into force of this Agreement and the other
seven on January 1st of each successive year.
Category D: Customs duties shall be eliminated over a period of 10 years, in 10 equal
stages, the first one taking place on the date of entry into force of this Agreement and the
other nine on January 1st of each successive year.
Category E: Customs duties shall be subject to preferences, as specified for each tariff item,
upon entry into force of this Agreement, under the conditions also specified for each tariff
item.

11
Besides a tariff reduction program, MPFTA includes articles on anti-dumping, safeguards,
payments, restrictions to safeguard the balance of payments and customs cooperation. Chapter IV
of the agreement extensively addresses the Rules of Origin. Annex I emphasizes that Palestinian
exports may lose their originating status when exported to a MERCOSUR Member and re-
exported to another one. The Parties agreed that MERCOSUR Members will establish respective
internal procedures within MERCOSUR in the future.
The agreement also includes chapters on technical regulations and procedures for standards and
conformity assessment, sanitary and phytosanitary measures, technical and technological
cooperation, institutional provisions, publications and notifications, dispute settlement and
arbitration.
Recognizing the importance of the areas of investments and trade in services, MPFTA emphasizes
that negotiations in these fields on the basis of GATS may be opened in the framework of the Joint
Committee. In addition, in order to broaden reciprocal knowledge about trade and investment
opportunities in both Palestine and MERCOSUR Member countries, the Parties shall stimulate
trade promotion activities such as seminars, trade missions, fairs, symposia and exhibitions.
The parties decided that once the Agreement is ratified by Palestine and MERCOSUR Member
countries, it will enter into force. The depositary of the Agreement is the Government of the
Republic of Paraguay. It is responsible for notifying all Parties that have signed or acceded to this
Agreement of the deposit of any instrument of ratification, acceptance or accession, the entry into
force of this Agreement, of its expiry or of any withdrawal therefrom.
With this background, the objective of this study is to evaluate the potential impact of MPFTA
using a methodology developed by researchers at the University of Sussex, known as the Sussex
Framework (SF)2.
We divide the report into different sections which revolve around key features of the SF. First, we
identify key aspects of the Palestinian economy. Secondly, we look at the evolution of trade
between Palestine and MERCOSUR. Thirdly, bearing in mind the concessions made by
MERCOSUR and Palestine within the tariff reduction program, we use selected SF indicators to
identify the likelihood for shallow integration induced trade effects. Lastly, we turn to the issue of
deep integration and consider qualitative and quantitative evidence which can shed light on the
potential welfare gains which could arise from deeper integration in MPFTA.
2 Details about Sussex Framework attached as Annex I.

12
A snapshot of Palestinian economic performance
Palestine had a GDP of 7.5 billion USD in 2013 at constant prices (base year 2004) and the
economy grew by 1.9% over 2012-2013. As illustrated in Figure 1, Palestinian GDP per capita has
seen an average annual growth rate of 1.5% throughout the years 1994-2013.
Figure 1: Palestinian GDP per capita at constant prices
Source: PCBS (base year 2004; data for 2013 preliminary and based on predictions)
Furthermore, Figure 2 shows that the Palestinian economy is predominantly services-based; the
sector has accounted for more than 70% of GDP and total employment over time. Within services,
other services constitute the largest share (20% of GDP in 2013), followed by construction
(14.1%) and wholesale and retail trade (14%) (Figure 3). In view of this sectorial distribution, any
agreement involving the Palestine should cover services. Having said this, the majority of
Palestinian trade is in merchandise goods. In 2013, Palestinian net imports of services were 2.6%
of total net imports of goods and services, and net exports of services contributed 20.6% to
Palestinian exports, compared to 17% in 2012. Palestinian total exports have contributed roughly
12.8% to the Palestinian GDP of 2013.3
3 PCBS 2014, “Palestine in Figures 2013”, URL: http://www.pcbs.gov.ps/Portals/_PCBS/Downloads/book2040.pdf (last access:
15.09.2014)

13
Figure 2: Sectorial distribution of GDP at constant prices
Note: Others include ‘Households with employed persons’, ‘Public owned employed persons’, FISIM, Customs
duties, Net VAT on Imports (Source: PCBS)
Figure 3: Breakdown of services contribution to GDP at constant prices 1994-2012
Note: Other services include accommodation and food service activities (hotel & restaurants); real estate activities;
professional, scientific and technical activities; administrative and support service activities; education, health and
social work; and arts, entertainment and recreation. (Source: PCBS)

14
Figure 4 below illustrates the value of Palestinian exports/imports between 1996 and 2013.
Throughout the years, Israel has been Palestine’s major trade partner. In 2013, it has accounted for
71.6% of Palestine’s imports and more than 87% of Palestinian exports. Other important trade
partners are the EU, GAFTA, Turkey, China, USA, South Korea, MERCOSUR, India, Thailand,
Japan, EFTA, Canada and Indonesia. Palestine’s trade relations with the world and MERCOSUR
will be highlighted in more detail in the following chapters.
Figure 4: Palestinian total trade with the world 1996-2013
Palestine-MERCOSUR trade relations
The MERCOSUR-Palestine Free Trade Arrangement (MPFTA) was signed in 2011, providing
immediate duty-free treatment of certain Palestinian exports under Category A, as well as gradual
tariff exception for goods under Categories B, C and D. Besides tariff measures, MPFTA provides
numerous instruments for deep integration, including for technical regulations and procedures for
standards and conformity assessment, sanitary and phytosanitary measures, technical and
technological cooperation, institutional provisions, publications and notifications, dispute
settlement and arbitration.
Unfortunately, because the Agreement is still in the progress of ratification, it has not entered into
force yet.

15
As illustrated in Figure 5 and Table 2, Palestine’s exported value to MERCOSUR was
exceptionally low between 1996 and 2013. Very low exports were registered in 2001 and 2007,
while between 2010 and 2012 the value of exports to MERCOSUR reached a mere 342.32
thousand USD. No exports were registered in 2013.
Imports, on the other hand, were relatively high during the same period. The average annual value
of Palestinian imports from MERCOSUR was 12.75 million USD, increasing from 2.7 million
USD in 1996 to 26.4 million USD in 2013.
Figure 5: Palestinian total trade with MERCOSUR 1996-2013
Table 2: Palestinian total trade with MERCOSUR 1996-2013
Year Imports value (‘000s USD) Exports value (‘000s USD) Imports share Exports share
1996 2,702.00 0.00 0.13% 0.00%
1997 3,777.92 0.00 0.17% 0.00%
1998 4,357.55 0.00 0.18% 0.00%
1999 3,914.28 0.00 0.13% 0.00%
2000 5,856.73 0.00 0.25% 0.00%
2001 8,550.60 0.14 0.42% 0.00%
2002 5,908.25 0.00 0.39% 0.00%
2003 8,546.22 0.00 0.47% 0.00%
2004 12,984.56 0.00 0.55% 0.00%
2005 14,612.08 0.00 0.55% 0.00%

16
2006 19,618.41 0.00 0.71% 0.00%
2007 13,087.38 2.31 0.42% 0.00%
2008 21,090.17 0.00 0.59% 0.00%
2009 20,481.50 0.00 0.57% 0.00%
2010 11,734.17 204.99 0.30% 0.04%
2011 21,886.26 65.33 0.52% 0.01%
2012 24,068.88 72.00 0.51% 0.01%
2013 26,395.85 0.00 0.51% 0.00%
Source: PCBS
Looking now at the geographical distribution of Palestinian exports and imports, Figure 6, Figure 7
and Table 3 illustrate that nearly all (99.7%) of Palestine’s exports to MERCOSUR countries
between 1996 and 2013 were directed to Brazil. The country was also the most significant partner
to Palestine regarding its imports from MERCOSUR. Between 1996 and 2013, around 74% of
imports were sourced in Brazil, followed by Argentina (15.9%), Uruguay (5.2%), Paraguay (4.2%)
and Venezuela (0.6%).
Figure 6: Palestinian exports to MERCOSUR by country (details in Annex II)

17
Figure 7: Palestinian imports from MERCOSUR by country (details in Annex II)
Table 3: Geographical distribution of Palestine’s trade with MERCOSUR 1996-2013 (details in
Annex II)
Year Partner Imports value
000s USD) Imports share
Exports value
('000s USD) Exports share
1996-2013
Brazil 170,063.40 74.08% 343.83 99.73%
Argentina 36,405.82 15.86% 0.94 0.27%
Uruguay 11,953.05 5.21% 0.00 0.00%
Paraguay 9,740.89 4.24% 0.00 0.00%
Venezuela 1,409.64 0.61% 0.00 0.00%
Total 229,572.81 100.00% 344.77 100.00%
Source: PCBS
Trade Shares
Tables 4 and 5 below illustrate MERCOSUR’s trade with its most important trade partners in
2013. Table 4 shows that the EU has been MERCOSUR’s most important partner for imports,
accounting for nearly one fifth of its imports, followed by China, the USA, GAFTA, South Korea
(“Rep. of Korea”), Nigeria, Japan, Mexico, India, Bolivia, Chile, Russia, EFTA, Taiwan-China
(“Other Asia nes”), Canada, Thailand, Trinidad and Tobago, Malaysia, Indonesia, Peru and
Colombia.

18
Similarly, MERCOSUR’s most important partner for exports was the EU, followed by China, the
USA, GAFTA, Japan, Chile, South Korea, Mexico, Russia, Panama, Canada, India, Colombia,
EFTA, “Bunkers”, Peru, China – Hong Kong SAR, Indonesia, Iran, Taiwan-China (“Other Asia
nes”) and Thailand. We find similar trade shares when we look at MERCOSUR’s trade during the
period 1996-2013 (Figures 8 and 9, Annex III). As mentioned above, while MERCOSUR did not
import from Palestine in 2013 (according to Palestinian statistics), the Palestinian share of
MERCOSUR’s exports was low at 0.0078%.
Table 4: Geographical distribution of MERCOSUR’s imports in 2013
Partner Imports Value ('000s USD) Imports share
World 337,060,779.10 100.00%
EU28 66,897,540.57 19.85%
China 54,013,887.14 16.02%
USA 46,150,650.08 13.69%
Germany 19,604,617.63 5.82%
GAFTA 12,981,594.42 3.85%
Rep. of Korea 11,195,140.47 3.32%
Nigeria 10,489,515.48 3.11%
Japan 8,974,779.71 2.66%
France 8,931,799.40 2.65%
Italy 8,655,471.16 2.57%
Mexico 8,424,042.55 2.50%
India 7,389,780.62 2.19%
Spain 6,165,759.47 1.83%
Bolivia 5,739,586.37 1.70%
Chile 5,599,558.38 1.66%
Russian Federation 4,750,687.40 1.41%
EFTA 4,677,603.58 1.39%
United Kingdom 4,422,197.58 1.31%
Other Asia, nes 3,664,123.64 1.09%
Switzerland 3,587,623.66 1.06%
Netherlands 3,579,501.59 1.06%
Canada 3,558,426.49 1.06%
Thailand 3,440,406.96 1.02%
Trinidad and Tobago 3,381,082.61 1.00%
Saudi Arabia 3,238,415.96 0.96%
Algeria 3,076,731.60 0.91%
Belgium 2,942,779.04 0.87%
Malaysia 2,814,490.58 0.84%
Sweden 2,399,373.90 0.71%
Indonesia 2,031,054.70 0.60%
Peru 1,943,891.37 0.58%
Colombia 1,933,638.08 0.57%
Austria 1,671,778.12 0.50%
Palestine* 0.00 0.00%
Source: Comtrade via TradeSift (HS 1996 Total Trade)
*Note: Data for trade between MERCOSUR and Palestine originates from PCBS (with Palestine as reporter country)

19
Table 5: Geographical distribution of MERCOSUR’s exports in 2013
Partner Exports Value (‘000s USD) Exports share
World 337,309,973.50 100.00%
EU28 60,180,654.82 17.84%
China 52,884,894.60 15.68%
USA 29,762,557.68 8.82%
GAFTA 20,571,938.21 6.10%
Netherlands 19,517,195.61 5.79%
Japan 9,450,160.48 2.80%
Chile 9,059,757.71 2.69%
Germany 8,838,803.40 2.62%
Rep. of Korea 5,797,534.21 1.72%
Mexico 5,712,384.13 1.69%
Italy 5,649,436.71 1.67%
Spain 5,624,204.36 1.67%
Russian Federation 4,925,603.58 1.46%
United Kingdom 4,863,086.46 1.44%
Panama 4,552,816.91 1.35%
Canada 4,465,705.84 1.32%
India 4,280,123.40 1.27%
Colombia 4,278,501.41 1.27%
EFTA 4,181,293.64 1.24%
Bunkers 4,134,781.90 1.23%
Saudi Arabia 4,019,816.85 1.19%
France 3,989,838.57 1.18%
Belgium 3,957,709.79 1.17%
Peru 3,906,038.18 1.16%
China, Hong Kong SAR 3,841,829.42 1.14%
Egypt 3,612,047.28 1.07%
Indonesia 3,587,857.87 1.06%
Switzerland 3,084,584.43 0.91%
United Arab Emirates 2,930,365.21 0.87%
Algeria 2,894,275.13 0.86%
Iran 2,774,631.53 0.82%
Other Asia, nes 2,714,305.15 0.80%
Thailand 2,652,762.45 0.79%
Palestine* 26,395.85 0.0078%
Source: Comtrade via TradeSift (HS 1996 Total Trade)
*Note: Data for trade between MERCOSUR and Palestine originates from PCBS (with Palestine as reporter country)

20
Figure 8: Top trade partners for MERCOSUR’s imports 1996-2013 (details in Annex III)
Note: Most important partners for imports from EU: Germany, Italy, France, Spain, United Kingdom, The Netherlands, Sweden, Belgium; from
GAFTA: Algeria, Saudi Arabia; from EFTA: Switzerland.
Figure 9: Top trade partners for MERCOSUR’s exports 1996-2013 (details in Annex III)
Note: Most important partners for exports to EU: The Netherlands, Germany, Italy, Spain, United Kingdom, France, Belgium; to GAFTA: Egypt,
Saudi Arabia; to EFTA: Switzerland;

21
Turning now to Palestine’s geographical distribution of trade, Tables 6 and 7 show that Palestine’s
most important trade partner in 2013 was Israel, accounting for 71.6% of its imports and 87.2% of
its exports. Other significant partners in trade were the EU, GAFTA, Turkey, China, USA, South
Korea, MERCOSUR, India, Thailand, Ukraine, Japan and EFTA. This hasn’t changed by much if
we look at Palestinian trade shares since 1996 (Figures 10 and 11, Annex IV). Looking at
Palestinian trade with MERCOSUR throughout time (Table 2) we find that MERCOSUR’s share
of Palestinian imports has slightly increased throughout time (from 0.13% in 1996 to 0.51% in
2013), while MERCOSUR’s share of Palestinian exports was zero during most years.
Table 6: Geographical distribution of Palestine’s imports in 2013
Partner Imports Value ('000s USD) Imports Share
World 5,163,897.46 100.00%
Israel 3,694,820.63 71.55%
EU28 455,472.53 8.82%
Turkey 289,169.86 5.60%
China 236,601.08 4.58%
GAFTA 214,774.86 4.16%
Germany 124,152.70 2.40%
Jordan 91,504.33 1.77%
Italy 61,155.12 1.18%
Spain 60,607.62 1.17%
France 51,629.67 1.00%
Saudi Arabia 43,997.36 0.85%
Egypt 43,501.32 0.84%
USA 42,397.06 0.82%
Rep. of Korea 38,352.45 0.74%
MERCOSUR 26,395.85 0.51%
Sweden 26,068.82 0.50%
India 23,506.68 0.46%
Thailand 23,353.78 0.45%
United Kingdom 22,921.07 0.44%
Netherlands 22,825.21 0.44%
Ukraine 22,177.82 0.43%
Brazil 20,035.29 0.39%
Poland 17,492.71 0.34%
Belgium 15,989.37 0.31%
United Arab Emirates 15,834.77 0.31%
Japan 12,485.66 0.24%
Ireland 12,129.26 0.23%
Qatar 11,426.78 0.22%
EFTA 10,139.09 0.20%
Switzerland 10,016.59 0.19%
Czech Rep. 8,995.68 0.17%
Malaysia 6,546.10 0.13%
Russian Federation 6,185.30 0.12%
Bahrain 5,977.86 0.12%
Viet Nam 5,883.31 0.11%

22
Hungary 5,763.31 0.11%
Denmark 5,697.10 0.11%
Guatemala 5,255.56 0.10%
Australia 4,834.92 0.09%
Source: PCBS (total trade aggregated from HS 1996 6-digit level)
Table 7: Geographical distribution of Palestine’s exports in 2013
Partner Exports Value ('000s USD) Exports Share
World 900,617.86 100.00%
Israel 785,110.86 87.17%
GAFTA 86,549.39 9.61%
Jordan 55,389.85 6.15%
EU28 13,155.64 1.46%
USA 10,294.21 1.14%
Saudi Arabia 8,421.49 0.94%
United Arab Emirates 7,366.87 0.82%
Qatar 4,812.23 0.53%
Kuwait 3,923.57 0.44%
Netherlands 2,991.95 0.33%
Turkey 2,987.65 0.33%
United Kingdom 2,928.70 0.33%
Germany 1,750.10 0.19%
Algeria 1,723.77 0.19%
Italy 1,154.70 0.13%
Poland 1,102.39 0.12%
Slovakia 1,053.32 0.12%
Canada 908.04 0.10%
Yemen 854.27 0.09%
Belgium 718.06 0.08%
Libya 598.10 0.07%
France 549.94 0.06%
Japan 476.10 0.05%
EFTA 382.82 0.04%
Dem. People's Rep. of Korea 325.32 0.04%
Switzerland 311.99 0.03%
Indonesia 305.20 0.03%
Rep. of Korea 299.48 0.03%
Iraq 282.95 0.03%
Oman 230.07 0.03%
Egypt 204.13 0.02%
Cyprus 195.96 0.02%
Sweden 181.43 0.02%
Malta 158.33 0.02%
Austria 154.01 0.02%
Morocco 151.04 0.02%
Russian Federation 150.30 0.02%
New Zealand 149.30 0.02%
Sudan 139.60 0.02%
Source: PCBS (total trade aggregated from HS 1996 6-digit level)

23
Figure 10: Top trade partners for Palestine’s imports 1996-2013 (details in Annex IV)
Note: Most important partners for imports from the EU: Italy, Germany, Spain, France, United Kingdom, The Netherlands,
Sweden; from GAFTA: Jordan, Egypt; from EFTA: Switzerland, from MERCOSUR: Brazil
Figure 11: Top trade partners for Palestine’s exports 1996-2013 (details in Annex IV)
Note: Most important partners for exports to the EU: The Netherlands, Italy, United Kingdom, France, Belgium, Germany, Poland,
Malta, Slovakia; to GAFTA: Jordan, Saudi Arabia, United Arab Emirates, Algeria, Kuwait, Qatar, Egypt, Yemen, Iraq, Oman; to
EFTA: Switzerland.

24
Trade Structure
As we shall see in the following section, because of the extremely low level of Palestinian exports
to MERCOSUR, the exports structure was very concentrated throughout the past years. Because
exports to MERCOSUR before 2010 were insignificant, Figure 12 illustrates only exports between
2010 and 2013 (at the HS 1996 6-digit level). Accordingly, we find that the only products exported
to MERCOSUR were sewing machines, dates and medicaments.
Looking further at Palestinian imports from MERCOSUR between 1996 and 2006 (Figure 13), and
2007 and 2013 (Figure 14)4, we find that imports are fairly diversified. The top 5 products
imported between 1996 and 2006 account for 67.4% of Palestine’s total imports from
MERCOSUR, compared to 73.7% during 2007-2013.
As illustrated in Figure 13, throughout both periods Palestine predominantly imported meat
products, fish, coffee and tobacco from MERCOSUR. Between 2007 and 2013, Palestine
additionally imported sugar.
Figure 12: Palestinian exports to MERCOSUR (Annex V)
4 Because trade data for the years 1999-2006 is only available at the SITC Rev.3 level, we consider the periods 1999-
2006 and 2007-2013 separately in our analysis.

25
Figure 13: Top 5 Palestinian imports from MERCOSUR between 1996 and 2006 (Annex VI)
Figure 14: Top 5 Palestinian imports from MERCOSUR between 2007 and 2013 (Annex VI)

26
Looking at the composition of Palestinian trade with MERCOSUR in 2013 only, Table 8 illustrates
that Palestine’s top 5 (10) import products at the 6-digit level account for more than 85% (91%) of
total imports from MERCOSUR in 2013. The top imported product, frozen bovine cuts,
contributed more than 40% (10.9 million USD) to the total imported value from MERCOSUR.
Furthermore, coffee (not roasted) and coffee extracts together accounted for nearly 27% (7.1
million USD), followed by cane sugar and frozen salmon, accounting for 9.4% (2.5 million USD)
and 8.1% (2.1 million USD) of Palestine’s imports from MERCOSUR in 2013.
Looking now at Israel’s applied tariffs5 on Palestine’s imports from MERCOSUR in 2013, we find
that based on Israel’s trade agreement concluded with MERCOSUR, applied AHS tariffs are zero
in most sectors except for sugar confectionary, where the tariff rate is relatively low at 6%.
Regarding Israel’s imports from the world, applied tariffs are 12% for sugar confectionary, 8.5%
for electrical switches, 6% for homogenized tobacco, 5.25% for automobiles and 4% for maize oil,
and 0% for the remaining products listed in Table 8.
5 Because Palestinian tariffs are nearly in all sectors the same as applied by Israel, we look at Israel’s tariff structure.

27
Table 8: Palestinian top 25 imports from MERCOSUR in 2013
Product Product Name
PSE - MERCOSUR PSE - WLD
Imports
Value
Imports
Share
Israel's
applied
AHS tariff
Imports
value
Imp.
Share
Israel's
applied
AHS
tariff
020230 Bovine cuts boneless, frozen 10,909.86 41.33% 0.00% 12,261.55 0.19% 0.00%
090111 Coffee, not roasted, not decaffeinated 5,518.75 20.91% 0.00% 18,948.17 0.30% 0.00%
170111 Raw sugar, cane 2,485.28 9.42% 0.00% 18,661.10 0.30% 0.00%
030310 Salmon, Pacific, frozen, whole 2,136.72 8.09% 0.00% 7,579.11 0.12% 0.00%
210111 Coffee extracts, essence 1,535.01 5.82% 0.00% 2,903.13 0.05% 0.00%
170490 Sugar confectionery not chewing gum.. 392.11 1.49% 6.00% 21,131.30 0.33% 12.00%
160250 Bovine meat, offal nes, not livers, .. 306.71 1.16% 0.00% 592.62 0.01% 0.00%
680293 Worked granite 303.54 1.15% 0.00% 5,854.73 0.09% 0.00%
870331 Automobiles, diesel engine of <1500 .. 242.19 0.92% 0.00% 16,492.93 0.26% 5.25%
390210 Polypropylene in primary forms 242.06 0.92% 0.00% 1,302.49 0.02% 0.00%
200811 Ground-nuts otherwise prepared or .. 241.52 0.91% 0.00% 743.65 0.01% 0.00%
441820 Doors, frames and thresholds, of wood 192.34 0.73% 0.00% 642.11 0.01% 0.00%
120740 Sesamum seeds 171.72 0.65% 0.00% 9,139.07 0.14% 0.00%
151529 Maize oil, fractions, refined not .. 143.81 0.54% 0.00% 8,001.96 0.13% 4.00%
240391 Homogenized or reconstituted tobacco 132.65 0.50% 0.00% 133.35 0.00% 6.00%
180631 Chocolate, cocoa preps, block, slab,.. 132.49 0.50% 0.00% 24,673.49 0.39% 0.00%
071333 Kidney beans and white pea beans .. 125.36 0.47% 0.00% 1,253.62 0.02% 0.00%
190530 Sweet biscuits, waffles and wafers 95.04 0.36% 0.00% 26,246.60 0.42% 0.00%
100630 Rice, semi-milled or wholly milled 93.51 0.35% 0.00% 16,427.07 0.26% 0.00%
470200 Chemical wood pulp, dissolving grades 73.60 0.28% 0.00% 425.88 0.01% 0.00%
470319 Chem wood pulp, soda/sulphate, no.. 73.59 0.28% 0.00% 197.23 0.00% 0.00%
120220 Ground-nuts shelled, not roasted or .. 70.09 0.27% 0.00% 7,309.08 0.12% 0.00%
071320 Chickpeas, dried, shelled 68.41 0.26% 0.00% 3,518.01 0.06% 0.00%
853690 Electrical switch, protector, connecte.. 52.29 0.20% 0.00% 965.61 0.02% 8.50%
680291 Worked marble, travertine and ala.. 47.53 0.18% 0.00% 3,086.01 0.05% 0.00%
Others 609.68 2.31% - 6,111,195.02 96.70% -
Total 26,395.85 100.00% - 6,319,684.92 100.00% -
Source: PCBS (HS 1996 6-digit trade data); WTO IDB via WITS (AHS tariffs);

28
Shallow integration effects
Rule of Thumb 1 of the SF focuses on the initial tariff and/or trade barrier structure6.
Given that Palestinian tariffs are generally the same as applied Israeli tariffs in general, Figure 15
shows the evolution of MERCOSUR’s and Israel’s tariffs over time. The figure shows that at the
total trade level, Israeli tariffs on global imports have been low in the past 13 years at around 5.1%.
MERCOSUR’s tariffs, on the other hand, have been relatively high at an average of 14.9% for
Brazil, 13.5% for Argentina, 13.2% for Venezuela, 12.2% for Paraguay, 11.7% for Uruguay.
The tariff levels suggest that the extent of shallow integration induced trade creation under
MPFTA is fairly low for MERCOSUR countries, but likely to be high for Palestine, especially in
Brazil.
Figure 15: Evolution of tariffs in Israel and MERCOSUR over time (Simple average AHS in %)
Looking further at the minimum and maximum applied tariff rates on global imports in Israel and
the MERCOSUR countries in 2012, we find that the minimum tariff rate in all countries is 0%,
whereas maximum applied rates are 212% in Israel, 55% in Brazil, 40% in Venezuela, 35% in
Argentina and Uruguay, and 30% in Paraguay (Table 9).
6 If not mentioned otherwise, our analysis on tariffs is based on World Integrated Trade Solution (WITS). WITS uses the concept of
“effectively applied tariffs” (AHS), which are defined as the lowest available tariffs. In this framework, we are working with
“simple average” AHS tariffs, which means that we use the simple average tariff of included 6-digit lines. The 6-digit tariff is itself
an average of included tariff line level lines.

29
As a share of total tariff lines in each case, we further look at domestic7 and international tariff
peaks8 applied by Israel and the MERCOSUR countries in 2012. While domestic tariff peaks are
low in Israel (1.1%), Paraguay (0.07%), Uruguay (0.31%) and Venezuela (0.48%) and relatively
low in Argentina (1.8%) and Brazil (4%), international peaks are high for MERCOSUR countries:
25.3% in Argentina, 30.5% in Brazil, 23.9% in Paraguay, 33.3% in Uruguay and 18.1% in
Venezuela.
These figures suggest that due to the high number of international tariff peaks in
MERCOSUR countries, it appears that there is considerable scope for Palestine to create
trade in certain sectors.
Table 9: Comparative tariff profiles of Israel and MERCOSUR on world imports
Importer Year Simple Average
AHS Tariff
Imports Value
(‘000s USD)
Minimum
Rate
Maximum
Rate
Total
Lines
Dom.
Peaks
Intern.
Peaks
Israel
1999 2.50% 31,085,575.00 0.00% 250.00% 129,325 0.61% 0.83%
2000 5.30% 35,742,024.00 0.00% 250.00% 130,930 0.65% 0.94%
2001 5.65% 33,303,113.00 0.00% 250.00% 121,533 0.53% 0.63%
2002 5.50% 33,105,904.00 0.00% 250.00% 120,414 0.49% 0.58%
2003 5.43% 34,210,938.00 0.00% 250.00% 118,681 0.45% 0.51%
2004 5.40% 40,969,518.00 0.00% 230.00% 123,450 0.44% 0.47%
2005 5.55% 45,032,350.00 0.00% 230.00% 122,163 1.09% 1.14%
2006 5.47% 47,834,446.00 0.00% 230.00% 122,200 1.10% 1.15%
2007 5.49% 56,619,379.00 0.00% 230.00% 125,236 1.22% 1.27%
2008 5.51% 65,170,546.00 0.00% 230.00% 124,544 1.27% 1.33%
2009 5.43% 47,362,724.00 0.00% 230.00% 122,054 1.11% 1.17%
2011 4.47% 73,526,105.00 0.00% 212.00% 126,242 0.77% 0.77%
2012 4.70% 73,112,080.00 0.00% 212.00% 126,948 1.05% 1.09%
Argentina
1996 13.94% 23,761,555.46 0.00% 30.00% 129,708 0.00% 35.55%
1997 13.04% 30,349,402.11 0.00% 30.00% 137,036 0.00% 30.88%
1998 14.74% 31,377,246.21 0.00% 33.00% 137,394 0.00% 41.34%
1999 15.46% 25,507,944.03 0.00% 33.00% 142,034 0.00% 46.65%
2000 15.22% 25,280,463.49 0.00% 33.00% 140,099 0.00% 42.43%
2001 16.26% 20,321,127.10 0.00% 35.00% 135,048 0.00% 56.24%
2002 12.37% 8,989,546.00 0.00% 35.00% 112,766 0.30% 26.26%
2003 12.32% 13,850,774.00 0.00% 35.00% 123,678 0.21% 26.57%
2004 11.31% 22,445,246.58 0.00% 35.00% 163,538 0.21% 25.43%
2005 12.31% 28,688,637.65 0.00% 35.00% 142,204 0.23% 27.28%
2006 12.23% 34,153,541.76 0.00% 35.00% 147,248 0.26% 27.99%
2007 12.29% 44,707,041.81 0.00% 35.00% 150,410 0.25% 29.29%
2008 13.88% 57,461,774.37 0.00% 35.00% 150,206 4.55% 29.99%
2009 13.65% 38,786,161.79 0.00% 35.00% 146,487 4.26% 29.12%
2010 14.17% 56,792,359.35 0.00% 35.00% 146,915 2.52% 28.11%
2011 14.26% 74,319,324.61 0.00% 35.00% 150,866 2.30% 28.54%
2012 11.28% 68,507,490.49 0.00% 35.00% 149,416 1.79% 25.29%
Brazil 1997 17.45% 65,074,597.89 0.00% 63.00% 150,484 0.16% 60.16%
1998 17.27% 60,793,118.72 0.00% 49.00% 150,570 0.16% 59.18%
7 Domestic tariff peaks are the number of tariff lines exceeding three times the overall simple average applied rate. 8 International peaks are the number of tariff lines exceeding the overall average applied rate by 15% or more.

30
1999 16.84% 51,747,393.44 0.00% 35.00% 143,465 0.00% 57.19%
2000 16.68% 55,850,546.40 0.00% 35.00% 147,091 0.00% 57.20%
2001 15.67% 55,601,756.87 0.00% 55.00% 172,281 0.01% 47.26%
2002 14.72% 47,242,654.09 0.00% 55.00% 148,409 0.01% 44.74%
2004 13.11% 62,835,613.54 0.00% 55.00% 139,036 0.16% 29.07%
2005 13.14% 73,600,375.46 0.00% 55.00% 143,896 0.18% 29.43%
2006 13.12% 91,342,783.55 0.00% 35.00% 147,199 0.17% 27.18%
2007 13.14% 120,620,871.17 0.00% 35.00% 153,473 0.21% 27.97%
2008 14.44% 173,196,633.76 0.00% 35.00% 160,033 3.16% 28.25%
2009 14.42% 127,647,330.79 0.00% 35.00% 158,193 3.04% 28.10%
2010 14.43% 180,458,788.52 0.00% 35.00% 167,565 3.07% 28.40%
2011 14.60% 226,243,408.91 0.00% 35.00% 170,176 3.64% 29.22%
2012 14.83% 223,149,128.35 0.00% 55.00% 192,544 4.03% 30.50%
Paraguay
1998 13.79% 2,896,688.38 0.00% 23.50% 51,774 0.00% 35.77%
1999 13.64% 1,905,851.23 0.00% 30.00% 53,469 0.00% 34.07%
2000 13.80% 2,260,221.14 0.00% 30.00% 60,429 0.00% 33.45%
2001 13.83% 2,181,926.70 0.00% 32.50% 62,348 0.00% 29.44%
2002 13.41% 1,661,292.98 0.00% 31.50% 53,513 0.00% 30.05%
2003 13.42% 1,920,591.73 0.00% 31.50% 51,959 0.00% 31.02%
2004 12.22% 2,671,557.99 0.00% 30.00% 54,226 0.01% 24.17%
2005 11.36% 3,273,773.31 0.00% 30.00% 55,324 0.02% 22.40%
2006 11.20% 4,757,639.74 0.00% 30.00% 57,910 0.03% 23.06%
2007 10.98% 5,859,421.20 0.00% 30.00% 66,809 0.03% 23.11%
2008 11.02% 9,033,190.51 0.00% 30.00% 70,541 0.07% 23.58%
2009 10.90% 6,939,841.58 0.00% 30.00% 69,722 0.06% 22.82%
2010 11.00% 10,033,466.14 0.00% 30.00% 75,144 0.08% 23.94%
2011 10.97% 12,366,126.52 0.00% 30.00% 80,463 0.25% 24.52%
2012 10.90% 11,555,136.43 0.00% 30.00% 79,754 0.07% 23.89%
Uruguay
1998 13.55% 3,807,613.95 0.00% 24.00% 91,111 0.00% 42.36%
1999 13.35% 3,356,245.11 0.00% 23.00% 90,656 0.00% 40.91%
2000 13.18% 3,465,809.10 0.00% 23.00% 88,300 0.00% 40.55%
2001 13.07% 3,060,842.70 0.00% 35.00% 89,836 0.00% 40.12%
2002 11.55% 1,966,843.51 0.00% 55.00% 72,171 0.01% 36.22%
2006 10.14% 4,806,055.55 0.00% 35.00% 93,357 0.01% 27.69%
2007 10.16% 5,627,662.83 0.00% 35.00% 99,208 0.00% 28.92%
2008 12.26% 9,069,360.17 0.00% 55.00% 102,068 0.01% 33.68%
2009 12.27% 6,906,724.91 0.00% 55.00% 105,745 0.24% 33.48%
2010 10.55% 8,621,757.64 0.00% 55.00% 117,520 0.19% 31.97%
2011 9.86% 10,726,377.52 0.00% 35.00% 123,274 0.21% 29.99%
2012 10.80% 11,652,107.82 0.00% 35.00% 127,174 0.31% 33.32%
Venezuela
1997 13.00% 13,158,796.29 0.00% 35.00% 63,852 0.00% 22.90%
1998 13.17% 14,250,360.83 0.00% 35.00% 70,160 0.00% 23.27%
1999 13.42% 13,553,948.78 0.00% 35.00% 74,496 0.00% 25.14%
2000 13.42% 14,584,165.38 0.00% 35.00% 78,274 0.00% 25.38%
2001 13.60% 16,435,556.30 0.00% 35.00% 84,825 0.00% 26.37%
2002 13.59% 11,673,345.83 0.00% 35.00% 65,958 0.00% 25.47%
2003 13.34% 8,357,705.35 0.00% 35.00% 55,185 0.00% 23.48%
2009 13.47% 38,676,637.47 0.00% 40.00% 86,764 0.36% 25.04%
2010 13.41% 32,342,886.99 0.00% 40.00% 80,166 0.40% 24.25%
2011 13.15% 36,387,613.82 0.00% 40.00% 72,972 0.22% 22.35%
31
2012 11.84% - 0.00% 40.00% 78,628 0.48% 18.14%
Source: WTO IDB via WITS (tariff data) and Comtrade via TradeSift (trade data).
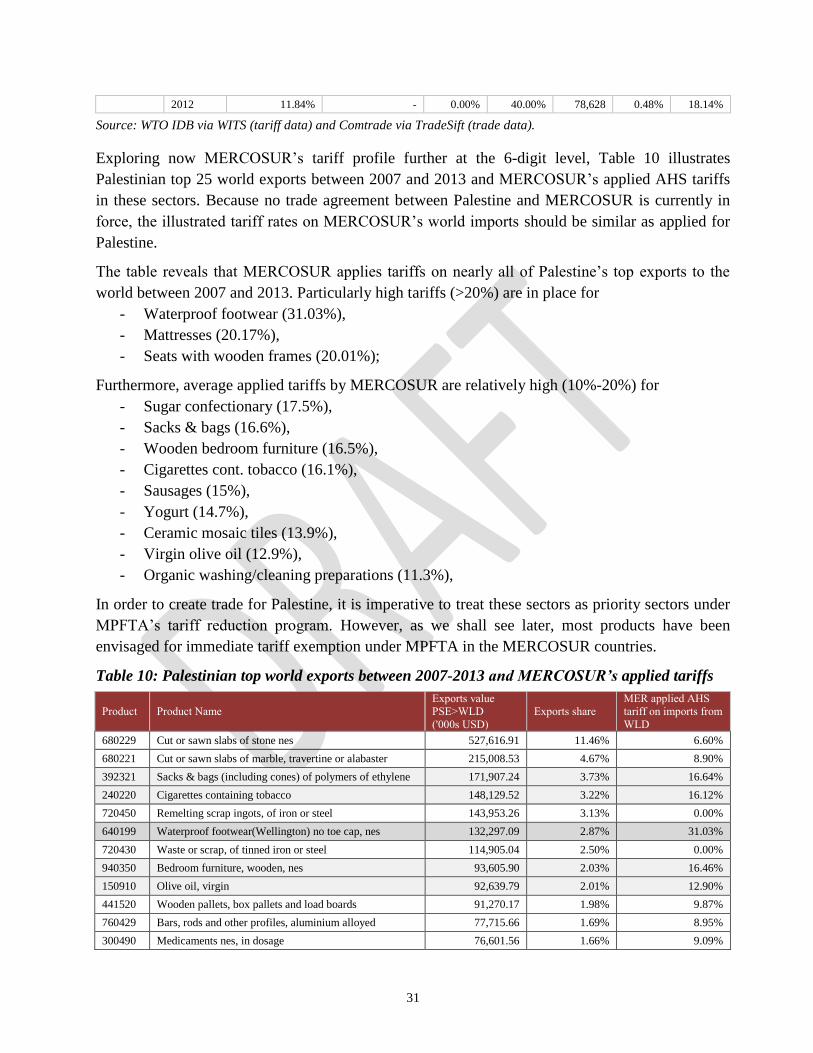
Exploring now MERCOSUR’s tariff profile further at the 6-digit level, Table 10 illustrates
Palestinian top 25 world exports between 2007 and 2013 and MERCOSUR’s applied AHS tariffs
in these sectors. Because no trade agreement between Palestine and MERCOSUR is currently in
force, the illustrated tariff rates on MERCOSUR’s world imports should be similar as applied for
Palestine.
The table reveals that MERCOSUR applies tariffs on nearly all of Palestine’s top exports to the
world between 2007 and 2013. Particularly high tariffs (>20%) are in place for
- Waterproof footwear (31.03%),
- Mattresses (20.17%),
- Seats with wooden frames (20.01%);
Furthermore, average applied tariffs by MERCOSUR are relatively high (10%-20%) for
- Sugar confectionary (17.5%),
- Sacks & bags (16.6%),
- Wooden bedroom furniture (16.5%),
- Cigarettes cont. tobacco (16.1%),
- Sausages (15%),
- Yogurt (14.7%),
- Ceramic mosaic tiles (13.9%),
- Virgin olive oil (12.9%),
- Organic washing/cleaning preparations (11.3%),
In order to create trade for Palestine, it is imperative to treat these sectors as priority sectors under
MPFTA’s tariff reduction program. However, as we shall see later, most products have been
envisaged for immediate tariff exemption under MPFTA in the MERCOSUR countries.
Table 10: Palestinian top world exports between 2007-2013 and MERCOSUR’s applied tariffs
Product Product Name
Exports value
PSE>WLD
('000s USD)
Exports share
MER applied AHS
tariff on imports from
WLD
680229 Cut or sawn slabs of stone nes 527,616.91 11.46% 6.60%
680221 Cut or sawn slabs of marble, travertine or alabaster 215,008.53 4.67% 8.90%
392321 Sacks & bags (including cones) of polymers of ethylene 171,907.24 3.73% 16.64%
240220 Cigarettes containing tobacco 148,129.52 3.22% 16.12%
720450 Remelting scrap ingots, of iron or steel 143,953.26 3.13% 0.00%
640199 Waterproof footwear(Wellington) no toe cap, nes 132,297.09 2.87% 31.03%
720430 Waste or scrap, of tinned iron or steel 114,905.04 2.50% 0.00%
940350 Bedroom furniture, wooden, nes 93,605.90 2.03% 16.46%
150910 Olive oil, virgin 92,639.79 2.01% 12.90%
441520 Wooden pallets, box pallets and load boards 91,270.17 1.98% 9.87%
760429 Bars, rods and other profiles, aluminium alloyed 77,715.66 1.69% 8.95%
300490 Medicaments nes, in dosage 76,601.56 1.66% 9.09%

32
940429 Mattresses, stuffed, spring interior, etc 75,088.50 1.63% 20.17%
121190 Plants & parts, pharmacy, perfume, insecticide use nes 66,930.33 1.45% 7.50%
940161 Seats with wooden frames, upholstered nes 59,597.25 1.29% 20.01%
390190 Polymers of ethylene nes, in primary forms 59,433.33 1.29% 8.25%
040310 Yogurt 56,796.69 1.23% 14.67%
721399 Bars&rods,iron/na st irr 54,654.68 1.19% 9.10%
740400 Copper/copper alloy waste or scrap 53,468.89 1.16% 2.00%
690810 Glazed ceramic mosaic tiles, cubes & similar <7cm wide 45,655.55 0.99% 13.88%
100890 Cereals unmilled nes 42,888.58 0.93% 4.41%
170490 Sugar confectionery not chewing gum, no cocoa content 39,408.11 0.86% 17.50%
251611 Granite, crude or roughly trimmed 37,498.61 0.81% 3.51%
340290 Organic surfactant washing, cleaning preparations nes 37,075.55 0.81% 11.33%
160100 Sausages, similar products of meat, meat offal & blood 35,407.86 0.77% 15.04%
Total 2,549,554.61 55.38% -
Source: WTO IDB via WITS (AHS tariff data), Comtrade via TradeSift (trade data)
We can further identify Palestine’s potential for trade creation by looking at MERCOSUR’s
applied tariff peaks for products exported by Palestine in 2013. Our analysis reveals that at the 6-
digit level, a staggering 644 products are subject to domestic and/or international tariff peaks in the
MERCOSUR countries. Limiting the analysis by selecting only products that are exported at a
minimum value of 1 million USD, Table 11 illustrates the remaining 74 products with tariff peaks
applied by MERCOSUR countries (for a full list of products with tariff peaks please refer to
Annex VII).
The table includes many of Palestine’s top 25 exports products between 2007 and 2013, including
- sacks & bags,
- cigarettes containing tobacco,
- waterproof footwear,
- wooden furniture,
- olive oil,
- bars & rods,
- mattresses,
- seats with wooden frames,
- yogurt,
- sugar confectionary,
- organic washing/cleaning preparations and
- sausages;
Additionally, MERCOSUR applies particularly high AHS tariffs (>20%) in the following sectors:
- Furniture: Metal office furniture (20.6%), wooden office furniture (20.7%), plastic
furniture (20.2%);
- Footwear: Footwear with rubber sole (29.9%), leather footwear (28.8%);
- Textile: Woven fabric with synthetic filament (20.4%), pullovers and cardigans (27%),
women/girls trousers (28%);

33
- Dairy: Fresh cheese (21.2%), Milk and cream powder (27.1%);
- Trailers (22.9%).
Preferential tariff treatment in these sectors will grant Palestine a competitive edge vis-à-vis other
countries. Therefore, based on Palestinian export elasticities and the existing demand in
MERCOSUR markets, there is considerable likelihood for shallow integration induced trade
creation.
Table 11: MERCOSUR’s applied tariff peaks for Palestine’s exports to the world (2013)
Product Product Name
Palestine's exports MERCOSUR's applied tariffs
Exp. Value
('000s USD)
Exp.
Share
Simple
Average
AHS
Tariff
Min.
Rate
Max.
Rate
Total
Lines
Dom.
Peaks
Internat.
Peaks
392321 Sacks & bags (including cones) of .. 38,941.56 4.16% 16.64% 0% 20% 285 0.00% 92.63%
240220 Cigarettes containing tobacco 35,350.69 3.77% 16.12% 0% 35% 40 0.00% 77.50%
640199 Waterproof footwear(Wellington) .. 26,238.01 2.80% 31.03% 0% 35% 41 58.54% 97.56%
940350 Bedroom furniture, wooden, nes 21,059.83 2.25% 16.46% 0% 20% 125 0.00% 87.20%
940429 Mattresses, stuffed, spring interio.. 15,756.71 1.68% 20.17% 0% 35% 80 0.00% 85.00%
940161 Seats with wooden frames, upho.. 14,977.65 1.60% 20.01% 0% 35% 135 0.00% 90.37%
760429 Bars, rods and other profiles, alum.. 13,611.49 1.45% 8.95% 0% 20% 356 0.00% 12.64%
040310 Yogurt 10,386.29 1.11% 14.67% 0% 20% 12 0.00% 83.33%
210690 Food preparations nes 9,857.40 1.05% 13.83% 0% 20% 1614 0.00% 59.11%
150910 Olive oil, virgin 8,842.09 0.94% 12.90% 0% 32% 45 0.00% 31.11%
940310 Office furniture, metal, nes 7,138.35 0.76% 20.61% 0% 35% 86 0.00% 93.02%
170490 Sugar confectionery not chewing .. 6,825.73 0.73% 17.50% 0% 20% 380 0.00% 88.16%
640419 Footwear,sole rubber/plastic,uppe.. 6,724.77 0.72% 29.89% 0% 35% 106 60.38% 91.51%
691010 Porcelain bathroom, kitchen & .. 6,650.50 0.71% 15.51% 0% 18% 57 0.00% 75.44%
340290 Organic surfactant washing, clea.. 6,505.81 0.69% 11.33% 0% 18% 1132 0.00% 38.16%
220290 Non-alcoholic beverages nes, .. 6,040.63 0.64% 18.49% 0% 20% 110 0.00% 90.91%
940130 Swivel seats with variable height .. 5,847.87 0.62% 17.20% 0% 20% 152 0.00% 92.11%
160100 Sausages, similar products of mea.. 5,827.95 0.62% 15.04% 0% 20% 39 0.00% 76.92%
940340 Kitchen furniture, wooden, nes 5,827.23 0.62% 16.53% 0% 20% 93 0.00% 87.10%
481810 Toilet paper 5,631.91 0.60% 13.33% 0% 20% 39 0.00% 79.49%
180631 Chocolate, cocoa preps, block, sl.. 5,630.90 0.60% 17.96% 0% 20% 137 0.00% 90.51%
110419 Cereals, rolled or flaked grains nes 5,321.07 0.57% 12.50% 10% 20% 4 0.00% 25.00%
481890 Household, hospital & sanitary .. 4,931.53 0.53% 14.67% 0% 20% 151 0.00% 90.07%
401110 Pneumatic tyres new of rubber for.. 4,604.53 0.49% 12.33% 0% 16% 193 0.00% 48.19%
853669 Electrical plugs and sockets 4,153.40 0.44% 14.73% 0% 16% 416 0.00% 75.48%
870899 Motor vehicle parts nes 3,879.71 0.41% 9.13% 0% 18% 1825 0.00% 25.59%
940370 Furniture, plastic, nes 3,845.48 0.41% 20.23% 0% 35% 136 0.00% 91.91%
701339 Glass table or kitchenware, exce.. 3,705.58 0.40% 15.44% 0% 20% 22 0.00% 77.27%
392410 Plastic table and kitchen ware 3,628.38 0.39% 16.13% 0% 20% 186 0.00% 75.27%
391721 Tube, pipe or hose, rigid, of poly.. 3,570.95 0.38% 15.16% 0% 20% 75 0.00% 89.33%
950669 Balls nes 3,542.05 0.38% 18.29% 0% 20% 60 0.00% 91.67%
761010 Aluminium Doors, windows, .. 3,461.53 0.37% 14.86% 0% 16% 84 0.00% 64.29%
848180 Taps, cocks, valves and similar .. 2,903.67 0.31% 12.71% 0% 18% 4308 0.00% 19.87%
850780 Electric accumulators, nes 2,584.52 0.28% 14.65% 0% 18% 261 0.00% 75.48%
940421 Mattresses of cellular rubber or .. 2,554.22 0.27% 15.90% 0% 20% 56 0.00% 83.93%

34
851712 Telephones for cellular networks.. 2,512.75 0.27% 6.21% 0% 16% 1830 0.00% 10.16%
540791 Woven fabric synthetic filament nes 2,509.15 0.27% 20.42% 0% 26% 19 0.00% 89.47%
401120 Pneumatic tyres new of rubber fo.. 2,325.63 0.25% 12.70% 0% 16% 242 0.00% 51.24%
391740 Fittings for plastic tube, pipe or .. 2,243.92 0.24% 9.85% 0% 20% 376 0.00% 55.85%
220890 Alcoholic liqueurs nes 2,230.76 0.24% 19.34% 0% 35% 112 0.00% 82.14%
040610 Fresh cheese, unfermented whey .. 2,203.07 0.24% 21.17% 0% 40% 43 9.30% 93.02%
190531 Sweet biscuits 2,188.86 0.23% 16.12% 0% 20% 107 0.00% 86.92%
640351 Footwear, soles, uppers of leather.. 2,116.69 0.23% 28.78% 0% 35% 100 38.00% 86.00%
090190 Coffee husks and skins, 2,109.93 0.23% 14.55% 10% 20% 11 0.00% 45.45%
170390 Molasses, except cane molasses 2,055.24 0.22% 15.88% 15% 16% 8 0.00% 87.50%
732393 Table/kitchen articles, parts, .. 1,929.68 0.21% 16.74% 0% 20% 154 0.00% 81.17%
090121 Coffee, roasted, not decaffeinated 1,902.15 0.20% 9.88% 0% 20% 39 0.00% 10.26%
871639 Trailers nes for the transport of .. 1,892.69 0.20% 22.89% 0% 35% 45 33.33% 93.33%
040221 Milk and cream powder unswe.. 1,891.91 0.20% 27.05% 0% 40% 118 61.02% 94.07%
701349 Glassware for table or kitchen .. 1,881.75 0.20% 16.73% 0% 18% 97 0.00% 78.35%
151529 Maize oil, fractions, refined n.. 1,848.96 0.20% 12.00% 0% 30% 18 0.00% 11.11%
870829 Parts and accessories of bodies .. 1,767.37 0.19% 11.93% 0% 18% 2693 0.00% 34.53%
940490 Articles of bedding nes 1,701.31 0.18% 16.76% 0% 20% 231 0.00% 90.48%
330499 Beauty, makeup and suntan
preparations nes 1,627.38 0.17% 16.20% 0% 20% 267 0.00% 80.90%
040390 Buttermilk, curdled milk, cream,
kephir, etc. 1,567.97 0.17% 10.96% 0% 20% 18 0.00% 61.11%
691110 Tableware and kitchenware of .. 1,497.18 0.16% 16.54% 0% 20% 196 0.00% 84.18%
482360 Trays, dishes, plates, cups and the .. 1,478.80 0.16% 17.09% 0% 20% 13 0.00% 84.62%
482361 Bamboo trays, dishes, plates, cups.. 1,447.87 0.15% 13.71% 0% 16% 7 0.00% 85.71%
100620 Rice, husked (brown) 1,445.00 0.15% 9.38% 0% 20% 30 0.00% 3.33%
120740 Sesamum seeds 1,439.41 0.15% 4.83% 0% 40% 46 4.35% 4.35%
481910 Cartons, boxes & cases, of corru.. 1,367.96 0.15% 14.55% 0% 16% 142 0.00% 76.06%
940330 Office furniture, wooden, nes 1,316.06 0.14% 20.66% 0% 35% 114 0.00% 89.47%
850980 Domestic appliances, with electri.. 1,282.85 0.14% 18.01% 0% 20% 104 0.00% 90.38%
901890 Instruments, appliances for medic.. 1,273.32 0.14% 5.48% 0% 16% 2497 0.00% 27.27%
820530 Planes, chisels, gouges and simil.. 1,265.08 0.14% 16.11% 0% 18% 70 0.00% 75.71%
854420 Co-axial cable and other co-axial.. 1,237.42 0.13% 14.76% 0% 16% 244 0.00% 58.20%
150790 Refined soya-bean oil, not chem.. 1,170.47 0.12% 18.35% 0% 40% 56 8.93% 19.64%
481840 Sanitary articles of paper, sanitar.. 1,159.04 0.12% 12.36% 0% 20% 114 0.00% 63.16%
392510 Plastic reservoirs, tanks, vats, etc,.. 1,148.96 0.12% 16.24% 0% 20% 49 0.00% 87.76%
611030 Pullovers, cardigans etc of man.. 1,142.37 0.12% 27.02% 0% 35% 224 35.71% 90.18%
160250 Bovine meat, offal nes, not livers.. 1,121.59 0.12% 13.14% 0% 20% 34 0.00% 58.82%
831110 Electrodes, coated, of base metal,.. 1,099.10 0.12% 14.02% 0% 16% 96 0.00% 72.92%
620469 Womens, girls trousers, shorts, m.. 1,030.80 0.11% 27.97% 0% 35% 161 32.92% 89.44%
392010 Sheet/film not cellular/reinf .. 1,029.20 0.11% 7.36% 0% 20% 439 0.00% 38.72%
Source: WTO IDB via WITS (AHS tariff data), PCBS (trade data)
To explore further the export potential of the products which we have previously discussed, we
look at their revealed comparative advantage (RCA)9.
9 It is the essence of Rule of Thumb 3 of SF to which extent Palestine and MERCOSUR differ in comparative advantage, which can
be estimated by calculating the RCA. The RCA measures a country’s exports of a commodity relative to its total exports and
compares this to the world exports of a commodity relative to total world exports. A comparative advantage is “revealed” if RCA >
1. This is because the index shows that the country is exporting a higher share of the good than the share of the good in world
exports – hence the country has a comparatively higher share for that good, implying a comparative advantage. Analogously, if the
RCA is less then unity, the country is said to have comparative disadvantage in that commodity.

35
Table 12 illustrates the calculated RCAs for Palestine’s top export products between 2007 and
2013 with tariff peaks, and other strong export products with applied tariff peaks in the
MERCOSUR markets.
We look at the RCA on different levels: First, the analysis on Palestine’s RCAs in the world
reveals that Palestine has a comparative advantage for all products listed in the table. Particularly
high RCA levels exist for waterproof footwear, woven fabric with synthetic filaments, mattresses,
sacks & bags and yogurt.
Second, we have calculated MERCOSUR’s RCAs in the same sectors and find that the
MERCOSUR countries have a comparative disadvantage or considerably lower RCA levels than
Palestine for most products, except for milk and cream powder. The analysis on Palestine’s RCAs
relative to MERCOSUR’s RCAs confirms this result. Accordingly, Palestine’s RCAs relative to
MERCOSUR’s RCAs are very high for woven fabric with synthetic filament, yogurt, sacks & bags
and cigarettes.
Lastly, we look at Palestine’s RCAs relative to Israel’s RCAs and find that Palestine has a
comparative advantage in most sectors, with very high RCA levels in the sectors waterproof
footwear, fresh cheese, mattresses, woven fabric with synthetic filament, footwear with rubber
sole, seats with wooden frames, wooden bedroom furniture and olive oil. RCAs are not available
for milk & cream powder, cigarettes containing tobacco and leather footwear, because Israel did
not export in these sectors in 2013.
Hence, based on preferential tariff treatment under MPFTA, we find that there is considerable
potential for trade creation for all of Palestine’s export products, except for milk and cream
powder.
Furthermore, in line with Rule of Thumb 3 of SF, the differences in comparative advantage
between Palestine’s and MERCOSUR’s exports indicate that MPFTA is likely to cause shallow
integration induced welfare effects.
Table 12: RCAs for Palestine’s world exports (2013)
Product Product Name
Exp. value
PSE>WLD
('000s USD)
Exp. share
MER
applied
AHS
tariff
PSE's
RCA
with
WLD
MER's
RCA
with
WLD
PSE's
RCA
relative to
MER
PSE's
RCA
relative to
ISR
040221 Milk and cream powder
unswe.. 1,891.91 0.20% 27.05% 3.0 5.3 0.6 n.a.
040310 Yogurt 56,796.69 1.23% 14.67% 69.7 0.1 692.9 297.7
040610 Fresh cheese, unfermente.. 2,203.07 0.24% 21.17% 6.0 0.9 6.6 26,172.9
150910 Olive oil, virgin 92,639.79 2.01% 12.90% 28.8 0.7 43.1 1,318.6
160100 Sausages, similar produc.. 35,407.86 0.77% 15.04% 19.4 1.4 13.9 95.7
170490 Sugar confectionery not .. 39,408.11 0.86% 17.50% 12.2 1.0 11.8 51.0
240220 Cigarettes containing toba.. 148,129.52 3.22% 16.12% 31.8 0.2 131.7 n.a.
340290 Organic surfactant washin.. 37,075.55 0.81% 11.33% 19.9 0.7 27.5 14.7
392321 Sacks & bags (including .. 171,907.24 3.73% 16.64% 68.9 0.2 298.6 74.5
540791 Woven fabric synthetic .. 2,509.15 0.27% 20.42% 478.4 0.0 56,686.1 11,923.7
640351 Footwear, soles, uppers .. 2,116.69 0.23% 28.78% 13.2 0.3 43.4 n.a.

36
640419 Footwear,sole rubber.. 6,724.77 0.72% 29.89% 8.7 0.3 32.1 5,385.9
640199 Waterproof footwear(.. 132,297.09 2.87% 31.03% 1,476.1 0.4 3,640.6 27,504.1
760429 Bars, rods and other profi.. 77,715.66 1.69% 8.95% 26.4 0.1 196.1 68.3
871639 Trailers nes for the .. 1,892.69 0.20% 22.89% 3.8 0.8 4.5 182.3
940161 Seats with wooden frame.. 59,597.25 1.29% 20.01% 18.3 0.0 441.6 3,158.7
940310 Office furniture, metal, nes 7,138.35 0.76% 20.61% 51.8 0.0 3,564.7 481.4
940350 Bedroom furniture, woo.. 93,605.90 2.03% 16.46% 43.5 1.4 30.2 2,734.4
940370 Furniture, plastic, nes 3,845.48 0.41% 20.23% 31.3 0.3 89.8 2.7
940429 Mattresses, stuffed, spri.. 75,088.50 1.63% 20.17% 138.8 0.2 872.8 23,399.1
Source: PCBS (trade data for Palestine) and Comtrade (trade data for MERCOSUR and Israel)
Lastly, in order to identify potential for trade creation, we take into consideration MERCOSUR’s
demand based on imports and exports in the discussed sectors. Table 13 therefore illustrates all of
Palestine’s top 25 exports and other strong exports with tariff peaks in the MERCOSUR markets,
vis-à-vis MERCOSUR’s imported and exported value in these sectors.
Accordingly, MERCOSUR’s demand appears to be particularly high for
- slabs of marble,
- agricultural produce (olive oil, plants and parts thereof, incl. fresh herbs, cereals),
- bars & rods,
- medicaments,
- furniture (seats with wooden frames, metal office furniture, plastic furniture),
- polymers of ethylene,
- ceramic mosaic tiles,
- organic washing/cleaning preparations and
- footwear.
On the other hand, the demand appears to be low for slabs of stone, scrap ingots, waste/scrap of
tinned iron/steel, wooden pallets, granite and milk & cream powder. These products will therefore
not be included in our further analysis.
Table 13: MERCOSUR’s imported/exported value of Palestine’s exports (2013)
Product Product Name
Exports value
PSE>WLD
('000s USD)
Exports
share
MER
applied
AHS
tariff
MER imports
from WLD
MER exports
to WLD
680229 Cut or sawn slabs of stone nes 527,616.91 11.46% 6.60% 1,796.23 53,006.41
680221 Cut or sawn slabs of marble, travertine or .. 215,008.53 4.67% 8.90% 8,658.99 1,991.99
392321 Sacks & bags (including cones) of polymers.. 171,907.24 3.73% 16.64% 51,717.05 45,991.38
240220 Cigarettes containing tobacco 148,129.52 3.22% 16.12% 48,083.89 94,658.97
720450 Scrap ingots, of iron or steel 143,953.26 3.13% 0.00% 52.05 0.00
640199 Waterproof footwear(Wellington) no toe cap.. 132,297.09 2.87% 31.03% 2,556.46 2,541.26
720430 Waste or scrap, of tinned iron or steel 114,905.04 2.50% 0.00% 63.57 20,936.91
940350 Bedroom furniture, wooden, nes 93,605.90 2.03% 16.46% 34,559.09 245,983.40
150910 Olive oil, virgin 92,639.79 2.01% 12.90% 302,603.81 72,414.27
441520 Wooden pallets, box pallets and load boards 91,270.17 1.98% 9.87% 983.15 53,338.00

37
760429 Bars, rods and other profiles, aluminium .. 77,715.66 1.69% 8.95% 54,174.27 24,480.16
300490 Medicaments nes, in dosage 76,601.56 1.66% 9.09% 3,641,514.57 1,100,689.25
940429 Mattresses, stuffed, spring interior, etc 75,088.50 1.63% 20.17% 8,453.41 6,365.88
121190 Plants & parts, pharmacy, perfume, insectic.. 66,930.33 1.45% 7.50% 35,614.84 22,456.83
940161 Seats with wooden frames, upholstered nes 59,597.25 1.29% 20.01% 24,540.34 11,958.45
390190 Polymers of ethylene nes, in primary forms 59,433.33 1.29% 8.25% 442,089.18 133,856.29
040310 Yogurt 56,796.69 1.23% 14.67% 5,639.82 5,285.80
721399 Bars&rods,iron/na st irr 54,654.68 1.19% 9.10% 756.08 2,513.42
740400 Copper/copper alloy waste or scrap 53,468.89 1.16% 2.00% 92,670.08 79,318.80
690810 Glazed ceramic mosaic tiles, cubes & simila.. 45,655.55 0.99% 13.88% 15,127.99 820.28
100890 Cereals unmilled nes 42,888.58 0.93% 4.41% 5,289.53 416.62
170490 Sugar confectionery not chewing gum, no .. 39,408.11 0.86% 17.50% 92,396.57 204,351.97
251611 Granite, crude or roughly trimmed 37,498.61 0.81% 3.51% 153.21 14,943.15
340290 Organic surfactant washing, cleaning prepar.. 37,075.55 0.81% 11.33% 145,436.63 83,437.60
160100 Sausages, similar products of meat, meat .. 35,407.86 0.77% 15.04% 4,780.71 147,781.71
940310 Office furniture, metal, nes 7,138.35 0.76% 20.61% 6,289.22 706.11
640419 Footwear,sole rubber/plastic,uppe.. 6,724.77 0.72% 29.89% 212,734.51 73,899.88
940370 Furniture, plastic, nes 3,845.48 0.41% 20.23% 36,901.12 15,103.33
540791 Woven fabric synthetic filament nes 2,509.15 0.27% 20.42% 650.11 15.61
040610 Fresh cheese, unfermented whey .. 2,203.07 0.24% 21.17% 66,458.55 118,586.45
640351 Footwear, soles, uppers of leather.. 2,116.69 0.23% 28.78% 1,695.43 17,209.02
871639 Trailers nes for the transport of .. 1,892.69 0.20% 22.89% 76,359.98 147,736.15
040221 Milk and cream powder unswe.. 1,891.91 0.20% 27.05% 230,657.14 1,194,133.54
Based on our tariff analysis, the calculation of RCAs, Palestine’s export capacities and
MERCOSUR’s demand, we can identify a list of products with potential for trade creation for
Palestine in the MERCOSUR countries. However, as we shall see in Table 14, most of these
products are not classified as “Category A” products, i.e. as products for immediate exemption
from customs duties in the MERCOSUR countries. In fact, as illustrated in the table, the only
products under Category A are slabs of marble (as all other stone and marble products), olive oil
and copper. Besides that, certain tariff lines under bars & rods, medicaments, polymers of
ethylene, cereals and organic washing/cleaning preparations are also classified as Category A
products.
On the other hand, many significant Palestinian export products are excluded from immediate
tariff exemption under MPFTA, including
- sacks & bags,
- cigarettes,
- furniture,
- mattresses,
- plants & parts thereof (incl. fresh
herbs),
- dairy products,
- mosaic tiles (and other products in the
handicraft sector),
- iron bars & rods,
- sugar confectionary,
- sausages,
- footwear, and
- trailers.

38
However, there is considerable potential for trade creation for Palestine in these sectors, especially
in the sectors with high applied tariffs by MERCOSUR, most notably, footwear, mattresses,
furniture, and trailers.
Table 14: Products with export potential and assigned tariff reduction categories under MPFTA
Product Product Name
MER
applied
AHS tariff
Tariff reduction
category under
MPFTA
Notes and specified conditions
680221 Cut or sawn slabs of marble, trave.. 8.90% A
392321 Sacks & bags (including cones) o.. 16.64% C / D
- Category C: for tariff line 39232190 in Brazil,
Uruguay, Venezuela
- Category D: for tariff line 39232110; 39232190
in Paraguay and Argentina
240220 Cigarettes containing tobacco 16.12% D
640199 Waterproof footwear(Wellington).. 31.03% n.a. For all other footwear apply Category C and D
940350 Bedroom furniture, wooden, nes 16.46% C
150910 Olive oil, virgin 12.90% A
760429 Bars, rods and other profiles, .. 8.95% A / C
- Category A: for tariff line 76042911
- Category C: for tariff lines 76042919 and
76042920
300490 Medicaments nes, in dosage 9.09% A / B / C / D
- Category A: 8 tariff lines
- Category C: 26 tariff lines
- Category D: 22 tariff lines
- Others: 2 tariff lines under different Categories
depending on country
940429 Mattresses, stuffed, spring interior.. 20.17% D
121190 Plants & parts, pharmacy, perfume.. 7.50% B
940161 Seats with wooden frames, .. 20.01% D
390190 Polymers of ethylene nes, in .. 8.25% A / C
- Category A: for tariff line 39019030 and
390140
- Category C: for tariff lines 39019010 and
39019020
040310 Yogurt 14.67% B
721399 Bars&rods,iron/na st irr 9.10% B
740400 Copper/copper alloy waste or scrap 2.00% A
690810 Glazed ceramic mosaic tiles, cube.. 13.88% C
100890 Cereals unmilled nes 4.41% A / B - Category A: for tariff line 10089010
- Category B: for tariff line 10089090
170490 Sugar confectionery not chewing.. 17.50% B
340290 Organic surfactant washing, clea.. 11.33% A / C / D
- Category A: for tariff lines 34029021,
34029022, 34029023
- Category C: for tariff lines 34029011,
34029019
- Category D: for tariff lines 34029029,
34029031, 34029039, 34029090
160100 Sausages, similar products of meat,
meat .. 15.04% B
940310 Office furniture, metal, nes 20.61% C
640419 Footwear,sole rubber/plastic,uppe.. 29.89% C
940370 Furniture, plastic, nes 20.23% C
540791 Woven fabric synthetic filament nes 20.42% D
040610 Fresh cheese, unfermented whey .. 21.17% B
640351 Footwear, soles, uppers of leather.. 28.78% C
871639 Trailers nes for the transport of .. 22.89% n.a.

39
Deep integration
In analysing the potential impact of MPFTA, it is important to consider not just the implications of
the removal of tariff barriers, but also the implications of the removal of non-tariff barriers and the
opportunities for positive or deeper integration. These may deal, for example, with regulatory
harmonisation, with investment rules, with liberalisation of services, and with measures of trade
defence. The welfare gains from a process of deeper integration are likely to be considerably
higher than those derived simply from a process of shallow integration. The possible range of
further gains often associated with deeper integration include: technology transfer and diffusion
both through trade and foreign direct investment (FDI); pro-competitive gains from increasing
import competition in an environment of imperfect competition, which may also allow greater
exploitation of economies of scale in production; the increased geographical dispersion of
production through trade that supports (i) exploitation of different factor proportions for different
parts of the production process (Ricardian efficiency gains) and/or (ii) local economies of scale
through finer specialization and division of labour in production (Smithian efficiency gains); and
externalities arising from institutional changes that lead to wide increases in productivity.10
It is more likely that the potential for deeper integration gains will be achieved the greater is the
realisation of a “common economic space” as a result of an FTA. This common economic space
requires both removal of barriers to trade that operate beyond borders (e.g. discriminatory taxes
and regulations) and action to undertake common policies needed for dealing with the existence of
public goods and externalities. Of course, the impact of deep integration will clearly depend on
whether the norms adopted are appropriate — i.e., generate positive externalities and promote
trade. Broadly speaking, adopting appropriate standards is synonymous with finding the
appropriate intuitional framework for dealing with externalities.11
Instruments of deep integration in MPFTA
The MERCOSUR-Palestine FTA (MPFTA) includes provisions on many instruments for deep
integration. As outlined in Article 3 of MPFTA, in addition to eliminating trade barriers and
facilitating the movement of goods, the Agreement also targets
i) promoting conditions of fair competition in the free trade area;
ii) boosting investment opportunities and increasing cooperation in areas of mutual
interest,
iii) creating effective procedures for the implementation, application and compliance of the
Agreement and its joint administration; and
iv) to set a framework for further bilateral and multilateral cooperation aimed at expanding
and enhancing the benefits of the Agreement.
10
CARIS (2007), Qualitative Analysis of a Potential Free Trade Agreement between the European Union and India. 11
Ibid.

40
The agreement also includes chapters on the establishment of a Joint Committee, rules of origin,
safeguards, technical regulations and procedures for standards and conformity assessment, sanitary
and phytosanitary measures, technical and technological cooperation, institutional provisions,
publications and notifications, dispute settlement and arbitration.
Furthermore, the Parties agree that negotiations in the fields of investment and trade in services on
the basis of GATS may be opened in the framework of the Joint Committee. In addition, in order
to broaden reciprocal knowledge about trade and investment opportunities in both Palestine and
MERCOSUR Member countries, the Parties shall stimulate trade promotion activities such as
seminars, trade missions, fairs, symposia and exhibitions.
Joint Committee
Article 1 of Chapter IX lay out the establishment of a Joint Committee under MPFTA, which shall
be responsible for administering the Agreement and ensuring a proper implementation. Within the
Joint Committee, the Parties may have the opportunity to consult on all issues related to trade
between them, and further remove obstacles to trade. Article 2 of the same chapter comprises an
outline of the work procedures of the Joint Committee.
Customs cooperation and rules of origin
Article 8 of MPFTA points out the importance of customs cooperation, committing both Parties to
establishing dialogue on all matters related to customs, providing mutual assistance and developing
mechanisms for customs cooperation.
Furthermore, Chapter IV lays out the rules of origin and relevant matters in this regard, the
certificate of origin/invoice declaration, mutual assistance and dispute settlement. In Annex I to
this chapter, Palestine agrees to postpone the implementation of free circulation of goods among
MERCOSUR Member states, and that the Joint Committee shall determine measures for its
implementation.
Trade remedies (safeguards, subsidies and anti-dumping measures)
Article 3 of MPFTA lays out that regarding “the application of antidumping or countervailing
measures and with respect to subsidies, the Signatory Parties shall be governed by their respective
legislation, which shall be consistent with the WTO Agreement”. In Article 4 of the Agreement,
the Parties agree that the Parties may apply safeguards, in case of an imported product causing
serious injury or threat of serious injury to a domestic industry. The application of safeguards is
explained in detail in Chapter V.
Technical regulations, standards and conformity assessment procedures
Aiming at eliminating technical barriers to trade and promoting the harmonization of international
standards, the Parties agree in Chapter VI to cooperate in the fields of standardization, metrology,
conformity assessment and product certification. Excluded from these provisions are sanitary and
phytosanitary (SPS) measures, services and government procurement.

41
In this chapter, the Parties not only commit themselves to strengthen national standardization,
technical regulations, conformity assessment and metrology systems; they also agree on the
possibility and process of implementing mutual recognition agreements based on WTO/TBT
Agreements, and the provision of mutual cooperation and technical assistance.
Sanitary and phytosanitary measures
In Chapter VII, Palestine and MERCOSUR agree on guidelines for cooperation in the field of SPS
measures. These guidelines are in conformity with the WTO Agreement on the Application of
Sanitary and Phytosanitary Measures, and generally target the facilitation of trade between the
Parties “in animals and animal products, plants and plant products, regulated articles or any other
product deemed to require sanitary and phytosanitary measures, included in this Agreement, whilst
safeguarding human, animal and plant health”.
This chapter includes provisions on the exchange of information regarding changes of the SPS
status and epidemiological findings and others. Furthermore, the Parties agree on establishing a
mechanism for consultation, shall the Parties face SPS related obstacles. This mechanism is set out
in detail under Article 3 of Chapter VII.
Technical and technological cooperation
In order to develop their industrial sectors and infrastructure, the Parties agree in Chapter VIII to
establish a mechanism for technological cooperation, which may entail technology transfer and
joint projects for the development of new technologies and other initiatives.
On the other hand, the Parties shall develop a cooperation mechanism for technical cooperation in
order to develop technical capabilities in specific sectors, with particular emphasis on
strengthening SMEs. This provision includes
- organizing and holding fairs, exhibitions, conferences, advertising, consultancy and other
business services;
- developing contacts between business entities, manufacturers associations, chambers of
commerce and other business associations in MERCOSUR countries and Palestine;
- conducting trainings for technicians.
No later than 6 months after entry into force of MPFTA, the Joint Committee shall define priority
sectors for both technical and technological cooperation.

42
Summary and Conclusions
While MERCOSUR has been a fairly significant trade partner for Palestinian imports, especially
of frozen meat products & fish, coffee, cane sugar and tobacco, Palestine has barely exported so
far been an insignificant trade partner for Palestine’s exports. Until 2010, Palestine’s exported to
the MERCOSUR countries in the past years. In 2010, Palestine exported sawing machines for
working stone, ceramics and glass at the value of 200 thousand USD. Furthermore, while dates
were exported in 2011 and 2012 at the total value of 135 thousand USD, no exports were
registered in 2013. Within MERCOSUR, nearly all of Palestine’s exports were directed to Brazil,
which was also Palestine’s most important partner for imports from MERCOSUR.
Examining the potential impact of tariff measures taken under MPFTA, we have identified
considerable scope for trade creation for Palestine in certain sectors. However, as we shall see
below, the majority of these products have not been prioritized under MPFTA’s tariff
exemption program.
When looking first at Israeli and MERCOSUR’s applied tariffs at the total trade level, we find that
while Israeli tariffs have been low throughout time at around 5.1%, MERCOSUR’s tariffs have
been relatively high at average levels of 14.9% for Brazil, 13.5% for Argentina, 13.2% for
Venezuela, 12.2% for Paraguay, 11.7% for Uruguay. Additionally, Israel’s applied tariff peaks are
relatively low, whereas we have identified a very high number of tariff peaks applied in the
MERCOSUR countries. This suggests that for Palestine, there may be considerable scope for trade
creation through tariff reduction/exemption in the sectors with tariff peaks.
Having said this, we look at Palestine’s top 25 exports in the years 2007-2013 and find that
MERCOSUR applies tariff peaks in the following sectors:
- Sacks & bags,
- Cigarettes containing tobacco,
- Waterproof footwear,
- Wooden furniture,
- Olive oil,
- Bars & rods,
- Mattresses,
- Seats with wooden frames,
- Yogurt,
- Sugar confectionary,
- Organic washing/cleaning preparations,
- Sausages;
Additionally, MERCOSUR applies particularly high AHS tariffs (>20%) in the following
sectors:
- Furniture: Metal office furniture, wooden office furniture, plastic furniture;

43
- Footwear: Footwear with rubber sole, leather footwear;
- Textile: Woven fabric with synthetic filament, pullovers and cardigans, women/girls
trousers;
- Dairy: Fresh cheese, Milk and cream powder;
- Trailers.
To explore further the export potential of the products which we have identified, we have also
looked at their revealed comparative advantage (RCA) at different levels: Palestine’s RCA in
the world, Palestine’s RCA in the world relative to MERCOSUR and Palestine’s RCA in the world
relative to Israel. Looking at all the three levels, the overall result shows that Palestine’s
comparative advantage is particularly high for
- yogurt,
- sacks & bags,
- woven fabric with synthetic filament,
- waterproof footwear,
- office furniture and
- mattresses.
Lastly, in order to identify potential for trade creation, we take into consideration MERCOSUR’s
demand based on imports and exports in the discussed sectors. We find that while the demand is
low for slabs of stone, scrap ingots, waste/scrap of tinned iron/steel, wooden pallets, granite and
milk & cream powder, MERCOSUR’s demand appears to be particularly high for
- slabs of marble,
- agricultural produce (olive oil, plants and parts thereof, incl. fresh herbs, cereals)
- bars & rods,
- medicaments,
- furniture (seats with wooden frames, metal office furniture, plastic furniture)
- polymers of ethylene,
- ceramic mosaic tiles,
- organic washing/cleaning preparations and
- footwear.
Having identified a list of products with considerable export potential for Palestine, we next take
into consideration MPFTA’s tariff reduction program, and the list of concessions negotiated
between Palestine and MERCOSUR. This analysis brings into light that unfortunately, the great
majority of our identified products with export potential are not subject to immediate customs
exemption (“Category A”) in MERCOSUR.
Table 1 below illustrate that in fact, only 3 products at the 6-digit level (slabs of marble, olive oil
and copper) as well as 15 products at the 8-digit level are provided immediate tariff exemption in
MERCOSUR, while for all other products, tariff exemption is going to take place only within 4, 8
or 10 years (Categories B, C and D).

44
The table above also reveals that MERCOSUR’s concessions provided to Palestine are nearly the
same as those provided to Israel. However, one needs to take into consideration that Israel’s FTA
with MERCOSUR has entered into force in 2010, while MPFTA’s entry into force is still pending.
For this reason, MERCOSUR’s concessions are, for the time being and in the first 10 years
after entry into force of MPFTA, considerably more favorable to Israel than to Palestine.
Table 15: MERCOSUR’s concessions under MPFTA for Palestine’s products with export
potential
Product Product Name
MER
applied
AHS tariff
on WLD
imports
Tariff exemption for Palestine
under MPFTA upon entry into
force
Tariff exemption for Israel under
Israel-MERCOSUR FTA (entry
into force April 2010)
680221 Cut or sawn slabs of marble, trave.. 8.90% Immediate Within 3 years
392321 Sacks & bags (including cones) o.. 16.64% Within 8 and 10 years Within 8 and 10 years
240220 Cigarettes containing tobacco 16.12% Within 10 years Within 10 years
640199 Waterproof footwear(Wellington).. 31.03% n.a. n.a.
940350 Bedroom furniture, wooden, nes 16.46% Within 8 years Within 10 years
150910 Olive oil, virgin 12.90% Immediate Within 8 years
760429 Bars, rods and other profiles, .. 8.95% Within 8 years, immediate for
certain tariff line
Within 8 years, immediate for
certain tariff line
300490 Medicaments nes, in dosage 9.09%
Most tariff lines within 8 and
10 years, certain tariff lines
immediate.
Most tariff lines within 8 and 10
years, certain tariff lines
immediate.
940429 Mattresses, stuffed, spring interior.. 20.17% Within 10 years Within 10 years
121190 Plants & parts, pharmacy, perfume.. 7.50% Within 4 years Within 4 years
940161 Seats with wooden frames, .. 20.01% Within 10 years Within 10 years
390190 Polymers of ethylene nes, in .. 8.25% Certain tariff lines immediate,
others within 8 years.
Certain tariff lines immediate,
others within 8 years.
040310 Yogurt 14.67% Within 4 years Within 4 years
721399 Bars&rods,iron/na st irr 9.10% Within 4 years Within 8 years
740400 Copper/copper alloy waste or scrap 2.00% Immediate Immediate
690810 Glazed ceramic mosaic tiles, cube.. 13.88% Within 8 years Within 8 years
100890 Cereals unmilled nes 4.41% One tariff line immediate,
another within 4 years. Immediate
170490 Sugar confectionery not chewing.. 17.50% Within 4 years Within 4 years
340290 Organic surfactant washing, clea.. 11.33%
Immediate for certain tariff
lines, others within 8 and 10
years.
Immediate for certain tariff
lines, others within 8 and 10
years.
160100 Sausages, similar products of meat,
meat .. 15.04% Within 4 years Within 10 years
940310 Office furniture, metal, nes 20.61% Within 8 years Within 10 years
640419 Footwear,sole rubber/plastic,uppe.. 29.89% Within 8 years Within 10 years
940370 Furniture, plastic, nes 20.23% Within 8 years Within 10 years
540791 Woven fabric synthetic filament nes 20.42% Within 10 years Within 10 years
040610 Fresh cheese, unfermented whey .. 21.17% Within 4 years Within 8 years
640351 Footwear, soles, uppers of leather.. 28.78% Within 8 years Within 10 years
871639 Trailers nes for the transport of .. 22.89% n.a. n.a.

45
In a nutshell, there is considerable potential for shallow integration induced trade effects for
Palestine, if tariff measures are taken in the above mentioned sectors. As stated in Chapter III, Art.
3 of MPFTA, “[u]pon request of either Party, the Parties shall consider granting further
concessions in their bilateral trade”. Having said this, further efforts must be taken in order to
include at least the above mentioned products in MERCOSUR’s list of Category A
concessions. In addition, the list shall be modified further in order to provide Palestinian
exporters with – at least – the same tariff treatment as Israel.
In addition, in order to create trade, tariff measures must go along with behind-the-border
measures. As discussed above, MPFTA provides the coverage of many instruments for deep
integration, including customs cooperation and rules of origin, trade remedies (safeguards,
subsidies and anti-dumping measures), technical regulations, standards and conformity assessment
procedures, sanitary and phytosanitary measures and technical and technological cooperation. If,
as suggested in MPFTA, the Parties will establish cooperation mechanisms in these fields through
the Joint Committee, Palestine will be able to benefit from knowledge transfer in standards
matters, the participation in seminars, trade missions, fairs, symposia and exhibitions with the
support from MERCOSUR’s side, including targeted events for the encouragement of investing in
and trading with Palestine, just to name some of them.
Because the Agreement further suggests to conduct negotiations on agreements in the fields of
investment and services, respective actions should be taken upon entry into force of MPFTA.

46
Appendices
Annex I: The Sussex Framework
The Sussex Framework12
The Sussex Framework (SF) involves focussing on selected descriptive statistical indicators from which one can draw
analytical conclusions well-grounded in economic theory to evaluate the likely effects of a FTA.
Shallow integration
Preferential trade liberalization involves a process of shallow integration, defined as the removal of border barriers to
trade, typically tariffs and quotas. The potential net benefits from shallow integration are inherently ambiguous
because of the likelihood of both trade creation (which is welfare increasing) and trade diversion (which is welfare
reducing). The net welfare impact of a FTA depends on the relative size of these two effects.
There are two possible channels of trade creation: First, this can arise when more efficiently produced imported
goods replace less efficient domestically produced goods. Thus, trade is “created” and yields welfare gains on the
production side. Secondly, a reduction in tariffs that leads to a reduction in prices will increase the demand for goods
which were already previously imported from the partner country. This leads to trade creation and welfare gains on the
consumption side as consumers have access to cheaper goods than previously.
Trade diversion occurs when sources of supply switch away from more efficient non-partner countries to less
efficient partner countries. If, prior to the FTA, a country chose to import from a non-FTA supplier, this would have
occurred because that supplier was more efficient (cheaper) than the alternatives. If, because of tariff reduction, a
country moves the source of supply away from the more efficient (cheaper) supplier and towards the less efficient
FTA partner country, then trade diversion is considered to result in a welfare loss. On the other hand, there is a
potential welfare gain to the exporting FTA partner country, depending on whether the country was at full employment
prior to the FTA. If the partner country was previously at full employment, the FTA results in a reallocation of
resources from one sector to another, where demand has increased after the formation of the FTA.
The conclusion is that preferential liberalization in the framework of the FTA will have an impact on trade flows
through trade creation and trade diversion, but the net welfare effect from that reallocation of trade flows is inherently
ambiguous.
The SF identifies the following rules of thumb, which are used to shed light on the likely shallow integration impact of
a trade agreement:
1. The higher are the initial tariffs/barriers, the greater are the likely effects on both trade creation and trade
diversion. With high initial (MFN) tariffs, the initial distortion is great. This in turn means that in principle there is
greater scope for both trade creation and trade diversion as the high tariffs are preferentially removed. Thus if the pre-
FTA tariffs were very high, as these are removed it is more likely that the new partner country may be able to supply
the good more efficiently than the domestic economy. The higher the pre-FTA tariffs, the more likely it is that this will
be the case and consequently, the greater the possibility for such trade to be created. Moreover, the higher the pre-FTA
tariffs, the greater the price reduction arising from their removal, which in turn increases the demand for the good and
creates more trade. Each of these processes of trade creation are welfare increasing. However, it is also the case that if
pre-FTA tariffs were high, then as they are removed there is a greater possibility of the new FTA partner countries
supplying the (tariff free) good cheaper than the excluded countries (on whose exports tariffs are levied). Hence, even
though these excluded countries may produce the good more efficiently and cheaply, the good will be supplied by the
12 This section draws heavily on CARIS (2007), ‘Qualitative Analysis of a Potential Free Trade Agreement between the European
Union and India’, and CARIS (2007), ‘Assessing Preferential Trading Agreements Using the Sussex Framework’.

47
FTA partner who has preferential access to the market. The higher the pre-FTA tariffs, the more likely it is that this
form of welfare reducing trade diversion will occur.
2. The greater the number of FTA partners, the more likely it is that there will be trade creation as opposed to trade
diversion, because of the increased likelihood of including more efficient suppliers. As an illustration, suppose that a
given trade agreement were to include the maximum number of possible countries. At the limit this would include all
the countries in the world, and hence by definition the most efficient countries will have been included. Therefore,
including a greater number of countries in a FTA minimizes the extent of trade diversion, and simultaneously
maximizes the likelihood of trade creation.
3. Wide differences in comparative advantage between partner countries are likely to lead to a welfare improving
FTA. Trade creation occurs when there are differences in efficiency and costs across partner countries – hence the
FTA enables the partners to source the goods from the most efficient FTA partner. The greater those differences in
comparative advantage (and hence in costs across the countries) the greater is the likely gain from trade creation. If
Palestine is only marginally more efficient than the USA in producing a given good, then the gain to the USA from
importing the good from Palestine as opposed to producing it itself is relatively small. However, if Palestine is
significantly more efficient than the potential gains are that much higher. It is worth noting, however, that if the initial
tariffs are high then, as detailed in the first rule of thumb, there is also greater likelihood of trade diversion which
diminishes the trade creation gains.
4. The more similar the product mix in the economies concerned and the higher the elasticities of supply, the greater
the possibility of trade creation. Recall that trade creation occurs when the importing country produces less of the good
itself and instead imports the good from its FTA partner. Suppose that prior to the FTA there was no overlap
whatsoever between the two countries’ production bundles. If that were the case then the only possibilities for trade
creation would arise on the demand side. Conversely, if there is a significant overlap in the goods produced by the
partner countries, there is much more scope for switching sources of supply to the more efficient country. Note also
that assuming a given degree of overlap in the production structures, the more responsive supply is to the tariff
reduction-induced changes in prices, the greater the extent of trade creation.
5. The higher the percentage of trade with potential partners, the greater the possibility of the FTA enhancing
welfare. Consider an initial situation where there was very little trade with the potential partner country. This would
suggest that in the initial situation, third countries were more efficient suppliers. A FTA is therefore more likely to
result in trade diversion under these circumstances. Conversely, if in the initial situation the countries traded
significantly with each other, it is more likely that they are each respectively importing from the more efficient
supplier, and the chances of trade diversion occurring are lessened.
6. Trade diversion is more likely when partners and excluded countries are close competitors. If it is the case that the
partner exports a similar range of products as the excluded countries, then it is clearly more likely that a FTA may
result in the partner displacing the exports of one of the excluded countries.
7. The greater the possibilities for supply chain integration the greater the likely gains: Following from RT4,
specialization and supply chain integration greatly increases the chances of welfare gains, which are characteristic of
deep integration.
8. Greater share of trade in GDP suggests that larger gains are likely: A low trade share in GDP suggests a high
degree of protection, which thus points to greater distortions. Thus, a boost in trade to a closed economy will constitute
a welfare gain, and the less trade there is, the lesser is the risk of trade diversion.

48
Deep integration
In addition to shallow integration effects, there are further welfare gains arising from the induced growth effects
stimulated by, for example, productivity growth, positive externalities between firms, sectors or across sectors (e.g.
between manufacturing and services), technology transfer and diffusion both through trade and FDI, pro-competitive
gains from increasing import competition in an environment of imperfect competition, the increased geographical
dispersion of production through trade that supports the exploitation of different factor proportions for different parts
of the production process and/or local economies of scale through increased specialization and division of labor in
production. These gains are more likely to arise in the presence of deeper integration.
In contrast to shallow integration, deep integration involves policies and institutions that facilitate trade by reducing or
eliminating regulatory and behind-the-border impediments to trade, where such impediments may or may not be
intentional. These can include issues such as customs procedures, regulation of domestic services production that
discriminate against foreigners, product standards that differ from international norms or where testing and
certification of foreign goods is complex and perhaps exclusionary, regulation of inward investments, competition
policy, intellectual property protection and rules surrounding access to government procurement.
There is a contrast between shallow and deep integration: For shallow there is wealth of data and comprehensive and
sophisticated analytical methods for analysis of welfare effects, but usually the estimated welfare benefits are relative
small. Deep integration, in contrast, is likely to result in the creation of large welfare gains. However, there is a
relatively low availability of data and analytical methods for the analysis of deep integration.
In assessing a FTA it is therefore crucial to first identify the implications arising from the implied shallow integration
using the above-mentioned Rules of Thumb and then build upon this to consider the possible role and importance of
measures of deeper integration.
II: Geographical distribution of Palestine’s total trade with MERCOSUR by country (1996-
2013)
Year Partner Imports Value ('000s
USD)
Exports Value ('000s
USD) Imports Share Exports Share
1996
Argentina 1,523.62 0.00 56.39% 0.00%
Brazil 752.94 0.00 27.87% 0.00%
Venezuela 378.39 0.00 14.00% 0.00%
Uruguay 47.05 0.00 1.74% 0.00%
Total 2,702.00 0.00 100.00% -
1997
Argentina 1,863.61 0.00 49.33% 0.00%
Uruguay 1,030.72 0.00 27.28% 0.00%
Brazil 883.46 0.00 23.38% 0.00%
Venezuela 0.13 0.00 0.00% 0.00%
Total 3,777.92 0.00 100.00% -
1998
Brazil 1,710.58 0.00 39.26% 0.00%
Argentina 1,682.60 0.00 38.61% 0.00%
Uruguay 784.12 0.00 17.99% 0.00%
Venezuela 180.25 0.00 4.14% 0.00%
Total 4,357.55 0.00 100.00% -
1999
Brazil 2,062.42 0.00 52.69% 0.00%
Uruguay 1,132.52 0.00 28.93% 0.00%
Argentina 642.93 0.00 16.43% 0.00%
Paraguay 76.42 0.00 1.95% 0.00%
Total 3,914.28 0.00 100.00% -
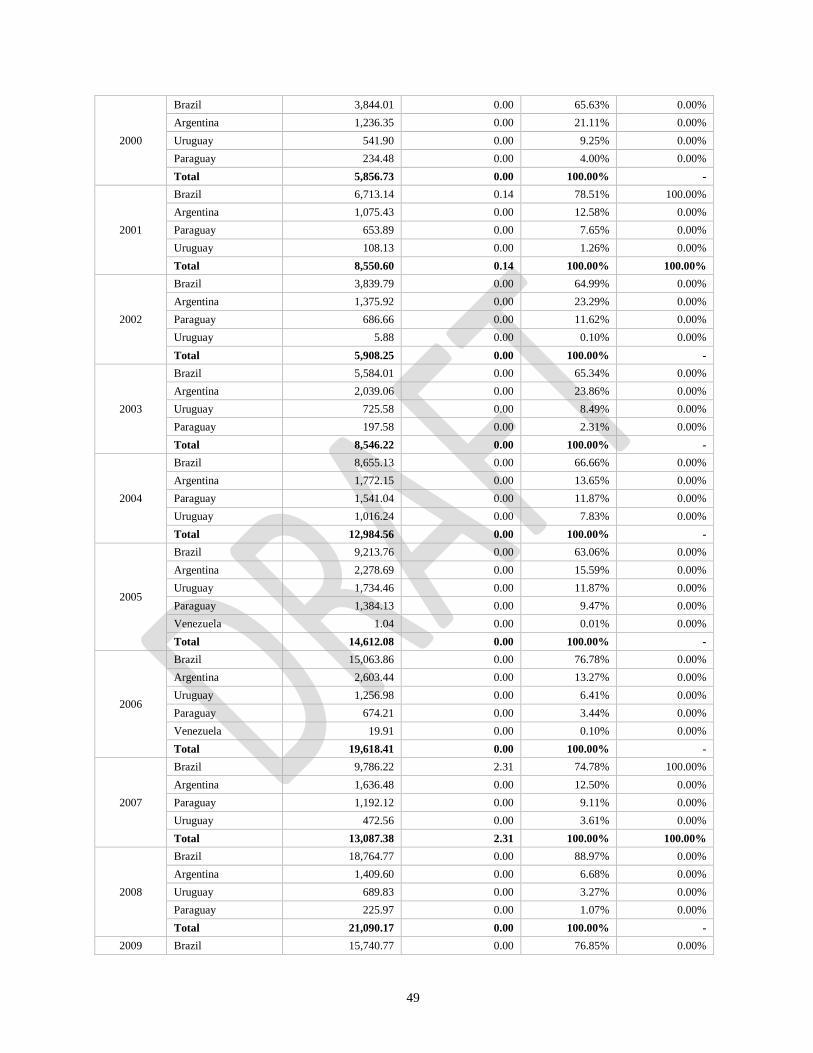
49
2000
Brazil 3,844.01 0.00 65.63% 0.00%
Argentina 1,236.35 0.00 21.11% 0.00%
Uruguay 541.90 0.00 9.25% 0.00%
Paraguay 234.48 0.00 4.00% 0.00%
Total 5,856.73 0.00 100.00% -
2001
Brazil 6,713.14 0.14 78.51% 100.00%
Argentina 1,075.43 0.00 12.58% 0.00%
Paraguay 653.89 0.00 7.65% 0.00%
Uruguay 108.13 0.00 1.26% 0.00%
Total 8,550.60 0.14 100.00% 100.00%
2002
Brazil 3,839.79 0.00 64.99% 0.00%
Argentina 1,375.92 0.00 23.29% 0.00%
Paraguay 686.66 0.00 11.62% 0.00%
Uruguay 5.88 0.00 0.10% 0.00%
Total 5,908.25 0.00 100.00% -
2003
Brazil 5,584.01 0.00 65.34% 0.00%
Argentina 2,039.06 0.00 23.86% 0.00%
Uruguay 725.58 0.00 8.49% 0.00%
Paraguay 197.58 0.00 2.31% 0.00%
Total 8,546.22 0.00 100.00% -
2004
Brazil 8,655.13 0.00 66.66% 0.00%
Argentina 1,772.15 0.00 13.65% 0.00%
Paraguay 1,541.04 0.00 11.87% 0.00%
Uruguay 1,016.24 0.00 7.83% 0.00%
Total 12,984.56 0.00 100.00% -
2005
Brazil 9,213.76 0.00 63.06% 0.00%
Argentina 2,278.69 0.00 15.59% 0.00%
Uruguay 1,734.46 0.00 11.87% 0.00%
Paraguay 1,384.13 0.00 9.47% 0.00%
Venezuela 1.04 0.00 0.01% 0.00%
Total 14,612.08 0.00 100.00% -
2006
Brazil 15,063.86 0.00 76.78% 0.00%
Argentina 2,603.44 0.00 13.27% 0.00%
Uruguay 1,256.98 0.00 6.41% 0.00%
Paraguay 674.21 0.00 3.44% 0.00%
Venezuela 19.91 0.00 0.10% 0.00%
Total 19,618.41 0.00 100.00% -
2007
Brazil 9,786.22 2.31 74.78% 100.00%
Argentina 1,636.48 0.00 12.50% 0.00%
Paraguay 1,192.12 0.00 9.11% 0.00%
Uruguay 472.56 0.00 3.61% 0.00%
Total 13,087.38 2.31 100.00% 100.00%
2008
Brazil 18,764.77 0.00 88.97% 0.00%
Argentina 1,409.60 0.00 6.68% 0.00%
Uruguay 689.83 0.00 3.27% 0.00%
Paraguay 225.97 0.00 1.07% 0.00%
Total 21,090.17 0.00 100.00% -
2009 Brazil 15,740.77 0.00 76.85% 0.00%

50
Argentina 3,905.46 0.00 19.07% 0.00%
Paraguay 452.45 0.00 2.21% 0.00%
Venezuela 192.14 0.00 0.94% 0.00%
Uruguay 190.69 0.00 0.93% 0.00%
Total 20,481.50 0.00 100.00% -
2010
Brazil 9,180.43 204.05 78.24% 99.54%
Argentina 1,672.66 0.94 14.25% 0.46%
Uruguay 428.38 0.00 3.65% 0.00%
Paraguay 278.03 0.00 2.37% 0.00%
Venezuela 174.67 0.00 1.49% 0.00%
Total 11,734.16 204.99 100.00% 100.00%
2011
Brazil 18,909.86 65.33 86.40% 100.00%
Argentina 1,827.46 0.00 8.35% 0.00%
Venezuela 400.18 0.00 1.83% 0.00%
Uruguay 383.60 0.00 1.75% 0.00%
Paraguay 365.16 0.00 1.67% 0.00%
Total 21,886.26 65.33 100.00% 100.00%
2012
Brazil 19,322.97 72.00 80.28% 100.00%
Argentina 3,264.33 0.00 13.56% 0.00%
Uruguay 969.72 0.00 4.03% 0.00%
Paraguay 448.96 0.00 1.87% 0.00%
Venezuela 62.90 0.00 0.26% 0.00%
Total 24,068.88 72.00 100.00% 100.00%
2013
Brazil 20,035.29 0.00 75.90% 0.00%
Argentina 4,596.02 0.00 17.41% 0.00%
Paraguay 1,329.80 0.00 5.04% 0.00%
Uruguay 434.70 0.00 1.65% 0.00%
Venezuela 0.04 0.00 0.00% 0.00%
Total 26,395.85 0.00 100.00% -
Source: PCBS (data for 1996-2006 aggregated from SITC Rev. 3 5-digit data, for 2007-2013 aggregated from HS
1996 6-digit)

51
Annex III: MERCOSUR’s top trade partners 1996-2013
Partner Year Imports Value
('000s USD)
Exports Value
('000s USD) Imports share Exports share
World 1996 32,663,767.04 46,881,970.18 100.00% 100.00%
World 1997 112,298,328.60 105,035,996.20 100.00% 100.00%
World 1998 113,125,028.10 98,391,402.11 100.00% 100.00%
World 1999 96,071,382.59 94,398,073.26 100.00% 100.00%
World 2000 101,441,205.50 115,572,805.40 100.00% 100.00%
World 2001 97,601,209.72 113,248,703.70 100.00% 100.00%
World 2002 71,533,682.63 112,946,893.80 100.00% 100.00%
World 2003 74,645,090.18 131,630,132.90 100.00% 100.00%
World 2004 105,768,210.50 175,630,346.90 100.00% 100.00%
World 2005 131,289,803.20 219,124,954.90 100.00% 100.00%
World 2006 165,619,020.60 251,570,219.90 100.00% 100.00%
World 2007 218,725,997.00 223,763,187.40 100.00% 100.00%
World 2008 296,211,025.40 361,844,341.20 100.00% 100.00%
World 2009 218,956,696.50 273,821,746.20 100.00% 100.00%
World 2010 288,249,258.60 345,735,296.20 100.00% 100.00%
World 2011 360,042,851.40 447,103,392.20 100.00% 100.00%
World 2012 314,863,863.10 339,487,401.80 100.00% 100.00%
World 2013 337,060,779.10 337,309,973.50 100.00% 100.00%
EU 1996 8,681,768.65 6,724,376.40 26.58% 14.34%
EU 1997 28,991,891.54 21,267,323.06 25.82% 20.25%
EU 1998 30,931,532.17 22,306,183.01 27.34% 22.67%
EU 1999 27,910,278.65 20,947,597.61 29.05% 22.19%
EU 2000 24,221,451.98 22,450,781.01 23.88% 19.43%
EU 2001 23,789,077.11 22,668,359.78 24.37% 20.02%
EU 2002 18,526,873.01 23,488,502.82 25.90% 20.80%
EU 2003 18,165,092.19 28,749,405.06 24.34% 21.84%
EU 2004 23,458,715.02 34,312,087.44 22.18% 19.54%
EU 2005 27,367,703.87 38,365,862.07 20.85% 17.51%
EU 2006 29,997,626.15 45,510,758.35 18.11% 18.09%
EU 2007 38,895,002.06 51,586,245.07 17.78% 23.05%
EU 2008 52,626,246.28 67,235,438.58 17.77% 18.58%
EU 2009 41,931,383.61 45,897,559.05 19.15% 16.76%
EU 2010 54,207,295.69 57,524,090.91 18.81% 16.64%
EU 2011 65,266,411.39 70,654,415.47 18.13% 15.80%
EU 2012 62,109,888.58 63,092,226.93 19.73% 18.58%
EU 2013 66,897,540.57 60,180,654.82 19.85% 17.84%
USA 1996 8,750,748.42 15,935,021.06 26.79% 33.99%
USA 1997 27,743,649.92 24,815,443.07 24.71% 23.63%
USA 1998 27,500,083.52 21,118,155.22 24.31% 21.46%
USA 1999 23,269,861.55 24,966,944.63 24.22% 26.45%
USA 2000 23,830,293.47 35,205,829.20 23.49% 30.46%
USA 2001 22,806,560.19 31,784,296.97 23.37% 28.07%
USA 2002 16,338,410.25 32,257,477.92 22.84% 28.56%
USA 2003 14,981,391.91 31,444,407.01 20.07% 23.89%
USA 2004 19,870,335.32 48,996,908.61 18.79% 27.90%
USA 2005 24,727,091.08 53,286,853.18 18.83% 24.32%
USA 2006 27,200,532.23 60,766,188.56 16.42% 24.15%
USA 2007 33,406,967.58 30,254,489.00 15.27% 13.52%
USA 2008 46,430,903.22 60,183,163.29 15.67% 16.63%
USA 2009 36,798,008.20 20,158,487.08 16.81% 7.36%
USA 2010 44,499,602.45 24,145,343.00 15.44% 6.98%

52
USA 2011 53,934,680.65 31,073,020.34 14.98% 6.95%
USA 2012 43,077,789.34 31,468,640.38 13.68% 9.27%
USA 2013 46,150,650.08 29,762,557.68 13.69% 8.82%
China 1996 698,214.94 608,196.67 2.14% 1.30%
China 1997 2,385,997.90 2,082,501.05 2.12% 1.98%
China 1998 2,406,743.81 1,663,108.53 2.13% 1.69%
China 1999 2,092,697.36 1,255,510.36 2.18% 1.33%
China 2000 2,936,195.51 2,013,379.15 2.89% 1.74%
China 2001 3,105,415.28 3,239,763.52 3.18% 2.86%
China 2002 2,395,756.02 3,815,755.77 3.35% 3.38%
China 2003 3,397,348.68 7,290,138.56 4.55% 5.54%
China 2004 6,128,897.28 8,481,517.73 5.79% 4.83%
China 2005 8,575,594.58 10,393,766.57 6.53% 4.74%
China 2006 14,382,763.25 12,181,623.20 8.68% 4.84%
China 2007 21,950,630.03 16,132,832.96 10.04% 7.21%
China 2008 35,051,199.81 23,295,350.28 11.83% 6.44%
China 2009 27,638,763.33 24,430,031.63 12.62% 8.92%
China 2010 41,335,240.79 37,668,486.99 14.34% 10.90%
China 2011 52,817,509.23 51,579,159.45 14.67% 11.54%
China 2012 49,046,589.54 47,087,098.83 15.58% 13.87%
China 2013 54,013,887.14 52,884,894.60 16.02% 15.68%
Unspecified 1996 446,397.90 507,737.23 1.37% 1.08%
Unspecified 1997 1,065,394.12 1,965,693.75 0.95% 1.87%
Unspecified 1998 435,918.79 1,185,402.20 0.39% 1.20%
Unspecified 1999 336,533.54 2,284,649.42 0.35% 2.42%
Unspecified 2000 678,370.49 2,802,184.45 0.67% 2.42%
Unspecified 2001 471,628.78 2,638,550.95 0.48% 2.33%
Unspecified 2002 264,884.34 2,195,155.86 0.37% 1.94%
Unspecified 2003 434,540.27 3,976,668.46 0.58% 3.02%
Unspecified 2004 1,044,510.12 9,200,249.79 0.99% 5.24%
Unspecified 2005 347,443.24 18,469,553.46 0.26% 8.43%
Unspecified 2006 7,624,317.81 15,361,188.28 4.60% 6.11%
Unspecified 2007 13,285,285.67 3,804,559.64 6.07% 1.70%
Unspecified 2008 3,235,367.92 30,220,238.02 1.09% 8.35%
Unspecified 2009 1,732,454.96 52,560,327.24 0.79% 19.20%
Unspecified 2010 2,339,474.37 57,194,022.02 0.81% 16.54%
Unspecified 2011 4,397,635.93 77,298,017.90 1.22% 17.29%
Unspecified 2012 910,330.40 2,049,556.68 0.29% 0.60%
Unspecified 2013 692,877.20 2,170,419.00 0.21% 0.64%
Germany 1996 1,828,571.30 1,041,116.32 5.60% 2.22%
Germany 1997 7,663,727.48 3,484,216.46 6.82% 3.32%
Germany 1998 8,226,065.75 3,925,170.03 7.27% 3.99%
Germany 1999 7,095,040.59 3,497,592.06 7.39% 3.71%
Germany 2000 6,378,335.50 3,498,613.42 6.29% 3.03%
Germany 2001 6,603,561.80 3,293,137.25 6.77% 2.91%
Germany 2002 5,685,807.62 3,406,944.11 7.95% 3.02%
Germany 2003 5,417,296.65 4,152,544.32 7.26% 3.15%
Germany 2004 6,761,851.50 5,220,434.50 6.39% 2.97%
Germany 2005 8,232,114.53 6,426,378.15 6.27% 2.93%
Germany 2006 8,919,365.81 7,790,228.95 5.39% 3.10%
Germany 2007 11,726,411.92 8,668,136.41 5.36% 3.87%
Germany 2008 16,257,676.03 12,047,527.28 5.49% 3.33%
Germany 2009 13,422,518.96 7,805,676.13 6.13% 2.85%
Germany 2010 16,540,354.32 10,443,248.53 5.74% 3.02%
Germany 2011 20,281,956.17 12,420,742.85 5.63% 2.78%

53
Germany 2012 18,377,608.56 9,945,067.25 5.84% 2.93%
Germany 2013 19,604,617.63 8,838,803.40 5.82% 2.62%
GAFTA 1996 93,350.16 989,603.44 0.29% 2.11%
GAFTA 1997 2,563,806.31 2,793,523.69 2.28% 2.66%
GAFTA 1998 1,816,309.51 2,764,941.69 1.61% 2.81%
GAFTA 1999 2,109,648.76 2,505,544.62 2.20% 2.65%
GAFTA 2000 3,030,447.90 2,591,007.58 2.99% 2.24%
GAFTA 2001 2,483,560.45 3,528,846.25 2.54% 3.12%
GAFTA 2002 2,356,881.67 3,969,160.11 3.29% 3.51%
GAFTA 2003 2,769,557.59 4,400,569.95 3.71% 3.34%
GAFTA 2004 4,252,558.32 6,149,974.86 4.02% 3.50%
GAFTA 2005 5,400,991.58 7,525,050.79 4.11% 3.43%
GAFTA 2006 5,545,091.34 8,939,156.82 3.35% 3.55%
GAFTA 2007 6,750,045.40 9,932,862.26 3.09% 4.44%
GAFTA 2008 10,904,634.56 14,399,840.80 3.68% 3.98%
GAFTA 2009 5,478,364.85 12,608,034.43 2.50% 4.60%
GAFTA 2010 7,503,652.53 16,273,646.23 2.60% 4.71%
GAFTA 2011 10,790,563.12 21,579,761.90 3.00% 4.83%
GAFTA 2012 11,977,462.74 20,428,182.22 3.80% 6.02%
GAFTA 2013 12,981,594.42 20,571,938.21 3.85% 6.10%
Japan 1996 1,025,435.81 658,332.03 3.14% 1.40%
Japan 1997 5,623,123.44 3,892,129.98 5.01% 3.71%
Japan 1998 5,793,981.34 3,069,513.75 5.12% 3.12%
Japan 1999 4,423,471.45 2,978,924.70 4.60% 3.16%
Japan 2000 4,627,650.44 3,126,547.10 4.56% 2.71%
Japan 2001 4,726,038.49 2,517,301.89 4.84% 2.22%
Japan 2002 3,179,548.57 2,602,046.50 4.44% 2.30%
Japan 2003 3,189,043.87 2,812,585.31 4.27% 2.14%
Japan 2004 4,150,946.19 3,406,207.19 3.92% 1.94%
Japan 2005 4,815,407.13 4,006,181.95 3.67% 1.83%
Japan 2006 5,869,956.55 4,543,957.86 3.54% 1.81%
Japan 2007 7,003,597.85 5,050,233.93 3.20% 2.26%
Japan 2008 9,486,151.38 6,796,425.28 3.20% 1.88%
Japan 2009 7,316,451.94 4,818,552.27 3.34% 1.76%
Japan 2010 9,061,875.13 8,033,012.20 3.14% 2.32%
Japan 2011 10,283,875.59 10,384,414.41 2.86% 2.32%
Japan 2012 9,656,164.11 9,218,321.44 3.07% 2.72%
Japan 2013 8,974,779.71 9,450,160.48 2.66% 2.80%
Netherlands 1996 329,960.66 1,718,452.38 1.01% 3.67%
Netherlands 1997 1,060,226.96 5,297,706.22 0.94% 5.04%
Netherlands 1998 1,204,497.38 4,516,874.74 1.06% 4.59%
Netherlands 1999 1,072,358.80 4,135,195.74 1.12% 4.38%
Netherlands 2000 1,123,720.02 3,907,636.32 1.11% 3.38%
Netherlands 2001 868,058.45 4,015,482.14 0.89% 3.55%
Netherlands 2002 755,846.25 4,623,949.99 1.06% 4.09%
Netherlands 2003 715,133.89 7,449,249.52 0.96% 5.66%
Netherlands 2004 931,348.40 7,517,052.91 0.88% 4.28%
Netherlands 2005 1,248,211.03 7,342,825.84 0.95% 3.35%
Netherlands 2006 1,187,735.85 8,513,544.54 0.72% 3.38%
Netherlands 2007 1,666,305.96 10,767,109.17 0.76% 4.81%
Netherlands 2008 2,174,388.96 14,817,354.42 0.73% 4.09%
Netherlands 2009 1,647,759.57 10,790,009.24 0.75% 3.94%
Netherlands 2010 2,492,646.70 13,170,582.96 0.86% 3.81%
Netherlands 2011 3,175,467.58 16,578,814.90 0.88% 3.71%
Netherlands 2012 4,403,463.79 17,443,201.15 1.40% 5.14%

54
Netherlands 2013 3,579,501.59 19,517,195.61 1.06% 5.79%
Chile 1996 676,122.48 1,971,824.77 2.07% 4.21%
Chile 1997 1,952,076.37 3,344,960.92 1.74% 3.18%
Chile 1998 1,834,849.26 3,185,195.82 1.62% 3.24%
Chile 1999 1,660,537.73 2,995,497.54 1.73% 3.17%
Chile 2000 1,914,060.04 4,177,358.06 1.89% 3.61%
Chile 2001 1,745,039.77 4,419,983.53 1.79% 3.90%
Chile 2002 1,076,616.19 4,650,208.00 1.51% 4.12%
Chile 2003 1,309,683.45 5,579,607.46 1.75% 4.24%
Chile 2004 2,130,790.61 6,819,635.01 2.01% 3.88%
Chile 2005 2,867,973.34 8,846,617.59 2.18% 4.04%
Chile 2006 4,019,207.72 9,500,573.81 2.43% 3.78%
Chile 2007 4,963,371.08 8,753,236.41 2.27% 3.91%
Chile 2008 6,534,491.59 11,176,757.99 2.21% 3.09%
Chile 2009 4,358,114.79 7,515,962.60 1.99% 2.74%
Chile 2010 5,781,768.42 9,498,346.15 2.01% 2.75%
Chile 2011 7,194,168.36 10,997,075.71 2.00% 2.46%
Chile 2012 5,466,843.00 10,062,401.43 1.74% 2.96%
Chile 2013 5,599,558.38 9,059,757.71 1.66% 2.69%
Italy 1996 1,834,405.22 882,974.78 5.62% 1.88%
Italy 1997 6,010,563.25 2,650,006.94 5.35% 2.52%
Italy 1998 5,703,708.69 2,899,831.22 5.04% 2.95%
Italy 1999 5,734,721.41 2,736,055.73 5.97% 2.90%
Italy 2000 3,986,629.80 3,162,892.36 3.93% 2.74%
Italy 2001 3,705,989.04 2,955,405.85 3.80% 2.61%
Italy 2002 2,639,733.80 2,957,184.30 3.69% 2.62%
Italy 2003 2,522,368.61 3,397,757.09 3.38% 2.58%
Italy 2004 3,180,300.19 4,978,163.49 3.01% 2.83%
Italy 2005 3,642,681.17 5,242,899.45 2.77% 2.39%
Italy 2006 4,168,737.43 5,250,576.92 2.52% 2.09%
Italy 2007 5,248,339.63 6,017,474.18 2.40% 2.69%
Italy 2008 7,146,313.56 6,856,404.77 2.41% 1.89%
Italy 2009 5,690,765.73 4,755,458.17 2.60% 1.74%
Italy 2010 7,087,907.27 6,315,097.23 2.46% 1.83%
Italy 2011 8,616,940.25 8,077,565.43 2.39% 1.81%
Italy 2012 7,884,160.30 6,117,123.35 2.50% 1.80%
Italy 2013 8,655,471.16 5,649,436.71 2.57% 1.67%
Mexico 1996 897,739.74 399,602.02 2.75% 0.85%
Mexico 1997 2,463,504.16 1,466,325.56 2.19% 1.40%
Mexico 1998 2,321,781.58 1,506,776.84 2.05% 1.53%
Mexico 1999 1,703,462.52 1,567,143.26 1.77% 1.66%
Mexico 2000 2,024,000.04 2,402,852.97 2.00% 2.08%
Mexico 2001 1,962,712.53 2,793,192.59 2.01% 2.47%
Mexico 2002 1,311,106.83 3,447,250.18 1.83% 3.05%
Mexico 2003 1,218,603.41 4,014,176.73 1.63% 3.05%
Mexico 2004 2,194,168.09 5,553,812.26 2.07% 3.16%
Mexico 2005 3,168,592.28 5,852,844.82 2.41% 2.67%
Mexico 2006 4,155,974.11 6,715,007.47 2.51% 2.67%
Mexico 2007 5,014,521.45 5,909,724.18 2.29% 2.64%
Mexico 2008 7,112,866.47 6,086,920.17 2.40% 1.68%
Mexico 2009 5,570,899.44 3,959,446.66 2.54% 1.45%
Mexico 2010 7,344,130.82 5,329,716.41 2.55% 1.54%
Mexico 2011 9,580,547.69 5,267,447.87 2.66% 1.18%
Mexico 2012 8,789,395.86 5,129,207.59 2.79% 1.51%
Mexico 2013 8,424,042.55 5,712,384.13 2.50% 1.69%

55
Spain 1996 1,248,319.73 936,097.76 3.82% 2.00%
Spain 1997 2,813,649.49 1,926,831.13 2.51% 1.83%
Spain 1998 3,036,028.92 2,200,311.28 2.68% 2.24%
Spain 1999 2,827,568.06 2,401,710.62 2.94% 2.54%
Spain 2000 2,534,530.41 2,422,158.97 2.50% 2.10%
Spain 2001 2,509,167.59 2,644,145.02 2.57% 2.33%
Spain 2002 1,684,752.45 2,871,431.64 2.36% 2.54%
Spain 2003 1,775,089.02 3,238,465.75 2.38% 2.46%
Spain 2004 2,307,162.45 3,752,143.99 2.18% 2.14%
Spain 2005 2,554,772.62 4,336,532.12 1.95% 1.98%
Spain 2006 2,585,791.79 6,203,217.67 1.56% 2.47%
Spain 2007 3,442,010.48 5,719,611.81 1.57% 2.56%
Spain 2008 4,618,539.38 8,831,539.60 1.56% 2.44%
Spain 2009 3,664,014.53 4,736,274.70 1.67% 1.73%
Spain 2010 4,885,935.49 6,611,897.54 1.70% 1.91%
Spain 2011 6,395,616.36 8,281,677.67 1.78% 1.85%
Spain 2012 5,104,498.67 6,648,142.46 1.62% 1.96%
Spain 2013 6,165,759.47 5,624,204.36 1.83% 1.67%
France 1996 1,360,287.20 401,844.30 4.16% 0.86%
France 1997 3,456,050.08 1,583,393.00 3.08% 1.51%
France 1998 4,441,073.43 1,689,711.88 3.93% 1.72%
France 1999 4,253,976.82 1,679,073.87 4.43% 1.78%
France 2000 3,402,101.20 2,504,111.39 3.35% 2.17%
France 2001 3,275,274.99 2,180,510.79 3.36% 1.93%
France 2002 2,346,244.01 2,038,556.00 3.28% 1.80%
France 2003 2,380,052.51 2,181,562.10 3.19% 1.66%
France 2004 3,160,446.20 2,634,150.05 2.99% 1.50%
France 2005 3,799,850.77 3,100,038.06 2.89% 1.41%
France 2006 4,236,243.70 3,718,905.63 2.56% 1.48%
France 2007 5,093,921.09 4,187,943.29 2.33% 1.87%
France 2008 6,824,783.87 5,199,421.37 2.30% 1.44%
France 2009 4,984,310.56 3,447,452.61 2.28% 1.26%
France 2010 7,022,809.65 4,315,101.21 2.44% 1.25%
France 2011 7,860,530.35 5,188,734.29 2.18% 1.16%
France 2012 7,796,513.69 4,578,725.84 2.48% 1.35%
France 2013 8,931,799.40 3,989,838.57 2.65% 1.18%
Rep. of Korea 1996 491,504.11 219,167.95 1.50% 0.47%
Rep. of Korea 1997 2,345,157.66 965,405.00 2.09% 0.92%
Rep. of Korea 1998 2,288,723.74 617,463.08 2.02% 0.63%
Rep. of Korea 1999 2,015,010.38 828,579.86 2.10% 0.88%
Rep. of Korea 2000 2,382,546.57 773,529.63 2.35% 0.67%
Rep. of Korea 2001 2,408,407.09 1,143,244.87 2.47% 1.01%
Rep. of Korea 2002 1,411,274.35 1,230,616.29 1.97% 1.09%
Rep. of Korea 2003 1,429,278.08 1,678,212.60 1.91% 1.27%
Rep. of Korea 2004 2,291,546.33 1,842,824.66 2.17% 1.05%
Rep. of Korea 2005 3,162,908.02 2,337,040.88 2.41% 1.07%
Rep. of Korea 2006 4,205,695.41 2,439,237.69 2.54% 0.97%
Rep. of Korea 2007 4,654,423.38 2,775,232.60 2.13% 1.24%
Rep. of Korea 2008 6,910,507.34 3,768,582.93 2.33% 1.04%
Rep. of Korea 2009 5,902,499.64 3,244,387.81 2.70% 1.18%
Rep. of Korea 2010 9,869,824.40 4,568,572.11 3.42% 1.32%
Rep. of Korea 2011 12,231,762.31 5,813,460.77 3.40% 1.30%
Rep. of Korea 2012 10,690,982.03 5,931,924.80 3.40% 1.75%
Rep. of Korea 2013 11,195,140.47 5,797,534.21 3.32% 1.72%
United Kingdom 1996 747,148.98 564,298.06 2.29% 1.20%

56
United Kingdom 1997 2,710,733.32 1,728,749.83 2.41% 1.65%
United Kingdom 1998 2,771,989.40 2,009,801.99 2.45% 2.04%
United Kingdom 1999 2,118,428.41 1,977,875.30 2.21% 2.10%
United Kingdom 2000 2,106,188.02 2,049,123.12 2.08% 1.77%
United Kingdom 2001 2,071,492.62 2,258,147.88 2.12% 1.99%
United Kingdom 2002 1,865,979.45 2,464,214.44 2.61% 2.18%
United Kingdom 2003 1,705,112.16 2,762,851.18 2.28% 2.10%
United Kingdom 2004 2,207,555.88 3,158,424.75 2.09% 1.80%
United Kingdom 2005 1,979,753.46 4,027,548.10 1.51% 1.84%
United Kingdom 2006 2,135,826.21 4,196,229.71 1.29% 1.67%
United Kingdom 2007 2,745,456.51 4,127,383.41 1.26% 1.84%
United Kingdom 2008 3,582,466.70 5,977,577.39 1.21% 1.65%
United Kingdom 2009 3,241,543.71 4,640,148.08 1.48% 1.69%
United Kingdom 2010 4,111,651.69 5,520,288.51 1.43% 1.60%
United Kingdom 2011 4,610,748.99 6,155,642.37 1.28% 1.38%
United Kingdom 2012 4,272,031.41 5,494,804.19 1.36% 1.62%
United Kingdom 2013 4,422,197.58 4,863,086.46 1.31% 1.44%
Colombia 1996 730,964.94 1,432,049.92 2.24% 3.05%
Colombia 1997 1,095,007.42 2,035,624.77 0.98% 1.94%
Colombia 1998 1,038,538.40 2,111,419.81 0.92% 2.15%
Colombia 1999 1,002,417.12 1,325,156.76 1.04% 1.40%
Colombia 2000 1,562,213.83 1,511,104.09 1.54% 1.31%
Colombia 2001 1,678,399.97 1,556,813.10 1.72% 1.37%
Colombia 2002 1,092,877.50 1,640,216.38 1.53% 1.45%
Colombia 2003 835,361.03 1,643,377.84 1.12% 1.25%
Colombia 2004 1,758,914.25 2,372,947.24 1.66% 1.35%
Colombia 2005 2,607,398.52 2,819,001.64 1.99% 1.29%
Colombia 2006 2,730,759.61 3,294,319.35 1.65% 1.31%
Colombia 2007 4,254,850.46 2,941,682.48 1.95% 1.31%
Colombia 2008 7,899,983.39 4,066,218.39 2.67% 1.12%
Colombia 2009 5,110,664.18 3,118,735.45 2.33% 1.14%
Colombia 2010 2,671,670.36 4,111,415.63 0.93% 1.19%
Colombia 2011 3,182,098.38 4,906,349.96 0.88% 1.10%
Colombia 2012 1,683,767.39 4,988,329.23 0.53% 1.47%
Colombia 2013 1,933,638.08 4,278,501.41 0.57% 1.27%
Other Asia, nes 1996 477,834.50 251,684.68 1.46% 0.54%
Other Asia, nes 1997 1,481,173.19 758,504.99 1.32% 0.72%
Other Asia, nes 1998 1,607,725.92 754,077.98 1.42% 0.77%
Other Asia, nes 1999 1,201,377.10 485,166.35 1.25% 0.51%
Other Asia, nes 2000 1,294,996.04 444,447.68 1.28% 0.38%
Other Asia, nes 2001 1,132,908.28 358,317.53 1.16% 0.32%
Other Asia, nes 2002 853,521.39 536,156.20 1.19% 0.47%
Other Asia, nes 2003 869,388.62 867,164.89 1.16% 0.66%
Other Asia, nes 2004 1,339,885.26 1,027,133.79 1.27% 0.58%
Other Asia, nes 2005 1,758,119.53 3,555,535.86 1.34% 1.62%
Other Asia, nes 2006 2,287,090.79 3,097,286.69 1.38% 1.23%
Other Asia, nes 2007 2,894,805.69 925,365.13 1.32% 0.41%
Other Asia, nes 2008 4,359,840.26 4,199,737.21 1.47% 1.16%
Other Asia, nes 2009 3,024,900.72 3,609,003.72 1.38% 1.32%
Other Asia, nes 2010 3,864,269.81 8,364,502.31 1.34% 2.42%
Other Asia, nes 2011 4,326,820.56 15,186,283.89 1.20% 3.40%
Other Asia, nes 2012 3,855,992.38 2,668,814.31 1.22% 0.79%
Other Asia, nes 2013 3,664,123.64 2,714,305.15 1.09% 0.80%
Russian Federation 1996 100,305.87 166,369.61 0.31% 0.35%
Russian Federation 1997 535,295.68 1,025,277.69 0.48% 0.98%

57
Russian Federation 1998 554,423.06 819,586.71 0.49% 0.83%
Russian Federation 1999 578,112.58 921,301.57 0.60% 0.98%
Russian Federation 2000 809,747.86 574,297.78 0.80% 0.50%
Russian Federation 2001 620,435.02 1,286,569.14 0.64% 1.14%
Russian Federation 2002 634,352.58 1,452,550.71 0.89% 1.29%
Russian Federation 2003 942,546.82 1,745,781.73 1.26% 1.33%
Russian Federation 2004 1,326,621.84 2,103,493.36 1.25% 1.20%
Russian Federation 2005 1,209,365.91 3,776,492.04 0.92% 1.72%
Russian Federation 2006 1,296,010.60 4,818,739.18 0.78% 1.92%
Russian Federation 2007 2,511,101.47 4,778,334.83 1.15% 2.14%
Russian Federation 2008 5,294,119.31 6,219,574.38 1.79% 1.72%
Russian Federation 2009 1,924,130.64 4,044,753.58 0.88% 1.48%
Russian Federation 2010 2,702,144.73 5,558,970.83 0.94% 1.61%
Russian Federation 2011 4,123,998.03 5,783,474.36 1.15% 1.29%
Russian Federation 2012 4,669,299.97 4,955,357.60 1.48% 1.46%
Russian Federation 2013 4,750,687.40 4,925,603.58 1.41% 1.46%
Canada 1996 569,860.45 397,605.07 1.74% 0.85%
Canada 1997 2,473,269.08 1,268,490.35 2.20% 1.21%
Canada 1998 2,244,981.72 1,165,267.10 1.98% 1.18%
Canada 1999 1,779,287.46 1,371,209.15 1.85% 1.45%
Canada 2000 1,825,054.99 1,350,798.49 1.80% 1.17%
Canada 2001 1,624,626.95 1,321,629.78 1.66% 1.17%
Canada 2002 1,139,801.01 1,305,484.85 1.59% 1.16%
Canada 2003 1,070,009.46 1,582,285.90 1.43% 1.20%
Canada 2004 1,447,259.19 2,306,993.59 1.37% 1.31%
Canada 2005 1,504,283.60 3,047,932.39 1.15% 1.39%
Canada 2006 1,834,102.40 3,399,939.91 1.11% 1.35%
Canada 2007 2,400,530.07 2,786,050.06 1.10% 1.25%
Canada 2008 4,542,552.86 2,516,347.84 1.53% 0.70%
Canada 2009 2,435,190.17 2,256,327.75 1.11% 0.82%
Canada 2010 3,702,266.69 3,837,087.56 1.28% 1.11%
Canada 2011 4,750,873.84 5,604,465.93 1.32% 1.25%
Canada 2012 3,641,174.35 5,343,621.87 1.16% 1.57%
Canada 2013 3,558,426.49 4,465,705.84 1.06% 1.32%
Nigeria 1996 23,201.38 52,542.88 0.07% 0.11%
Nigeria 1997 610,482.47 301,974.75 0.54% 0.29%
Nigeria 1998 680,254.47 359,018.29 0.60% 0.36%
Nigeria 1999 815,968.89 279,442.57 0.85% 0.30%
Nigeria 2000 1,071,345.50 302,229.22 1.06% 0.26%
Nigeria 2001 1,682,321.44 489,623.24 1.72% 0.43%
Nigeria 2002 1,121,207.87 595,176.64 1.57% 0.53%
Nigeria 2003 1,587,836.34 554,480.72 2.13% 0.42%
Nigeria 2004 3,669,904.66 613,679.81 3.47% 0.35%
Nigeria 2005 2,871,723.54 1,094,505.71 2.19% 0.50%
Nigeria 2006 3,884,799.28 1,554,740.01 2.35% 0.62%
Nigeria 2007 5,273,894.51 1,851,438.19 2.41% 0.83%
Nigeria 2008 6,707,905.15 1,785,022.83 2.26% 0.49%
Nigeria 2009 4,762,521.18 1,202,861.54 2.18% 0.44%
Nigeria 2010 6,083,352.19 978,093.78 2.11% 0.28%
Nigeria 2011 8,725,207.35 1,343,039.22 2.42% 0.30%
Nigeria 2012 8,411,845.16 1,288,977.66 2.67% 0.38%
Nigeria 2013 10,489,515.48 1,014,878.42 3.11% 0.30%
India 1996 90,964.43 188,422.12 0.28% 0.40%
India 1997 420,496.44 389,540.42 0.37% 0.37%
India 1998 420,552.01 497,045.91 0.37% 0.51%

58
India 1999 354,581.97 754,697.35 0.37% 0.80%
India 2000 473,645.36 836,492.58 0.47% 0.72%
India 2001 774,498.47 1,217,754.78 0.79% 1.08%
India 2002 711,937.34 1,460,002.74 1.00% 1.29%
India 2003 667,059.40 1,126,891.10 0.89% 0.86%
India 2004 799,397.50 1,245,615.09 0.76% 0.71%
India 2005 1,543,852.25 1,889,636.33 1.18% 0.86%
India 2006 1,938,882.38 1,922,815.26 1.17% 0.76%
India 2007 2,751,596.27 1,848,095.39 1.26% 0.83%
India 2008 4,376,534.47 1,982,395.90 1.48% 0.55%
India 2009 2,875,037.94 4,141,252.93 1.31% 1.51%
India 2010 5,152,089.17 4,899,601.48 1.79% 1.42%
India 2011 7,103,517.30 4,355,323.20 1.97% 0.97%
India 2012 5,926,354.18 6,798,372.49 1.88% 2.00%
India 2013 7,389,780.62 4,280,123.40 2.19% 1.27%
EFTA 1996 401,644.56 113,633.85 1.23% 0.24%
EFTA 1997 1,634,208.74 537,269.08 1.46% 0.51%
EFTA 1998 1,736,710.98 567,348.90 1.54% 0.58%
EFTA 1999 1,468,416.93 516,032.67 1.53% 0.55%
EFTA 2000 1,480,551.45 911,150.66 1.46% 0.79%
EFTA 2001 1,675,951.22 784,602.79 1.72% 0.69%
EFTA 2002 1,475,919.75 768,505.80 2.06% 0.68%
EFTA 2003 1,615,492.42 825,346.65 2.16% 0.63%
EFTA 2004 1,930,463.48 895,053.60 1.83% 0.51%
EFTA 2005 2,148,157.24 1,298,461.03 1.64% 0.59%
EFTA 2006 2,385,178.77 2,124,783.63 1.44% 0.84%
EFTA 2007 3,446,978.37 2,564,666.34 1.58% 1.15%
EFTA 2008 3,922,554.23 3,480,214.26 1.32% 0.96%
EFTA 2009 3,474,356.11 3,840,280.38 1.59% 1.40%
EFTA 2010 4,628,083.17 3,684,642.13 1.61% 1.07%
EFTA 2011 4,737,976.94 3,665,139.03 1.32% 0.82%
EFTA 2012 4,599,154.91 3,760,203.54 1.46% 1.11%
EFTA 2013 4,677,603.58 4,181,293.64 1.39% 1.24%
Belgium 1999 888,883.87 2,104,098.82 0.93% 2.23%
Belgium 2000 945,435.16 2,202,913.92 0.93% 1.91%
Belgium 2001 857,377.30 2,157,992.43 0.88% 1.91%
Belgium 2002 731,305.12 2,247,839.98 1.02% 1.99%
Belgium 2003 696,079.58 2,152,697.92 0.93% 1.64%
Belgium 2004 934,514.84 2,233,029.98 0.88% 1.27%
Belgium 2005 1,754,875.35 2,457,469.23 1.34% 1.12%
Belgium 2006 1,367,958.47 3,382,712.86 0.83% 1.34%
Belgium 2007 1,692,775.13 4,336,442.11 0.77% 1.94%
Belgium 2008 2,281,794.17 5,177,999.79 0.77% 1.43%
Belgium 2009 1,574,439.44 3,677,562.69 0.72% 1.34%
Belgium 2010 1,972,309.64 4,096,204.50 0.68% 1.18%
Belgium 2011 2,506,805.39 4,582,244.19 0.70% 1.02%
Belgium 2012 2,576,538.61 4,238,056.11 0.82% 1.25%
Belgium 2013 2,942,779.04 3,957,709.79 0.87% 1.17%
Switzerland 1996 334,878.67 60,340.97 1.03% 0.13%
Switzerland 1997 1,312,507.18 335,253.55 1.17% 0.32%
Switzerland 1998 1,420,834.70 294,700.82 1.26% 0.30%
Switzerland 1999 1,228,283.01 267,105.25 1.28% 0.28%
Switzerland 2000 1,224,546.37 604,625.72 1.21% 0.52%
Switzerland 2001 1,405,358.83 515,654.11 1.44% 0.46%
Switzerland 2002 1,226,945.10 551,012.94 1.72% 0.49%
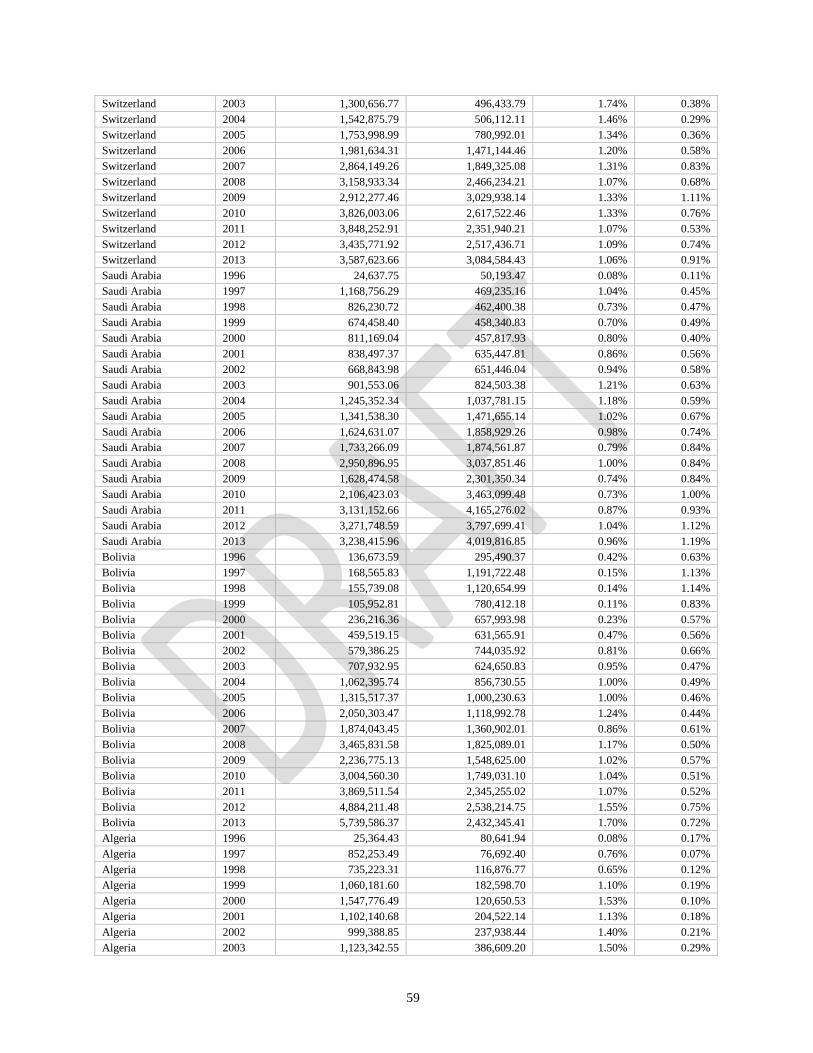
59
Switzerland 2003 1,300,656.77 496,433.79 1.74% 0.38%
Switzerland 2004 1,542,875.79 506,112.11 1.46% 0.29%
Switzerland 2005 1,753,998.99 780,992.01 1.34% 0.36%
Switzerland 2006 1,981,634.31 1,471,144.46 1.20% 0.58%
Switzerland 2007 2,864,149.26 1,849,325.08 1.31% 0.83%
Switzerland 2008 3,158,933.34 2,466,234.21 1.07% 0.68%
Switzerland 2009 2,912,277.46 3,029,938.14 1.33% 1.11%
Switzerland 2010 3,826,003.06 2,617,522.46 1.33% 0.76%
Switzerland 2011 3,848,252.91 2,351,940.21 1.07% 0.53%
Switzerland 2012 3,435,771.92 2,517,436.71 1.09% 0.74%
Switzerland 2013 3,587,623.66 3,084,584.43 1.06% 0.91%
Saudi Arabia 1996 24,637.75 50,193.47 0.08% 0.11%
Saudi Arabia 1997 1,168,756.29 469,235.16 1.04% 0.45%
Saudi Arabia 1998 826,230.72 462,400.38 0.73% 0.47%
Saudi Arabia 1999 674,458.40 458,340.83 0.70% 0.49%
Saudi Arabia 2000 811,169.04 457,817.93 0.80% 0.40%
Saudi Arabia 2001 838,497.37 635,447.81 0.86% 0.56%
Saudi Arabia 2002 668,843.98 651,446.04 0.94% 0.58%
Saudi Arabia 2003 901,553.06 824,503.38 1.21% 0.63%
Saudi Arabia 2004 1,245,352.34 1,037,781.15 1.18% 0.59%
Saudi Arabia 2005 1,341,538.30 1,471,655.14 1.02% 0.67%
Saudi Arabia 2006 1,624,631.07 1,858,929.26 0.98% 0.74%
Saudi Arabia 2007 1,733,266.09 1,874,561.87 0.79% 0.84%
Saudi Arabia 2008 2,950,896.95 3,037,851.46 1.00% 0.84%
Saudi Arabia 2009 1,628,474.58 2,301,350.34 0.74% 0.84%
Saudi Arabia 2010 2,106,423.03 3,463,099.48 0.73% 1.00%
Saudi Arabia 2011 3,131,152.66 4,165,276.02 0.87% 0.93%
Saudi Arabia 2012 3,271,748.59 3,797,699.41 1.04% 1.12%
Saudi Arabia 2013 3,238,415.96 4,019,816.85 0.96% 1.19%
Bolivia 1996 136,673.59 295,490.37 0.42% 0.63%
Bolivia 1997 168,565.83 1,191,722.48 0.15% 1.13%
Bolivia 1998 155,739.08 1,120,654.99 0.14% 1.14%
Bolivia 1999 105,952.81 780,412.18 0.11% 0.83%
Bolivia 2000 236,216.36 657,993.98 0.23% 0.57%
Bolivia 2001 459,519.15 631,565.91 0.47% 0.56%
Bolivia 2002 579,386.25 744,035.92 0.81% 0.66%
Bolivia 2003 707,932.95 624,650.83 0.95% 0.47%
Bolivia 2004 1,062,395.74 856,730.55 1.00% 0.49%
Bolivia 2005 1,315,517.37 1,000,230.63 1.00% 0.46%
Bolivia 2006 2,050,303.47 1,118,992.78 1.24% 0.44%
Bolivia 2007 1,874,043.45 1,360,902.01 0.86% 0.61%
Bolivia 2008 3,465,831.58 1,825,089.01 1.17% 0.50%
Bolivia 2009 2,236,775.13 1,548,625.00 1.02% 0.57%
Bolivia 2010 3,004,560.30 1,749,031.10 1.04% 0.51%
Bolivia 2011 3,869,511.54 2,345,255.02 1.07% 0.52%
Bolivia 2012 4,884,211.48 2,538,214.75 1.55% 0.75%
Bolivia 2013 5,739,586.37 2,432,345.41 1.70% 0.72%
Algeria 1996 25,364.43 80,641.94 0.08% 0.17%
Algeria 1997 852,253.49 76,692.40 0.76% 0.07%
Algeria 1998 735,223.31 116,876.77 0.65% 0.12%
Algeria 1999 1,060,181.60 182,598.70 1.10% 0.19%
Algeria 2000 1,547,776.49 120,650.53 1.53% 0.10%
Algeria 2001 1,102,140.68 204,522.14 1.13% 0.18%
Algeria 2002 999,388.85 237,938.44 1.40% 0.21%
Algeria 2003 1,123,342.55 386,609.20 1.50% 0.29%

60
Algeria 2004 1,944,859.47 807,013.27 1.84% 0.46%
Algeria 2005 2,832,306.17 853,596.10 2.16% 0.39%
Algeria 2006 1,992,375.29 1,039,264.52 1.20% 0.41%
Algeria 2007 2,255,556.61 1,283,230.02 1.03% 0.57%
Algeria 2008 2,505,997.40 1,562,873.25 0.85% 0.43%
Algeria 2009 1,381,648.62 1,463,826.96 0.63% 0.53%
Algeria 2010 2,371,217.14 1,921,013.99 0.82% 0.56%
Algeria 2011 3,150,416.84 3,254,052.10 0.88% 0.73%
Algeria 2012 3,201,834.70 2,736,847.45 1.02% 0.81%
Algeria 2013 3,076,731.60 2,894,275.13 0.91% 0.86%
Thailand 1996 75,092.26 148,215.01 0.23% 0.32%
Thailand 1997 379,189.21 465,058.34 0.34% 0.44%
Thailand 1998 370,054.15 263,441.29 0.33% 0.27%
Thailand 1999 309,812.45 344,893.80 0.32% 0.37%
Thailand 2000 384,304.57 432,811.38 0.38% 0.37%
Thailand 2001 375,301.32 534,102.05 0.38% 0.47%
Thailand 2002 242,287.80 680,679.59 0.34% 0.60%
Thailand 2003 335,462.89 908,626.01 0.45% 0.69%
Thailand 2004 604,642.34 993,919.69 0.57% 0.57%
Thailand 2005 863,905.93 1,257,347.01 0.66% 0.57%
Thailand 2006 1,213,850.80 1,086,455.46 0.73% 0.43%
Thailand 2007 1,543,706.58 1,400,577.72 0.71% 0.63%
Thailand 2008 2,090,074.38 2,038,680.88 0.71% 0.56%
Thailand 2009 1,830,476.49 1,599,890.97 0.84% 0.58%
Thailand 2010 2,633,660.41 1,986,651.63 0.91% 0.57%
Thailand 2011 3,317,664.24 2,411,983.69 0.92% 0.54%
Thailand 2012 3,481,509.90 2,853,649.06 1.11% 0.84%
Thailand 2013 3,440,406.96 2,652,762.45 1.02% 0.79%
Sweden 1996 338,963.06 156,985.31 1.04% 0.33%
Sweden 1997 1,435,487.20 463,042.46 1.28% 0.44%
Sweden 1998 1,656,642.28 228,210.59 1.46% 0.23%
Sweden 1999 1,403,172.82 277,530.24 1.46% 0.29%
Sweden 2000 1,179,549.97 428,535.87 1.16% 0.37%
Sweden 2001 1,086,488.69 316,490.42 1.11% 0.28%
Sweden 2002 721,634.10 422,989.05 1.01% 0.37%
Sweden 2003 806,864.51 388,257.79 1.08% 0.29%
Sweden 2004 1,186,579.84 575,054.35 1.12% 0.33%
Sweden 2005 1,232,067.48 597,714.64 0.94% 0.27%
Sweden 2006 1,360,098.88 548,767.37 0.82% 0.22%
Sweden 2007 1,860,492.88 712,796.97 0.85% 0.32%
Sweden 2008 2,295,774.47 716,447.37 0.78% 0.20%
Sweden 2009 1,662,578.40 387,854.21 0.76% 0.14%
Sweden 2010 2,112,215.18 463,548.05 0.73% 0.13%
Sweden 2011 2,710,205.74 636,497.47 0.75% 0.14%
Sweden 2012 2,389,216.25 577,445.25 0.76% 0.17%
Sweden 2013 2,399,373.90 545,366.47 0.71% 0.16%
Source: Comtrade via TradeSift (HS 1996 Total Trade)
Annex IV: Palestine’s top trade partners 1996-2013
Partner Year Imports Value
(‘000s USD)
Exports Value
(‘000s USD) Imports share Exports share

61
World 1996 2,016,279.00 339,467.00 100.00% 100.00%
World 1997 2,238,560.00 380,423.00 100.00% 100.00%
World 1998 2,375,102.00 394,846.00 100.00% 100.00%
World 1999 3,007,227.00 372,148.00 100.00% 100.00%
World 2000 2,382,807.00 400,857.00 100.00% 100.00%
World 2001 2,033,647.00 290,349.00 100.00% 100.00%
World 2002 1,515,608.00 240,867.00 100.00% 100.00%
World 2003 1,800,268.00 279,680.00 100.00% 100.00%
World 2004 2,373,248.00 312,688.00 100.00% 100.00%
World 2005 2,667,592.00 335,443.00 100.00% 100.00%
World 2006 2,758,726.00 366,706.00 100.00% 100.00%
World 2007 3,141,279.29 512,982.82 100.00% 100.00%
World 2008 3,568,673.59 558,446.00 100.00% 100.00%
World 2009 3,600,785.37 518,355.48 100.00% 100.00%
World 2010 3,958,511.52 575,512.92 100.00% 100.00%
World 2011 4,221,105.70 719,588.97 100.00% 100.00%
World 2012 4,697,355.94 782,368.75 100.00% 100.00%
World 2013 5,163,897.46 900,617.86 100.00% 100.00%
Israel 1996 1,743,190.13 319,247.24 86.46% 94.04%
Israel 1997 1,852,943.48 360,250.78 82.77% 94.70%
Israel 1998 1,833,651.79 381,443.35 77.20% 96.61%
Israel 1999 1,857,229.43 360,426.99 61.76% 96.85%
Israel 2000 1,740,704.61 369,680.10 73.05% 92.22%
Israel 2001 1,352,896.73 273,109.09 66.53% 94.06%
Israel 2002 1,118,157.71 216,325.73 73.78% 89.81%
Israel 2003 1,309,641.90 256,018.62 72.75% 91.54%
Israel 2004 1,747,850.12 281,148.77 73.65% 89.91%
Israel 2005 1,873,700.41 290,558.19 70.24% 86.62%
Israel 2006 2,002,150.28 326,567.64 72.58% 89.05%
Israel 2007 2,307,935.29 455,231.68 73.47% 88.74%
Israel 2008 2,767,714.18 499,422.97 77.56% 89.43%
Israel 2009 2,651,128.87 453,494.35 73.63% 87.49%
Israel 2010 2,873,497.68 488,395.42 72.59% 84.86%
Israel 2011 2,938,379.64 617,781.53 69.61% 85.85%
Israel 2012 3,350,424.82 639,180.36 71.33% 81.70%
Israel 2013 3,694,820.63 785,110.86 71.55% 87.17%
EU 1996 155,743.94 244.14 7.72% 0.07%
EU 1997 188,825.10 915.15 8.44% 0.24%
EU 1998 233,608.42 1,649.95 9.84% 0.42%
EU 1999 498,001.40 1,526.16 16.56% 0.41%
EU 2000 272,589.97 1,708.87 11.44% 0.43%
EU 2001 374,485.22 2,480.65 18.41% 0.85%
EU 2002 179,737.18 8,921.95 11.86% 3.70%
EU 2003 161,285.31 7,073.67 8.96% 2.53%
EU 2004 215,814.95 7,058.54 9.09% 2.26%
EU 2005 252,291.91 11,556.07 9.46% 3.45%
EU 2006 227,589.51 2,640.60 8.25% 0.72%
EU 2007 250,863.57 18,078.26 7.99% 3.52%

62
EU 2008 289,237.77 8,121.22 8.10% 1.45%
EU 2009 348,496.32 4,739.52 9.68% 0.91%
EU 2010 368,048.76 9,874.67 9.30% 1.72%
EU 2011 444,337.19 14,462.80 10.53% 2.01%
EU 2012 469,295.84 14,392.09 9.99% 1.84%
EU 2013 455,472.33 13,151.73 8.82% 1.46%
GAFTA 1996 26,570.00 19,054.00 1.32% 5.61%
GAFTA 1997 56,146.00 19,058.00 2.51% 5.01%
GAFTA 1998 85,411.00 11,558.00 3.60% 2.93%
GAFTA 1999 81,071.00 9,638.00 2.70% 2.59%
GAFTA 2000 39,668.00 29,122.00 1.66% 7.26%
GAFTA 2001 36,781.00 14,576.00 1.81% 5.02%
GAFTA 2002 31,075.00 15,093.00 2.05% 6.27%
GAFTA 2003 45,721.00 14,977.00 2.54% 5.36%
GAFTA 2004 65,100.00 19,357.00 2.74% 6.19%
GAFTA 2005 69,000.00 25,855.00 2.59% 7.71%
GAFTA 2006 66,937.00 34,031.00 2.43% 9.28%
GAFTA 2007 78,239.47 34,771.88 2.49% 6.78%
GAFTA 2008 81,907.99 45,832.72 2.30% 8.21%
GAFTA 2009 91,959.41 47,247.73 2.55% 9.11%
GAFTA 2010 129,816.68 65,876.98 3.28% 11.45%
GAFTA 2011 162,301.23 73,958.40 3.84% 10.28%
GAFTA 2012 187,159.89 108,778.25 3.98% 13.90%
GAFTA 2013 214,774.86 84,214.46 4.16% 9.35%
Turkey 1996 8,982.18 0.00 0.45% 0.00%
Turkey 1997 35,558.00 0.00 1.59% 0.00%
Turkey 1998 48,439.25 0.00 2.04% 0.00%
Turkey 1999 141,671.29 6.99 4.71% 0.00%
Turkey 2000 65,905.51 284.53 2.77% 0.07%
Turkey 2001 58,984.59 147.96 2.90% 0.05%
Turkey 2002 61,280.56 82.42 4.04% 0.03%
Turkey 2003 96,469.87 139.26 5.36% 0.05%
Turkey 2004 116,670.66 1,227.88 4.92% 0.39%
Turkey 2005 120,665.64 1,227.83 4.52% 0.37%
Turkey 2006 92,526.18 274.92 3.35% 0.07%
Turkey 2007 81,885.39 429.01 2.61% 0.08%
Turkey 2008 68,511.44 123.09 1.92% 0.02%
Turkey 2009 110,348.08 53.00 3.06% 0.01%
Turkey 2010 179,112.32 483.49 4.52% 0.08%
Turkey 2011 233,819.56 418.12 5.54% 0.06%
Turkey 2012 233,842.30 833.03 4.98% 0.11%
Turkey 2013 289,169.86 2,987.65 5.60% 0.33%
China 1996 10,643.33 0.00 0.53% 0.00%
China 1997 16,187.59 0.00 0.72% 0.00%
China 1998 33,816.98 0.00 1.42% 0.00%
China 1999 98,171.85 0.00 3.26% 0.00%
China 2000 88,652.88 0.00 3.72% 0.00%
China 2001 44,629.67 0.00 2.19% 0.00%

63
China 2002 42,881.81 0.00 2.83% 0.00%
China 2003 63,584.08 42.36 3.53% 0.02%
China 2004 88,705.31 504.06 3.74% 0.16%
China 2005 110,935.17 373.98 4.16% 0.11%
China 2006 114,326.27 139.03 4.14% 0.04%
China 2007 143,834.33 113.06 4.58% 0.02%
China 2008 125,963.10 46.94 3.53% 0.01%
China 2009 161,815.70 11.71 4.49% 0.00%
China 2010 181,261.40 20.30 4.58% 0.00%
China 2011 194,118.01 0.00 4.60% 0.00%
China 2012 197,319.71 0.00 4.20% 0.00%
China 2013 236,601.08 0.00 4.58% 0.00%
USA 1996 24,765.52 671.94 1.23% 0.20%
USA 1997 24,002.38 2.01 1.07% 0.00%
USA 1998 33,382.85 75.17 1.41% 0.02%
USA 1999 87,186.94 291.90 2.90% 0.08%
USA 2000 56,690.50 70.03 2.38% 0.02%
USA 2001 40,293.32 123.13 1.98% 0.04%
USA 2002 190.36 203.30 0.01% 0.08%
USA 2003 31,021.99 668.01 1.72% 0.24%
USA 2004 39,475.27 1,649.29 1.66% 0.53%
USA 2005 31,908.00 4,136.35 1.20% 1.23%
USA 2006 21,644.29 2,389.47 0.78% 0.65%
USA 2007 24,303.50 3,358.52 0.77% 0.65%
USA 2008 37,680.28 3,559.10 1.06% 0.64%
USA 2009 40,356.03 6,131.72 1.12% 1.18%
USA 2010 41,919.49 7,273.01 1.06% 1.26%
USA 2011 39,900.89 8,702.17 0.95% 1.21%
USA 2012 43,899.90 13,576.83 0.93% 1.74%
USA 2013 41,750.41 11,616.49 0.81% 1.29%
Japan 1996 3,901.21 0.00 0.19% 0.00%
Japan 1997 6,031.64 0.00 0.27% 0.00%
Japan 1998 6,710.43 0.00 0.28% 0.00%
Japan 1999 29,438.69 0.00 0.98% 0.00%
Japan 2000 8,761.94 23.85 0.37% 0.01%
Japan 2001 35,820.81 0.06 1.76% 0.00%
Japan 2002 22,749.31 0.45 1.50% 0.00%
Japan 2003 13,634.65 0.00 0.76% 0.00%
Japan 2004 11,950.29 56.01 0.50% 0.02%
Japan 2005 46,970.11 187.79 1.76% 0.06%
Japan 2006 87,082.27 169.10 3.16% 0.05%
Japan 2007 103,109.41 101.17 3.28% 0.02%
Japan 2008 17,011.99 192.81 0.48% 0.03%
Japan 2009 18,712.35 460.13 0.52% 0.09%
Japan 2010 20,327.73 372.84 0.51% 0.06%
Japan 2011 17,013.07 256.78 0.40% 0.04%
Japan 2012 14,836.89 87.98 0.32% 0.01%
Japan 2013 12,485.66 476.10 0.24% 0.05%

64
South Korea 1996 8,349.55 0.00 0.41% 0.00%
South Korea 1997 9,750.32 0.00 0.44% 0.00%
South Korea 1998 17,174.59 0.00 0.72% 0.00%
South Korea 1999 46,702.77 0.00 1.55% 0.00%
South Korea 2000 15,448.18 0.00 0.65% 0.00%
South Korea 2001 8,292.93 0.13 0.41% 0.00%
South Korea 2002 5,010.45 0.00 0.33% 0.00%
South Korea 2004 3,261.40 15.31 0.14% 0.00%
South Korea 2005 10,788.38 0.00 0.40% 0.00%
South Korea 2006 2,492.50 0.00 0.09% 0.00%
South Korea 2007 12,872.51 0.00 0.41% 0.00%
South Korea 2008 27,696.97 0.00 0.78% 0.00%
South Korea 2009 50,511.95 0.00 1.40% 0.00%
South Korea 2010 29,654.56 258.94 0.75% 0.04%
South Korea 2011 46,900.96 697.18 1.11% 0.10%
South Korea 2012 42,403.61 231.45 0.90% 0.03%
South Korea 2013 38,352.45 299.48 0.74% 0.03%
EFTA 1996 5,497.21 0.00 0.27% 0.00%
EFTA 1997 7,525.45 6.74 0.34% 0.00%
EFTA 1998 14,151.69 3.06 0.60% 0.00%
EFTA 1999 11,810.72 0.00 0.39% 0.00%
EFTA 2000 8,334.63 0.00 0.35% 0.00%
EFTA 2001 5,748.72 0.01 0.28% 0.00%
EFTA 2002 5,187.06 239.72 0.34% 0.10%
EFTA 2003 7,250.37 318.23 0.40% 0.11%
EFTA 2004 9,181.94 77.73 0.39% 0.02%
EFTA 2005 15,947.90 172.72 0.60% 0.05%
EFTA 2006 16,125.39 273.97 0.58% 0.07%
EFTA 2007 35,462.09 116.02 1.13% 0.02%
EFTA 2008 53,901.76 168.25 1.51% 0.03%
EFTA 2009 4,670.74 173.21 0.13% 0.03%
EFTA 2010 37,348.82 453.67 0.94% 0.08%
EFTA 2011 40,756.83 461.06 0.97% 0.06%
EFTA 2012 14,162.91 378.65 0.30% 0.05%
EFTA 2013 10,139.09 382.82 0.20% 0.04%
MERCOSUR 1996 2,702.00 0.00 0.13% 0.00%
MERCOSUR 1997 3,796.19 0.00 0.17% 0.00%
MERCOSUR 1998 4,361.45 0.00 0.18% 0.00%
MERCOSUR 1999 4,052.02 0.00 0.13% 0.00%
MERCOSUR 2000 5,879.33 0.00 0.25% 0.00%
MERCOSUR 2001 8,550.60 0.14 0.42% 0.00%
MERCOSUR 2002 5,908.25 0.00 0.39% 0.00%
MERCOSUR 2003 8,546.22 0.00 0.47% 0.00%
MERCOSUR 2004 12,986.71 0.00 0.55% 0.00%
MERCOSUR 2005 14,642.75 0.00 0.55% 0.00%
MERCOSUR 2006 19,673.31 0.00 0.71% 0.00%
MERCOSUR 2007 13,087.38 2.31 0.42% 0.00%
MERCOSUR 2008 21,090.17 0.00 0.59% 0.00%

65
MERCOSUR 2009 20,481.50 0.00 0.57% 0.00%
MERCOSUR 2010 11,734.16 204.99 0.30% 0.04%
MERCOSUR 2011 21,886.26 65.33 0.52% 0.01%
MERCOSUR 2012 24,073.00 72.00 0.51% 0.01%
MERCOSUR 2013 26,395.85 0.00 0.51% 0.00%
Thailand 1996 507.11 0.00 0.03% 0.00%
Thailand 1997 1,030.86 0.00 0.05% 0.00%
Thailand 1998 5,926.49 0.00 0.25% 0.00%
Thailand 1999 21,088.13 0.00 0.70% 0.00%
Thailand 2000 5,690.57 0.00 0.24% 0.00%
Thailand 2001 9,992.86 0.00 0.49% 0.00%
Thailand 2002 4,169.09 0.00 0.28% 0.00%
Thailand 2003 3,604.88 0.00 0.20% 0.00%
Thailand 2004 4,912.80 0.00 0.21% 0.00%
Thailand 2005 49,096.46 0.00 1.84% 0.00%
Thailand 2006 9,389.69 0.00 0.34% 0.00%
Thailand 2007 25,460.43 0.00 0.81% 0.00%
Thailand 2008 8,316.52 0.00 0.23% 0.00%
Thailand 2009 14,263.41 0.00 0.40% 0.00%
Thailand 2010 9,089.27 3.72 0.23% 0.00%
Thailand 2011 12,872.63 0.00 0.30% 0.00%
Thailand 2012 16,875.37 0.00 0.36% 0.00%
Thailand 2013 23,353.78 0.00 0.45% 0.00%
India 1996 2,661.78 0.00 0.13% 0.00%
India 1997 3,201.33 0.00 0.14% 0.00%
India 1998 7,456.72 0.00 0.31% 0.00%
India 1999 14,005.29 0.00 0.47% 0.00%
India 2000 7,674.28 0.00 0.32% 0.00%
India 2001 5,796.61 0.00 0.29% 0.00%
India 2002 6,659.79 0.00 0.44% 0.00%
India 2003 7,566.68 0.00 0.42% 0.00%
India 2004 9,613.26 0.00 0.41% 0.00%
India 2005 12,375.11 0.00 0.46% 0.00%
India 2006 10,969.03 0.00 0.40% 0.00%
India 2007 12,560.24 0.00 0.40% 0.00%
India 2008 12,352.33 0.00 0.35% 0.00%
India 2009 15,112.18 0.00 0.42% 0.00%
India 2010 17,084.51 0.02 0.43% 0.00%
India 2011 21,465.90 462.81 0.51% 0.06%
India 2012 22,670.83 33.59 0.48% 0.00%
India 2013 23,506.68 0.00 0.46% 0.00%
Russia 1996 284.83 0.92 0.01% 0.00%
Russia 1997 1,036.40 71.08 0.05% 0.02%
Russia 1998 4,700.89 0.00 0.20% 0.00%
Russia 1999 12,302.69 0.00 0.41% 0.00%
Russia 2000 17,534.55 0.00 0.74% 0.00%
Russia 2001 11,846.92 0.05 0.58% 0.00%
Russia 2002 3,611.81 0.00 0.24% 0.00%

66
Russia 2003 6,715.92 1.97 0.37% 0.00%
Russia 2004 2,592.91 0.11 0.11% 0.00%
Russia 2005 7,071.04 0.00 0.27% 0.00%
Russia 2006 11,868.19 25.50 0.43% 0.01%
Russia 2007 7,988.44 10.59 0.25% 0.00%
Russia 2008 16,187.68 1.25 0.45% 0.00%
Russia 2009 2,512.46 7.20 0.07% 0.00%
Russia 2010 10,262.54 23.57 0.26% 0.00%
Russia 2011 8,548.02 291.52 0.20% 0.04%
Russia 2012 3,963.46 576.22 0.08% 0.07%
Russia 2013 6,185.30 150.30 0.12% 0.02%
Australia 1996 2,216.72 0.00 0.11% 0.00%
Australia 1997 4,839.20 0.00 0.22% 0.00%
Australia 1998 7,276.75 0.00 0.31% 0.00%
Australia 1999 5,148.84 0.00 0.17% 0.00%
Australia 2000 15,063.36 0.00 0.63% 0.00%
Australia 2001 12,824.81 1.00 0.63% 0.00%
Australia 2002 9,506.96 0.00 0.63% 0.00%
Australia 2003 9,601.35 18.11 0.53% 0.01%
Australia 2004 8,754.18 0.00 0.37% 0.00%
Australia 2005 7,693.68 0.00 0.29% 0.00%
Australia 2006 14,642.84 6.60 0.53% 0.00%
Australia 2007 1,968.46 94.16 0.06% 0.02%
Australia 2008 4,034.44 110.05 0.11% 0.02%
Australia 2009 2,171.15 62.29 0.06% 0.01%
Australia 2010 3,743.75 11.79 0.09% 0.00%
Australia 2011 3,299.44 35.61 0.08% 0.00%
Australia 2012 12,480.95 17.34 0.27% 0.00%
Australia 2013 4,834.92 20.98 0.09% 0.00%
Ukraine 1996 157.30 0.00 0.01% 0.00%
Ukraine 1997 301.51 2,002.97 0.01% 0.53%
Ukraine 1998 358.37 4.01 0.02% 0.00%
Ukraine 1999 4,213.21 0.00 0.14% 0.00%
Ukraine 2000 548.57 0.00 0.02% 0.00%
Ukraine 2001 515.06 1.42 0.03% 0.00%
Ukraine 2002 884.92 0.00 0.06% 0.00%
Ukraine 2003 6,106.57 0.00 0.34% 0.00%
Ukraine 2004 3,803.01 0.00 0.16% 0.00%
Ukraine 2005 553.78 0.00 0.02% 0.00%
Ukraine 2006 7,402.62 0.00 0.27% 0.00%
Ukraine 2007 4,828.88 0.00 0.15% 0.00%
Ukraine 2008 7,174.28 32.77 0.20% 0.01%
Ukraine 2009 6,303.45 14.44 0.18% 0.00%
Ukraine 2010 3,460.75 33.31 0.09% 0.01%
Ukraine 2011 3,022.29 25.66 0.07% 0.00%
Ukraine 2012 8,663.97 67.47 0.18% 0.01%
Ukraine 2013 22,177.82 11.92 0.43% 0.00%
Canada 1996 684.31 133.85 0.03% 0.04%

67
Canada 1997 582.49 15.29 0.03% 0.00%
Canada 1998 598.41 0.00 0.03% 0.00%
Canada 1999 3,285.66 0.00 0.11% 0.00%
Canada 2000 1,382.87 1.20 0.06% 0.00%
Canada 2001 768.57 4.46 0.04% 0.00%
Canada 2002 458.71 0.00 0.03% 0.00%
Canada 2003 568.54 134.35 0.03% 0.05%
Canada 2004 1,283.66 50.94 0.05% 0.02%
Canada 2005 1,405.40 82.16 0.05% 0.02%
Canada 2006 2,603.92 164.06 0.09% 0.04%
Canada 2007 5,151.99 242.57 0.16% 0.05%
Canada 2008 1,767.88 267.73 0.05% 0.05%
Canada 2009 2,649.62 2,664.82 0.07% 0.51%
Canada 2010 8,168.77 2,028.70 0.21% 0.35%
Canada 2011 2,394.00 1,788.69 0.06% 0.25%
Canada 2012 2,872.00 3,259.00 0.06% 0.42%
Canada 2013 2,686.51 908.04 0.05% 0.10%
Swaziland 2005 1.54 0.00 0.00% 0.00%
Swaziland 2008 3.17 0.00 0.00% 0.00%
Swaziland 2009 23,070.28 3,079.18 0.64% 0.59%
Swaziland 2010 102.40 0.00 0.00% 0.00%
Swaziland 2012 0.35 0.00 0.00% 0.00%
Swaziland 2013 1,407.07 0.00 0.03% 0.00%
Source: PCBS (HS 1996 Total Trade)
Annex V: Palestinian exports to MERCOSUR (by product and year)
Palestinian exports to MERCOSUR between 1996 and 2006
SITC Rev.3 5-digit, Source: PCBS
Year Product
code Product
Exports Value
(‘000s USD) Exports Share
2001
84241 Dresses for women and girls i.e.s. soire and parties dresses. 0.07 46.05%
84281 Slips and petticoats, women's or girls', of textile materials, not .. 0.04 30.59%
07413 Black tea (fermented) and partly fermented tea, in immediate .. 0.03 23.36%
Total 0.14 100.00%
Palestinian exports to MERCOSUR between 2007 and 2013
HS 1996 6-digit, Source: PCBS
Year Product Product Exports Value
(‘000s USD) Exports Share
2007 700420 Drawn glass sheets, coloured, opacified, etc. 2.31 100.00%
Total 2.31 100.00%
2010
846410 Sawing machines for stone, ceramics and glass 204.05 99.54%
300490 Medicaments nes, in dosage 0.94 0.46%
Total 204.99 100.00%
2011
080410 Dates, fresh or dried 63.15 96.67%
300490 Medicaments nes, in dosage 2.17 3.33%
Total 65.33 100.00%
2012 080410 Dates, fresh or dried 72.00 100.00%

68
Total 72.00 100.00%
Annex VI: Palestinian imports from MERCOSUR (by product and year)
Palestinian imports from MERCOSUR between 1996 and 2006
SITC Rev.3 5-digit, Source: PCBS
Year Product Product Imports Value
(‘000s USD) Imports Share
1996
68421 Aluminium bars, rods and profiles 378.39 14.00%
01122 Meat of bovine animals, frozen, boneless 373.42 13.82%
03421 Salmonidae, frozen (excluding livers and roes) 357.41 13.23%
61121 Composition leather with a basis of leather or leather fibres i.. 248.13 9.18%
01761 Tinned meat and offals of bovine goats and sheep (other than .. 207.52 7.68%
66523 Glassware of a kind used for table (other than drinking glasses.. 205.17 7.59%
85199 Footwear accessories 176.29 6.52%
07111 Coffee, not roasted, not decaffeinated 174.92 6.47%
06221 Chewing-gum, whether or not sugar-coated, not containing cocoa 104.94 3.88%
61291 Other articles of leather or of composition leather 97.34 3.60%
12111 Tobacco raw 50.18 1.86%
66529 Other glassware, other than of glass-ceramics 49.44 1.83%
63599 Other articles of wood 37.94 1.40%
66522 Drinking glasses other than of glass-ceramics 37.06 1.37%
25191 Semi-chemical wood pulp 36.94 1.37%
Others 166.91 6.18%
Total 2,702.00 100.00%
1997
01122 Meat of bovine animals, frozen, boneless 935.61 24.77%
03421 Salmonidae, frozen (excluding livers and roes) 729.86 19.32%
01761 Tinned meat and offals of bovine goats and sheep (other tha.. 494.78 13.10%
61121 Composition leather with abasis of leather or leather fibres in .. 149.30 3.95%
01232 Poultry not cut in pieces, frozen 144.19 3.82%
01299 Other meat and edible meat offal, fresh, chilled or frozen 134.11 3.55%
07111 Coffee, not roasted, not decaffeinated 132.69 3.51%
66523 Glassware of a kind used for table (other than drinking glasses).. 129.97 3.44%
63591 Tools, tool bodies, tool handles, broom or brush bodies and .. 109.17 2.89%
52499 Inorganic compounds, n.e.s. (including distilled or conductivity.. 88.21 2.34%
78439 Other parts and accessories of the motor vehicles of groups 72.. 80.25 2.12%
87229 Other medical, surgical or veterinary instruments and appliances 61.48 1.63%
05899 Edible nuts,mixtured 45.60 1.21%
63599 Other articles of wood 41.64 1.10%
85199 Footwear accessories 41.05 1.09%
Others 460.01 12.18%
Total 3,777.92 100.00%
1998
03421 Salmonidae, frozen (excluding livers and roes) 867.00 19.90%
01761 Tinned meat and offals of bovine goats and sheep (other than.. 723.79 16.61%
01122 Meat of bovine animals, frozen, boneless 441.14 10.12%
07111 Coffee, not roasted, not decaffeinated 405.20 9.30%
51489 Compounds with other nitrogen function 276.82 6.35%
68412 Aluminium alloys 180.25 4.14%
57191 Other polymers of ethelene in primary forms 159.70 3.66%

69
61121 Composition leather with abasis of leather or leather fibres in .. 155.91 3.58%
05423 Beans, other than broad beans and horse beans, dried, shelled, .. 131.80 3.02%
63591 Tools, tool bodies, tool handles, broom or brush bodies and .. 123.93 2.84%
24831 Wood of coniferous species of the kindes for parquet flooring .. 76.58 1.76%
63441 Other veneered panels and similar laminated wood with at least.. 70.92 1.63%
06221 Chewing-gum, whether or not sugar-coated, not containing cocoa 68.08 1.56%
07321 Other food preparations containing cocoa in blocks slabs or b.. 56.96 1.31%
24841 Wood of non-coniferous species sawn or chipped lengthwise .. 54.06 1.24%
Others 565.39 12.98%
Total 4,357.55 100.00%
1999
78122 Pick-ups vehicles 604.09 15.43%
84551 Brassi res 347.39 8.87%
78219 Motor vehicles for the transport of goods, n.e.s. 319.63 8.17%
84483 Nightdresses and pyjamas, women's or girls', knitted or croche.. 256.19 6.54%
82159 Furniture, n.e.s., of wood 214.25 5.47%
87422 Drafting tables and machines, whether or not automatic, and .. 195.92 5.01%
74343 Other fans 156.94 4.01%
82155 Furniture, n.e.s., of wood, of a kind used in the bedroom 134.06 3.42%
89399 Other articles of plastics 124.20 3.17%
58229 Other plates, sheets, film, strip, of other plastics, non-cellular .. 95.98 2.45%
74159 Parts for the air-conditioning machines of heading 741.5 91.17 2.33%
76421 Microphones and stands therefor 88.72 2.27%
69112 Towers and lattice masts, of iron or steel 86.67 2.21%
75911 Parts and accessories of the photocopying and thermocopyin.. 85.11 2.17%
74613 Spherical roller bearings 76.97 1.97%
Others 1,036.97 26.49%
Total 3,914.28 100.00%
2000
54199 Other pharmaceutical goods 1,067.33 18.22%
05996 Mixtures of fruit or vegetable juices 862.15 14.72%
87141 Stereoscopic microscopes 584.04 9.97%
01761 Tinned meat and offals of bovine goats and sheep (other than.. 500.68 8.55%
63532 Doors and their frames and thresholds 366.11 6.25%
63411 Veneer sheets and other wood sawn lengthwise of thickness < .. 356.73 6.09%
66382 Friction material and articles thereof (e.g., sheets, rolls, strips.. 248.49 4.24%
06229 Other sugar confectionery, not containing cocoa 202.52 3.46%
62511 Tyres pneumatic new of akind used on buses and lomires 127.16 2.17%
69119 Other structures and parts of structures, of iron or steel 125.60 2.14%
07321 Other food preparations containing cocoa in blocks slabs or .. 117.31 2.00%
51489 Compounds with other nitrogen function 113.28 1.93%
63591 Tools, tool bodies, tool handles, broom or brush bodies and .. 110.19 1.88%
96101 Coin (other than gold coin) not being legal tender 109.69 1.87%
76493 Parts and accessories suitable for use solely or principally wi.. 79.89 1.36%
Others 885.56 15.12%
Total 5,856.73 100.00%
2001
01122 Meat of bovine animals, frozen, boneless 3,588.36 41.97%
01761 Tinned meat and offals of bovine goats and sheep (other th.. 1,081.11 12.64%
03428 Other fish, frozen (excluding livers and roes) 830.25 9.71%
07111 Coffee, not roasted, not decaffeinated 768.36 8.99%
06229 Other sugar confectionery, not containing cocoa 533.26 6.24%
05423 Beans, other than broad beans and horse beans, dried, shelled.. 292.05 3.42%

70
51489 Compounds with other nitrogen function 277.22 3.24%
63532 Doors and their frames and thresholds 227.16 2.66%
03421 Salmonidae, frozen (excluding livers and roes) 151.26 1.77%
87141 Stereoscopic microscopes 81.12 0.95%
01252 Edible offal of bovine animals, frozen 74.14 0.87%
66332 Building blocks and bricks, tiles, flagstones and similar articles 63.73 0.75%
78433 Brakes and servo-brakes and parts thereof, of the motor vehicle.. 59.40 0.69%
74611 Ball bearings 53.64 0.63%
63591 Tools, tool bodies, tool handles, broom or brush bodies and.. 49.40 0.58%
Others 420.13 4.91%
Total 8,550.60 100.00%
2002
01122 Meat of bovine animals, frozen, boneless 2,028.96 34.34%
03427 Hake, frozen (excluding livers and roes) 567.99 9.61%
07111 Coffee, not roasted, not decaffeinated 535.68 9.07%
51489 Compounds with other nitrogen function 448.36 7.59%
01761 Tinned meat and offals of bovine goats and sheep (other tha.. 396.50 6.71%
03428 Other fish, frozen (excluding livers and roes) 299.28 5.07%
06229 Other sugar confectionery, not containing cocoa 299.23 5.06%
05423 Beans, other than broad beans and horse beans, dried, shelled.. 243.36 4.12%
63532 Doors and their frames and thresholds 187.08 3.17%
66135 Monumental or building stone (except slate) and articles thereo.. 182.14 3.08%
01252 Edible offal of bovine animals, frozen 135.38 2.29%
07511 Pepper of the genus Piper, neither crushed nor ground 83.43 1.41%
55341 Preparations for dental hygiene tooth paste 70.74 1.20%
07321 Other food preparations containing cocoa in blocks slabs or .. 61.46 1.04%
01212 Meat of sheep, frozen 46.02 0.78%
Others 322.62 5.46%
Total 5,908.25 100.00%
2003
01122 Meat of bovine animals, frozen, boneless 2,150.71 25.17%
01761 Tinned meat and offals of bovine goats and sheep (other tha.. 1,242.93 14.54%
00119 Bovine animals, live, other than pure-bred breeding stock 805.11 9.42%
03427 Hake, frozen (excluding livers and roes) 612.82 7.17%
07111 Coffee, not roasted, not decaffeinated 480.04 5.62%
66139 Other monumental or building stone and articles thereof (oth.. 413.85 4.84%
06229 Other sugar confectionery, not containing cocoa 370.16 4.33%
03428 Other fish, frozen (excluding livers and roes) 329.28 3.85%
01252 Edible offal of bovine animals, frozen 323.46 3.78%
63532 Doors and their frames and thresholds 230.07 2.69%
07321 Other food preparations containing cocoa in blocks slabs or .. 121.33 1.42%
63591 Tools, tool bodies, tool handles, broom or brush bodies and .. 116.84 1.37%
01121 Meat of bovine animals, frozen, with bone in 115.23 1.35%
66134 Marble, travertine and alabaster and articles thereof, simply c.. 86.19 1.01%
05423 Beans, other than broad beans and horse beans, dried, shelled.. 70.19 0.82%
Others 1,078.00 12.61%
Total 8,546.22 100.00%
2004
01122 Meat of bovine animals, frozen, boneless 4,830.72 37.20%
07321 Other food preparations containing cocoa in blocks slabs or .. 1,510.02 11.63%
03427 Hake, frozen (excluding livers and roes) 1,458.63 11.23%
07111 Coffee, not roasted, not decaffeinated 836.74 6.44%
66139 Other monumental or building stone and articles thereof (.. 619.24 4.77%

71
01252 Edible offal of bovine animals, frozen 576.94 4.44%
03428 Other fish, frozen (excluding livers and roes) 354.43 2.73%
06229 Other sugar confectionery, not containing cocoa 285.76 2.20%
01761 Tinned meat and offals of bovine goats and sheep (other than
liver) preserved or prepared n.e.s. 208.60 1.61%
63532 Doors and their frames and thresholds 173.01 1.33%
09893 Food preparations for infant use, put up for retail sale, of flour.. 169.37 1.30%
66135 Monumental or building stone (except slate) and articles there.. 159.71 1.23%
04842 Sweet biscuits, waffles and wafers, gingerbread and the like 147.58 1.14%
63591 Tools, tool bodies, tool handles, broom or brush bodies and .. 141.99 1.09%
72321 Front-end shovel-loaders, self-propelled 127.59 0.98%
Others 1,384.24 10.66%
Total 12,984.56 100.00%
2005
01122 Meat of bovine animals, frozen, boneless 4,902.40 33.55%
03427 Hake, frozen (excluding livers and roes) 1,817.42 12.44%
07111 Coffee, not roasted, not decaffeinated 1,223.09 8.37%
66139 Other monumental or building stone and articles thereof (o.. 756.48 5.18%
03428 Other fish, frozen (excluding livers and roes) 717.93 4.91%
01761 Tinned meat and offals of bovine goats and sheep (other than.. 534.05 3.65%
01252 Edible offal of bovine animals, frozen 383.67 2.63%
06229 Other sugar confectionery, not containing cocoa 352.54 2.41%
66135 Monumental or building stone (except slate) and articles there.. 318.01 2.18%
07321 Other food preparations containing cocoa in blocks slabs or .. 307.12 2.10%
04842 Sweet biscuits, waffles and wafers, gingerbread and the like 244.37 1.67%
74189 Other machinery, plant or equipment 193.15 1.32%
57311 Polyvinyl chloride, not mixed with any other substances 174.08 1.19%
63532 Doors and their frames and thresholds 168.88 1.16%
85132 Other footwear, n.e.s., with outer soles and uppers of rubber .. 164.73 1.13%
Others 2,354.16 16.11%
Total 14,612.08 100.00%
2006
01122 Meat of bovine animals, frozen, boneless 8,918.13 45.46%
12111 Tobacco raw 2,316.20 11.81%
03427 Hake, frozen (excluding livers and roes) 1,695.58 8.64%
87141 Stereoscopic microscopes 839.93 4.28%
03428 Other fish, frozen (excluding livers and roes) 834.98 4.26%
01761 Tinned meat and offals of bovine goats and sheep (other than.. 672.97 3.43%
01252 Edible offal of bovine animals, frozen 459.10 2.34%
06129 Other beet or cane sugar in solid form, other than flavoured or .. 402.02 2.05%
66139 Other monumental or building stone and articles thereof (othe.. 329.03 1.68%
93101 Special transactions and commodities not classified to kind 324.85 1.66%
63532 Doors and their frames and thresholds 289.05 1.47%
06229 Other sugar confectionery, not containing cocoa 249.44 1.27%
66135 Monumental or building stone (except slate) and articles ther.. 210.03 1.07%
03713 Tunas, skipjack and Atlantic bonito (Sarda spp.), whole or in .. 191.10 0.97%
07321 Other food preparations containing cocoa in blocks slabs or .. 155.79 0.79%
Others 1,730.22 8.82%
Total 19,618.41 100.00%
Palestinian imports from MERCOSUR between 2007 and 2013
HS 1996 6-digit, Source: PCBS via TradeSift
Year Product Product Imports Value
(‘000s USD) Imports Share

72
2007
170111 Raw sugar, cane 2,024.63 15.47%
020230 Bovine cuts boneless, frozen 1,983.92 15.16%
170199 Refined sugar, in solid form, nes, pure sucrose 1,413.47 10.80%
150790 Refined soya-bean oil, not chemically modified 1,245.71 9.52%
030378 Hake, frozen, whole 1,142.83 8.73%
090111 Coffee, not roasted, not decaffeinated 1,083.08 8.28%
760120 Aluminium unwrought, alloyed 832.70 6.36%
390110 Polyethylene - specific gravity <0.94 in primary forms 292.56 2.24%
170490 Sugar confectionery not chewing gum, no cocoa content 270.36 2.07%
441820 Doors, frames and thresholds, of wood 225.87 1.73%
120740 Sesamum seeds 178.70 1.37%
020622 Bovine livers, frozen 158.74 1.21%
680293 Worked granite 142.79 1.09%
680299 Worked monumental or building stone nes 135.58 1.04%
020629 Bovine edible offal, frozen except livers and tongues 129.96 0.99%
Others 1,826.48 13.96%
Total 13,087.38 100.00%
2008
020230 Bovine cuts boneless, frozen 5,351.12 25.37%
170111 Raw sugar, cane 4,031.86 19.12%
170199 Refined sugar, in solid form, nes, pure sucrose 4,019.21 19.06%
090111 Coffee, not roasted, not decaffeinated 1,502.54 7.12%
150790 Refined soya-bean oil, not chemically modified 1,347.54 6.39%
030378 Hake, frozen, whole 1,290.94 6.12%
441820 Doors, frames and thresholds, of wood 354.26 1.68%
390110 Polyethylene - specific gravity <0.94 in primary forms 301.03 1.43%
020621 Bovine tongues, frozen 217.81 1.03%
240110 Tobacco, unmanufactured, not stemmed or stripped 216.42 1.03%
120740 Sesamum seeds 211.92 1.00%
690890 Glazed ceramic flags, tiles wider than 7 cm 168.87 0.80%
071333 Kidney beans and white pea beans dried shelled 157.26 0.75%
100630 Rice, semi-milled or wholly milled 144.61 0.69%
440799 Lumber, non-coniferous nes 141.06 0.67%
Others 1,633.73 7.75%
Total 21,090.17 100.00%
2009
170199 Refined sugar, in solid form, nes, pure sucrose 3,922.12 41.61%
170111 Raw sugar, cane 2,467.43 26.18%
150790 Refined soya-bean oil, not chemically modified 453.92 4.82%
120740 Sesamum seeds 277.15 2.94%
441820 Doors, frames and thresholds, of wood 263.16 2.79%
901890 Instruments, appliances for medical, etc science, nes 249.91 2.65%
170490 Sugar confectionery not chewing gum, no cocoa content 207.95 2.21%
210112 Coffee prep. of extracts 189.27 2.01%
690890 Glazed ceramic flags, tiles wider than 7 cm 176.71 1.87%
440799 Lumber, non-coniferous nes 164.86 1.75%
470321 Chem wood pulp, soda or sulphate, conifer, bleached 163.50 1.73%
680299 Worked monumental or building stone nes 99.99 1.06%
680293 Worked granite 95.25 1.01%
210111 Coffee extracts, essence 90.11 0.96%
160250 Bovine meat, offal nes, not livers, prepared/preserved 74.17 0.79%
Others 531.09 5.63%

73
Total 9,426.59 100.00%
2010
170111 Raw sugar, cane 2,518.00 21.46%
090111 Coffee, not roasted, not decaffeinated 2,117.24 18.04%
030378 Hake, frozen, whole 1,082.19 9.22%
170199 Refined sugar, in solid form, nes, pure sucrose 607.44 5.18%
240110 Tobacco, unmanufactured, not stemmed or stripped 578.74 4.93%
120740 Sesamum seeds 541.14 4.61%
210111 Coffee extracts, essence 431.28 3.68%
090190 Coffee husks and skins, 291.81 2.49%
441820 Doors, frames and thresholds, of wood 269.04 2.29%
210112 Coffee prep. of extracts 249.40 2.13%
901920 Therapeutic respiration apparatus 244.29 2.08%
020230 Bovine cuts boneless, frozen 225.60 1.92%
842952 Shovels and excavators with revolving superstructure 199.91 1.70%
390130 Ethylene-vinyl acetate copolymers in primary forms 192.49 1.64%
170490 Sugar confectionery not chewing gum, no cocoa content 158.37 1.35%
Others 2,027.24 17.28%
Total 11,734.17 100.00%
2011
170199 Refined sugar, in solid form, nes, pure sucrose 5,219.52 23.85%
020230 Bovine cuts boneless, frozen 3,528.80 16.12%
170111 Raw sugar, cane 3,306.81 15.11%
090111 Coffee, not roasted, not decaffeinated 1,975.93 9.03%
030378 Hake, frozen, whole 1,184.41 5.41%
240110 Tobacco, unmanufactured, not stemmed or stripped 1,002.61 4.58%
090190 Coffee husks and skins, 817.05 3.73%
150790 Refined soya-bean oil, not chemically modified 663.70 3.03%
120740 Sesamum seeds 414.66 1.89%
210112 Coffee prep. of extracts 380.82 1.74%
200811 Ground-nuts otherwise prepared or preserved 346.45 1.58%
680293 Worked granite 345.09 1.58%
170490 Sugar confectionery not chewing gum, no cocoa content 322.84 1.48%
160250 Bovine meat, offal nes, not livers, prepared/preserved 245.93 1.12%
390210 Polypropylene in primary forms 242.66 1.11%
Others 1,889.00 8.63%
Total 21,886.26 100.00%
2012
020230 Bovine cuts boneless, frozen 9,111.58 42.30%
090111 Coffee, not roasted, not decaffeinated 3,249.06 15.08%
170199 Refined sugar, in solid form, nes, pure sucrose 1,689.48 7.84%
210111 Coffee extracts, essence 1,545.26 7.17%
847130 Portable digital data pr 552.16 2.56%
470200 Chemical wood pulp, dissolving grades 537.53 2.50%
170490 Sugar confectionery not chewing gum, no cocoa content 394.87 1.83%
240110 Tobacco, unmanufactured, not stemmed or stripped 348.70 1.62%
680291 Worked marble, travertine and alabaster 298.33 1.39%
200811 Ground-nuts otherwise prepared or preserved 290.67 1.35%
390210 Polypropylene in primary forms 284.24 1.32%
170112 Raw sugar, beet 260.39 1.21%
170111 Raw sugar, cane 213.36 0.99%
680293 Worked granite 207.41 0.96%
901890 Instruments, appliances for medical, etc science, nes 206.42 0.96%

74
Others 2,350.88 10.91%
Total 21,540.34 100.00%
2013
020230 Bovine cuts boneless, frozen 10,909.86 41.33%
090111 Coffee, not roasted, not decaffeinated 5,518.75 20.91%
170111 Raw sugar, cane 2,485.28 9.42%
030310 Salmon, Pacific, frozen, whole 2,136.72 8.09%
210111 Coffee extracts, essence 1,535.01 5.82%
170490 Sugar confectionery not chewing gum, no cocoa content 392.11 1.49%
160250 Bovine meat, offal nes, not livers, prepared/preserved 306.71 1.16%
680293 Worked granite 303.54 1.15%
870331 Automobiles, diesel engine of <1500 cc 242.19 0.92%
390210 Polypropylene in primary forms 242.06 0.92%
200811 Ground-nuts otherwise prepared or preserved 241.52 0.91%
441820 Doors, frames and thresholds, of wood 192.34 0.73%
120740 Sesamum seeds 171.72 0.65%
151529 Maize oil, fractions, refined not chemically modified 143.81 0.54%
240391 Homogenized or reconstituted tobacco 132.65 0.50%
Others 1,441.58 5.46%
Total 26,395.85 100.00%

75
Annex VII: MERCOSUR’s applied tariff peaks for Palestine’s world exports (2013)
Product Product Name
Palestine's exports MERCOSUR's applied tariffs
Exp. Value
('000s USD)
Exp.
Share
Simple
Average
AHS
Tariff (%)
Min.
Rate
(%)
Max.
Rate
(%)
Total
Lines
Dom.
Peaks
Internat.
Peaks
392321 Sacks & bags (including cones)
of polymers of ethylene 38,941.56 4.16% 16.64 0 20 285 0.00% 92.63%
240220 Cigarettes containing tobacco 35,350.69 3.77% 16.12 0 35 40 0.00% 77.50%
640199 Waterproof
footwear(Wellington) no toe
cap, nes
26,238.01 2.80% 31.03 0 35 41 58.54% 97.56%
940350 Bedroom furniture, wooden, nes 21,059.83 2.25% 16.46 0 20 125 0.00% 87.20%
940429 Mattresses, stuffed, spring
interior, etc 15,756.71 1.68% 20.17 0 35 80 0.00% 85.00%
940161 Seats with wooden frames,
upholstered nes 14,977.65 1.60% 20.01 0 35 135 0.00% 90.37%
760429 Bars, rods and other profiles,
aluminium alloyed 13,611.49 1.45% 8.95 0 20 356 0.00% 12.64%
040310 Yogurt 10,386.29 1.11% 14.67 0 20 12 0.00% 83.33%
210690 Food preparations nes 9,857.40 1.05% 13.83 0 20 1614 0.00% 59.11%
150910 Olive oil, virgin 8,842.09 0.94% 12.9 0 31.5 45 0.00% 31.11%
940310 Office furniture, metal, nes 7,138.35 0.76% 20.61 0 35 86 0.00% 93.02%
170490 Sugar confectionery not
chewing gum, no cocoa content 6,825.73 0.73% 17.5 0 20 380 0.00% 88.16%
640419 Footwear,sole
rubber/plastic,upper textile, not
sports
6,724.77 0.72% 29.89 0 35 106 60.38% 91.51%
691010 Porcelain bathroom, kitchen &
other sanitary fixtures 6,650.50 0.71% 15.51 0 18 57 0.00% 75.44%
340290 Organic surfactant washing,
cleaning preparations nes 6,505.81 0.69% 11.33 0 18 1132 0.00% 38.16%
220290 Non-alcoholic beverages nes,
except fruit, veg juices 6,040.63 0.64% 18.49 0 20 110 0.00% 90.91%
940130 Swivel seats with variable
height adjustment 5,847.87 0.62% 17.2 0 20 152 0.00% 92.11%
160100 Sausages, similar products of
meat, meat offal & blood 5,827.95 0.62% 15.04 0 20 39 0.00% 76.92%
940340 Kitchen furniture, wooden, nes 5,827.23 0.62% 16.53 0 20 93 0.00% 87.10%
481810 Toilet paper 5,631.91 0.60% 13.33 0 20 39 0.00% 79.49%
180631 Chocolate, cocoa preps, block,
slab, bar, filled, >2kg 5,630.90 0.60% 17.96 0 20 137 0.00% 90.51%
110419 Cereals, rolled or flaked grains
nes 5,321.07 0.57% 12.5 10 20 4 0.00% 25.00%
481890 Household, hospital & sanitary
supplies, of paper, nes 4,931.53 0.53% 14.67 0 20 151 0.00% 90.07%
401110 Pneumatic tyres new of rubber
for motor cars 4,604.53 0.49% 12.33 0 16 193 0.00% 48.19%
853669 Electrical plugs and sockets 4,153.40 0.44% 14.73 0 16 416 0.00% 75.48%
870899 Motor vehicle parts nes 3,879.71 0.41% 9.13 0 18 1825 0.00% 25.59%
940370 Furniture, plastic, nes 3,845.48 0.41% 20.23 0 35 136 0.00% 91.91%
701339 Glass table or kitchenware,
except low expansion glass 3,705.58 0.40% 15.44 0 20 22 0.00% 77.27%
392410 Plastic table and kitchen ware 3,628.38 0.39% 16.13 0 20 186 0.00% 75.27%
391721 Tube, pipe or hose, rigid, of
polyethylene 3,570.95 0.38% 15.16 0 20 75 0.00% 89.33%
950669 Balls nes 3,542.05 0.38% 18.29 0 20 60 0.00% 91.67%
761010 Aluminium Doors, windows,
frames and thresholds 3,461.53 0.37% 14.86 0 16 84 0.00% 64.29%
848180 Taps, cocks, valves and similar
appliances, nes 2,903.67 0.31% 12.71 0 18 4308 0.00% 19.87%
850780 Electric accumulators, nes 2,584.52 0.28% 14.65 0 18 261 0.00% 75.48%
940421 Mattresses of cellular rubber or
plastic 2,554.22 0.27% 15.9 0 20 56 0.00% 83.93%
851712 Unknown 2,512.75 0.27% 6.21 0 16 1830 0.00% 10.16%
540791 Woven fabric synthetic filament
nes 2,509.15 0.27% 20.42 0 26 19 0.00% 89.47%
401120 Pneumatic tyres new of rubber
for buses or lorries 2,325.63 0.25% 12.7 0 16 242 0.00% 51.24%
391740 Fittings for plastic tube, pipe or
hose 2,243.92 0.24% 9.85 0 20 376 0.00% 55.85%
220890 Alcoholic liqueurs nes 2,230.76 0.24% 19.34 0 35 112 0.00% 82.14%
040610 Fresh cheese, unfermented whey
cheese, curd 2,203.07 0.24% 21.17 0 40 43 9.30% 93.02%
190531 Unknown 2,188.86 0.23% 16.12 0 20 107 0.00% 86.92%
640351 Footwear, soles, uppers of
leather, over ankle, nes 2,116.69 0.23% 28.78 0 35 100 38.00% 86.00%

76
090190 Coffee husks and skins, 2,109.93 0.23% 14.55 10 20 11 0.00% 45.45%
170390 Molasses, except cane molasses 2,055.24 0.22% 15.88 15 16 8 0.00% 87.50%
732393 Table/kitchen articles, parts,
stainless steel 1,929.68 0.21% 16.74 0 20 154 0.00% 81.17%
090121 Coffee, roasted, not
decaffeinated 1,902.15 0.20% 9.88 0 20 39 0.00% 10.26%
871639 Trailers nes for the transport of
goods 1,892.69 0.20% 22.89 0 35 45 33.33% 93.33%
040221 Milk and cream powder
unsweetened > 1.5% fat 1,891.91 0.20% 27.05 0 40 118 61.02% 94.07%
701349 Unknown 1,881.75 0.20% 16.73 0 18 97 0.00% 78.35%
151529 Maize oil, fractions, refined not
chemically modified 1,848.96 0.20% 12 0 30 18 0.00% 11.11%
870829 Parts and accessories of bodies
nes for motor vehicles 1,767.37 0.19% 11.93 0 18 2693 0.00% 34.53%
940490 Articles of bedding nes 1,701.31 0.18% 16.76 0 20 231 0.00% 90.48%
330499 Beauty, makeup and suntan
preparations nes 1,627.38 0.17% 16.2 0 20 267 0.00% 80.90%
040390 Buttermilk, curdled milk, cream,
kephir, etc. 1,567.97 0.17% 10.96 0 20 18 0.00% 61.11%
691110 Tableware and kitchenware of
porcelain or china 1,497.18 0.16% 16.54 0 20 196 0.00% 84.18%
482360 Trays, dishes, plates, cups and
the like, of paper 1,478.80 0.16% 17.09 0 20 13 0.00% 84.62%
482361 Unknown 1,447.87 0.15% 13.71 0 16 7 0.00% 85.71%
100620 Rice, husked (brown) 1,445.00 0.15% 9.38 0 20 30 0.00% 3.33%
120740 Sesamum seeds 1,439.41 0.15% 4.83 0 40 46 4.35% 4.35%
481910 Cartons, boxes & cases, of
corrugated paper or board 1,367.96 0.15% 14.55 0 16 142 0.00% 76.06%
940330 Office furniture, wooden, nes 1,316.06 0.14% 20.66 0 35 114 0.00% 89.47%
850980 Domestic appliances, with
electric motor, nes 1,282.85 0.14% 18.01 0 20 104 0.00% 90.38%
901890 Instruments, appliances for
medical, etc science, nes 1,273.32 0.14% 5.48 0 16 2497 0.00% 27.27%
820530 Planes, chisels, gouges and
similar wood cutting tools 1,265.08 0.14% 16.11 0 18 70 0.00% 75.71%
854420 Co-axial cable and other co-
axial electric conductors 1,237.42 0.13% 14.76 0 16 244 0.00% 58.20%
150790 Refined soya-bean oil, not
chemically modified 1,170.47 0.12% 18.35 0 40 56 8.93% 19.64%
481840 Sanitary articles of paper,
sanitary towels, diapers 1,159.04 0.12% 12.36 0 20 114 0.00% 63.16%
392510 Plastic reservoirs, tanks, vats,
etc, capacity <300l 1,148.96 0.12% 16.24 0 20 49 0.00% 87.76%
611030 Pullovers, cardigans etc of
manmade fibres, knit 1,142.37 0.12% 27.02 0 35 224 35.71% 90.18%
160250 Bovine meat, offal nes, not
livers, prepared/preserved 1,121.59 0.12% 13.14 0 20 34 0.00% 58.82%
831110 Electrodes, coated, of base
metal, for arc welding 1,099.10 0.12% 14.02 0 16 96 0.00% 72.92%
620469 Womens, girls trousers, shorts,
material nes, not knit 1,030.80 0.11% 27.97 0 35 161 32.92% 89.44%
392010 Sheet/film not cellular/reinf
polymers of ethylene 1,029.20 0.11% 7.36 0 20 439 0.00% 38.72%
392111 Sheet etc, cellular of polymers
of styrene 983.24 0.10% 14.77 0 20 39 0 35
392610 Plastic office and school articles
and supplies 982.52 0.10% 16.93 0 20 134 0 123
481710 Envelopes of paper 961.45 0.10% 15.13 0 20 63 0 56
170191 Refined sugar, in solid form,
flavoured or coloured 952.74 0.10% 22.11 0 35 9 4 8
640219 Sports footwear nes, soles,
uppers of rubber, plastic 949.01 0.10% 30.05 0 35 66 38 61
442010 Statuettes and other ornaments
of wood 906.78 0.10% 14.05 0 20 111 0 20
200980 Single fruit, veg juice nes, not
fermented or spirited 890.15 0.10% 14.3 0 20 112 0 88
940320 Furniture, metal, nes 817.67 0.09% 19.85 0 35 179 0 167
620690 Womens, girls blouses & shirts,
material nes, not knit 813.83 0.09% 27.89 0 35 87 34 79
330510 Hair shampoos 812.34 0.09% 15.31 0 20 86 0 58
482010 Registers, account books, note
books, diaries etc 808.37 0.09% 15.19 0 20 144 0 127
820130 Mattocks, picks, hoes and rakes 797.30 0.09% 12.87 0 18 53 0 30
870432 Spark ignition engine trucks
weighing > 5 tonnes 780.78 0.08% 20.83 15 35 18 4 16
040620 Cheese, grated or powdered, of
all kinds 768.13 0.08% 19.2 0 40 19 4 14
691090 Ceramic bathroom kitchen
sanitary items not porcelain 758.61 0.08% 16.15 0 18 66 0 51
847130 Portable digital data pr 754.47 0.08% 5.6 0 16 427 0 132
200490 Vegetables nes and mixtures,
prepared, frozen 744.94 0.08% 13.27 0 20 34 0 2
330300 Perfumes and toilet waters 733.70 0.08% 13.87 0 20 194 0 125
190590 Communion wafers, rice paper,
bakers wares nes 722.49 0.08% 16.34 0 20 299 0 270

77
392690 Plastic articles nes 707.12 0.08% 13.13 0 20 4162 0 2812
940390 Furniture parts nes 682.43 0.07% 15.9 0 18 306 0 219
580900 Woven fabric incorporating
metal threads, nes 676.06 0.07% 22.94 18 26 17 0 17
570190 Carpets of materials nes, knotted 666.48 0.07% 24.57 0 35 52 20 49
853921 Filament lamps, tungsten
halogen 662.34 0.07% 16.4 0 20 316 0 256
392310 Boxes, cases, crates etc. of
plastic 651.12 0.07% 16.97 0 20 366 0 338
190540 Rusks, toasted bread and similar
toasted products 633.50 0.07% 16.32 0 20 31 0 27
482390 Paper and paper articles, nes 609.98 0.07% 8.61 0 16 1020 0 197
620990 Babies garments, accessories of
material nes, not knit 606.05 0.06% 28.51 0 35 84 48 78
151219 Sunflower or safflower
oil,fractions simply refined 605.84 0.06% 10.58 0 21 66 0 2
640620 Soles and heels for footwear, of
rubber or plastic 599.24 0.06% 14.75 0 18 46 0 29
620930 Babies garments, accessories
synthetic fibre, not knit 592.97 0.06% 27.11 0 35 78 35 72
420212 Trunks, suit-cases, etc, outer
surface plastic/textile 592.63 0.06% 18.79 0 20 354 0 332
110429 Cereals, hulled, pearled, sliced
or kibbled nes 584.24 0.06% 11.82 0 20 16 0 8
220300 Beer made from malt 579.26 0.06% 18.41 0 20 102 0 93
950490 Articles for funfair, table and
parlour games, nes 571.93 0.06% 10.9 0 20 200 0 120
730490 Iron or steel tubes, pipes or
hollow profiles, nes 566.09 0.06% 15.23 0 16 311 0 280
482020 School, etc, exercise books 527.96 0.06% 15.28 0 20 86 0 77
610449 Womens, girls dresses, of
material nes, knit 519.45 0.06% 27.08 0 35 55 22 48
420500 Articles of leather and
composition leather, nes 505.58 0.05% 17.55 0 20 305 0 264
761519 Table,kitchen&household 496.58 0.05% 16.15 0 20 149 0 126
691390 Ceramic statuettes, ornamental
articles, not porcelain 487.72 0.05% 17.95 0 20 188 0 165
391739 Plastic tube, pipe or hose,
flexible, nes 483.36 0.05% 15.84 0 20 199 0 190
846729 Unknown 480.23 0.05% 15.95 0 20 544 0 392
210500 Ice cream and other edible ice 470.26 0.05% 14.83 0 20 70 0 60
630499 Furnishing goods nes, material
nes, not knit, crochet 465.51 0.05% 28.93 14 35 46 28 45
040590 Other milk fats and oils 453.91 0.05% 14.91 0 20 23 0 19
853530 Isolating and make-and-break
switches, voltage >1 kV 444.53 0.05% 12.26 0 16 861 0 600
940171 Seats with metal frames,
upholstered nes 443.86 0.05% 19.07 0 35 114 0 105
220110 Mineral and aerated waters not
sweetened or flavoured 419.16 0.04% 17.92 0 20 27 0 24
570320 Carpets nylon, polyamides,
tufted 410.48 0.04% 27.37 0 35 59 34 55
200931 Unknown 407.59 0.04% 15.2 14 20 9 0 1
853931 Fluorescent lamps, hot cathode 393.15 0.04% 13.94 0 20 183 0 129
340120 Soaps nes 383.09 0.04% 15.52 0 20 181 0 152
491199 Printed matter, nes 381.37 0.04% 15.71 0 20 186 0 172
220429 Grape wines, alcoholic grape
must nes 378.81 0.04% 20.18 0 35 73 0 65
190240 Couscous 372.88 0.04% 14.86 0 16 14 0 13
551219 Woven fabric >85% polyester
staple fibres, nes 366.52 0.04% 20.25 0 26 47 0 43
841919 Instantaneous/storage water
heaters, not electric nes 364.02 0.04% 18.66 0 20 144 0 134
110520 Potato flakes, granules and
pellets 363.17 0.04% 11.93 0 20 35 0 2
844332 Unknown 356.12 0.04% 4.57 0 16 2635 0 498
200290 Tomatoes nes, prepared or
preserved, not in vinegar 354.65 0.04% 13.05 0 20 82 0 6
180632 Chocolate, cocoa prep,
block/slab/bar, not filled,>2kg 351.94 0.04% 17.32 0 20 164 0 144
580410 Tulles, other nets (not woven,
knit or crochet) 349.71 0.04% 21.03 0 26 55 0 53
392490 Plastic household, toilet articles
not table, kitchen 346.85 0.04% 16.94 0 20 196 0 179
620920 Babies garments, accessories of
cotton, not knit 334.30 0.04% 28.15 0 35 118 59 108
560121 Wadding, products, of cotton,
except sanitary articles 330.85 0.04% 15.89 0 18 112 0 94
392390 Plastic articles for goods
conveyance or packing nes 328.79 0.04% 16.77 0 20 237 0 215
847141 Dig auto data proc w/cpu 323.37 0.03% 6.93 0 16 233 0 59
620721 Mens, boys nightshirts or
pyjamas, cotton, not knit 314.89 0.03% 26.77 0 35 31 7 28

78
090230 Tea, black (fermented or partly)
in packages < 3 kg 312.38 0.03% 10.24 0 20 62 0 5
732310 Iron or steel wool, pot scourers,
etc, iron or steel 311.52 0.03% 16.79 0 20 58 0 53
853710 Electrical control and
distribution boards, < 1kV 302.92 0.03% 9.82 0 18 1426 0 252
851660 Electric cooking, grilling &
roasting equipment nes 301.84 0.03% 18.02 0 20 251 0 216
650590 Hats and other headgear, knit or
crochet, nes 299.80 0.03% 16.04 0 20 148 0 118
620219 Womens, girls overcoats of
material nes, not knit 299.77 0.03% 25.19 0 35 52 22 49
110311 Wheat meal 297.41 0.03% 10 0 20 12 0 1
200410 Potatoes, prepared, frozen 297.20 0.03% 14.58 0 20 42 0 7
850110 Electric motors of an output <
37.5 watts 288.57 0.03% 12.29 0 18 1075 0 603
620459 Womens, girls skirts, of material
nes, not knit 282.98 0.03% 28.22 0 35 134 44 124
843110 Parts of hoists and winches 280.01 0.03% 12.13 0 16 181 0 77
841510 Air conditioners window/wall
types, self-contained 279.18 0.03% 15.24 0 35 195 16 98
845210 Household type sewing
machines 277.36 0.03% 16.1 0 20 98 0 25
691490 Articles of ceramics, except
porcelain or china, nes 273.53 0.03% 17.53 0 20 133 0 99
847190 Automatic data processin 270.99 0.03% 6.07 0 16 969 0 84
540110 Sewing thread of synthetic
filaments 269.20 0.03% 15.13 0 18 193 0 154
392112 Sheet etc, cellular of polymers
of vinyl chloride 267.04 0.03% 14.34 0 20 111 0 95
830249 Mountings, fittings, of base
metal, nes 261.31 0.03% 14.92 0 16 155 0 123
160414 Tuna, skipjack, bonito,
prepared/preserved, not minced 251.93 0.03% 14.17 0 20 72 0 60
330430 Manicure or pedicure
preparations 250.16 0.03% 16.02 0 20 66 0 58
841829 Refrigerators, household type,
including non-elecctric 246.80 0.03% 18.92 0 20 56 0 53
521139 Woven cotton nes, <85%
+manmade fibre, >200g/m2,
dyed
246.30 0.03% 20.23 0 26 32 0 27
200580 Sweet corn, prepared or
preserved, not frozen/vinegar 245.38 0.03% 11.82 0 20 23 0 3
620343 Mens, boys trousers shorts,
synthetic fibre, not knit 245.05 0.03% 28.22 0 35 158 71 147
100590 Maize except seed corn 240.81 0.03% 8.14 0 20 60 0 5
570390 Carpets of materials nes, tufted 240.16 0.03% 26.9 0 35 55 29 52
340119 Soaps for purposes other than
toilet soap, solid 239.48 0.03% 15.11 0 20 83 0 62
540219 Unknown 238.24 0.03% 16.14 0 18 84 0 78
420221 Handbags with outer surface of
leather 236.53 0.03% 18.24 0 20 238 0 214
854460 Electric conductors, for over
1,000 volts, nes 233.88 0.02% 14.73 0 16 185 0 92
040120 Milk not concentrated nor
sweetened 1-6% fat 232.94 0.02% 19.39 0 40 27 5 7
691310 Statuettes & ornamental articles
of porcelain or china 215.23 0.02% 17.27 0 20 78 0 65
820140 Axes, bill hooks and similar
hewing tools 215.05 0.02% 15.61 0 18 94 0 54
640590 Footwear, nes 208.95 0.02% 29.37 0 35 77 25 67
630699 Camping goods nes, textile
material, not cotton 207.69 0.02% 19.23 0 35 13 2 11
391990 Self-adhesive plates, sheets,
film, plastic, w >20 cm 207.40 0.02% 14.24 0 20 323 0 278
190211 Uncooked egg pasta not stuffed
or prepared 205.84 0.02% 15.4 0 20 20 0 19
040900 Honey, natural 204.48 0.02% 12.97 0 20 22 0 16
821220 Safety razor blades, including
blanks in strips 202.96 0.02% 16.99 0 20 95 0 88
940510 Chandeliers, other electric
ceiling or wall lights 200.51 0.02% 16.4 0 20 906 0 787
200559 Beans nes, prepared or
preserved, not frozen/vinegar 198.48 0.02% 14.78 14 20 24 0 3
870321 Automobiles, spark ignition
engine of <1000 cc 197.98 0.02% 21.62 0 40 79 25 39
691190 Household & toilet articles nes
of porcelain or china 194.72 0.02% 18.34 0 20 57 0 52
151590 Veg fats, oils nes, fractions, not
chemically modified 193.10 0.02% 9.84 0 30 328 0 2
847290 Office machines, nes 191.01 0.02% 7.33 0 18 871 0 207
630293 Toilet or kitchen linen, of
manmade fibres 189.80 0.02% 26.44 0 35 54 19 47
640411 Sports footwear, sole rubber or
plastic, upper textile 183.90 0.02% 28.28 0 35 88 36 80
210112 Coffee prep. of extracts 182.64 0.02% 13.35 0 20 39 0 31
841990 Parts, laboratory/industrial
heating/cooling machinery 175.37 0.02% 8.83 0 16 900 0 129
870322 Automobiles, spark ignition
engine of 1000-1500 cc 170.59 0.02% 22.33 0 40 202 68 102
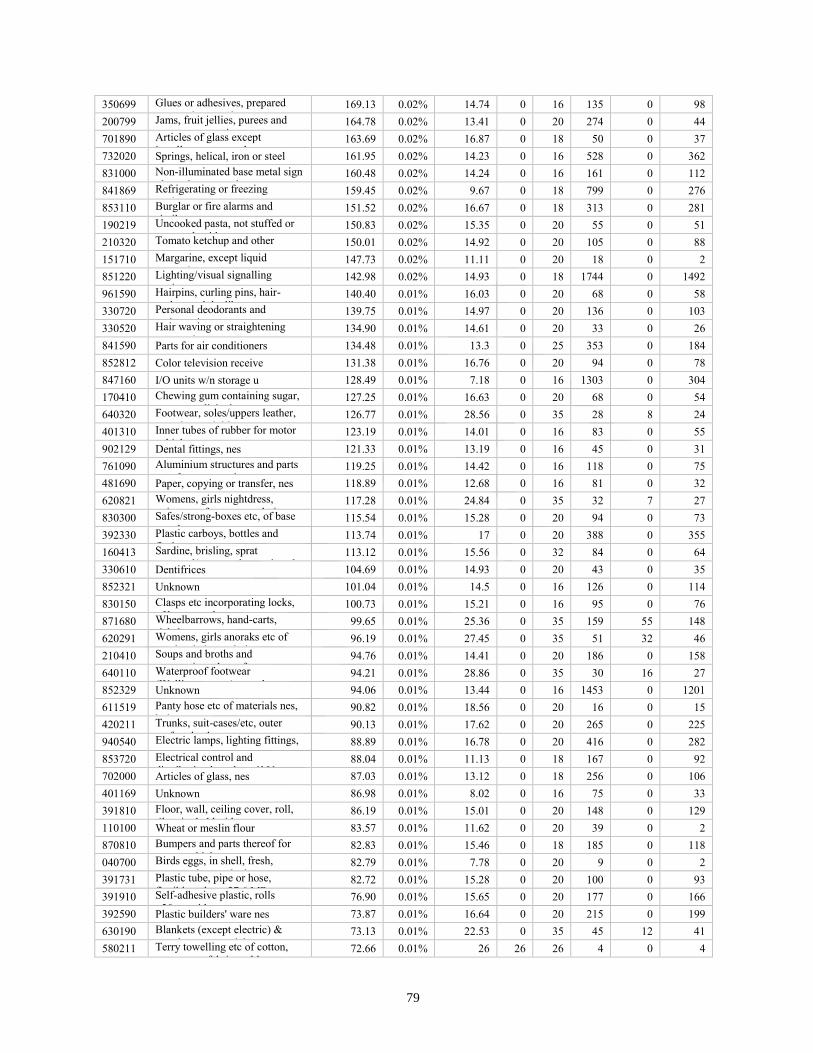
79
350699 Glues or adhesives, prepared
nes, package > 1kg 169.13 0.02% 14.74 0 16 135 0 98
200799 Jams, fruit jellies, purees and
pastes, except citrus 164.78 0.02% 13.41 0 20 274 0 44
701890 Articles of glass except
jewellery nes, toy glass eyes 163.69 0.02% 16.87 0 18 50 0 37
732020 Springs, helical, iron or steel 161.95 0.02% 14.23 0 16 528 0 362
831000 Non-illuminated base metal sign
plates, letter, number 160.48 0.02% 14.24 0 16 161 0 112
841869 Refrigerating or freezing
equipment nes 159.45 0.02% 9.67 0 18 799 0 276
853110 Burglar or fire alarms and
similar apparatus 151.52 0.02% 16.67 0 18 313 0 281
190219 Uncooked pasta, not stuffed or
prepared, without eggs 150.83 0.02% 15.35 0 20 55 0 51
210320 Tomato ketchup and other
tomato sauces 150.01 0.02% 14.92 0 20 105 0 88
151710 Margarine, except liquid
margarine 147.73 0.02% 11.11 0 20 18 0 2
851220 Lighting/visual signalling
equipment nes 142.98 0.02% 14.93 0 18 1744 0 1492
961590 Hairpins, curling pins, hair-
curlers and the like, nes 140.40 0.01% 16.03 0 20 68 0 58
330720 Personal deodorants and
antiperspirants 139.75 0.01% 14.97 0 20 136 0 103
330520 Hair waving or straightening
preparations 134.90 0.01% 14.61 0 20 33 0 26
841590 Parts for air conditioners 134.48 0.01% 13.3 0 25 353 0 184
852812 Color television receive 131.38 0.01% 16.76 0 20 94 0 78
847160 I/O units w/n storage u 128.49 0.01% 7.18 0 16 1303 0 304
170410 Chewing gum containing sugar,
except medicinal 127.25 0.01% 16.63 0 20 68 0 54
640320 Footwear, soles/uppers leather,
strap instep & big toe 126.77 0.01% 28.56 0 35 28 8 24
401310 Inner tubes of rubber for motor
vehicles 123.19 0.01% 14.01 0 16 83 0 55
902129 Dental fittings, nes 121.33 0.01% 13.19 0 16 45 0 31
761090 Aluminium structures and parts
nes, for construction 119.25 0.01% 14.42 0 16 118 0 75
481690 Paper, copying or transfer, nes 118.89 0.01% 12.68 0 16 81 0 32
620821 Womens, girls nightdress,
pyjamas, of cotton, not knit 117.28 0.01% 24.84 0 35 32 7 27
830300 Safes/strong-boxes etc, of base
metal 115.54 0.01% 15.28 0 20 94 0 73
392330 Plastic carboys, bottles and
flasks, etc 113.74 0.01% 17 0 20 388 0 355
160413 Sardine, brisling, sprat
prepared/preserved,not minced 113.12 0.01% 15.56 0 32 84 0 64
330610 Dentifrices 104.69 0.01% 14.93 0 20 43 0 35
852321 Unknown 101.04 0.01% 14.5 0 16 126 0 114
830150 Clasps etc incorporating locks,
of base metal 100.73 0.01% 15.21 0 16 95 0 76
871680 Wheelbarrows, hand-carts,
rickshaws etc 99.65 0.01% 25.36 0 35 159 55 148
620291 Womens, girls anoraks etc of
wool or hair, not knit 96.19 0.01% 27.45 0 35 51 32 46
210410 Soups and broths and
preparations thereof 94.76 0.01% 14.41 0 20 186 0 158
640110 Waterproof footwear
(Wellingtons etc), metal toe cap 94.21 0.01% 28.86 0 35 30 16 27
852329 Unknown 94.06 0.01% 13.44 0 16 1453 0 1201
611519 Panty hose etc of materials nes,
knit 90.82 0.01% 18.56 0 20 16 0 15
420211 Trunks, suit-cases/etc, outer
surface leather 90.13 0.01% 17.62 0 20 265 0 225
940540 Electric lamps, lighting fittings,
nes 88.89 0.01% 16.78 0 20 416 0 282
853720 Electrical control and
distribution boards, > 1kV 88.04 0.01% 11.13 0 18 167 0 92
702000 Articles of glass, nes 87.03 0.01% 13.12 0 18 256 0 106
401169 Unknown 86.98 0.01% 8.02 0 16 75 0 33
391810 Floor, wall, ceiling cover, roll,
tile, vinyl chloride 86.19 0.01% 15.01 0 20 148 0 129
110100 Wheat or meslin flour 83.57 0.01% 11.62 0 20 39 0 2
870810 Bumpers and parts thereof for
motor vehicles 82.83 0.01% 15.46 0 18 185 0 118
040700 Birds eggs, in shell, fresh,
preserved or cooked 82.79 0.01% 7.78 0 20 9 0 2
391731 Plastic tube, pipe or hose,
flexible, mbp > 27.6 MPa 82.72 0.01% 15.28 0 20 100 0 93
391910 Self-adhesive plastic, rolls
<20cm wide 76.90 0.01% 15.65 0 20 177 0 166
392590 Plastic builders' ware nes 73.87 0.01% 16.64 0 20 215 0 199
630190 Blankets (except electric) &
travel rugs, material nes 73.13 0.01% 22.53 0 35 45 12 41
580211 Terry towelling etc of cotton,
not narrow fabric, unbl 72.66 0.01% 26 26 26 4 0 4

80
841830 Freezers of the chest type, < 800
litre capacity 71.65 0.01% 16.24 0 20 37 0 29
830890 Clasps/buckles, etc for clothing,
footwear, bags etc 71.65 0.01% 14.71 0 16 301 0 267
480257 Unknown 70.91 0.01% 9.98 0 16 357 0 55
330420 Eye make-up preparations 70.26 0.01% 15.18 0 20 177 0 145
611120 Babies garments, accessories of
cotton, knit 69.85 0.01% 26.49 0 35 118 52 108
950691 Physical exercise, gymnasium
and athletics equipment 69.45 0.01% 18.37 0 20 121 0 111
540753 Woven fabric >85% textured
polyester, yarn dyed, nes 67.43 0.01% 20.04 0 26 57 0 47
852872 Unknown 65.77 0.01% 13.82 0 20 67 0 44
630240 Table linen, of textile knit or
crochet materials 64.01 0.01% 25.79 0 35 27 3 24
040690 Cheese except fresh, grated,
processed or blue-veined 63.56 0.01% 24 0 40 252 60 244
240399 Products of tobacco, substitute
nes, extract, essences 63.39 0.01% 15.98 0 35 17 0 7
220900 Vinegar and substitutes for
vinegar from acetic acid 62.86 0.01% 17.91 0 20 47 0 42
330410 Lip make-up preparations 62.83 0.01% 15.57 0 20 80 0 55
392210 Baths, shower-baths and wash
basins, of plastics 62.22 0.01% 16.19 0 20 78 0 67
903289 Automatic
regulating/controlling
equipment nes
61.50 0.01% 10.35 0 18 4683 0 1670
330710 Pre-shave, shaving and after
shaving preparations 61.28 0.01% 16.33 0 20 75 0 67
845290 Parts of sewing machines, nes 60.50 0.01% 7.12 0 18 680 0 230
392119 Sheet etc, cellular of plastics nes 59.03 0.01% 12.97 0 20 123 0 85
620811 Womens, girls slips etc, of
manmade fibres, not knit 58.22 0.01% 22.95 0 35 22 7 20
392640 Plastic statuettes and other
ornamental articles 57.47 0.01% 16.79 0 20 133 0 120
610439 Womens, girls jackets &
blazers, material nes, knit 56.99 0.01% 24.06 0 35 54 16 44
110290 Cereal flour except wheat,
meslin, rye, maize, rice 55.98 0.01% 9.31 0 20 33 0 4
620319 Mens, boys suits, of material
nes, not knit 55.49 0.01% 27.49 0 35 70 15 63
441900 Tableware and kitchenware, of
wood 53.87 0.01% 13.85 0 20 91 0 14
611710 Shawls, scarves, veils etc, textile
material, knit 53.76 0.01% 24.18 0 35 129 44 115
090122 Coffee, roasted, decaffeinated 53.38 0.01% 10.48 0 20 21 0 3
950510 Articles for Christmas festivities 52.62 0.01% 17.59 0 20 88 0 79
901831 Syringes, with or without
needles 52.44 0.01% 14.35 0 16 441 0 354
620711 Mens, boys underpants or briefs,
of cotton, not knit 50.68 0.01% 27.88 0 35 56 23 52
847990 Parts of machines and
mechanical appliances nes 50.15 0.01% 11.54 0 16 385 0 166
190110 Infant foods of cereals, flour,
starch or milk, retail 50.08 0.01% 14.94 0 20 164 0 123
391890 Floor/wall/ceiling cover, roll/tile
not vinyl chloride 49.89 0.01% 16 0 20 82 0 78
830210 Hinges of base metal 49.72 0.01% 14.43 0 16 256 0 152
950699 Equipment nes for sports,
swimming and paddling pools 49.22 0.01% 18.72 0 20 173 0 158
340700 Model paste, dental paste and
wax, etc. 49.12 0.01% 14.28 0 20 240 0 188
732510 Cast articles, of non-malleable
cast iron nes 48.51 0.01% 16.28 0 18 94 0 75
401610 Articles of cellular rubber 48.01 0.01% 15.76 0 20 339 0 328
580710 Label, badge, etc, of woven
textile not embroidered 46.75 0.00% 19.5 0 26 59 0 52
711411 Silver wares, silver ware plated
with precious metal 46.71 0.00% 16.62 0 20 38 0 33
690790 Unglazed ceramic flags, tiles >
7 cm wide 46.36 0.00% 18.76 0 35 78 18 18
731811 Screws, coach, iron or steel 45.94 0.00% 14.65 0 16 43 0 30
392530 Plastic shutters and blinds
(including Venetian) 45.67 0.00% 16.98 0 20 82 0 76
611529 Unknown 45.41 0.00% 24.03 0 35 93 33 87
750890 Articles of nickel, nes 44.52 0.00% 7.88 0 16 154 0 61
846721 Unknown 44.30 0.00% 17.81 0 20 131 0 73
732690 Articles of iron or steel, nes 43.89 0.00% 10.97 0 18 697 0 334
200551 Beans, shelled,
prepared/preserved, not
frozen/vinegar
43.57 0.00% 13.57 0 20 35 0 3
920290 String musical instruments nes 42.80 0.00% 12.56 0 18 56 0 29
732111 Cooking appliances for gas fuel,
etc, iron or steel 41.80 0.00% 17.74 0 20 140 0 117
340600 Candles, tapers and the like 41.47 0.00% 19.02 0 35 88 0 80
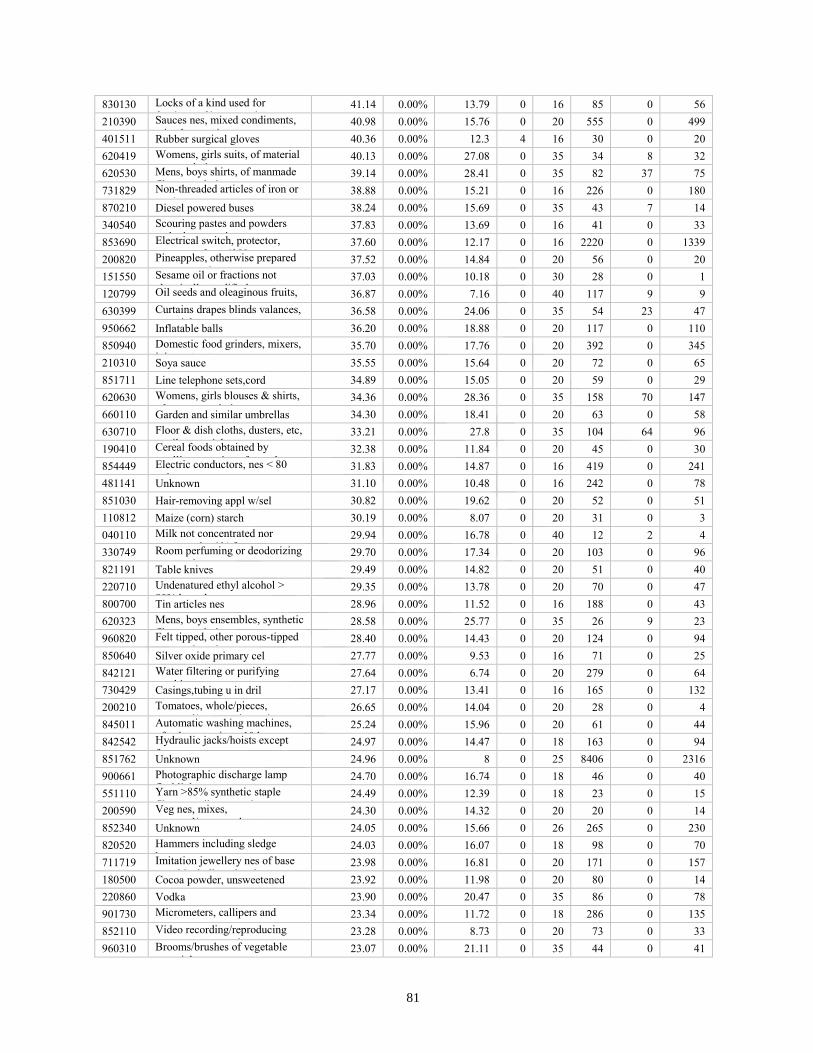
81
830130 Locks of a kind used for
furniture of base metal 41.14 0.00% 13.79 0 16 85 0 56
210390 Sauces nes, mixed condiments,
mixed seasoning 40.98 0.00% 15.76 0 20 555 0 499
401511 Rubber surgical gloves 40.36 0.00% 12.3 4 16 30 0 20
620419 Womens, girls suits, of material
nes, not knit 40.13 0.00% 27.08 0 35 34 8 32
620530 Mens, boys shirts, of manmade
fibres, not knit 39.14 0.00% 28.41 0 35 82 37 75
731829 Non-threaded articles of iron or
steel, nes 38.88 0.00% 15.21 0 16 226 0 180
870210 Diesel powered buses 38.24 0.00% 15.69 0 35 43 7 14
340540 Scouring pastes and powders
and other scouring preps 37.83 0.00% 13.69 0 16 41 0 33
853690 Electrical switch, protector,
connecter for < 1kV nes 37.60 0.00% 12.17 0 16 2220 0 1339
200820 Pineapples, otherwise prepared
or preserved 37.52 0.00% 14.84 0 20 56 0 20
151550 Sesame oil or fractions not
chemically modified 37.03 0.00% 10.18 0 30 28 0 1
120799 Oil seeds and oleaginous fruits,
nes 36.87 0.00% 7.16 0 40 117 9 9
630399 Curtains drapes blinds valances,
material nes, woven 36.58 0.00% 24.06 0 35 54 23 47
950662 Inflatable balls 36.20 0.00% 18.88 0 20 117 0 110
850940 Domestic food grinders, mixers,
juice extractors 35.70 0.00% 17.76 0 20 392 0 345
210310 Soya sauce 35.55 0.00% 15.64 0 20 72 0 65
851711 Line telephone sets,cord 34.89 0.00% 15.05 0 20 59 0 29
620630 Womens, girls blouses & shirts,
of cotton, not knit 34.36 0.00% 28.36 0 35 158 70 147
660110 Garden and similar umbrellas 34.30 0.00% 18.41 0 20 63 0 58
630710 Floor & dish cloths, dusters, etc,
textile material 33.21 0.00% 27.8 0 35 104 64 96
190410 Cereal foods obtained by
swelling, roasting of cereal 32.38 0.00% 11.84 0 20 45 0 30
854449 Electric conductors, nes < 80
volts, no connectors 31.83 0.00% 14.87 0 16 419 0 241
481141 Unknown 31.10 0.00% 10.48 0 16 242 0 78
851030 Hair-removing appl w/sel 30.82 0.00% 19.62 0 20 52 0 51
110812 Maize (corn) starch 30.19 0.00% 8.07 0 20 31 0 3
040110 Milk not concentrated nor
sweetened < 1% fat 29.94 0.00% 16.78 0 40 12 2 4
330749 Room perfuming or deodorizing
preparations, nes 29.70 0.00% 17.34 0 20 103 0 96
821191 Table knives 29.49 0.00% 14.82 0 20 51 0 40
220710 Undenatured ethyl alcohol >
80% by volume 29.35 0.00% 13.78 0 20 70 0 47
800700 Tin articles nes 28.96 0.00% 11.52 0 16 188 0 43
620323 Mens, boys ensembles, synthetic
fibres, not knit 28.58 0.00% 25.77 0 35 26 9 23
960820 Felt tipped, other porous-tipped
pens and markers 28.40 0.00% 14.43 0 20 124 0 94
850640 Silver oxide primary cel 27.77 0.00% 9.53 0 16 71 0 25
842121 Water filtering or purifying
machinery or apparatus 27.64 0.00% 6.74 0 20 279 0 64
730429 Casings,tubing u in dril 27.17 0.00% 13.41 0 16 165 0 132
200210 Tomatoes, whole/pieces,
prepared/preserved, no vinegar 26.65 0.00% 14.04 0 20 28 0 4
845011 Automatic washing machines,
of a dry capacity < 10 kg 25.24 0.00% 15.96 0 20 61 0 44
842542 Hydraulic jacks/hoists except
for garages 24.97 0.00% 14.47 0 18 163 0 94
851762 Unknown 24.96 0.00% 8 0 25 8406 0 2316
900661 Photographic discharge lamp
flashlight apparatus 24.70 0.00% 16.74 0 18 46 0 40
551110 Yarn >85% synthetic staple
fibres, retail, not sewing 24.49 0.00% 12.39 0 18 23 0 15
200590 Veg nes, mixes,
prepared/preserved, not
frozen/vinegar
24.30 0.00% 14.32 0 20 20 0 14
852340 Unknown 24.05 0.00% 15.66 0 26 265 0 230
820520 Hammers including sledge
hammers 24.03 0.00% 16.07 0 18 98 0 70
711719 Imitation jewellery nes of base
metal including plated 23.98 0.00% 16.81 0 20 171 0 157
180500 Cocoa powder, unsweetened 23.92 0.00% 11.98 0 20 80 0 14
220860 Vodka 23.90 0.00% 20.47 0 35 86 0 78
901730 Micrometers, callipers and
gauges 23.34 0.00% 11.72 0 18 286 0 135
852110 Video recording/reproducing
apparatus, magnetic tape 23.28 0.00% 8.73 0 20 73 0 33
960310 Brooms/brushes of vegetable
material 23.07 0.00% 21.11 0 35 44 0 41

82
821300 Scissors, tailors/similar shears,
blades thereof 23.04 0.00% 15.53 0 18 115 0 65
851850 Electric sound amplifier sets 22.90 0.00% 16.49 0 20 90 0 62
840999 Parts for diesel and semi-diesel
engines 22.71 0.00% 10.58 0 16 3560 0 1959
620212 Womens, girls overcoats etc of
cotton, not knit 22.65 0.00% 25.12 0 35 91 42 83
392340 Plastic spools, cops, bobbins
and similar supports 21.89 0.00% 16.91 0 20 66 0 61
732619 Articles, iron or steel nes,
forged/stamped, nfw 21.77 0.00% 16.26 0 18 187 0 147
200540 Peas, prepared or preserved, not
frozen/vinegar 21.61 0.00% 12.09 0 20 23 0 6
940380 Furniture of cane, materials nes 21.43 0.00% 30.07 0 35 26 0 22
940389 Unknown 21.09 0.00% 17.18 0 18 66 0 63
870510 Mobile cranes 20.32 0.00% 9.61 0 35 80 15 15
950430 Games, coin or disc operated 20.25 0.00% 20.79 0 35 107 0 104
870590 Special purpose motor vehicles
nes 20.00 0.00% 8.88 0 35 88 10 10
401691 Floor coverings, mats of rubber
except cellular, hard 19.74 0.00% 14.94 0 20 135 0 113
900130 Contact lenses 19.64 0.00% 11.21 0 18 52 0 24
820190 Scythes, sickles etc used in
agriculture, etc 19.40 0.00% 15.73 0 18 70 0 48
851610 Electric instant, storage and
immersion water heaters 18.90 0.00% 19.06 0 20 103 0 97
600121 Looped pile knit or crochet
fabric, of cotton 18.64 0.00% 19.82 0 26 11 0 9
560410 Rubber thread and cord, textile
covered 18.28 0.00% 16.09 0 18 37 0 30
350610 Glues and adhesives of all
kinds, package <1 kg 18.21 0.00% 15 0 16 282 0 244
491110 Trade advertising material,
catalogues etc. 18.15 0.00% 10.21 0 20 517 0 294
210130 Chicory & other coffee
substitutes, roasted & products 17.29 0.00% 12.55 0 20 11 0 2
900659 Photographic, other than
cinematographic cameras nes 17.24 0.00% 12.23 0 18 111 0 46
220600 Fermented beverages nes (eg
cider, perry, mead, etc) 16.65 0.00% 20.48 0 35 50 0 47
590320 Fabric impregnated, coated,
covered with polyurethane 16.37 0.00% 20.4 0 26 84 0 70
820320 Pliers, pincers, tweezers and
similar tools 16.35 0.00% 16.36 0 18 304 0 233
610120 Mens, boys overcoats, etc, of
cotton, knit 16.32 0.00% 25.7 0 35 101 48 94
210330 Mustard flour or meal and
prepared mustard 16.14 0.00% 16.02 0 20 121 0 115
711620 Articles of precious, semi-
precious, artificial stones 16.12 0.00% 12.27 0 20 147 0 95
330730 Perfumed bath salts and other
bath preparations 16.03 0.00% 16.58 0 20 53 0 48
851640 Electric smoothing irons 15.89 0.00% 14.3 0 20 56 0 39
830110 Padlocks of base metal 15.79 0.00% 14.32 0 16 109 0 78
842290 Parts of wash, filling, closing,
aerating machinery 15.24 0.00% 11.4 0 16 360 0 140
620891 Womens, girls panties,
bathrobes etc, cotton, not knit 15.00 0.00% 25.74 0 35 57 16 51
570490 Carpets of felt of textile
materials, > 0.3 m2 14.51 0.00% 25.25 0 35 79 25 75
630520 Sacks & bags, packing, of
cotton 14.36 0.00% 21.8 0 35 30 10 27
330590 Hair preparations, nes 14.16 0.00% 13.23 0 20 92 0 64
200891 Palm hearts, otherwise prepared
or preserved 13.96 0.00% 6.43 0 20 22 0 2
842390 Weighing machine parts and
weights of all kinds 13.96 0.00% 13.29 0 16 337 0 196
330790 Perfumery, cosmetic or toilet
preparations, nes 13.52 0.00% 15.59 0 20 102 0 85
851671 Electric coffee or tea makers,
domestic 13.35 0.00% 18.43 0 20 76 0 70
460210 Basketwork, wickerwork
products of vegetable material 13.13 0.00% 20 20 20 8 0 8
852359 Unknown 12.91 0.00% 11.36 0 16 219 0 98
732391 Table/kitchen articles, parts,
unenamelled cast iron 12.89 0.00% 15.58 0 20 33 0 28
170290 Sugar nes, invert sugar, caramel
and artificial honey 12.67 0.00% 14.54 0 20 85 0 65
940210 Dentists, barbers or similar
chairs and parts 12.64 0.00% 15.42 0 18 45 0 25
640610 Footwear uppers and parts
thereof, except stiffeners 12.63 0.00% 14.08 0 18 51 0 35
070320 Garlic, fresh or chilled 12.62 0.00% 11.23 0 35 37 7 11
611490 Garments nes, of materials nes,
knit 12.54 0.00% 21.46 0 35 100 30 89
481940 Sacks and bags, of paper, nes,
including cones 12.27 0.00% 14.29 0 16 174 0 134
420329 Leather, composition gloves &
mittens except sports 12.24 0.00% 18.73 0 20 93 0 87

83
732219 Radiators and parts thereof, iron
or steel except cast 12.22 0.00% 16.48 0 18 60 0 44
851770 Unknown 11.72 0.00% 6.01 0 16 1269 0 199
853521 Automatic circuit breakers for
voltage 1-72.5 kV 11.69 0.00% 15.17 0 16 46 0 38
482340 Paper rolls, sheets & dials for
recording instruments 11.49 0.00% 14.74 0 16 56 0 42
730419 Unknown 11.49 0.00% 14.4 0 16 40 0 36
701399 Glassware, not kitchen or table
ware, not lead crystal 11.32 0.00% 17.07 0 20 125 0 115
841330 Fuel, lubricating and cooling
pumps for motor engines 11.03 0.00% 13.86 0 18 1116 0 716
900410 Sunglasses 10.87 0.00% 17.93 0 20 92 0 84
420100 Saddlery and harness, of any
material 10.68 0.00% 18.24 0 20 150 0 132
620339 Mens, boys jackets & blazers,
material nes, not knit 10.51 0.00% 27.29 0 35 83 27 76
910610 Time-registers, time-recorders 10.40 0.00% 16.81 0 20 63 0 48
820150 Secateurs, one handed shears
including poultry shears 9.90 0.00% 15.84 0 18 59 0 46
500790 Woven fabric of silk, nes 9.67 0.00% 22.85 18 26 26 0 26
842410 Fire extinguishers, whether or
not charged 9.53 0.00% 13.55 0 16 50 0 28
847010 Electronic calculators operable
with internal power 9.41 0.00% 12.48 0 20 43 0 23
853910 Sealed beam lamp units 9.39 0.00% 15.24 0 18 287 0 208
701391 Glassware except kitchen, table
ware, of lead crystal 9.17 0.00% 17.58 0 20 147 0 144
842123 Oil/petrol filters for internal
combustion engines 9.12 0.00% 13.53 0 16 299 0 206
611211 Track suits, of cotton, knit 9.05 0.00% 24.57 0 35 58 23 54
960990 Pastels, drawing charcoals,
chalks 8.67 0.00% 16.83 0 20 88 0 80
610230 Womens, girls overcoats, etc,
manmade fibres, knit 8.60 0.00% 25.64 0 35 113 54 103
732181 Domestic iron/steel liquid/solid
fuel appliances nes 8.53 0.00% 17.49 0 20 38 0 32
630140 Blankets (except electric) &
travel rugs, synth fibres 8.52 0.00% 21.83 0 35 56 19 47
851632 Electro-thermic hairdressing
apparatus, nes 8.51 0.00% 17.68 0 20 51 0 45
820330 Metal and wire cutting shears,
etc 8.40 0.00% 15.96 0 18 64 0 46
846722 Unknown 8.35 0.00% 18.05 0 20 82 0 55
841451 Table, window, ceiling fans,
electric motor <125 watts 8.34 0.00% 18.43 0 20 343 0 325
220210 Beverage waters, sweetened or
flavoured 8.32 0.00% 17.07 0 20 41 0 35
960400 Hand sieves and hand riddles 8.28 0.00% 16.19 0 18 43 0 32
630590 Sacks & bags, packing, of
materials nes 8.14 0.00% 23.13 0 35 63 21 57
870840 Transmissions for motor
vehicles 8.03 0.00% 9.09 0 18 710 0 252
732429 Baths, iron or steel, except cast
iron 7.98 0.00% 15.24 0 18 30 0 18
481960 Office box files, letter trays etc.,
of paper 7.95 0.00% 14.79 0 16 84 0 66
850131 DC motors, DC generators, of
an output < 750 watts 7.94 0.00% 13.45 0 18 390 0 225
701331 Lead crystal table, kitchen glass
(not drink glasses) 7.93 0.00% 20 20 20 5 0 5
850910 Domestic vacuum cleaners 7.86 0.00% 16.68 0 20 29 0 24
961210 Typewriter or similar ribbons 7.84 0.00% 16.32 0 18 530 0 485
901780 Instruments for measuring
length, hand use, nes 7.84 0.00% 15.17 0 18 282 0 204
845121 Drying machines, capacity <10
kg, except washer-driers 7.82 0.00% 18.63 0 20 31 0 29
392350 Plastic stoppers, lids, caps and
other closures 7.81 0.00% 16.92 0 20 292 0 266
820540 Screwdrivers 7.54 0.00% 16.3 0 18 141 0 76
851010 Shavers, with self-contained
electric motor 7.48 0.00% 16.31 0 20 34 0 25
960340 Paint/distemper/varnish brushes
nes, paint pads etc 7.34 0.00% 17.22 0 20 173 0 162
240310 Cigarette or pipe tobacco and
tobacco substitute mixes 7.31 0.00% 13.04 0 20 17 0 11
820220 Band saw blades 7.29 0.00% 16.07 0 18 73 0 55
640359 Footwear, outer soles and
uppers of leather, nes 7.20 0.00% 27.95 0 35 107 41 93
820750 Tools for drilling, other than for
rock drilling 7.19 0.00% 16.86 0 18 412 0 360
392190 Plastic sheet, film, foil or strip,
nes 7.17 0.00% 10.55 0 20 746 0 401
520921 Plain weave cotton, >85%
>200g/m2, bleached 7.11 0.00% 23.8 18 26 11 0 11
482290 Bobbins, spools and similar
supports of paper, nes 7.01 0.00% 14.14 0 16 36 0 29

84
481019 Unknown 6.88 0.00% 9.86 0 16 385 0 67
851650 Microwave ovens 6.88 0.00% 17.67 0 20 68 0 62
330741 Agarbatti, odorifers operated by
burning 6.87 0.00% 17.24 0 20 21 0 20
960899 Duplicating stylos, pen/pencil
holders, pen parts 6.85 0.00% 16.01 0 18 201 0 174
491000 Calendars, printed 6.85 0.00% 15.23 0 20 149 0 135
640312 Ski-boots,c-c, snowboard 6.83 0.00% 20 20 20 1 0 1
761210 Aluminium containers,
collapsible tubular 6.78 0.00% 13.05 0 16 22 0 17
190120 Mixes and doughs for bread,
pastry, biscuits, etc. 6.75 0.00% 11.56 0 20 32 0 1
960810 Ball point pens 6.70 0.00% 15.45 0 20 214 0 134
820830 Blades for kitchen appliances &
food industry machines 6.63 0.00% 15 0 16 92 0 73
960390 Brushes, parts, nes 6.50 0.00% 16.54 0 18 180 0 125
830630 Photograph, picture, etc frames,
mirrors of base metal 6.50 0.00% 16.13 0 20 79 0 75
732410 Sinks and wash basins, stainless
steel 6.30 0.00% 15.15 0 18 54 0 36
620439 Womens, girls jackets &
blazers, material nes,not knit 6.29 0.00% 27.5 0 35 112 34 102
330491 Powders, for skin care and
make-up 6.23 0.00% 15.37 0 20 80 0 52
820239 Circular saw blades&part 6.18 0.00% 15.08 0 18 72 0 57
732399 Table/kitchen articles, parts, of
iron or steel, nes 5.98 0.00% 16.99 0 20 122 0 112
760421 Profiles, hollow, aluminium,
alloyed 5.90 0.00% 11.65 0 20 83 0 16
420239 Articles for pocket or handbag,
nes 5.83 0.00% 17.91 0 20 86 0 77
940290 Medical, dental, surgical &
veterinary furniture, nes 5.77 0.00% 8.92 0 16 283 0 78
630312 Curtains drapes blinds valances,
synthetic fibre, knit 5.71 0.00% 24.82 0 35 33 15 29
630622 Tents, synthetic fibres 5.61 0.00% 25.65 0 35 46 20 44
490900 Postcards, printed or illustrated,
greeting cards 5.54 0.00% 15.02 0 20 92 0 81
920999 Parts and accessories for the
musical instruments nes 5.39 0.00% 12.35 0 16 82 0 55
940150 Seats of cane, osier, bamboo or
similar materials 5.39 0.00% 30 0 35 7 0 6
220830 Whiskies 5.36 0.00% 18.88 0 35 106 0 68
960839 Fountain pens, stylograph pens
and other pens, nes 5.32 0.00% 17.89 0 20 21 0 20
961000 Slates/boards with writing or
drawing surfaces 5.26 0.00% 16.85 0 20 61 0 56
902511 Thermometers, liquid-filled 5.09 0.00% 15.08 0 18 234 0 172
621112 Womens, girls swimwear, not
knit 5.07 0.00% 25.2 0 35 47 13 42
960622 Buttons of base metal, not
covered with textile 5.05 0.00% 14.91 0 18 42 0 29
961700 Vacuum flasks etc, parts except
inner 5.03 0.00% 16.05 0 20 185 0 151
870710 Bodies for passenger carrying
vehicles 4.76 0.00% 21.7 0 35 34 13 20
200899 Fruit, edible plants nes
otherwise prepared/preserved 4.64 0.00% 12.31 0 20 121 0 42
900490 Spectacles, goggles except
sunglasses 4.61 0.00% 15.19 0 20 355 0 284
820510 Drilling, threading or tapping
tools 4.60 0.00% 16.46 0 18 77 0 58
610791 Mens, boys bathrobes, dressing
gowns etc cotton, knit 4.54 0.00% 20.18 0 35 28 7 23
902300 Instruments, apparatus and
models, for demonstration 4.48 0.00% 14 0 16 171 0 99
151419 Unknown 4.48 0.00% 7.8 0 20 18 0 1
340520 Polishes, creams etc. for
maintenance of woodwork 4.46 0.00% 12.97 0 16 28 0 20
851629 Electric space heating nes and
soil heating apparatus 4.46 0.00% 19.06 0 20 147 0 135
701341 Unknown 4.30 0.00% 17.18 0 18 44 0 42
732211 Radiators and parts thereof, cast
iron 4.02 0.00% 16.5 0 18 14 0 12
170199 Refined sugar, in solid form,
nes, pure sucrose 3.98 0.00% 24.55 0 40 36 19 35
852713 Radio apparatus w/sound 3.95 0.00% 17.64 0 20 129 0 104
850811 Unknown 3.93 0.00% 18.89 0 20 54 0 51
960321 Tooth brushes 3.87 0.00% 16.98 0 20 74 0 68
540490 Strip, straw, etc. synth textile
material,< 5 mm thick 3.82 0.00% 16.26 0 18 35 0 29
842131 Intake air filters for internal
combustion engines 3.73 0.00% 13.48 0 16 277 0 193
870790 Bodies for tractors, buses, trucks
etc 3.71 0.00% 15.31 0 35 118 34 34

85
940151 Unknown 3.70 0.00% 17.36 0 18 28 0 27
846890 Welding machinery parts 3.70 0.00% 9.59 0 16 294 0 86
940560 Illuminated signs, illuminated
nameplates etc 3.67 0.00% 19.28 0 35 109 0 99
420291 Containers nes, outer surface of
leather 3.66 0.00% 18.37 0 20 236 0 211
852910 Aerials and aerial reflectors 3.65 0.00% 14.99 0 16 585 0 441
821520 Cutlery sets, articles, not plated
with precious metal 3.60 0.00% 16.92 0 20 70 0 64
151530 Castor oil or fractions not
chemically modified 3.60 0.00% 16.09 0 30 23 0 9
200811 Ground-nuts otherwise prepared
or preserved 3.57 0.00% 12.43 0 20 39 0 10
392099 Sheet/film not cellular/reinf
plastics nes 3.48 0.00% 9.73 0 20 600 0 293
910119 Wrist-watch, precious metal,
battery, other 3.45 0.00% 12.89 5 20 19 0 10
853210 Fixed power capacitors (50/60
herz circuits) 3.39 0.00% 13.75 0 16 88 0 62
820110 Spades and shovels 3.28 0.00% 13.43 0 18 79 0 42
520710 Cotton yarn (except sewing
thread) >85% cotton, retail 3.21 0.00% 12.21 0 18 27 0 12
900319 Frames & mountings for
spectacles etc, except plastic 3.20 0.00% 15.98 0 18 170 0 113
630222 Bed linen, of manmade fibres,
printed, not knit 3.19 0.00% 23.73 0 35 36 8 30
900140 Spectacle lenses of glass 3.07 0.00% 15.53 0 18 34 0 26
621290 Corsets, braces and parts thereof 2.95 0.00% 24.88 0 35 68 33 60
960200 Worked vegetable, mineral
carving material, articles 2.95 0.00% 12.58 0 20 194 0 108
040510 Butter 2.87 0.00% 15 0 20 35 0 28
902830 Electricity supply, production
and calibrating meters 2.78 0.00% 14.38 0 18 519 0 264
961800 Tailors dummies, display
dummies and automata 2.78 0.00% 16.25 0 18 86 0 65
870190 Wheeled tractors nes 2.72 0.00% 3.7 0 20 165 0 10
850990 Parts of domestic appliances
with electric motor 2.67 0.00% 13.43 0 16 74 0 54
340510 Polishes, creams etc. for
footwear or leather 2.65 0.00% 14.21 0 20 43 0 36
820590 Sets of hand tools 2.56 0.00% 16.3 0 18 129 0 99
961620 Powder-puffs and pads for the
application of cosmetics 2.55 0.00% 16.67 0 20 57 0 51
852821 Color video monitors 2.54 0.00% 17.08 0 20 33 0 28
851020 Hair clippers, with self-
contained electric motor 2.49 0.00% 2.76 0 20 62 0 14
460120 Mats, matting and screens,
vegetable plaiting material 2.39 0.00% 20 20 20 4 0 4
851680 Electric heating resistors 2.37 0.00% 14.74 0 16 345 0 296
640420 Footwear, sole leather and
uppers textile material 2.34 0.00% 30.23 0 35 46 22 42
851631 Electric hair dryers 2.30 0.00% 16.27 0 20 44 0 37
850440 Static converters, nes 2.23 0.00% 13.13 0 18 2371 0 1143
950410 Video games used with a
television receiver 2.22 0.00% 16.13 0 20 45 0 38
560750 Twine, cordage, ropes & cables,
other synthetic fibres 2.15 0.00% 16.74 0 18 326 0 297
650610 Safety headgear 2.06 0.00% 15.31 0 20 125 0 95
401290 Solid or cushioned tyres,
interchangeable treads 2.01 0.00% 13.7 0 16 224 0 108
841840 Freezers of the upright type, <
900 litre capacity 1.97 0.00% 18.41 0 20 49 0 45
850610 Manganese dioxid primary 1.91 0.00% 13 0 16 291 0 147
830610 Bells, gongs and the like, of
base metal 1.80 0.00% 15.15 0 16 46 0 37
850790 Parts of electric accumulators,
including separators 1.76 0.00% 13.44 0 16 311 0 206
870830 Unknown 1.75 0.00% 13.55 0 18 522 0 276
901090 Parts and accessories for photo
laboratory equipment 1.75 0.00% 9.62 0 16 117 0 50
901720 Drawing, marking-out,
instruments nes, slide rules 1.74 0.00% 14.42 0 18 166 0 70
620311 Mens, boys suits, of wool or
hair, not knit 1.69 0.00% 28.15 0 35 52 28 47
621210 Brassieres and parts thereof 1.66 0.00% 25.43 0 35 103 47 95
820559 Tools for
masons/watchmakers/miners,
hand tools nes
1.65 0.00% 15.36 0 18 468 0 142
950640 Articles, equipment for table-
tennis 1.64 0.00% 18.92 0 20 37 0 35
848210 Bearings, ball 1.54 0.00% 12.39 0 16 584 0 440
940180 Seats nes 1.53 0.00% 21.56 0 35 192 0 177

86
842211 Dish washing machines
(domestic) 1.50 0.00% 18.92 15 20 37 0 29
732182 Domestic iron/steel liquid fuel
appliances,not cookers 1.43 0.00% 20 20 20 16 0 16
871690 Trailer/non-mechanically
propelled vehicle parts nes 1.40 0.00% 14 0 16 163 0 140
300691 Unknown 1.38 0.00% 10.86 0 18 62 0 28
420340 Clothing accessories nes, of
leather or composition 1.36 0.00% 17.69 0 20 50 0 44
732490 Sanitary ware and parts thereof,
iron or steel, nes 1.35 0.00% 15.95 0 18 84 0 60
110813 Potato starch 1.33 0.00% 8.8 0 20 25 0 3
392062 Sheet/film not cellular/reinf
polyethylene terephthal. 1.29 0.00% 9.53 0 16 317 0 190
852859 Unknown 1.27 0.00% 16.82 0 20 190 0 151
340590 Polishes, creams and similar
preparations, nes 1.27 0.00% 14.43 0 16 122 0 99
830140 Locks of base metal, nes 1.21 0.00% 14.5 0 16 228 0 134
871492 Bicycle wheel rims and spokes 1.19 0.00% 15.34 0 16 62 0 45
420321 Leather, composition sports
gloves, mittens and mitts 1.08 0.00% 18.9 0 20 71 0 67
481830 Paper tablecloths and serviettes 1.07 0.00% 14.77 0 20 86 0 75
180610 Cocoa powder, sweetened 1.07 0.00% 13.37 0 20 19 0 14
630130 Blankets (non-electric) and
travelling rugs, of cotton 1.05 0.00% 22.54 0 35 51 17 45
481950 Containers, packing, nes of
paper 1.04 0.00% 14.01 0 16 75 0 55
741999 Articles of copper, nes 1.01 0.00% 13.56 0 16 554 0 109
961511 Combs, hair-slides etc of hard
rubber or plastic 0.98 0.00% 16.64 0 20 68 0 62
852190 Video record/reproduction
apparatus not magnetic tape 0.97 0.00% 11.42 0 20 202 0 103
160231 Turkey meat, offal prepared or
preserved, except liver 0.96 0.00% 10.4 0 20 6 0 4
900510 Binoculars 0.94 0.00% 17.99 0 20 46 0 45
620333 Mens, boys jackets, blazers,
synthetic fibre, not knit 0.93 0.00% 26.75 0 35 80 32 74
420229 Handbags, of vulcanised fibre or
paperboard 0.91 0.00% 18.47 0 20 124 0 114
151800 Processed animal, vegetable
oils, industrial preps nes 0.89 0.00% 10.77 0 40 88 4 6
482050 Albums for samples or for
collections, of paper 0.89 0.00% 14.58 0 20 65 0 56
401219 Unknown 0.84 0.00% 16 16 16 5 0 5
551291 Woven fabric >85% synth staple
fibre nes unbl/bleached 0.81 0.00% 14 2 26 22 0 11
630419 Bedspreads, textile material,
nes, not knit or crochet 0.80 0.00% 23.13 0 35 73 30 64
420330 Belts and bandoliers of leather
or composition leather 0.79 0.00% 17.88 0 20 186 0 164
020230 Bovine cuts boneless, frozen 0.74 0.00% 8.06 0 20 34 0 2
961420 Smoking pipes and pipe bowls 0.70 0.00% 17.5 0 20 8 0 7
620463 Womens, girls trousers, shorts,
synth fibres, not knit 0.65 0.00% 28.76 0 35 150 74 143
950651 Lawn-tennis rackets 0.64 0.00% 19.03 0 20 30 0 29
950440 Playing cards 0.58 0.00% 17.67 0 20 43 0 38
820890 Blades for leather, paper,
tobacco etc. industries 0.57 0.00% 15.09 0 16 175 0 132
871610 Trailers for housing or camping 0.50 0.00% 18 0 20 10 0 9
910521 Wall clocks, battery or mains
powered 0.45 0.00% 18.46 0 20 58 0 55
481149 Unknown 0.43 0.00% 13.22 0 16 100 0 44
820210 Hand saws 0.42 0.00% 16.32 0 18 116 0 70
851830 Headphones, earphones,
combinations 0.42 0.00% 16.6 0 20 141 0 93
830120 Locks of a kind used for motor
vehicles of base metal 0.41 0.00% 14.52 0 16 158 0 102
200600 Fruits, nuts, fruit-peel, etc
preserved by sugar 0.38 0.00% 11.11 0 20 36 0 2
610990 T-shirts, singlets etc, of material
nes, knit 0.38 0.00% 27.82 0 35 236 89 214
940120 Seats, motor vehicles 0.36 0.00% 16.37 0 20 105 0 85
790700 Articles of zinc, nes 0.36 0.00% 13.18 0 16 186 0 75
961400 Unknown 0.35 0.00% 17 0 18 36 0 34
701810 Ornamental glass beads, pearls,
stones, worked items 0.35 0.00% 16.07 0 18 122 0 108
940381 Unknown 0.33 0.00% 18 18 18 32 0 32
490300 Children's picture, drawing or
colouring books 0.31 0.00% 14.86 0 20 121 0 104

87
160520 Shrimps and prawns, prepared
or preserved 0.30 0.00% 7.43 0 20 7 0 3
420232 Articles for pocket or handbag,
plastic, textile outer 0.29 0.00% 19.11 0 20 162 0 153
610520 Mens, boys shirts, of manmade
fibres, knit 0.28 0.00% 27.82 0 35 121 51 111
540600 Unknown 0.27 0.00% 16.62 0 18 52 0 48
820551 Cork screws, nut-crackers and
other household tools 0.25 0.00% 16.61 0 20 106 0 96
230910 Dog or cat food (retail) 0.23 0.00% 13.63 0 20 34 0 10
920600 Percussion musical instruments 0.21 0.00% 15.1 0 18 80 0 62
392620 Plastic apparel and clothing
accessories 0.21 0.00% 17.37 0 20 182 0 172
820420 Wrench sockets, ratchet handles,
extensions, spinners 0.20 0.00% 16.46 0 18 112 0 85
590700 Textile fabric treated for
theatrical backdrops etc 0.19 0.00% 15.66 0 20 52 0 48
490700 Documents of title (bonds etc),
unused stamps etc 0.19 0.00% 6.13 0 20 320 0 108
040130 Milk and cream not
concentrated nor sweetened <
6% fat
0.19 0.00% 10 0 40 4 1 1
170240 Glucose including syrup of
20%-50% dry weight fructose 0.17 0.00% 14.5 0 20 24 0 19
853190 Parts of electric sound & visual
signalling apparatus 0.16 0.00% 14.46 0 16 187 0 154
392220 Lavatory seats and covers of
plastics 0.15 0.00% 15.7 0 20 68 0 58
392329 Plastic sacks, bags, cone except
of ethylene polymers 0.14 0.00% 17.21 0 20 291 0 275
401519 Gloves other than surgical, of
rubber 0.13 0.00% 20.63 0 35 166 33 136
040210 Milk powder < 1.5% fat 0.12 0.00% 24 0 40 38 8 36
200710 Homogenised jams, jellies, etc 0.11 0.00% 13.04 0 20 21 0 1
151229 Cotton-seed or fractions simply
refined 0.11 0.00% 17.5 10 40 18 2 2
610342 Mens, boys trousers & shorts, of
cotton, knit 0.11 0.00% 26.45 0 35 119 46 109
851821 Single loudspeakers, mounted in
enclosure 0.11 0.00% 16.52 0 20 122 0 83
902620 Equipment to measure or check
pressure 0.10 0.00% 14.71 0 18 520 0 352
821410 Paper knives, letter openers,
pencil sharpeners etc 0.09 0.00% 16.38 0 18 81 0 63
220410 Grape wines, sparkling 0.08 0.00% 20.21 0 35 94 0 86
961100 Hand printing, dating and
numbering devices, etc 0.08 0.00% 16.18 0 18 78 0 60
830510 Office binder/file fittings, of
base metal 0.08 0.00% 15.3 0 16 33 0 25
852692 Radio remote control apparatus 0.08 0.00% 8.89 0 18 130 0 58
110819 Starches except wheat, maize,
potato, manioc 0.08 0.00% 10 0 20 15 0 1
621111 Mens, boys swimwear, not knit 0.07 0.00% 28.37 0 35 89 42 84
852580 Unknown 0.06 0.00% 4.74 0 20 973 0 226
821290 Parts of non-electric razors 0.06 0.00% 17.04 0 20 27 0 25
903281 Hydraulic and pneumatic
automatic controls 0.05 0.00% 16.38 0 18 81 0 58
960329 Shaving, hair, nail, eyelash and
other toilet brushes 0.04 0.00% 17.25 0 20 93 0 86
190532 Unknown 0.04 0.00% 15.81 0 20 75 0 64
902000 Breathing appliances and gas
masks 0.04 0.00% 14.28 0 16 173 0 150
960330 Artists, writing and cosmetics
brushes 0.03 0.00% 17.25 0 20 106 0 98
840310 Central heating boilers nes 0.03 0.00% 11.89 0 18 54 0 25
830629 Statuettes and other ornaments,
base metal, unplated 0.03 0.00% 15.58 0 20 148 0 134
151519 Linseed oil,fractions, refined not
chemically modified 0.03 0.00% 12.08 0 30 24 0 4
851310 Portable battery and magneto-
electric lamps 0.02 0.00% 15.52 0 20 258 0 201
847150 Digital process units wh 0.02 0.00% 6.7 0 16 717 0 160
670210 Artificial flowers foliage fruit,
articles, plastic 0.02 0.00% 16.1 0 20 58 0 55
910511 Alarm clocks, battery or mains
powered 0.02 0.00% 18.57 0 20 28 0 26
842481 Agricultural sprays and powder
dispersers 0.02 0.00% 6.83 0 16 585 0 93
950661 Lawn-tennis balls 0.01 0.00% 19.03 0 20 39 0 38
820310 Files, rasps and similar tools 0.01 0.00% 16.11 0 18 194 0 149
731990 Articles for sewing/etc,
iron/steel, except pin/needle 0.01 0.00% 15.9 0 20 73 0 69
481029 Paper, fine, wood containing
clay coated, except light 0.01 0.00% 11.04 0 16 170 0 62
392630 Plastic fittings for furniture,
coachwork, etc 0.01 0.00% 17.28 0 20 194 0 183

88
401590 Clothing and accessories except
gloves, of rubber 0.01 0.00% 14.85 0 20 115 0 83