Embed Size (px)
Citation preview

33 IGC excursion No 11, A: July 30–August 5, B: August 15–19, 2008
Paleoseismicity and Uplift of Sweden Organizer: Nils-Axel Mörner, Paleogeophysics & Geodynamics, Stockholm, Sweden In collaboration with Rabbe Sjöberg, Sweden, Franck Audemard, Venezuela, Sue Dawson, Scotland and Guangyu Sun, China.

2
TABLE OF CONTENTS
Abstract 5
Logistics 5 Dates and location ........................................................................................................................................ 5 Travel arrangements ..................................................................................................................................... 5 Field logistics ............................................................................................................................................... 6
General Introduction .................................................................................................................. 6
Regional Geology....................................................................................................................... 6 1. The history of sea level changes and land uplift ................................................................. 7
Excursion Route and Road Log ............................................................................................... 18
Excursion Stops........................................................................................................................ 18 Excursion Part A ......................................................................................................................... 19 Umeå: over-night at Bothnia Hotel........................................................................................... 19
Day 1: July 30, Umeå to the High Coast .................................................................................................... 19 Introduction........................................................................................................................................ 19
BWG No 1–1: the river delta and a medieval harbour in view of uplift ............................... 21 Stop No 1–1: Röbäck gravel pits.............................................................................................. 22 Stop No 1-2: Lake Kassjön at +84 m....................................................................................... 22 BWG No 1-2: the PL level at +120 m at Tavelsjö .................................................................. 24 Stop No 1-3: Tavelsjö ice marginal position and the 9428 vBP paleoseismic event........ 24 Stop No 1-4: Botsmark ice marginal position and the 9291 vBP paleoseismic event...... 27 Stop No 1-5: the Spänningberget Fault and the ~9170 vBP paleoseismic event............. 28 BWG No 1-3: bedrock fracturing of “Ernst Knalle”................................................................. 29 BWG No 1-4: the tsunami bed in the +44 m bog N of Umeå ............................................... 29 BWG en route ............................................................................................................................. 29 Stop No 1-6: the Lidberget caves and paleoseismic events ................................................ 30
Synthesis of the +85 m event............................................................................................... 31 There are 3 sites in the Umeå region, which should be considered with respect to a possible paleoseismic evet occurring when sea level was in the order of +90 m, viz. Lidberget, Kassjön (Stop 1-2) and “Ernst Knalle” (BWG 1-3). This is illustrated in Fig. 27. When analyzed together, it seems clear the sea level, at the time of the paleoseismic event, was at +90 ±5 m, which would correspond to 6680 ±220 VBP. The fracturing at Lidberget is severe, suggesting that we might be in the vicinity of the epicentre. The distance between Lidberget and Ernst Knalle is 100 km. Simultaneous fracturing over such a large distance calls for a high magnitude event (M >>7). ......................................................................... 31 Synthesis of the +40-45 m event.......................................................................................... 32
BWG No 1-3: first view of Skuleberget.................................................................................... 32 Stop No 1-8: the Mt. Skuleberget ML at +284 m ................................................................... 32 Höga Kusten: over-night at the High Coast Hotel.................................................................. 34
Day 2: July 31, the High Coast to Njutånger (Hudiksvall)......................................................................... 35 Introduction........................................................................................................................................ 35
BWG en route south................................................................................................................... 37 Stop No 2-1: Gnarp River section ............................................................................................ 37 Stop No 2-2: Hög gravel pit...................................................................................................... 38 The remarkable liquefaction stratigraphy in the Hög gravel pit was discovered in 1997 and has been one of our key sites since then (Mörner et al., 2000; Mörner, 1999b, 2003, 2005). In 2000, Mörner and Audemard undertook a very detailed analysis of the site, including pains-taking cleaning of huge sections. The result documented in a series of colour photos (Mörner, 2003, p. 122-147). Two events were recorded and dated............................................................................ 39 The 9663 vBP event................................................................................................................... 39 Stop No 2-3: The Boda Cave.................................................................................................... 39 BWG No 2-1: the Boda earth slide........................................................................................... 41 Stop 2-4: liquefaction at Iggesund Harbour ............................................................................ 41
Njutånger: over-night at Njutångergården.................................................................................................. 42 Day 3: August 1, in the Hudiksvall area..................................................................................................... 42

3
Introduction........................................................................................................................................ 42 The 6100 cBP event................................................................................................................... 44 The 2000 cBP event................................................................................................................... 44 Stop No 3-1: the 9663 vBP tsunami bed in Lake Svartsjön ................................................. 45 BWG No 3–1: the Blacksåsberget rock fall ............................................................................ 47 BWG No 3-2: the Lake Källsjön tsunami................................................................................. 47 BWG No 3-3: the Storberget paleoseismic event .................................................................. 47 Stop No 3-2: the 2000 cBP methane explosive and block cone at Skålbo........................ 47 Stop No 3-3: the Falkberget Fault ............................................................................................ 49 BWG No 3-4: the Lake Bålsjön tsunami and “Niklas’ tea house” ........................................ 50 Stop No 3-4: the Aftonsjöberget bedrock faulting .................................................................. 50 BWG 3-5: the Kuggörarna harbour .......................................................................................... 51 Stop No 3-5: the shingly coast at Tomashamn ...................................................................... 51 BWG No 3-6: the Hölik cave ..................................................................................................... 52 Njutånger: over-night at Njutångergården .............................................................................. 52
Day 4: August 2, Njutånger to Saltsjöbaden (Stockholm).......................................................................... 52 Introduction........................................................................................................................................ 52
BWG No 4-1: the annual moraines at Sivik and the turbidite .............................................. 52 At Sivik, we cross a very clear annual moraine (De Geer moraine) and further southwards, we pass one after the other; a whole end moraine field. The distance between the ridges gives the rate of recession each year (fitting well with the rate of ice recession from the varve chronology). On the east site of the road, there is a varve chronological site, which we cored in 1997, and found that the unusually thick varve of 9663 vBP, in fact, was a clear turbidite..................................... 52 Stop No 4-1: liquefaction at Västra Myra ................................................................................ 52 This site originally offered the investigation of multiple liquefaction phases including a large variety of structures and venting cycles (Mörner, 2003, p. 155-157). Today, only a small section is accessible. In Fig. 51, we can distinguish up to 5 phases of liquefaction and venting. This is almost identical to the records at Hög (Stop 2-2) and is a second and independent record of shocks and after-shocks in association with the 9663 vBP paleoseismic event. ....................................... 52 BWG No 4-2: the PL level at Fågelviken ................................................................................ 53 At Fågelviken, the PL level is recorded by a shingle field and a rock cut notch at +95 m............ 53 BWG No 4-3: the Storåsen rock avalange.............................................................................. 53 BWG No 4-4: the “Alf’s gryt” cave ............................................................................................ 53 BWG No 4-5: the Losjön turbidite and varve sequence ....................................................... 53 During the building of the motorway and the new railroad, we had good exposures of varved clay. The varves were measured and we got an excellent record of the varve 9663 vBP turbidite (Mörner, 2003, 173-175) as illustrated in Fig. 52. This turbidite – always in the same varve year – can be traced from Sundsvall in the north to Uppsala in the south over 320 km. This is indicative of a very strong paleoseismic event in 9663 vBP. This is also the horizon where the methane venting signals end (Mörner, 2003, 289-294). .............................................................................. 53 BWG No 4-6: Gävle and the limits of Corylus ........................................................................ 54 Fig. 53. Anderson’s remarkable map of 1902 where he mapped the Mid-Holocene and the Present limit of Corylus (hazel) and measured the difference in temperature at 2.4 oC. This value is identical to that established by stable isotopes in Lake Tingstäde Träsk on the Island of Gotland (Mörner & Wallin, 1976). ............................................................................................................. 54 Stop No 4-2: Mehedeby bedrock fractures and caves.......................................................... 54 Stop No 4-3: the Uppsala area ................................................................................................. 55 Stop No 4-4: The esker centre at Haga .................................................................................. 56
Stop No 4-5: Lyell’s oke ............................................................................................................................ 57 BWG No 4-8: the Old Town ...................................................................................................................... 57 Saltsjöbaden: over-night at Grand Hotel .................................................................................................... 58 Day 5: August 4, Saltsjöbaden to Mariefred .............................................................................................. 58
Introduction........................................................................................................................................ 58 Stop No 5-1: Skogsö .................................................................................................................. 60 Stop No 5-2: Erstavik ................................................................................................................. 60 BWG No 5-1: Järlasjön – Hammarbybacken ......................................................................... 61 BWG No 5-2: 8 km road section south of Stockholm............................................................ 61 Stop No 5-3: Olivelund gravel pit ............................................................................................. 63 Stop No 5-4: Turinge.................................................................................................................. 63 Stop No 5-5: Turinge grave pit at Ryssjöbrink (Taxinge)...................................................... 65

4
BWG No 5-3: ............................................................................................................................... 67 Stop No 5-6: Lövtorp gravel pit................................................................................................. 67 Stop No 5-7: Läggesta railway station..................................................................................... 67 Stop No 5-8: The Ärja Fault ...................................................................................................... 67
Mariefred: over-night at Gripsholmsvikens Hotell & Konferens ............................................................... 67 Day 1 (6): August 15, Stockholm to Stavsjö .............................................................................................. 68
Introduction........................................................................................................................................ 68 BWGs (from day 5) en route Södertälje–Mariefred ............................................................... 70 BWG No 6-1: Läggesta.............................................................................................................. 70 Stop No 6-1: the Ärja Fault........................................................................................................ 71 BWG No 6-2: Lida gärde and the Ingvar Expedition ............................................................. 71 Stop No 6-2: Skäggesta “manor” of “Great Åker” in 500-700 AD....................................... 72 BWG No 6-3: the Åker Styckebruk ironworks ........................................................................ 73 Stop No 6-3: the PL-shore at Göksjön and 7800 cBP paleoseismic event ....................... 73 BWG No 6-4: esker change and end-moraine at Lake Malsjön .......................................... 73 Stop No 6-4: coring at Lake Millsjön for varves ..................................................................... 74 Stop No 6-5: coring Lake Skeppmorasjön for PL transgression ......................................... 74 Stop No 6-6: walking “the path of the mind”: 10,500 years in 2 km .................................... 75 Stop No 6-7: a Late Holocene paleoseismic event ............................................................... 77 Stop No 6-8: Krampan; iron industry, brook meandering and the 2700 cBP level ........... 79 Stop No 6-9: Canoeing from Krampan to Laxne.................................................................... 80
Stavsjö: over-night at Stavsjö Wärdshus .................................................................................................... 81 Day 2 (7): August 16, Stavsjö to Helsjön................................................................................................... 81
Introduction........................................................................................................................................ 81 BWG: en route ............................................................................................................................ 81 Stop No 7-1: Borghamn harbour .............................................................................................. 82
BWG: en route ........................................................................................................................................... 82 Stop No 7-2: the ML level and liquefaction site at Kinnarumma ........................................... 82
Stop No 7-3: the YD-delta and OD-moraine and PL-delta at Berghem ............................. 83 Stop No 7-4: the Fjärså Bräcka terminal moraine ................................................................. 83 Stop No 7-5: the bog of Älgare mosse .................................................................................... 83
Helsjön: over-night at Helsjöns folkhögskola ............................................................................................ 84 Day 3 (8): August 18, Helsjön to Hovs Hallar ........................................................................................... 85
Introduction........................................................................................................................................ 85 Stop No 8-1: the PL delta of the Younger Sea Fiord................................................................... 90 Stop No 8-2: the Kattunga mosse stratigraphy ...................................................................... 90 Stop No 8-3: view of the ALV subsurface delta area ............................................................ 91 Stop No 8-4: PTM-levels at south of Horred .......................................................................... 92 BWG No 8-1: the Veddige area................................................................................................ 93 Stop No 8-5: successive PTM shore cuts ............................................................................... 94 Stop No 8-7: Tvååker ................................................................................................................. 95 Stop No 8-8: liquefaction in Hunnestad gravel pits ............................................................... 95 BWG No 8-2: the Halmstad sea level story ............................................................................ 95 Stop No 8-9: liquefaction at Östrakarup .................................................................................. 96
Hovs Hallar (Båstad): over-night at Hovs Hallar Hotel ............................................................................. 96 Day 4: August 18, in the area around Hovs Hallar..................................................................................... 96
Introduction........................................................................................................................................ 96 Stop No 9-1: Hovs Hallar........................................................................................................... 98 BWG: No 9-1: the double ML.................................................................................................... 98 Stop No 9-2: Eskilstorp buried sea level sequence............................................................... 98 Stop No 9-3: liquefaction structures in the River Stensån riverbank ................................ 100 Stop No 9-4: the shore profile in Malen................................................................................. 100 BWG No 9-2: shorelines along the road to Kattvik .............................................................. 101 Stop No 9-5: multiple sea level data from Torekov ............................................................. 102
Day 5: August 19, end of excursion ......................................................................................................... 105 Summary and Postludium ...................................................................................................... 105
References 106

5
Abstract A 2-parts excursion through most of Sweden from 64oN to 56.5oN or from the centre of uplift to the periphery of uplift with intricate interplay of isostasy and eustasy. Field evidence of a large number of high-magnitudes paleoseismic events will be explored; faults, fractures, bedrock caves, slides, sections with excellent liquefaction structure, varves, seismic turbidites and multiple tsunami records. The special distribution of liquefaction events provides new means of assessing magnitudes. The varve chronology offers the dating as to a single year, sometimes even the season of a year. The fluid stage of the liquefaction structures have been demonstrated by magnetic methods. There are about 4000 registered bedrock caves in Sweden, most of those seem to have been formed as a function of paleoseismics in combination with explosive methane venting. The tsunami waves are traced by coring in lakes and bogs. Our Paleoseismic Catalogue includes 58 events, 16 of which generated tsunamis. There will also be numerous records of the changes in climate like the severe Younger Dryas cooling event, the Holocene climatic optimum, the Late Holocene deterioration, and a number of short (~50 yrs), very warm and dry horizons. We will also explore classical Fennoscandian Quaternary geology; eskers, ice recession, varve counting, the Baltic stages, elevated and tilted shorelines, sea level oscillations, isolation/transgression levels in bogs and lakes. Much attention will also be paid on scenic views and records of the local cultural evolution.
Logistics Dates and location Timing (A): From July 30 to August 5 Start location: Hotel Bothnia in Umeå; in the evening of July 30 End location: Stockholm Central Station; in the morning of August 5 Timing (B): From August 15 to 19 Start location: Stockholm Central Station; in the morning of August 15 End location: Båstad Railway Station; in the morning of August 19
Travel arrangements Part A starts at Hotel Bothnia in Umeå in the evening of July 30. The hotel is located just opposite the Umeå airport. We recommend air travel from Arlanda (Stockholm) to Umeå or train or bus, as long as you arrive in Umeå in the evening of July 30. From the airport to the hotel, it is walking distance (but we will try to pick you up). The excursion Part A ends at the Central Railway Station in Stockholm in the morning of August 5 (for travel to Oslo by train or by air via Arlanda airport). Part B starts at the Central Railway Station in Stockholm in the morning of August 15 and ends at the Båstad railway station in the morning of August 19 (for travel to Copenhagen). The accommodation, breakfast, picnic lunch, dinner and transportation are included in the excursion fee, like other special arrangements included in the program. We cannot guarantee the weather, but we can guarantee a very nice time with a lot of high-level science and excellent scenic impressions. Accommodation Accommodations will be provided in hotels and equivalent over-night places. Nights 3 & 4 and 9 & 10 will be in the same place. All over-night places will have something extra to offer with respect to scenery and/or culture.

6
Field logistics Transport by bus. Lunch will be in the field. The stops usually are all close to where the bus stops. In a few cases we set out for longer walks. Some boulder fields are rough. In all cases we have alternatives to offer. One day we are canoeing through a lake system (in a fracture valley), but it will be possible to follow as passive participant in the middle of a 3-person canoe (or in the bus). Weather will always be unpredictable. The temperature will be warm. But we may be out for rain and wet ground. So, prepare your clothing. (I will try to have a few extra boots handy). At some places, you may go swimming (if you want). All necessary field tools will be brought with the bus. Besides the excursion guide, much reference will be made to the monograph (Mörner, 2003) “Paleoseismicity of Sweden – a novel paradigm” (which will provided).
General Introduction The excursion is organized under the auspices of the INQUA Committee on Paleoseismics, the IGCP-437 project on Shelves of the World, and the Swedish Speleological Society. The Fennoscandian Uplift is a classical issue in geosciences. It will be demonstrated in the field by following different shorelines from the centre to the periphery of uplift (e.g. the 9300 C14 years BP shoreline at +294 m at Skuleberget, +80 m at Stockholm, +0 at Varberg and –22 m at Båstad). The “postglacial transgression” will be shown by coring at +45 m in Åker and +18 m in the Viskan Valley. The interaction among sea level changes and changes in climate will be discussed and shown in stratal records.
The deglacial high seismicity is a new concept predominantly laid down by studies in Sweden. At present we have a catalogue of 58 high-magnitude events, all recorded by multiple criteria such as faults, fractures, bedrock caves, slides and rock-falls, liquefaction structures, tsunami layers and turbidites. The recording of liquefaction and its dating via the Swedish Varve Chronology play a fundamental part in these studies. 16 events generated tsunami waves, some of them with waves at least 20 m high. We intend to investigate paleoseismic sites from Umeå in the north to Båstad in the south. Much attention will be paid on outcrops and trenches exposing liquefaction structures, and on the methodology of paleoseismological investigation (including new magnetic methods).
The country of Sweden has much to offer regarding culture and scenic views. The excursion will provide a deep insight into this, too.
Regional Geology The excursion starts in Umeå on the Baltic shore at Latitude ~64o N and ends in Båstad on the Swedish West Coast at Latitude 56.5 o N (Fig. 1). This provides a transect from the area of maximum uplift and general sea level regression to the area of peripheral uplift with a delicate interaction between uplift and eustatic changes in sea level. The discovery of a very high seismic activity – in amplitude as well as in frequency – at around the time of deglaciation, is another important and challenging fact. The dating by varve chronology to the year (or sometimes even to the season) is remarkable, too. In this guide, dates will be given in varve years BP (vBP), radiocarbon years BP (cBP) and occasionally also in calibrated radiocarbon years BP (cal.yrs. BP).

7
Fig. 1. Contours of absolute uplift of Fennoscandia (yellow) and surrounding subsidence (blue) (Mörner, 1979a, 1980a). Red dot denote the centre of uplift as recently redefined (Mörner, 2003). The excursion will make a transect from the centre to the periphery of uplift.
1. The history of sea level changes and land uplift An extensive historical overview is given by Mörner (1979a) in GeoJournal, a paper which is included in the excursion handout. References are also given to notes in Mörner (1987). True benchmark papers are De Geer’s (1888-90) papers of glacial isostasy and Lidén’s (1938) paper on varve dated uplift in Ångermanland (to be visited on Days 1-2). At the same time, it should be appreciated that much of the so-called Fairbridge curve (Fairbridge, 1961), in fact, originates from Florin’s relative sea level curve for the Kålmården area (Florin, 1944) This region will be visited on Day 6 and we will realize that the old curve of Florin has now become more or less totally revised (cf. Fig. 74). 2. The Baltic The Baltic is an inland-sea. Its environment – brackish today – has changes in four main steps since deglaciation (below). The bottom topography of the Baltic and the changes in sea level and water volumes are illustrated in a N–S profile (Fig. 2). The catchments area of the Baltic is very large. Some 450 km3 of water goes out of the Baltic. This means that the sea surface level of the Baltic exhibits a tilt from the outlet in the south northwards into the Bothnian Bay and the Bay of Finland. If precipitation and prevailing air pressure changes significantly, the tilt angle of the sea surface will change. This was used by Mörner (1999a) to explain rapid sea level falls in the Stockholm region (Day 6).

8
Fig. 2. N–S profile across the Baltic with bathymetry and elevated Ancylus and Littorina shorelines illustrating the related changes in water volumes in the Baltic basin. The Baltic Ice Lake: a glacially pounded ice lake with outlet in the south from deglaciation in the south at around 13,000 vBP to “the Drainage at Mt. Billingen” at 10,700 vBP. The Yoldia Sea: a brackish-marine stage with inlet at the Närke Straight from the sudden invasion of salt water in the varve 10,340 (≈10,000 cBP)
up to about 9.600 cBP. The 300 years between the drainage and the ingression represent a forgotten stage of lacustrine environment (Mörner, 1995).
The Ancylus Lake: a lacustrine stage with outlet in the south from about 9600 cBP (when the Närke Strait dried up) to 7750 cBP (when the Öresund Strait was flooded) The Littorina Sea: a marine stage with inlet through Öresund and the Belts.
from 7750 BP up to the present. An increasing salinity peaked (with twice the salinity of today) ~6500 to 4600 cBP and was followed by a stepwise decrease, the largest one of which occurred at around 2500 BP.
The paleogeography of these four main Baltic stages is given in a cartoon of maps (Fig. 3). During the Eemian Interglacial there was a marine connection also to the White Sea (Forsström and Eronen, 1987). This was not the case in the Holocene, however.
Fig. 3. Paleogeopgraphy of the four main Baltic stages with purple fields denoting ice cover. By about 9000 vBP the land ice was gone and present day climatic conditions prevailed. 3. The Swedish West Coast The Swedish West Coast and the Kattegatt Sea covers the area of peripheral uplift. Hence it is the ideal place for a detailed analysis of the interaction between isostasy and eustasy (Mörner,

9
1969, 1979b, 1980b, 1980c). The Kattegatt Sea has always been a marine embayment between the Atlantic and the Baltic.The strategic position of the Kattegatt Sea and the Swedish West Coast is illustrated in Fig. 4. A total of 40 separate shorelines were identified and followed for 250 km along the direction of uplift tilting (Fig. 5). At any place along this profile, individual shorelevel displacement curve (or “sea level curves”) can be drawn. The precision of these sea level curves – where the individual data points are dated at multiple places along the profile, where each shoreline is identified by morphological characteristics all along the profile, where any sea level oscillation is identified by multiple individual sedimentological characteristics, etc. – are superior to most single sea level graphs where the margin of errors, both in elevation and age, usually are large (and often, by far, exceed the assumed values). We will see examples of this during our odyssey through Sweden.
Fig. 4. The Kattegatt Sea and its geodynamic key position in between the Atlantic and the Baltic, the bridge between uplift and subsidence and the transition from bedrock shield to the surrounding sedimentary troughs. 58 paleoseismic events and 16 tsunamis are recorded here. 4. The Marine Limit (ML) and other limits (RL and PL) The highest level of the sea is termed the Marine Limit (ML). In the Baltic, which sometimes was a lake, we are talking about the highest Baltic level (BL) or highest coastal level (HC). The ML (BL) level is defined by the moment of free melting of the area; i.e. the deglaciation. Consequently, the ML represents a moment in the process of uplift, not a synchronous shoreline. The mapping of the ML level gives a highly metachronous position of the sea (further discussed during Days 1 and 8). RL refers to the Regression Limit. In the Kattegatt area it denotes a synchronous shore from the transition between a general regression to the onset of the “postglacial transgression” at a time of 9700–9300 cBP (Mörner, 1969, 1976a). See Days 8 and 9. PL stands for Postglacial Limit and it represents a metachronous limit by successively younger transgression waves towards the periphery (von Post, 1903; Mörner, 1969, 1980b). See Days 8 and 9.

10
Fig. 5. The Kattegatt shoreline spectrum of 40 separate shorelines followed over an area of 200–250 km in the direction of tilting. It includes 13 Holocene eustatic oscillation peaks. The –200 km curve (red) represents the axis of tilting with the true NW European eustatic signal.
5. Glaciation and Deglaciation At around 20,000 cBP, the entire Fennoscandian Shield and Baltic Basin were covered by ice. This ice cap had a thickness of about 3000 m. Its weight depressed the crustal surface by about 830 m in the centre of uplift. The deglaciation of Sweden begun shortly before 13,000 cBP and was over by about 9000 cBP. A major halt in the ice recession took place in the period 11,000-10,000 cBP. This period is known as the Younger Dryas Stadial; characterized by significant cooling, a halt-to- readvance in ice recession and the building up of a huge terminal moraine zone all along the Fennoscandian ice cap. With the end of the YD-stadial, the ice recession was fast and amounted to some 200-300 m per year. 6. Glacial isostatic uplift In the peripheral areas of the Fennoscandian ice cap, we can trace and identify the moment of inland tilting in the change of tilt-angle (gradients) of the shorelines. At 12,700 cBP, the onset of a sudden inland tilting is recorded in six separate areas (SE Sweden, SW Sweden, W Norway, NW Norway, NE Norway-Finland and E Finland-Estonia) as presented by Mörner (1977, 1979a, 1980a). This means that the glacial isostatic uplift of the central area (Fig. 1), started to go up as early as at around 12,700 cBP and, hence, that the central uplift started far earlier than the moment of local deglaciation. Consequently, a very large part of the uplift took place at subglacial conditions. The available data (Mörner, 1979a, 1980a) give a central absolute uplift in the order of 830 m to be compared with the maximum shoreline at +294 m (to be visited at Day 1) equaling 330 m absolute uplift. Fig. 6 illustrates the total uplift according to the old (Lidén, 1938) and new (Mörner, e.g. 1991) recognition. The mode of

11
deformation and rheolgical parameters are further discussed elsewhere (Mörner, 1979a, 1980a, 1990, 1991, 2003).
Fig. 6. Maximum absolute uplift according to Lidén (C) and Mörner (A-B). The centre of uplift started to go up some 3000 years prior to the free-melting of the area (from Mörner, 1991). Furthermore, the uplift is composed of two factors (A and B). 7. Melting energy The ice recession is a function of the balance between ice flow and ice melting. The melting of the ice can take its energy from the air, from the sea and from the subglacial heat flow (Fig. 7). The mere fact that the Swedish esker systems represent a hydrological drainage system (at high hydrostatic pressure) at the base of the thick ice sheet and in subaquatic position (below the geoid level), indicates that basal melting must be the main source of energy (Fig. 7). The variations in the rate of deglaciation, in the supply of material for the building up of the eskers, and in the rhythmicity of the esker centers and varve thicknesses, suggest that the basal melting, in fact, was time variable (Mörner, 1984a). This phenomenon is not yet properly investigated, however. 8. The eskers The eskers are characteristic feature in the Swedish landscape. As huge serpents are they winding over 10s of kilometers. They carry stones from distant outcrops. They consist of sand, gravel, stones and sometimes even big boulders. The material is very well rounded and sorted. This fact together with the size of stones and boulder, give evidence of a very high hydrostatic pressure. The successive positions of the receding ice margin are marked by a halt during the winter recorded by an esker centre of extra course and much material, lateral terminal moraines along the ice margin and the ending of each separate varve Day 4).

12
Fig. 7. Melting energy and dynamics of an ice margin receding in water (e.g. the Baltic). The basal drainage can only come from basal melting. The geoid potential surface prevents surface water to sink deeper down. Ice recession may amount 200-300 m/year. 9. The varves In response of the rhythmic melting of the glacial ice during one year and the seasonal changes in open water condition and frozen over water surface, the glacial clay and silt are annually varved (unless deposited in marine water). The proximal varves exhibit an alternation between finer clay units of the winter season and coarser units of the summer season when melting was strong. More distal varve exhibit color alternations between darker winter units and lighter summer units. Coarser material within distal varves represents turbidites. Some turbidites represent drainages of local ice lakes in the vicinity. Other turbidites may represent paleoseismic events. This is especially true, if the turbidites extends over different drainage basins (Mörner, 1985, 1996, 1999b, 2003; Mörner et al. 2000). Because of the rhythmic variations in snow melting and river water discharge, the river valley deposits in Norrland also exhibits an annual varving (Lidén, 1913; Cato, 1987). Some lakes have such a high rate of sedimentation and so much influence of annual variability that the gyttja becomes varved. These lakes are ideal archives for a variety of different studies; like environmental evolution (e.g. Renberg, 1978), uplift (Renberg & Segerström, 1981; Cato, 1992) and paleomagnetics (Mörner & Sylwan, 1989; Sun, 2005).

13
10. The varve chronology The Swedish Varve Chronology was developed and “invented” by De Geer (1912, 1940). The first observations by De Geer were made in 1984. When he, in 1904, found correlatable varve diagrams from the other side of the Stockholm esker, he became convinced of the potential of the method. At the International Geological Congress in Stockholm in 1910, he was able to present the first chronology of ice recession (De Geer, 1912). To begin with, the chronology started with a zero-year marking the “drainage of the central Jämtland ice lake”. Later, Lidén (1913, 1938) was able to utilize the postglacial river varves and connect the zero-varve to the present, a connection that was revised by an additional 365 varves by Cato (1987, 1998). This means that Sweden is now in the possession of a quite accurate varve chronology extending some 11,000 varves back in time, maybe even up to 12,000-13,000 varves. Fig. 8 gives the deglaciation of Sweden in the context of the Swedish Time Scale. This means that we may have an annual (maybe even seasonal) resolution despite ages in the order of 10,000 years. This has been utilized, with great success, in our paleoseismic studies (e.g. Mörner, 1996a, 2003; Tröften & Mörner, 1997; Tröften, 2000).
Fig. 8.The vanishing of the Late Weichselian ice cap and its varve dating for the last ~13 Ka along the Swedish–Finish coasts of the Baltic (modified from Lindström et al., 1991).

14
11. End moraines We may speak about two different types of “end moraines”: the annual terminal till ridges marking the annual winter position of the ice margin (these are often, especially in Canada, termed “De Geer moraines”) and the ice marginal deposits, of till as well as of stratified drift, of longer halts in the ice recession (like the Younger Dryas end moraine zone). 12. Drumlins Drumlins are erosion remains or sediment accumulations that are streamed in the ice flow direction. Hence, they are perpendicular to the ice front. In the Umeå area (Day 1), there are numerous drumlins. 13. Glacial striae When the ice flows over the bedrock, it polishes and scrapes the bedrock surface. We can identify a stoss-side and a lee-side (“roche moutonnée”). The stoss-side is scoured and scraped by pebbles and stones frozen into the ice flowing over the bedrock. Those marks are known as glacial striae. In some way, this “sets a zero” for dating later fracturing and faulting of this surface. This simplifies our interpretations in paleoseismics and neotectonics. The glacial striae are predominantly cut in the zone just inside the ice margin. This has become evident when one compares local swinging patterns in the ice front recession established by varve chronology and the successive turning of glacial striation as illustrated in Fig. 9.
Fig. 9. Glacial striae (red dots with directional lines) of different relative age (youngest, medium and oldest) can be extrapolated to corresponding ice marginal positions (blue dashed lines) indicating that the youngest are cut a few km inside, the medium some 5-10 km inside and the oldest some 10-20 km inside the ice margin (modified from Strömberg, 1971). This is of great significance for our dating of recorded deformations of the bedrock surface.

15
14. Paleoseismicity Today the Fennoscandian Shield is characterized by low-to-moderate seismic activity. At least three significant events are recorded in historic time; M>4.8 in 1497, M>5.3 in 1759 and M>5.4 (maybe M~6.0) in 1904. At the time of deglaciation the situation was totally different (Mörner, 1985, 2003, 2004, 2005). At that time, Sweden constituted a high-seismic area; both in amplitude (>8 M events) and frequency (5 successive events with a ~20 year spacing). A total of 58 events are recorded today (Fig. 10). There is a clear maximum (~50%) in the time range 9–11 vBP. For a meaningful seismic hazard assessment, it is vital to include also the paleoseismic records. This is evident from the observed maximum magnitude at different time units; viz. M<4.5 for the instrumental records of last century, M<5.5 for the historical records of the last 600 years, M~7 for the paleoseismic records of the last 5000 years, and M>>8 for the paleoseismic records of the last 12,000 years. During this excursion, we will explore several of the imprints left by the paleoseismic events (faults, fractures, “blown-up” bedrock hills, liquefaction, sliding, turbidites, seismites, tsunami beds). Fig. 11 gives the distribution of paleoseismic index sites and seismic recurrence diagrams from five key areas (Mörner, 2003, 2004) with 5 events in the Umeå region (Day 1), 7 in the Hudiksvall area (Days 2-3), 5 in northern Uppland (Day 4), 14 in the Mälardalen region (Day 5) and 13 on the West Coast (Part B). The Late Holocene events are discussed separately in view of myths and improved seismic hazard assessments (Mörner, 2007, 2008a). The relation between paleoseismics and explosive methane venting (at hydrate/gas transformation) is discussed on Days 2 and 3 in relation to Stops 2-3 and 3-2.
Fig. 10. Time distribution (per 1000 years) of the 58 paleoseismic events recorded and dated in Sweden by late 2007 (cf. Mörner, 2003, 2008a). The maximum at 11-9 Ka BP coincides with the maximum rate of glacial isostatic uplift.

16
Fig. 12. Paleoseismicity as recorded at 26 sites in Sweden (Mörner, 2003) and the seismic recurrence diagrams (the cumulative number of events vs time of events) of five main regions (Mörner, 2003, 2008a). Blue dots denote tsunami events (Mörner, 1999c, 2008a, 2008b). 15. Climate Southern Scandinavia is a classical area for the study paleoclimate. The Bölling–Older Dryas–Alleröd–Younger Dryas sequence of the Late Glacial was defined here. So was the classical subdivision of the Holocene into Preboreal, Boreal, Atlantic, Sub-Boreal and Sub-Atlantic periods. The pollen analysis was founded in Sweden (von Post, 1916). In 1938, Fromm was able to combine pollen analysis with Lidén’s varve chronology in the Ångermanland river valley, so that exact ages could be assigned to the pollen zonation (Fromm, 1938). This was, of course, a remarkable achievement. In the 18th century, Celcius started his air temperature readings in 1722. In view of the global warming discussions, it is interesting to note that the early 18th century was as warm as it is today. In 1756/58 daily readings began at the Stockholm City Observatory from where we have a continual sequence up to today (e.g. Moberg, 1996; Mörner, 1984b). When von Post and Granlund (1926) made a general survey of the peat resources in Sweden, they discovered a periodic recurrence of surfaces when the bogs had dried out due to low
17
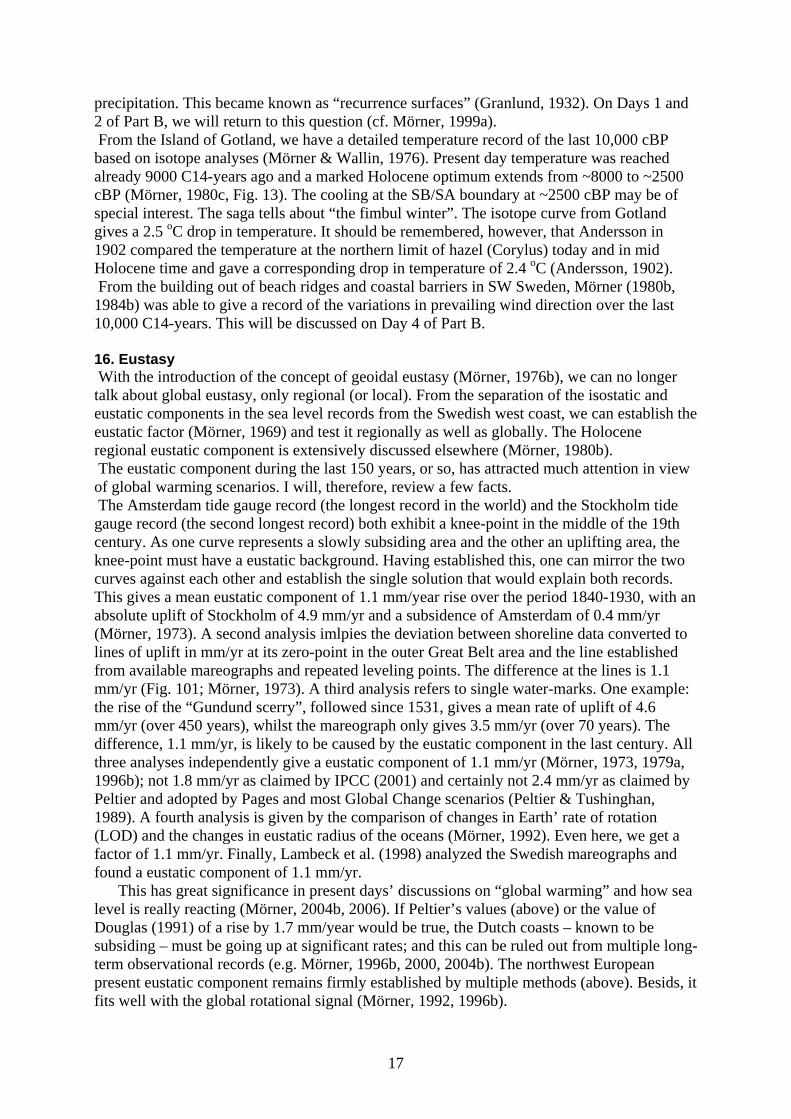
precipitation. This became known as “recurrence surfaces” (Granlund, 1932). On Days 1 and 2 of Part B, we will return to this question (cf. Mörner, 1999a). From the Island of Gotland, we have a detailed temperature record of the last 10,000 cBP based on isotope analyses (Mörner & Wallin, 1976). Present day temperature was reached already 9000 C14-years ago and a marked Holocene optimum extends from ~8000 to ~2500 cBP (Mörner, 1980c, Fig. 13). The cooling at the SB/SA boundary at ~2500 cBP may be of special interest. The saga tells about “the fimbul winter”. The isotope curve from Gotland gives a 2.5 oC drop in temperature. It should be remembered, however, that Andersson in 1902 compared the temperature at the northern limit of hazel (Corylus) today and in mid Holocene time and gave a corresponding drop in temperature of 2.4 oC (Andersson, 1902). From the building out of beach ridges and coastal barriers in SW Sweden, Mörner (1980b, 1984b) was able to give a record of the variations in prevailing wind direction over the last 10,000 C14-years. This will be discussed on Day 4 of Part B. 16. Eustasy With the introduction of the concept of geoidal eustasy (Mörner, 1976b), we can no longer talk about global eustasy, only regional (or local). From the separation of the isostatic and eustatic components in the sea level records from the Swedish west coast, we can establish the eustatic factor (Mörner, 1969) and test it regionally as well as globally. The Holocene regional eustatic component is extensively discussed elsewhere (Mörner, 1980b). The eustatic component during the last 150 years, or so, has attracted much attention in view of global warming scenarios. I will, therefore, review a few facts. The Amsterdam tide gauge record (the longest record in the world) and the Stockholm tide gauge record (the second longest record) both exhibit a knee-point in the middle of the 19th century. As one curve represents a slowly subsiding area and the other an uplifting area, the knee-point must have a eustatic background. Having established this, one can mirror the two curves against each other and establish the single solution that would explain both records. This gives a mean eustatic component of 1.1 mm/year rise over the period 1840-1930, with an absolute uplift of Stockholm of 4.9 mm/yr and a subsidence of Amsterdam of 0.4 mm/yr (Mörner, 1973). A second analysis imlpies the deviation between shoreline data converted to lines of uplift in mm/yr at its zero-point in the outer Great Belt area and the line established from available mareographs and repeated leveling points. The difference at the lines is 1.1 mm/yr (Fig. 101; Mörner, 1973). A third analysis refers to single water-marks. One example: the rise of the “Gundund scerry”, followed since 1531, gives a mean rate of uplift of 4.6 mm/yr (over 450 years), whilst the mareograph only gives 3.5 mm/yr (over 70 years). The difference, 1.1 mm/yr, is likely to be caused by the eustatic component in the last century. All three analyses independently give a eustatic component of 1.1 mm/yr (Mörner, 1973, 1979a, 1996b); not 1.8 mm/yr as claimed by IPCC (2001) and certainly not 2.4 mm/yr as claimed by Peltier and adopted by Pages and most Global Change scenarios (Peltier & Tushinghan, 1989). A fourth analysis is given by the comparison of changes in Earth’ rate of rotation (LOD) and the changes in eustatic radius of the oceans (Mörner, 1992). Even here, we get a factor of 1.1 mm/yr. Finally, Lambeck et al. (1998) analyzed the Swedish mareographs and found a eustatic component of 1.1 mm/yr. This has great significance in present days’ discussions on “global warming” and how sea level is really reacting (Mörner, 2004b, 2006). If Peltier’s values (above) or the value of Douglas (1991) of a rise by 1.7 mm/year would be true, the Dutch coasts – known to be subsiding – must be going up at significant rates; and this can be ruled out from multiple long-term observational records (e.g. Mörner, 1996b, 2000, 2004b). The northwest European present eustatic component remains firmly established by multiple methods (above). Besids, it fits well with the global rotational signal (Mörner, 1992, 1996b).

18
Excursion Route and Road Log The excursion makes a huge traverse over most of Sweden, from Umeå in the north to Båstad in the south. It means through the centre of uplift (the High Coast) out to the periphery of uplift with multiple Holocene sea level oscillations. Sweden has recently become a country known for its multiple high-magnitude paleoseismic events in the last 12 ka. The excursion passes all the main sites, discussing 5 events around Umeå, 7 around Hudiksvall, 5 in Forsmark area, 14 in the Mälardalen area and 13 on the Swedish West Coast. Science will be linked to scenic impression and cultural evolution. We will have 8 over-night places, all of special flavour and cultural impact, some with a smashing location.
Fig. 12. Location of over-night places; 1-6 during Part A and 7–10 during Part B.
Excursion Stops The excursion spans 5 and 4 days for Parts A and B, respectively. Each day will include several stops (Stop No 1:1, etc.) and a number of on-route information or “bus window geology” (BWG), all described below. Each morning will begin with a morning gathering when the program of the day is given a short overview (with power-point presentation).

19
Excursion Part A Umeå: over-night at Bothnia Hotel Hotel Bothnia is located rite at the banks of the Ume River and a few minutes walk from the Umeå airport. www.hotelbothnia.com, tel. 46–(0)90-135490, [email protected]
Day 1: July 30, Umeå to the High Coast
Introduction Umeå is an old harbour city located at the outlet of the Ume River. This river is eroded down in an old shear zone. The area contains most of the classical Quaternary morphological elements; a major esker, numerous drumlins, some end moranes (“De Geer moraines”), raised beaches, etc. Our itinerary for the Umeå region is given in Fig. 13.
Fig. 13. Location of Stops (red dots) and BWGs (red crosses) in the Umeå area (Day 1).
Bergström (1968) established a local varve chronology of the region and was able to reconstruct the deglaciation. Umeå was deglaciated at around 9500 vBP. The highest Baltic level (BL/ML) was in the order of +260–265 m. The shorelevel displacement has, in this area, been reconstructed in an interesting and unusual way (Renberg & Segerström, 1981; Segerström & Renberg, 1986). Some of the lakes in this area exhibit a rhythmic lamination that represents annual varves. These varves began to be formed when the basin had become a separate lake; i.e. had become isolated from the Baltic basin. Because the elevation of the lake thresholds can be determined and the varves counted, a general sea level curve of the area could be established (not taking isobase differences into account). In Fig. 14, the five lake dates of Segerström & Renberg (1986) have been combined with the ML/BL level, the PL level and the present rate of uplift (BWG 1). One of the key points – Kassjön – will be discussed in the field (Stop 1-2). Five paleoseismic events have been recorded in the Umeå area (Mörner, 2003), viz at 9428 vBP, 9191 vBP, ~9150 vBP, ~6500 vBP and ~4000 cBP. The first three can be tied to the ice recession and varve chronology (Bergström, 1968). The 4th and 5th are dated with respect to the shorelevel displacement curve (Fig. 14). The 4000 cBP event was linked to a tsunami.

20
Characteristics: Max uplift ~750 m Deglaciation ~9500–9400 vBP ML/BL-level 260-265 m 9300 cBP (AL) ~260 m 7000 cBP (PL: PTM-2) ~120 m 2600 cBP (PTM-7) ~25 m Relative Uplift 9.0 mm/yr Paleoseismic events 5 events Paleoclimate Fig. 18
Fig. 14. Shorelevel displacement curve of the Umeå area (from Mörner, 1999b) with the time/elevation points of the 5 paleoseismic events added.

21
BWG No 1–1: the river delta and a medieval harbour in view of uplift The present relative rate of uplift is 9.0 mm/year, implying quite rapid and drastic changes in land/sea configuration with time. The absolute rate of uplift is 10.0 mm/year for the last 550 years as recorded from old harbour positions in 1350 and 1550. The delta of River Umeälven is continuously expanding through land uplift and sedimentation (Fig. 15). Every year this delta area increases by about 5 acres. Storsandskär and the other islands downstream have been created since the town of Umeå was founded in 1622. Today, most sediment is being deposited in the bay of Österfjärden and in 400 years this entire water surface should be transformed into delta land.
Fig. 15. Land/sea changes of the Ume delta recording a relative uplift of 9.0 mm/year. The Baggböle site is located just off the map in the NW corner.
Downstream Baggböle manor is probably the remaining part of the first harbour in Umeå. We believe it was used by a Hanseatic merchant Könik Skarlakan who lived in the village of Kåddis in the 14th century. In the 16th century the mighty merchant Könik Olsson had his farm in Baggböle overlooking the harbour, which then was a part of the river estuary with brackish water. Könik Olsson made business with the cities on the German Baltic coast. His son, Petrus Kenicius was appointed Archbishop in Sweden 1609, and as such he crowned king Gustavus II Adolphus. We obtain two entries to our sea level curve (Fig. 14); viz. a shoreline at +6.8 m with landing place or harbour at the time of Könik Skarlakan from ~1350, and the pond level at +5.0 m that seemed to have been a harbour (with some estuary pounding) at the time of Könik Olsson from around 1550 (Sjöberg & Johansson, 1996).

22
Stop No 1–1: Röbäck gravel pits At Röbäck (Swed: “red brook”) south of the Ume River, there was a large gravel pit in the Ume-esker (today restored and gone except for a section left for scientific documentation). To the NW, there is a new pit in operation, however. We will discuss the findings in the old pit and observe similar structures in the new pit (Fig. 16).
Fig. 16. Location of the old (A) and new (B) gravel pits at Röbäck (esker marked in green). This site is a key site for liquefaction studies (Mörner 2003, 2005). In 1999, we found excellent liquefaction structures, which was a highlight at the 1999 international excursion on uplift and paleoseismicity (Mörner, 1999b). Later, I was able to tie the liquefaction event to one single varve in the varve chronology of Bergström (1968) providing an age of 9428 vBP. This was done both by the character of this marker-varve and by direct varve correlations via a new varve record obtained in Röbäck gravel pit (Mörner, 2003). In 2001, Mörner and Audemard studied the site in details. We recorded liquefied sand beds, venting structures, flame & sink structures, ball & pillow structures, collapse features and faulting, giving evidence of two separate phases of liquefaction (all well illustrated in Mörner, 2003 and 2005). In 2002, we returned and exposed an exceptionally nice mushroom structure in sandy sediments (Mörner, 2003), which became the subject of a separate study on magnetic characters (Sun, 2005; Mörner & Sun, 2008). We also found evidence of a quite violent Late Holocene paleoseismic event estimated at ~4000 cBP (Mörner, 2003; Mörner et al., 2003, 2008). In 2005, we cored a bog at +44 m elevation and recorded a layer that might represent a tsunami event (BWG 1-3). Similarly, there are some archaeological sites in the +40 m level that are covered by littoral sand in an unusual manner. Further records at Stop 1-6. The magnetic analyses of the sediments within the mushroom venting structure reveal fundamental facts with respect to differential grain behaviour and the character of liquefied sediments (Sun, 2005; Mörner & Sun, 2008). We were able to identify 3 different modes of flow pattern (Mörner & Sun, 2008, Table 2). (1) a laminar flow of sand and course silt particles giving bedding (visually observed), (2) a turbulent flow of AMS carrying silt-clay particles giving a random AMS distribution, (3) a free liquid flow allowing the ChRM carrying grains closely to orient with respect to the
earth geomagnetic field. This is the ultimate evidence that the proposed liquefaction structures were really created under fully fluid conditions (Mörner & Sun, 2008).
Stop No 1-2: Lake Kassjön at +84 m We stop at the western side with a view of the lake from where so much data have been obtained. To begin with, however, we explore a slide mark right beside the road. The slide

23
must have moved on land under subaerial conditions. The elevation is around +95-100 m. In the Lake Kassjön varved lake sediments, there are no traces of the slide. Therefore, it seems likely that the slide moved when sea was below +95 m but above +85 m. This is interesting, because right at the same time/elevation, we have a paleoseismic event recorded at Lidberget, 53 km to the south (Stop 1-6). If so, the slide might have been driven by ground shaking. Lake Kassjön has been studied in details by the research group headed by Ingmar Renberg at the Institute of Ecological Botany of Umeå University (e.g. Renberg, 1978; Renberg & Segerström, 1981). The lake is annually varved. Some 6300 varves have been counted. The outlet threshold is at +83 m. Hence, it provides a bench for the uplift reconstruction (Fig. 14). Mörner & Sylwan (1989) have measured the paleomagnetic short-term changes in inclination, declination and relative intensity in a core taken in the centre of the lake and including 6300 horizontally bedded varves. Core take at the northern edge (Mörner & Tarling, 1995 and unpubl.) show alternations in clay/gyttja deposition, sensitively recording of climatic changes during the last 2700 years (Fig. 17). The paleomagnetic records (Mörner & Sylwan, 1989) include a drastic declination swing at around 2700 vBP (Fig. 18). This swing has been C14-dated (in the 10 samples recording the swing) showing that the swing in declination coincides with the strong atmospheric 14C spike implying a causal connection (Mörner, 2003b, unpubl.).
Fig. 17. The Lake Kassjön sedimentary record with a mean rate of sedimentation anchored by the isolation level 6300 vBP, the climatic SB/SA boundary at ~2700 vBP and the 1902 level marked by a clay layer from the digging of a ditch in this year.

24
Fig. 18. The 6300 years paleomagnetic varve record of Mörner & Sylwan (1989) here re-plotted and supplied with peak-feature by Sun (2005). The peak f–e change amounts to a westward swing in declination of 117 degrees. The same 10 samples were C14-dated indicating that this geomagnetic swing coincides with a major atmospheric 14C spike, providing new perspectives on the SB/SA change in climate (Mörner, 2003b).
BWG No 1-2: the PL level at +120 m at Tavelsjö We pass a slope in the road due to an ancient shore make, and in front of the bus, we view a flat sedimentary sedimentary surface on the island in the lake. Both forms are consistent with a sea level at around +120 m. This level represents the “Postglacial Limit” or “Littorina Limit” (i.e. the PTM-2 level) of an age of 7000 cBP or 8000 vBP (Fig. 14).
Stop No 1-3: Tavelsjö ice marginal position and the 9428 vBP paleoseismic event At Lake Tavelsjön, we can trace the ice marginal position at the time of the 9428 vBP paleoseismic event partly in the esker morphology below water level (Fig. 19; Sjöberg, 1995) and partly in the bedrock feature of Mt. Tavelsjöberget (Fog. 20; Sjöberg, 1995). We are making two stops at this place (marked a and b in Fig. 19). Lake Tavelsjön is crossed by an esker. The morphology below the lake water is shown in Fig. 19. This reveals an unusual pattern, which we subscribe to the 9428 VBP paleoseismic event. Where the lake narrows (dividing the lake in two bodies), there is a drastic change in the esker formation. In the SE, a typical esker with 10 identifiable esker centres (denoting annual winter halts) serpentines over the bottom for 5 km. To the NW, there is a break in the esker formation for 2 km and the bottom topography is instead characterized by furrows and channels from collapsing subglacial esker tunnels (in our interpretation). This change in the esker formation is, in our opinion, the result of the year 9428 vBP paleoseismic event. This fits perfectly well with the configuration of ice recession (further below, Fig. 21). Therefore, we assign an age of 9428 vBP to the ice marginal position at the change in esker formation. The situation is illustrated in Fig. 19. To the west of point b, there is a high bedrock hill, Mt. Tavelsjöberget, with an elevation of +300 m; i.e. reaching just above the highest coastline at +260 m. At the time of the paleoseismic event, it seems to have emerged as a nunnatakk with an ice lake off its more than 100 m high northern scarp (Sjöberg, 1995). At the paleoseismic event, a huge scree (Fig. 20) went into the narrow ice lake between the mountain and the ice as proposed by Sjöberg (1995). Consequently, this scree (Fig. 20) and the change in esker formation (Fig. 19) tell the same story; viz. the occurrence of a major earthquake (cf. Fig. 21).

25
Fig. 19. The Lake Tavelsjön sub-aqueous bottom topography recording a significant break between a normal esker system (green) and a collapsed esker tunnel (purple). This point is proposed to represent the ice marginal position of 9428 vBP when a major paleoseismic event occurred (as recorded by the liquefaction structures in Röbäck and Tobacka; Mörner, 2003) like, after realizing the occurrence of a seismic event, also in 14 varve sequences (Bergström, 1968; Mörner, 2003). The esker morphology show the occurrence of 10 eskercentres, which are likely to represent 10 annual winter halts (red lines).

26
Fig. 20. Observed scree deposits at Tavelsjö and model of deposition (from Sjöberg, 1995).
Summary of the 9428 vBP paleoseismic event We are now in the position to summarize the situation at this paleoseismic event. Extensive liquefaction horizons in Röbäck and Tobacka are both properly varve-dated at the sites (Mörner, 2003). From Bergström (1968) we obtain additional 14 varve sites providing a firm date of 9428 vBP of a major paleoseismic event. The spatial distribution of sites affected is in the order of 60x30 km, suggesting a possible earthquake magnitude in the order of M 7.0–7.5 (Mörner, 2003). The position of the ice margin is quite easily reconstructed from the proximal varves at Tobacka, the varve equicesses of Bergström and the ice marginal position found at Tavelsjön (Fig. 21). No epicentre, is so far recorded. BL was at about +260 m.
Fig. 21. Ice cover (green), main sites (red) and varve sites (blue) at the 9428 vBP event.

27
Stop No 1-4: Botsmark ice marginal position and the 9291 vBP paleoseismic event At Botsmark, a clear postglacial fault has been identified and mapped (Lagerbäck, 1991; Sjöberg, 1996b, 2004). It seems to represent the continuation of faults in the Skellefteå-Boliden region (Rodhe et al., 1990; Svedlund, 2001), constituting the “Botsmark–Burträsk Fault” (Mörner, 2005). The intensive liquefaction at Tobacka dated at about 9293 vBP seems to be a correlative effect (Mörner, 2003) with an uncertainty in the varve counting of 4 varves (i.e. 9293-9289 vBP). The varve record of Bergström (1968) includes a signal at 9 sites that is likely to reflect this shaking event. The age is 9291 vBP, fitting perfectly well with the age obtained in Tobacka. Therefore, we now assign an age of 9291 vBP to this paleoseismic event (a shift of 2 years with respect to the age given in Mörner, 2003 and 2005). In order to combine the ice recessional line of varve 9291 BP with the ice margin at Botsmark at the time of the seismotectonic event, there need to have been a small ice-lobe in the area between (which seems to fit with other data as striae). The proposed situation is illustrated in Fig. 22. Just west of Botsmark, there are some immense erratic blocks (estimated at 7300 m3) and claimed to be the largest erratic blocks in the world. The blocks must have been transported just for a short distance (sharp edges) and the breaking-loose of the blocks may well have been initiated by the 9291 vBP earthquake when the ice margin was shortly outside. The fault scarp at Botsmark is in the order of several metres and runs as the Botsmark–Burträsk Fault for many tens of km, indicating a high magnitude causation event. The violent liquefaction venting at Tobacka lies some 60-70 km away from the fault movement at Botsmark (whether representing the epicentre or not), which would imply a magnitude in the order of M 7.5 (cf. Mörner 2005).
Fig. 22. The situation at the paleoseismic event in varve 9291 vBP. Ice cover (green), land area (brown), key sites (red) and sites of varve dating (blue). At Botsmark, there is a clear fault (red dot) with several additional features (red crosses); viz (from NO to SW): two earth slides, a secondary fault, two rock slides with cave formation, a site of liquefaction and the huge “Botsmark Eratic Blocks”. At Tobacka, violent liquefaction venting is recorded. This paleoseismic event is dated by varves at 9291 vBP.

28
Fig. 23. The Spänningberget Fault. Above: The hill is divided by a 10 m scarp with a flat, down-faulted bedrock surface outside (yellow wedge). The down-faulted surface is cut up in blocks by minor en echelon faults and lateral fractures. There are no traces of littoral abrasion. Below: Between the fault scarp and the down-faulted block, there is a furrow or fault trough. An oblique fault fracture exhibits a strongly fractured surface and large angular block beneath, all lacking traces of littoral abrasion. This indicates that the fault moved when the Baltic level was further below.
Stop No 1-5: the Spänningberget Fault and the ~9170 vBP paleoseismic event At the preparation of this excursion in 2007, we suddenly saw a hill – “Spänningberget” – that exhibited clear faulting feature (Fig. 23). The scarp is about 10 m high. At the foot of the scarp there is a 20 m wide depression (Fig. 23, below), indicating that the down-faulted block has moved both downwards and outwards along a dipping plane. The down-faulted block is cut by en echelon faults and lateral fractures. The fractured surfaces lack sign of littoral abrasion, indicating that, at the time of the faulting, the Baltic level had fallen further below. The depression seems to have acted as a drainage channel, and alluvial material seems to have been deposited at around +200 m. In the slope beside this drainage, there are well rounded beach material at +240 m below angular blocks from the fault movement. When the fault moved, the Baltic level must have been well below +240 m, and probably at +200, maybe +220 m. From the rate of uplift (Fig. 14), this would imply an age in the order of 9170 vBP, which is the age we assign to this paleoseismic event. On the opposite side of the valley, there is a well-exposed BL-shore at +260 m. We note that the immense Botsmark erratic blocks have been subjected to a second phase of fracturing, at a time when they had emerged out of the sea (+235-240 m). Consequently, this fracturing might have been driven by the ground shaking at the 9170 vBP event.

29
BWG No 1-3: bedrock fracturing of “Ernst Knalle” We pass in the neighbourhood of an interesting bedrock hill, Lilla Gårdsberget or “Ernst Knalle” (N 64°5´24.85¨, E 20°25´30.24¨), exhibiting a double phase of fracturing; viz. a first fracturing in subaqueous environment when the blocks were thrown in direction S30-40oW (these fractures and caves were later exposed for a strong littoral abrasion), and a second phase of fracturing when the area (base level at +105 and +95 m) had been lifted out of the sea and when the blocks were thrown in direction N20-40oW with a total absence of littoral abrasion (i.e. sea must have been, at least, below +105–95 m). See Stop 1-6 (Fig. 27). BWG No 1-4: the tsunami bed in the +44 m bog N of Umeå Just north of Umeå, we cored a bog (X = 70.97085, Y = 17.20178) at +44 m in the search of a possible tsunami bed related to the paleoseismic event recorded in the Röbäck gravel pit (Stop 1-1; Mörner, 2003). At a depth of 5 m there is a 22 cm layer of fine sand with lacustrine clayey gyttja above and gyttja clay below (Fig. 24). At the base (6.2–7.2 m), there is 1 m of deformed varved clay dipping at ~45o. The basal 1.0 cm of gyttja on top of the sand was C14-dated at 4310 ±40 cBP.
Fig. 24. The stratigraphy of the +44 m bog including a sand layer that is likely to be a tsunami bed of the paleoseismic event recorded at Röbäck and Lidberget (Stops 1-1 and 1-6). BWG en route From Umeå to the next stop we have a fairly long drive. We note the typical “Norrland landscape”; a relatively flat coastal area with sandy deposits, drumlins, large flat “Norrland bogs”, river valleys cut down into the surface with successive delta plains and meanders, lakes and views of the mountains in the distance. If time allows, we will stop at Torsmyran (+50 m) where there is a special viewpoint over the Torsmyran bog.

30
Stop No 1-6: the Lidberget caves and paleoseismic events Lidberget is a bedrock hill reaching up to around +200 m. It is located just west of Aspeå (Lödgeå) 2 km west of the highway E4. At the nearby Storrisberget, the situation is the same. At these sites, there are three different morphological features of special interest: (1) pot holes formed beneath the ice shortly before deglaciation, (2) typical shore caves (tunnel caves) described by Sjöberg (1982), and (3) deep fractures and fractured-off blocks lacking signs of littoral abrasion. The difference between the well rounded littoral material and the angular, fractured-off blocks is evident in the field (Fig. 25), and has a story to tell (Mörner et al., 2008).
Fig. 25. On the hill slopes of Lidberget (and Storrisberget) there are well-rounded blocks from the littoral zone (A) and fractured bedrock surfaces and fractured-off blocks with angular and sharp edges (B) that lack signs of littoral abrasion. Consequently, the fracturing must have occurred when the surface was lifted out of the sea. The tunnel caves were eroded when the sea level was at the foot of the caves. The littoral abrasion is clear. At the sides and just outside the caves, however, there are sharp-edged blocks that have not been exposed to littoral abrasion. Obviously, the fracturing took place shortly after the shore abrasion of the caves. Three of the caves have their base level at +90 m, a level, which in the sea level curve would correspond to 6680 vBP (Fig. 14). The fracturing of the bedrock is extensive. It is partly seen in a number of open fractures that can be followed some hundred meters up the slope, and partly as the fracturing-off of blocks with a concentration in the +90-100 m zone and occasional blocks further down/out. At +78 m, there is a nice shingle beach from restored normal littoral conditions. Therefore, the moment of fracturing can be fixed to a time when sea level was at +85 ±5 m, which corresponds to a time of 6460 ±220 vBP (Fig. 14). The origin of the fracturing is proposed to be a high-magnitude paleoseismic event (the 4th in the Umeå region).

31
In the downhill slope (below +78 m), there are traces of littoral abrasion and shore deposits. There are also occasional big blocks from the fracturing event. These blocks, however, are rooted in the littoral material and have even adopted some secondary signs of abrasion. There are some traces of fresh fracturing, and at about the level +50–45 m, there is a new zone of fresh fracturing ending in a littoral sedimentary plane at about +40 m. This second phase of fracturing co-insides in altitude with the liquefaction event recorded in Röbäck (Stop 1-1) and with the probable tsunami bed in the +44 m bog (BWG 1-3).
Fig. 26. The deep and fresh fractures (red lines) and location of littoral tunnel caves (blue dots). Two fracturing levels are easily seen in the orienteering maps of the Lidberget area; one very distinct in the level ending at about +85 m, and one less distinct at +50-45 m. The new maps prepared by the local orienteering society (Högåkers OK, 2006) give a very good record of the topography of the Mt. Lidberget (Fig. 26). The two levels of fracturing – around +85 m and +45 m – are fairly easily identified. So are the deep fractures. In the hope of obtaining stratigraphic records of the fracturing events, we tried to core bogs and ponds in the sedimentary plane below. In all cases we had to stop a few tens of cm below the surface in thick sand deposits. In Lake Svartsjön, 1.8 m of detrital gyttja covers a sand layer that perhaps might be a seismite. The base was dated at 7075 ±215 cBP, however. In conclusion, the Lidberget site seems to record two paleoseismic events in the fracturing of the bedrock. The first event occurred when the sea level was in the order of +85 m, and the second when it was in the order of +45 m (cf. Fig. 14). The picture can be sharpened, if put into the context of the others sites in the Umeå region that record those events. Synthesis of the +85 m event There are 3 sites in the Umeå region, which should be considered with respect to a possible paleoseismic evet occurring when sea level was in the order of +90 m, viz. Lidberget, Kassjön (Stop 1-2) and “Ernst Knalle” (BWG 1-3). This is illustrated in Fig. 27. When analyzed together, it seems clear the sea level, at the time of the paleoseismic event, was at +90 ±5 m, which would correspond to 6680 ±220 VBP. The fracturing at Lidberget is severe, suggesting that we might be in the vicinity of the epicentre. The distance between Lidberget and Ernst Knalle is 100 km. Simultaneous fracturing over such a large distance calls for a high magnitude event (M >>7).

32
Fig. 27. Three sites, spaced 100 km apart, record a ground shaking that can be fixed to a time when sea level was in the order of +90 m (with an uncertainty of ±5 m) which implies and age of 6680 ±220 vBP (cf. Fig. 14). Synthesis of the +40-45 m event In Röbäck (Stop 1-1) there is clear evidence of a severe liquefaction event when sea level was in the order of +40 m (Mörner, 2003). In the +44 m bog (Fig. 24), there seems to be a tsunami bed. A tsunami wave might also been traced in the covering of some archaeological sites by littoral sand (Mörner, 2003). At Lidberget, there are traces of a second phase of fracturing when the sea level was in the order of +45 m (Fig. 26). BWG No 1-3: first view of Skuleberget Mt. Skuleberget is a famous “capped hill”, implying that the marine abrasion has washed away most of the sediments up to the highest level of wave actions – BL or ML – leaving a calotte of till on the very top of the hill. As trees are rooted in the till, the cap becomes visible from a long distance. We can simply see the Marine (Baltic) Limit from a distance of several km. From the road, the “capped” top of Mt Skuleberget is very clear (Fig. 28).
Fig. 28. The “capped hill” of Mt. Skuleberget with BL +284 (Stop 1-8) as seen from the road. Stop No 1-8: the Mt. Skuleberget ML at +284 m With a ski lift, we are being taken to the top of Mt. Skuleberget. We explore the traces of the highest limit of wave action; the +284 m mark (originally given as +294 m). This shore, cut some 9600 vBP represents the highest postglacial shore mark in Sweden (and after revision of the Canadial Arctic data, even the highest in the world).

33
We have a magnificent view of the surrounding areas. This area is known as “the High Coast” because, in this unique area, high mountains go all the way out to the very coast and then dipp steeply into the Ulva Deep at –250 m 25 km off the coast. The bedrock is highly variable. The high rate of uplift has set the character of the development of the area and the interaction with human settlement and habitation; in ancient time as well as in present day. This is why this area has been included in the UNESCO World Heritage List.
Fig. 29 (above) the capped hill of Hörnsten (1964) and (below) the variations in values of the washing limit all around the calotte indicating a prevailing wind direction from the SW.

34
Hörnsten (1964) made extensive studies of the highest coastline in the area, including the capped hill of Mt. Skuleberget. His study of the Fig. 29 capped hill of is educational (Mörner 1999b). He measured the “washing limit” at 64 points all around the hill (Fig. 29a). The variability in height is considerable. This is illustrated in an elevation plot of the values (Fig. 29b). The variability is in the order of 6 m. There is a strong peak at the SW side of the hill indicating the prevailing wind direction. The level of the highest actual mean sea level is hard to determine; somewhere in the order of +281-282 m seems reasonable. With a rate of uplift in the order of 30-40 cm/yr (p. 40; Mörner, 1979a, 2003), the total 6 m zone of Fig. 29b should have been left in 15-20 years. Hence, the maximum values in Fig. 29b represents the wave action of the very first year or years, whilst the lower part represents more and more years up to a maximum of 15-20 years at the base. Already, De Geer (1888) marked this area as the centre of glacial isostatic uplift. Hörnsten (1964) gave an isobase map of the height of BL (Fig. 30). There is a clear decrease in the 10 m isolines from +280 m in the east to +240 m in the west. Similar pictures have been given by all previous investigators of the area; back to De Geer (1888). This is the reason why the centre of glacial isostatic uplift has always been placed in the very coastal zone of Ångermanland. This has turned out to be an illusion, however (Mörner, 1999b, 2003) as shown in Fig. 1 above and further discussed tomorrow.
Fig. 30. Isobases of the highest coastline (BL) according to Hörnsten (1964). There is a clear dip westwards. The BL level is metachronous, formed in association with the receding ice. The true shorelines, however, are tilted from the west to the east as shown by Mörner (2003; Mörner, 1999b) and illustrated in Fig. 31 (below).
Höga Kusten: over-night at the High Coast Hotel “Hotell Höga Kusten” has a remarkable setting at the high mountain-side right at the new bridge over River Ångermanälven, this classical region in Swedish uplift history. www.hotellhoga-kusten.se, tel. 46–(0)613-722270, [email protected]

35
Day 2: July 31, the High Coast to Njutånger (Hudiksvall)
Introduction From the hotel we have a magnificent view over River Ångermanälven estuary. This area occupies a key position in Swedish Quaternary research. Here we have the classical uplift centre of De Geer (1888), the varve/uplift study of Lidén (1938) and the varve/pollen of Fromm (1938). In the close-by River Indalsälven, we have the zero-varve in De Geer’s Swedish Time Scale (De Geer, 1912, 1940; Borell & Offerberg, 1955) with its connection to the present via the River Ångermanlandälven studies of Lidén (1913, 1938) and successfully revised by Cato (1987). The old and new uplift curves of the area are given in Fig. 6 (above). Characteristics Total uplift 830 m of the area: Deglaciation 9600 vBP BL-level 284 m Postglacial uplift 284 +38 = 322 m Subglacial uplift ~830 –322 = ~500 m 9300 cBP (AL) +280 m 7000 cBP (PL: PTM-2) +135 m 2700 cBP (PTM-7) +30 m Relative Uplift 10 mm/yr Paleoseismic events yes Fig. 30 gives the paleogeography of the area at the time of deglaciation. In the River Indalsälven valley, De Geer (1912, 1940) established his zero-varve, and counted the varves all the way down to Stockholm. Later, Lidén counted the postglacial varves all along the River Ångermanlandälven by that connecting the Swedish Varve Chronology to the present. Fig. 31 gives Lidén’s (1913) classical section (supplied with English text) through the River Ångermanlandälven sediments; the successive on-lapping of varves in relation to the receding ice front, the lowering of the Baltic level and the successive off-lapping of postglacial river varves as a function of land uplift.
Fig. 31. Glacial varved clay on-lapping followed by postglacial off-lapping (Lidén, 1913).

36
In Fig. 32, I analyse the Fig. 30 BL data (Hörnsten, 1964) with respect to the relations between ML-gradients and shoreline gradients (Mörner, 1974) indicating that the shore must dip eastwards, and compare this with Cato’s revised varve dated delta surfaces and some isolation levels of varved lakes (Cato, 1992). This implies that the true centre of uplift was located further westwards (Fig. 1). Present day uplift data indicated tilting in the opposite direction. This suggests a different origin of driving forces (as stressed by Mörner; e.g. 1979a, 1979c) for the true glacial isostatic uplift and the present linear uplift (A and B in Fig. 6).
Fig. 31. Uplift and tilt: revised shoreline data from the Ångermanland area (Mörner, 1999, 2003). Ice recession at the base (from SE to NW).

37
The church of Nordingrå lies at the shore of Lake Vågsfjärden, today separated from the sea by an 0.8 m rapid. In the late 19th century, there was free access by boats for the church visitors. This gives firm evidence of an uplift rate in the order of 9 mm/yr. At Ulvön, there is an old water-mark from 1822 (Bergsten, 1954) giving a mean relative uplift of 9.0 mm/yr (114 cm in 126 year). According to De Geer (1940), the Nordingrå area has structural indications of former seismic events. We agree in this interpretation (e.g. Sjöberg, 1994; Mörner, 2003, 2004).
BWG en route south Between Härnösand and Sundsvall, we cross River Indalsälven. In the Indalsälven Valley, there was a catastrophic drainage of Lake Ragunda caused by a single man´s careless digging of a separate drainage in the year 1796 (Ahlmann et al, 1924). This drainage, however, gave excellent exposures of varved clay now forming the base in the Swedish Time Scale. In the year 1782, at 2 o’clock in the morning of Maj 23, the Liden area was struck by disastrous behaviour; there was a strong sound, the lake experienced tremendeous waves, the land surface fractured and slid, soft sediments “fermented” (Hellzen, 1782). It was interpreted in terms of an earthquake. Indeed, it seems to give a good description of an earthquake of significant magnitude with associated liquefaction (Mörner, 2003). Sundsvall is a very typical harbour city of Norrland with an old and strong timber/paper industry. The island of Alnön is known to represent an old intrusion. South of Sundsvall, we cross River Ljungan. From here, 210 km south, do we find evidence of an extensive turbidite representing the paleoseismic event in the varve year 9663 vBP (Mörner et al., 2000; Mörner, 1999b, 2003).
Stop No 2-1: Gnarp River section In the riverbank of River Gnarpån, there is a very informative section described in details by Mörner (2003, p. 159-166). Only some parts of the section are accessible today.
Fig. 33. Liquefied sand (E) with a Z-shaped venting pipe through the micro-varved clay (D), a surface mushrooming of the vented sand, and a thick (three-parted) turbidite (D) of the 9663 vBP paleoseismic event. Layer B is a horizontally bedded clay, varved in the lower part.

38
The section is composed of the following general stratigraphy (Fig. 33): A river sediments B clay, varved in the lower part C turbidite bed of sand and gravel (of the varve 9663 vBP event) D a deformed lower varved clay of at least 80 varves E sand, strongly liquefied (including unit D) Layers C, D and E record the 9663 vBP paleoseismic event (Mörner, 2003). Layer E is strongly liquefied and exhibits a large variety of liquefaction structures, including the prime liquefied sand layer that now is structureless, and into which covering layers have sunk down under deformation and fracturing, and out of which material has vented upwards.
Stop No 2-2: Hög gravel pit In Hudiksvall Esker, there is a large gravel pit at Hög. Here, we have an unusually complete and informative stratal sequence (Mörner et al., 2000; Mörner, 1999b, 1999c, 2003, 2005). The following stratigraphy was recorded: A1 1-2 m littoral to eolian sand A2 0.5 m beach shingle with a marked beach at about +68 m A3 1-3 m stratified regressional sand, with a vented bed at the base B1 0.2-0.4 m blue, unvarved Baltic clay B2 0.3-0.5 m micro-varved clay; ~420 varves counted C1 1-3 m sand of tsunami type (above) and liquefaction type (below) C2 0.5 m varved clay (vented by D) including 33 varves C3 3-5 m liquefied sand bed; 5 phases recorded, includes 3 varves D1 10-20 m esker sand and gravel, partly deformed and liquefied D2 >20 m esker deposits The main liquefaction event can be dated as to a single varve year as illustrated in Fig. 34.
Fig. 34. Dating of the paleoseismic event by correlating the liquefaction event in Hög with the turbidite of varve –424 (= 9663 vBP) in a nearby varve diagram (Mörner, 2003, p.133).

39
The remarkable liquefaction stratigraphy in the Hög gravel pit was discovered in 1997 and has been one of our key sites since then (Mörner et al., 2000; Mörner, 1999b, 2003, 2005). In 2000, Mörner and Audemard undertook a very detailed analysis of the site, including pains-taking cleaning of huge sections. The result documented in a series of colour photos (Mörner, 2003, p. 122-147). Two events were recorded and dated.
The 9663 vBP event The main event occurred right after the last varve in layer C2. It can be correlated with the turbidite varve (seismite) in a nearby varve record (Fig. 34). The layer C liquefied unit includes 5 separate liquefaction phases (A-E; Mörner, 2003, p. 144). The 5 phases represent, in our opinion, shocks and after-shocks of one and the same paleoseismic event. This implies that the magnitude must have been high, bearing in mind that after-shocks usually are one order of magnitude weaker than the main shock. When the entire area of liquefaction, turbidite spreading, the area of bedrock fracturing and the character of fault movements is considered, a magnitude in the order of M ~8 to >8 seems likely (Mörner, 2003, 2004, 2005). The 6100 cBP event The sand and coarse gravel of layer D was, to our surprise, found to have vented through the layer B clay and spread laterally (a layer of sand, gravel and clay balls) in the lower part of the regression sand at a position which would equal a shore level of about 6100 cBP. Venting of coarse gravel implies a very high seismic magnitude or M >>8 (Mörner, 2003). This event was later documented also by slides (including one 100 km away) and tsunami beds with a run-up of at least 15 m and even the covering of an archaeological site with littoral sand. Stop No 2-3: The Boda Cave The Boda Cave is probably the most impressive bedrock cave in Sweden (Sjöberg, 1994). It was subjected to a multi-parameter survey, including detailed mapping, geophysics and deep drilling. Our aerial photo gives a good view of surface topography (Fig. 35).
Fig. 35. The surface of the Boda Cave, consisting of huge angular blocks that has moved both anti-gravitationally and against the ice flow direction (Mörner, 2003).

40
The Boda Cave consists of a subsurface cave system of over 2.6 km’s length (closely mapped by Sidén). The fracture pattern of the surface and of the subsurface agrees well, both with two predominant perpendicular directions. Deep drillings of 100-180 m’s length suggest that the fracturing continues, at least, 100 m down (Mörner, 2003). No doubt, the fracturing of the bedrock must have happened after ice had left the site. The age of deformation must be postglacial (Sjöberg, 1994). With the identification of varve -424 (= 9663 vBP) as a true seismite (Mörner, 1999b; Mörner, et al., 2000), we know (from the varve chronology of Strömberg, 1989) that this event took place 65-70 years after the free-melting of the Boda area. This fits perfectly well with the character of the Boda Cave. Fig. 36 gives two actually measured profiles across the Bada Cave surface (from W to E) and the proposed reconstruction of deformation from a smooth pre-existing roche moutonnée surface (Mörner, 2003). The main motion is an original explosive extension followed by a second collapse back (a scheme which we have documented all over Sweden). This motion is also recorded by some of the individual blocks and fractures.
Fig. 36. Two W–E profiles across the north-central part of the Boda Cave surface (by Zykov). In both profiles two surfaces are given; the heavily dissected surface today (above) and the proposed original surface (below). Dark hatching gives glacially polished and striated surfaces. Green arrows give the ice flow direction. Arrows give proposed direction of motion. A main question was what the Boda Cave fracturing actually represents: viz. (1) the epicentral area with the interaction of primary and secondary forces, or (2) a more distal area only affect by secondary seismotectonic forces. This was vividly discussed at the 1999 International Excursion (Mörner, 1999b). Fairly early, we were able to discard the first alternative. This was further supported by the discovery of the direction of turbidite sand deposition (Stop 2-4). With the finding of the Falkberget Fault, the epicentral area was located. The Boda Cave is located 12 km away from the primary fault. Still, the bedrock is heavily fractured, and in other sites, it continues over a distance of 40 km (Mörner, 2003). The mode deformation is further discussed in Mörner (2003, p. 70-75); the shock-wave and its effects on the banking planes and a number of centres of methane venting as illustrated in Fig. 37.

41
Fig. 37. Mechanism proposed by Mörner in order to explain the heavy fracturing per se, and the occurrence of a number of fracturing centres as far as 12 km from the epicentre. The idea is that the seismic wave kicked methane hydrate to change phase into methane gas, which would generate explosive venting of methane (Mörner, 2003). BWG No 2-1: the Boda earth slide Just west of the Boda Cave hill, there is a flat area with steep sides that might represent a huge earth slide of >600.000 m3 of sediments (Mörner, 1999b, 2003). A section was cored. There is a curved ridge in the seabed outside that might be the slide edge. Some other nearby possible slides were also discussed. In total, this suggested that the Boda area had undergone a violent earth shaking in the varve year 9663 BP. The dating of the slide remains questionable, however (Mörner, 2003). Close by, there was a section with nice liquefaction structures. Stop 2-4: liquefaction at Iggesund Harbour Sections along the road provide excellent examples of liquefactions, varves and turbidites (Fig. 38). The general stratigraphy is as follows: A regressional sand B upper varved clay unit C turbidite sand and gravel D lower varved clay unit; 84 varves counted in the middle opened by injected sand deformed and liquefied, especially at the base E liquefied sand We exposed the surface of layer D in order to disclose the direction of deposition of the layer C turbidite (Mörner, 2003, p. 149). It seemed to have come the NNE, i.e. from the sea inland, implying that it rather is a tsunami bed than a turbidite. The direction established, was later found to fit perfectly well with the epicentre at Hornslandet (Falkberget).

42
Fig. 38. Stratigraphy, correlations and varve dates form the Iggesund Harbour site.
Njutånger: over-night at Njutångergården Njutångergården is a small countryside pension where we live “far from the madding crowd” surrounded by kind people. When we worked with our big “Boda Project”, we always stayed here. Local friends assisted with observations; Alf Sidén, our assisting co-leader for the days here, is a remarkable caver who has mapped several caves here, not least the Boda Cave. www.njutangersgarden.se, tel. 46–(0)650-70555, [email protected]
Day 3: August 1, in the Hudiksvall area
Introduction This day will be devoted to the big 9663 vBP paleoseismic event, originally termed “the Iggesund event” from the location of the Boda Cave (Stop 2-3), and some additional events we recorded during our work with the “Boda Project” (Mörner et al., 2000) and gave a full description of in Mörner (2003). Totally, 7 events are recorded in the area (Fig. 39). The uplift story is revised and improved. The shorelines record a tilt from the NE to the SW, in full agreement with the revised location of the uplift centre (Figs 1 and 31). The uplift between the BL level and the 9663 vBP tsunami level, allowed the calculation of the deglacial absolute rate of uplift (for the first time) at about 40 mm/yr (Mörner, 2003, p. 183). Characteristics Max uplift ~600 m of the area Deglaciation ~9750 vBP (Fig. 39): ML/BL-level +238 m 9300 cBP (AL) ~215 m 7000 cBP (PL: PTM-2) ~95 m 2600 cBP (PTM-7) ~26 m Deglacial rate of uplift ~40 mm/yr Recent rate of uplift 8.5 mm/yr Repeated leveling 7.2 mm/yr Paleoseismic events 7 events

43
Fig. 39. Shore displacement and paleoseismic events in the Hudiksvall area (Mörner, 2003). The 9663 vBP event This paleoseismic event is probably one of the far best studied and documented paleoseismic events in the world. We have (1) an impressive primary fault along a shear zone with up-thrusting in the order of 10 m (Stop 3-3), (2) bedrock fracturing recorded in 40 sites within an area of 40x40 km, (3) liquefaction structures recorded in 12 sites over an area of 80x30 km, (4) a tsunami event that is recorded in 13 sites over an area of 80x25 km and composed of up to 5 individual phases, and (5) a turbidite that is recorded and dated in 28 varve chronological sites in the area but continuing all the way down to Uppsala in the south; i.e. an area of 320x40 km. The liquefaction, the tsunami and the turbidite are all inter-correlated as to one single varve year: 9663 vBP. This also applies to some earth slides and fracturing events. The size of the fault and the spatial distribution recorded of all the other 4 parameters are indicative of a very high magnitude event in the order of M >8. The paleogeography of the area, at the time of the 9663 vBP event, is well established as to ice marginal position, sea level position, and land/sea distribution (Fig. 40). Only minor areas emerged out of the sea, and most of the present land was then below sea level. The fault zone was covered by, at least, 200 m of water. Therefore, it is quite logical that a tsunami wave was created. The wave height must have been significant judging from our records of the run-up (at Lake Källsjön the wave over-flow an area 9 m high and 900 m wide; Mörner, 2003, p. 184-187).

44
Fig. 40. Paleogeography at 9663 vBP. Explanations: blue = ice covered area, brown = land area, white = land below the Baltic level at around +238 m, red dots = sited of bedrock deformation, and green dots = sites of sedimentary deformation and/or records.
The 6100 cBP event The 6100 cBP event was first recorded in Hög gravel pit (Stop 2-2) as a violent venting of coarse gravel (Mörner, 2003, p. 145-147). It was later recorded in 2 sites of earth slides (one located 100 km SW of Hög) and 7 sites recording tsunami deposits (with run-ups of 10-15 m) within an area of 100x30 km (Mörner, 2003, p. 203-209). The event must have been of a magnitude of M >>8. The epicentre is not known. Because of the violent venting of coarse gravel at Hög and all the tsunami records in the North Dellen – Hög fracture valley, it may well have been located to this structure (cf. Fig. 47).
The 2000 cBP event This was a very special event driven by explosive methane venting to be further discussed at Stop 3-2 (Mörner, 2003, p. 105-109). It set up a tsunami wave of, at least, 20 m height, recorded in near-by sites as well as probably also in a 3 m pounding of Lake Dellen.

45
Fig. 41. Location map for end of day 2, the whole of day 3 and the early part of day 4. Red dots with blue numbers gives stops, and red crosses with brown numbers give BWG sites. Stop No 3-1: the 9663 vBP tsunami bed in Lake Svartsjön Lake Svartsjön (with its surface at +223.4 m) was deglaciated some 20-25 years before the 9663 vBP event. The BL level can be closely fixed at +231.3 m. The lake basin provides an exceptionally clear registration of a huge tsunami wave; an on-swash wave followed by a back-swash wave. The site was discovered in 1997 with two cores recording a tsunami bed. In 2000, Mörner and Dawson made a dense coring profile of 11 additional cores across the lake (later a 14th core was made in a nearby bog). The cores record a maximum of 25 varves at the base. The tsunami is recorded as an on-swash wave from the east overflowing the land area there and washing in a reddish till-material in the easternmost cores, followed by a back-swash wave depositing nicely graded bedded tsunami signals in all 13 cores (Fig. 42). The tsunami beds were found to contain a planctonic diatom flora of Baltic Lake Ancylus species. C14 dating of the basal cm of the covering gyttja was dated at about 9150 cBP, corresponding to ~10,350 cal.yrs BP. Consequently, we here got another check of the relations among dates: 9663 vBP ≈ 9150 cBP ≈ 10,350 cal.yrs BP. The level of the Baltic at the tsunami event was fixed at +223.5 m. The site is fully described in Mörner (2003, p. 176-183).

46
Fig. 42. The Lake Svartsjön record (Mörneer, 2003). Top: profile across the lake. Middle: the core 3 record form the western side. Base: the core 11 record from the eastern side.

47
BWG No 3–1: the Blacksåsberget rock fall The Mt. Blacksåsberget has a high vertical scarp to the east with extensive down-fallen masses of angular blocks and boulder below and outside (Sjöberg, 1994, Mörner, 2003). In Lake Blacksåssjön, Mörner and Dawson recorded the tsunami bed of the 9663 vBP event. BWG No 3-2: the Lake Källsjön tsunami Lake Källsjön is located shortly above BL and 9 m above the sea level of the 9663 vBP event. Mörner and Dawson recorded, in multiple cores, a distinct tsunami bed where the sand included planctonic microfossils of the Baltic Ancylus biota (Mörner, 2003, p. 183-187). This implies that the 9663 vBP tsunami wave invaded the Lake Källsjön basin after over-washing a land bridge of 900 m length and 9 m height. This calls for a very significant tsunami event. The distance from the epicentre is 30 km. BWG No 3-3: the Storberget paleoseismic event Mt. Storberget is to the north traversed by a number of deep and open fractures where the fractured-off blocks have been thrown out of the fractures (Mörner, 2003, p. 86-88). The blocks have been transported (via ground shaking) 350 m away from the scarp where they ended in and on a paleo-beach at +120 m. This means that the paleoseismic event advocated for the fracturing and block motion must have happened when sea level formed the beach at +120 m. This corresponds to a time of 8000 cBP (Fig. 39). Close-by, a simultaneous event of liquefaction was recorded (op. cit.). Stop No 3-2: the 2000 cBP methane explosive and block cone at Skålbo At Skålbo, we recorded a 20 m high cone of very large, angular blocks. At the base, below the blocks, there is well-rounded beach material from the sea level position at around 3200 cBP. Therefore, the block cone must be younger. Subsequent work recorded quite an interesting story, including an, at least, 20 m high tsunami, and causation process in terms a violent methane gas venting 2000 cBP (Mörner, 2003, p. 105-109).
Fig. 43. The 20 m high block cone at Skålbo seen from the air. The blocks at the top are of huge dimensions. At the base, the cone rests on beach material from about 3200 cBP. Later studies documented tsunami event dated at 2000 cBP. The origin of the boulder cone and tsunami is supposed to be a sudden phase transformation of methane hydrate stored in the subsurface into methane gas generating an explosive venting.

48
We cored 5 bogs (Fig. 44) and recorded traces of a major tsunami event in all of them. The corresponding sea level position was established at +18 m, which implies 2000 cBP (Fig. 37). In core 5 at +38 m, 2.65 m of gravel with marine shells is recorded between lake gyttja and peat; a run-up of at least 20 m. In core 4, the tsunami caused severe erosion followed by a stagnant phase of black FeS-rich clay, assumed to be a function of the venting of methane. Later, we heard of a 3 m rise in the level of Lake Dellen, now at +42.6 m, dated at 2000 cBP. This seems to fit perfectly well with the Skålbo event. If so, the run-up must have been 25 m (pounding the lake by 3 m by filling the outlet area with additional sediments).
Fig. 44. Location of the boulder cone (yellow) and core sites (red dots). A tsunami event is recorded in all cores, even cores 5 at +38 m, implying a run-up of, at least, 20 m. The origin of the boulder cone and the simultaneous violent tsunami event is proposed to be an explosive venting of methane gas due to a sudden phase transformation of methane hydrate stored in subsurface voids into methane gas as illustrated in Fig. 45.
Fig. 45. Mechanism proposed for the formation of the boulder cone, its surrounding depression, the violent tsunami event, and the creation of reducing environment in core 4.

49
Stop No 3-3: the Falkberget Fault The Falkberget Fault (first discovered from the air) is a part in a “tails of a roof” sequence of up-trusted bedrock segments along gently dipping slip-planes on the mobile side of a major shear zone (Figs. 46-47; Mörner, 2003, p. 112-121).
Fig. 46 (above) showing the field appearance of the Falkberget Fault (arrow = ice flow dir.). Fig. 47 (below) giving the seismotectonic interpretation (yellow dot = proposed epicentre).

50
BWG No 3-4: the Lake Bålsjön tsunami and “Niklas’ tea house” In Lake Bålsjön (4a), Mörner and Dawson recorded a tsunami bed. It included a planctonic diatom flora of the early Littorina sea type. Therefore, it should be correlated with the high-magnitude earthquake recorded at Hög and a number of other sites at 6100 cBP (Mörner, 2003, p. 203-209). At the northern shore (4b), there is a huge angular boulder that has been fractured-off and moved laterally on top of 1.5-2.0 m high minor blocks, leaving an open room in the middle as made for “a nice cup of tea”, hence named “Niklas’ tea house”. No doubts, the forces to move the block must have been enormous. Stop No 3-4: the Aftonsjöberget bedrock faulting This bedrock hill is cut up by a number of vertical fractures and scarp surfaces (Fig. 48) with a lot of fractured-off blocks resting more or less in place and others moved for a short distance even directly against the ice flow direction. We identify two phases of fracturing; one shortly before deglaciation (i.e. around 9800 vBP) and one after ice had left and coincidental with the 9663 vBP paleoseismic event. The first phase was later pinpointed at varve year 9813 vBP (Mörner, 2003). In order to investigate the subsurface structures, we drilled a 157 m long drill-hole at 37.5o dip (red line in Fig. 48), in which we undertook successive radar readings all the way down. The subsurface fracture pattern fits the surface fracture pattern very well, implying that the surface fractures continue vertically, at least, 50-100 m down. There are also horizontal banking planes. A full description is given in Mörner (2003, p. 90-96).
Fig. 48. Aftonsjöberget (N down, S up) is cut by a number sub- parallel fracture in 125o, cut by perdicular fractures in 205o. Blue arrow = ice flow direction. Red dot and line give the location and direction of the 157 m long drilling. A first fracturing phase must have occurred subglacially just before deglaciation, because some blocks are transported for a short distance downglacier towards the SE. The second and main fracturing phase is likely to co-inside with the 9663 vBP paleoseismic event. At this stage blocks were thrown laterally, even directly against the ice flow direction (i.e. towards the NW).

51
BWG 3-5: the Kuggörarna harbour This is a lovely coastal site, where we may explore the effects of recent uplift and settlement. We may also trace the brackish biota of the sea. Stop No 3-5: the shingly coast at Tomashamn On this shingly coast, fully exposed to the Baltic, we investigate a profile with 5 separate beach ridges (Fig. 49). An active beach ridge usually consists of an onshore ridge of shingle, pebbles or gravel, and a zone of larger stones at about mean sea level to shortly outside. This stone zone can be seen both in ridge IV and V. The crest-to-foot difference is about 2.5 m for the present as well as all the ancient beaches. The ages of the ridges are fairly easily given by the rate of uplift (Fig. 50), viz at AD ~980, ~1350, ~1650, ~1780 and ~1930-40.
Fig. 49. The beach ridge system at Tomashamn. Arrow marks limit of “present” shingles.
Fig. 50. Time/elevation position of the 5 beach ridges with respect to mean sea level (red dots) and ridge crests at a linear uplift of 8.5 mm/yrs.

52
BWG No 3-6: the Hölik cave The Hölik cave was mapped by Sidén and described by Sjöberg (1994). Our analyses record a double origin; a first fracturing when ice was still covering the area, and a second fracturing after ice was gone (Mörner, 2003, p. 103). The last phase was the 9663 vBP event and the first must have occurred “around 9800 vBP” (Mörner, 1999b). With the discovery and dating of the 9813 vBP event (Mörner, 2003, p. 291), it seems obvious that this was the event. This is the same observations and conclusions as found at Aftonsjöberget (Stop 3-4). Njutånger: over-night at Njutångergården The same as yesterday.
Day 4: August 2, Njutånger to Saltsjöbaden (Stockholm)
Introduction We end the exploration of the Hudiksvall area and the 9663 vBP paleoseismic event in the morning (as given in Fig. 41) and set out for our drive down to Stockholm with a few stops and BWGs along the main-road and a visit to Uppsala.
BWG No 4-1: the annual moraines at Sivik and the turbidite
At Sivik, we cross a very clear annual moraine (De Geer moraine) and further southwards, we pass one after the other; a whole end moraine field. The distance between the ridges gives the rate of recession each year (fitting well with the rate of ice recession from the varve chronology). On the east site of the road, there is a varve chronological site, which we cored in 1997, and found that the unusually thick varve of 9663 vBP, in fact, was a clear turbidite.
Stop No 4-1: liquefaction at Västra Myra This site originally offered the investigation of multiple liquefaction phases including a large variety of structures and venting cycles (Mörner, 2003, p. 155-157). Today, only a small section is accessible. In Fig. 51, we can distinguish up to 5 phases of liquefaction and venting. This is almost identical to the records at Hög (Stop 2-2) and is a second and independent record of shocks and after-shocks in association with the 9663 vBP paleoseismic event.
Fig. 51. Five phases of liquefaction and venting in the Västra Myra gravel pit (in 1998-2000). Liquefaction 1 (into which the clay sinks down), liquefaction 2 with venting cutting phase 1, liquefaction 3 cutting the venting pipe of phase 2, liquefaction 4 cutting the phase 3 beds and allowing the clay to sink down into the liquefied sand, and phase 5 covering phase 4 and allowing another heavy clay layer to sing down. Today, we only see some liquefaction and a possible covering tsunami bed.

53
BWG No 4-2: the PL level at Fågelviken At Fågelviken, the PL level is recorded by a shingle field and a rock cut notch at +95 m. The hill is traversed by two major wide-open fractures lacking sign of either glacial or littoral erosion. One of the factures is covered and filled by the beach shingle of the +95 m beach. The fractures must have been formed just before the shoreline formation +95 m, which implies an age in the order of 7500 cBP (Mörner, 2003, p. 82-84). BWG No 4-3: the Storåsen rock avalange The mountainside of Storåsen has steep scarps and extensive block-fields on the gently dipping surface outside (Mörner, 2003, p. 111). The forces to spread the fractured-off blocks and boulders so far away from the scarps despite the gentle slope cannot be gravity (talus) but seems only possible via a very strong ground shaking; i.e. an earthquake. BWG No 4-4: the “Alf’s gryt” cave “Alf’s gryt” is a nice and rare structure (Mörner, 2003, p. 101-102). A surface scarp of reverse-fault indicates upward, extensional forces. This opened a subsurface cave, into which sand and silt of the covering till was sucked in and deposited in a delta-like accumulation, barren of microfossils. Again, we face anti-gravitational expansion forces. BWG No 4-5: the Losjön turbidite and varve sequence During the building of the motorway and the new railroad, we had good exposures of varved clay. The varves were measured and we got an excellent record of the varve 9663 vBP turbidite (Mörner, 2003, 173-175) as illustrated in Fig. 52. This turbidite – always in the same varve year – can be traced from Sundsvall in the north to Uppsala in the south over 320 km. This is indicative of a very strong paleoseismic event in 9663 vBP. This is also the horizon where the methane venting signals end (Mörner, 2003, 289-294).
Fig. 52. After 118 diminishing varves, there is a distinct turbidite of graded bedding. This is varve –424 or 9663 vBP. Close-ups of the turbidite at Losjön (above) and Styvje (below).
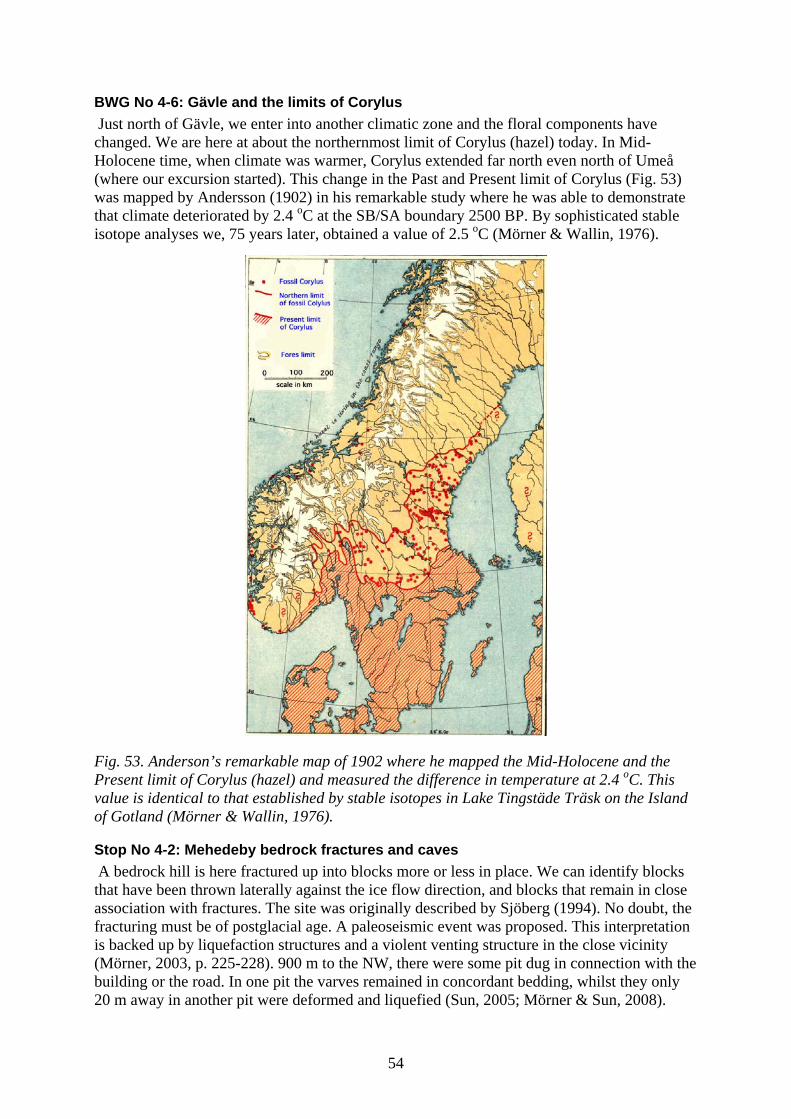
54
BWG No 4-6: Gävle and the limits of Corylus Just north of Gävle, we enter into another climatic zone and the floral components have changed. We are here at about the northernmost limit of Corylus (hazel) today. In Mid-Holocene time, when climate was warmer, Corylus extended far north even north of Umeå (where our excursion started). This change in the Past and Present limit of Corylus (Fig. 53) was mapped by Andersson (1902) in his remarkable study where he was able to demonstrate that climate deteriorated by 2.4 oC at the SB/SA boundary 2500 BP. By sophisticated stable isotope analyses we, 75 years later, obtained a value of 2.5 oC (Mörner & Wallin, 1976).
Fig. 53. Anderson’s remarkable map of 1902 where he mapped the Mid-Holocene and the Present limit of Corylus (hazel) and measured the difference in temperature at 2.4 oC. This value is identical to that established by stable isotopes in Lake Tingstäde Träsk on the Island of Gotland (Mörner & Wallin, 1976).
Stop No 4-2: Mehedeby bedrock fractures and caves A bedrock hill is here fractured up into blocks more or less in place. We can identify blocks that have been thrown laterally against the ice flow direction, and blocks that remain in close association with fractures. The site was originally described by Sjöberg (1994). No doubt, the fracturing must be of postglacial age. A paleoseismic event was proposed. This interpretation is backed up by liquefaction structures and a violent venting structure in the close vicinity (Mörner, 2003, p. 225-228). 900 m to the NW, there were some pit dug in connection with the building or the road. In one pit the varves remained in concordant bedding, whilst they only 20 m away in another pit were deformed and liquefied (Sun, 2005; Mörner & Sun, 2008).

55
Fig. 54. Paleoseismic events and sites in the Bothian Bay area (from Mörner, 2003, 2004). We have discussed the 7 events in the Hudiksvall area, and we are now down in northern Uppland where 5 evens are recorded; occurring ~10,150 vBP, ~10,000 vBP, 9813 vBP, ~8000 cBP and ~2900 cBP. There is a clear linkage to the old tectonic fracture zones (Fig. 54). The 2900 cBP event is a tsunami event traced in off-shore setting, in the coastal zone and in basins 10-20 m up (Mörner, 2008a, 2008b). BWG No 4-7: the PL-shorelevel at Heby Along the esker slope, there is a distinct shoreline at about +78 m. It represents the PL level of the area. It is formed by the first Littorina oscillation (PTM-2) at 7000 cBP. Stop No 4-3: the Uppsala area Old Uppsala was the centre of Sweden during the Late Iron Age to early Medieval time. Here the King had to be accepted and crowned at the thing. The three mounds date to Late Iron Age. The Asa creed finally lost its power when a church was built there in 1164. We drive through the centre of Uppsala. The university was first established in 1477. Linné, Celcius and Berzelius worked here, just to name a few. Important buildings like the Dome (from 1245), Gustavianum, Skytteanum, Carolina Rediviva and the Uppsala Castle are pointed out. The Uppsala Esker passes the city. Fig. 55 gives an old core log (Järnefors, 1956), which provides a documentation both of “the spotted zone” of the paleoseismic event 9813 vBP, and of the turbidite of the paleoseismic event 9663 vBP (Mörner, 2003). The 9663 vBP turbidite is traced over an area of 320x90 km (from Sundsvall to Uppsala).

56
Fig. 55. Old drill log from Uppsala recording the 9813 and 9663 vBP events. Stop No 4-4: The esker centre at Haga The Hagaparken area is a classical area in Swedish Quaternary research because this is where De Geer did most of his basic investigations with respect to esker formation, ice recession and varve chronology (De Geer, 1940), here illustrated in Fig. 56 (modified from De Geer, 1940). Clear shore-marks are cut into the slopes of the esker. The top of the Storkullen esker centre is formed by PL (PTM-2) at +50 m. Younger shore-marks are present at 40.0 (PTM-4), 33.0 (PTM-5A), 13.6 (PTM-7), 8.4 (PTM-9) and 5.2 (PTM-10); cf. Figs. 74 and 84 (Day 6).
Fig. 56. Ice marginal position in the year 10,385 vBP (green), variations in thickness of this year’s varve (blue), esker accumulations (orange) and varve chronological points (red dots).

57
Stop No 4-5: Lyell’s oke In 1834, Charles Lyell went to Sweden in order to investigate the process of land uplift. He became convinced that land was really rising (the elevation theory). He noted, however, that the rate was moderate. One of his key sites was the section at “Fiskartorpet” (Fig. 57) where two giant oaks were growing; one so close to the Baltic that the rate of uplift must have been in the order of 25 cm/century (Lyell, 1835). The true rate is 49 cm/century (Mörner, 1973).
Fig. 57. Lyell´s old section of the Fiskartorpet site (Lyell, 1835). “Lyell’s oke” is, today, at an elevation of +2.2 m, a level which started to emerge around 1350 AD (Fig. 58).
BWG No 4-8: the Old Town Stockholm is founded where the Stockholm esker crosses the water, now separating it into the Baltic to the east and Lake Mälaren to the west. The isolation of Lake Mälaren seems to have occurred in the 13th century. Soon, a fortified centre was built at today’s Old Town for trading, not least for the export of iron. During the Viking time, the centre, Birka, was located on the island of Björkö in Lake Mälaren. Records from Birka, from runic stores and rock carvings, from subsurface remains in the Old Town, from water-marks and from the tide gauges (the second longest in the world), allow the reconstruction of a detailed sea level curve of the last millennium (Fig. 58), further discussed on days 1 and 4 of Part B (below).
Fig. 58. Sea level curve for the last millennium for the Stockholm area (Mörner, 1984b). The rate of uplift is 4.9 mm/year (Mörner, 1973). Variations from a straight line of uplift, are the function of changes in regional eustasy plus local Baltic level (Mörner, 1999a).
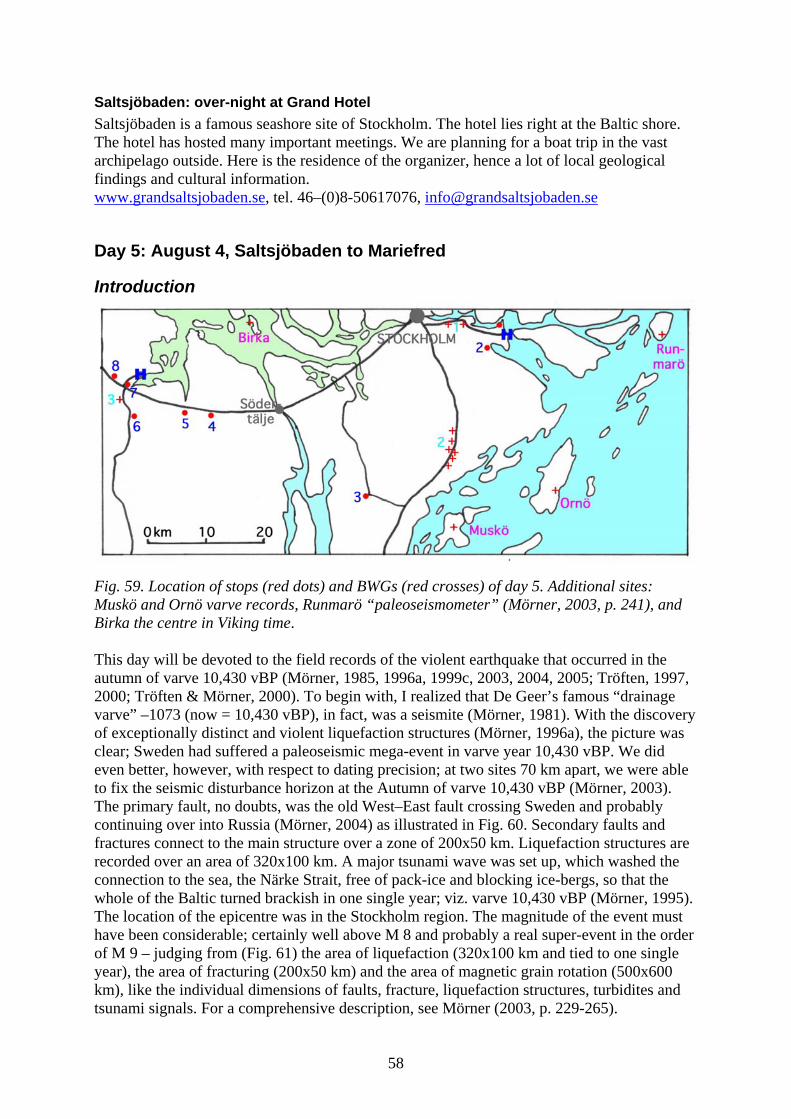
58
Saltsjöbaden: over-night at Grand Hotel Saltsjöbaden is a famous seashore site of Stockholm. The hotel lies right at the Baltic shore. The hotel has hosted many important meetings. We are planning for a boat trip in the vast archipelago outside. Here is the residence of the organizer, hence a lot of local geological findings and cultural information. www.grandsaltsjobaden.se, tel. 46–(0)8-50617076, [email protected]
Day 5: August 4, Saltsjöbaden to Mariefred
Introduction
Fig. 59. Location of stops (red dots) and BWGs (red crosses) of day 5. Additional sites: Muskö and Ornö varve records, Runmarö “paleoseismometer” (Mörner, 2003, p. 241), and Birka the centre in Viking time. This day will be devoted to the field records of the violent earthquake that occurred in the autumn of varve 10,430 vBP (Mörner, 1985, 1996a, 1999c, 2003, 2004, 2005; Tröften, 1997, 2000; Tröften & Mörner, 2000). To begin with, I realized that De Geer’s famous “drainage varve” –1073 (now = 10,430 vBP), in fact, was a seismite (Mörner, 1981). With the discovery of exceptionally distinct and violent liquefaction structures (Mörner, 1996a), the picture was clear; Sweden had suffered a paleoseismic mega-event in varve year 10,430 vBP. We did even better, however, with respect to dating precision; at two sites 70 km apart, we were able to fix the seismic disturbance horizon at the Autumn of varve 10,430 vBP (Mörner, 2003). The primary fault, no doubts, was the old West–East fault crossing Sweden and probably continuing over into Russia (Mörner, 2004) as illustrated in Fig. 60. Secondary faults and fractures connect to the main structure over a zone of 200x50 km. Liquefaction structures are recorded over an area of 320x100 km. A major tsunami wave was set up, which washed the connection to the sea, the Närke Strait, free of pack-ice and blocking ice-bergs, so that the whole of the Baltic turned brackish in one single year; viz. varve 10,430 vBP (Mörner, 1995). The location of the epicentre was in the Stockholm region. The magnitude of the event must have been considerable; certainly well above M 8 and probably a real super-event in the order of M 9 – judging from (Fig. 61) the area of liquefaction (320x100 km and tied to one single year), the area of fracturing (200x50 km) and the area of magnetic grain rotation (500x600 km), like the individual dimensions of faults, fracture, liquefaction structures, turbidites and tsunami signals. For a comprehensive description, see Mörner (2003, p. 229-265).

59
Fig. 60. The W–E Fault (purple), ice cover at 10,430 vBP (blue), secondary rhombic fractures in the Erstavik area (red) and pattern of the Stockholm esker (black). Stops & BWGs (dots).
Fig. 61. Ice cover at 10,430 vBP (blue), extent of liquefaction 320x100 km (dark) and area of seismotectonically rotated magnetic particles 500x600 km (yellow). Location of epicentre (red dot). The area of bedrock fracturing is 200x50 km. Estimated magnitude >>8 to ~9.

60
From high magnitude to high frequency The deglacial frequency is achieved by direct varve dating within the varve sequence 10,500 to 10,400 vBP (Mörner, 2003). The sharpening of the picture has gone from 1 event (Mörner, 1981), via 3 events (Mörner, 1985) and 4 events (Tröften, 1997, 2000) to 5 events (Mörner, 2003), now probably 6 (unpubl.). The varve records extend about 30 km southwards and 80 km westwards (for the 10,430 vBP event 320 km). It has recently been possible to identify approximate locations of the epicentres. This suggests a segmentation of the seismic energy release along the old fault. The following is recorded: date of event magnitude epicentre ~10,400 vBP 6–7 Säffle area ~10,410 vBP >8 Taxinge area Autumn 10,430 vBP 8–9 Stockholm 10,447 vBP 6-7 Stockholm 10,469 vBP 7–8 Åker area 10,490 vBP 6–7 Stockholm This implies 6 separate events within 90 years, which, indeed, is a very high frequency. The Holocene seismicity The total number of paleoseismic events recorded in the Mälardalen–Stockholm area is 14, whilst the spacing of the deglacial events is in the order of decades, the spacing of the postglacial events is in the order of 1500 years (Mörner, 2003). Three events occurred in Late Holocene time with magnitudes up to M ~7 (Mörner, 2008a). The one occurring ~3250 cBP is recorded by multiple events and will be visited at Stop 6-7 (Fig. 82).
Stop No 5-1: Skogsö The long tide gauge record in Stockholm allows for a very precise determination of the present absolute rate of uplift at 4.9 mm/year (Mörner, 1973). In 1704, the royal architect Nikodemus Tessin had two water-marks cut into the bedrock at each side of the narrow strait called “Stäket”. We will visit the eastern mark, cut “12 feet above the water”, today at an elevation of +5.0 m above the Baltic. (The western mark lies 33 cm lower). Close-by, at the slope of the old E-W fault that was reactivated in postglacial time, there are a number of very large potholes with one side lacking (location: green dot in Fig. 60). Obviously, these potholes were formed at the ice/rock interface due to water motions under high hydrostatic pressure. The cutting of a pothole in rock with the other side consisting of ice implies that the ice was moving forward at a high rate (in the order of 500 m/yr) despite the fact that the ice margin was successively displaced up-glaciers at a rate in the order of 200-300 m/year. The potholes are now traversed by open fractures, which must have been created after the pothole formation (i.e. after the deglaciation). This occurred at the very large earth-quake that struck the region in the autumn of varve 10,430 vBP (Mörner, 2003, p. 238).
Stop No 5-2: Erstavik Both Mörner and Tröften have worked intensively in this area. The esker system exhibits changes that can be directly tied into the seismotectonic story (Mörner & Tröften, 1993; Mörner 2003). The area is crossed by a secondary rhombic fault pattern, where the lines seem to have moved in successive order by that affecting/controlling the esker formation (Mörner et al. 1989; Mörner, 2003). Numerous sites have been investigated with respect to the varve chronology (Mörner, 1985, 2003, Mörner et al., 1989; Mörner & Tröften, 1993; Tröften, 1997, 2000; Tröften & Mörner, 1997). This is illustrated in Fig. 62.

61
Fig. 62. Cartoon of ice recession (blue), esker formation (green) and seismotectonics (red and oranage lines). Ice receded normally over the area at a rate of about 250 m/yr and an esker was built out in the extension of the Skuru depression (i.e. in NNE). Then begins the cartoon. Right: At 10,469 vBP, an earthquake strikes the area and the red marked line moves, closing the natural subglacial drainage and opening a new one along the faultline. Middle: At 10,447 vBP, a second earthquake strikes the area and another line moves (red), closing the subglacial drainage, which leads to a 5 km westward jump of the esker. Left: In the authumn of varve 10,430 vBP, there is a third, very strong, earthquake. The line marked red moves, and the surrounding varves are deformed and shaken into the fault basin generating very nice sliding structures (Mörner, 2003, p. 232; 2005, Fig. 3).
BWG No 5-1: Järlasjön – Hammarbybacken The E–W fault is well recorded in the narrow Lake Järlasjön and the steep slope at Hammar-by (orange dots in Fig. 59). This fault was reactivated in postglacial time. Magnetic fabric analyses across the fault record a strong horizontal component, however. On both sides of the fault, we have recorded strongly deformed varved clay beds (Tröften, 1997; Sun, 2005).
BWG No 5-2: 8 km road section south of Stockholm A new road section of 8 km was built in 1996. When crossing it one evening, our car light happened to disclose some heavily undulating clay layers. This was the onset of a detailed recording and analysis by Tröften (1997). A number of excellent liquefaction structures were recorded at several places along the 8 km exposed, in Fig. 64 supplied with inserted pictures of selected relevant structures (Tröften, 1997, 2000, Tröften & Mörner, 1997). They all seem to represent the 10,430 vBP paleoseismic event. Seawards and down-gradients, there are very huge turbidite beds recorded in varve 10,430 vBP (Mörner, 1985, 2003) as illustrated in Fig. 63. Obviously, the sediments set in motions by the liquefaction generated extensive turbidites seawards, like those recorded at Muskö 10 km to the south and Ornö 18 km to the west of Berga (Mörner, 2003).
Fig. 63. Varve diagrams from the islands of Muskö and Ornö exhibiting a thick marker-varve in varve 10,430 vBP composed of sandy-silty material, contorted clay and “pebbles” of eroded clay indicative of a massive and extensive turbidite flow (Mörner, 1985, 2003). Those thick turbidites occur high up in the sequence (274 and 321 varves after deglaciation) and record a very unusual and violent event.

62
Fig. 64. The 8 km road section south of Stockholm with extensive liquefaction structures studied by Tröften (1997). Inserted figures; heavily deformed varved at Berga (57 varves counted), liquefaction of venting type at Ribbylund (119 varves counted), differential liquefaction at Solslätt, and liquefied silt and sand at Dalarö road (from Tröften, 1997).

63
Stop No 5-3: Olivelund gravel pit In 1996, we started our investigation of a gravel pit at Olivelund (Mörner, 1996a; Tröften, 1997). It is cut into the edge of a long esker that extends northwards via Uppsala and Mehedeby and out into the Bothnian Bay. In 2000, Mörner and Audemard undertook a very comprehensive study of the structures recorded in the pit after painstaking digging, cleaning and brushing of the surfaces. The site includes remarkable examples of liquefaction (Mörner, 2003, p. 234-237). This site will be proposed as a type-site for liquefaction structure (Mörner and Audemard, in prep.). At least three separate phases of liquefaction were recorded.
Fig. 65. A: boulders and sand blocks “swimming” in liquefied sand. B: liquefied waves which are likely to record fossil seismic waves.
Stop No 5-4: Turinge In this area, we have 5 sites of paleoseismic implication (Fig. 66). All sites are today gone, and we stop for a theoretic exercise of the records (at the crossing of the motorway, shortly north of site 5).
Fig. 66. Location of the 5 sites investigated at Turinge (Mörner, 2003; Sun, 2005). The grid is in 1000 m. Site 1 equals C, and Site 2 equals A and B in Fig. 67.

64
Fig. 67. Iner-site correlations A & B from site 2 and C from the main site 1. Site 1, is the site were we in 1996 found remarkable liquefaction structure including a violent venting structure seen in 3-D (Fig. 67C). The site is closely discussed by Mörner (2003, p. 242-246). We have a video cover of the original investigation in 1996. In site 2, there was a fine section of the varved clay showing a concordant bed of 34 varves set in freshwater environment covered by varves (30 counted) set under brackish condition (Fig. 65A). The boundary, obviously, coincided with the marker bed –1073 of De Geer (1940). Some 10-20 m laterally in the same section, the freshwater varves are strongly disturbed with a surface depression (from erosion along the sea bed), which is filled by brackish varves beginning with the winter unit of varve 10,430 vBP. Hence, the deformation must have occurred in the autumn of varve 10,430 vBP (Fig. 67B). This is exactly the same position as the deformation recorded in Lake Albysjön (Tröften, 1997), some 70 km to the east (Fig. 68; Mörner, 2003, 2005). The simultaneous change from freshwater to brackish water conditions, was interpreted as the effect of a major tsunami, recorded in many sites over southern Sweden (Mörner, 1996a, 1999c, 2003, 2008b).
Fig. 68. At Turinge site 2, section A, the varves are concordant with an environmental change from freshwater to brackish water conditions (due to a violent tsunami). In section B, there is an erosional basin filled, under restored calm conditions, by the winter unit of varve 10,430 vBP. At Lake Albysjön, 70 km to the east, a slid intruded the sequence in the autumn of varve 10,430 vBP. Therefore, the paleoseismic event is dated at the autumn of varve 10,430 vBP.
At sites 3 and 4, there are additional paleoseismic deformations (Mörner, 2003; Mörner & Sun, 2008).

65
At site 5, we found 32 freshwater varves in concordant stratification (Mörner, 2003; Sun, 2005). Like in Mehedeby, sites close-by each other seemed to be very differently affected by the paleoseismic event. Detailed magnetic analyses by Sun (2005) recorded quite strong internal crypto-deformation, however (Mörner & Sun, 2008). This is illustrated in Fig.69. “The Nykvarn section reveals something very important, one may even say fundamental, with respect to AMS, ChRM and earthquake deformation and shaking. Whilst AMS (the larger anisotropic grains) remains more or less uniform from base to top, the ChRM declination exhibits a very clear clockwise twist upward” (Mörner & Sun, 2008).
Fig. 69. The magnetic fabric (AMS) of all samples fall within a narrow zone (yellow). The ChRM values on the other hand record a 90o rotation, which cannot be ascribed to geomag-netic field variations, but must be ascribed to internal deformation (Mörner & Sun, 2008).
Stop No 5-5: Turinge grave pit at Ryssjöbrink (Taxinge) When the new highway and railway were built here in 1996, I observed some shaken and liquefied beds (Mörner, 1996a, 2003, 2005) that seemed to give quite straight forward indications of a former high-magnitude paleoseismic event. Close-by, there are two large gravel pits, which I have had under continual observation. It was shown at the 1999 international excursion (Mörner, 1999b), when a very large fold was exposed, interpreted as a combination of liquefaction, venting and down-sinking (Mörner, 2003). A section of varved clay was strongly tilted and seemed to include traces of paleoseismicity dated at varve 10,469 vBP, 10,430 vBP and some 20-30 years later (i.e.10,410-14.400 vBP). Subsequent excavation has, in the last two years, exposed quite remarkable venting structure in association with the third paleoseismic event at this site. The venting includes the venting of coarse gravel (Fig. 70). This violent event generated the huge folds and the vertically tilted clay and sand beds previously observed. Venting of coarse gavel implies a very strong paleoseismic event with a magnitude >8.5 (cf. p. 58). The age can, at the moment, not be set closer than at about 10,410 vBP. The epicentre is likely to have been in the close vicinity because the recorded effects seem do decrease both to the east and the west. Far to the west (280 km), there are records of a violent event at around 10,400 vBP (cf. p. 58), but because of the distance, it is considered to represent at separate event and segment

66
Fig. 70. The Turinge gravel pit (at Ryssjöbrink); new sections in 2005-2006 exhibiting strong liquefaction and venting, including venting of gravel, which calls for a magnitude >8.5. Above: venting fold. Middle: venting and lateral mushrooming of coarse gravel and sand. Below: liquefied sand and gravel at the base of the venting pipe in the middle picture.

67
BWG No 5-3: Just south of Läggesta (where we leave the highway), there is a quite significant fault with the fresh fault-surface facing the ice flow direction (Mörner, 1999b, 2003, 2004, 2005). The throw is in the order of 8 m. The faulted surface looks fresh and totally unpolished by the ice. Hence, a postglacial origin seems likely. There seems to be the mark of a major till-slide.
Stop No 5-6: Lövtorp gravel pit Just beside the road, there is a minor old gravel pit. Here, a basal varved clay sequence show extensive deformation, which was assigned an age of 10,469 vBP (Mörner, 2003, 2005). The varves are deformed in a snake-like pattern (Mörner, 2003, p. 248, Fig. 23). Cf. Stop 6-4.
Stop No 5-7: Läggesta railway station The bedrock surface on the northern side of the railway, exhibits a flat surface strongly polished by the ice in striae and grooves, which are cut and off-set by minor fractures. The fracturing and off-setting must be of postglacial origin, and we assign those mini-structures to the high frequency/magnitude seismicity right after deglaciation.
Stop No 5-8: The Ärja Fault Along the northern side of the railway between Läggesta and Ärja, there is a very clear postglacial fault with an off-set in the order of 8 m (Mörner, 1996a, 2003, 2004). A well polished glacial surface in down-faulted into a position where glacial polishing could hardly have occurred (Fig. 71). Whether down-faulted or pop-up, is another question (Mörner, 2004).
Fig. 71. The Ärja Fault. Blue arrow gives ice flow direction. A glacially well polished and striated surface is down-faulted by about 8 m. This is a lateral fault to the main W-E Fault.
Mariefred: over-night at Gripsholmsvikens Hotell & Konferens Mariefred is a lovely little town. It is the place of the magnificent Wasa Castle “Gripsholm”. The famous Swedish chemist Berselius had a factory here (where selenium was first found). An evening walk in the town is highly recommended. www.redcross.se/gripsholm, tel. 46–(0)159-3276709, [email protected] Day 6: August 5, end of excursion Directly after breakfast, all participants will be taken by bus to the Central Railway Station in Stockholm (end of excursion) for individual travel to Oslo by train or by air (via Arlanda).

68
Excursion Part B The bus will pick up all participants at the Central Railway Station in Stockholm (in front of the air bus terminal and opposite the railway entrance on Klarabergsviadukten)
Day 1 (6): August 15, Stockholm to Stavsjö
Introduction The Stockholm area was visited on day 5 of Part A (see page 00). We are proceeding directly to the Mariefred–Åker area where we will spend the day. On the way, we pass the sites of 5-4 (our BWG 6-1) and 5-5 (our BWG 6-2). Fig. 72 gives locations of today’s sites. This day will primarily be spent on sea level changes and the integration between natural and cultural history, but also traces of early iron ore utilization and a Late Holocene earthquake.
Fig. 72. Location of stops (red dots) and BWGs (red crosses) during day 1 of Part /B (6). In this area, natural and cultural history is interacting in a fascinating way. We may talk about “Sweden in a nut-shell” or “10,500 years in 17.5 km”. Since 1994, we have had courses in “Integrated Natural and Cultural Knowledge” and a separate field station was bought in Åker: “the Solberga Research Station”. In connection with these activities, a lot of scientific results have been obtained with respect the ice recession, land uplift, lake and bog stratigraphy, paleoseismicity, onset of iron ore industry, etc. Characteristics Max uplift ~450 m of the area Deglaciation 10,450 vBP ML/BL-level +150 m 9300 cBP (AL) +80 m 7000 cBP (PL: PTM-2) +50 m 2700 cBP (PTM-7) +13.6 m Deglacial rate of uplift ~15 mm/yr Recent rate of uplift 4.9 mm/yr Paleoseismic events 5 events In connection with the Solberga courses, I found the outcrops of heavy liquefaction at Ryssjöbring and Turinge (Stops 5-4 and 5-5) dated at the autumn of varve 10,430 BP (Fig. 68; Mörner, 1996a). In total, liquefaction structures have been found over an area of 320 km. We compare this with the distribution of liquefactions over 200 km at the 1964 Alaskan

69
earthquake (Walsh et al., 1995) and conclude that the 10,430 vBP event is likely to have been well above M 8, maybe ~9, on the Richter scale. This event set up a tsunami, which washed the Närke Strait free of ice so that the sea could suddenly flush into the Baltic (Mörner, 1995; De Geer, 1940) as illustrated in Fig. 73. Several local basins record a sudden marine invasion (Mörner, 2003. p. 255-257). From the deglacial period, there are, in this region, clear records of the 10,469 and 10,430 vBP paleoseismic events. From the postglacial period, there are records of paleoseismic events at 7800 and 3200 cBP (Mörner, 2003, 2008a).
Fig. 73. Chronostratigraphic table for the Baltic with the implication of the 10,430 vBP event and the tsunami event, which, in one singe year, altered the Baltic into a brackish sea, the Yoldia Sea sensu stricto (Mörner, 1995). Columns: (1) main stages, (2) stage transitional events, (3) stage environment, (4) varve dates from the Stockholm region, (5) varve dates and shorelines in Finland, (6) Lake Lången records at Mt. Billingen, (7) radiocarbon ages, (8) main Baltic stages, and (9) outlet/inlet changes and boundary events. In Fig. 74 give the sea level curve of the area (Mörner, 1999b). The AL and PL levels are fixed by well-expressed morphological elements. We think that this is a necessity for the establishment of a reliable sea level curve. There are far to many uncertainties in proper determination of the isolation threshold, proper identification of the isolation contact in the stratal sequence and, especially, proper dating of an isolation contact. This is evident from a compilation of proposed local sea level curves from Gävle in the north to Norrköping in the south (Fig. 75). One may advocate heavy neotectonic differences. The most probable error lies in the dating, however; the contamination (re-deposition, penetration of roots and borings, post-depositional alteration) and the atmospheric 14C-variations (which are especially problematic in the period 9300–7000 cBP). Therefore, we believe that our sea level graph in Fig. 74 is better founded than those in Fig. 75. If this is true, single sea level curves based solely on radiocarbon dated isolation levels are seriously in doubt. And it is true that C14-dates of clay and gyttja mixtures at the isolation level often have to be discarded because they give impossible ages. The same conclusion was arrived at with respect to the Hudiksvall area when comparing C14-dates isolation levels (Lundqvist, 1963) and our own sea level curve with emphasis on morphological elements and AMS-dating (Mörnere, 2003) as illustrated in Fig. 39 above (where horizontal lines mark the data from Lundqvist’s curve of 1963). Some of the confusions may also be ascribed to the effects of tsunamis (Mörner, 2003, 2008b).

70
Fig. 74. Sea level curve of Marvikarna-Åker-Stockholm area with AL and PL levels marked. The AL level at +80 m and the PL level at +50 m are seen as distinct shorelines all over the area. The 5000 cBP level is often well expressed in the field. The 2700 cBP level is very distinct, and so is the 1000 cBP level. The sudden regressions following those events are traced by multiple criteria, and owe their own explanation in terms of short (about 50 years, or so) and severely warm and dry episodes (further below; cf. Mörner, 1999a). The area was blessed by rich and good quality iron in the bedrock, excess to hydropower, dense forests for charcoal energy and a remarkable transportation system in the Marviken lake system (allowing easy transport of the heavy iron ore over the winter ices). Therefore, Åker Styckebruk ironworks is quite logically located at this place. At Lake Mälaren close by, lies the Gripsholme Caste founded in mid 14th century and rebuild by Gustav Wasa in 1537. BWGs (from day 5) en route Södertälje–Mariefred On the way, we pass the major liquefactions sites of stop 5-4 (p. 61) and 5-5 (p. 63), like the BWG site 5-3 (p. 65). BWG No 6-1: Läggesta This is the site of a quiet remarkable project called “the Time Tower at Läggesta” for the erection of a 150 m high tower (mimicking the uplift curve; Fig. 74), where the history of uplift and the cultural evolution should become integrated and visualized, utilizing the uplift and shore level displacement as a “motor” for the integration (www.tidstornet.se).

71
Fig. 75. Sea level curves (a-f) from south to north. The data are strongly inconsistent. Curves b and c refer to the same isobase latitude as that of Fig. 74. All curves seem to have a significant factor of error (cf. Fig. 39). Fig. 89 gives the ideal way of integrated analyses. Stop No 6-1: the Ärja Fault We make a short stop at this site to investigate a postglacial fault scarp with a down-faulted surface, well polished and striated by the ice. See Stop 5-8 (p. 65, Fig. 71). BWG No 6-2: Lida gärde and the Ingvar Expedition In year 1934, a Viking named Ingvar had gathered 30 ships and numerous men to set our for a remarkable expedition to Russia, the Black Sea, crossing the Transcaucasian Mountains pulling the ships over a crest at +996 m, the Caspian Sea down into Persia or what they called “Särkland” for gold, pearls and silk. Only 7 ships returned in the 1040s – and numerous runic stones were now erected to commemorate the event. Hence those stones give a very precise age and elevation in our sea level studies (Mörner, 1984b, 1999a). There are strong reasons to propose that the whole expeditions started here at the shore of Lida Gärde (Fig. 76; Larsson, 2004; Mörner, 2004c). In the period 980 to 1050 AD, sea level fell over 1 m, closing the water arm around the present church area (Fig. 76). This may have triggered the move of the “manor-house” of the chief from Skäggesta to Lida.

72
Fig. 76. The situation at around 1030-1050 AD, when Emund may have ruled at Lida and Ingvar started his remarkable expedition with 30 ships to Särkland. Stop No 6-2: Skäggesta “manor” of “Great Åker” in 500-700 AD Skäggesta was the centre of “Great Åker” in the period 500-700 AD (Fig. 77).
Fig. 77. The situation of the period of “Great Åker” (Stor Åker) 500-700 AD. The Baltic sent a last narrow arm in direct connection to Lake Visnaren and the Lake Marvikarna system. A chief established a strategic position at Skäggesta (2): with thing place (1), additional settlements (3), chief graves (4), ordinary grave fields (5), market place (6), storehouses (7), farming fields (8), bridge (9), escape camps (10) and iron ore quarries (11).

73
In the period 500 to 700 AD, the Marviken–Visnaren lake system was connected to the sea via the narrow , strongly curved, water-arm around the present church area and down to Läggesta (Fig. 77). This water way was an intensive trading route, and the person controlling it obviously became wealthy. Mörner (2004c) has proposed that a chief settled at Skäggesta, controlled the trading along the water channel, became wealthy, started a new iron ore industry in the forest area (identified at 5 different sites), became even more wealthy and hence formed a centre which we may call “Great Åker”. In direct succession of this centre, the Birka centre was established at around 750 AD (suddenly ending in 980 AD). BWG No 6-3: the Åker Styckebruk ironworks Åker ironworks was first mentioned in 1580. In 1604 and 1607 “two lovely blast furnaces of bedrock were erected side by side”. The main product rapidly became casting of cannons (hence the name “styckebruk” which means cannon factory). Today, it is a world leading roll factory. We explore the setting of the factory and some of the individual buildings. In places like this a very special “ironworks’ spirit” grew forming the base of last centuries’ idea of the state as a “people’s house”. It is interesting to note that, during the severe famines at the end of the 17th century (one of the Little Ice Ages), there is no mentioning of problems and suffering at the factory, whilst the farmers around had very hard times, indeed.
Stop No 6-3: the PL-shore at Göksjön and 7800 cBP paleoseismic event A very distinct shoreline is cut into the hill slope. It constitutes the PL-level (PTM-2) at 7000 cBP and the subsequent peak PTM-3A at 6500 cBP, here levelled at +49.5-50.0 m and +47.0 m, respectively (agreeing perfectly well with the Fig. 74 sea level curve). In the slope above the PL-shore, there are a number of minor beach ridges (from the end of the Ancylus stage some 8000 cBP). This system is truncated by the PL-shore, suggesting that the PL-shore was cut after a transgression. From coring lakes and bogs in the surroundings, we know that the PL level was preceded by a trangression of 3-4 m. This will be demonstrated at Stop 6-5. There is a sand pit in the hill-side directly above the PL level. A beach shingle is covering off-shore sand. The odd thing, however, is that the stones have sunk down into the sand after deposition. A seismic origin seems likely (Mörner, 2003, p. 250). This must have happened between 8000 and 7500 cBP, an age that fits perfectly with a C14 date of 7865 ±75 cBP of an eroded pine-cone found 2.6 m down in a deposit of paleoseismic origin some 15 km to the SW. There is also a significant turbidite recorded in a lake. This event, originally assumed to be of more local dimension (M >6), may, in fact, become a very important event in the future, because there seems to be an extensive turbidite deposited over a huge area; viz. 90 km to the east and 180 km to the NE. There is also a record of a 15 m tsunami wave dated at around 7750 cBP (Mörner, unpubl.). BWG No 6-4: esker change and end-moraine at Lake Malsjön We will have a view of the Lake Marviken fracture valley. The valley itself was active in the Permian and formed at this time (or far earlier in the Precambrian). The valley sides are rough and only occasionally well polished by the ice. A small esker (a part of the Enköping esker) runs along the road. It suddenly disappears and changes over into a sedimentary “pancake” (including lots of kettle holes from incorporated ice blocks). At this very spot, a quite distinct end moraine divides Lake Malsjön into to parts. Obviously, we are dealing with an ice marginal position and an event that changed the mode of deposition and ice recession. Originally, we suspected that this might be correlated with the paleoseismic event that struck the area in autumn of varve 10,430 BP (Mörner, 1996a; Tröften 1997). From improved varve chronological work, we can now show that this happened at the paleoseismic event in varve 10,469 vBP (cf. Stops 5-6 and 6-4).

74
Stop No 6-4: coring at Lake Millsjön for varves We core the shore of Lake Millsjön in order to demonstrate the varves that occur in the region. A sequence of three extra thick varves provides a marker in our local varve chronology (Tröften, 1997). A total of 110 varves were counted and measured here (Fig. 78). In the lower sequence, we have observed heavy deformations including vertically standing varves suggesting that it was at this level the 10,469 vBP earthquake struck the area. With a margin of error of only a few varves, this would correspond to the ice marginal position along the Malsjön moraine and where the esker changes character and becomes a flat “pancake”.
Fig. 78. Varve diagram from Millsjön with the paleoseismic events marked; the 10,469 vBP event linked to the ice marginal collapse at Malsjön and the varve deformations at Stop 5-6, and the 10,430 vBP event here followed by 3 thick varves of suspended clay setting. Stop No 6-5: coring Lake Skeppmorasjön for PL transgression We drill the little lake at +45 m. Instead of a sharp isolation contact, we identify a gyttja bed within the upper part of the grey Littorina clay. His bed – which we have found in other sites, too, at similar altitudes – is interpreted as lagunal phases indicative of a sea level oscillation prior to the PTM-2 peak. This was confirmed by a C14-date of the top of the lagoonal gyttja (pre-PTM-2) giving 7105±95 cBP, fitting perfectly well with the age of the PTM-2 trans-gression (as being shown on Days 3 and 4 below; Mörner, 1969).
Fig. 79. Core log from Lake Skeppmorasjön at +45 m. The clay gyttja at 4.40-4.45 m gives evidence of a sea level regression, forming lagoonal conditions, followed by a rise in sea level (transgression) in the order of 4 m (or 3-4 m) to the PL leval at +50 m. Thetop of the lagoonal gyttja was C14-dated at 7105 ±95 cBP.

75
Stop No 6-6: walking “the path of the mind”: 10,500 years in 2 km The “path of the mind” (Swed: Själens Motionsslinga) is an educational time-historical walk as a part of our courses in the area, where the changes in local environmental conditions (land/sea distribution, postglacial immigration, climate, archaeology, etc.) are mirrored against the global evolution in culture, sea level, and climate (cf. BWG 6-1). This time we make an abbreviated version with emphasis on sea level changes and the environmental change from arctic sea bed, via outer archipelago, to inner archipelago and a main land area traversed by a channel (connecting the Baltic proper with the Baltic gulf over the Mälardalen basin) and finally a lake system (remaining an important trading route up to Medieval time) and later an ideal transport system for iron ore and charcoal over the winter ice. When ice receded over the area at about 10,470 vBP, sea level was at about +150 m and the whole area constituted a sea floor. Full arctic water conditions prevailed. At 10,469 vBP a huge earthquake struck the area affecting the esker formation and ice marginal conditions immediately to the north (BWG 6-4). The kettle holes lack all kinds of lake deposits and only have a thin covering peat layer, indicating that the ice blocks were melted subaerially after the emergence some 8000-8500 cBP. We walk up the hill at Stenhuggarmon. At about +80 m there are a number of distinct beach ridged, the highest one of which consists of stones. This is the AL-level formed by the slight transgression of the Ancylus Lake to reach the outlet level in the south as the Närke Strait started to emerge and close this sea connection. This paleo-beach occurs all over the area. The area constituted an outer archipelago (Fig. 80A). The +80 m level here corresponds the +260 m level at Umeå, the +280 m level at Skuleberget and the +215 m level in the Hudiksvall area to the north, and the the+15 m level in Gothenburg, the ±0 level at the mouth of River Viskan, the –24 m level at Torekov and the –38 m regional eustatic level. This gives a field observable recording of the postglacial shoreline tilting (this excursion). On the walk downhill, we pass the PL-shore at +50 m. This is another level occurring all over the area at strictly +50 m. The shoreline at Stop 6-3 is a good example. The evidence of a transgression of about 4 m preceding the PL level was presented in Fig. 79. The area had now become an inner archipelago (Fig. 80B). The shoreline tilt is from +120 m in Umeå, +26 m in Gothenburg, +18 m in the outer Viskan Valley, +5 m at Båstad to –10 m as regional eustatic level. At +33 m there is another quite well expressed sea level position. This is the level of PTM-5A at 5000 cBP. The area had now turned into a major land area crossed by a marine channel (Fig. 80C). Down at the lake-shore, we find marine shells from the period around 5000–6000 cBP (Cardium edule, Mytilus edulis, Littorina obtusata, Macoma Baltica are identified). We had just become farmers. The climate was 2.5o C warmer than today. Wine was growing in the vicinity. Our living conditions and tools were still very “primitive” – especially in comparison with the highly advanced cultures in the south, not least in Mesopotamia were the Gilgamesh Epos was already written down. This small eustatic sea level high is coincidental with the +0.3 m level in the Gulf of Persia, which led to the flooding of the ancient city of Ur (Mörner et al., in prep.). We pass the +25 m level of 4000 cBP, the +13.6 m level of 2700 cBP and come down to the present lake shore at +11 m with the isolation from the Baltic at around 2300 cBP (cf. Fig. 84). We pass some graves and mounds. On the whole, lots of archaeological remains are found along this lake system signifying its importance for travel and trading. There are distinct cuts and remains of old by-pass routs for the sleigh transport of heavy iron ore when the water was turbulent and the winter ice thin. The word “edet” in Långa Edet refers to a place where goods and boats have to be brought over land (“långa” means long). The last channel stage was in 500-700 AD, when the Baltic made a narrow bend towards Lake Visnare, an ancient name that means just “the water at the water bend” (Fig. 81).

76
Fig. 80. Changes in land/sea configuration; (A) 9000 cBP, (B) 7000 cBP and (C) 5000 cBP.

77
Fig. 81. The Marviken lake-system and the huge bent of the Baltic connecting to Lake Visnaren in AD 500-700. “Visnaren” is an ancient name meaning “the water at the water bend” fitting perfectly well with this reconstruction (Mörner & Strandberg, 2001). A strong centre, “Great Åker” (Mörner, 2004c), seems to have grown up around Skäggesta (Stop 6-2).
Stop No 6-7: a Late Holocene paleoseismic event In the hill side there is a dry gully beginning with a bird-foot backward erosion system and ending in an alluvial cone. It borders a large earth slide. Neither the foot of the slide nor the alluvial cone show sings of shore erosion. Hence they should have been formed when the sea level was lower or at around +15 m. An earth slide can be induced by several mechanisms, one of which is ground shaking. The gully is indicative of a simultaneous escape of water. This, in its turn, may be the effect of liquefactions. With this as a possible scenario, we made

78
extensive coring, trenching, dating and mapping work resulting in the identification of a paleiseismic event occurring at around 3200 cBP (Mörner, 2003, p. 251-252; 2008a) and presented in Fig. 82). It includes a proposed fault lineament, 9 slides (including two till slides and two rock slides), a lake tsunami traced over, at least, 6.5 km and a trench with slide covered plant and tree remains (possibly documenting even two sliding episodes). Nine C14-dates give an age in the order of 3200 cBP, fitting well with the shore criteria at the alluvial cone. Also, one of the slides moved a Bronze Age mound downhill (slide 3 in Fig. 82).
Fig. 82. The Lake Marviken area and the field observational records of the 3200 cBP paleoseismic event with related slides (1-9) and local lake tsunami.

79
Stop No 6-8: Krampan; iron industry, brook meandering and the 2700 cBP level In the eastern hillside there is a small quarry of ancient character. Iron must have been quarried by burning wood followed by chilling with water and collection of rock fragments (which was likely to give a spike of iron ions into the water outside). A profile of 7 cores were taken in the lakebed, analyzed for magnetic susceptibility and dated by 10 AMS dates. The result is as follows. At around 500 AD people settled in the area. At around 600 AD, they started to collect iron ore in the quarry (which is the oldest known age for the utilization of iron ore by quarrying crystalline bedrock). In Medieval time, there was a second period of increased iron into the lake. In the 19th century, there was a third iron peak. In contrary, to both the others, this came via the Kvarnbäcken brook, into which the spill-water from the Skottvång Mine now was pumped out. This is illustrated in Fig. 83 (Mörner, 2004c).
Fig. 83. The first iron spike is correlated with the quarrying in the hillside. The 500 AD date signify the establishment of a settlement at Krampan (as recorded in a nearby core), the sudden rise in iron content at 600 AD records the onset of quarrying and the 1500 AD increase is due to increased farming with the onset of industrial iron work at Skottvång. On the western side of the lake, we have a excellent sea level record to explore. The story can be condensed in 3 steps as follows: (1) a stable lake level at +11 m all from the isolation (~2300 cBP) giving rise to a strongly meandering brook and a quite extensive subaqueous delta, (2) a stable sea level at +13.6 m kept for about 500 years from 3100 to 2600 cBP (this is the PTM-7 level in Fig. 84) giving rise to an extensive delta 2-3 m above the present lake and hanging meander-planes behind (some 2-3 m above the present brook level), and (3) a long brook sequence upstream dominated by a V-shaped down-cutting of the brook (due to the predominant factor of uplift). This means that we here have an extraordinary clear record of the PTM-7 level (the delta with associated hanging meander-planes), its eustatic rise component (by uplift transformed into a 400-500 year step), and its following regression (the abrupt end of delta formation and meandering). Fig. 84 merits further analyses. We can see the presence of 3 very abrupt regressions; after PTM-7 at 2700 cBP, after PTM-9 at 1550 cBP and at 950 cBP. The sudden drop in relative sea level 900-1000 BP from +5.2 m to +3.6 m (Fig. 58) is very well fixed by observations (the city wall and bridges at Birka from 980 AD and rock carvings from 1040 AD). In a century, 0.5 m of uplift can be subtracted. The rest – 1.1 m – is eustasy. A part of this – at the most some 0.3 m – may be understood in terms of a regional regression due to a decrease in the Gulf Stream transport (Mörner, e.g. 2006). The rest – 0.8 m – has to be explained in other terms (Mörner, 1999a). In Fig. 85 the eustatic curve is plotted against the bog stratigraphy of recurrence surfaces (closely dated by Aaby, 1976). There is a perfect fit between rapid

80
regressions and recurrence surfaces. The recurrence surfaces refer to periods of extreme dryness. This means that the regression would correspond to periods of dryness and warming, completely opposite to normal eustatic interpretations. Still, this is the case (op. cit.). The explanation lies in a standing Summer high pressure over southern Sweden and a strongly decreased precipitation over the Baltic catchments area deforming the local Baltic sea surface topography and southward tilt.. This seems to be the explanation for all three sudden drops in sea level in Fig. 85 (Mörner, 1999b). Today, it seems highly interesting to note that we, in the past, have had short periods – in the order of 50 years (at least less than 100 years) – with extreme heat and dryness. At the 950 cBP event, severe sand-drift is recorded in many areas. There is even an oral witness, telling that one king who fell back to the Asa creed, was punished by God with such severe dryness that it was not known before (in the Ansgar story by Adam von Bremen). The bogs are sensitive recorders of the changes in precipitation (to be shown tomorrow at Stop 7-5).
Fig. 84. Sea level changes in the last 3500 years in the Marviken–Stockholm area (Fig. 74). Stop No 6-9: Canoeing from Krampan to Laxne Scenic impressions are combined with scientific observations. At Laxne, the valley is crossed by a terminal moraine, dividing the lake system in a northern system (the Marvikarna lakes) draining into Lake Mälaren, and a southern system (Lake Klämmingen) draining into the Baltic. The threshold was lifted out of the sea at about 3700 cBP. When the boats could no longer sail straight across, the boats were simply pulled over the crest by hand. The furrow from this pulling is still to be seen on both sides of the crest. A major Bronze Age mound, an old Medieval road, a 17th century road from a temporary shipping of ore and a lake shore from the late 19th century before a lake lowering in the 1870s are also to be seen.

81
Fig. 85. The local eustatic changes in sea level (from Fig. 84) plotted against the bog stratigraphy of Aaby (1976) with the regional RY-surfaces emphasised. The vector line indicates a perfect correlation between rapid sea level regressions and regional RY-surfaces (red squares). This implies that the rapid regressions (following PTM-7, 9 and 10) were the function of short periods of extreme regional dryness (Mörner, 1999a).
Stavsjö: over-night at Stavsjö Wärdshus Stavsjö is located in the iron-district of Sweden (“Bergslagen”) and here there has been a famous ironworks since several centuries. www.stavsjovardshus.se, tel. 46–(0)11-393150, [email protected]
Day 2 (7): August 16, Stavsjö to Helsjön
Introduction This is a day of a long bus drive down to the Swedish West Coast, with a few adequate stops on the route and much bus-window geology/culture and scenic views. The introduction to the West Coast part will follow further below.
BWG: en route We pass the fault bordering the southern margin of Kålmården and cross the flat (down-faulted cambrosilurian beds) plain of Östergötland. We cross “Göta Kanal”, a channel dug about 200 years ago in order to open a sailing route between Stockholm and Gothenburg via the great lakes of Vättern and Vänern. We make a detour passing the town of Vadstena where the monastery of St. Birgitta was located and where there is an impressive Wasa Castle.

82
Stop No 7-1: Borghamn harbour We face the northern slope of Mt. Omberg, claimed to be a horst. It has been proposed that it might have moved in postglacial time, too. The northern slope is rough and steep at the coast (facing the ice flow direction). This seems rather to be an effect of littoral erosion on a subvertical slope and not a sign of young tectonic activity, however. The Ordovician limestone extends right to the foot of Mt. Omberg. It makes excellent building stones and has been quarried since the 12th century. This limestone is perfectly horizontally bedded and solid (i.e. un-fractured). It certainly contradicts any young tectonic activity (maybe even a Permian horst faulting). The internal structures are interesting and there are even liquefaction-like structures to be found.
BWG: en route We pass the shallow bird-lake of Tåkern. In Mid Holocene time the lake was larger and bordered by swamps and bogs. In Dagsmosse, remains from a Neolithic pile-dwelling settlement have been excavated (e.g. Magnusson, 1964). At Rök, close by, we have the “Rök Stone”, our oldest written document in early runic lettering from about 500 AD telling about Theoderic, ruler of East Gothians. We drive the scenic road along Lake Vättern, a deep graben structure right in the so-called Protegine zone. Because the outlet of Lake Vättern is located at Motala in the NNE, the level of the lake must rotate with respect to this point and the decreasing tilt-gradient with time, causing a significant transgression in the south of Lake Vättern all since the time of isolation some 9000 years ago. This rise in lake level is to be seen at Husqvarna–Jönköping. When we climb the hill south of Jönköping, we pass the Marine Limit and continue to drive in area deglaciated in supraaquatic environment. At Ulricehamn, we pass an old trading route from the west coast (Falkenberg today) up into the county of Västergötland and further into Östergötland and up to Svealand with the old centres of Uppsala and Birka. In the city of Borås, we turn down the Viskan Valley, our target for the afternoon and tomorrow. The main introduction is given at the onset of tomorrow’s program. We will focus three main factors; deglaciation, sea level changes and climate, all being central themes of my thesis (Mörner, 1969).
Stop No 7-2: the ML level and liquefaction site at Kinnarumma At Kinnarumma we have the innermost ML-delta of the Viskan-Häggån valley. The contact between the flat delta surface and the unwashed till-slope provides an excellent reading of ML; here at +88 m with an age of 11,700 cBP (Mörner, 1969). We are 55 km upstream the Viskan Valley at the extremity of the Older Sea Fiord (cf. below). In a gravel pit in the Kinnarumma delta clear liquefaction structures were recorded (Mörner, 1986, 1999b, 2003, p. 277-280, 2005, Fig. 26). When first observed (Mörner, 1969, p. 145), a seismic wedge was covered by a bed of course, angular and unsorted material. The 11,600 cBP shoreline can be followed over a wide area as will be demonstrated the next two days (Fig. 87). At Fjärås (Stop 7-4), the shoreline passes at +66 m, which is the level of a very strong event of erosion/deposition. At Veddige the level is +45 m, fitting perfectly well with small re-deposited delta with its level at +44-45 m and covering glacial clay with shells dated at 11,565 ±180 cBP (Mörner, 1969, 2003, 2005). The layer of re-deposited gravel and sand has been followed 4 km downstream of Vedige, indicating a very significant event of deposition. This event can also be associated with liquefaction and sedimentary deformation structures on the coastal plane of Halland and with earth slides and liquefaction at Båstad (Mörner, 2003). Therefore, we believe that all these records (from an area of 100x50 km) can be explained by a large earthquake occurring about 11,600 cBP. A tsunami wave has been traced at several sites. The magnitude was estimated at about M >7.

83
Stop No 7-3: the YD-delta and OD-moraine and PL-delta at Berghem We stop at Berghem. Today, there is a clear climatic boundary right at the church. There are three things to consider; (1) an YD-delta to the north, (2) an OD moraine zone right at the church, and (3) the PL delta to the south. Just north of our stop, there is a “double delta” with a surface at +37 m (von Post, 1968; Mörner, 1969, p. 160) consisting of: A an upper delta unit with its surface at about +37 m B a clay unit C a lower delta unit D marine fiord sediments As this delta belongs to the Younger Dryas period, the layer B clay was interpreted by Mörner (1969) as an estuarine “Dryas-Clay” equivalent to the well-known “Dryas-Clay” deposited in lakes and bogs. Alternatively, one may consider the effects of the huge tsunami of the 10,430 vBP event in the Mälardalen region (above). The Berghem Moraine zone crosses the road in the form of three separate till ridges. The corresponding ML-level was at +80 m. This stadial is dated at the Older Dryas period (Mörner, 1969, 1979b, Fig. 6). To the south, there is a wide flat delta area of the PL level, here formed after a significant transgression (further tomorrow). It forms the extremity of the Younger Sea Fiord, 35 km upstream the Viskan Valley. Stop No 7-4: the Fjärså Bräcka terminal moraine Fjärås Bräcka is an impressive and classical terminal moraine in Sweden. It acts as a valley threshold damming Lake Lygnern. It has given the name to the Fjärås Ice Marginal Line and Fjärås Stadial (Mörner, 1969). Chronologically, it is separates the marine Ågård Interstadial from the continental Bölling Interstadial sensu stricto. It lasted some 50-85 years. The corresponding ML is at +77-78 m. The main glacifluvial surface of the western side is only graded to +66 m, however. This corresponds to a sea level position at 11,600 cBP (as discussed at Stop 7-2). We drive across the Fjärås terminal moraine in order to explore the dimensions and character of this impressive ice marginal deposit. The glacifluvial bed in the west changes over to large till beds in the east. Obviously ice stood right up to the moraine with a direct ice contact surface. On the slopes of the terminal moraine, there are numerous cultural remains. The Li grave field and megaliths are especially impressive. In an active gravel pit, we get an insight to the strongly polished bedrock surface beneath and the thick cover of till and glacifluvium. There is also a thick marine clay bed capped with regressional “washed gravel”. The clay contains a lower varved sequence and an upper normal marine grey clay unit. Both units contain a number of mollusc shells. At about 12,700 cBP a new boreal mollusc fauna suddenly invaded Kattegatt (giving rise to the identification of a separate Ågård Interstadial; Mörner, 1969). A climatic deterioration is recorded during the Fj-stadial (the fauna changes and the species become smaller). At about the same time, the Gothenburg geomagnetic “flip” occurred (Mörner, 2003, p. 285). Stop No 7-5: the bog of Älgare mosse Älgare Mosse is a raised bog dammed by a small end moraine. The ice receded in late Ågård time, shortly before the halt along the Fjärås line building up a terminal delta at Björkhult 2 km eastwards. ML is at +74 m. Shells in marine clay are dated at 12,450 cBP. The threshold is at +41 m, which means that the basin should have been isolated in the middle of the Alleröd Interstadial. Fig. 86 gives the chrono-stratigraphy of the lake sediments. The isolation (= onset

84
of gyttja production) is established in the middle of pollen zone II (= AL, Alleröd). The Younger Dryas Stadial (zone III or YD) is identified both palynologically (zone III) and sedimentologically (Dryas Clay), bracketed by two radiocarbon dates (Fig. 86 left). The bog itself is a raised bog; i.e. a Sphagnum peat bog feed by the precipitation allowing it to “raise” over the ground. It included several recurrence levels (RY) of short periods of extreme dryness (cf. Fig. 83). A separate coring will be undertaken from the top of the bog in order to document the RY-surfaces and the lake phase below (Fig. 86, left). The peat layer is 7 m thick and contains several distinct RY-surfaces. The lake stage 7.1–8.3 records the isolation in Alleröd and the Dryas Clay at 7.8–8.0 m down.
Fig. 86. The Älgare Mosse records of the isolation and lake stage with “Dryas Clay” C14-dated at the Younger Dryas interval (Mörner, 1969) and the new bog record with a number of RY-surfaces (about 1 m peat per 1000 year).
Helsjön: over-night at Helsjöns folkhögskola This is a pension of a school. It is located at a small lake in the forestland of the West Coast. Tel. 46–(0)320-205840, [email protected]

85
Day 3 (8): August 18, Helsjön to Hovs Hallar
Introduction The Swedish West Coast and the Viskan Valley was intensively studied by von Post in the 30s (von Post, e.g. 1968) and by Mörner in the 60s (Mörner, 1969), both realizing that this was an ideal place for a detailed analysis of the isostatic and eustatic interaction and its subtraction into individual components (von Post, 1952; Mörner, 1971). The direction of tilting has been and is still constantly from N 40o E. The tide is negligible in the Kattegatt today and seems to have been so all since the deglaciation. The ML related to each of the major moraine lines form synchronous shorelines that may be dated further seawards via radiocarbon and pollen dating of the isolation levels of lakes (Fig. 87; Mörner, 1979b). From high ML levels of extensive sea fiords, the sea level was displaced to low levels (the “Regression Maximum", RL) in early Holocene time; in the Viskan Valley a valley lake was isolated, the "Ancient Lake Veselången", giving name to the ALV stages and shorelines (Mörner 1969). At about 7750 cBP, a distinct transgression buried the old land surfaces and ALV-shorelines, and invaded the Ancient Lake Veselången establishing the "Younger Sea Fiord". The Holocene sea level changes are characterized by a sequence of Postgiacial Transgression Maxima (PTM) forming synchronous shorelines all along the west coast: the PTM-shorelines (Mörner 1969, 1980b). The shorelines were followed some 250-350 km in the direction of tilting. They exhibit a bend along the northern slope of the horst of Hallandsåsen and its extension out into the Kattegatt (e.g. Mörner, 2004). The age of the shorelines is backed up by hundreds of radiocarbon dates. Geodetic data on the present uplift agree perfectly well with the geological data and establish a "double-nature" of the uplift (Mörner, 1973, 1979a, 1980a, 1990, 1991).
Fig. 87. Late glacial regressive shorelines (in synchronous ice contact: blue) successively falling down to the ALV-1 shoreline of the “regression maximum” or RL (Mörner, 1979b). The Viskan Valley The Viskan Valley was intensively investigated by von Post (e.g. 1968) and Mörner (1969). It occupies a key position in the sea level story. Four major stages are recognizable:

86
(1) The Older Sea Fiord: The ice receded with two major halts; during the Fjärås Stadial and the Older Dryas Stadial. In front of the receding ice, a Late Glacial sea fiord extended reaching about 55 km inland. Numerous shore marks from this stage are present in the valley sides (some 2000 were levelled by von Post). Due to the more or less continual regression in Late Glacial time, those shore marks do not represent synchronous shorelines, however (Mörner 1969).
(2) The Ancient LakeVeselången (ALV): A valley lake was isolated north of the thresholds at Järlöv with a mean lake level dammed 2.2 m above the sea level. This lake reached 15 km inland to the Björketorp-Sundholmen area where deltas were built out. Three different ALV stages were distinguished with only the first stage being truly lacustrine (Mörner 1969). The ALV stages lasted from 9750 to 7750 cBP. Fig. 88 gives the ALV-shoreline diagram and location of cored sections.
(3) The Younger Sea Fiord: A Postglacial sea fiord was created with the transgression up to PTM-2 (starting 7750 cBP and peaking 7000 cBP). It reached about 35 km inland. Several minor sea level oscillations are recorded during this fiord stage, which lasted up to about 4500 cBP. Fig. 89 gives the PTM-shoreline diagram and the multiple parameter data controlling it.
(4) The Recent Lake Veselången: Between PTM-5B and PTM-6, a new valley lake was isolated north of the thresholds at Järlöv. It reached up to Sundholmen from where a delta with levées was built out into the lake with an estimated rate of 1.5 m/year Wenner 1950). This stage was ended by artificial draining in 1859 and 1917.
In the Jarlöv area, the valley is narrow and the valley floor covered by sandy-gravely layers that acted as thresholds in Postglacial time, damming the Ancient Lake Veselången at +7 m and the Recent Lake Vesellången at +12 m. The threshold rests on clay and was raised in connection with the Younger Sea Fiord transgressions. The ALV shorelines in the Viskan Valley ALV stands for Ancient Lake Veselången, the valley lake that was isolated in the Viskan Valley in early Holocene time between the Older Sea Fiord regression and Younger Sea Fiord transgression. Three different stages and shorelines were distinguished (Mörner, 1969). As the ALV shorelines are now buried under the sediments of the Younger Sea Fiord, they must be studied by coring. This burial, however, meant two very important things, viz that the shore features were preserved and that a stratigraphy was created that allows close dating by pollen and radiocarbon. The fact that the ALV stages belong to the Preboreal and Boreal is also important, as the pollen zonation is here good and easily established. Von Post had numerous sections cored across the valley during the 1930s and 1940s (von Post 1968, posthumously published by the author), later supplemented by new sections, corings and numerous radiocarbon dates combined with pollen analysis (Mörner 1969). Three ALV shorelines/stages were established by Mörner (1969). They are all considered to be very precisely fixed as to altitude and gradient, and closely dated at several places along the shore line diagram. Fig. 88 gives the location of the sections and borings with respect to the direction of tilting, and the established shoreline diagram. ALV-1: A very distinct shorelevel of the "Regression Maximum” (determined and mapped over the entire Kattegatt region; Mörner, 1969, Pl. 7). This stage is well dated at 9700-9300 cBP. During this stage, the shore level remained quite stationary (syngression) without any observable changes either from eustatic or isostatic causes. The Ancient Lake Veselången was dammed 2.2 m (mean-water level) above the sea level as ALV-1b. South of Björketorp, time allowed the delta to advance about 2 km downstream (i e. by about 5 m per year). The intersection between the ALV-1 shoreline and the present sea level lies at Section 40, which was, therefore, chosen as 0-point in all shoreline diagrams.

87
Fig. 88. The ALV shorelines along the Viskan Valley in the direction of tilting (above) and the geographic location of cores and sections and the profile line (below) as given in Mörner (1969). This excursion will follow the valley from the PL delta to the river mouth. ALV-2 (= PTM-1): A distinct marine transgression started at 9300 cBP and brought the sea level up to ALV-2. This meant an ingression of salt water in Ancient Lake Veselången as indicated by the diatom diagrams (von Post, 1968; Mörner, 1969). The transgression peaked shortly before the onset of the Alnus curve or at about 8500-8300 cBP. This transgression is well established outside as well as inside the Ancient Lake Veselången proper, in the delta area as well as in the old riverbeds further upstream. The ALV-2 (PTM-1) transgression is caused by a large and rapid eustatic rise in sea level. ALV-3: A marine regression (not isostatically caused) rapidly brought the sea level down to a second low level, ALV-3. This stage lasted from 8300 to 7750 cBP. It ended with the onset of the PTM-2 transgression, which is well recorded and dated. During ALV-3 no changes of either eustatic or isostatic causes are observed (= syngression). As indicated by the diatom diagrams, the Ancient Lake Veselången was almost entirely locustrine, though it was
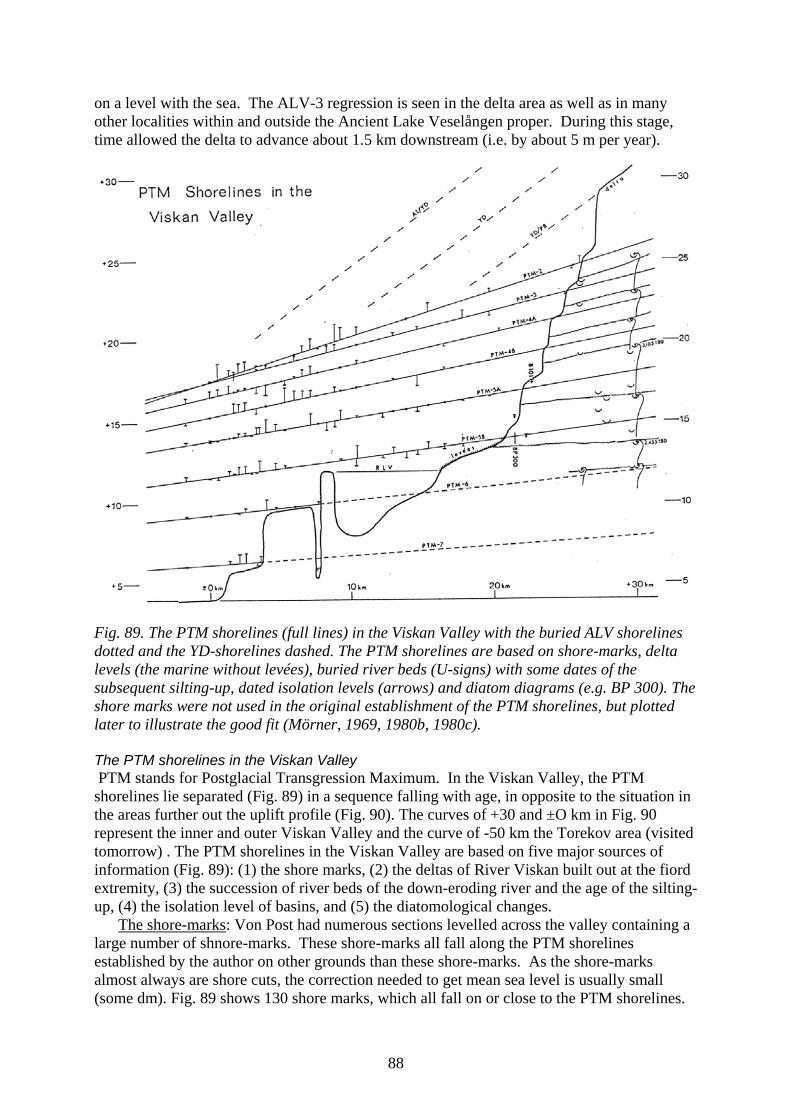
88
on a level with the sea. The ALV-3 regression is seen in the delta area as well as in many other localities within and outside the Ancient Lake Veselången proper. During this stage, time allowed the delta to advance about 1.5 km downstream (i.e. by about 5 m per year).
Fig. 89. The PTM shorelines (full lines) in the Viskan Valley with the buried ALV shorelines dotted and the YD-shorelines dashed. The PTM shorelines are based on shore-marks, delta levels (the marine without levées), buried river beds (U-signs) with some dates of the subsequent silting-up, dated isolation levels (arrows) and diatom diagrams (e.g. BP 300). The shore marks were not used in the original establishment of the PTM shorelines, but plotted later to illustrate the good fit (Mörner, 1969, 1980b, 1980c). The PTM shorelines in the Viskan Valley PTM stands for Postglacial Transgression Maximum. In the Viskan Valley, the PTM shorelines lie separated (Fig. 89) in a sequence falling with age, in opposite to the situation in the areas further out the uplift profile (Fig. 90). The curves of +30 and ±O km in Fig. 90 represent the inner and outer Viskan Valley and the curve of -50 km the Torekov area (visited tomorrow) . The PTM shorelines in the Viskan Valley are based on five major sources of information (Fig. 89): (1) the shore marks, (2) the deltas of River Viskan built out at the fiord extremity, (3) the succession of river beds of the down-eroding river and the age of the silting-up, (4) the isolation level of basins, and (5) the diatomological changes. The shore-marks: Von Post had numerous sections levelled across the valley containing a large number of shnore-marks. These shore-marks all fall along the PTM shorelines established by the author on other grounds than these shore-marks. As the shore-marks almost always are shore cuts, the correction needed to get mean sea level is usually small (some dm). Fig. 89 shows 130 shore marks, which all fall on or close to the PTM shorelines.

89
In the outermost area of the Viskan Valley, von Post had the shore-marks mapped and levelled for 4 km (Mörner 1969) as shown in Fig. 95. The deltas: Between Björketorp and Sundholmen, there are successively lower deltas, each of which corresponds to a PTM shoreline: viz. at about +25.0-25.8 m (PTM-2), +23.0-23.6 m (distinct; PTM-3), +21.4 m (distinct; PTM-4A, renamed PTM-3B), +19.5 m (indistinct; PTM-4B, renamed PTM-4), +18-17 m (very distinct; PTM-5A) and +14.5-15.0 m (distinct; PTM-5B). All these are marine deltas lacking levées. From the isolation of Recent Lake Veselången on, the delta was built out with levées (Wenner, 1950). The riverbeds: Upstream the delta, there is a series of successively lower buried riverbeds which correlate with the deltas and the PTM shorelines. Obviously, a PTM stage corresponds to a period of aggradations (delta, riverbed), whilst a PR stage corresponds to a period of erosion. When a riverbed was left by the down-eroding river, infilling of alluvial sediments started. Radiocarbon dates from the basal part of the alluvial sediments covering these river- beds are in full agreement with the PTM shorelines (Fig. 89). The isolation levels: The isolation of Kattunga Mosse is of greatest importance (Mörner 1969). Palynologically, this isolation took place in earliest zone VIII (SB-1) at the local pollen horizon No. 2, which is dated at 4890 ±90 BP. At the local horizon No. 3, peat formation started in the bogs of Lönnebo and Sundholmen. The diatom diagrams: Several diatom diagrams have been published by von Post (1968) and discussed by Mörner (1969). The diagram of BP 300 is especially interesting as it shows a double peak of marine diatoms in earliest zone VIIl (SB-1). The first marine peak falls between the local pollen horizons No. 1 and 2, and undoubtedly corresponds to PTM-5A (Fig. 93). A regression occurred at about horizon No. 3. A final marine stage occurred just after horizon No. 3, and obviously corresponds to PTM-5B.
Fig. 90. Sea level curves from +50 to –250 km along the shoreline profile (Mörner, 1969). Points ±0 to + 30 km refers to the Viskan Valley (Fig. 89), curve –50 km to the Torekov area and curve –200 km approximates the eustatic curve very well (Fig. 103; Mörner, 1973).

90
The shoreline diagram: The available data from the above mentioned sources of information are put together in Fig. 89. PTM-2 to PTM-5B reached above the threshold at Järlöv. PTM-6 reached into Lake Dran. PTM-7 reached the area just south of Veddige. There are very good correlations between all the PTM shorelines and the corresponding shore-marks, deltas and riverbeds. PTM-5A and PTM-5B are directly dated in this area, the others are directly dated in other parts of the west coast. Note that the age of PTM-5A obtained here (+18 m) and in Torekov (+7.4 m) is the same (not to say identical).
Stop No 8-1: the PL delta of the Younger Sea Fiord South of Berghem, there is a huge delta at about +29.6–31.0 m. It was built out in the Older Sea Fiord in latest YD-time, and gives another example of the drastically increased sedimen-tation during the Younger Dryas Stadial (alluvial dates in Mörner 1969, p. 238). Sections in the meander plains between Berghem and Björketorp (Wenner 1950) show successions of riverbeds (Mörner 1969, p. 238, 306); an old corresponding to the regression down to ALV-1, and a young corresponding to the regression down from PTM-2 (Fig. 91). Radiocarbon dates confirm the double system and the relation of the riverbeds to the ALV and PTM shorelines. In the Björketorp area, we pass the deltas of PTM-2, PTM-3A and PTM-3B (4A). At Björketorp (still on the PTM-3B delta) we cross River Viskan and drive down to Kattunga Mosse at the northern end of the large delta of PTM-5A.
Fig. 91. The double system of down-eroding riverbeds within the delta just upstream of the main PL delta; (1) down to ALV-1 and (2) down from PL. The silting-up is C14 dated. Stop No 8-2: the Kattunga mosse stratigraphy Kattunga Mosse nicely illustrates the four main stages in evolution of the Viskan Valley after deglaciation (Fig. 92). The stratigraphy is as follows (1) The recent bog, Kattunga Mosse, with a short initial lake stage. (2) The Younger Sea Fiord, bracketed by two dates at 7600 to 4900 cBP (PTM-2 – PTM-5A). (3) The Ancient Lake Kattunga with three substages:
a swampy peat area with an open lake in tile middle (= ALV-3) as seen in Fig. 92, a shallow lake with lacustrine-alluvial sedimentation (= ALV-2), and ponds with alluvial sedimentation and intermittently inundated land (= ALV-1b).
(4) The Older Sea Fiord with deposition of marine "blue-clay" In core B 101, radiocarbon dates have been made of 1.5 cm thick samples of the lacustrine sediments immediately above and below the marine Ruppia gyttia (“mud”) of the Younger

91
Sea Fiord, which lasted from the onset of the PTM-2 transgression up to the regression after the PTM-5A level (which fits perfectly well with the delta level of +17.5 m at PTM-5A (Fig. 89). The pollen diagram of BP 273 includes three important local horizons at about the isolation level (Mörner, 1969), which were used for correlations with BP 300 (Fig. 93) and other diagrams within the delta region.
Fig. 92. Kattunga Mosse, core B 101; elevation, stratigraphy, dating and main stages (with Ancient Lake Kattunga representing ALV-3 and Younger Sea Fiord = PTM-2 to PTM-3A). Stop No 8-3: view of the ALV subsurface delta area From the valley side we have a good view over the delta area between Björketorp and Sundholmen. The delta area is very important for the reconstruction of the sea level changes during the time of Ancient Lake Veselången (Mörner 1969, p. 223-237). Seven sections have been cored across the valley (Mörner 1969, Pl. 8). Five pollen and two diatom diagrams by von Post (1968) and nine pollen diagrams and 20 radiocarbon dates by Mörner (1969) have made it possible to reconstruct the ALV changes in details. (1) During ALV-1 a delta was built out (with levées) from the area just north of Section 11
about 2 km downstream to the area between Sections 4 and 14 (i.e. with 5 m/yr). (2) By the transgression up to ALV-2, the delta was displaced northwards again to the area of
about Section 13, lacustrine gyttja covered the ALV-1 delta and a distinct shore cut was eroded in Section 14.
(3) By the regression down to ALV-3 large swamps were formed. During this stage, the delta advanced about 1.5 km downstream to Section 14 (i.e. with 5 m/yr). A reconstruction of the delta area just before the end of this stage is given by Mörner (1969, Fig. 75).

92
The diatom diagram of BP 300 (Fig. 93) in Section 15 records this threefold division of the ALV stage. In Section 4, a double ALV delta is buried under the Ruppia gyttja of the Younger Sea Fiord. In the eastern part of Section 14, there is a distinct (buried) shore cut terrace at +15.5 m belonging to ALV-2 (Fig. 94). The terrace is covered by brushwood peat formed on land above the lake. This is a good indication of the regression from ALV-2 to ALV-3. Fig. 94 gives the stratigraphy and C14-dates of core B 100, closely dating the ALV-3 stage (cf. the well-dated sequence in Krokens Mosse in Mörner 1980c, Fig. 6).
Fig. 93. Litho-, pollen- and diatom-stratigraphy at BP 300 in Section 15 (Mörner, 1980b). Stop No 8-4: PTM-levels at south of Horred Just south of Horred there is a very distinct shoreline cut into the valley side. It is the PTM-5A level at +16 m (Fig. 89). There are other PTM shore-marks, too. At the Viskan River, lies the last point of the delta built out with levées into the Recent Lake Veselången before the artificial drainage of the lake in 1859 and 1917 (Wenner, 1950). In the river sediments, a fault has been recorded (the ALV peat and early covering delta sediments being displaced 20 cm) and been explained in terms of a slide (Mörner, 2008a).

93
Fig. 94. The ALV-2 shore cut in section 14 and the ages obtained in core B 100 of ALV-3 and the onset of the PTM-2 transgression (cf. Mörner 1980c, Fig. 6). BWG No 8-1: the Veddige area On each side of the valley, there is a large glacifluvial delta built up to ML at +71 m by lateral meltwater between the ice and the hill slope at the time of the Fjärås Stadial at 12.400 cBP when there was a distinct halt in the ice recession (Mörner, 1969). Between the two giacifluvial deltas, there is a small “delta” built up only to +44-45 m. Both von Post and Caldenius thought that this was an ice marginal deposit, too; a remnant of a large horseshoe-shaped moraine. The whole "delta" at Kalvhult rests upon late glacial clay, however, dated at 11,565 +180 cBP indicating that the "delta" is not an ice marginal deposition but the result of heavy re-deposition in early Alleröd time. The level fits the 10,600 cBP shoreline perfectly well, indicating that the re-deposition and soutward spreading of sand are to be linket with the “Kinnarumma paleoseismic event” (Stop 7-2; Mörner, 2003). In this area ALV-1 is at +4 m and PL at +20 m (Figs. 88-89).
Fig. 95. Individual shorelines followed laterally and levelled along the valley side for 4 km, with the position of PTM shorelines established on other grounds (from Mörner, 1969).

94
Stop No 8-5: successive PTM shore cuts In the area between Åsbro and Åskloster, there is a complete sequence of PTM shorelines. The shore-marks are cut into the till in the valley side (Fig. 95B). They were individually mapped and levelled for 4 km along the valley side in the 30s, and there is a very good fit with the PTM shorelines of Mörner (Fig. 95A; Mörner, 1969, Fig. 112). Stop No 8-6: the buried ALV-1 evidence of RL at ±0 m A buried riverbed, cut down into the Late Glacial blue-clay, is revealed by this section (and Sections 39 and 41 close-by; Mörner, 1969). The buried blue-clay surface along the buried river channel is weathered into a dry-crust and covered by organic remains representing an old land surface transgressed by the ALV-2 (PTM-1) transgression at 9300 cBP. Section 40 marks the place where the ALV-1 shoreline intersects the present sea level, nicely illustrated by the equal depth of the present and buried river channels (Fig. 96). Section 40 was therefore chosen as a zero-point in the Viskan-Kattegatt analyses (Mörner, 1969). The end of the ALV-1 stage is well-dated in a number of cores. The marine deposits covering the old land-surface are interrupted by a deltaic layer of sand that polynologically belongs to the late Boreal (BO-2). It represents aggradations during the ALV-3 stage (Mörner, 1969, Fig. 54).
Fig. 96. Cross section of the Viskan River valley revealing the presence of a buried river bed at exactly the same level as the present one. This signifies the ALV-1 regression limit (RL). The ALV riverbed contains a shell bank primarily of oyster shells. Buried dry-crusts and organic land horizons occur; dated at 9280 cBP. Characteristics Max uplift ~150 m of Point Zero Deglaciation ~12,500 cBP Section 40: ML-level ~70 m 9300 cBP (ALV-1), RL ±0.0 m 7000 cBP (PTM-2+3A), PL +17.6 m 5000 cBP (PTM-5A) +14.0 m 2700 cBP (PTM-7) +6.3 m Relative Uplift 0.75 mm/yr Absolute Uplift 1.85 mm/yr SW of the zero point, the RL goes below the present sea level. Submarine peat of the ALV-1 stage have been cored and dated (Mörner, 1969). During the ALV-1 stage (RL), the Kattegatt Sea was less than 50% of its present size with large land areas where now is sea. This has been mapped in details by off-shore work (Mörner, 1969, PL 7). In the Bay of Laholm, for example, there is a back-barrier freshwater swamp of about 1 km2 at a depth of –16 m, and at Hallands Väderö, there is a submarine shore at –22 m (to be discussed tomorrow).

95
Stop No 8-7: Tvååker Between Varberg and Falkenberg, the Postglacial Limit (PL) is very distinct and can be followed as a marked beach ridge along the road Träslövsläge-Tvååker-Morup-Falkenberg. The area is traversed by a great number of terminal moraine ridges, which to a great extent have influenced the position of the PTM shorelines. PL is polygenous as all the shorelines from PTM-2 to PTM-5A lie close together. The lagoonal area at Tvååker was isolated in middle YD-time and transgressed by the PTM-2 transgression (Mörner 1969). In a ditch, the following stratigraphy is accessible.
A: eolian sand. B: sand alternating with layers of gyttja and humus. C: grey littoral sand. D: sandy marine clayey gyttja with a boreo-licitanic mollusc fauna and pollen of
zone AT). E: peat, 0.77 m thick. Palynologically the base belongs to the YD zone and the
top to the BO-2 zone. The topmost 1.5 cm was dated at 7565 ±160 cBP and the basal 1 .5 cm was dated at 10, 305 ±120 cBP. F: blue-grey sand with increasing clay content downwards, a shore deposit from
middle Younger Dryas time when the sea passed the level of +8-9 m. Note that this +8-9 m shorelevel indication correlate with the younger part of the +37 m delta at Berghem providing a good illustration of the local tilt (Mörner 1969). Stop No 8-8: liquefaction in Hunnestad gravel pits In these gravel pits, I recorded very clear liquefaction structures (Mörner, 2003, p. 282; cf. Påsse, 1990). The liquefied beds are covered by a littoral bed including pebbles and stones of flint and chalk coming from the Öresund region by drifting icebergs. The site is interpreted as giving evidence of a paleoseismic event at about 12,400 cBP and a related tsunami event (flooding the surface with littoral material and drifting icebergs (Mörner, 2003). BWG No 8-2: the Halmstad sea level story At Halmstad there is a large glaifluvial terminal moraine delta with a ML-level at +63 m. The subsequent regresstion brought sea level to a minimum (RL) at the ALV-1 stage 9300 cBP at -13.5 m indicated by river down cut and submarine dry-crust level. The subsequent trans-gression culminated at +12.7-13.0 m, the local PL level formed by the PTM-4 and -5A oscillations. We pass a prominent PL shoreline just after crossing River Nissan. Characteristics of Deglaciation 12,800 cBP the Halmstad area: ML-level 63 m 9300 BP (ALV-1), RL -13.5 m 7000 BP (PTM-2) +10,3 m PL (PTM-4–5A) +12.7-13.0 m 2700 BP (PTM-7) +4.7 m Present absolute uplift 1.6 mm/yr Present relative uplift 0.5 mm/yr BWG No 8-3: the coastal plain We drive over the Laholm coastal plain, in the south bounded by the Mt. Hallandsåsen horst. The plane was exposed above sea level during Younger Dryas time and suffered cryoturbation (Svensson, 1964). Ice blocks, left from the deglaciation around 13,000 cBP, did not melt until the sudden Holocene warming around 10,000 cBP (Mörner, 1969, p. 141). River Stensån has a buried old river channel cut down to –9 m (De Geer, 1893), another old evidence of the deep regression preceding “the Postglacial Transgression” (Mörner, 1969, p. 255).

96
Stop No 8-9: liquefaction at Östrakarup At the 1999 international excursion (Mörner, 1999b), we explored a fresh road section including a spectrum of different deformational structures (Mörner, 2003, p. 269-270). In this site (contrary to the previous ones visited), the surface had been exposed during the Younger Dryas cold phase. Therefore, cryoturbation had to be considered (the more so because of the report of Svensson, 1964). Hence, we spent much time at this site. Interestingly, after extensive cleaning and much discussion, all participants seemed to set for liquefaction. And, certainly the wedges and faults were accompanied with venting and flow structures indicative of fluid motions (Mörner, 2003, 2005). In the hillside, there are several shorelines to be seen. In the one at +27 m and correlated with the Fjärrås line from 12.400 cBP, bones of a polar bear has been found and dated at about the same age. BWG No 8-4: the disastrous tunnel through Hallandsåsen Instead of doing proper basic ground analyses, the tunnel builder draw a line on the map, disregarded geological knowledge, made the decision to build but with a much reduced budget and at a higher speed, and to use a giant drill corer which was bound to fail in this strongly fractured and altered bedrock. When the operation failed, one tried to stabilize the walls with injection of a highly poisonous Rocha Gil mixture. The scandal was obvious when fishes died and cows became badly sick. Now they have frozen the bedrock down to –40o C, ignoring the seepage of methane – will there be a future Skålboberget explosion?
Hovs Hallar (Båstad): over-night at Hovs Hallar Hotel Hovs Hallar is a hotel and conference centre right at the dramatic coastal cliff. The view over the sea is magnificent. The geology is all around. There are excellent walking tracks. It is a place for scenic impressions, picnic and swimming. www.hovshallar.com, tel. 46–(0)431-448370, [email protected]
Day 4: August 18, in the area around Hovs Hallar
Introduction The Bjäre Peninsula is a horst uplifted in the Cretaceous. The northern fault line exhibits resumed activity. At about 8000 cBP a bending (a hinge zone) was initiated along this fault (Fig. 87; Mörner, 1969). All pre-8000 shorelines have equal tilting on both sides (after subtraction of the post-8000 changes), whilst post-8000 shorelines show a constantly increasing tilt difference between the two sides. Therefore, we know that the tilting commenced at around 8000 cBP (between the ALV-3 and PTM-2 shorelines). Many earthquakes are located to this zone, not least three successive events in the Kattegatt in the mid-80s with magnitudes around M 4. A total of 14 paleoseismic events have been reported from the Kattegatt-West Coast region with 5 events in the Late Holocene (Mörner, 2003, p. 269-288; 2008a). The Marine Limit is closely fixed at +50 m. The area was deglaciated shortly before and up to about 13,200 cBP when ice readvanced onto the northern slope of Mt. Hallandsåsen (cf. Fig. 98; Mörner, 1969, 1979b). With a few prominent late glacial shore marks (e.g. at +30 m), sea level fell to an ALV-1 minimum (RL) far below sea level. Outside the Island of Hallands Väderö, a sharp submarine cliff ends in a shingle plain at –22.5 m (very much like the morphology at Hovs Hallar today). In the centre of the Bay of Laholmsbukten, there is a large submarine peat bog at –16 m and an extensive dry-crust level (here I had 48 cores taken in the 60s, Mörner, 1969).

97
The subsequent PTM transgressions and oscillations are well constrained by numerous morphological elements and radiocarbon dates (Fig. 97A). Many of the key sites will be visited and explored. From the changes in coastal dynamics, shore morphology and direction of shore construction, a curve of changes in prevailing wind direction over the last 10,000 years was established (Fig. 97B).
Fig. 97. A: the Bjäre Peninsula sea level curve based on shore morphology, stratigraphy and 37 radiocarbon dates (from Mörner, 1980b, 1980c). B: changes in prevailing wind direction. Characteristics of Max total uplift >100 m Båstad-Torekov: Deglaciation 13,200 cBP ML-level +50 m onset of tilting 12,700 cBP +28-30 m 9300 BP (ALV-1), RL -24.2 m 7000 BP (PTM-2) +5.2 m PL (PTM-4–5A) +7.8-7.5 m 2700 BP (PTM-7) +3.8 m Relative uplift 0.2 mm/yr Absolute uplift 1.3 mm/yr Paleoseismic events 14 in 13,000 years Late Holocene earthquakes 4–5, max M ~7

98
Stop No 9-1: Hovs Hallar The ML at +50 m is marked by a distinct rock cut terrace, with corresponding upper limit of beach material and lower limit of supraaquatic ice marginal phenomena. ALV-1 lies at -22.5 m. PL at about +7.8 m is formed by a rock cut terrace and beach ridge material. To the SW, the PL rock cliff changes over to a till cliff with hanging dead gullies. 1 km to the east, there is a nice sequence of 9 PTM beaches below the PL-shore (Mörner, 2003, p. 274) with a major talus shattering between PTM-6 (4050 cBP) and PTM-7 (2700 cBP). All along the cliffs, from cove to cove, one can distinguish a number of events of simultaneous talus shuttering that are likely to be driven by paleoseismics; viz. at 4800 cBP, 3500 ±600 cBP, 2000 cBP, 1300 cBP and 900 cBP (Mörner, 2003, p. 273-277; 2008a). Above ML, there is a till accumulation containing abundant Cretaceous rock fragments which represents the Low Baltic readvance. In front of this ridge, there are meltwater channels ending at ML. This ice marginal position and ML represent the G4-line, i.e. the initial, major, phase of the Low Baltic Stadial (Fig. 98).
Fig. 98. Ice cover at the G4 readvance stage at around 13,200 cBP with ML and dotted line for the G4 shoreline. The sites of today’s program are also marked. L = lunch place. BWG: No 9-1: the double ML There is a ML shoreline at +49.5 m. Outside and below this, there is an even more clear shoreline at about +46 m. It grades up to the outlet of a canyon, which was fed by water from the G4 ice readvance (Fig. 98). Coastward, there is a flat surface of the late glacial seabed.
Stop No 9-2: Eskilstorp buried sea level sequence The hill slope represents the fault line scarp of the Mt. Hallandsåsen horst. It was active also in postglacial time, and is the line along which all the post-8000 cBP shorelines are bent; i.e. it acted as a hinge (for the last 8000 years). There are nice late glacial shorelines at +30 m and +13-14 m. There are also clear structural evidence of slides; slide marks as well as alluvial cones. At Eskiltorp, there is a fairly extensive alluvial cone going down over the PL shore.

99
At Eskilstorp, I recorded a most important section (Mörner, 1969, Pl. 10) where the PTM-2 at, PTM-3A and PTM-3B oscillations could be identified, fixed as to sea level position and dated by radiocarbon (Fig. 99). The buried PTM-2 shore has a beach ridge crest at +7.0 m and a mean sea level in the order of +5.2–5.5 m and it is bracketed by two C14-dates giving an age of 7000 cBP for PTM-2. This allows a firm shoreline connection with the PTM-2 level in the Viskan Valley (like Fig. 79). The absence of the PTM-4 and PTM-5A level (PL forming) is probably due to the covering by the slide and alluvial cone, likely to have occurred at about 4800 cBP (Mörner, 2003, 2008a).
Fig. 99. The Eskiltorp section as established by stratigraphic recording at 52 points and by 4 C14-dates (redrawn from Mörner, 1969, Pl.10).
Fig. 100. Pre-Holocene littoral beach material covering a Late Glacial land surface.

100
Below the Holocene transgression surface, there is a littoral beach material at +3.3–5.8 m (Fig. 100), which cover a Late Glacial land surface (a humus horizon in B 681 and a dry-crust in B 678). Consequently, this beach material should have been deposited after a transgression (which we don’t know of in Late Glacial time) or a tsunami event, which fits very well with the 11,250 cBP event (Mörner, 2003, p. 269) and, if so, would signify a tsunami run-up of about 10-11 m. There is even a little notch in the till surface at the end of the littoral deposit (between B 254 and 255 in Fig. 100; from Mörner, 1969, part of PL. 10). Stop No 9-3: liquefaction structures in the River Stensån riverbank Liquefaction structures were found in the Holocene sediments in the riverbanks of River Stensån in 1998. They were shown at the 1999 International Excursion (Mörner, 1999b) and extensively investigated by Mörner and Audemard in 2002 (Mörner, 2003, p. 271-272; 2008). Detained stratigraphic analyses were made at 3 points (I–III, Fig. 101). Three, maybe four, events of liquefaction were identified (A–D in Fig. 101): A a strong event occurring in association with the onset of the PTM-2 transgression; i.e.
most probably in direct association with the onset of bending at about 7750 cBP along the Mt. Hallandsåsen Fault.
B a very strong event deforming the main sedimentary sequences in points I and II (as shown in the photography), which occurred right before the deposition of the yellow gravel layer originally thought to represent the regression after PTM-2 and later found to represent the most distal part of the earth slides at Eskilstorp. This implies that event B either occurred at around 7000 cBP (Mörner, 2003) or 4800 cBP (Mörner, 2008a).
C a minor event causing venting with injection into the covering marine and lagoon beds. D a possible fourth events may be seen in fracturing and injections in the covering lake bed.
Fig. 101. The River Stensån stratigtaphy and liquefaction events (A–D). Two strong events (A and B), one weak event (C) and a hypothetical event (D) are recorded.
Stop No 9-4: the shore profile in Malen The Bay of Laholm forms a huge semi lunar structure with an extensive sandy coast. Today with a long-shore transport northwards, prior to 6000 cBP in the opposite direction, however, as illustrated in Fig. 97B). We drive across the former PL barrier shore-bar. Here it is flat

101
(Fig. 102), indicating over-banking wave deposition. Directly after crossing River Stensån, there is a prominent beach ridge (of shingle) with a mean sea level in the order of +4.0-3.8 m formed by the PTM-7 sea level oscillation peaking at about 2700 cBP. We will explore the situation and go down to the actual beach. Here we explore a flat eratic block with the inscription 1778. This block marked the boundary between the county of Skåne and Halland. When the marking was cut, this was at the shore – as it is today. Inside the block there are stones arranged for dry excess to the block. This implies a somewhat higher sea level in 1778. This fits well with an absolute uplift of 1.3 mm/year, giving +30 cm in 230 years.
Fig. 102. The shore profile of our route to the sea (yellow) with the distinct PTM-7 beach. The top of the profile is at +8.6 m. To the west, it rises to +11.5 m, however. The question about absolute uplift and eustatic changes in sea level may rise a special interest. This is illustrated in Fig. 103 (from Mörner, 1973). Relative uplift is obtained from repeated levelling and relative sea level changes by mareographs or tide gauges. Both give rates in mm per year. So if we want to compare those data sets with our shoreline records, the shorelines, after calibration of C14-ages into absolute ages, must be converted into lines of rates in mm/year. This was done in Fig. 102. The remarkable think now is that the uplift is revealed to consist of two factors; one exponentially decaying and one linear with time (Mörner, 1973, 1979a, 1980a, 1991). The place where tilting has remained fixed for the last 8000 years lies at -205 km (from the zero-point at Stop 8-6). At this point, the line of relative uplift or sea level changes obtained from repeated levelling and mareographs fall 1.1 mm below the zero (Fig. 102). This value is therefore a very good measure of the eustatic factor over the last 150 year (Mörner, 1973; cf. 1996b, 2000, 2004b). BWG No 9-2: shorelines along the road to Kattvik Along the coastal road back to Hovs Hallar, we pass some nice sections of late glacial shore marks. At one place, one may identify 5 different shorelines. The one at +31 m is especially prominent. It represent the moment when tilting commenced in the centre in Ångermanland. The PL shore forms a distinct shore cliff. The strong erosion in this sector corresponds to the strong deposition of sand eastwards (Stop 9-4). The PL cliff is strongly affected by fracturing and block movements even against gravity, and large angular blocks have fallen on the well- rounder shingle of the PL-beach in good agreement with other indication of a paleoseismic event at around 4800 cBP; i.e. right after PTM-5A (Mörner, 2003, p. 273-277).

102
Fig. 103. PTM-shorelines converted to rates in mm/year and compared with the rates obtained from local repeated levelling and mareographs (the S-line). At the axis of tilting and zero and isostatic zero (point –205 km), the S line falls 1.1 mm/year too low – providing a good value of the eustatic calibration needed. Stop for lunch: Lunch will be taken in the garden of the Mörner family Stop No 9-5: multiple sea level data from Torekov During ALV-1, the sea level was at about -24.0 m and the Island of Hallads Väderö was connected with the mainland. It had a steep dramatic rock cliff on its western side with rounded beach shingle and sea caves at its foot. In connection with the onset of the PTM-2 transgression, a fen was formed in the bay of Torekov as indicated by an extensive layer of alder brushwood peat followed from about +1 m down to -2.5 m and dated at about 8000 BP (Fig. 104). There are also peat beds dating to the ALV-1 stage (Figs. 104-105). PL is highly polygenous, formed by PTM-3A to PTM-5A, with a mean sea level at +7.4 m. The PL shore is marked by a very distinct beachridge of shingle. North of Torekov, the PL beach ridge rests on peat (Fig. 104). Corings on the inner side of the ridge have shown that the beach ridge is double (Fig. 104). A series of radiocarbon dates have provided good age control of PTM-4 and PTM-5A. In central and southern Torekov, numerous pits for house foundations have shown that the PL beach ridge is highly complex and formed by 2-3 shingle ridges separated by eolian sand (Mörner, 1969). In order to decipher the story, one must also consider the changes in wind direction and long-shore drift (Fig. 97B). Later investigations by the author have established and dated the PTM-9 level (1550 BP) and the PTM-10 level (1000 BP). The transgressivity of PTM-10 is also indicated by beach ridge shingle over C14-dated peat as illustrated in Fig. 105.

103
Fig. 104. The levelled and cored sections at Torekov and the dates obtained (Mörner, 1969).
Fig. 105. The buried PTM-10 beach and the PTM-7 ridge, both covered by dune sand, and the peat beds below. Stop No 9-6: the beach ridge systems at Råle and the Rålö Fault We stop at Rålö right on the PL beach. It continues at the same height to the north. To the south, however, there is a drastic and clear drop in its elevation. There are two detailed levelled sea level profiles close-by; one at Norra Ängalag 600 m to the north and one at Perstorp 200 m to the south (Mörner, 1969, Fig. 118). Both sections include 9 different beach ridges, which obviously are synchronous despite the difference in elevation; viz. (2) PTM-10, (4-5) PTM-7, (6) PTM-6, (7) PTM-5B and (8-9) PL of PTM-4 and PTM-5A (Fig. 106; cf. Mörner, 2003, p. 273-274). When plotted together, the difference in elevation reveals 3 steps; a jump of 1.4-1.0 m between 8 and 7 at 4800 cBP, a jump of 0.9 m at around 3500 cBP (±600 years) between PTM-6 and PTM-7, and a jump of 1.1 m 900 cBP (right after the Viking shoreline PTM-10). This can only be understood in terms of repeated seismotectonic faulting (Mörner, 2003, 2008a). Just south of Rålö, there seems to be traces of a fault, the Rålö Fault. It seems to continue off the coast (where huge angular boulders occur in an unusual way just along the continuation of the fault).

104
Fig. 106. The beach ridge systems at N. Ängalag (A) and Perstorp (B), 0.8 km apart. The differences in elecation give evidence of 3 seismitectonic “jumps” along the Rålö Fault.
The 4800 cBP event is also seen in very heavy talus shuttering, fracturing and liquefaction (event B at River Stensån; Stop 9-3). The 3500 cBP event is also seen in talus shuttering in the coves of Hovs Hallar (and perhaps the liquefaction C event at River Stensån). The 900 cBP event is seen in extensive talus shuttering (Mörner, 2008a, Fig. 4) and a 1 m fault also south of Torekov. At the old harbour of Galtabäck, south of Varberg, some 65 km to the NNW, two Viking ships were suddenly silted over. One may speculate about a sudden disastrous storm or a tsunami wave. The ships were C14-dated at 825 ±65 cBP or 1125 AD (Mörner, 1969, p. 310), which fits very well with the assumed age of faulting and talus shuttering in the Torekov–Båstad area. Finally, shell banks at +4-5 m were, at to different sites, dated at ~1500 cBP. This is far too young for the ridge. Whether this is a result of another tsunami wave or just an extreme storm event is, at the moment, not known. Stop No 9-7: the beach ridges at Dalen Here we note the PL level with a corresponding mean sea level at +7.7 m. The shingle field outside includes younger PTM-levels (especially clear to the SW, where also 7 mounds from the Brontz Age are to be seen). There is a distinct PTM-7 beach at +3.8 m and a PTM-10 at about +1.5 m. The recent shore morphology is considered as a key to the interpretation of the raised beaches (left profile in Fig. 106). During the Viking time (PTM-10) there seems to have been an ideal harbour-lake just at the coast and near to the brook mouth. We cored the lake (for possible tsunami beds) and were able to determine a water depth of 0.8 m during the Viking time, which seems ideal for their way of keeping their boats.
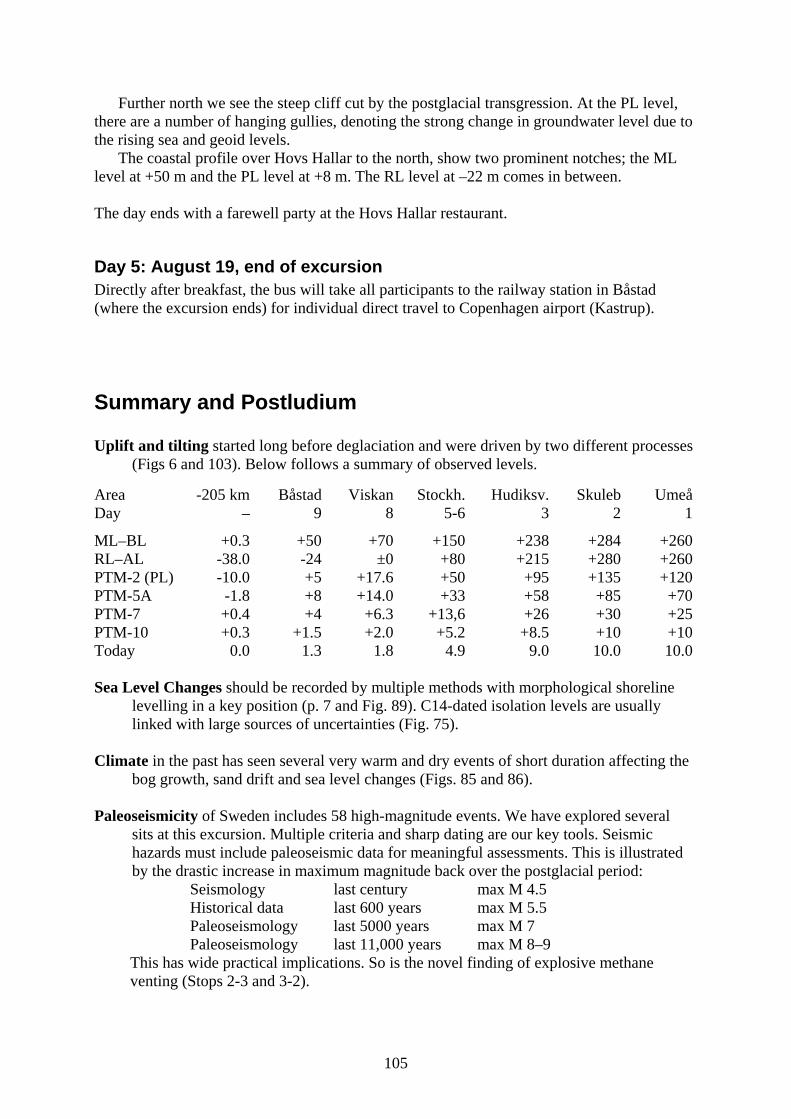
105
Further north we see the steep cliff cut by the postglacial transgression. At the PL level, there are a number of hanging gullies, denoting the strong change in groundwater level due to the rising sea and geoid levels. The coastal profile over Hovs Hallar to the north, show two prominent notches; the ML level at +50 m and the PL level at +8 m. The RL level at –22 m comes in between. The day ends with a farewell party at the Hovs Hallar restaurant.
Day 5: August 19, end of excursion Directly after breakfast, the bus will take all participants to the railway station in Båstad (where the excursion ends) for individual direct travel to Copenhagen airport (Kastrup).
Summary and Postludium Uplift and tilting started long before deglaciation and were driven by two different processes
(Figs 6 and 103). Below follows a summary of observed levels. Area -205 km Båstad Viskan Stockh. Hudiksv. Skuleb Umeå Day – 9 8 5-6 3 2 1
ML–BL +0.3 +50 +70 +150 +238 +284 +260 RL–AL -38.0 -24 ±0 +80 +215 +280 +260 PTM-2 (PL) -10.0 +5 +17.6 +50 +95 +135 +120 PTM-5A -1.8 +8 +14.0 +33 +58 +85 +70 PTM-7 +0.4 +4 +6.3 +13,6 +26 +30 +25 PTM-10 +0.3 +1.5 +2.0 +5.2 +8.5 +10 +10 Today 0.0 1.3 1.8 4.9 9.0 10.0 10.0 Sea Level Changes should be recorded by multiple methods with morphological shoreline
levelling in a key position (p. 7 and Fig. 89). C14-dated isolation levels are usually linked with large sources of uncertainties (Fig. 75).
Climate in the past has seen several very warm and dry events of short duration affecting the
bog growth, sand drift and sea level changes (Figs. 85 and 86). Paleoseismicity of Sweden includes 58 high-magnitude events. We have explored several
sits at this excursion. Multiple criteria and sharp dating are our key tools. Seismic hazards must include paleoseismic data for meaningful assessments. This is illustrated by the drastic increase in maximum magnitude back over the postglacial period:
Seismology last century max M 4.5 Historical data last 600 years max M 5.5 Paleoseismology last 5000 years max M 7 Paleoseismology last 11,000 years max M 8–9 This has wide practical implications. So is the novel finding of explosive methane
venting (Stops 2-3 and 3-2).

106
References Aaby, B. 1976: Cyclic variations in climate over the past 5,500 yr reflected in raised bogs. Nature 263, 281-284. Ahlmann, H.W:son, Caldenius, C.C:zon & Sandegren, R. 1924: Ragundasjön. Sveriges Geol. Undersökn., Ca-
12, I-III. Andersson, G., 1902: Hasseln i Sverige fordom och nu. Sveriges Geol. Undersökn., Ca-3, 1-168. Bergsten, F. 1954: The land uplift in Sweden from the evidence of old water marks. Geogr. Ann. 1954, 181-111. Bergström, R. 1968: Stratigrafi och isrecession i södra Västerbotten. Sveriges Geol. Undersökn., C-634, 1-76. Borell, R. & Offerberg, J. 1955: Geokronologiska undersökningar inom Indals-älvens dalgång mellan
Bergeforsen och Ragunda. Sveriges Geol. Undersökn., Ca-31, 1-24. Cato, I. 1987: On the definite connection of the Swedish Time Scale with the present. Sveriges Geol.
Undersökn., Ca-68, 1-55. Cato, I. 1992: Shore displacement data based on lake isolation confirm the postglacial part of the Swedish
Geochronological Time Scale. Sveriges Geol. Undersökn., Ca-81: 75-80. Cato, I., 1998. Ragnar Lidén’s postglacial varve chronology from the Ångermanlandälven valley, northen
Swede. Sveriges Geol. Undersökn., Ca-88, 1-82. De Geer, G. 1888 & 1890: Om skandinaviens nivåförändringar under Quartärperioden. Geol. Fören. Stockh.
Förhandl., 10, 366-379 & 12, 61-110. De Geer, G. 1893: Praktiskt geologiska undersökningar inom Hallands län. Sveriges Geol. Undersök., C-131. De Geer, G. 1912: A geochronology of the last 12000 years. Compt Rendu, XI Congr. Geol. Intern., Stockholm
1910, p. 241-253. De Geer, G. 1940: Geochronologica Suecia Principles. Kungl. Sv. Vet. Akad. Handl., 3, 18, 6, 1-350. Douglas, B. 1991: Global sea level rise. J. Geophys. Res. 96, 6981-6992. Fairbridge, R.W. 1961: Eustatic changes in sea level. Phys. Chem. Earth 4, 99-185. Florin, S. 1944: Havsstrandens förskjutningar och bebyggelseutvecklingen i östra Mellansverige under
senkvartär tid. Geol. Fören. Stockh. Förh. 66, 417-448. Forsström, L. & Eronen, M. 1987: Flandrian amd Eemian shore levels in Finland and adjacent areas – a
discussion. Eiszeit. Gegenwart 35, 135-145. Fromm, E. 1938: Geochronologisch datirte Pollemndiagramme und Diatoméen-analyse aus Ånergmanland.
Geol. Fören. Stockh. Förh. 60, 365-381. Granlund, E. 1932: De svenska högmossarnas geologi; deras bildningsbvetingelser, utvecklingshistoria och
utbredning jämte sambandet mellan högmossebildning och försumpning. Sveriges Geol. Undersökn., C-373, 1-193.
Hellzen, P. 1782: Berättelse om en jordbävning. Ort & inrikes tidningen, okt-nov-dec 1782, p. 323-329. Högåkers OK 2006: Aspeå (orienteringskarta i 1:10.000), Upprättad 2006 av Högåkers OK. Hörnsten, Å. 1964: Ångermanlands kustland under isavsmältningsskedet. Geol. Fören. Stockh. Förh. 86, 181-
205. IPPC 2001: Climate Change. Cambridge Univ. Press. Järnefors, B. 1956: Isressiosionen inom Uppsalaområdet. Geol. Fören. Stockh. Förhandl. 78, 310-315. Lagerbäck, R. 1991: Seismically deformed sediments in the Lansjärv area, northern Sweden. SKB, TR 91-17, 1-
58. Lambeck, K., Smither, C. & Ekman, M. 1998: Test of glacial rebound models for Fenno-scandinavia based on
instrumented sea- and lake-level records. Geophys. J. Int. 135, 375-387. Larsson, M.G. 2004: Spåren efter Ingvar den vittfarne och hans ätt. Sörmlandsbygden 2004, 46-58. Lidén, R. 1913: Geokronologiska studier öfver det finiglaciala skedet I Ångermanland. Sveriges Geol.
Undersökn., Ca-9, 1-39. Lidén, R. 1938: Den senkvartär strandförskjutningens förlopp och kronologi i Ångermanland. Geol. Fören.
Stockh. Förhandl. 60, 397-404. Lindström, M., Lundqvist, J. & Lundqvist, T. 1991: Sveriges geologi från urtid till nutid. Studentlitteratur. Lundqvist, G. 1963: Beskrivning till Jordartskarta över Gävleborgs län. Sveriges Geol. Undersökn., Ca-42, 1-
181. Lyell, C. 1835: On the proofs of the gradual rising of the land in certain parts of Sweden. Phil. Trans. Roy. Soc.
London, 1835, 1-38. Magnussen, E. 1964: Pollen-analytic investigations at Tåkern, Dagsmosse and the Neolithic settlement at
Alvastra, Sweden. Sveriges Geol. Undersök., C597, 1-47. Moberg, A. 1996: Temperature variations in Sweden since the 18th century. Ph.D.-thesis, Phys. Geogr.,
Stockholm Univ. Mörner, N.-A. 1969: The Late Quaternary history of the Kattegatt Sea and the Swedish West Coast;
deglaciation, shorelevel displacement, chronology, isostasy and eustasy. Sveriges Geol. Undersökn., C-

107
640, 1-487. Mörner, N.-A. 1971: Eustatic changers during the last 20,000 years and a method of separating the isostatic and
eustatic factors in an uplifted area. Palaeogeogr. Palaeoclim. Palaeoecol. 9, 153-181. Mörner, N.-A. 1973: Eustatic changes during the last 300 years. Palaeogeogr. Palaeoclim. Palaeoecol. 13, 1-14. Mörner, N.-A. 1974: Relations between shoreline gradients, uplift and ice recession. Norsk Geogr. Tidsskr. 28,
237-241. Mörner, N.-A. 1976a: The Pleistocene/Holocene boundary: a proposed boundary-stratotype in Gothenburg,
Sweden. Boreas 5, 193-275. Mörner, N.-A. 1976b: Eustasy and geoid changes. J. Geol. 84, 123-151. Mörner, N.-A. 1977: The Fennoscandian uplift: geological data and their geodynamic implication. Abstracts,
Inter-Union Comm. Geodynamics, WG-7 symp. Earth Rheology and Late Cenozoic Isostatic Movements, p. 79-92.
Mörner, N.-A. 1979a. The Fennopscandian uplift and Late Cenozoic geodynamics: Geological evidence. GeoJournal 3, 287-318.
Mörner, N.-A. 1979b: The deglaciation of southern Sweden: a multi-parameter consideration. Boreas 8, 189-198.
Mörner, N.-A. 1980a: The Fennoscandian uplift: geological data and their geodynamic implication. In Mörner, N.-A. (ed.): Earth Rheology, Isostasy and Eustasy, 251-284. John Wiley & Sons.
Mörner, N.-A. 1980b: The northwest European “sea-level laboratory” and regional Holocene eustasy. Palaeogeogr. Palaeoclim. Palaeoecol. 29, 281-300.
Mörner, N.-A. 1980c: Late Quaternary sea-level changes in north-western Europe: a synthesis. Geol. Fören. Stockh. Förh. 100, 381-400.
Mörner, N.-A. 1981: A 10,700 years paleotemperature record from Gotland and the Pleistocene/Holocene boundary events. Boreas 9, 283-287.
Mörner, N.-A., 1984a. Planetary, solar, atmosphere, hydrosphere and endogene processes as origin of climatic changes on the Earth. In Mörner, N.-A. & Karlén, W. (eds): Climatic Changes on a Yearly to Millennial Basis, 483-507. Reidel.
Mörner, N.-A. 1984b: Climatic changes on a yearly to millennial basis. An introduction. In Mörner, N.-A. & Karlén, W. (eds): Climatic Changes on a Yearly to Millennial Basis, 1-13. Reidel.
Mörner, N.-A. 1985: Paleoseismicity and geodynamics in Sweden. Tectonophysics 117, 139-153. Mörner, N.-A. 1986: Supposed ice wedge casts and neotectonics; Swedish data. Bull. INQUA Neotectonics
Comm. 9, 93. Mörner, N.-A. 1987: Models of global sea level changes. In (M.J. Tooley, M.J. & Shennan, I. (eds): Sea-level
changes, 332-355. Blackwell. Mörner, N.-A. 1990: Glacial isostasy and long-term crustal movements in Fennoscandia with respect to
lithospheric and asthenospheric processes and properties. Tectonophysics 176, 13-24. Mörner, N.-A. 1991: Course and origin of the Fennoscandian uplift: the case for two separate mechanisms. Terra
Nova 3, 408-413. Mörner, N.-A. 1992: Sea-level changes and Earth’s rate of rotation. J. Coastal Res. 8, 966-971. Mörner, N.-A. 1995: The Baltic Ice Lake – Yoldia Sea transition. Quaternary International 27, 95-98. Mörner, N.-A. 1996a: Liquefaction and varve dating as evedence of paleoseismic events and tsunamis. The
autumn 10,430 BP case in Sweden. Quaternary Sci. Rev. 15, 939-948. Mörner, N.-A. 1996b: Sea level variability. Z. Geomorphologie, N.F., Suppl-Bd. 102, 223-232. Mörner, N.-A. 1999a: Sea level and climate: rapid regressions at local warm phases. Quaternary International
60, 75-82. Mörner, N.-A. 1999b: Sweden Excursion, May 1999, Sea level changes, uplift, paleoseismicity, climate, coastal
dynamics. The P&G unit, Stockholm Univ., 1-81. Mörner, N.-A. 1999c: Paleo-tsunamis in Sweden. Phys. Chem. Earth 24, 443-448. Mörner, N.-A. 2000: Sea level changes along Western Europe. Integrated Coastal Zone Management 1:2, 33-37. Mörner, N.-A. 2003: Paleoseismicity of Sweden – a novel paradigm. A contribution to INQUA from its Sub-
commission on Paleoseismology, ISBK-91-631-4072-1, 320 pp, the P&G unit, Stockholm Univ. Mörner, N.-A. 2003b: The 2700 BP solar-terrestrial signal. EGS-AUG-EUG meeting, Nice, April 6-11,
Abstracts, ST-1. Mörner, N.-A. 2004: Active faults in Fennoscandia, especially Sweden: primary structures and secondary
effects. Tectonophysics 380, 139-157. Mörner, N.-A. 2004b: Estimating future sea level changes from past records. Global Planet. Change 40, 49-54. Mörner, N.-A., 2004c: Storåker ca. 500–700 e.Kr. Sörmlandsbygden 2004, 35-45. Mörner, N.-A. 2005: An interpretation and catalogue for paleoseismicity in Sweden. Tectonophysics 408, 265-
307. Mörner, N.-A. 2006: 2500 years of observations, deductions, models and geoethics. Boll. Soc. Geol. It. 125, 259-

108
264. Mörner, N.-A. 2007: The Fenris Wolf in the Asa Creed in the light of paleoseismics. In Piccardi, L. & Masse,
W.B. (eds): Myth and Geology, Geol. Soc. London, Spec. Publ., 273, 117-119. Mörner, N.-A. 2008a: Late Holocene earthquake geology in Sweden. Geological Society, London, Special
Publications, in press. Mörner, N.-A. 2008b: Paleoseismics and tsunami events in the Baltic. Polish Geological Institute Special Papers
23, in press. Mörner, N.-A., Sjöberg, R. & Audemard, F. 2003: Tre jättejordbävningar i Umeå trakten. Markkontakt 1, 3-6. Mörner, N.-A., Sjöberg, R. & Ågren, E. 2008: Grottor och jordbävningar i Umeå-trakten. Grottan 43:1, in press. Mörner, N.-A., Somi, E. & Zuchiewicz, W. 1989: Neotectonics and paleoseismicity within the Stockholm
intercratonal region in Sweden. Tectonophysics 163, 289-303. Mörner, N.-A. & Strandberg, S. 2004: Visnaren. Ett sjönamn i geologisk belysning. Ortnamnssällskapet
Uppsala Årsskrift 2004, 66-74. Mörner, N.-A. & Sun, G. 2007. Paleoearthquake deformations recorded by magnetic variables. Earth and
Planetary Science Letters, in press. Mörner, N.-A. & Sylwan, C., 1989: Detailed paleomagnetic record for the last 6300 years from varved lake
deposits in northern Sweden. In Lowes, F. et al. (eds.): Geomagnetism and Paleomagnetism, 63-70. Kluwer, Dordrecht.
Mörner, N.-A. & Tarling, D. 1995: The North Sweden 6300 yr varve record revisited. Symp. GA.-1.14. Abstracts, IUGG XXI General Assembly, Boulder, USA.
Mörner, N.-A. & Tröften, P.-E. 1993: Paleoseismotectonics in glaciated cratonal Sweden. Z. Geomorphologie N.F. 94, 107-117.
Mörner, N.-A., Tröften, P.E., Sjöberg, R., Grant, D., Dawson, S., Bronge, C, Kvamsdal, O. & Sidén, A., 2000. Swedish paleoseismicity: the 9663 BP event. Quaternary Sci. Rev. 19, 1461-1468.
Mörner, N.-A. & Wallin, B. 1976: A 10 000 year temperature record from Gotland, Sweden. Palaeogeogr.Palaeoclim.Palaeoecol. 21, 113-138.
Peltier, W.R. & Tushinghan, A.M. 1989: Global sea level rise and the greenhouse effect: Might they be connected? Science 244, 806-810.
von Post, L. 1903: En profil genom högsta Litorinavallen på södra Golland. Geol. Fören. Stockh. Förh. 25, 339-372.
von Post, L. 1916: Skogsträdpollen i sydsvenska torvmosselagerföljder. Forh. 16 Naturforsk. mötet Kristiania 1916, 443-465. (translated 1967 in Pollen et Spores 9, 375-401).
von Post, L. 1952: New aspects on the Late Quaternary displacements of Swedish sea shore. I.G.C 18, Great Britain, 8, 219-225.
von Post, L. 1968 (postumously): The Ancien Sea Fiord of the Viskan Valley. Geol. Fören. Stockh. Förh. 90. von Post, L. & Granlund, E. 1926: Södra Sveriges torvtillgångar. Sverges Geol. Undersökn., C-335, 1-127. Påsse, T. 1990: Beskrivning till kartbladet Varberg NO. Sveriges Geol. Undersök., Ae 102, 1-117. Renberg, I. 1978: Palaeolomnology abd varve counts of the annually laminated sediments of Lake Rudtjärn,
northern Swede. Early Norrland II, 63-92. Renberg, I. & Segerström, U. 1981: The initial point on a shoreline displacement curve for southern
Västerbotten, dated by varve-counts of lake sediments. Striae 14, 174-176. Rodhe, L., Sundh, M. & Winberg, B. 1990: Beskrivning till kvartärgeologiska kartorna 22K/22L
Skellefteå/Rönnskär and 23K/23L Biliden/Byske. Sveriges Geol. Undersök., Ak 2&4: 1-32. Segerström, U. & Rehnberg, I. 1986: Varviga sjösediment avslöjar forntida landhöjningens förlopp. In
Stephansson, O. & Rösshof, K. (eds): Landet som stiger ur havet, 27-30. Luleå Tekn. Högsk. Sjöberg, R. 1982: Tunnelgrottor i södra Västerbotten. GERUM A31, 1-95. Sjöberg, R. 1994: Bedrock caves and fractured rock surfaces in Sweden. Occurrence and origin. Paleogeohysics
& Geodynamics, Ph.D-thesis 7, 1-110, Stockholm University. Sjöberg, R. 1995: Tavelsjöbergets blockbrant – en seismotektonisk bildning? Markkontakt 3, 12-14. Sjöberg, R. 1996: En seismotektonisk förkastning i nordligaste Umeå. Markkontakt 3-4, 39-41. Sjöberg, R. 2004: Grottorna i Stor-Bobergsberget. Grottan 4, 4-8. Sjöberg, R. & Johansson, B-Å. 1996: Medeltida hamn i Baggböle? Markkontakt 4, 8-11. Strömberg, B. 1971: Isrecessionen i området kring Ålands hav. Ph.D.-thesis., Naturgeogr., Stockholms Univ.,
Forsknings-rapport 10. Strömberg, B. 1989: Late Weichselian deglaciation and clay-varve chronology in east-central Sweden Sveriges
Geol. Undersök., Ca-73, 1-70. Sun, G. 2005: The characters of magnetic records of deformed soft sediments with emphasis on liquefaction
structures. Paleogeohysics & Geodynamics, Ph.D-thesis 10, 1-122, Stockholm University. Svedlund, J.O. 2001: Beskrivning till kvartärgeologiska kartan 21K Robertsfors/21L Ånäset. Sveriges Geol
Undersök., Ak-1, 1-24.

109
Svensson, H. 1964.Fossil tundramark på Laholmsslätten. Sveriges Geol. Undersök., C598, 1-29. Tröften, P.E. 1997: Neotectonics and paleoseismicity in southern Sweden with emphasis on sedimentological
criteria. Paleogeohysics & Geodynamics, Ph.D-thesis 8, 1-124, Stockholm University. Tröften, P.E. 2000: The use of varved clay chronology for dating paleoseismic events: the Erstavik record in the
Stockholm area, south Sweden. Sediment. Geol. 130, 167-181. Tröften, P.E. & Mörner, N.-A. 1997: Varved clay chronology as a means of recording paleseismic events in
southern Swede. J. Geodynamics 24, 249-258. Walsh, T,J., Combellick, E.A. & Black, G.L. 1995: Liquefaction features from a subduction zone earthquake:
preserved examples from the 1964 Alaskan earthquake. Washington State Dept., Div. Geol. Earth Sci., Rep. 32, 1-80.
Wenner, C.G. 1950: The deltas and terraces of the Viskan Valley between Berghem and Horred. Geogr. Ann. 1950.