Embed Size (px)
Citation preview

ABSTRACT
A paleomagnetic investigation of Marinoanglacial and preglacial deposits in Australia wasconducted to reevaluate Australia’s paleo-geographic position at the time of glaciation(ca. 610–575 Ma). The paleomagnetic resultsfrom the Elatina Formation of the centralFlinders Ranges yield the first positive regional-scale fold test (significant at the 99% level), aswell as at least three magnetic polarity inter-vals. Stratigraphic discontinuities typical ofglacial successions prevent the application of amagnetic polarity stratigraphy to regional cor-relation, but the positive fold test and multiplereversals confirm the previous low paleolati-tude interpretation of these rocks (mean D =214.9°, I = –14.7°,α95 = 12.7°, paleolatitude =7.5°). The underlying preglacial Yaltipena For-mation also carries low magnetic inclinations(mean D = 204.0°, I = –16.4°,α95= 11.0°, paleo-latitude = 8.4°), suggesting that Australia waslocated at low paleolatitude at the onset ofglaciation. The number of magnetic polarity in-tervals present within the Elatina Formationand the Elatina’s lithostratigraphic relation-ship to other Marinoan glacial deposits suggestthat glaciation persisted at low latitudes in Aus-tralia for a minimum of several hundreds ofthousands to millions of years.
INTRODUCTION
The Neoproterozoic Era (1000–543 Ma) marksa time of unusual and profound changes on the
surface of the Earth. Supercontinents assembled,then broke apart with apparent great rapidity(Moores, 1991; Dalziel, 1991, 1995; Hoffman,1991; Powell et al., 1993). The first complexmetazoan organisms appeared (e.g., Cowie andBrasier, 1989; Lipps and Signor, 1992; Bengtson,1994; Grotzinger et al., 1995; Xiao et al., 1998),perhaps spurred by enhanced carbon burial thatyielded significant amounts of oxygen (Knoll,1992, 1994). There were two broad intervals ofwidespread and extended (and possibly repetitive)glaciation in the Neoproterozoic Era: the Sturtianglacial interval (ca. 780–700 Ma) and theVaranger glacial interval (which includes theMarinoan glaciation in Australia and Ice Brookglaciation in Canada, ca. 610–575 Ma; see Knolland Walter, 1992; Bowring and Erwin, 1998).These glacial intervals are unlike any in Phanero-zoic Earth history because of their great severity.Paleomagnetic evidence from glacial strata sug-gests that continental-scale ice sheets advancedover land at or near sea level and equatorward of20° latitude (Sturtian of North America; Park,1994, 1997; Marinoan of Australia; Schmidt et al.,1991; Schmidt and Williams, 1995). On only oneother occasion in Earth history, the Paleoprotero-zoic Huronian glaciation (ca. 2.2 Ga), may glacia-tion have been equally severe (Evans et al., 1997;Williams and Schmidt, 1997).
Paleoclimatologists accustomed to Pleis-tocene glacial conditions tend to greet word oflow-latitude glaciation with polite disbelief, be-cause the Pleistocene climate models that haveguided thinking about climatic processes havenever needed to address such an extreme case ofglobal cooling. Most climate models for glacialintervals since the days of the CLIMAP Project
(CLIMAP Project Members, 1976) have as-sumed steep thermal gradients and general cool-ing of oceanic surface water at middle to high lat-itudes, with little or no change in tropical oceansurface temperatures. Some researchers haveeven proposed that the average equatorial sea-surface temperature has remained within 1 °C ofits present level for billions of years (Fairbridge,1991). Only in the past few years has evidence ofcooling of the tropics come to light, and the cal-culated temperature changes are only a few de-grees in magnitude (Beck et al., 1992; Stute et al.,1995; Broecker, 1996; Patrick and Thunell, 1997).
In light of Pleistocene climate modeling, theoccurrence of low-latitude glaciation in Neopro-terozoic time seems bizarre; however, it is the rar-ity of low-latitude glaciation in the Precambrianthat is strange. After all, models of stellar evolu-tion suggest that 600 Ma, the sun’s luminosityshould have been 3%–6% lower than present lev-els (e.g., Gough, 1981). Under those conditions,producing an extremely frigid climate shouldhave been simple. However, the existence of wa-ter-lain sedimentary deposits dating back to 3.9Ga indicates that temperatures were warm enoughfor running water, a problem known as the “faintyoung sun” paradox (Sagan and Mullen, 1972;Newman and Rood, 1977). To compensate for re-duced solar luminosity, researchers have postu-lated a supergreenhouse effect, caused by elevatedlevels of greenhouse gases such as methane andCO2, that declined with the passage of time untilthe atmosphere achieved a composition similar tothat of the present day (Sagan and Mullen, 1972;Newman and Rood, 1977; Owen et al., 1979;Kasting, 1992). (Note that an “effective” level ofCO2 is often used as a replacement for other
1120
Paleomagnetic polarity reversals in Marinoan (ca. 600 Ma) glacial depositsof Australia: Implications for the duration of low-latitude glaciation in Neoproterozoic time
Linda E. Sohl* Department of Earth and Environmental Sciences and Lamont-Doherty Earth Observatory of Nicholas Christie-Blick Columbia University, Palisades, New York 10964
Dennis V. Kent Lamont-Doherty Earth Observatory of Columbia University, Palisades, New York 10964,andDepartment of Geological Sciences, Rutgers University, Piscataway, New Jersey 08854
GSA Bulletin; August 1999; v. 111; no. 8; p. 1120–1139; 12 figures; 3 tables.
*E-mail: [email protected].
Data Repository item 9965 contains additional material related to this article.
}

greenhouse gases in climate modeling [Washing-ton, 1992].) Estimates of normal atmosphericCO2 levels ca. 600 Ma are around 840 ppm(Carver and Vardavas, 1994), compared to thepreindustrial value of ~280 ppm. As Kasting(1992) pointed out, having to account for low-lat-itude glaciation at sea level in a supergreenhouseworld presents a rather difficult problem.
The entire Proterozoic climate scene mayseem too far removed from present-day condi-tions to be of any interest to paleoclimatologistsworking in more recent geologic intervals. How-ever, the physics of climatic processes does notchange—only the boundary conditions do. Whilegreat strides have been made in improving ourunderstanding of the various forcings and feed-backs that control climate today and in the recentgeologic past (e.g., CLIMAP Project Members,1976; Hays et al., 1976; Hansen and Takahashi,1984; Broecker and Denton, 1989), the role thatthese perturbations play in long-term climatetrends and the possible range of climate variabil-ity is still poorly understood. Understanding thecircumstances under which the Earth’s climatecan be compelled to change from unusualwarmth to extreme cold, as well as the timescales over which various processes interact, mayprovide unique insights that improve our under-standing of the current climatic conditions.
In this paper we approach the low-latitudeglaciation question by analyzing the most com-prehensive evidence yet acquired from the Neo-proterozoic of Australia in support of the hypoth-esis. We then discuss the implications of thesedata for the duration of low-latitude glaciationduring the Varanger glacial interval. In the inter-ests of opening the discussion of the low-latitudeglaciation hypothesis to a broader interdiscipli-nary audience, we have also provided some addi-tional background material on selected topics.
PALEOMAGNETISM AND THE LOW-LATITUDE GLACIATION HYPOTHESIS
The hypothesis of low-latitude glaciation dur-ing the Proterozoic dates back nearly 40 years,when researchers first noted some major differ-ences between Neoproterozoic glacial depositsand the much younger (and more familiar) glacialdeposits of the Cenozoic (Harland and Bidgood,1959; Girdler, 1964; Harland, 1964a, 1964b).First, the extensive Neoproterozoic glacial depos-its are widely scattered across the globe: they canbe found on every continent, with the possible ex-ception of Antarctica (cf. Stump et al., 1988).Such a distribution is unlike the more areally lim-ited distribution of Pleistocene glacial deposits.Second, the glacial deposits appeared to be inclose spatial and temporal relationships with
rocks normally associated with warm, arid, ortropical settings. Redbeds, carbonates, and/orevaporites are commonly found stratigraphicallybeneath the glacial rocks, and the end of glacialdeposition for both the Sturtian and Varanger in-tervals is typically marked by the presence of thin,laterally persistent (over hundreds of kilometers),laminated, buff to pink dolomites now called capcarbonates (because they cap the glacial deposits;Roberts, 1976; Williams, 1979; Deynoux, 1985;Young, 1992; Kennedy, 1996). Third, early paleo-magnetic studies of rocks associated with (but notfrom) Varanger-age glacial deposits in Greenlandand Norway yielded low paleolatitudes (Harlandand Bidgood, 1959; Bidgood and Harland, 1961).The widespread distribution of the glacial depos-its, their unusual relationship with carbonates andother arid-climate deposits, and the paleomag-netic data led Harland (1964a) to postulate thatsomehow, the entire Earth had become glaciatedduring an interval he referred to as “the great In-fra-Cambrian glaciation” (see also Chumakovand Elston, 1989; Kirschvink, 1992). As the fieldof paleomagnetism developed and methods formeasuring and analyzing paleomagnetic rema-nence improved, additional studies were under-taken in rocks associated with certain glacial unitsin Africa (Kröner et al., 1980; McWilliams andKröner, 1981), North America (Morris, 1977),China (Zhang and Zhang, 1985; Li et al., 1991),and Australia (McWilliams and McElhinny, 1980;Embleton and Williams, 1986; Schmidt et al.,1991). All of these studies seemed to confirm thatlow-latitude glaciation had occurred over much ofthe existing landmass during the Neoproterozoic.
The low-latitude glaciation hypothesis has metconsiderable resistance over the years because itdoesn’t fit a familiar rule of thumb: sedimentarydeposits commonly linked with particular cli-matic conditions (e.g., carbonates, coal, bauxite)are supposed to lie within certain latitudinalranges, because the climates that influencedthose deposits have latitude-dependent meantemperatures in the more modern world (Bridenand Irving, 1964). (It is ironic that this rule ofthumb was based upon a frequency analysis ofthe paleolatitudes of such deposits as determinedby paleomagnetism.) Objections to the hypothe-sis on sedimentological grounds have centeredon the possibility that widespread diamictites arenonglacial, perhaps related to debris flow in tec-tonically active basins (Schermerhorn, 1974) ormeteorite impact ejecta blankets (e.g., Oberbecket al., 1993; Rampino, 1994; cf. Young, 1993).For the most part, such objections are easily ad-dressed because there is ample evidence ofglaciation. Thick successions (to thousands ofmeters) of marine diamictite contain glaciallystriated and faceted stones (e.g., Hambrey andHarland, 1981, 1985; Eyles, 1993). Associated
laminated siltstones contain dropstones that areinferred to have been ice rafted (Crowell, 1964;Ovenshine, 1970; Vorren et al., 1983) rather thantransported by some other means (e.g., biologicalrafting or gravitational processes; Bennett et al.,1994; Menzies, 1995). Signs of erosion beneathice sheets are preserved, particularly aroundbasin margins, as rare, glacially striated pave-ments (Biju-Duval and Gariel, 1969), in somecases associated with valleys tens to hundreds ofmeters deep (Christie-Blick, 1983; Edwards,1984; Karfunkel and Hoppe, 1988; Sønderholmand Jepsen, 1991). Periglacial features, such assand wedges and frost-heaved blocks, are alsofound in connection with a number of the glacialdeposits (e.g., Nystuen, 1976; Deynoux, 1982;Williams and Tonkin, 1985; Zhang, 1994). Con-sidering the extent and regional stratigraphic con-text of those deposits, it is clear that debris flowsor meteorite impacts cannot explain the Neopro-terozoic deposits (Young, 1993). Suggestionsthat the deposits are glacially derived but wereproduced by glacial activity in an alpine setting(Eyles, 1993) cannot account for all circum-stances, because several examples were clearlydeposited at some distance from features withsignificant topographic relief (Christie-Blick,1983; Deynoux et al., 1989; Moncrieff, 1989;Lemon and Gostin, 1990).
Criticism of the low-latitude glaciation hy-pothesis also has been based upon the availablepaleomagnetic data. Meert and Van der Voo(1994) assessed the quality of recent paleomag-netic studies supporting the low-latitude hypoth-esis, including those studies mentioned here, byapplying criteria developed to evaluate the relia-bility of paleopoles calculated from such data(e.g., Van der Voo, 1990). While not foolproof,reliability criteria provide a more uniform way toevaluate the likelihood that the magnetic rema-nences measured are primary. In their review,Meert and Van der Voo (1994) found that the ma-jority of the studies they examined had low relia-bility scores for a variety of reasons. Poor strati-graphic correlations between rocks sampled andthe glacial rocks (Congo), possible remagnetiza-tions (Namibia, north China), and improved datareflecting at least mid-latitude depositional set-tings (Baltica) have cast doubt on the data sup-porting the low-latitude glaciation hypothesis fornearly all of the locations examined. While mostcontinents are now thought to have beenglaciated at middle latitudes or higher during ei-ther of the Neoproterozoic glacial intervals (cf.Park, 1997), the Marinoan glacial interval of Aus-tralia continues to provide the best evidence forthe existence of an unusually cold climate in theEarth’s past.
The most recent paleomagnetic studies fromAustralia (Schmidt et al., 1991; Schmidt and
PALEOMAGNETIC POLARITY REVERSALS, MARINOAN GLACIAL DEPOSITS, AUSTRALIA
Geological Society of America Bulletin, August 1999 1121

Williams, 1995) have yielded excellent datasupporting the low-latitude glaciation hypothe-sis. However, these studies still leave open thepossibility that the magnetic remanence pre-served is not primary, but a remagnetization thatoccurred perhaps 50–90 m.y. after glaciation,possibly in relation to the Delamerian orogenicevent in South Australia (as noted in Meert andVan der Voo, 1994). The Schmidt et al. (1991)study was problematic because the sampleswere taken from a single section of tidal rhyth-mites in the southern Flinders Ranges repre-senting as little as 60–70 yr, an interval that isinsufficient for averaging out the secular varia-tion of the Earth’s magnetic field. Schmidt andWilliams (1995) addressed this problem bysampling a number of sites from three separatesections in the central Flinders Ranges, and re-ported a possible reversal. However, the combi-nation of a small number of sites sampled (fiveper section), scatter in the data as reflected bysmall values of k (i.e., the best estimate ofFisher’s precision parameter), and relativelysmall structural variation between sections didnot permit the application of a regional-scalefold test to help constrain the age of the magne-tization.
Moreover, Schmidt and Williams’s (1995)principal argument for the primary nature of themagnetization still rested upon the samples’ sta-ble, high-temperature magnetic remanence (agood indication, but not a guarantee), as well asthe results of micro-scale fold tests conducted onslabs of the southern Flinders rhythmite (Sumneret al., 1987; Schmidt et al., 1991). Williams(1996) interpreted the small folds sampled assynsedimentary, describing them as part of grav-ity-slide deposits that formed after the sedimentshad been transformed into a hydroplastic state.The photographic evidence provided, however,does not demonstrate the sort of disharmonicfolding normally considered characteristic ofsynsedimentary folds (e.g., Ricci Lucchi, 1995).If these small folds are not synsedimentary, theirorigins—and thus the origins of the magnetiza-tion they preserve—remain unclear. These uncer-tainties indicate a need for additional paleomag-netic work.
NEW PALEOMAGNETIC RESULTSFROM AUSTRALIA
The objective of this study was to acquire pa-leomagnetic data that could provide the strongestconstraints yet on the paleolatitudes of Marinoanglacial deposits, especially by constraining thetiming of magnetic remanence acquisition. To ac-complish this goal, high-resolution sampling wasundertaken in locations that permitted us to applyfield stability tests for the age of magnetization
(e.g., was the remanence acquired before, during,or after tectonic folding?). (Part A of Data Repos-itory1 discusses sampling and analytical meth-ods.) Detailed sampling would also permit theconstruction of a magnetostratigraphy that couldbe used to correlate between stratigraphic sec-tions, both within and between basins, to investi-gate whether magnetization was acquired inclose association with sedimentation. Preglacialstrata were also sampled to determine whether itwas likely that Australia had been glaciated athigh latitudes, and then drifted into lower lati-tudes where the glacial rocks had acquired a lowmagnetic inclination during remagnetization (re-ferred to here as the drift hypothesis; Crowell,1983; Meert and Van der Voo, 1994). Various re-gions of Australia with differing tectonic historieswere sampled in an effort to gain independentconfirmation of our paleomagnetic results for theMarinoan. Not all of these efforts were entirelysuccessful, but several yielded critical data thatsupport the low-latitude glaciation hypothesis.
Regional and Stratigraphic Context for Sampling
Three regions with lithostratigraphic units ofroughly equivalent age were selected for thisstudy: the central Flinders Ranges and Stuart shelfof South Australia, and the northeastern portion(Ooraminna subbasin) of the Amadeus basin ofcentral Australia (Fig. 1). Structural deformationof the rocks in these regions varies in both degreeand timing. The strata of the central FlindersRanges were gently warped into a series of dou-bly plunging folds during the Delamerianorogeny, a mid-Early Cambrian to earliest Or-dovician (ca. 526–480 Ma) collisional event thataffected the southeastern margin of the Australianpaleocontinent (e.g., Preiss, 1987; Jenkins, 1990;Turner et al., 1994; Chen and Liu, 1996; Flöttmanet al., 1998; see time scale of Bowring and Erwin,1998). The Stuart shelf, located on the easternedge of the Gawler craton, was virtually unaf-fected by the Delamerian orogeny and has notbeen subjected to any significant tectonic activitythrough the Phanerozoic; its strata are essentiallyundeformed (Sprigg, 1952; Thomson, 1969;Preiss and Forbes, 1981; Drexel and Preiss, 1995).The Ooraminna subbasin of the Amadeus basinunderwent some deformation during Neoprotero-zoic time as a result of salt movement (Field,1991; Kennedy, 1993, 1994), but Sturtian andyounger rocks were not involved in any signifi-
cant compressional tectonic events until the AliceSprings orogeny in Devonian-Carboniferous time(Oaks et al., 1991; Ding et al., 1992). Of thesethree regions, only the central Flinders Rangesprovided useful paleomagnetic data; these are dis-cussed in detail in following sections. (Paleomag-netic data from the Stuart shelf and Amadeusbasin that proved uninterpretable are discussed inPart B of Data Repository; see footnote 1.)
Paleomagnetic sampling in the central FlindersRanges focused upon four formations: thepreglacial Trezona and Yaltipena Formations, andthe late glacial to early postglacial Elatina andNuccaleena Formations (see Fig. 2 for regionalstratigraphic context of these units, and Fig. 3 forsampling locations). The Trezona and YaltipenaFormations are important for this study not sim-ply because lithostratigraphic relationships markthem as preglacial, but also because the sedimen-tology of these two units has been interpreted astypical of a warm, tropical setting (Lemon, 1988).Thus, the Trezona and Yaltipena Formations pro-vide an opportunity to test the “drift hypothesis”(Crowell, 1983). The Trezona Formation consistsof stromatolitic and intraclastic limestone layersalternating with calcareous and non-calcareoussiltstones that has been interpreted as typical of awarm-water carbonate ramp (Preiss, 1987;Lemon, 1988). Locally preserved at the top of theTrezona Formation is the Yaltipena Formation(formerly referred to informally as the YaltipenaMember of the Trezona Formation; Lemon,1988), which consists of red siltstones and sand-stones that contain mud cracks, dolomitic tepees,and oscillation ripple marks characteristic of veryshallow water depths (Lemon, 1988; Lemon andReid, 1998), as well as rare calcite vugs that maybe evaporite replacements.
The glaciomarine Elatina Formation consistslargely of feldspathic, silty to fine-grained sand-stones that display considerable local facies varia-tion (Lemon and Gostin, 1990). The basal unit istypically a diamictite or pebble conglomerate ofvariable thickness, with a sandy matrix and pebbleto cobble and boulder-sized clasts of diverse lithol-ogy. In the areas north of Trezona Bore (Fig. 3),exposures of the basal diamictite and/or conglom-erate rest upon an unconformable surface display-ing several meters of erosional relief and plasticdeformation of the underlying, partially lithifiedred sandstones of the Yaltipena Formation; thesefeatures are suggestive of ice-contact deformation.Additional diamictite beds with silty matrix andcobble-sized clasts of diabase that are most likelyderived from xenoliths exposed in nearby diapirs(Fig. 3) are also found in this area (Lemon andGostin, 1990). The tidal rhythmite member of theElatina Formation, which was the focus of some ofthe earlier paleomagnetic studies (Embleton andWilliams, 1986; Schmidt et al., 1991), is repre-
SOHL ET AL.
1122 Geological Society of America Bulletin, August 1999
1GSA Data Repository item 9965, supplemental ta-bles and data, is available on the Web at http://www.geosociety.org/pubs/ftpyrs.htm. Requests may also besent to Documents Secretary, GSA, P.O. Box 9140,Boulder, CO 80301; e-mail: [email protected].

sented in the central Flinders Ranges by a singleinterval <1 m thick at the northern end of Arkabadiapir, ~36 km south-southwest of the ElatinaFormation section sampled at Trezona Bore (Fig. 3); it is interbedded with the very fine grainedfeldspathic sandstone common elsewhere near thetop of the formation. The Elatina Formation isoverlain disconformably by the NuccaleenaFormation. The Nuccaleena is the cap carbonate ofthe central Flinders Ranges; it is typically a finelylaminated, buff-weathering pink dolomite, al-though some facies variations have been observed(Preiss, 1987; Kennedy, 1996). Although the pres-ence of cap carbonates like the Nuccaleena havebeen interpreted in the past as a return to warmtropical conditions (e.g., Lemon and Gostin,1990), the proposed unusual geochemical condi-tions associated with these carbonates as well astheir subtidal depositional settings (Kennedy,1996; Hoffman et al., 1998) make the determina-tion of temperate vs. tropical depositional environ-ments for the cap carbonates difficult at present.
The Elatina and Nuccaleena Formations weresampled along three sections that afforded thebest opportunities to conduct a fold test (see Figs.1A and 3). Two of these sections, the BennettSpring section (31°13′S lat, 138°48′E long) and
the Trezona Bore section (31°17′S lat, 138°39′Elong) are ~18 km apart and are on opposite sidesof a salt diapir. The third section at Warcowie(31°47′S lat, 138°40′E long) is located ~55 kmsouth-southeast of Trezona Bore. The averagebedding attitude of the Elatina and NuccaleenaFormations at the Bennett Spring Section is strike165°, dip 14°NE; at the Trezona Bore section,strike 170°, dip 16°SW; and at Warcowie, strike055°, dip 85°NW. The Trezona and YaltipenaFormations were sampled along only two sec-tions, because at Warcowie the exposure of theTrezona Formation is too incomplete and theYaltipena Formation is completely absent. Theaverage bedding attitude for the Trezona andYaltipena sections at Bennett Spring is strike 168°,dip 14°NE; at the Northern Park section, located afew hundred meters north of the Elatina Forma-tion’s Trezona Bore section to take advantage ofsuperior outcrop, it is strike 167°, dip 16°SW.
Analysis of Paleomagnetic Results
The analysis of the paleomagnetic data illus-trates well the difficulties in obtaining reliable re-sults from shallow-water carbonates and diamic-tites. Remanence directions from the carbonates
of the Trezona and Nuccaleena Formations arewidely scattered and poorly defined. Their rela-tively low unblocking temperatures (<600 °C)and isothermal remanent magnetization (IRM)tests of the magnetic mineralogy in these forma-tions (method of Lowrie, 1990) suggest that mag-netite and goethite are the principal remanencecarriers. The scattering and poor definition of themagnetization directions, as well as the commonpresence of goethite, suggest that the carbonatescarry unstable magnetizations unsuitable for usein paleomagnetic studies. Thus, the carbonateshave not been included in subsequent analysis.
The Yaltipena and Elatina Formations yieldedmuch better results overall. Two components ofnatural remanent magnetization (NRM) couldbe consistently identified as linear thermal de-magnetization trajectories in these samples(Fig. 4): a low-temperature component A(0–300 °C), and a high-temperature componentC (600–675 °C). In many samples there is alsosome indication of an intermediate temperaturecomponent B (350–575 °C; see, e.g., Fig. 4I).The remanence directions recorded by the Acomponents of the Yaltipena and Elatina For-mations are northerly with moderately steep in-clinations in in situ coordinates, similar to (al-
PALEOMAGNETIC POLARITY REVERSALS, MARINOAN GLACIAL DEPOSITS, AUSTRALIA
Geological Society of America Bulletin, August 1999 1123
Spenc
er G
ulf
137oE 139oE
Gawler Craton
South A
ustralia
Arunta BlockAlice
Springs
Petermann Ranges 0 100 km
MusgraveBlock
WA
NT
135oE132oE 23oS
25oS
CentralRidge
N
N
N
NS
WV
ictoria0 100 km
36oS
FLINDERS
RANGES
Pichi RichiPass
34oS
TorrensH
ingeZone
32oS
1000 km0
129oE
Adelaide
STUARTSHELF
Curnamona CratonicNucleus
GawlerCraton
141oE
30oS
A) B)
OORAMINNASUB-BASIN
A
Bbasin
craton
platform
Figure 1. Locations of sections sampled for paleomagnetic study. (A) Adelaide geosyncline and Stuart shelf. (B) Amadeus basin (adapted fromPreiss, 1987; Lindsay et al., 1987; Lindsay and Korsch, 1991). Area inside box in A is shown in greater detail in Figure 3.

though distinct from) the orientation of the pre-sent-day magnetic field in the region (Fig. 5, Aand C). The A component is likely a thermo-viscous magnetization acquired during the Ter-tiary uplift of the Flinders Ranges (Wellmanand Greenhalgh, 1988).
In both the Yaltipena and Elatina samples, thesite mean C component directions have moder-ate to shallow inclinations and either north-northwest or southwest declinations (Fig. 6), al-though there are slight differences in thedistribution of the site mean directions fromsection to section (see Table 1 for summary ofdata). The overall remanence direction for theElatina Formation in this study (site mean D = 212.1°, I = –16.9° for 58 sites) is similar tothose directions previously published (e.g.,D = 197.4°, I = –7.1° for 10 sites; Schmidt andWilliams, 1995).
In contrast to the A and C components, the Bcomponent is not well defined (Fig. 5, B and D);on the site level, the remanence directions arespread out in a broad band with generally north-west directions. The B component vectors typi-cally make a small angle with either the A or Ccomponent, or even show signs of curvature (e.g.,Fig. 4I). These characteristics combined suggesttwo possible origins for the B component: (1) it isan artifact resulting from overlap between thelow-temperature, thermoviscous A componentand the high-temperature C component; or (2) itrepresents a magnetization component, the de-magnetization spectrum of which overlaps that ofthe C component to such an extent that it is diffi-cult to isolate. The latter origin is supported byaspects of the magnetic mineralogy and stabilitytests performed on the samples (see followingdiscussions).
Magnetic Mineralogy
Thermal demagnetization of the Yaltipena andElatina samples and IRM tests of the magneticmineralogy (method of Lowrie, 1990) have iden-tified hematite as the dominant magnetic rema-nence carrier, although traces of goethite (a recentweathering product) and rare relict magnetite arealso present (Fig. 7). A scanning electron micro-scope (SEM) survey revealed numerous silt- tovery fine sand-sized opaque detrital grains; thesegrains include various Fe-Ti oxides displaying ex-solution lamellae, as well as grains that are nowhematitic in composition, but that retain the relictcrystallographic structure of magnetite (see alsoEmbleton and Williams, 1986). The ultimatesource of the opaque detrital grains must be ig-neous or metamorphic, because only thesesources would have achieved the high tempera-
SOHL ET AL.
1124 Geological Society of America Bulletin, August 1999
Cam
bria
n
Wilp
ena
Gro
upU
mbe
rata
na G
roup
Ne
op
rote
roz
oic
Pal
eozo
ic
Hawker Group
Uratanna Fm
Elatina Fm
Enorama Shale
Etina Fm
Sunderland Fm
Tapley Hill Fm
Wilyerpa
Pualco Tillite
Holowilena Ironstone
Neo
prot
eroz
oic
IIIC
ryo
ge
nia
n
~750
Ediacaranfauna
Marinoanglaciation
Sturtianglaciation
Tapley Hill Fm
Whyalla Sandstone
Tent Hill Fm
Nuccaleena Fm
Aralka Fm
Limbla Member
Ringwood Member
Areyonga Fm
Olympic Fm
Gaylad Sandstone
Julie Fm
ArumberaSandstone
Pertatataka FmYarloo Shale
Brighton Limestone
Todd River Dolomite
Cyclops Mbr
Unit 1
Unit 2
Unit 4Unit 3
Central FlindersRanges
Geologic TimePeriod
Geologic Events
Central and Eastern Amadeus BasinEra
Waldo Pedlar Mbr
Ear
lyMid
Late
12
34
Lake Frome Group
Wirrealpa LimestoneBilly Creek Limestone
Delamerianorogeny(FlindersRanges)
543
~600
~700
Age(Ma)
530
525
520
510
500 Deception FmIllara Sandstone
Tempe Fm
Arumbera Sandstone
Petermann SandstonePacoota Sandstone
Andamooka LimestoneYarrawurta Shale
490
Angepena Fmequivalent
Wilmington Fmequivalent
Stuart Shelf
Rawnsley Quartzite
Bonney SandstoneWonoka Fm
Bunyeroo Fm
ABC Range Quartzite
Brachina Fm
Nuccaleena Fm
Trezona Fm Yaltipena Fm
Figure 2. Stratigraphic correlation chart for the regions sampled in this study, from mid-Neoproterozoic through Cambrian time (adapted fromPreiss, 1987; Kennard and Lindsay, 1991; Shergold et al., 1991; Gravestock, 1993; Callen and Reid, 1994; Preiss et al., 1998). The time scale forthe Cambrian Period was adapted from Bowring and Erwin (1998); subdivisions of the Early Cambrian shown are: 1 = Nemakit-Daldynian(Manykaian), 2 = Tommotian, 3 = Atdabanian, and 4 = Botomian. Neoproterozoic age estimates for the Sturtian and Marinoan glaciations arefrom Knoll and Walter (1992). The dotted lines marking the bottom of the Uratanna Formation, as well as the bottom of the Arumbera Sand-stone unit 3 and top of the Arumbera unit 2, reflect the current uncertainty in the ages of these boundaries (e.g., Mount and McDonald, 1992).

tures necessary (>600 °C) for the formation of ex-solution lamellae. Appropriate potential sourcesfor these grains can be found in the Mesoprotero-zoic volcanic and metasedimentary rocks of theGawler craton, west of the central FlindersRanges (see Fig. 1; Drexel et al., 1993). Embletonand Williams (1986) reported that many Fe-Ti ox-ide grains in the Elatina Formation around PichiRichi Pass (Fig. 1A) had been martitized, i.e.,hematite had replaced magnetite. Many of thesetitano-magnetite grains were likely oxidized to ti-tano-hematite prior to deposition, and thus the Ccomponent magnetization carried by the Fe-Tioxides could be primarily a detrital or early post-depositional remanent magnetization.
In addition to the detrital Fe-Ti oxide grains,there is abundant hematite in the form of submi-cron-sized crystals that coat the larger grains. Theorigins of this ultrafine hematite are not certain; itcould be the product of diagenetic alteration offerric oxyhydroxides originally deposited withinthe glacial sediment. A diagenetic origin for thehematitic coating would mean that any magneticremanence carried by the coating is a chemicalremanent magnetization (CRM) younger than theremanence carried by the detrital Fe-Ti oxidegrains. The strength of the magnetizations in the
samples examined (~10–2–10–3A/m; see Fig. 4for examples) suggests that the detrital grains,rather than the hematitic coating, carry most ofthe remanent magnetization present. However, aCRM carried by the coating may be the source ofthe overprint (i.e., the B component) observed inmany of the samples.
Stability Tests
To help determine whether the site mean Ccomponent data from the central Flinders Rangesrepresent a primary magnetic remanence (i.e., adetrital or an early diagenetic remanence) orsome later magnetization, we applied geologicalor field stability tests to the central Flinders datato link the magnetizations to the geologic historyof the rocks. Four tests commonly used for sedi-mentary rocks are the fold test, the reversals test,the conglomerate test, and the unconformity test(see review in Butler, 1992).
Two of the tests we applied, the conglomerateand unconformity tests, yielded indeterminate re-sults. The diamictites in the Trezona Bore sectionof the Elatina Formation were targeted for a con-glomerate test, because the clasts within the di-amictite are composed of diverse lithologic types
and are large enough to sample with a rock drill.A conglomerate test is positive if the stable direc-tions of individual clasts have a random distribu-tion, indicating that the entire unit (and perhapsother stratigraphic units in the region) has notbeen remagnetized. Unfortunately, the claststested yielded unstable magnetizations that couldnot be compared with those of the matrix.
The contact between the Yaltipena and ElatinaFormations at the Trezona Bore–Northern Parksections was selected for an unconformity test(Kirschvink, 1978a), since there are several me-ters of relief on the unconformable surface be-tween the two units. Had we been able todemonstrate that the polarity stratigraphy of theYaltipena beneath the unconformity was differ-ent from laterally adjacent but stratigraphicallysuperjacent polarity stratigraphy of the ElatinaFormation above the unconformity, the magne-tizations of both the Yaltipena and Elatina rockscould have been considered primary. Unfortu-nately, the crucial intervals of both formationsyielded unstable magnetizations, and so couldnot be used for the test.
Other tests proved to be more revealing. De-finitive inferences regarding the reliability ofmagnetizations can be made from the results of
PALEOMAGNETIC POLARITY REVERSALS, MARINOAN GLACIAL DEPOSITS, AUSTRALIA
Geological Society of America Bulletin, August 1999 1125
EXPLACAINOZOIC TERTIARY-QUATE
Recent alluvial
PALAEOZOIC CAMBRIA
Limestone, sand
PROTEROZOICADELAIDEA
WILPENA GROUP
UMBERATANA GR
1 2
k
S
Sandstone and
Shal
Siltstone and
Glacial CALLANA GROUP
Diapirs (injectedderived from Ca
Major geological
Hawker
31o 30'S
139o 139oE138o 30'E31oS
Bennett Spring
Trezona Bore/Northern Park
Warcowie
N
Wilpena
Parachilna
Cenozoic EraTERTIARY-QUATERNARY
Recent alluvial sediments
Paleozoic Era
Limestone, sandstone, and shale
Neoproterozoic Era
NEOPROTEROZOIC IIIWILPENA GROUP
UMBERATANA GROUP
Sandstone and quartzite
Shale
Siltstone and limestone; thinglacial sediments at top
Glacial sediments
CALLANA GROUP
Diapirs (injected broken rock derived from Callana Group)
0 10 20 km
CRYOGENIAN
Major geological fault
CAMBRIAN
Figure 3. Map of the central Flinders Ranges showing the locations of sections sampled for this study (after Selby, 1990).

1126 Geological Society of America Bulletin, August 1999
A) E01-3B NRM
N
W,Up
1 Tick = 1 mA/m
680 650 100450
B) E05-2A
NRM
N
W,Up
1 Tick = 1 mA/m 675
650
500
300
C) TE03-3NRM
N
W,Up
1 Tick = 1 mA/m 690
670500
300
D) EE21-1NRM
N
W,Up
1 Tick = 1 mA/m
300
550
690 670
E) EE33-1 NRM
N
W,Up
1 Tick = 1 mA/m
300
650670
NRM
NW,Up
1 Tick = 10 mA/m
690
500625
675
G) EE51-1NRM
N
W,Up
1 Tick = 1 mA/m
300
690660
500
H) ES02A-1 NRM
N
W,Up
1 Tick = 1 mA/m
300685
670
560
I) ES04-2ANRM
E
N,Up
1 Tick = 1 mA/m
300
540
685625
J) EW26-2
NRM
N
W,Up
1 Tick = 1 mA/m 690
670
540
300
K) EW30-1NRM
N
W,Up
1 Tick = 10 mA/m
685670
300
550
L) EW38-3 NRM
N
W,Up
1 Tick = 1 mA/m
300
685
550
670
F) EE45-2
Figure 4. Representative vector component diagrams (Zijderveld plots) showing progressive thermal demagnetization (in bedding tilt–correctedcoordinates) of selected samples from the Yaltipena and Elatina Formations. These are among the samples that best illustrate the low-temperatureA component and high-temperature C component. Yaltipena Formation: (A, B) Northern Park section; (C) Bennett Spring section. Elatina Forma-tion: (D, G) Bennett Spring section; (H, I) Warcowie section; (J, L) Trezona Bore section. Axes scale indicates measured intensity of the sample’scharacteristic remanent magnetization. Numbers on the plots indicate particular temperature steps. Open circles and filled circles represent thevertical and horizontal components, respectively, of the magnetic vector for each temperature step given. NRM—natural remanent magnetization.

Geological Society of America Bulletin, August 1999 1127
C)
D)
N = 106 sites
N = 92 sites
In situ
A)
B)
N N
N = 37 sites
N = 33 sites
Tilt-corrected
Figure 5. Equal-area projections of A andB component site mean directions in both insitu and bedding tilt-corrected coordinates.Yaltipena Formation, all sites: (A) A compo-nent and (B) B component. Elatina Formation,all sites: (C) A component and (D) B compo-nent. Open circles and filled circles representnegative and positive inclinations, respectively.The orientation of the present-day magneticfield in the central Flinders Ranges with re-spect to the A component directions is indi-cated by a white triangle in A and C.

1128 Geological Society of America Bulletin, August 1999
In situ
N N
A)
B)
C)
D)
N = 16 sites
N = 33 sites
N = 17 sites
N = 8 sites
Tilt-corrected
Figure 6. Equal-area projections of C com-ponent site mean directions in both in situ andbedding tilt-corrected coordinates. YaltipenaFormation: (A) Northern Park and BennettSpring sections combined. Elatina Formation:(B) Bennett Spring section; (C) Trezona Boresection; and (D) Warcowie section. Open cir-cles and filled circles represent negative andpositive inclinations, respectively.

the fold test. The reversals test shows the neces-sity of averaging over both normal and reversedpolarities to suppress bias of residual overprintcontamination. The presence of distinct polarityintervals, combined with the magnetic mineral-ogy, provides further supportive evidence of earlymagnetization acquisition. These analyses are de-scribed in the following.
Fold Test
Graham’s (1949) fold test can determinewhether magnetization was acquired before orafter folding by comparing the clustering of sitemean directions uncorrected for bedding tilt(geographic, or in situ directions) to clusteringof site mean directions with bedding restored tohorizontal (McElhinny, 1964; McFadden, 1990;McFadden and Jones, 1981). A significant im-provement of clustering upon tilt correction isevidence that the magnetization was acquiredprior to folding, and the directions are said tohave passed the fold test. If the clustering wors-ens upon tilt correction, the magnetization wasacquired after folding (the directions fail thefold test). On occasion, the clustering of sitemeans reaches a maximum at some point<100% unfolding; such a result might indicatemagnetization acquired during folding (e.g.,Sumner et al., 1987; Schmidt et al., 1991; butsee Halim et al., 1996).
When the fold test is applied to the A compo-nent site mean directions for both the Yaltipenaand Elatina Formations, the clustering of site meandirections clearly worsens upon tilt correction(Fig. 5, A and C). To confirm these observations,we applied the McFadden and Jones (1981) foldtest to the Yaltipena directions, and the more con-servative McElhinny (1964) fold test to the Elatinadirections (where the large number of sites makesapplication of the McFadden and Jones (1981) testimpractical). In both cases, the observed test val-ues for the in situ directions exceed the critical testvalues at the 99% level; thus both the Yaltipena and
Elatina Formation A components are postfoldingin origin, consistent with the Cenozoic age in-ferred from its mean direction. The same fold testapplied to the B component for both formationsproduces similar results, i.e., the B component isalso postfolding in origin. The diffuse distributionof B component directions (Fig. 5, B and D)makes it difficult to identify the precise age of thecomponent, but the northwesterly directions andmoderate inclinations most closely resemble theEarly Jurassic paleomagnetic data of Australia(e.g., Schmidt, 1976, 1990).
We then applied the fold test to the C compo-nent directions for the two units. We compared thetwo Yaltipena sections to each other, and each ofthe three Elatina sections to one another, using thein situ and tilt-corrected mean directions calcu-lated for each section from the individual C com-ponent site means. For the Elatina Formation,mean directions were calculated from the sectionmeans as well (Table 1). In all cases, the cluster-ing of data improved when bedding was restoredto horizontal (Figs. 6A and 8). The improvementin clustering of the Elatina section mean direc-tions (Fig. 8B) is obvious, and is significant at the95% confidence limit according to the conserva-tive test of McElhinny (1964) (i.e., k2/k1 = 8.25,exceeding the critical test ratio of 6.39). Using themore sensitive fold test of McFadden and Jones(1981), the improvement in clustering of sitemeans for both the Yaltipena and the Elatina issignificant at the 99% level (Table 2). An addi-tional examination of clustering at various levelsof unfolding of the Yaltipena and Elatina Forma-tions does not indicate the presence of synfoldingmagnetization (Fig. 9). Thus both the Yaltipenaand Elatina Formations cleanly pass the fold test.However, such a prefolding remanence couldhave been acquired at any point during thelengthy interval between the Marinoan glaciationand the Delamerian orogeny (~50–90 m.y.); thereis also a question of magnetic overprint acquisi-tion (see next section). Further evidence for thetiming of remanence acquisition is required.
Reversals Test
The presence of dual polarities (i.e., reversals)within the site mean directions of the YaltipenaFormation, and particularly within the ElatinaFormation, is an encouraging indicator for thepreservation of a primary magnetization (Fig. 6).Van der Voo (1990) used the presence of reversalsas one of the criteria for evaluating the reliabilityof paleomagnetic data. We performed a reversalstest to determine whether the mean direction ofone polarity in a section is statistically indistin-guishable, at the 5% level of significance, fromthe antipode of the opposite polarity; if the twodirections are indistinguishable, the sectionpasses the reversal test (McFadden and Lowes,1981; McFadden and McElhinny, 1990).
For the Yaltipena and Elatina Formations, themeans of the north-northeast cluster of direc-tions were compared with the means of thesouthwest cluster of directions. In all cases, thenorth-northeast cluster means are statisticallydistinguishable from the antipodes of the south-west cluster means; accordingly, both forma-tions fail the reversals test (Table 3). This failuremay be due to either a wide separation in age be-tween the north-northeast and southwest direc-tions, or to some magnetic overprint that was notremoved by the thermal demagnetization proce-dures outlined here. A fold test applied to thenorth-northeast and southwest site mean direc-tions separately for both the Yaltipena andElatina Formations suggests that both polaritiespredate Delamerian folding (Table 2). Sincemuch of the magnetization is apparently carriedby detrital Fe-Ti oxide grains, the north-northeastand southwest directions are likely close in age toeach other as well as the time of deposition.
However, a CRM overprint carried by thehematitic coating—perhaps partly represented bythe ill-defined B component noted here—wouldbe difficult to separate completely from the re-manence carried by the detrital grains becausetheir demagnetization spectra overlap signifi-
PALEOMAGNETIC POLARITY REVERSALS, MARINOAN GLACIAL DEPOSITS, AUSTRALIA
Geological Society of America Bulletin, August 1999 1129
TABLE 1. PALEOMAGNETIC DATA FROM THE CENTRAL FLINDERS RANGES
Formation/ N In situ coordinates Tilt-corrected coordinatessection Dm Im k1 α95 Dm Im k2 α95 λ φ dp dm Plat
(°E) (°N) (°) (°E) (°N) (°) (°N) (°E) (°) (°) (°)
Yaltipena FormationBennett Spring (YBS) 5 209.8 –38.7 13.8 21.4 215.5 –27.4 14.2 21.0 –33.0 0.9 12.5 22.9 –14.5Northern Park (YNP) 11 200.6 0.2 12.1 13.7 199.2 –11.2 14.2 12.6 –48.8 348.4 6.5 12.8 –5.7Yaltipena Formation total 16 203.0 –11.9 8.0 13.9 204.0 –16.4 12.2 11.0 –44.2 352.7 5.9 11.4 –8.4
Elatina FormationBennett Spring (EBS) 33 201.8 –28.1 9.0 8.8 206.9 –19.7 9.2 8.7 –41.2 355.1 4.8 9.1 –10.2Trezona Bore (ETB) 17 219.9 –4.9 9.8 12.0 218.0 –14.7 10.5 11.6 –36.9 8.4 6.1 11.9 –7.5Warcowie (EW) 8 246.3 –18.2 18.4 13.3 219.5 –9.6 19.0 13.0 –37.5 11.8 6.7 13.2 –4.8Elatina Fm total (sites) 58 213.9 –20.6 7.1 7.6 212.1 –16.9 9.9 6.2 –39.7 1.9 3.3 6.4 –8.6Elatina Fm total (sections) 3 223.1 –17.9 11.5 38.1 214.9 –14.7 94.9 12.7 –38.9 5.6 6.7 13.0 –7.5
Notes: N—number of sites or sections; Dm and Im—mean declination, inclination of N sites or sections; k—the best estimate of Fisher’s precision parameter; α95—radius of95% circle of confidence for the mean direction; λ and φ—latitude and longitude of paleopole for mean direction; dp and dm—semi-minor and semi-major axes of 95% polar errorellipse; Plat—paleolatitude.

cantly. It is quite probable that the paleomagneticresults of previous studies have been similarly af-fected by such a CRM overprint. The fewer datain these studies, combined with unequal numbersof normal and reversed polarity sites, may haveprevented the clear identification of the overprint(see following section on comparison with otherNeoproterozoic paleomagnetic results).
Magnetostratigraphy
The chief difference between this study andprevious studies of Marinoan age rocks becomes
apparent when the mean site data are plotted (inmodified form) in their stratigraphic context: it isclear that distinct polarity magnetozones havebeen recorded in both the Yaltipena and ElatinaFormations (Fig. 10). We make tentative interpre-tations of polarity here based upon previous pale-omagnetic work that covers the post-Marinoanthrough Cambrian interval in the Amadeus basin(Kirschvink, 1978b), as well as previously pub-lished apparent polar wander (APW) paths foreast Gondwana (e.g., Powell et al., 1993). Ac-cording to these interpretations, the Earth’s mag-netic field in late Neoproterozoic time corre-
sponds to reversed polarity for southwest and updirections and normal polarity for north-northeastand down directions; Australia thus is right-side-up near the equator, but mostly in the NorthernHemisphere (see Table 1 and Fig. 11). Strati-graphic intervals labeled as being of uncertainpolarity are so marked for either of two reasons:(1) the section was not sampled owing to poor ex-posure and/or unpromising lithology (e.g., whitesandstone); or (2) samples were taken that did notyield reliable paleomagnetic data according to thecriteria established for this study. In counting thenumber of reversals per section, we assume no
SOHL ET AL.
1130 Geological Society of America Bulletin, August 1999
J/J o
0
0.2
0.4
0.6
0.8
1.0
D) EE21-1 E) EE33-1 F) EE45-2
J/J o
G) EE51-1 H) ES02A-1 I) ES04-2A
0
0.2
0.4
0.6
0.8
1.0
J/J o
J) EW26-2 K) EW30-1 L) EW38-3
0
0.2
0.4
0.6
0.8
1.0
0 100 200 300 400 500 600 7000 100 200 300 400 500 600 700 0 100 200 300 400 500 600 700
J/J o
A) E01-3B B) E05-2A C) TE03-30
0.2
0.4
0.6
0.8
1.0
Temperature (oC) Temperature (oC) Temperature (oC)
Figure 7. Plots of the change in magnetic intensity J/J0 with progressive thermal treatments for selected samples. Yaltipena Formation: (A, B)Northern Park section; (C) Bennett Spring section. Elatina Formation: (D, G) Bennett Spring section; (H, I) Warcowie section; (J, L) TrezonaBore section. Note that in most cases, a significant portion of the sample’s measured intensity is retained until a temperature of 660–680 °C isreached, indicating that hematite carries the high-temperature C component. Sharp decreases in J/J0 from 0°–100° or 200 °C (e.g., samples A, H,and L) indicate the presence of goethite; the abrupt dip in J/J0 at ~560 °C in sample I likely indicates the presence of magnetite.

polarity changes within uncertain intervals. Notethat several polarity intervals, particularly thosenear the bases of the Yaltipena Formation North-ern Park section and the Elatina Formation Tre-zona Bore section, are tentatively identified hereby single data points only.
Unfortunately, an obvious feature of the polar-ity intervals in Figure 10 is the lack of consis-tency in the pattern of polarity changes from sec-tion to section. For example, the Bennett Springsection of the Yaltipena Formation shows onlytwo polarity intervals over a thicker interval thanthe Northern Park section, which shows sevenpossible polarity intervals. The discrepancy inmagnetostratigraphy between these two sectionsmay be partly an artifact of the wider spacing ofsampling sites, since sites were located 15–20 mapart in the lower two-thirds of the section. Anadditional obstacle is the limited regional preser-vation of the Yaltipena Formation within salt-withdrawal synclines (Lemon, 1988); precisephysical stratigraphic correlation between thetwo sections is not possible, and there are fewconstraints on how the polarity intervals can bematched. The relatively small numbers of paleo-magnetically reliable data points defining the po-larity intervals, particularly within the BennettSpring section, also cloud the issue.
A similar correlation problem is apparentwithin the Elatina Formation, as the TrezonaBore section displays seven polarity intervalscompared to five at Bennett Spring and only twoat Warcowie, over stratigraphic intervals ofroughly comparable thickness. In the ElatinaFormation, however, the fundamentally discon-tinuous nature of glacial strata is most likely re-sponsible for much of our inability to correlatemagnetostratigraphy between sections. Glacio-marine deposits like the Elatina are typicallyhighly variable, both along depositional strikeand crossing from shallow-water to deeper waterenvironments. Such variability is largely a func-tion of their proximity to sediment sources, suchas subglacial tunnel mouths in grounded ice mar-gins (e.g., Eyles et al., 1985; Menzies, 1995).This variability is clearly illustrated in the ElatinaFormation lithologic columns (Fig. 10B). For ex-ample, the Trezona Bore section (the closest sec-tion to an inferred grounded-ice margin) has sev-eral diamictite units and disconformities and isoverall coarser grained in comparison to the Ben-nett Spring section, which has only one distinctdiamictite layer and only one apparent disconfor-mity. The Warcowie section, which is farthestfrom the inferred grounded ice margin and closeto the transition to deep-water glacial sedimentsof the southern Flinders Ranges, includes only avery thin, discontinuous diamictite bed at itsbase. It is important to note, however, that our in-ability to make magnetostratigraphic correlations
PALEOMAGNETIC POLARITY REVERSALS, MARINOAN GLACIAL DEPOSITS, AUSTRALIA
Geological Society of America Bulletin, August 1999 1131
N N
A)
B)
N = 58 sites
N = 3 sections
in situ Tilt-corrected
Figure 8. Comparison of the Elatina’s in situ and tilt-corrected (A) site mean directions and(B) section mean directions for the fold test. Mean directions for north-northeast and southwestclusters in (A), and overall mean directions in (B), are indicated by the solid black squares withtheir corresponding α95 confidence limits. Improvement in the clustering of directions upon tiltcorrection is most obvious for the section means, although it is also evident in the site mean di-rections through the decreasing diameter of α95confidence limits for north-northeast and south-west tilt-corrected cluster means.
TABLE 2. FOLD TEST RESULTS FOR C COMPONENT, CENTRAL FLINDERS RANGES*
Formation N Critical test Observed Observed Passesvalue at test value test value fold 1% level (in situ) (tilt-corrected) test?
Yaltipena FormationAll site mean directions 16 0.3893 0.3959 0.2441 YesNorth-northeast site mean directions 8 1.1548 1.9152 0.7520 YesSouthwest site mean directions 8 1.1548 0.2434 0.0673 †
Elatina FormationAll site mean directions 58 3.5082 12.0464 1.8081 YesNorth-northeast site mean directions 25 3.7922 6.7320 1.6027 YesSouthwest site mean directions 33 3.6490 12.0045 1.5885 Yes
Notes: N—number of sites.*Fold test calculated as per McFadden and Jones (1981). The fold test is passed if the observed test value (in
situ) exceeds the critical test value, while the observed test value (tilt-corrected) does not. The fold test is failedif the opposite holds true.
†When neither the observed in situ or tilt-corrected test values exceed the critical test value, the results of thefold test are indeterminate. Such a result indicates that the structural distortion of the beds was too small toyield a significance with the available sample (McFadden and Jones, 1981).

1132 Geological Society of America Bulletin, August 1999
0 20 40 60 80 100 7
8
9
10
11
12
13 A)
Pre
cisi
on p
aram
eter
,k
Percentage of unfolding
5
6
7
8
9
10
0 20 40 60 80 100
B)
Pre
cisi
on p
aram
eter
, kN = 16 sites
N = 58 sites
Percentage of unfolding
C)
0
20
40
60
80
100
0 20 40 60 80 100
Pre
cisi
on p
aram
eter
, k
Percentage of unfolding
N = 3 sections
Figure 9. Test for the presence of synfoldingmagnetization. The precision parameter k foran overall mean direction would reach a peakvalue at somewhat less than 100% bedding tiltcorrection (i.e., unfolding to a horizontal posi-tion) if magnetization were acquired duringfolding. The value of k has been calculated at5% increments of unfolding. (A) YaltipenaFormation (mean direction calculated from sitemeans). (B) Elatina Formation (mean directioncalculated from site means). (C) ElatinaFormation (mean direction calculated fromsection means). The steady increase in k in allthree plots suggests that magnetization was notacquired during folding.
between sections does not automatically invali-date our interpretation of the magnetic polarityintervals as primary, or the Elatina Formation asa low-latitude deposit; it simply means that theprecise depositional relationship between sec-tions remains unresolved.
Comparison with Other Neoproterozoic Paleomagnetic Results
The combination of multiple polarity reversals,a positive regional-scale fold test, and detrital orearly postdepositional magnetic remanence re-vealed in this study contributes to a very robustpaleomagnetic survey of the Marinoan age glacialdeposits. To compare previous paleomagneticstudies more easily to this one, we calculatedtime-averaged paleopoles for the Yaltipena andElatina Formations from the section mean direc-tions (Table 1). These poles are then plotted alongwith other late Neoproterozoic–Cambrian paleo-poles published for Australia (Fig. 12; see alsoTable DR1 [see footnote 1]). The overall similari-ties between the Yaltipena (YA = Yaltipena aver-age) and Elatina (EA = Elatina average) poles andseveral other late Neoproterozoic poles (LA,BR1, E1, and E2) are clear; their clustering agreeswell with the presumed close age relationships oftheir corresponding rock units.
There is a small but significant difference(16.3°) between the previously published averagepaleopole for the Elatina Formation (Schmidtand Williams, 1995) and the average Elatina pa-leopole in this study, but it can be readily ex-plained by overprint polarity bias. At both thesite mean and individual sample levels, Schmidtand Williams’ (1995) data contain a ratio ofnorth-northeast:southwest directions (“nor-mal:reversed” polarity) of ~2:1 (see also TableDR2 [see footnote 1]). Thus, the mean direction(and corresponding paleopole) derived eitherfrom their sample or site mean data has beensomewhat biased by an overprint caused by theabundance of north-northeast directions. Thepresence of this bias can be confirmed by com-paring the antipode of the mean north-northeast
direction for the site means in this study (Dm = 202.9°, Im = –4.9°,α95 = 10.0) to theoverall Schmidt and Williams (1995) mean di-rection for their site mean data (Dm = 197.4°,Im = –7.1°,α95 = 15.2). They are only 5.9° apartand statistically indistinguishable. In contrast,the overall mean direction for the site mean dataof this study (Dm = 212.1°, Im = –16.9°) hasbeen calculated from a subequal number ofnorth-northeast and southwest directions (ratioof ~1:1.3); as such, we argue that this overallmean direction, and its corresponding paleo-pole, should better average out the overprint andis less biased than Schmidt and Williams’previ-ously published result.
Paleolatitude of Marinoan Glacial Deposits
The paleolatitudes of the Yaltipena and ElatinaFormations can be determined from the meantilt-corrected inclinations of each unit (see Table1), as inclination, I, and latitude,λ, can be relatedthrough this simple equation, assuming a geo-centric axial dipole:
tan I = 2 tan λ. (1)
Error limits based upon the α95 values for themean inclinations can then be assigned to the pa-leolatitude estimates as follows:
λmaximum= tan–1 {0.5[tan (I + α95)]} (2)
λminimum= tan–1 {0.5[tan (I - α95)]} (3)
Thus, the paleolatitude estimate for theYaltipena Formation (N = 16 sites) is –8.4°, witherror limits of –2.7° and –14.5°. For the ElatinaFormation (N = 58 sites), the paleolatitude esti-mate is –8.6°, with error limits of –5.4° and–12.0°; averaged over three sections instead, theElatina’s paleolatitude estimate is –7.5°, with er-ror limits of –1.0° and –14.5°. Based upon polar-ity interpretations previously published forslightly younger data in the Amadeus basin, weinterpret these values as representative of re-
versed field conditions, so that Australia lieswithin the Northern Hemisphere.
The paleomagnetic results from the ElatinaFormation provide ample evidence in favor of thelow-latitude glaciation hypothesis for Australiaca. 600 Ma. In addition, the low paleolatitude forthe Yaltipena Formation is consistent with thewarm, arid setting inferred for these rocks andimplies that Australia occupied a near-equatorialposition just prior to glaciation as well, makingthe “drift hypothesis” rather unlikely. Althoughwe were unable to use our own data from theAmadeus basin and Stuart shelf to verify inde-pendently the low paleolatitudinal position of theMarinoan glacial deposits, we note that a calcu-lated average paleolatitude of ~8° for the centralFlinders Ranges during the Marinoan glaciationis consistent with a paleolatitude of ~18° (frompole LA) for the younger Lower Arumbera Sand-stone of the Amadeus basin (Kirschvink, 1978a)and a paleolatitude of ~3° (from pole BR1) forthe Brachina Formation of the Mount LoftyRanges (Karner, 1974). These secondary con-straints also serve to support the low-latitudeglaciation hypothesis for the Marinoan glaciationin Australia (Fig. 11).
A fundamental assumption we make for thisstudy is that the Earth’s magnetic field behaved inNeoproterozoic time much as it has in the recentpast, i.e., that the time-averaged paleofield can bewell approximated by a dipole located at the cen-ter of the Earth and aligned with the Earth’s geo-graphic (rotational) axis (the geocentric axial di-pole hypothesis, or GAD). However, someresearchers have suggested that the Earth’s mag-netic field may have behaved differently in thedistant past. One of us (Kent) has collaborated ona statistical study of magnetic inclinations inEarth history that found a greater number of lowmagnetic inclination data from Precambrian andPaleozoic rocks than would be expected if theEarth’s magnetic field were behaving dominantlyas a GAD (Kent and Smethurst, 1998). Thatstudy has suggested that either (1) the magneticfield contained a much larger non-dipole compo-nent than it did in Mesozoic and Cenozoic time(~30% compared to <10%) that exerted a “flat-tening” influence on magnetic inclinations, or(2) the GAD was valid but (super)continents hada tendency to cycle into low latitudinal positionsowing to true polar wander. We are unable to ex-clude the first hypothesis in relation to this study,but we prefer and assume a GAD field for theMarinoan pending additional paleomagnetic datafrom other continents that could further constrainthe magnetic field’s behavior.
In summary, the paleomagnetic data from theYaltipena and Elatina Formations support a lowpaleolatitude for Australia both prior to and dur-ing the Marinoan glaciation. The new Elatina pa-
PALEOMAGNETIC POLARITY REVERSALS, MARINOAN GLACIAL DEPOSITS, AUSTRALIA
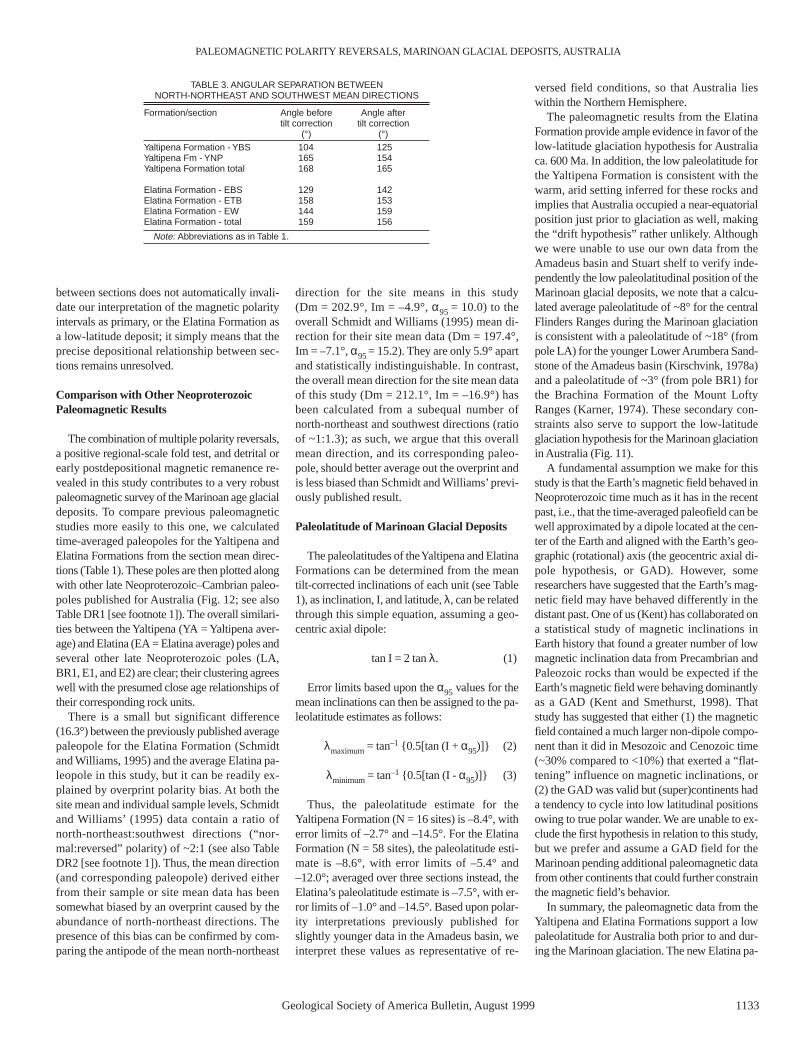
Geological Society of America Bulletin, August 1999 1133
TABLE 3. ANGULAR SEPARATION BETWEEN NORTH-NORTHEAST AND SOUTHWEST MEAN DIRECTIONS
Formation/section Angle before Angle aftertilt correction tilt correction
(°) (°)Yaltipena Formation - YBS 104 125Yaltipena Fm - YNP 165 154Yaltipena Formation total 168 165
Elatina Formation - EBS 129 142Elatina Formation - ETB 158 153Elatina Formation - EW 144 159Elatina Formation - total 159 156
Note: Abbreviations as in Table 1.

leopole in this study is robust, and can be usedwith confidence to constrain the APW path forAustralia in late Neoproterozoic time. We nowconsider what the new paleomagnetic data, com-bined with stratigraphic information about theElatina Formation and other Marinoan glacialdeposits, imply about the duration of low-latitudeglaciation in Australia.
DURATION OF LOW-LATITUDEGLACIATION IN AUSTRALIA
One of the continuing vexations in Neoprotero-zoic geology is the dearth of reliable radiometricdates to constrain the timing of geologic events.The age of the Marinoan glaciation is, not surpris-ingly, poorly constrained; the age limits of 610and 575 Ma are based upon the presumed rela-tionship of the Marinoan glaciation to Varangerglacial intervals elsewhere in the world (e.g.,Hambrey and Harland, 1981; Knoll and Walter,1992), and estimated sedimentation rates of stratabetween the top of the glacial rocks and the Pre-cambrian-Cambrian boundary, respectively (Con-way Morris, 1988; Grotzinger et al., 1995). Theduration of glaciation within those age limits hasbeen correspondingly difficult to quantify, partic-ularly where stratigraphic discontinuities have in-terrupted the sedimentary record. The presence ofmultiple magnetic polarity intervals in the ElatinaFormation permits us, for the first time, to makesome semiquantitative estimates of the duration oflow-latitude glaciation in Australia.
We assume that the Earth’s magnetic field be-haved then much as it has in the recent past: (1) thetime-averaged magnetic paleofield can be well ap-proximated by the GAD hypothesis (allowing lat-itude to be calculated from inclination using the di-pole formula; see equation 1); (2) the sequence ofpolarity reversals is stochastic to first order, vary-ing from several per million years to one per sev-eral million years, to long intervals of several mil-lion to several tens of millions of years with noreversals (Opdyke and Channell, 1996); (3) theEarth’s magnetic field typically takes on the orderof several thousand years to complete the transi-tion from one polarity state to another (e.g.,Clement and Kent, 1984); and (4) once the reversalis complete, the paleomagnetic field tends to be in-hibited from reversing again for a minimum of30–50 k.y. (McFadden and Merrill, 1984, 1993).
The polarity stratigraphy for the ElatinaFormation, as shown in Figure 10B, suggests thatthere were a minimum of four polarity reversalsduring its period of deposition, and possibly sev-eral more (if polarity intervals currently definedby only one data point are included and/or thetime spans represented by each stratigraphic sec-tion do not completely overlap). The ElatinaFormation should thus represent a minimum
SOHL ET AL.
1134 Geological Society of America Bulletin, August 1999
Sandstone
Siltstone
Shale
Dolomite
Diamictite
Dolomitic tepee
Carbonate cement
Calcite-filled vug
Rip-up clasts/intraclasts
Pebble/granule layer
Silty laminae
Mud cracks
Unconformity
Load casts
Deformed bedding
Trough cross-bedding
vcs v fmcsh
Rotated VGP Latitude0 45 90
120
130
140 m
0 m
10
20
30
40
50
60
70
80
90
100
110
Rotated VGP Latitude0 45 90
vcs v fmcsh
A)
Ripple marks
–90–45 –90–45
Bennett Spring Section Northern Park Section
110 m
0 m
20
40
50
60
70
80
90
100
10
30
Normal
Reversed polarity
Uncertain polarity
Figure 10. Stratigraphic sections with paleomagnetic data and polarity interpretations for (A) the Yaltipena Formation and (B) the Elatina Formation. The site mean directions are shownhere as rotated virtual geomagnetic pole (VGP) latitudes to simplify the comparison between in-dividual site mean directions and the time-averaged paleopole for each section. A VGP is calcu-lated for each site mean, and then both the VGPs and the mean paleopole are rotated until themean paleopole is at 90° latitude; the new latitude of the VGP is the rotated VGP latitude. Theplots show the latitudinal distance between the VGP latitudes and the paleopole; VGP latitudesmore than 45° away from the mean paleopole would have been considered unrelated to the pa-leopole, and would not have been included in this analysis.

span of several tens of thousands of years on thebasis of assumed reversal duration, and hundredsof thousands of years if inhibition was generallyoperative. The unit could represent as much asseveral million years, depending on the (un-known) rate of reversals in Neoproterozoic time.
In estimating the duration of the Marinoanglaciation, it is important also to consider thestratigraphic relationship of the Elatina Forma-tion to other Marinoan deposits in South Aus-tralia. The thinness of the Elatina Formation(generally <100 m) has been used to suggest thatit represents the waning stages of glaciation in theregion (Lemon and Gostin, 1990). The ElatinaFormation contains a number of stratigraphic dis-continuities of indeterminate duration, and prob-ably represents multiple advances and retreats ofthe local ice front. In subbasins to the north and
south of the central Flinders Ranges, the Mari-noan glacial deposits are considerably thicker, asmuch as ~1000 m to the north and more than~1500 m to the south (Preiss, 1987). These sub-basins contain thick successions of dropstone-bearing siltstones containing dropstones that pre-sumably accumulated over a considerableamount of time, and stratigraphic relationshipssuggest that these basinal deposits predate theElatina Formation in large part (Preiss, 1987).Between the polarity data and the stratigraphicdata, it is plain that glaciation in Australia mayhave persisted for a few million years, and per-haps considerably longer.
As the sole glacial deposits confirmed to havebeen deposited at low paleolatitudes, the ElatinaFormation and related Marinoan units representthe nadir of the late Neoproterozoic cooling
trend; they may also be the youngest glacial de-posits of the Varanger glacial interval. The poten-tially lengthy time span encompassed by thesedeposits suggests that the global cooling trendleading first to the development of ice sheets athigher latitudes was an interval of long duration,perhaps similar in time scale (if not severity) tothe Cenozoic cooling trend (e.g., Frakes, 1986;Miller et al., 1987; Ruddiman, 1997). If so, thenclimate forcings that operate on ~106 yr timescales, such as changes in ocean circulation in-duced by shifting continental masses and/orchanges in sea-floor topography, would havebeen important in setting the stage for severecooling in equatorial regions. However, the ap-parent swift collapse of glaciation inferred frommodels for cap carbonate deposition (e.g.,Kennedy, 1996; Hoffman et al., 1998) suggests
PALEOMAGNETIC POLARITY REVERSALS, MARINOAN GLACIAL DEPOSITS, AUSTRALIA
Geological Society of America Bulletin, August 1999 1135
Trezona Bore Section Warcowie Section110 m
100
90
80
70
60
50
40
30
20
10
0
csvffm vc
Rotated VGP latitude0 45 90
100 m
90
80
70
60
50
40
30
20
10
0
csvffm vc
Rotated VGP latitude110 m
100
90
80
70
50
40
30
20
10
0
csvffm vc
Rotated VGP latitude0 45 90
B) Bennett Spring Section
–90–45 –90–45 0 45 90 –45–90
60
Figure 10. (Continued).

that shorter-term “trigger” events also played arole in destabilizing the climatic system. Furtherwork is required to identify which climate forc-ing mechanisms operating at a variety of timescales are the key controls governing Earth’sProterozoic climate.
CONCLUSIONS
A paleomagnetic investigation of the ElatinaFormation of the central Flinders Ranges, SouthAustralia, has yielded a statistically significant,positive regional-scale fold test, as well as re-vealed the presence of multiple polarity inter-vals. These findings confirm that the Elatina’smagnetization predates tectonic folding duringCambrian time, thus providing the strongest ev-idence to date in favor of low-latitude glaciationof Australia in late Neoproterozoic time. In fact,with the Elatina Formation located at ~8°, all ofAustralia’s Marinoan glacial deposits must bebelow 30°. Meert and Van der Voo’s (1994) re-view of the Neoproterozoic paleomagnetic re-sults concerning the low-latitude glaciation hy-pothesis suggested that the paleomagnetic datafrom the Elatina Formation, if valid, did notnecessarily imply either global glaciation or anon-uniformitarian climate; they cited theproposition (Eyles, 1993) that Marinoan glacialdeposits accumulated in the elevated regions ofan active tectonic setting, so that the depositscould be low latitude but not low elevation.However, the glaciomarine nature of the ElatinaFormation and its correlative basinal strata, plusthe fact that its depositional setting had been apassive margin for ~100 m.y., precludes such apossibility (e.g., Preiss, 1987; Powell et al.,1994). Meert and Van der Voo’s suggestion thatglacial-interglacial intervals occurred as Aus-tralia (among other continents) drifted into, orout of, latitudes = 25° is also not supported bythe paleomagnetic data from the preglacialYaltipena Formation; these data suggest thatAustralia maintained a low latitudinal positionprior to, as well as during, the Marinoan glacia-tion. Thus, our new paleomagnetic data supportthe existence of an unusually cold climate inlate Neoproterozoic time. The number of mag-netic polarity intervals present within theElatina Formation, considered along with itsstratigraphic relationship to other Marinoanglacial deposits, suggests that glaciation per-sisted at low latitudes in Australia for at leastseveral hundreds of thousands to possibly mil-lions of years.
ACKNOWLEDGMENTS
This paper is part of L. Sohl’s Ph.D. dissertationdone at Columbia University under the supervi-
SOHL ET AL.
1136 Geological Society of America Bulletin, August 1999
10°S
0°
30°N
20°N
10°N
Figure 11. Inferred paleolatitude of Australia during deposition of the Elatina Formation ca.600 Ma (this study). Triangles mark the locations of Marinoan glacial deposits. The TasmanLine (heavy solid line) marks the approximate eastern limit of the Australian paleocontinentprior to Phanerozoic time (Veevers, 1984).
E1
BR2
BY1
BY2
BA
UA
TRD
HG2
60o S
30o S
0o
90o S
15o S
45o S
75o S
E2
LA
D
HG1
LF
PS
BR1
EA
IS
T
YA
330o E
345oE0o
15 oE
30 oE
Figure 12. Comparison of Yaltipena and Elatina Formation paleopoles with other Neopro-terozoic and Cambrian paleopoles from Australia (see Fig. 2 for their stratigraphic context).Filled circles represent late Neoproterozoic poles from the Flinders–Mt. Lofty Ranges (AmadeusBasin). YA, EA, this study; E1, Embleton and Williams (1986); E2, Schmidt and Williams(1995); BR1, Karner (1974); BR2, BY1, McWilliams and McElhiny (1980); BY2, Schmidt andWilliams (1996); BA, Schmidt and Williams (1991); LA, Kirschvink (1978a). Open squares rep-resent Cambrian poles from the Flinders–Mt. Lofty Ranges (Amadeus basin). HG1, HG2, LFG,T, IS, PS, D, Klootwijk (1980); UA, TRD, Kirschvink (1978a). The mean Elatina Formation pa-leopole from this study, as well as the two previously published Elatina poles E1 and E2, areshown with their α95 confidence limits in gray.

sion of N. Christie-Blick. Research was supportedby National Science Foundation grants EAR-92–06084 (Christie-Blick), EAR-94–18294(Christie-Blick and L. A. Derry), and ATM-93–17227 (Kent), and by grants-in-aid from theGeological Society of America, Sigma Xi, and theLamont-Doherty Center for Climate Research(Sohl). We thank the National Park and WildlifeService and the Flinders Ranges Aboriginal Her-itage Consultative Committee for permission tocollect samples from the Flinders Ranges NationalPark, local station owners for access to theirproperties, and F. Newell and D. Newell for lo-gistical assistance in the field. We also thank D. F.McNeill, J. G. Meert, D. A. Evans, and an anony-mous reviewer for helpful comments that im-proved the manuscript.
REFERENCES CITED
Beck, J. W., Edwards, R. L., Ito, E., Taylor, F. W., Recy, J.,Rougerie, F., Joannot, P., and Henin, C., 1992, Sea-sur-face temperature from coral skeletal strontium/calciumratios: Science, v. 257, p. 644–647.
Bengtson, S., ed., 1994, Early life on Earth: New York, Colum-bia University Press, Nobel Symposium No. 84, 656 p.
Bennett, M. R., Doyle, P. Mather, A. E., and Woodfin, J. L.,1994, Testing the climatic significance of dropstones: Anexample from southeast Spain: Geological Magazine,v. 131, p. 845–848.
Bidgood, D. E. T., and Harland, W. B., 1961, Palaeomagnetismin some East Greenland sedimentary rocks: Nature,v. 189, p. 633–634.
Biju-Duval, B., and Gariel, O., 1969, Nouvelles observationssur les phénomènes glaciaires “éocambriens” de la bor-dure nord de la synéclise de Taoudeni, entre le Hank et leTanezrouft (Sahara occidental): Palaeogeography, Palaeo-climatology, Palaeoecology, v. 6, p. 283–315.
Bowring, S. A., and Erwin, D. H., 1998, A new look at evolu-tionary rates in deep time: Uniting paleontology and high-precision geochronology: GSA Today, v. 8, p. 1–8.
Briden, J. C., and Irving, E., 1964, Palaeolatitude spectra ofsedimentary palaeoclimatic indicators,in Nairn,A. E. M.,ed., Problems in palaeoclimatology: Proceedings ofNATO Paleoclimates Conference: New York, IntersciencePublishers, p. 199–225.
Broecker, W. S., 1996, Glacial climate in the tropics: Science,v. 272, p. 1902–1904.
Broecker, W. S., and Denton, G. H., 1989, The role of ocean-atmosphere reorganization in glacial cycles: Geochim-ica et Cosmochimica Acta, v. 53, p. 2465–2501.
Butler, R. F., 1992, Paleomagnetism: Magnetic domains to ge-ologic terranes: Boston, Blackwell Scientific Publica-tions, 319 p.
Callen, R.A., and Reid, P. W., compilers, 1994, Geology of theFlinders Ranges National Park: South Australia Geologi-cal Survey Special Map, scale 1:75 000, 1 sheet.
Carver, J. H., and Vardavas, I. M., 1994, Precambrian glacia-tions and the evolution of the atmosphere: Annalas Geo-physicae, v. 12, p. 674–682.
Chen,Y. D., and Liu, S. F., 1996, Precise U-Pb zircon dating ofa post-D2 meta-dolerite: Constraints for rapid tectonic de-velopment of the southern Adelaide Fold Belt during theCambrian: Geological Society of London Journal, v. 153,p. 83–90.
Christie-Blick, N., 1983, Glacial-marine and subglacial sedi-mentation, upper Proterozoic Mineral Fork Formation,Utah,in Molnia, B. F., ed., Glacial-marine sedimentation:New York, Plenum Press, p. 703–776.
Chumakov, N. M., and Elston, D. P., 1989, The paradox of lateProterozoic glaciations at low latitudes: Episodes, v. 12,p. 115–120.
Clement, B. M., and Kent, D.V., 1984, Latitudinal dependencyof geomagnetic polarity transition durations: Nature,v. 310, p. 488–491.
CLIMAP Project Members, 1976, The surface of the ice-ageEarth: Science, v. 191, p. 1131–1137.
Conway Morris, S., 1988, Radiometric dating of the Precam-brian-Cambrian boundary in the Avalon Zone,in Landing,E., Narbonne, G. M., and Myrow, P. M., eds., Trace fossils,small shelly fossils, and the Precambrian-Cambrianboundary: New York State Museum Bulletin, v. 463,p. 53–58.
Cowie, J. W., and Brasier, M. D., eds., 1989, The Precambrian-Cambrian boundary: Oxford, United Kingdom, Claren-don Press, 213 p.
Crowell, J. C., 1964, Climatic significance of sedimentary de-posits containing dispersed megaclasts,in Nairn,A. E. M.,ed., Problems in palaeoclimatology: New York, Inter-science, p. 86–99.
Crowell, J. C., 1983, Ice ages recorded on Gondwanan conti-nents: Geological Society of South Africa Transactions,v. 86, p. 238–261.
Dalziel, I. W. D., 1991, Pacific margins of Laurentia and EastAntarctica as a conjugate rift pair: Evidence and implica-tions for an Eocambrian supercontinent: Geology, v. 19,p. 598–601.
Dalziel, I. W. D., 1995, Earth before Pangea: Scientific Ameri-can, January 1995, p. 58–63.
Deynoux, M., 1982, Periglacial polygonal structures and sandwedges in the late Precambrian glacial formations of theTaoudeni Basin in Adrar of Mauritania (West Africa):Palaeogeography, Palaeoclimatology, Palaeoecology,v. 39, p. 55–70.
Deynoux, M., 1985, Terrestrial or waterlain glacial diamictites?Three case studies from the late Precambrian and LateOrdovician glacial drifts in west Africa: Palaeogeography,Palaeoclimatology, Palaeoecology, v. 51, p. 97–141.
Deynoux, M., Kocurek, G., and Proust, J. N., 1989, Late Prot-erozoic periglacial eolian deposits on the west Africanplatform, Taoudeni Basin, western Mali: Sedimentology,v. 36, p. 531–549.
Ding, P., James, P. R., and Sandiford, M., 1992, Late Protero-zoic deformation in the Amadeus Basin, central Australia:Australian Journal of Earth Sciences, v. 39, p. 495–500.
Drexel, J. F., and Preiss, W.V., eds., 1995, The geology of SouthAustralia: The Phanerozoic: Geological Survey of SouthAustralia Bulletin 54, v. 2, 347 p.
Drexel, J. F., Preiss, W.V., and Parker,A. J., eds., 1993, The ge-ology of South Australia: The Precambrian: GeologicalSurvey of South Australia Bulletin 54, v. 1, 242 p.
Edwards, M. B., 1984, Sedimentology of the Upper Protero-zoic glacial record, Vestertana Group, Finnmark, northNorway: Norges Geologiske Undersøkelse Bulletin 394,76 p.
Embleton, B. J. J., and Williams, G. E., 1986, Low palaeolati-tude of deposition for late Precambrian periglacialvarvites in South Australia: Implications for palaeoclima-tology: Earth and Planetary Science Letters, v. 79,p. 419–430.
Evans, D. A., Beukes, N. J., and Kirschvink, J. L., 1997, Low-latitude glaciation in the Palaeoproterozoic era: Nature,v. 386, p. 262–266.
Eyles, C. H., Eyles, N., and Miall, A. D., 1985, Models ofglaciomarine sedimentation and their application to theinterpretation of ancient glacial sequences: Palaeogeogra-phy, Palaeoclimatology, Palaeoecology, v. 51, p. 15–84.
Eyles, N., 1993, Earth’s glacial record and its tectonic setting:Earth-Science Reviews, v. 35, p. 1–248.
Fairbridge, R. W., 1991, Planetary beats and geology,in Flod-mark, S., ed., New approaches in geomagnetism and theEarth’s rotation: London, World Scientific, p. 222–244.
Field, B. D., 1991, Paralic and periglacial facies and contem-poraneous deformation of the Late Proterozoic OlympicFormation, Pioneer Sandstone and Gaylad Sandstone,Amadeus Basin, central Australia,in Korsch, R. J., andKennard, J. M., eds., Geological and geophysical studiesin the Amadeus Basin, central Australia: Bureau of Min-eral Resources, Geology and Geophysics Bulletin 236,p. 127–136.
Flöttman, T., Haines, P., Jago, J., James, P., Belperio, A., andGum, J., 1998, Formation and reactivation of the Cam-brian Kanmantoo trough, SE Australia: Implications forearly Palaeozoic tectonics at eastern Gondwana’s platemargin: Geological Society of London Journal, v. 155,p. 525–539.
Frakes, L. A., 1986, Mesozoic-Cenozoic climatic history and
causes of glaciation,in Hsü, K. J., ed., Mesozoic andCenozoic oceans: American Geophysical Union Geody-namics Series, v. 15, p. 33–48.
Girdler, R. W., 1964, The palaeomagnetic latitudes of possi-ble ancient glaciations,in Nairn,A. E. M., ed., Problemsin palaeoclimatology: Proceedings of NATO Paleocli-mates Conference: New York, Interscience Publishers,p. 115–118.
Gough, D. O., 1981, Solar interior structure and luminosityvariations: Solar Physics, v. 74, p. 21–34.
Graham, J. W., 1949, The stability and significance of magnet-ism in sedimentary rocks: Journal of Geophysical Re-search, v. 54, p. 131–167.
Gravestock, D. I., 1993, Early Cambrian carbonates in theFlinders Ranges,in Jenkins, R. J. F., Lindsay, J. F., and Wal-ter, M. R., eds., Field guide to the Adelaide Geosynclineand Amadeus Basin,Australia:Australian Geological Sur-vey Organisation Record no. 1993/35,Appendix G.
Grotzinger, J. P., Bowring, S. A., Saylor, B. Z., and Kaufman,A. J., 1995, Biostratigraphic and geochronologic con-straints on early animal evolution: Science, v. 270,p. 598–604.
Halim, N., Cogné, J. P., Courtillot, V., and Chen,Y., 1996, Ap-parent synfolding magnetization as a result of overlap ofpre- and post-folding magnetizations: Geophysical Re-search Letters, v. 23, p. 3523–3526.
Hambrey, M. J., and Harland, W. B., eds., 1981, Earth’s pre-Pleistocene glacial record: Cambridge, United Kingdom,Cambridge University Press, 1019 p.
Hambrey, M. J., and Harland, W. B., 1985, The late Proterozoicglacial era: Palaeogeography, Palaeoclimatology,Palaeoecology, v. 51, p. 255–272.
Hansen, J. E., and Takahashi, T., eds., 1984, Climate processesand climate sensitivity: American Geophysical UnionGeophysical Monograph 29, 368 p.
Harland, W. B., 1964a, Critical evidence for a great Infracam-brian glaciation: Geologische Rundschau, v. 54, p. 45–61.
Harland, W. B., 1964b, Evidence of late Precambrian glaciationand its significance,in Nairn, A. E. M., ed., Problems inpalaeoclimatology: Proceedings of NATO PaleoclimatesConference: New York, Interscience Publishers,p. 119–149.
Harland, W. B., and Bidgood, D. E. T., 1959, Palaeomagnetismin some Norwegian sparagmites and the late Pre-Cam-brian ice age: Nature, v. 184, p. 1860–1862.
Hays, J. D., Imbrie, J., and Shackleton, N. J., 1976,Variations inthe Earth’s orbit: Pacemaker of the ice ages: Science,v. 194, p. 1121–1132.
Hoffman, P. F., 1991, Did the breakout of Laurentia turn Gond-wanaland inside-out?: Science, v. 252, p. 1409–1412.
Hoffman, P. F., Kaufman,A. J., and Halverson, G. P., 1998, Com-ings and goings of global glaciations on a Neoproterozoictropical platform in Namibia: GSA Today, v. 8, p. 1–9.
Jenkins, R. J. F., 1990, The Adelaide Fold Belt: Tectonic reap-praisal,in Jago, J. B., and Moore, P. S., eds., The evolu-tion of a late Precambrian–early Palaeozoic rift complex:The Adelaide Geosyncline: Geological Society of Aus-tralia Special Publication no. 16, p. 395–420.
Karfunkel, J., and Hoppe,A., 1988, Late Proterozoic glaciationin central-eastern Brazil: Synthesis and model: Palaeo-geography, Palaeoclimatology, Palaeoecology, v. 65,p. 1–21.
Karner, G. D., 1974, Palaeomagnetism of the Brachina Forma-tion at Hallett Cove, South Australia [B.Sc. thesis]: Ade-laide, South Australia, Flinders University, 62 p.
Kasting, J. F., 1992, Proterozoic climates: The effect of chang-ing atmospheric carbon dioxide concentrations,inSchopf, J. W., and Klein, C., eds., The Proterozoic bio-sphere: A multidisciplinary study: Cambridge, UnitedKingdom, Cambridge University Press, p. 165–168.
Kennard, J. M., and Lindsay, J. F., 1991, Sequence stratigraphyof the latest Proterozoic–Cambrian Pertaoorrta Group,northern Amadeus Basin, central Australia,in Korsch, R. J.,and Kennard, J. M., eds., Geological and geophysical stud-ies in the Amadeus Basin, central Australia: Australia Bu-reau of Mineral Resources, Geology and Geophysics Bul-letin 236, p. 171–194.
Kennedy, M. J., 1993, The Undoolya Sequence: Late Protero-zoic salt-influenced deposition, Amadeus Basin, centralAustralia: Australian Journal of Earth Sciences, v. 40,p. 217–228.
Kennedy, M. J., 1994, The influence of diapirism and deglacia-
PALEOMAGNETIC POLARITY REVERSALS, MARINOAN GLACIAL DEPOSITS, AUSTRALIA
Geological Society of America Bulletin, August 1999 1137

tion on the development of the Neoproterozoic stratigraphyof the Amadeus Basin, central Australia [Ph.D. dissert.]:Adelaide, South Australia, University of Adelaide, 186 p.
Kennedy, M. J., 1996, Stratigraphy, sedimentology, and iso-topic geochemistry of Australian Neoproterozoic post-glacial cap dolostones: Deglaciation,δ13C excursions,and carbonate precipitation: Journal of Sedimentary Re-search, v. 66, p. 1050–1064.
Kent, D.V., and Smethurst, M.A., 1998, Shallow bias of paleo-magnetic inclinations in the Paleozoic and Precambrian:Earth and Planetary Science Letters, v. 160, p. 391–402.
Kirschvink, J. L., 1978a, The Precambrian-Cambrian boundaryproblem: Paleomagnetic directions from the AmadeusBasin, central Australia: Earth and Planetary Science Let-ters, v. 40, p. 91–100.
Kirschvink, J. L., 1978b, The Precambrian-Cambrian boundaryproblem: Magnetostratigraphy of the Amadeus Basin, cen-tral Australia: Geological Magazine, v. 115, p. 139–150.
Kirschvink, J. L., 1992, Late Proterozoic low-latitude globalglaciation: The snowball Earth,in Schopf, J. W., andKlein, C., eds., The Proterozoic biosphere: A multidisci-plinary study: Cambridge, United Kingdom, CambridgeUniversity Press, p. 51–52.
Klootwijk, C. T., 1980, Early Palaeozoic palaeomagnetism inAustralia: Tectonophysics, v. 64, p. 249–332.
Knoll, A. H., 1992, Biological and biogeochemical preludes tothe Ediacaran radiation,in Lipps, J. H., and Signor, P. W.,eds., Origin and evolution of early Metazoa: New York,Plenum Press, p. 53–84.
Knoll,A. H., 1994, Neoproterozoic evolution and environmen-tal change,in Bengtson, S., ed., Early life on Earth: NewYork, Columbia University Press, Nobel Symposiumno. 84, p. 439–449.
Knoll,A. H., and Walter, M. R., 1992, Latest Proterozoic stratig-raphy and Earth history: Nature, v. 356, p. 673–678.
Kröner,A., McWilliams, M. O., Germs, G. J. B., Schalk, K. L.,and Reid, A., 1980, Paleomagnetism of late Precambrianto early Paleozoic mixtite-bearing formations in Namibia(southwest Africa): The Nama Group and BlaubekerFormation: American Journal of Science, v. 280,p. 942–968.
Lemon, N. M., 1988, Diapir recognition and modelling withexamples from the Late Proterozoic Adelaide Geosyn-cline, Central Flinders Ranges, South Australia[Ph.D. thesis]: Adelaide, South Australia, University ofAdelaide, 139 p.
Lemon, N. M., and Gostin, V. A., 1990, Glacigenic sedimentsof the late Proterozoic Elatina Formation and equiva-lents, Adelaide Geosyncline, South Australia,in Jago,J. B., and Moore, P. S., eds., The evolution of a late Pre-cambrian–early Palaeozoic rift complex: The AdelaideGeosyncline: Geological Society of Australia SpecialPublication no. 16, p. 149–163.
Lemon, N. M., and Reid, P. W., 1998, The Yaltipena Formationof the central Flinders Ranges: Mines and Energy SouthAustralia (MESA) Journal, v. 8, p. 37–39.
Li Yianping, Li Yongan, Sharps, R., McWilliams, M. O., andGao, Z., 1991, Sinian paleomagnetic results from theTarim block, western China: Precambrian Research,v. 49, p. 61–71.
Lindsay, J. F., and Korsch, R. J., 1991, The evolution of theAmadeus Basin, central Australia,in Korsch, R. J., andKennard, J. M., eds., Geological and geophysical studiesin the Amadeus Basin, central Australia:Australia Bureauof Mineral Resources, Geology and Geophysics Bulletin236, p. 7–32.
Lindsay, J. F., Korsch, R. J., and Wilford, J., 1987, Timing thebreakup of a Proterozoic supercontinent: Evidence fromAustralian intracratonic basins: Geology, v. 15,p. 1061–1064.
Lipps, J. H., and Signor, P. W., eds., 1992, Origin and early evo-lution of Metazoa: New York, Plenum Press, 548 p.
Lowrie, W., 1990, Identification of ferromagnetic minerals in arock by coercivity and unblocking temperature proper-ties: Geophysical Research Letters, v. 17, p. 159–162.
McElhinny, M. W., 1964, Statistical significance of the fold testin palaeomagnetism: Royal Astronomical Society Geo-physical Journal, v. 8, p. 338–340.
McFadden, P. L., 1990, A new fold test for palaeomagneticstudies: Geophysical Journal International, v. 103,p. 163–169.
McFadden, P. L., and Jones, D. L., 1981, The fold test in
palaeomagnetism: Royal Astronomical Society Geophys-ical Journal, v. 67, p. 53–58.
McFadden, P. L., and Lowes, F. J., 1981, The discrimination ofmean directions drawn from Fisher distributions: Royal As-tronomical Society Geophysical Journal, v. 67, p. 19–33.
McFadden, P. L., and McElhinny, M. W., 1990, Classificationof the reversal test in palaeomagnetism: GeophysicalJournal International, v. 103, p. 725–729.
McFadden, P. L., and Merrill, R. T., 1984, Lower mantle con-vection and geomagnetism: Journal of Geophysical Re-search, v. 89, p. 3354–3362.
McFadden, P. L., and Merrill, R. T., 1993, Inhibition and geo-magnetic field reversals: Journal of Geophysical Re-search, v. 98, p. 6189–6199.
McWilliams, M. O., and Kröner, A., 1981, Paleomagnetismand tectonic evolution of the Pan-African Damara Belt,southern Africa: Journal of Geophysical Research, v. 86,p. 5147–5162.
McWilliams, M. O., and McElhinny, M. W., 1980, Late Pre-cambrian palaeomagnetism of Australia: The AdelaideGeosyncline: Journal of Geology, v. 88, p. 1–26.
Meert, J. G., and Van der Voo, R., 1994, The Neoproterozoic(1000–540 Ma) glacial intervals: No more snowballearth?: Earth and Planetary Science Letters, v. 123,p. 1–13.
Menzies, J., ed., 1995, Modern glacial environments:Processes, dynamics, and sediments: Boston, Butter-worth-Heinemann, 621 p.
Miller, K. G., Fairbanks, R. G., and Mountain, G. S., 1987, Ter-tiary oxygen isotope synthesis, sea level history, and conti-nental margin erosion: Paleoceanography, v. 8, p. 409–426.
Moncrieff, A. C. M., 1989, The Tillite Group and related rocksof East Greenland: Implications for Late Proterozoicpalaeogeography,in Gayer, R. A., ed., The Caledonidegeology of Scandinavia: London, Graham and Trotman,p. 285–297.
Moores, E. M., 1991, Southwest U.S.–East Antarctic (SWEAT)connection: A hypothesis: Geology, v. 19, p. 425–428.
Morris, W. A., 1977, Paleolatitude of glaciogenic upper Pre-cambrian Rapitan Group and the use of tillites as chrono-stratigraphic marker horizons: Geology, v. 5, p. 85–88.
Mount, J. F., and McDonald, C., 1992, Influence of changes inclimate, sea level, and depositional systems on the fossilrecord of the Neoproterozoic–Early Cambrian metazoanradiation, Australia: Geology, v. 20, p. 1031–1034.
Newman, M. J., and Rood, R. T., 1977, Implications of solarevolution for the Earth’s early atmosphere: Science,v. 198, p. 1035–1037.
Nystuen, J. P., 1976, Late Precambrian Moelv Tillite depositedon a discontinuity surface associated with a fossil icewedge, Rendalen, southern Norway: Norsk GeologiskTidsskrift, v. 56, p. 29–50.
Oaks, R. Q., Jr., Deckelman, J. A., Conrad, K. T., Hamp, L. T.,Phillips, J. O., and Stewart, A. J., 1991, Sedimentationand tectonics in the northeastern and central AmadeusBasin,in Korsch, R. J., and Kennard, J. M., eds., Geolog-ical and geophysical studies in the Amadeus Basin, cen-tral Australia: Australia Bureau of Mineral Resources,Geology and Geophysics Bulletin 236, p. 73–90.
Oberbeck, V. R., Marshall, J. R., and Aggarwal, H., 1993, Im-pacts, tillites, and the breakup of Gondwanaland: Journalof Geology, v. 101, p. 1–19.
Opdyke, N. D., and Channell, J. E. T., 1996, Magnetic stratig-raphy: San Diego, California, Academic Press, 341 p.
Ovenshine,A. T., 1970, Observations of iceberg rafting in Glac-ier Bay,Alaska, and the identification of ancient ice-rafteddeposits: Geological Society of America Bulletin, v. 81,p. 891–894.
Owen, T., Cess, R. D., and Ramanathan, V., 1979, EnhancedCO2 greenhouse to compensate for reduced solar lumi-nosity on early Earth: Nature, v. 277, p. 640–642.
Park, J. K., 1994, Paleomagnetic constraints on the position ofLaurentia from middle Neoproterozoic to Early Cambriantimes: Precambrian Research, v. 69, p. 95–112.
Park, J. K., 1997, Paleomagnetic evidence for low-latitudeglaciation during deposition of the Neoproterozoic Rapi-tan Group, Mackenzie Mountains, N.W.T., Canada:Canadian Journal of Earth Sciences, v. 34, p. 34–49.
Patrick, A., and Thunell, R. C., 1997, Tropical Pacific sea sur-face temperatures and upper water column thermal struc-ture during the last glacial maximum: Paleoceanography,v. 12, p. 649–657.
Powell, C. M.., Li, Z. X., McElhinny, M. W., Meert, J. G., andPark, J. K., 1993, Paleomagnetic constraints on the timingof the Neoproterozoic breakup of Rodinia and the Cam-brian formation of Gondwana: Geology, v. 21, p. 889–892.
Powell, C. M., Preiss, W. V., Gatehouse, C. G., Krapez, B., andLi, Z. X., 1994, South Australian record of a Rodinianepicontinental basin and its mid-Neoproterozoic breakup(~700 Ma) to form the Palaeo-Pacific Ocean: Tectono-physics, v. 237, p. 113–140.
Preiss, W. V., compiler, 1987, The Adelaide Geosyncline: LateProterozoic stratigraphy, sedimentation, palaeontologyand tectonics: Geological Survey of South Australia Bul-letin 53, 438 p.
Preiss, W. V., and Forbes, B. G., 1981, Stratigraphy, correla-tion and sedimentary history of Adelaide (late Protero-zoic) basins in Australia: Precambrian Research, v. 15,p. 255–304.
Preiss, W. V., Dyson, I. A., Reid, P. W., and Cowley, W. M.,1998, Revision of lithostratigraphic classification of theUmberatana Group: Mines and Energy South Australia(MESA) Journal, v. 9, p. 36–42.
Rampino, M. R., 1994, Tillites, diamictites, and ballistic ejectaof large impacts: Journal of Geology, v. 102, p. 439–456.
Ricci Lucchi, F., 1995, Sedimentographica: Photographic atlasof sedimentary structures: New York, Columbia Univer-sity Press, 255 p.
Roberts, J. D., 1976, Late Precambrian dolomites, Vendianglaciation and synchroneity of Vendian glaciations: Jour-nal of Geology, v. 84, p. 47–63.
Ruddiman, W. F., ed., 1997, Tectonic uplift and climate change:New York, Plenum Press, 515 p.
Sagan, C., and Mullen, G., 1972, Earth and Mars: Evolution ofatmospheres and surface temperatures: Science, v. 177,p. 52–56.
Schermerhorn, L. J. G., 1974, Late Precambrian mixtites:Glacial and/or nonglacial?:American Journal of Science,v. 274, p. 673–824.
Schmidt, P. W., 1976, A new palaeomagnetic investigation ofMesozoic igneous rocks in Australia: Tectonophysics,v. 33, p. 1–13.
Schmidt, P. W., 1990, An attempt to determine uplift of theSydney Basin, New South Wales, Australia, from the pa-leomagnetic signatures of dyke contacts from Kiama,inParker, A. J., Rickwood, P. C., and Tucker, D. H., eds.,Mafic dykes and emplacement mechanisms: Proceedingsof the International Dyke Conference, Volume 2: Rotter-dam, A.A. Balkema, p. 263–271.
Schmidt, P. W., and Williams, G. E., 1991, Palaeomagnetic cor-relation of the Acraman impact structure and the LateProterozoic Bunyeroo ejecta horizon, South Australia:Australian Journal of Earth Sciences, v. 38, p. 283–289.
Schmidt, P. W., and Williams, G. E., 1995, The Neoproterozoicclimatic paradox: Equatorial palaeolatitude for Marinoanglaciation near sea level in South Australia: Earth andPlanetary Science Letters, v. 134, p. 107–124.
Schmidt, P. W., and Williams, G. E., 1996, Palaeomagnetism ofthe ejecta-bearing Bunyeroo Formation, late Neoprotero-zoic, Adelaide fold belt, and the age of the Acraman im-pact: Earth and Planetary Science Letters, v. 144,p. 347–357.
Schmidt, P. W., Williams, G. E., and Embleton, B. J. J., 1991,Low palaeolatitude of Late Proterozoic glaciation: Earlytiming of remanence in haematite of the Elatina Forma-tion, South Australia: Earth and Planetary Science Let-ters, v. 105, p. 355–367.
Selby, J., 1990, Corridors through time: The geology of theFlinders Ranges, South Australia: Department of Minesand Energy, South Australia, 37 p.
Shergold, J. H., Elphinstone, R., Laurie, J. R., Nicoll, R. S.,Walter, M. R., Young, G. C., and Zang, W., 1991, LateProterozoic and early Palaeozoic palaeontology and bio-stratigraphy of the Amadeus Basin,in Korsch, R. J., andKennard, J. M., eds., Geological and geophysical studiesin the Amadeus Basin, central Australia:Australia Bureauof Mineral Resources, Geology and Geophysics Bulletin236, p. 97–112.
Sønderholm, M., and Jepsen, H. F., 1991, Proterozoic basins ofNorth Greenland: Grønlands Geologiske UndersøgelseBulletin, v. 160, p. 49–69.
Sprigg, R. C., 1952, Sedimentation in the Adelaide Geosyn-cline and the formation of the continental terrace,inGlaessner, M. F., and Sprigg, R. C., eds., Sir Douglas
SOHL ET AL.
1138 Geological Society of America Bulletin, August 1999

Mawson Anniversary Volume:Adelaide, South Australia,University of Adelaide, p. 153–159.
Stump, E., Miller, J. M. G., Korsch, R. J., and Edgerton, D. G.,1988, Diamictite from Nimrod Glacier area, Antarctica:Possible Proterozoic glaciation on the seventh continent:Geology, v. 16, p. 225–228.
Stute, M., Forster, M., Frischkorn, H., Serejo, A., Clark, J. F.,Schlosser, P., Broecker, W. S., and Bonani, G., 1995,Cooling of tropical Brazil (5 °C) during the last glacialmaximum: Science, v. 269, p. 379–383.
Sumner, D.Y., Kirschvink, J. L., and Runnegar, B., 1987, Soft-sediment paleomagnetic field tests of late Precambrianglaciogenic sediments [abs.]: Eos (Transactions, Ameri-can Geophysical Union), v. 68, p. 1251.
Thomson, B. P., 1969, Precambrian crystalline basement,inParkin, L. W., ed., Handbook of South Australian geol-ogy: Geological Survey of South Australia, p. 21–48.
Turner, S., Sandiford, M., Flöttmann, T., and Foden, J., 1994,Rb/Sr dating of differentiated cleavage from the upperAdelaidean metasediments at Hallett Cove, southern Ade-laide fold belt: Journal of Structural Geology, v. 16,p. 1233–1241.
Van der Voo, R., 1990, The reliability of paleomagnetic data:Tectonophysics, v. 184, p. 1–9.
Veevers, J. J., ed., 1984, The Phanerozoic Earth history of Aus-tralia: Oxford, United Kingdom, Clarendon Press, 418 p.
Vorren, T. O., Hald, M., Edvardsen, M., and Lind-Hansen,
O. D., 1983, Glacigenic sediments and sedimentary envi-ronments on continental shelves: General principles witha case study from the Norwegian shelf,in Ehlers, J., ed.,Glacial deposits in north-west Europe: Rotterdam,A.A. Balkema, p. 61–73.
Washington, W. M., 1992, Climate-model responses to in-creased CO2 and other greenhouse gases,in Trenberth,K. E., ed., Climate system modeling: Cambridge, UnitedKingdom, Cambridge University Press, p. 643–668.
Wellman, P., and Greenhalgh, S. A., 1988, Flinders/MountLofty Ranges, South Australia: Their uplift, erosion, andrelationship to crustal structure: Royal Society of SouthAustralia Transactions, v. 112, p. 11–19.
Williams, G. E., 1979, Sedimentology, stable isotope geo-chemistry and paleoenvironment of dolostones cappingLate Precambrian glacial sequences in Australia: Geolog-ical Society of Australia Journal, v. 26, p. 377–386.
Williams, G. E., 1996, Soft-sediment deformation structuresfrom the Marinoan glacial succession, Adelaide foldbelt;implications for the palaeolatitude of late Neoproterozoicglaciation: Sedimentary Geology, v. 106, p. 165–175.
Williams, G. E., and Schmidt, P. W., 1997, Paleomagnetism ofthe Paleoproterozoic Gowganda and Lorrain formations,Ontario: Low paleolatitude for Huronian glaciation: Earthand Planetary Science Letters, v. 153, p. 157–169.
Williams, G. E., and Tonkin, D. G., 1985, Periglacial structuresand palaeoclimatic significance of a late Precambrian
block field in the Cattle Grid copper mine, Mount Gun-son, South Australia: Australian Journal of Earth Sci-ences, v. 32, p. 287–300.
Xiao, S., Zhang,Y., and Knoll,A. H., 1998, Three-dimensionalpreservation of algae and animal embryos in a Neopro-terozoic phosphorite: Nature, v. 391, p. 553–558.
Young, G. M., 1992, Late Proterozoic stratigraphy and theCanada-Australia connection: Geology, v. 20, p. 215–218.
Young, G. M., 1993, Impacts, tillites, and the breakup of Gond-wanaland: A discussion: Journal of Geology, v. 101,p. 675–679.
Zhang, H., and Zhang, W., 1985, Paleomagnetic data, late Pre-cambrian magnetostratigraphy and tectonic evolution ofeastern China: Precambrian Research, v. 29, p. 65–75.
Zhang Qi Rui, 1994, Environmental evolution during the earlyphase of Late Proterozoic glaciation, Hunan, China,inDeynoux, M., Miller, J. M. G., Domack, E. W., Eyles, N.,Fairchild, I. J., and Young, G. M., eds., Earth’s glacialrecord: Cambridge, United Kingdom, Cambridge Uni-versity Press, p. 260–266.
MANUSCRIPTRECEIVED BY THESOCIETYAPRIL 20, 1998REVISEDMANUSCRIPTRECEIVEDNOVEMBER5, 1998MANUSCRIPTACCEPTEDNOVEMBER25, 1998LAMONT-DOHERTYEARTH OBSERVATORYCONTRIBUTION 5952
PALEOMAGNETIC POLARITY REVERSALS, MARINOAN GLACIAL DEPOSITS, AUSTRALIA
Geological Society of America Bulletin, August 1999 1139
Printed in U.S.A.