Embed Size (px)
Citation preview
PALEOMAGNETIC EVIDENCE BEARING ON TERTIARY
TECTONICS OF THE TIHAMAT ASIR COASTAL PLAIN,
SOUTHWESTERN SAUDI ARABIA
by
Karl S. Kellogg and H. Richard Blank
U.S. Geological Surve Open-File Report
This report is preliminary and has not been reviewed for conformity with U.S. Geological Survey editorial standards or stratigraphic nomenclature.
Report prepared forMinistry of Petroleum and Mineral Resources
Deputy Ministry for Mineral ResourcesJiddah, Kingdom of Saudi Arabia
1402AH 1982AD
1982

CONTENTS
ABSTRACT............................................... 1INTRODUCTION........................................... 2PALEOMAGNETIC METHOD................................... 7RESULTS ................................................ 8
Demagnetization behavior related tomagnetic stability............................ 13
Opaque minerals.................................... 18A detailed study of one dike's magnetic
properties.................................... 19Comparison of paleomagnetic directions
for normal and reversed dikes................. 24PALEOMAGNETISM AND THE TECTONICS
OF THE TIHAMAT ASIR................................. 25The Jabal at Tirf gabbro and granophyre............ 25The Tihamat Asir dike swarm: orientation
of dike attitudes............................. 27Tectonic implications of paleomagnetic
directions of dikes............................ 30Evidence for magnetic stripes along the
Tihamat Asir.................................. 32CONCLUSIONS............................................ 33REFERENCES CITED....................................... 35
ILLUSTRATIONS
Figure 1. Geologic and sample location map of partof southwestern Saudi Arabia.............. 3
2. Geologic and sample location map of partof the Tihamat Asir....................... 5
3. Equal-area projection of the site meanmagnetic directions of intrusive rocksin the Tihamat Asir....................... 14
4. Graphs showing measured remanent intensity plotted against peak demagnetizing field for representative examples of intrusive rocks in the Tihamat Asir....... 15
5. Equal-area projections of directions of magnetization during alternating-field demagnetization for the samples in figure 4. ................................. 16
6. Sketch of south side of Wadi Damad ofdikes K77, K174, and K175................. 20
Figures 7-10. Equal-area projections of:
7. The directions of magnetization after successive stages of alternating-field and thermal demagnetization for samples from dike K77................... 21
8. Mean directions for 12 reverselymagnetized dikes and 11 normally magnetized dikes................ 26
9. The directions of magnetization for three localities in the Jabal at Tirf gabbro, showing both uncorrected and corrected directions..................... 26
10. The directions of magnetization of the Jabal at Tirf gabbro and the Tihamat Asir dikes, both before and after a rota tion that corresponds to restoring the mean dip of each dikes to vertical.......... 28
11. Histogram of the dips of 31 dikes inthe Tihamat Asir dike swarm........... 31
TABLES
Table 1. Summary of paleomagnetic data fromlocalities in the Tihamat Asir............. 9
2. Attitudes of dikes in the Tihamat Asir....... 29
11
PALEOMAGNETIC EVIDENCE BEARING ON TERTIARY
TECTONICS OF THE TIHAMAT ASIR COASTAL PLAIN,
SOUTHWESTERN SAUDI ARABIA
by
Karl S. Kellogg and H. Richard Blank U.S. Geological Survey
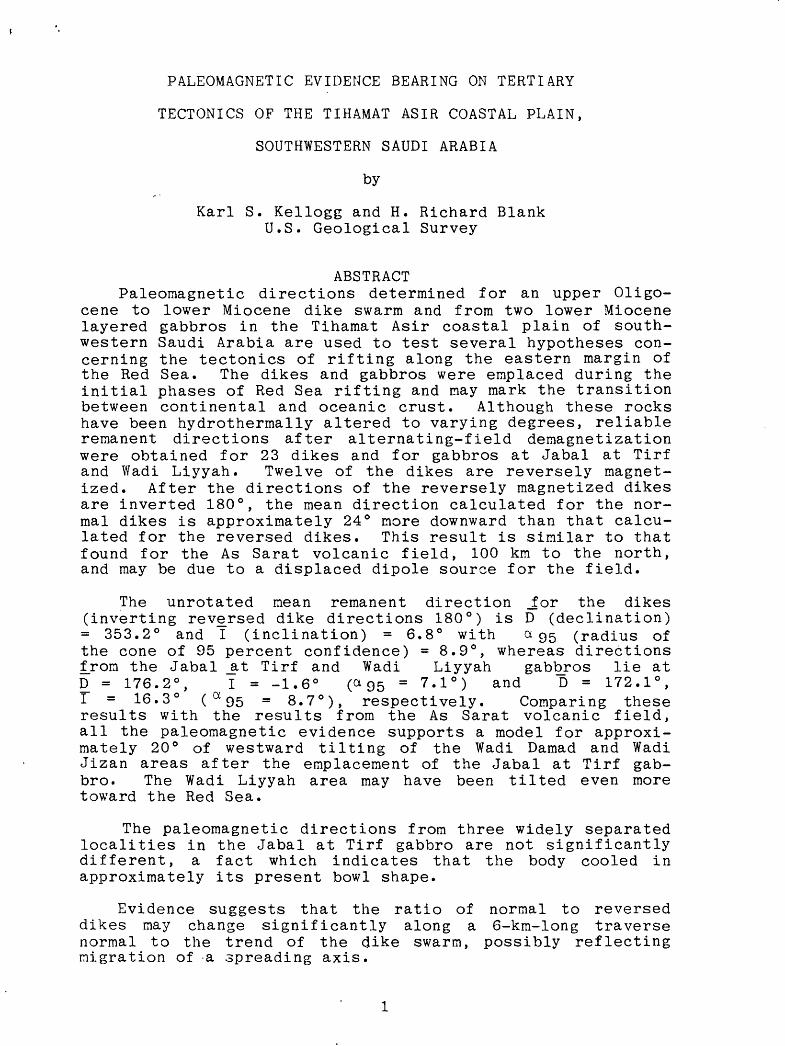
ABSTRACTPaleomagnetic directions determined for an upper Oligo-
cene to lower Miocene dike swarm and from two lower Miocene layered gabbros in the Tihamat Asir coastal plain of south western Saudi Arabia are used to test several hypotheses con cerning the tectonics of rifting along the eastern margin of the Red Sea. The dikes and gabbros were emplaced during the initial phases of Red Sea rifting and may mark the transition between continental and oceanic crust. Although these rocks have been hydrothermally altered to varying degrees, reliable remanent directions after alternating-field demagnetization were obtained for 23 dikes and for gabbros at Jabal at Tirf and Wadi Liyyah. Twelve of the dikes are reversely magnet ized. After the directions of the reversely magnetized dikes are inverted 180°, the mean direction calculated for the nor mal dikes is approximately 24° more downward than that calcu lated for the reversed dikes. This result is similar to that found for the As Sarat volcanic field, 100 km to the north, and may be due to a displaced dipole source for the field.
The unrotated mean remanent direction _for the dikes (inverting reversed dike directions 180°) is D (declination) = 353.2° and I (inclination) = 6.8° with ex 95 (radius of the cone of 95 percent confidence) = 8.9°, whereas directions f_rom the Jabal _at Tirf and Wadi Liyyah gabbros lie at D = 176.2°, I = -1.6° (ag5 = 7.1°) and D = 172.1°, I = 16.3° ( a 95 = 8.7°), respectively. Comparing these results with the results from the As Sarat volcanic field, all the paleomagnetic evidence supports a model for approxi mately 20° of westward tilting of the Wadi Damad and Wadi Jizan areas after the emplacement of the Jabal at Tirf gab- bro. The Wadi Liyyah area may have been tilted even more toward the Red Sea.
The paleomagnetic directions from three widely separated localities in the Jabal at Tirf gabbro are not significantly different, a fact which indicates that the body cooled in approximately its present bowl shape.
Evidence suggests that the ratio of normal to reversed dikes may change significantly along a 6-km-long traverse normal to the trend of the dike swarm, possibly reflecting migration of -a spreading axis.
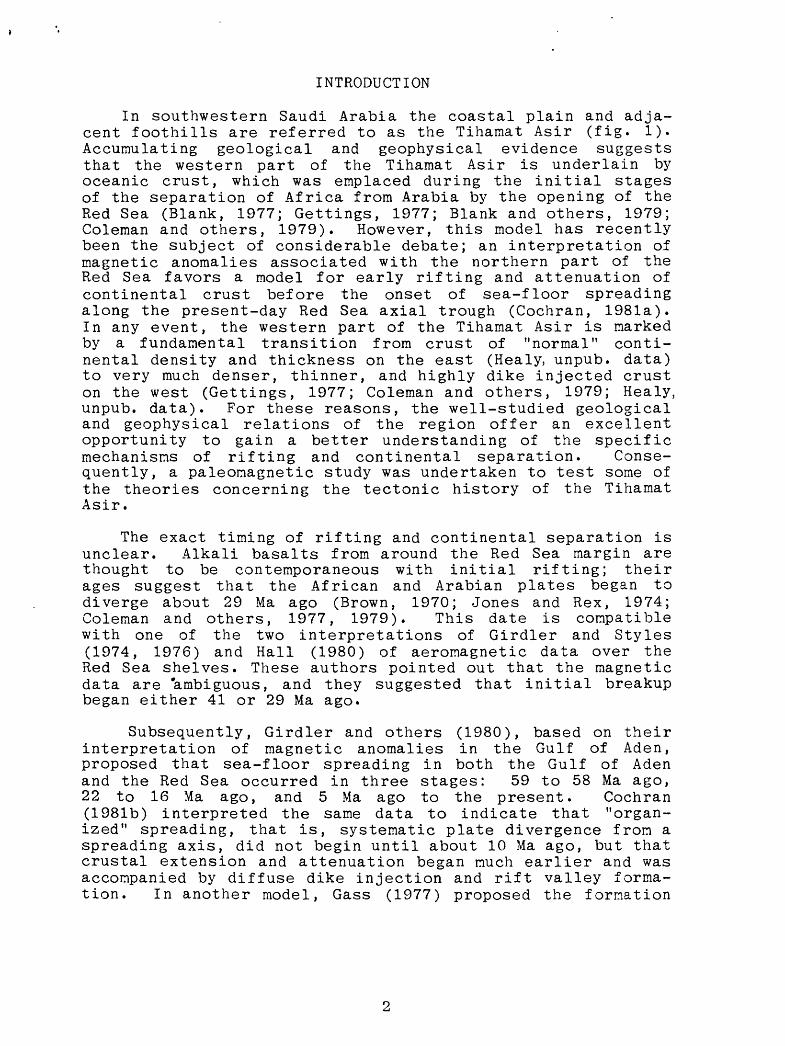
INTRODUCTION
In southwestern Saudi Arabia the coastal plain and adja cent foothills are referred to as the Tihamat Asir (fig. 1). Accumulating geological and geophysical evidence suggests that the western part of the Tihamat Asir is underlain by oceanic crust, which was emplaced during the initial stages of the separation of Africa from Arabia by the opening of the Red Sea (Blank, 1977; Gettings, 1977; Blank and others, 1979; Coleman and others, 1979). However, this model has recently been the subject of considerable debate; an interpretation of magnetic anomalies associated with the northern part of the Red Sea favors a model for early rifting and attenuation of continental crust before the onset of sea-floor spreading along the present-day Red Sea axial trough (Cochran, 1981a). In any event, the western part of the Tihamat Asir is marked by a fundamental transition from crust of "normal" conti nental density and thickness on the east (Healy, unpub. data) to very much denser, thinner, and highly dike injected crust on the west (Gettings, 1977; Coleman and others, 1979; Healy, unpub. data). For these reasons, the well-studied geological and geophysical relations of the region offer an excellent opportunity to gain a better understanding of the specific mechanisms of rifting and continental separation. Conse quently, a paleomagnetic study was undertaken to test some of the theories concerning the tectonic history of the Tihamat Asir.
The exact timing of rifting and continental separation is unclear. Alkali basalts from around the Red Sea margin are thought to be contemporaneous with initial rifting; their ages suggest that the African and Arabian plates began to diverge about 29 Ma ago (Brown, 1970; Jones and Rex, 1974; Coleman and others, 1977, 1979). This date is compatible with one of the two interpretations of Girdler and Styles (1974, 1976) and Hall (1980) of aeromagnetic data over the Red Sea shelves. These authors pointed out that the magnetic data are "ambiguous, and they suggested that initial breakup began either 41 or 29 Ma ago.
Subsequently, Girdler and others (1980), based on their interpretation of magnetic anomalies in the Gulf of Aden, proposed that sea-floor spreading in both the Gulf of Aden and the Red Sea occurred in three stages: 59 to 58 Ma ago, 22 to 16 Ma ago, and 5 Ma ago to the present. Cochran (1981b) interpreted the same data to indicate that "organ ized" spreading, that is, systematic plate divergence from a spreading axis, did not begin until about 10 Ma ago, but that crustal extension and attenuation began much earlier and was accompanied by diffuse dike injection and rift valley forma tion. In another model, Gass (1977) proposed the formation

42°00' 43°00' 43e30'
18 0.OV- - 18W
EXPLANATIONMiocene to Hoiocenr coasl»l-plam sedimentsAlkali-oiivine basalt. 5 Ma to preteritGrancpnyreLayered piDiabase dike swarm and individual diabase dikesAlfcali-oiiviiie basalt. 7^-24 m.\ oldUndifferentialed Cambrian-Ordovician and
Jurassic sedimentary rocks Late Prpterozoic granitic and metamorphic rocks
^0 - Tb \
r ^ volcanic/ <
field A Fault, dashed where inferredK34 I'aieomapnctic sampling locality
,_, Strip of paleomigneuc sampling locabties
Jabal \MPs abu Hassan
Tig K34
Masliyah oabbro
Jabal T atTirf
OTv
TlgPWadi Liyyah
oabbroARABIAN PENINSULA
10 20 30km
- IT'-OCX
42°00' 43°QO'
Figure 1. Geologic and sample location map of part of southwestern Saudi Arabia. .
of a Red Sea linear depression in the late Oligocene to early Miocene (29 to 24 Ma ago), with intermittent, slow sea-floor spreading occurring from that time until the present.
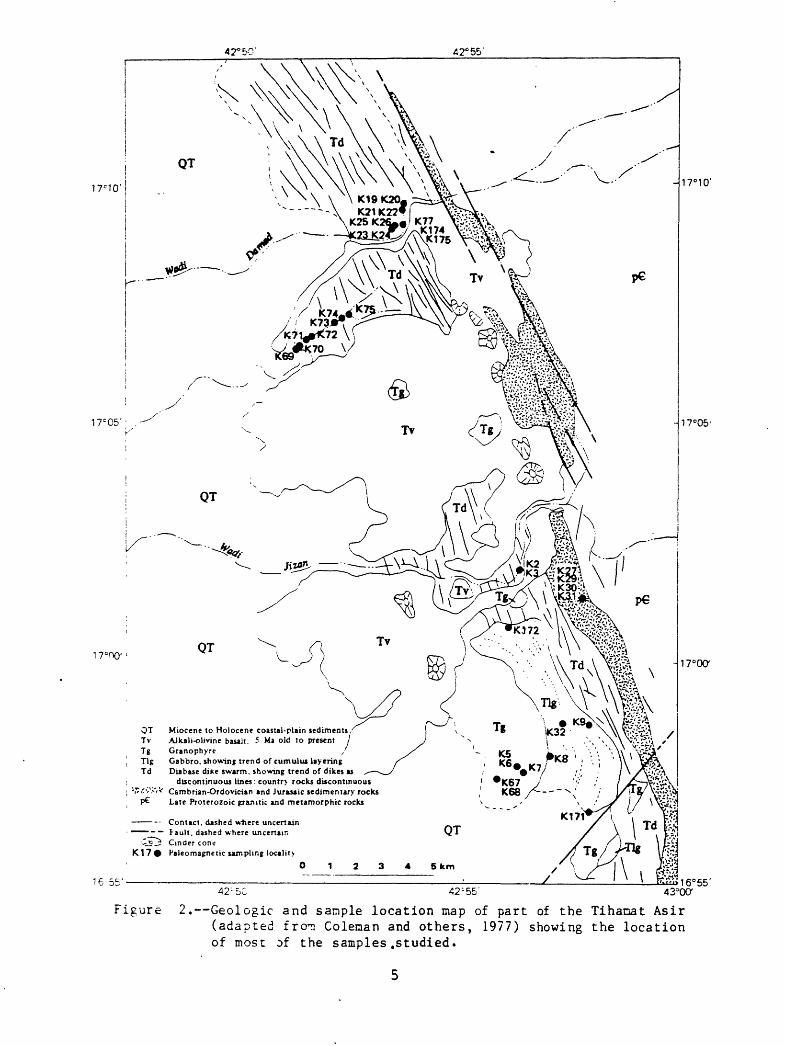
Detailed 1:100,000-scale geologic mapping of the southern Tihamat Asir has been carried out by Fairer (in press) north of lat 17° N. and by Blank and Gettings (unpublished data) south of lat 17° N. These studies indicate that the western most exposed continental crustal rocks, at the eastern edge of the Tihamat Asir, are composed of late Proterozoic grani tic and metamorphic rocks that are unconformably overlain by Cambrian-Ordovician Wajid Sandstone and Jurassic sandstone and limestone of the Khums Formation (figs. 1 and 2).
Deformation of Paleozoic and Mesozoic sedimentary rocks, which demonstrably preceded dike injection, suggests that continental separation was preceeded by downwarping and faulting parallel to the present Red Sea axis. Attenuation of continental crust by gradual extension was concommitant with development of rift structures. Downwarping was fol lowed by the deposition of andesitic to rhyolitic water-laid tuffs and pillow lavas. Thus, the present-day Red Sea depression was a locus of sedimentation and probable marine transgression prior to sea-floor spreading. Geological evidence elsewhere along the Red Sea margins supports this interpretation (Gass, 1977)
Generation of new mafic crust in the floor of the rift probably began with the emplacement of an extensive dike swarm along the axis of previous volcanism (Coleman and others, 1979). The dikes in this swarm are of two distinct types: fine-grained diabase dikes and subordinate rhyolite dikes. Immediately west of and adjacent to the continental- type rocks in the Tihamat Asir, the dikes are very closely spaced, and, although parallel, they complexly crosscut each other and locally become a true "sheeted-dike" complex, as seen in ophiolite zones in other parts of the world (Coleman and others, 1979).
Although the dike complex described by Coleman and others (1979) can be traced no farther north than the Ad Darb fault (fig. 1), isolated Tertiary dikes that strike parallel with the Red Sea axis intrude Arabian Shield rocks and are found as much as 35 km east of the main Tihamat Asir dike swarm (Blank, 1977), such as at Jabal abu Hassan (fig. ! ) Most of these dikes are diabasic. Farther north along the Red Sea coastal plain in the Harrat Tuffil quadrangle (J. Pallister, written commun., 1981), a locally sheeted dike complex is exposed in a transition area between shield-type rocks and possibly new oceanic crust.
Extensive east-dipping faults that strike roughly paral lel with the Red Sea axis in the Tihamat Asir region have
42°60' 42° 55'
17=10
17 C C5'
16-55'
QT
QT Miocene to Holocene coastal-plain sediments,TV AJkati-olivine basait. 5 Ma olc to present /Tg Granophyre /Tig Gabbro, showing trend of cumulus layeringTd Diabase dike swarm, showing trend of dikes u
discontinuous lines: countr> rocks discontinuous ?,?'/.«* !c Cambrian-Ordovjcian and Jurassic sedimentary rocks p Late Proterozoic granitic and metamorphic rocks
Contact, dashed where uncertain - Fault, dashed where uncertainij?3 Cinder cone
C170 Paleomapnctic sampling localitv
5km
42 : 5 42^55'
Figure 2. Geologic and sample location map of part of the Tihanat Asir (adapted fro^n Colenian and others, 1977) showing the location of most of the samples^studied.
produced complex imbricate slices. Dikes commonly were in truded along these fault planes, a fact which suggests that faulting and dike emplacement were at least in part contempo raneous. These dike-intruded faults have produced numerous repetitions of the Wajid Sandstone and Khums Formation, both of which locally dip from approximately 50° to 60° SW.
During the final stages of dike emplacement in the Tiha- mat Asir, diapiric gabbroid plutons were emplaced along the axis of dike injection. These plutons are as much as 8 km in diameter and in many places are rythmically layered. Coleman and others (1979) suggested that prominent cumulus layering in one of these plutons, the Jabal at Tirf gabbro, was ini tially almost horizontal and that subsequent warping produced the bowl-shaped configuration now observed.
The gabbros at Masliyah and Jabal at Tirf are intruded by granophyre stocks, which Coleman and others (1979) judged to be derived chiefly by differentiation of deep basaltic magma or from partial melting of the lower crust rather than by in situ differentiation of the source magma that gave rise to the gabbro. Dike injection had almost ceased by the tine the gabbro and granophyre intruded; only a few small, near- vertical, relatively unaltered mafic dikes transect these stocks.
The fact that most dikes of the pre-gabbro dike swarm dip steeply to the east suggests that westward (seaward) tilting of the region continued after most dikes were emplaced. Prior to this study, it was not known if the gabbros had also been tilted; the few dikes that cut the gabbro and granophyre are almost vertical.
The dikes, and to a lesser extent the gabbros, have un dergone low-temperature hydrothermal alteration (Taylor and Coleman, 1977; Coleman and others, 1979), which has produced effects similar to regional greenschist metamorphism. The greenish 'color of most dikes reflects the development of secondary chlorite and epidote. Feldspar albitization and zeolite growth have also occurred. All these alteration effects make it very difficult or impossible to obtain reli able radiometric ages for the dikes.
The ages of the gabbro and granophyre at Jabal at Tirf are identical within experimental limits: about 24 to 20 Ma old (Coleman and others, 1979). Only a few dikes are younger than the gabbro; therefore, this age span probably represents the termination of dike intrusion in the region.
Rocks of the dike complex are locally overlain by inter- layered fluvial and deltaic sedimentary rocks and basalt flow rocks assigned to the Baid formation (Gillman, 1968). Potassium-argon (K-Ar) dating of basalts of the Baid
Formation from the northern part of the Tihamat Asir has yielded ages of from 19 to 18 Ma. The Baid formation generally tilts 15° to 20° SW.
A paleomagnetic study of the Tertiary dikes and plutons of the Tihamat Asir was encouraged by two recent develop ments: first, the establishment of a modern paleomagnetic laboratory at the U.S. Geological Survey Saudi Arabian Mis sion, and second, the determination of a reliable paleomag netic pole from the 29-to 24-Ma-old As Sarat volcanic field of the eastern Asir (fig. !.) This pole lies at lat 79° N., long 248° E., with a 95 (the angular radius of the cone of 95 percent confidence) = 4.3° (Kellogg and Reynolds, 1981).
The following questions were addressed in our investi gation: 1) Are there regional differences between dike paleo magnetic mean directions that are related to differential rotation? 2) Are there significant regional differences in the ratio of normally magnetized dikes to reversely magnet ized dikes, possibly reflecting different periods of dike injection? 3) Can we determine any differences related to ongoing rotation during dike emplacement by comparing the paleomagnetic directions of dikes that dip at shallow angles to the east to those of dikes that are vertically emplaced? 4) Can the hypothesis (Coleman and others, 1979) that the layered gabbros were originally emplaced with near-horizontal flow layering be tested with paleomagnetic methods? 5) To what extent has hydrothermal alteration reset the paleo magnetic directions?
PALEOMAGNETIC METHOD
A total of 215 oriented samples was collected from 3 of the gabbro plutons (Masliyah, Jabal at Tirf, and Wadi Liyyah), the Jabal at Tirf granophyre, 33 dikes, and 4 lava flows of the Baid formation (fig. 1, 2). Samples were drilled at only two localities (K2 and K77, fig. 2). At all other sites block samples were collected with magnetic com pass and hand level. At least three and usually four samples were collected at each locality. Backsighting on outcrops was performed to check for local magnetic variation; as much as 20° variation was noted at some of the granophyre locali ties and reflects the high magnetite content of this rock type. Samples were separated from each other by a distance of at least 1 m at all localities except K77, where a de tailed measurement of magnetic properties across a dike was undertaken. In the Jabal at Tirf gabbro, 27 samples were collected at five localities in order that a test for internal deformation after cooling could be made.
In the laboratory, one core per block, 2.5 cm in diam eter, was cut using a leveling jig and water-cooled diamond
bit mounted in a drill press. Cores were cut to 2.5-cm lengths. Remanent directions and magnetization intensities were measured on a 15-Hz spinner magnetometer.
After the natural remanent magnetization (NRM) was mea sured, alternating-field (a.f.) demagnetization about three mutually perpendicular axes was routinely performed on all samples at 100 oersted (Oe), 200 Oe, and 400 Oe peak fields. In many cases, when it was felt that higher fields might im prove remanent directions, cleaning at 600 Oe, 800 Oe, and 1,000 Oe (the limit of our a.f. demagnetizer) was also per formed. In addition, selected samples were thermally demag netized to 500°C after a.f. cleaning to see if further im provement in directions could be obtained. This latter treatment proved difficult in some cases because about 20 percent of all heated samples either exploded or decrepitated in the heating chamber, a behavior that reflects the hydrated nature of these rocks.
Our criteria for geologic units to be considered "accept able" for use in tectonic reconstructions are that the number of samples from the unit (N) must be greater than two and that the mean direction of magnetization must be defined, at some cleaning level, with an a 95 of less than 15°. Demag netization is always continued until the dispersion in sample directions increases. "Stable" samples are generally defined as those that resist changing their directions of magnetiza tion upon a.f. demagnetization; however, these stable samples may not necessarily be members of an acceptable assemblage of directions.
Polished sections of samples from all three sampled gab- bro bodies, the granophyre at Jabal at Tirf, and nine of the dikes were examined under reflected light to determine if there were any unifying mineralogical characteristics govern ing stability of magnetization. These samples were preparedfrom rocks that displayed a range of magnetic stabilities.
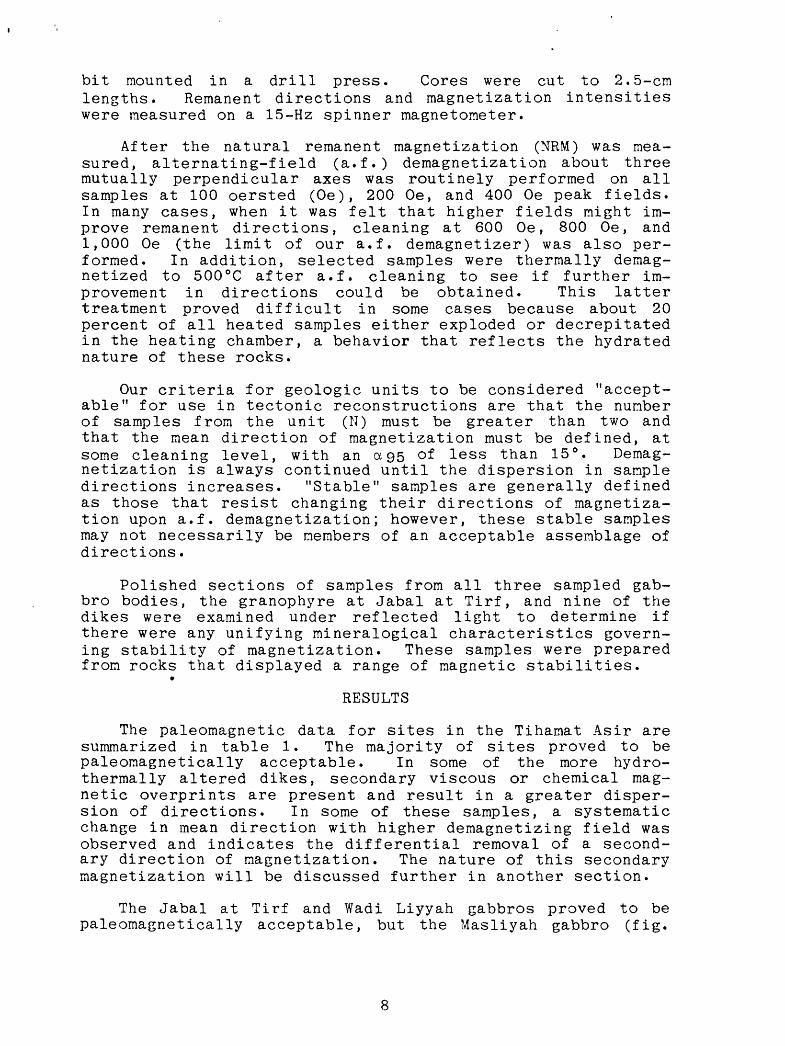
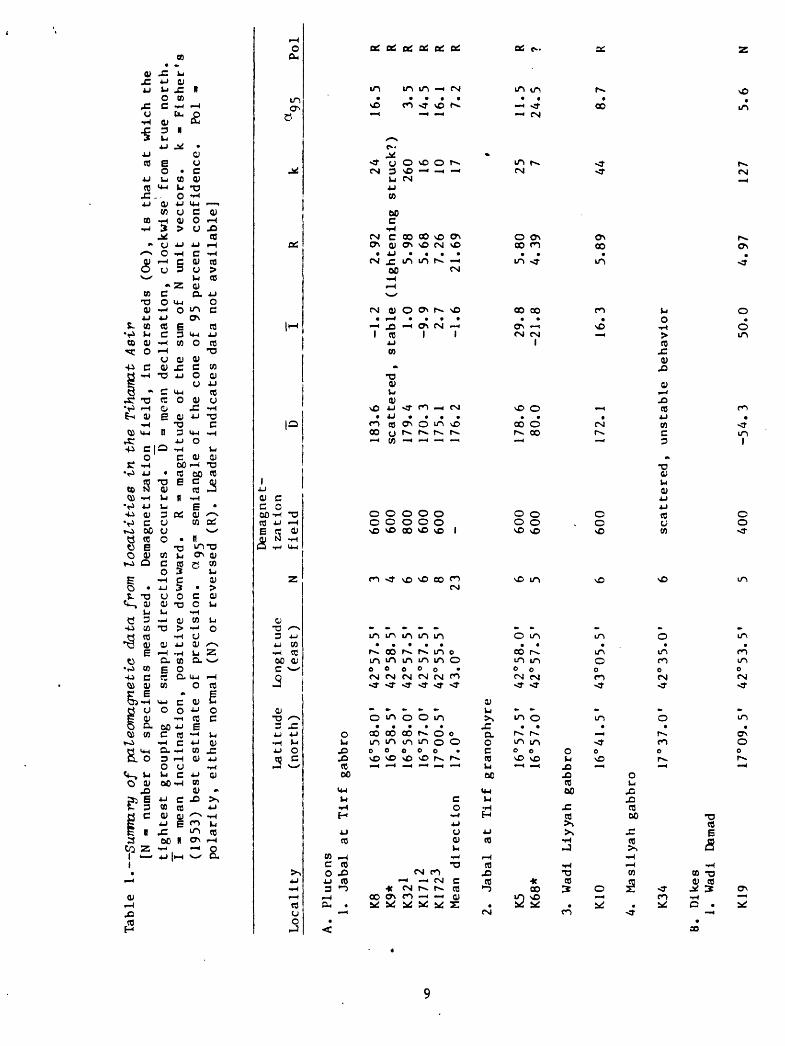
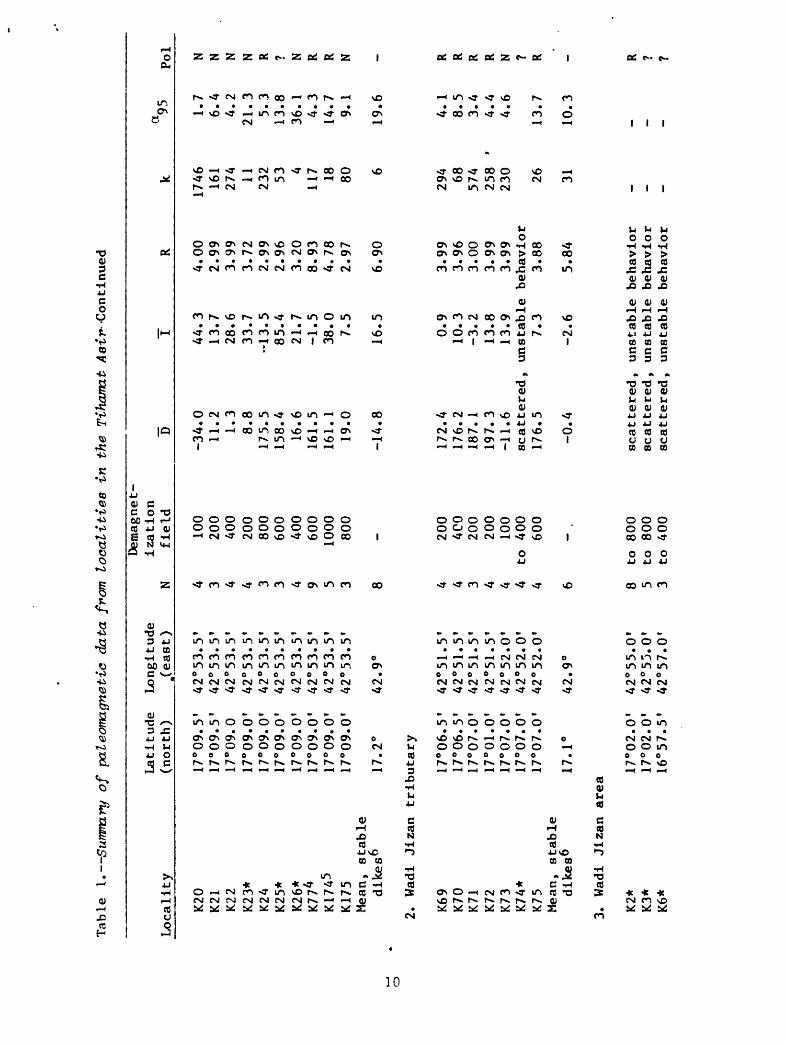
RESULTS
The paleomagnetic data for sites in the Tihamat Asir are summarized in table 1. The majority of sites proved to be paleomagnetically acceptable. In some of the more hydro- thermally altered dikes, secondary viscous or chemical mag netic overprints are present and result in a greater disper sion of directions. In some of these samples, a systematic change in mean direction with higher demagnetizing field was observed and indicates the differential removal of a second ary direction of magnetization. The nature of this secondary magnetization will be discussed further in another section.
The Jabal at Tirf and Wadi Liyyah gabbros proved to be paleomagnetically acceptable, but the Masliyah gabbro (fig.
8
Tab
le 1
. Su
mm
ry of
pale
om
ag
net
ic
da
ta f
rom
lo
cali
ties
in t
he
Tih
amat
Aei
r[N
»
num
ber
of
spec
imen
s m
easu
red.
Der
aagnet
izat
iojn
fi
eld
, in
o
ers
ted
s (O
e),
is
that
at
whi
ch
the
tighte
st
gro
upin
g
of
sam
ple
dir
ecti
ons
occurr
ed.
D «
mea
n decli
nati
on,
clock
wis
e fr
om
true
nort
h.
I »
mea
n in
cli
nati
on,
posi
tive
dow
nwar
d.
R »
mag
nit
ude
of
the
sum
of
N u
nit
vecto
rs.
k
Fis
her'
s (1
953)
best
est
imate
of
pre
cis
ion.
CLys
**
sem
iangle
of
the
cone
of
95 p
erc
en
t confi
dence.
Pol
«
pola
rity
, eit
her
norm
al
(N)
or
rev
ers
ed
(R
).
Lea
der
in
dic
ate
s d
ata
n
ot
avail
able
]
Loca
lity
Lat
itu
de
(nort
h)
Longit
ude
(east
)N
Dem
agne
tiz
ati
on
field
DI
Rk
a95
P
ol
A.
Plu
ton
s1.
Ja
bal
at
Tir
f gab
bro
K8 K9*
K
321
K17
12
K17
23
Mea
n d
irecti
on
2.
Jab
al
at
Tir
f
K5
K68
*
16°5
8.0
' 4
2°5
7.
16°5
8. 5
1 4
2°5
8.
16
°58
.0'
42
°57
. 16°5
7.0
' 42°5
7.
17°0
0.5
' 42°5
5.
17.0
° 43.0
°
gra
nophyre
16
°57
.5'
42°5
8.
16°5
7.0
' 42°5
7.
5'
51
5'
5f
5'
O1
5'
3.
Wad
i L
iyy
ah
gab
bro
K10
16°4
1.5
' 43°0
5.5
4.
Mas
liy
ah
gab
bro
K34
1
7°3
7.0
' 42°3
5.0
B.
Dik
es1.
W
adi
Dam
ad
3 4 6 6 8 23
600
600
80
0600
600
600
600
600
18
3.6
scatt
ere
d1
79
.4170.3
175.
1176.2
178.6
80.0
172.
1
-1.2
2
.92
24
st
able
(l
ighte
nin
g
stru
ck?)
1.0
5
.98
26
0-9
.9
5.6
8
16
2.7
7.2
6
10-1
.6
21.6
9
17
29
.8
-21.
8
16.3
scat
tere
d, un
stab
le behavior
5.80
4.39
5.89
25 7
44
16.5 3.5
14.5
16.
17.
2
11.5
24.5 8.7
K19
17°09.5'
42°5
3.5'
400
-54.3
50.0
4.97
127
5.6
Tab
le 1
. Su
mm
ary
of
pale
om
ag
net
ic data
fro
m lo
ca
liti
es
in th
e T
iham
at A
eir*
-Con
tinu
ed
Locali
ty
K20
K21 K22
K23
*K
24K
25*
K26
*
K17
45K
175
Mea
n,
stable
dik
es6
2.
Wad
i Ji
zan
K69
K70
K71
K72
K73
K74
*K
75M
ean,
st
able
dik
es6
3.
Wad
i Ji
zan
K2*
K
3*
K6*
Lati
tude
(no
rth
)
17°0
9.17
°09.
17°0
9.17
°09.
17°0
9.17
°09.
17°0
9.17
°09.
17
°09.
17°0
9.
17
.2°
trib
uta
ry
17
°06
.17
°06.
17°0
7.17
°01.
17°0
7.17
°07.
17°0
7.
17.1
°
area
17°0
2.
17°0
2.
16
°57
.
5f
51
0 Of
0'
0'
0'
0'
0'
0'
5'
5'
0'
Of
0'
Of
0'
0'
0'
5'
Longit
ude
.(east
)
42°5
3.5
'4
2°5
3.5
'4
2°5
3.5
'42°5
3.5
'42°5
3.5
'42°5
3.5
'42°5
3.5
'42°5
3.5
' 4
2°5
3.5
'4
2°5
3.5
'
42.9
°
42
°51
.5f
42
°51
.5'
42°5
1.5
f42°5
1.5
f42°5
2.0
f42°5
2.0
'42°5
2.0
'
42.9
°
42°5
5.0
f 4
2°5
5.0
' 42°5
7.0
'
N 4 3 4 4 3 3 4 9 5 3 8 4 4 3 4 4 4 4 6 8 5 3
Dem
agne
t
izati
on
fi
eld
100
200
400
200
800
600
400
600
1000
800
- 200
4CO
200
200
100
to
400
600
to
800
to
800
to
400
D
-34.0
11.2
1.3
8.8
17
5.5
15
8.4
16.6
161.
5 1
61
.11
9.0
-14.8
172.
41
76
.218
7.1
19
7.3
-11.6
scatt
ere
d,
17
6.5
-0.4
scatt
ere
d,
scatt
ere
d ,
scatt
ere
d,
I
44.3
13.7
28.6
33.7
-13.5
85.4
21.7
-1.5
38.0
7.5
16
.5
0.9
10.3
-3.2
13
.813.9
unst
able
7.3
-2.6
unst
able
unst
able
unst
able
R
4.0
02.9
93.9
93
.72
2.9
92.9
63.2
08.9
3
4.7
82.9
7
6.9
0
3.9
93
.96
3.0
03.9
93
.99
beh
avio
r3.8
8
5.8
4
beh
avio
r beh
avio
r b
ehav
ior
k
1746 161
274 11 232 534
117 18 80 6
294 68
574
258
'23
0 26 31
-
a95 1.7
6.4
4.2
21.3
5.3
13.8
36
.14.3
1
4.7
9.1
19
.6
4.1
8.5
3.4
4.4
4.6
13.7
10
.3
-
Pol
N N N N R 7 N R R N - R R R R N ? R - R 7
Tab
le 1
. Su
mnu
ry of
pa
leo
ma
gn
etic
d
ata
fro
m lo
ca
liti
es
in
the
Tiha
rnat
/I
sir-
Conti
nued
Locali
ty
K7 K27
K29
K30
K31
Mea
n,
stable
di
lf.e
s6
A.W
adi
Khu
ms
K13
*.
K14
K15
*K
16K
17K
65M
ean,
st
able
Lati
tude
(no
rth
)
16°5
8.0
'17°0
1.5
'17°0
1.5
'17°0
1.5
'17°0
1.5
'
17.0
°
16
°50
.0f
16°5
0.0
'1
6°5
0.0
'1
6°5
0.0
'16°5
0.0
'16°5
1.5
'
Longit
ude
(east
)
42°5
1.5
'42°5
3.0
»42
°58
.0'
42°5
8.0
'42
°58
.0'
430°
43
°03
.0'
43
°03
.0'
43
°03
.0'
43°0
3.0
f43
°03
.0'
43°0
3.0
'
N 3 6 4 4 3 5 2 5 3 4 3 3
Dem
agne
t
izati
on
field 60
040
020
020
080
0
- 400
600
200
900
400
100
D
171.
7-6
.9-7
. 3
2.0
16
1.3
-7.
3
138.
618
1.2
15
2.3
163.
18.5
7.7
I 15.
1-0
.53
7.5
6.9
-11.6
8.0
-31.6
4.0
22.9
-7.6
-18,9
24.9
R
2.9
95.9
73.
913
.97
2.9
7
4.7
5
1.95
4.9
52.7
03.9
72.9
53.0
0
k 136
157 33 104 60 16 20 777
88 3924
17
a95 6.9
4.6
12.3
6.9
10
.4
15
.8
-7.
131.5
7.5
*13.0
1.4
Pol
R N N R R - R? R R? R N N
dik
es6
16
.8'
43.0
'-0
. 1
2.4
3.7
814
5.
Jab
al
abu
Has
san
K11
5*
17°3
5.5
' 42°5
5.0
'
6.
Mea
n,
all
1
7.0
° 42.9
° d
ikes
6
7.
Mea
n, all
1
7.0
° 42
.9°
no
rmal
dik
es
8.
Mea
n, all
1
7.0
° 42.0
° re
ver
sed
dik
es
8 to 800
23 11 12
scat
tere
d, unstable behavior
-6.6
6.8
20.9
5
-7.
1
173.
9
19.8
9.
55
4.3
11.4
7
11 10 21
18.8 8.9
13.7 8.9
Tab
le 1.
Sum
mar
y o
f p
ale
om
ag
net
ic
da
ta f
rom
lo
cali
ties
in
the
Tih
amat
4
sir-
Co
nti
nu
ed
Loca
lity
Lati
tude
Longitude
(nor
th)
'(ea
st)
Demagnet
izat
ion
N field
Pol
C. Fl
ows
in Ba
ld fo
rmat
ion
K170
K176
K177
K1
78Me
an,
stable
site
s
D.
Mea
n, all
plu
tons
and
dik
es
6
16°3
1.0
' 4
3°0
8.2
'1
6°3
1.0
' 4
3°0
8.2
'1
6°3
l.O
' 4
3°0
8.2
'16°3
1.0
' 4
3°0
8.2
'
16.8
'
17.0
'
43
.0'
42
.9'
6 to
800
8 10
004
60
05
1000
2
26
scatt
ere
d,
un
stab
le
behavio
r1
15
.1
-22
.5
5.6
91
58
.6
-1.6
3
.96
187.8
2
6.1
4.8
0
-7.6
-6.3
-12.6
1.88
4.3
23.69
3 68 20 8 11
28.4 8.5
14.1 8.3
R?
R?
R R
1 Attitude of
cumulus
layering-
310°
, 67
° SW
.2 At
titu
de of
cumulus
layering-
015°
, 52
° W.
3 Attitude of
cu
mulu
s la
yeri
ng-
350°
, 28°
W.
^ Fo
ur sa
mple
s not
included;
see
text
. 5
Also
thermally
demagnetized at
400°C.
" Re
vers
ed directions in
vert
ed 18
0°.
* Not
used in mean pole ca
lcul
atio
ns.
1) gave very scattered and changing directions of magnetiza tion upon progressive a.f. demagnetization, indicating unsta ble (low coercivity) magnetization. The mean directions ob tained from the Jabal at Tirf and Wadi Liyya_h gabbros, both reversely magnetized, are U = 176.2°, I = 1.6° (0^95 = 7.1°) and D = 172.1°, T = 16.3° (ags = 8.7°), respectively. The implications of these directions on the tectonic history of the Tihamat Asir are discussed in the last section.
Two localities in the granophyre body at Jabal at Tirf (K5 and K68) gave widely divergent directions of magnetiza tion; however, one of the localities (K68) produced a rather scattered ("unacceptable") spread of directions (table 1). The magnetic intensity of samples from locality K68 dropped off rapidly and the directions wandered widely with a.f. demagnetization.
Of the 33 sampled dikes, 23 proved to be paleomagneti- cally acceptable. Of these acceptable sites, 11 are normal ly magnetized and 12 are reversed. Figure 3 shows an equal- area projection of the mean directions obtained from all acceptable dikes, the Jabal at Tirf gabbro and granophyre, and the Wadi Liyyah gabbro.
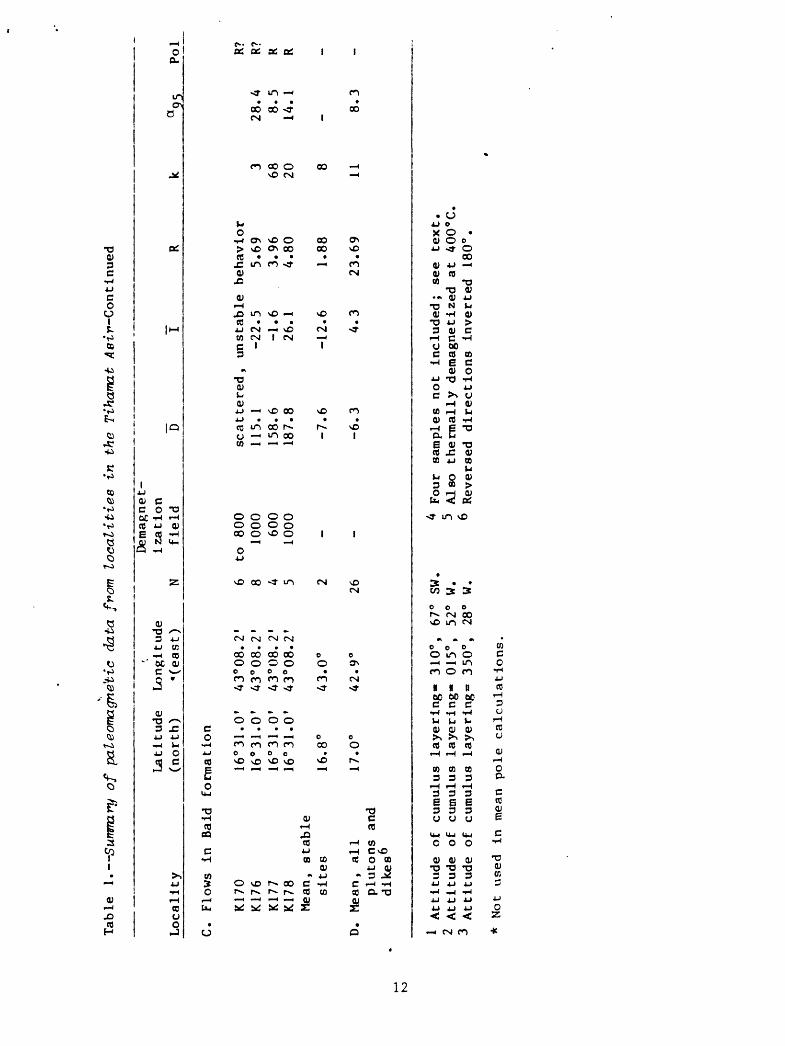
Only two of the four flows sampled in the Baid formation produced acceptable results; both are reversely magnetized. Most samples from the Baid formation are highly oxidized and apparently possess large components of secondary magnetiza tion. Because we do not have enough reliable data for the Baid formation, these directions will be discussed no further.
Demagnetization behavior related to magnetic stability
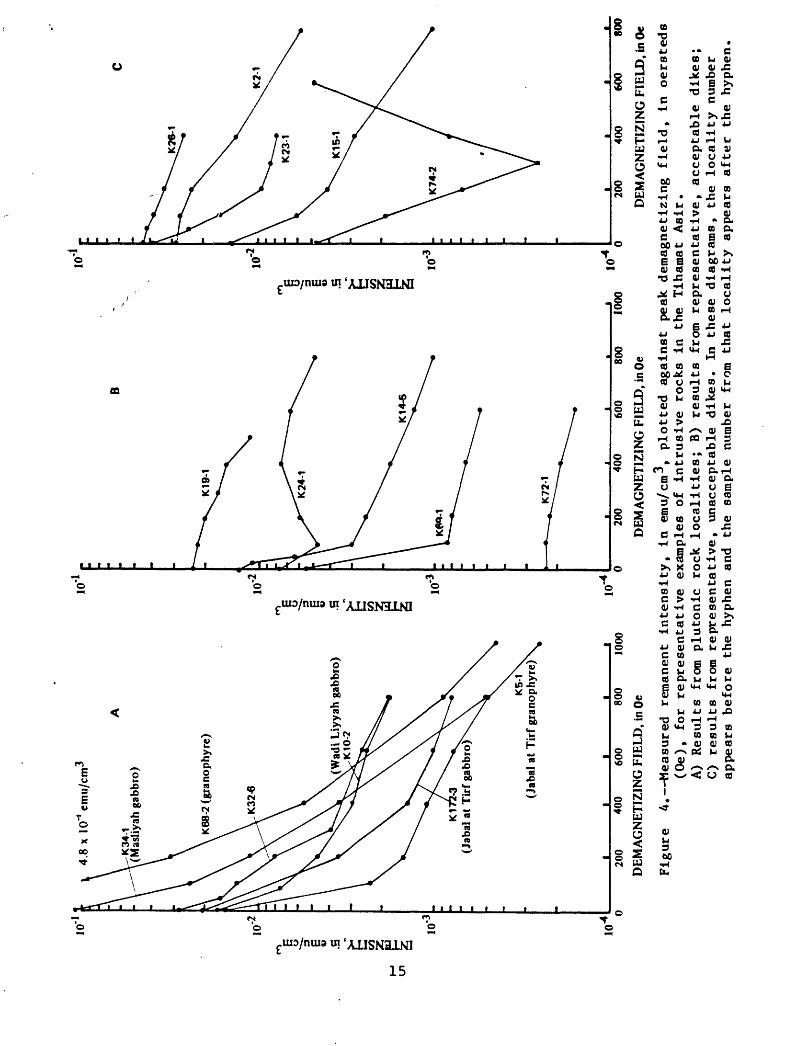
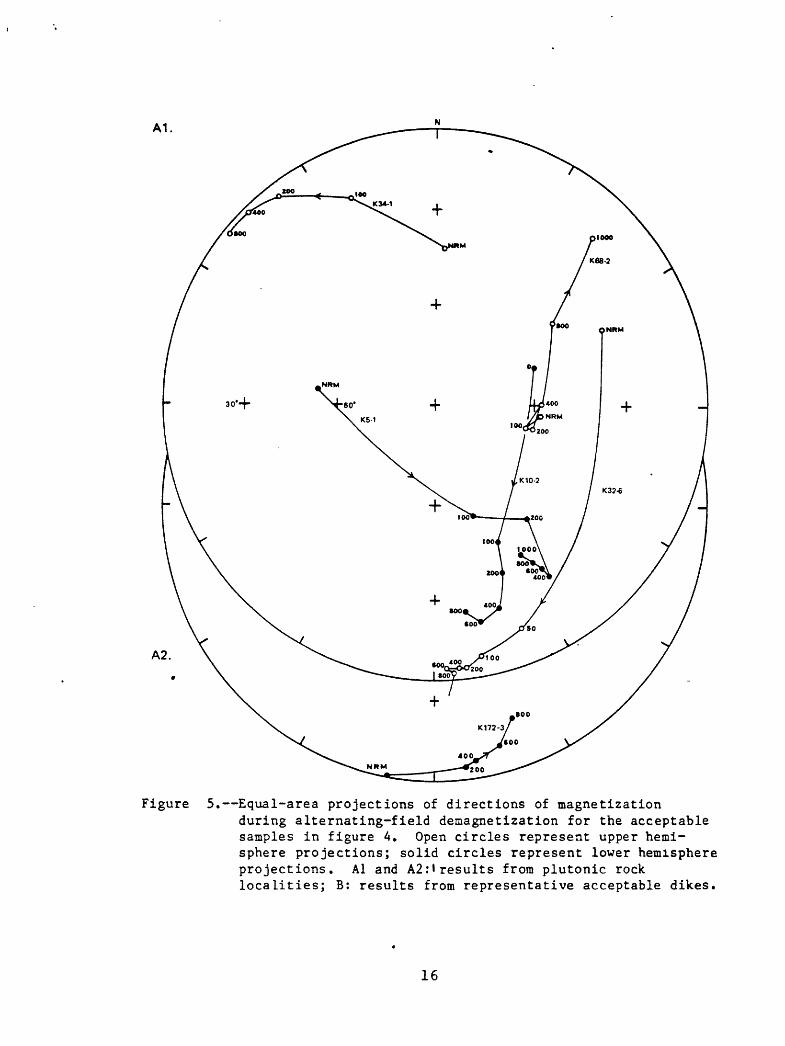
Figure 4 shows some typical examples of the decrease of remanent intensity with increasing demagnetizing field. The first diagram (fig. 4A) shows examples from plutonic rock localities. (In figures 4, 5, and 7, the locality number appears before the hyphen and the sample number from that locality appears after the hyphen.) The slope of the curve appears to be related to the general stability of the sample; those samples that show a sharper decrease of intensity (that is, a lower coercivity spectrum) tend to be more magnetically unstable than those that show a more gradual decrease. For example, a sample in figure 4A from the Masliyah gabbro (K34-1) and another from the Jabal at Tirf granophyre (K68-2) both demonstrate a drop of more than 2 1/2 orders of magni tude in intensity up to 600 Oe demagnetizing field and also have directions that change significantly at each magnetizing step (fig. 5A). In comparison, samples K171-1 and K172-3 from the Jabal at Tirf gabbro and sample K5-1 from an accept able locality in the Jabal at Tirf granophyre show initial
13
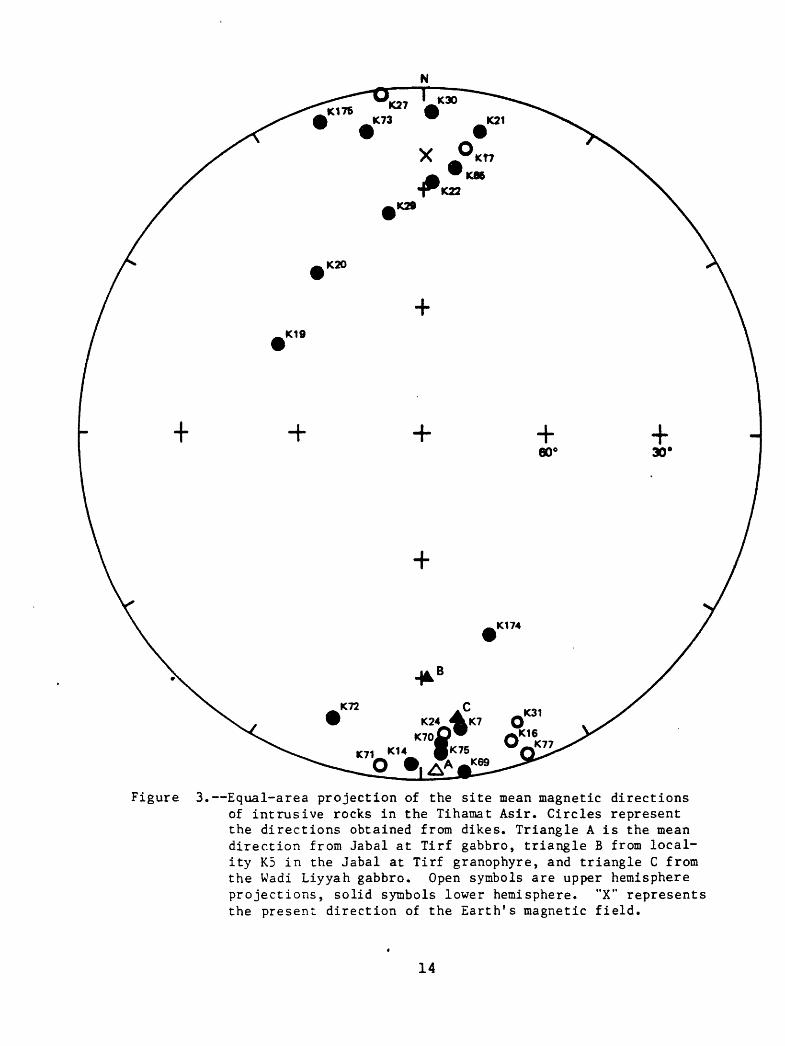
Figure 3. Equal-area projection of the site mean magnetic directions of intrusive rocks in the Tihamat Asir. Circles represent the directions obtained from dikes. Triangle A is the mean direction from Jabal at Tirf gabbro, triangle B from local ity K5 in the Jabal at Tirf granophyre, and triangle C from the Wadi Liyyah gabbro. Open symbols are upper hemisphere projections, solid symbols lower hemisphere. "X" represents the present direction of the Earth's magnetic field.
14
10"
10-2
E u IT 6 V .S CO
10-3
4.8
x 10
"'em
u/cm
3
K34
1 L(
Mas
liyah
gab
bro)
K68
-2 (
gran
ophy
re)
(Wad
i Liy
yah
gabb
ro)
K10
-2
K1
(Jab
al a
t T
irf g
abbr
o}
K5-
1 (J
abal
at
Tir
f gra
noph
yre)
^
200
400
600
800
1000
10-'
200
400
600
800
10,-2
3 6 W .S
10,-3
1000
10'
K26
-1
200
400
600
800
DEM
AG
NET
IZIN
G F
IEL
D, i
n O
c D
EMA
GN
ETIZ
ING
FIE
LD
, in
Oe
DEM
AG
NET
IZIN
G F
IEL
D, i
n O
e
Fig
ure
A
. M
easu
red
re
raan
ent
inte
nsi
ty,
in
emu/
cm-*
, p
lott
ed
a
ga
inst
p
eak
d
emagn
etiz
ing fi
eld
, in
o
erst
eds
(Oe)
, fo
r re
pre
sen
tati
ve
exam
ple
s of
intr
usi
ve
rock
s in
th
e T
iham
at
Asi
r.
A)
Res
ult
s fr
om
plu
ton
ic
rock
lo
cali
ties;
B)
resu
lts
from
rep
rese
nta
tive,
acc
epta
ble
d
ikes
; C
) resu
lts
from
rep
rese
nta
tive,
un
acc
epta
ble
d
ikes.
In
th
ese
dia
gra
ms,
th
e lo
cali
ty
num
ber
ap
pea
rs
bef
ore
th
e h
yph
en
and
the
sam
ple
nu
mbe
r fr
om
that
loca
lity
ap
pea
rs
aft
er
the
hyp
hen
.
A1.
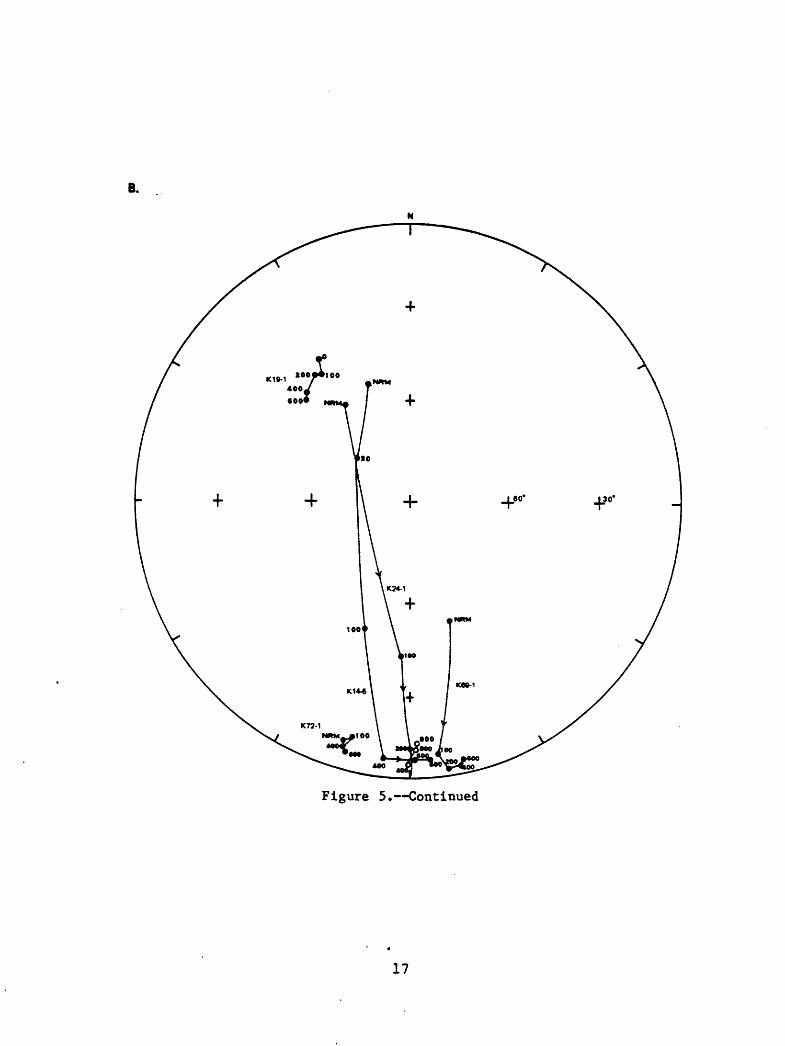
Figure 5. Equal-area projections of directions of magnetizationduring alternating-field demagnetization for the acceptable samples in figure 4. Open circles represent upper hemi sphere projections; solid circles represent lower hemisphere projections. Al and A2:1 results from plutonic rock localities; B: results from representative acceptable dikes.
16
B.
Figure 5. Continued
17
sharp decreases in intensity, coincident with the removal of large, unstable (viscous) components of magnetization gener ally parallel with the present field of the Earth. Above a cleaning field of 400 Oe, the slopes tend to decrease and the directions tend to stabilize. Finally, a stable locality in the gabbro (K32) demonstrates the least extreme decrease of all the plutonic rock localities shown. Sample K32-6 is representative of this locality. After demagnetization to 200 Oe, remanent directions from locality K32 had generally stabilized into a tight cluster and did not significantly change at higher fields.
A different mineralogic mechanism from that of the plu tonic rocks seems to be governing whether a dike is magnet ically acceptable or unacceptable. Figures 4B and 4C show some typical examples of demagnetization of dike samples from acceptable and unacceptable localities, respectively. There appears to be no clear distinction between the shapes of the curves from the acceptable and the unacceptable localities. The decrease in intensity is generally much less than that seen for the plutonic rock localities, a fact that indicates higher coercive forces and that suggests either a higher per centage of hematite relative to magnetite in the samples or the presence of magnetite grains with a small number of domains (Strangway and others, 1968).
Opaque minerals
Selected polished sections of samples from all gabbro localities, the granophyre, and nine of the dikes were exam ined under reflected light to identify the various magnetic phases.
All the gabbro samples are characterized by very large (as much as 3 mm diameter), embayed (partly resorbed) grains of magnetite, many of which have developed lamellae of ilmen- ite parallel with the (111) crystallographic plane. Some low-tempetature (hydrothermal?) alteration of magnetite to a fine-grained intergrowth of hematite and pseudobrookite (?) was observed in all samples. In the case of K34-1, collected from the magnetically unstable Masliyah gabbro, this altera tion is extreme and the remaining magnetite in the cores of a few grains is mostly altered to maghemite. Even the ilmenite lamellae have undergone significant low-temperature oxidation to a fine-grained intergrowth probably consisting of hema tite, rutile, and pseudobrookite.
All dike samples show the effects of low-temperature hydrothermal alteration. The degree of alteration varies from the irregular development of fine-grained hematite along cracks and edges of mostly unaltered magnetite grains to the complete alteration of magnetite grains to hematite-pseudo- brookite intergrowths, which are commonly associated with
18

halos of very fine grained red hematite. The magnetite is commonly altered to maghemite. In most instances this low- temperature alteration is superimposed on a previous high-temperature alteration, which is characterized by the development of ilmenite lamellae parallel with the (111) crystallographic plane in magnetite. This high-temperature alteration probably occurred during initial cooling of the dikes. -Primary pyrite is a common accessory mineral in all dikes.
The fact that the magnetically unacceptable dikes are generally among the most extensively altered suggests that highly coercive secondary components of magnetization were imposed by hydrothermal alteration. In many samples these components could not be removed by a.f. demagnetization. Thermal demagnetization to temperatures of as much as 500°C was performed on both acceptable and unacceptable dikes (localities K7, K16, K17, K26, K31, K70, K73, K75, K77, and K174) after the completion of a.f. demagnetization; only in the case of locality K174 did slight improvement occur. In all other cases, the directions scattered markedly and did not reveal the removal of any consistent secondary direction of magnetization.
A detailed study of one dike's (K77) magnetic properties offers more insight into the nature of this secondary magnetization:
Dike K77 is 6.8 m wide and crops out 100 m downstream from a small hydrologic testing station in Wadi Damad (fig. 2). Figure 6 is a sketch of the outcrop, looking horizon tally to the south. The dike is andesitic and has an ophitic texture; it is visibly chloritized in hand specimen. It strikes N.12°W., dips 80° E., and has well-developed chilled margins extending inward about 1 m from the edges. The dike is bounded on the east by an older dike (locality K174), approximately the same size as dike K77, and on the west by Cambrian-Ordovician Wajid Sandstone. The attitude of bedding in the sandstone is N.30°W., 56° W., typical for the region.
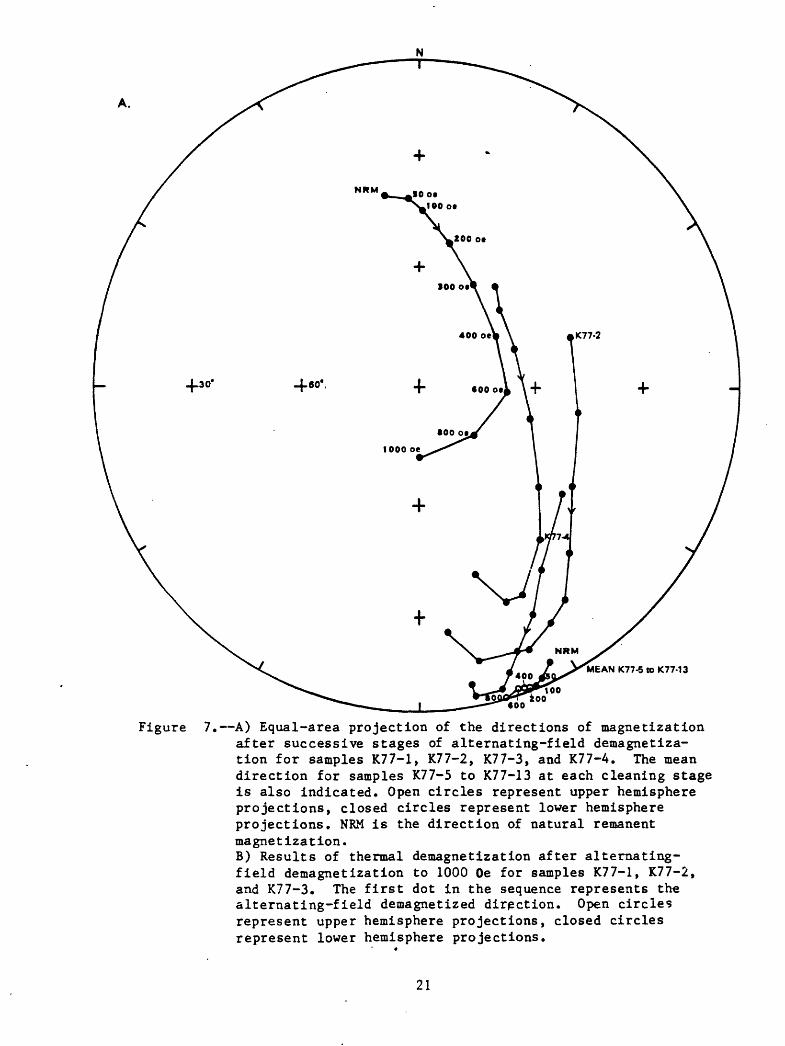
Thirteen samples were drilled across the face of the dike (fig. 6). Nine samples from the coarse-grained interior and the western chilled margin group closely about a reversed di rection at D = 161°, T = -2° (0x95 = 4.3°) after a.f. demag netization to 600 Oe (fig. 7). The mean direction did not significantly change at higher demagnetization levels.
Four samples drilled from the eastern margin of the dike show the acquisition of a secondary normally magnetized com ponent of magnetization (fig. 7A). The adjacent dike (K174) is also reversely magnetized. Therefore, the observed di rections of magnetization at the border of K77 cannot be the result of misinterpreting the relative ages of K174 and K77;
19
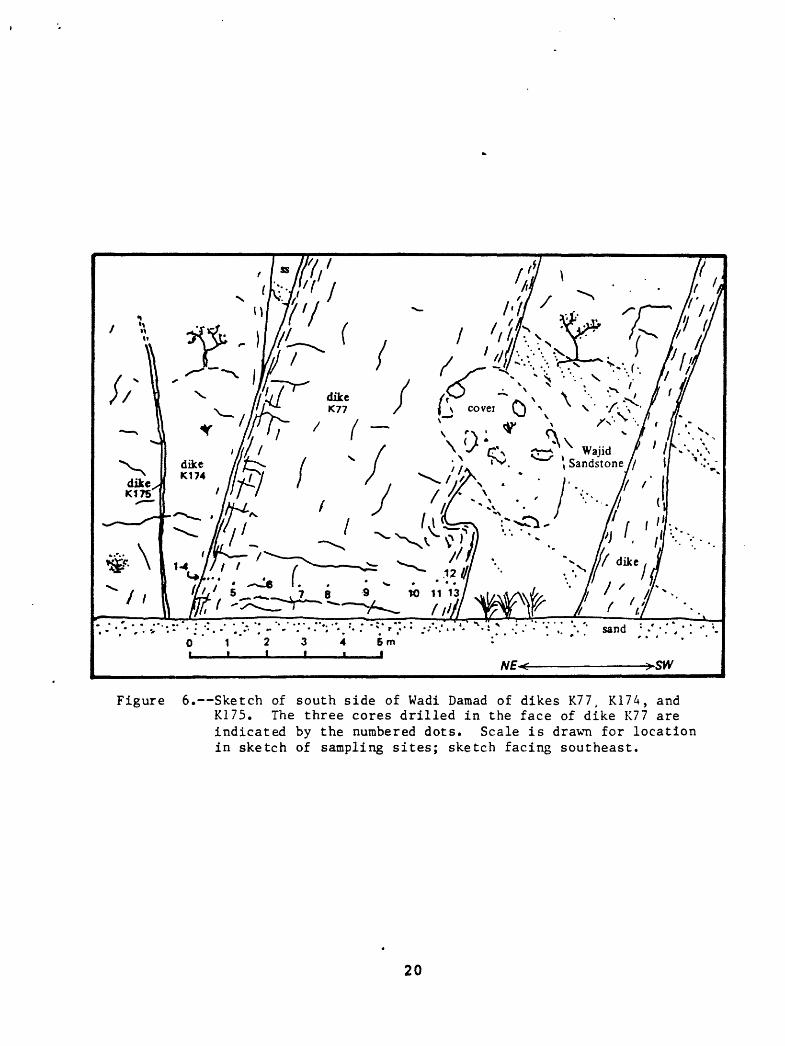
Figure 6. Sketch of south side of Wadi Damad of dikes K77, K174, and K175. The three cores drilled in the face of dike K77 are indicated by the numbered dots. Scale is drawn for location in sketch of sampling sites; sketch facing southeast.
20
A.
MEAN K77-5to K77-13
0000
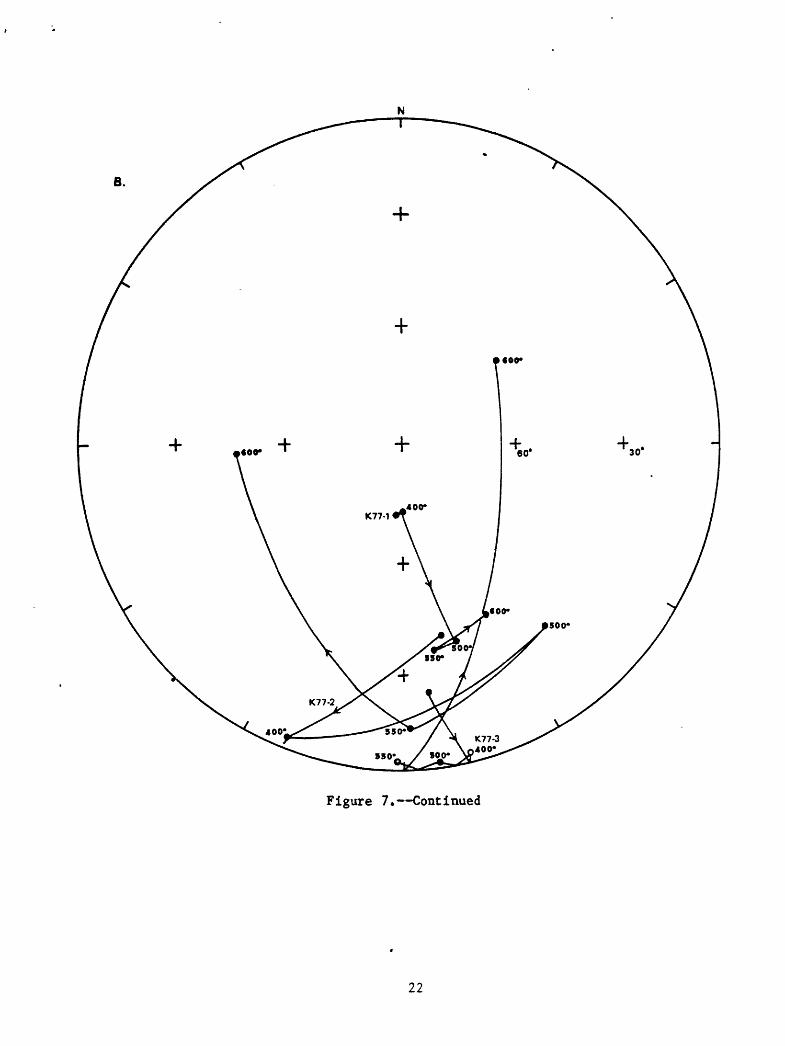
Figure 7. A) Equal-area projection of the directions of magnetization after successive stages of alternating-field demagnetiza tion for samples K77-1, K77-2, K77-3, and K77-4. The mean direction for samples K77-5 to K77-13 at each cleaning stage is also indicated. Open circles represent upper hemisphere projections, closed circles represent lower hemisphere projections. NRM is the direction of natural remanent magnetization.B) Results of thermal demagnetization after alternating- field demagnetization to 1000 Oe for samples K77-1, K77-2, and K77-3. The first dot in the sequence represents the alternating-field demagnetized direction. Open circles represent upper hemisphere projections, closed circles represent lower hemisphere projections.
21
B
Figure 7. Continued
22

that is, K174 cannot have thermally reset the eastern margin of K77. This secondary magnetization is detectable 40 cm from the border and becomes relatively stronger toward the margin of the dike. During a.f. demagnetization, the direc tions from samples 1 through 4, collected from 1 to 40 cm from the eastern margin, migrated along great-circle paths towards the mean direction defined by samples 5 through 13, collected from 0.90 to 6.5 m from the eastern margin. Above 400 Oe cleaning field, a tendency for the directions from samples 1 through 4 to swing toward the west indicates the possible removal of a third, as yet unexplained, direction of magnetization. The mean directions for samples 5 through 13 at each demagnetization step up to 800 Oe (the highest field used for all measurements) are also shown on figure 7A.
The western margin of the dike appears in hand specimen to be more altered than the eastern margin. Chloritization has so altered the westernmost 20 cm that no satisfactory samples could be obtained, and we were unable to compare adequately the magnetic behavior at the eastern and western chilled margins.
The directions of magnetization from samples 1 through 4 improved, that is, became closer to the mean for the other nine samples, upon thermal demagnetization to a temperature of 550°C after a.f. demagnetization to 1,000 Oe. At 600°C the directions became random (fig. 7B); this suggests that the carriers of stable remanence in these border rocks reside in the small vestiges of magnetite that remain after altera tion by hydrothermal processes. (Magnetite has a maximum Curie temperature of 585°C, whereas hematite has a maximum Curie temperature of 670°C; the addition of titanium lowers these temperatures.)
Thermal demagnetization of samples 5 through 13 at a tem perature of 550°C resulted in four samples (10 through 13) decrepitating in the oven. The mean direction from the re maining five samples (D = 169.7°, I = 9.1°, 0x95 = 5.5°) is displaced about 10° from the mean direction defined after a.f. demagnetization and may reflect the removal of a small residual secondary component. Demagnetization of these five samples at a temperature of 600.°C resulted in little change in mean direction (D = 167.9°, I = 5.2°), although the uncer tainty increased (a 95 = 11.7°). These relationships demon strate that hematite must carry some of the stable remanent magnetism in the interior of the dike.
Microscopic examination of polished sections from the border of K77 revealed the presence of fine-grained (about 50y in diameter), grayish magnetite, which has a very fine, almost sub-microscopic, granular texture. Development of ilnenite lamellae was not noted. The grayish color and gran ular texture are probably indicative of naghemite development
23
and the growth of very fine grained hematite, both of which are associated with low-temperature alteration.
Examination of the interior of dike K77 showed the pres ence of large (as much as lOOy in diameter), abundant, low- temperature-altered magnetite grains. The alteration was ex tensive, and few cores of unaltered magnetite remain. Ilmen- ite lamellae parallel with (111) crystallographic planes in magnetite were commonly altered, probably at relatively low temperatures, to fine-grained intergrowths of hematite, rutile (?), and pseudobrookite (?).
We suspect that hydrothermal fluids migrating along the margins of the dike may have been responsible for magnetic ally altering the finer grained border more profoundly than the interior of the dike. Incomplete oxidation of the mag netite to hematite (plus other minerals) suggests that oxygen fugacities during this time were not extremely high. The ubiquitous presence of unaltered pyrite in dikes also attests to relatively low oxygen fugacities.
Comparison of paleomagnetic directions for normal and reversed dikes
Wilson (1970, 1971) demonstrated that worldwide paleomag netic data best fit a model for a displacement of the dipole source for the geomagnetic field northward along the rota tional axis. This model produces slightly steeper inclina tions in the northern hemisphere than would be predicted by the expression for inclination due to a centered axial dipole: tan 1 = 2 tan X , where A is the latitude of the collecting locality. Therefore, Wilson (1970) suggested that at any paleomagnetic collecting locality in the Northern Hemisphere, normally magnetized rocks would have generally steeper inclinations than reversed rocks. This is probably because the normal field is nearer that of a central axial dipole field than that of the reversed field.
This theory has already been tested in Saudi Arabia.
Paleomagnetic results from the As Sarat volcanic field reveal a significant difference between the directions determined from normally and reversely magnetized flows (Kellogg and Reynolds, 1981). The mean inclination determined for the normal flows is significantly steeper, by about 9°, than that determined for the reversed flows.
Although dikes in the Tihamat Asir probably have been tectonically rotated, as will be pointed out below, it is instructive to see if there is a significant difference be tween the paleomagnetic directions determined from the normal and reversed dikes (table 1). The mean direction from the 11 acceptable, normally magnetized dikes is D = 7.1°, I = 19.8 ( a 95 of 13.7°), whereas the mean direction (inverted 180°)
24
o
ofrom the 12 reversely magnetized dikes is D = -6.1°, T = 4.3 ( a 95 = 8.9°). The mean inclination of the normal dikes is clearly more downward, by about 24°, than that of the reversed dikes (fig. 8), and the mean pole position of the normal dikes lies outside the cone of 95 percent confidence of the reversed dikes and conversely.
This result is in excellent agreement with that found for flows of the As Sarat volcanic field and lends additional support to Wilson's model for the source of the geomagnetic field.
PALEOMAGNETISM AND THE TECTONICS OF THE TIHAMAT ASIR
The Jabal at Tirf gabbro and granophyre
The paleomagnetic results from the Jabal at Tirf gabbro may be used to test the hypothesis of Coleman and others (1979) that the gabbro was originally emplaced with near- horizontal cumulus layering (fig. 2) and that subsequently it was deformed into its present bowl-shaped configuration, in which all layering dips toward the center of the structure. Twenty samples were collected from three localities (K32, K171, and K172; fig. 2) in the gabbro where the cumulus lay ering could be measured. The attitudes of the layering at the three sites were 050°, 68° NW.; 328°, 55° SW.; and 285°, 80° S., respectively. The mean paleomagnetic direction for each of these sites, without any correction applied, is plot ted on an equal-area projection (fig. 9A), along with the mean direction determined from the upper Oligocene-lower Miocene As Sarat volcanic field (Kellogg and Reynolds, 198$), inverted 180° to a reversed direction. The cones of 95 per cent confidence (ovals in this projection) are indicated around each mean direction.
Figure 9A shows the directions of magnetization without any correction for the attitudes of the cumulus layering ap plied to the data. The mean direction of D = 176°, T = -2° ( a 95 = 7°) is significantly different from that of the As Sarat volcanic field but is not significantly different from any of the individual site directions. However, after "flat tening" the gabbro, that is, rotating all paleomagnetic di rections about the strike of cumulus layering by the amount of dip of layering, the mean directions shown in figure 9B are clearly more scattered. The new mean direction is D = 167°, I = -21° (ct 9 5 = 13°). Now both locality K32 and locality K171 have directions that are significantly differ ent from the mean at the 95 percent confidence level. The direction at locality K171 is also significantly different from both of the other mean directions.
The major conclusion from these exercises is that the initial shape of the Jabal at Tirf gabbro, after it had
25
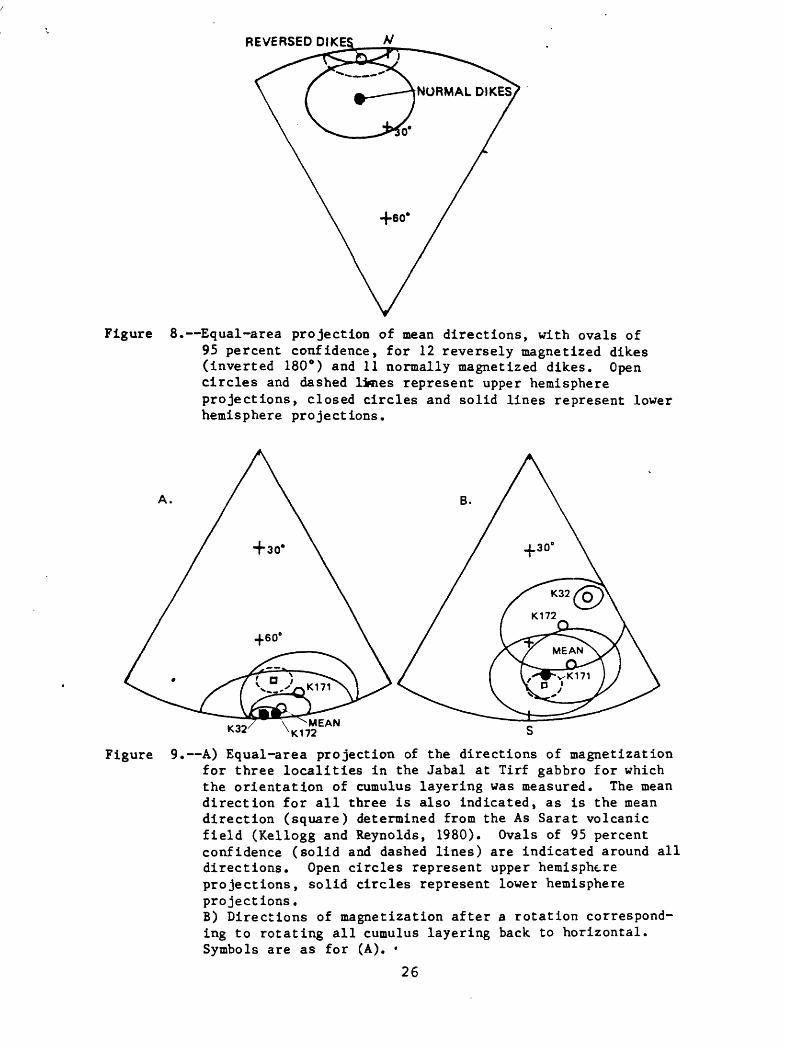
REVERSED DIKES _ti
Figure 8. Equal-area projection of mean directions, with ovals of 95 percent confidence, for 12 reversely magnetized dikes (inverted 180°) and 11 normally magnetized dikes. Open circles and dashed limes represent upper hemisphere projections, closed circles and solid lines represent lower hemisphere projections.
A.
K32
Figure 9. A) Equal-area projection of the directions of magnetization for three localities in the Jabal at Tirf gabbro for which the orientation of cumulus layering was measured. The mean direction for all three is also indicated, as is the mean direction (square) determined from the As Sarat volcanic field (Kellogg and Reynolds, 1980). Ovals of 95 percent confidence (solid and dashed lines) are indicated around all directions. Open circles represent upper hemisphere projections, solid circles represent lower hemisphere projections.B) Directions of magnetization after a rotation correspond ing to rotating all cumulus layering back to horizontal. Symbols are as for (A).
26
cooled to below its Curie temperature, was much more similar to its present shape than to that of a body with nearly hori zontal flow layering. The confidence limits, however, do not preclude some internal deformation of the gabbro after cool ing below its Curie temperature, but no more than about 20° of differential rotation could have occurred between the sites sampled.
Jaeger (1957) calculated that a sill 5 km thick would cool by conduction in about 350,000 years. Even allowing for the possibility of more rapid cooling by convection of circu lating aqueous solutions, a pluton the size of the Jabal at Tirf gabbro (long axis of exposed body approximately 8 km) must have required more time to cool than is needed to aver age secular variation (several thousand years; refer to McElhinny, 1973), and the four stable localities in the gab bro (including locality K8) possess a spectrum of directions representing secular variations of the field. This spectrum may also be one source for the small differences in mean paleomagnetic directions between sampling localities in the gabbro.
The paleomagnetic and geologic data suggest that the whole pluton has rotated en masse toward the west. This rota tion is seen by comparing the paleomagnetic direction of Jabal at Tirf with that of the As Sarat volcanic field (fig. 10). These two directions are significantly different at the 95 percent confidence level, but by rotating the directions about the mean strike direction of the dikes (332°), they are brought into best coincidence after a down-to-the-east rotation of about 20°.
The paleomagnetic direction of the Wadi Liyyah gabbro also supports a tectonic rotation in the same sense as that suggested by the direction of_Jabal at Tirf. In this case, the mean direction (D = 172°, T = 16°) is even more displaced than that of Jabal at Tirf from the mean As Sarat direction. Approximately 50° of rotation is needed before the directions from the Wadi Liyyah gabbro and the As Sarat volcanic field are significantly similar at the 95 percent confidence level. Because only one locality was sampled at Wadi Liyyah, this estimate of the amount of rotation is probably unreliable; however, it helps support the case for postintrusive rotation.
The Tihamat Asir dike swarm: orientation of dike attitudes
In an attempt to approximate the average orientation of the Tihamat Asir dike swarm, attitudes of all sampled dikes were measured (table 2). There was no conscious bias in sam pling dikes of any particular attitude. If we assume that the dikes were emplaced with an average vertical orientation, as seems geologically reasonable, then the mean dike orienta-
27
Tihamat Aar dikes.
-As Strsl volcaflic field
TestB.
assumed orientation by region (see text)
Test A: idikes rotated 20* about
.mean strike of dikes
\ 60° 30°
As Sarat volcanic field (inverted 180°)
Test A:gabbro rotated'',
about meai strike of dikes^
xJabal at Tirf gabbro
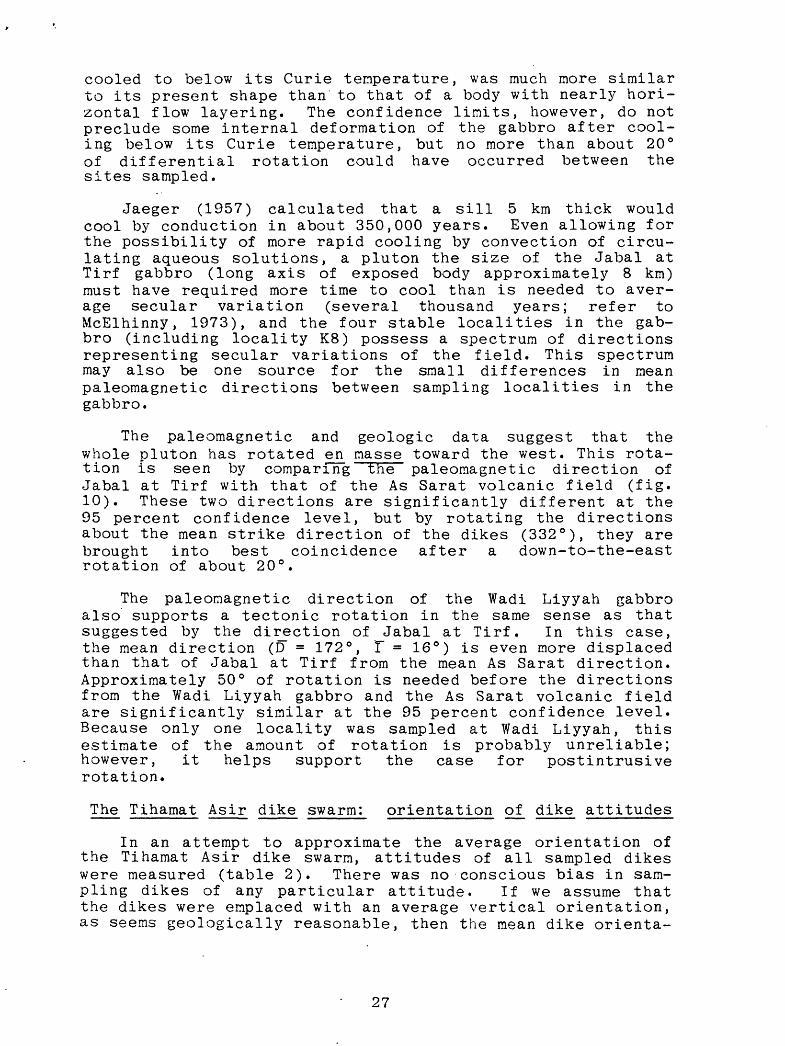
Figure 10, Equal-area projection of the directions of magnetization of the Jabal at Tirf gabbro and the Tihamat Asir dikes, with their confidence limits, both before and after a rotation that corresponds to restoring the mean dip of each dike to vertical (test A). The results of test B correspond to rotating the dikes to their assumed original orientation, by region. Open circles and dashed lines represent upper hemisphere projections, solid circles and lines represent lower hemisphere projections.
28
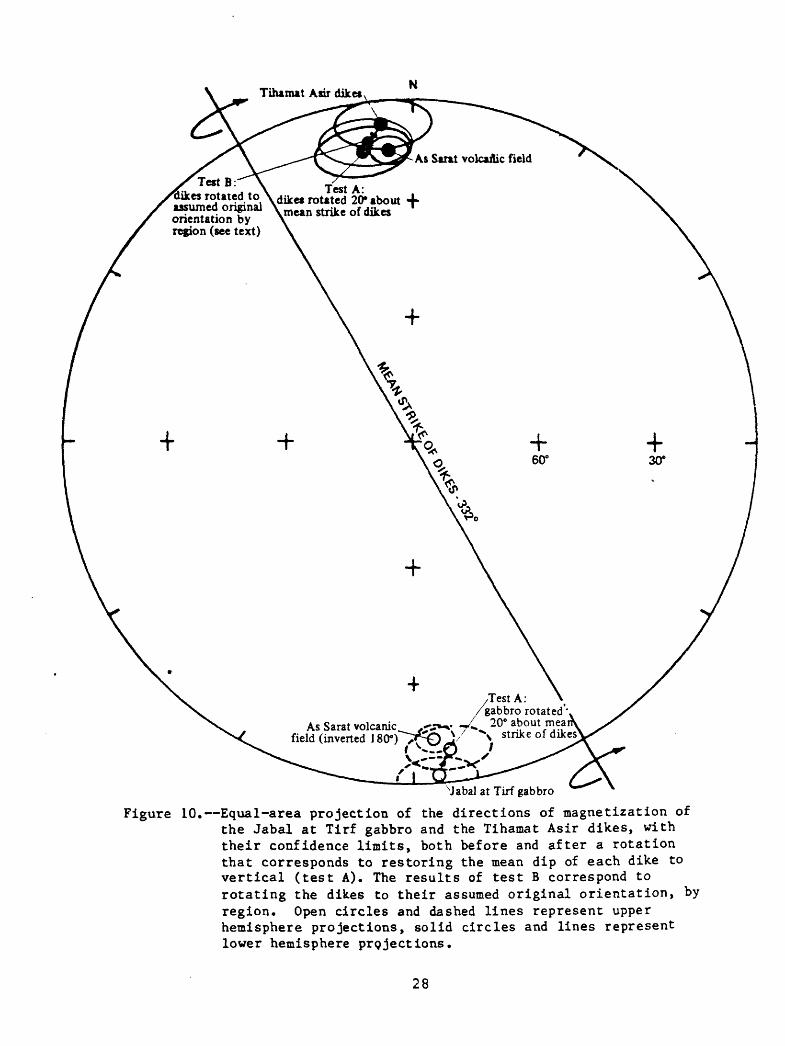
Table 2. Attitudes of dikes in the Tihanut Asir
Locality
1. Wadi Damad area K19K20K21K22K23*K24K69
Strike
315330330330330340330
o
o
o
o
o
o
o
Dip
61666565627066
o
o
o
o
o
o
o
E.E.E.E.E.E.E.
Locality
K70K71K72K73K74*K75K77
Strike
320333328324330347348
o
o
o
o
o
o
o
Dip
67646672705980
o
o
0
o
o
o
o
E,E,E,E,E,EE,
Average strike and dip - 331°, 70° E.
2. Wadi Jizan area K2*K3*K6*K7K27
290°346°060°355°005°
67° W.72° W.52° W.42° W.81° W.
K28*K29K30K31K65K67*
340°330°340°312°010°040°
41° W75° E67° W80° W55° W70° W
Average strike and dip (excluding K6 and K67) = 339°, 82° W.
3. Wadi Khuros area K12* K13* K14
000° 320° 350°
50° E. 45° E. 52° E.
K15*K16K17
350° 51° E.350° 51° E,340° 55° E,
Average strike and dip = 345°, 51° E.
*Locality for which unacceptable paleomagnetic results were obtained. See table 1.
29
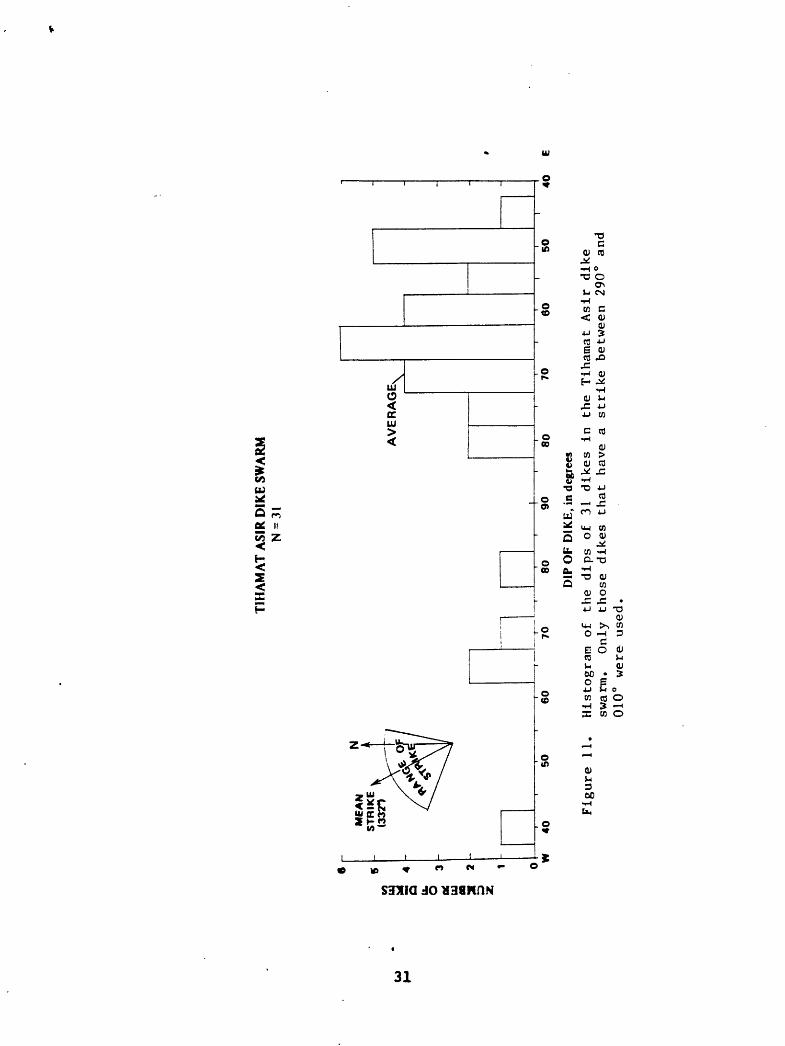
tion should indicate the approximate amount of rotation that has occurred since most dikes were emplaced. The very young est dikes, which postdate the intrusion of the gabbro, appear to be more nearly vertical, although no quantitative evidence has been collected to support this observation. Table 2 lists attitudes for the sampled dikes, and figure 11 is a histogram of the measured dips of all collected dikes that strike between 290° and 010°, that is, all dikes that were emplaced generally parallel with the Red Sea coastline and the Tertiary regional structural trend. The average dip of these dikes is 70° E., which suggests about 20° of seaward rotation since the major injection of dikes.
Tectonic implications of paleomagnetic directions of dikes
The mean paleomagnetic direction (D = 66°, T = 6.8°, a 95 = 8.9°) of the 23 acceptable dike localities is not significantly different from the mean direction of the As Sarat volcanic field (fig. 10); however, after a rotation of 20° down to the east, which corresponds to rotating the mean dip on each dike back to vertical about the mean strike of each dike, the mean paleomagnetic direction is in good agree ment with that of the As Sarat volcanic field. This test of the paleomagnetic data is referred to as test A in figure XO.
It may be argued that test A is unrealistic because there was undoubtedly a small original spread in dips of dikes about a mean dip; that is, although the mean dip may origi nally have been vertical, some dikes were originally injected with significantly nonvertical orientations.
Therefore, an additional test (test B, fig. 10) was de vised in which data from three dike-injected regions were rotated en masse by an amount corresponding to rotating the mean dip on the dikes in each region back to vertical. First, the mean strike and dip on dikes was determined separate!? for the Wadi Damad area (including localities K69-K75, fig. 2), the Wadi Jizan area, and the Wadi Khums area. These values are 331°, 70° E. (N = 14); 339°, 82° W. (N = 9); and 345°, 51° E. (N = 6), respectively, where N is the number of dikes considered. Next, the mean paleomagnetic direction was rotated about the average strike determined for each region by an amount that would bring the average dike orientation back to vertical. The resultant mean paleomag netic direction, shown in figure 10, is D = -8.6°, I = 12.4°( a95 = 8.9°). The uncertainty ( a95 ) of 8.9° in the unrotated mean dike direction indicates that no improvement in the mean direction has resulted from this test.
Although the lack of improvement in the mean direction after applying test B neither supports nor rules out the idea that dikes in each area were vertically emplaced, the slight
30
TIH
AM
AT
ASI
R D
IKE
SWAR
MN
= 3
I
6 5to I- u. 2
>u O
B 2 '
Z
ME
AN
S
TR
IKE
W
40
50
AV
ER
AG
E\
60
70
80
908
07
060
50
40
DIP
OF
DIK
E, i
n de
gree
sFigure 11
. Histogram of
the
dips of
31
dikes in th
e Tihamat Asir di
kesw
arm.
Only th
ose
dikes
that
have a
strike between 29
0° and
010° were used.
improvement in correspondence with the results from the As Sarat volcanic field after rotation of the mean dike direc tions does suggest that the dikes were approximately verti cally emplaced. The uncertainty in these mean directions leaves much leeway as to the exact amount of down-to-the-west rotation, and, after all considerations, both geological and paleomagnetic, it is felt that approximately 20° of rotation best fits the observations. This seaward rotation probably occurred as the locus of intrusion became more widely sepa rated from the Shield margin and while the escarpment was being uplifted.
If dikes were being emplaced during block rotation, there should be a spread of directions about some small circle cen tered on the rotation axis. An examination of all the ac ceptable dike directions (fig. 3) reveals no obvious spread. The dike directions from localities K19 and K20, both steeply inclined to the northwest, are in fact displaced in a sense opposite to that expected if the mean dike orientation were rotated to vertical. Nonetheless, there is more scatter in the data than can be expected simply from normal secular var iation. This scatter can be seen by calculating the standard angular deviation 5 , which is defined by cos-1 (R/N), where N is the number of directions and R is the length of the vector sum of N unit vectors (Wilson, 1959).
If N = 23 and R = 20.95 (our calculated value), the value for 5 is 24°. The value calculated from the As Sarat data (Kellogg and Reynolds, 1981) is only 16°, which is comparable with recent values calculated for this latitude (Brock, 1971). Thus, some factor, probably a combination of chemical and tectonic effects, clearly is dispersing the data.
Evidence for magnetic stripes along the Tihamat Asir
Some evidence indicates that the ratio of normally mag netized to reversely magnetized dikes may change along a tra verse normal to the strike of the dikes. Seven of the ten dikes from Wadi Damad are normally magnetized, whereas six of the seven dikes from the Wadi Jizan tributary (localities K69-K75, fig. 2), about 7 km to the east of the Wadi Damad dikes, are reversed. This observation is supported by a ground magnetic traverse made down Wadi Damad across almost all exposed dikes (Blank and others, 1981). If the occur rence of the zones of normally and reversely magnetized dikes is not merely fortuitous, it constitutes evidence for tempo ral migration (presumably toward the west) of the spreading center and the formation of magnetic stripes similar to that of stripes observed parallel with mid-ocean ridges in all ocean basins of the world. An aeromagnetic survey of part of the Tihamat Asir and the adjacent offshore region shows clearly defined stripes of negative and positive anomalies and provides a link between the ground magnetic profile, the
32
paleomagnetic data, and the sea-floor spreading anomaly pat tern (Hall, 1980; Blank and others, 1981). The sources of aeromagnetic stripe anomalies lie at depths of several kilo meters below sea level. Most of the dikes sampled in our work are not from a true sheeted-dike complex but are com monly widely separated from one another by intervening coun try rock, generally Tertiary chloritized tuffs or (farther east) Precambrian schists. They produce a complex pattern of overlapping anomalies on the aeromagnetic map of the Tihamat Asir. However, when the anomalies are analytically continued upward and the intensities are normalized to 100 percent dike material, the irregularities are smoothed out and two simple "stripes" appear, which have intensities comparable to those of marine anomalies.
CONCLUSIONS
All the paleomagnetic data are consistent with a tilt of approximately 20° of the coastal-plain region toward the Red Sea subsequent to the emplacement of the Tihamat Asir gabbros and granophyres about 24 to 21 Ma ago. This tilting was accomplished along a series of steeply east-dipping faults, which produced a complex array of imbricate fault blocks, and is consistent with the 15° to 20° westerly dips typically observed in the Baid formation (Fairer, in press).
Rotation toward the west began prior to' dike injection, as shown by the amount of dip (generally from 50° to 60° W. ) on the westernmost pre-Tertiary sedimentary units exposed. The paleomagnetic evidence outlined above does not support significant rotation during the period of time that most dikes were being enplaced.
Simple extension and rifting probably would produce west- dipping normal faults and east-dipping bedding planes, fea tures opposite to those observed. We suggest instead, as outlined by Blank and others (1981), that the tectonic style of the Tihamat Asir developed in response to lateral movement of plastic basal crust or upper mantle at shallow depth, as an integral part of the initial process of continental sepa ration. This movement produced a shear force, oriented away from the Red Sea axis, on the base of the upper crustal .rocks. The shear force resulted in a seaward rotation of fault-bounded blocks, which produced seaward dips of origi nally horizontal bedding and landward dips of dike orienta tions. The faults separating the blocks also dip away from the Red Sea (H. R. Blank, unpublished data) and probably flatten at depth.
Our work suggests that the ratio of normally to reversely magnetized dikes changes significantly along a traverse nor mal to the Red Sea coast; this change may indicate increasing separation of the dike complex from an axial spreading center
33
and would provide a link to oceanic sea-floor spreading "stripe" anomalies.
The paleomagnetic data support the hypothesis that the Jabal at Tirf gabbro cooled with an internal geometry similar to its present configuration, and they allow only a small amount of relative warping after emplacement.
Low-temperature hydrothermal alteration has partially reset and scattered the directions of magnetization in some dikes, although alternating-field demagnetization appears adequate to remove this component from most samples. The slightly larger dispersion of mean paleomagnetic dike direc tions as compared to that of the As Sarat volcanic field (Kellogg and Reynolds, 1981) may be due to unremoved compo nents of secondary magnetization.
Future paleomagnetic studies that focus on the rotated sedimentary rocks contained in the Tihamat Asir fault blocks and on younger dikes that intrude the gabbro units offer a means of acquiring additional insight into tectonic rotation as it relates to development of the continental margin.
34
REFERENCES CITED
Blank, H. R. , Jr., 1977, Aeromagnetic and geologic study of Tertiary dikes and related structures on the Arabian margin of the Red Sea, in Red Sea research, 1970-1975: Saudi Arabian Directorate General of Mineral Resources Bulletin 22, p. G1-G18.
Blank, H. R. , Jr., Gettings, M. E., Andreasen, G. E., 1979, Tertiary continental margin in southwest Saudi Arabia; status of current investigations [abs]: EOS, Trans actions of American Geophysical Union, v. 60, p.375.
Blank, H. R., Jr., Gettings, M. E., and Kellogg, K. S., 1981, Linear magnetic anomalies onshore and offshore in south west Saudi Arabia [abs]: EOS, Transactions of American Geophysical Union, v. 62, p. 407.
Brock, A., 1971, An experimental study of palaeosecular vari ation: Geophysical Journal of the Royal Astronomical Society, v. 24, p. 303-317.
Brown, G. F. , 1970, Eastern margin of the Red Sea and the coastal structures in Saudi Arabia: Philosophical Trans actions of the Royal Society of London, series A, v. 267, p. 75-87.
Cochran, J. R. , 1981a, The Red Sea: implications for the early development of Atlantic-type continental margins [abs]: EOS, Transactions of American Geophysical Union, v. 62, p. 407.
______________ 1981b, The Gulf of Aden: structure and evo lution of a young ocean basin and continental margin: Journal of Geophysical Research, v. 86,sec. B, p. 263-287.
Coleman, R. G., Fleck, R. J., Hedge, C. E., and Ghent, E. D., 1977, The volcanic rocks of southwest Saudi Arabia and the opening of the Red Sea, in Red Sea research, 1970- 1975: Saudi Arabian Directorate General of Mineral Resources Bulletin 22, p. D1-D30.
Coleman, R. G., Hadley, D. G. , Fleck, R. J., Hedge, C. T., and Donate, M. M. , 1979, The Miocene Tihama Asir ophio- lite and its bearing on the opening of the Red Sea, in Evolution and mineralization of the Arabian-Nubian Shield: King Abdulaziz University, Institute of Applied Geology Bulletin 3, v. 1: New York, Pergamon Press, p. 173-186.
35
Fairer, G., in press, Reconnaissance geology of the Sabya quadrangle, sheet 17/42 D, Kingdom of Saudi Arabia: Saudi Arabian Deputy Ministry for Mineral Resources Geological Map.
Fisher, R. A., 1953, Dispersion on a sphere: Proceedings of the Royal Society of London, v. A217, p. 295-305.
Gass, I. G., 1977, The age and extent of the Red Sea oceanic crust: Nature, v. 265, p. 722-724.
Gettings, M. E., 1977, Delineation of the continental margin in the southern Red Sea region from new gravity evidence, in Red Sea research, 1970-1975: Saudi Arabian Directorate General of Mineral Resources Bulletin 22, p. K1-K11.
Gillmann, M., 1968, Primary results of a geological and geo physical reconnaissance of the Jizan coastal plain in Saudi Arabia: American Institute of Mining and Metallur gical Engineers, Society of Petroleum Geologists, Saudi Arabian Section, 2nd Regional Symposium, Dhahran: Proceedings, p. 189-208.
Girdler, R. W., and Styles, P., 1974, Two stage Red Sea floor spreading: Nature, v. 247, p. 7-11.
___________ 1976, The relevance of magnetic anomalies over the southern Red Sea and Gulf of Aden to Afar, in Pilger, A. , and Rosier, A. , eds. , Afar depression of Ethiopia: Symposium of the Afar region of Ethiopia and related rift problems, Stuttgart, Proceedings, v. 1; Schweizerbart 'sche Verlagsbuchhandlung (Nagele u. Obermiller' ), p. 156-170.
Girdler, R. W. , Brown, C. , Noy, D. J. M., and Styles, P., 1980, A geophysical survey of the westernmost Gulf of Aden: Philosophical Transactions of the Royal Society of Londo.% v. 298, ser. A, p. 1-43
Hall, S. A., 1980, A total intensity magnetic anomaly map of the Red Sea and its interpretation: U.S. Geological Survey Open-File Report 80-131, (IR)SA-275, 260 p.
Jaeger, J. C., 1957, The temperature in the neighborhood of a cooling intrusive sheet: American Journal of Science, v. 255, p. 306-318.
Jones, P. W., and Rex, D. C. , 1974, New dates from the Ethiopian plateau volcanics: Nature, v. 252, p. 218-219.
3G
Kellogg, K. S., and Reynolds, R. L. , 1981, Paleomagnetic study of the As Sarat' volcanic field, southwestern Saudi Arabia: U.S. Geological Survey Open-File Report 81-675, (IR)SA-360, 31 p.
McElhinny, M. W. , 1973, Paleomagnetisn and plate tectonics: Cambridge, England; Cambridge University Press, 358 p.
Strangway, D. W. , Larson, E. E., and Goldstein, M. , 1968, A possible cause of high magnetic stability in volcanic rocks: Journal of Geophysical Research, v. 73, p. 3787- 3795.
Taylor, H. P., Jr., and Coleman, R. G., 1977, Oxygen isotopic evidence for meteoric-hydrothermal alteration of the Jabal at Tirf igneous complex, Saudi Arabia [abs.j: EOS, Transactions of American Geophysical Union, v. 58, p. 516.
Wilson, R. L., 1959, Remanent magnetism of late secondary and early Tertiary British rocks: Philosophical Magazine, v. 4, p. 750 - 755.
____________ 1970, Permanent aspects of the Earth's non magnetic field over upper Tertiary times: Geo-
v.dipolephysical Journal of the Royal Astronomical Society,19, p. 417-4 37.
________ 1971, Dipole offset; the time-average palaeo- magnetic field over the past 25 million years: Geophys ical Journal of the Royal Astronomical Society, v. 22, p 491-504.
37